Embed Size (px)
Citation preview
CONGRESSIONAL REPORT 2013
National Credit Union Administration Minority Depository Institutions Annual Report

Report to Congress May 21, 2012
Plain Writing Act of 2010 Compliance Report Plain Writing Act of 2010 Compliance Report
2
Minority Depository Institutions Congressional Report
Minority Depository Institutions Congressional Report● 2013
Table of Contents
Executive Summary ......................................................................................... 1
Background ..................................................................................................... 3
Minority Depository Institutions Preservation Program ................................... 5
Minority-Owned Depository Institutions .......................................................... 7
Minority Depository Institutions Preservation Program Benefits ...................... 12
NCUA’s Outreach to Stakeholders ................................................................... 17
Conclusion....................................................................................................... 19
Appendixes ...................................................................................................... 20
1. Minority Depository Institutions Preservation Program
Proposed Interpretive Ruling and Policy Statement .......................... 20
2. Minority Credit Unions Lists by State ............................................... 31
3. Technical Assistance Granted in 2012 .............................................. 69

Annual Report to Congress • 2013
Executive Summary
Section 367 of the Dodd-Frank Wall Street Reform and Consumer Protection Act (Dodd-Frank Act) requires the National Credit Union Administration (NCUA) to establish a program to preserve credit unions designated as minority depository institutions. Prior to the enactment of Section 367 by Congress, NCUA had not established a method to identify these types of institutions. Minority-owned credit unions provide financial services to consumers and businesses in communities that might not otherwise have access to a federally insured financial institution. They play an important role in serving the financial needs of historically underserved communities, such as African Americans, and growing populations of minorities, such as Hispanic Americans and Asian Americans. Minority depository institutions also provide significant assistance to regulators and other government agencies in their efforts to evaluate and address the needs of minority communities for financial services. For these reasons, Section 308 of the Financial Institutions Reform, Recovery, and Enforcement Act of 1989 (FIRREA) established goals that federal regulators must work toward to preserve and promote such institutions. The Dodd-Frank Act expanded the list of agencies subject to Section 308 of FIRREA. NCUA recognizes the importance of minority credit unions and the unique challenges they often face in serving their membership fields. As a result, the agency took proactive steps to comply with this new mandate. The NCUA Chairman charged NCUA’s Director of the Office of Minority and Women Inclusion (OMWI) with the responsibility of developing and administering a program to preserve and encourage minority depository institutions as prescribed by law. OMWI reviewed Section 308 of FIRREA and the minority depository institutions programs previously established by the other financial services regulatory agencies, mainly the Federal Deposit Insurance Corporation, the former Office of Thrift Supervision, and Office of the Comptroller of the Currency. OMWI also gathered input from minority credit union trade associations and offices within NCUA on the best way to define a minority depository institution and to preserve the economic viability of them as an ongoing entity. Based on the information gathered, OMWI tentatively: Adopted minority eligibility criteria for federally insured credit unions, as prescribed
by law; Established a process that allows credit unions to identify themselves as meeting the
minority eligibility criteria; and Drafted a policy statement for preserving and encouraging minority ownership in the
credit union industry.
1
OFEAR Act
Minority Depository Institutions
The agency developed a proposed Minority Depository Institutions Preservation Program, prescribing its functions, initiatives, and benefits. The program continues to evolve and change based on comments received from NCUA’s stakeholders. Currently, program technical assistance and training of minority institutions will be primarily provided by NCUA’s Office of Small Credit Union Initiatives. OMWI will facilitate and ensure that minority depository institutions receive technical assistance, training, educational programs, and mentoring opportunities. The NCUA Board approved the proposed Minority Depository Institutions Preservation Program Interpretive Ruling and Policy Statement along with a request for comments from credit unions, trade associations, and general public, at the July 25, 2013, open Board meeting. The 60-day comment period ended on September 30, and NCUA is reviewing these comments at this time.
2
Annual Report to Congress • 2013
Background
National Credit Union Administration The National Credit Union Administration (NCUA) is an independent agency of the Executive Branch of the U.S. Government responsible for chartering, insuring and regulating federal credit unions, as well as for insuring the overwhelming majority of state-chartered credit unions. With the backing of the full faith and credit of the United States, NCUA administers the National Credit Union Share Insurance Fund, insuring the deposits of more than 95 million credit union account holders. NCUA’s mission is to facilitate the availability of credit union services to all eligible consumers, especially those of modest means, through a safe and sound credit union system. Section 367 of the Dodd-Frank Act Congress enacted the Financial Institutions Reform, Recovery, and Enforcement Act of 1989 (FIRREA), in response to the failure of the Federal Savings and Loan Insurance Corporation, which insured the deposits of savings and loan institutions.1 Section 308 of FIRREA established goals for preserving and encouraging minority depository institutions.2 When established, Section 308 applied only to the Federal Deposit Insurance Corporation (FDIC) and the Office of Thrift Supervision (OTS).3 The FDIC and OTS developed various initiatives aimed at preserving federally insured banks and savings institutions that met FIRREA’s definition of a minority depository institution.4 Minority depository institutions receive the benefits of these initiatives, such as training, technical assistance and educational programs. In 2010, Congress enacted the Dodd-Frank Wall Street Reform and Consumer Protection Act.5 Section 367(4)(A) of the Dodd-Frank Act amended FIRREA Section 308 and requires NCUA to comply with its goals to preserve and encourage minority depository institutions.6 In addition, Section 367(4)(B) requires the Secretary of the Treasury, the Board of Governors of the Federal Reserve System, the Office of Comptroller of the
1 P.L. 101-73, 103 Stat. 183 2 12 U.S.C. 1463 note (a) 3 The Office of the Comptroller of the Currency (OCC) and the Board of Governors of the Federal Reserve System also initiated minority depository institutions programs to comply with the spirit of FIRREA §308, even though they were not originally required to do so. OTS became part of OCC on July 21, 2011. OCC now administers the OTS Minority Depository Institutions Program. 4 12 U.S.C. 1463 note (b) 5 P.L. 111-203, 124 Stat. 1376; 12 U.S.C. 5301 et seq. 6 124 Stat. 1556.
3
OFEAR Act
Minority Depository Institutions
Currency (OCC), FDIC, and NCUA to each submit an annual report to Congress describing actions taken to carry out Section 308.7 Office of Minority and Women Inclusion NCUA established the Office of Minority and Women Inclusion in January 2011, as a stand-alone office separate from the Office of Human Resources and Equal Opportunity Programs. NCUA’s Chairman Debbie Matz charged the OMWI Director with the responsibility of establishing and administering a program to preserve and encourage new minority depository institutions regulated by NCUA. Annual Report for 2013 With this report, NCUA submits its first Office of Minority and Women Inclusion Annual Report to Congress on Minority Depository Institutions pursuant to Section 367(4)(B)(c) of the Dodd-Frank Act. This report covers the agency’s initiatives and activities under Section 308 of FIRREA and Section 367 of the Dodd-Frank Act from July 1, 2012, through June 30, 2013.
7 124 Stat. 1556.
4
Annual Report to Congress • 2013
Minority Depository Institutions Preservation Program
The Minority Depository Institutions Preservation Program is in its infancy. Before NCUA could develop the proposed policy statement for the program, the agency first developed a method to determine the number of credit unions that would meet the applicable definition of a minority depository institution. Having this information enabled NCUA to design a program that would best fit the needs of credit unions identified as minority depository institutions, estimate needed resources, and minimize any duplication of NCUA’s existing technical assistance, training, and outreach efforts. OMWI solicited input on the proposed definition, benefits, and program initiatives from NCUA’s offices of General Counsel, Examination and Insurance, Small Credit Union Initiatives, and Consumer Protection, as well as NCUA’s regional offices and trade associations serving minority credit unions. Based on the feedback, NCUA developed a process to allow credit unions to identify themselves as meeting the minority definition by answering one of two questions in the Credit Union Online Profile section of the Call Reports beginning with the December 2011 cycle. For that period, approximately 430 credit unions identified themselves as minority depository institutions. As of June 30, 2013, 805 credit unions indicated they meet the minority depository institutions criteria. This increase was due to credit unions becoming more aware of the ability to self-identify as minority depository institutions through NCUA’s Credit Union Online and Call Report systems. The current 805 credit unions that qualify as minority depository institutions represent 12 percent of all federally insured credit unions. As noted earlier, in July 2013, NCUA issued a proposed Interpretive Ruling and Policy Statement (Appendix 1) that outlines the agency’s Minority Depository Institutions Preservation Program. The policy discusses the program’s eligibility criteria, initiatives, and benefits. The program’s goals and objectives for preserving and encouraging minority depository institutions are consistent with NCUA’s mission and strategic goals of ensuring a safe, sound, and healthy credit union system, and promoting access to credit unions for all eligible persons, including those of modest means.
5
OFEAR Act
Minority Depository Institutions
Program Eligibility NCUA adopted a definition of a minority depository institution that conforms to FIRREA and follows FDIC and OCC’s minority depository institutions definition for a mutual savings bank. To meet the minority definition or criteria, a federally insured credit union’s percentage of both minority members and minority senior management officials must exceed 50 percent. To identify an eligible minority group, NCUA used FIRREA Section 308’s definition of a “minority” that includes any “Black American, Asian American, Hispanic American, or Native American.” NCUA’s proposed interpretive ruling and policy statement defines a credit union’s management official as a member of the board of directors, supervisory and credit committees, and senior executive staff. Senior executive staff includes the chief executive officer, assistant chief executive officer, chief financial officer, and branch managers. NCUA is proposing the use of one of the following methods to ascertain the minority composition of the credit union’s current or potential field of membership: U.S. Census data to determine an area’s minority population; Home Mortgage Disclosure Act data to determine if the percentages of mortgages to
minorities represents, at least, 50 percent of mortgages to all borrowers; Voluntary collection of minority data from members; and Any other reasonable form of data.
A credit union with assets more than $50 million must retain, in some form, the supporting documentation it used to determine how the minority eligibility criteria of its membership and management officials were met. A credit union with assets of less than $50 million may self-certify the membership composition based solely on knowledge of its field of membership. However, these credit unions would need to produce supporting documentation if the minority self-designation is challenged.
6

Annual Report to Congress • 2013
Minority-Owned Depository Institutions
Credit unions are member-owned depository institutions. For this reason, minority ownership is defined by the minority composition of the credit union’s membership. This definition conforms to the minority definition of a mutual savings bank in Section 308 of FIRREA. In addition, NCUA takes the minority composition of the senior management officials of the institution into consideration, which is within the spirit of Section 342 of the Dodd-Frank Act. NCUA regulated or supervised 805 minority-owned credit unions that qualify as minority depository institutions as of June 30, 2013. These institutions represent 12 percent of all federally insured credit unions. A listing of minority depository institutions by state can be found in Appendix 2. The distribution of these institutions as of June 30, 2013, by racial or ethnic background is shown in the table below. Number of
Credit Unions Percent Minority
Depository Institutions
Total Assets
Average Assets
Total Members
African American 389 48% $4,762,577,027 $12,243,129 900,811
Hispanic American 137 17% $11,110,370,966 $81,097,598 1,403,551
Asian American 8 58 7% $4,506,235,546 $77,693,716 364,014
Native American 13 2% $129,630,196 $9,971,554 32,612
Multi-Cultural 9 208 26% $16,437,500,081 $79,026,443 2,140,485
Total Minority Depository Institutions
805 100% $36,946,313,816 $45,896,042 4,841,473
Total Federally Insured Credit Unions
6,681 $1,056,032,020,204 $158,064,963 95,194,356
The 805 minority depository institutions have total assets of $36.9 billion, and are owned by 4.8 million members. The total assets of minority depository institutions represent 3.5 percent of the total assets in all federally insured credit unions. The 4.8 million members who own the minority depository institutions represent 5.1 percent of the total members of federally insured credit unions.
8 Asian American includes Native Hawaiian and Other Pacific Islanders. 9 Multi-Cultural is two or more minority racial backgrounds at the same minority depository institution, such as African American and Hispanic American.
7
OFEAR Act
Minority Depository Institutions
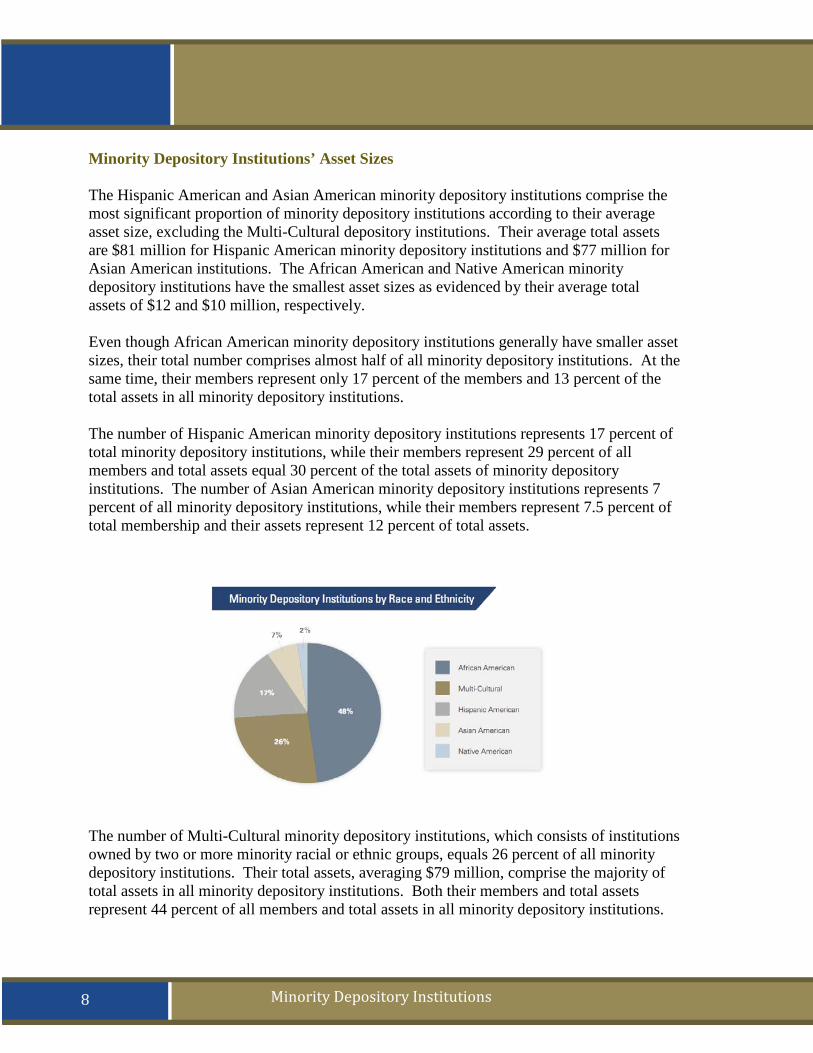
Minority Depository Institutions’ Asset Sizes The Hispanic American and Asian American minority depository institutions comprise the most significant proportion of minority depository institutions according to their average asset size, excluding the Multi-Cultural depository institutions. Their average total assets are $81 million for Hispanic American minority depository institutions and $77 million for Asian American institutions. The African American and Native American minority depository institutions have the smallest asset sizes as evidenced by their average total assets of $12 and $10 million, respectively. Even though African American minority depository institutions generally have smaller asset sizes, their total number comprises almost half of all minority depository institutions. At the same time, their members represent only 17 percent of the members and 13 percent of the total assets in all minority depository institutions. The number of Hispanic American minority depository institutions represents 17 percent of total minority depository institutions, while their members represent 29 percent of all members and total assets equal 30 percent of the total assets of minority depository institutions. The number of Asian American minority depository institutions represents 7 percent of all minority depository institutions, while their members represent 7.5 percent of total membership and their assets represent 12 percent of total assets.
The number of Multi-Cultural minority depository institutions, which consists of institutions owned by two or more minority racial or ethnic groups, equals 26 percent of all minority depository institutions. Their total assets, averaging $79 million, comprise the majority of total assets in all minority depository institutions. Both their members and total assets represent 44 percent of all members and total assets in all minority depository institutions.
8
Annual Report to Congress • 2013
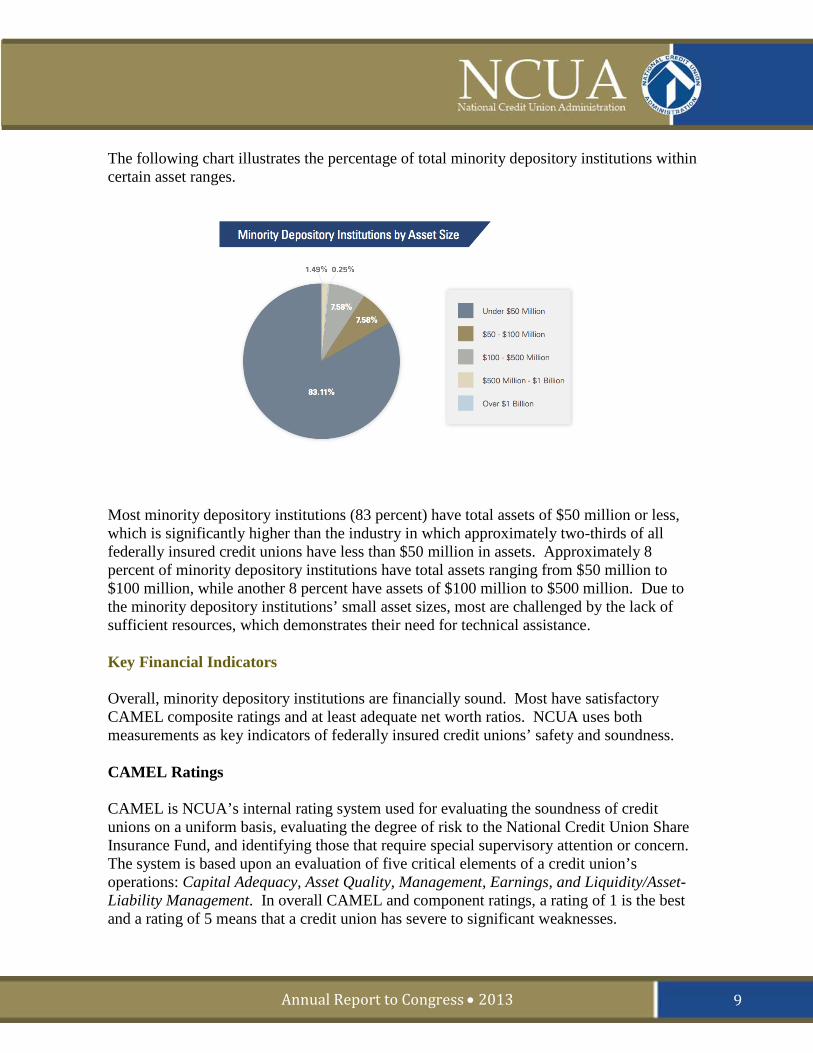
The following chart illustrates the percentage of total minority depository institutions within certain asset ranges.
Most minority depository institutions (83 percent) have total assets of $50 million or less, which is significantly higher than the industry in which approximately two-thirds of all federally insured credit unions have less than $50 million in assets. Approximately 8 percent of minority depository institutions have total assets ranging from $50 million to $100 million, while another 8 percent have assets of $100 million to $500 million. Due to the minority depository institutions’ small asset sizes, most are challenged by the lack of sufficient resources, which demonstrates their need for technical assistance. Key Financial Indicators Overall, minority depository institutions are financially sound. Most have satisfactory CAMEL composite ratings and at least adequate net worth ratios. NCUA uses both measurements as key indicators of federally insured credit unions’ safety and soundness. CAMEL Ratings CAMEL is NCUA’s internal rating system used for evaluating the soundness of credit unions on a uniform basis, evaluating the degree of risk to the National Credit Union Share Insurance Fund, and identifying those that require special supervisory attention or concern. The system is based upon an evaluation of five critical elements of a credit union’s operations: Capital Adequacy, Asset Quality, Management, Earnings, and Liquidity/Asset-Liability Management. In overall CAMEL and component ratings, a rating of 1 is the best and a rating of 5 means that a credit union has severe to significant weaknesses.
9
OFEAR Act
Minority Depository Institutions
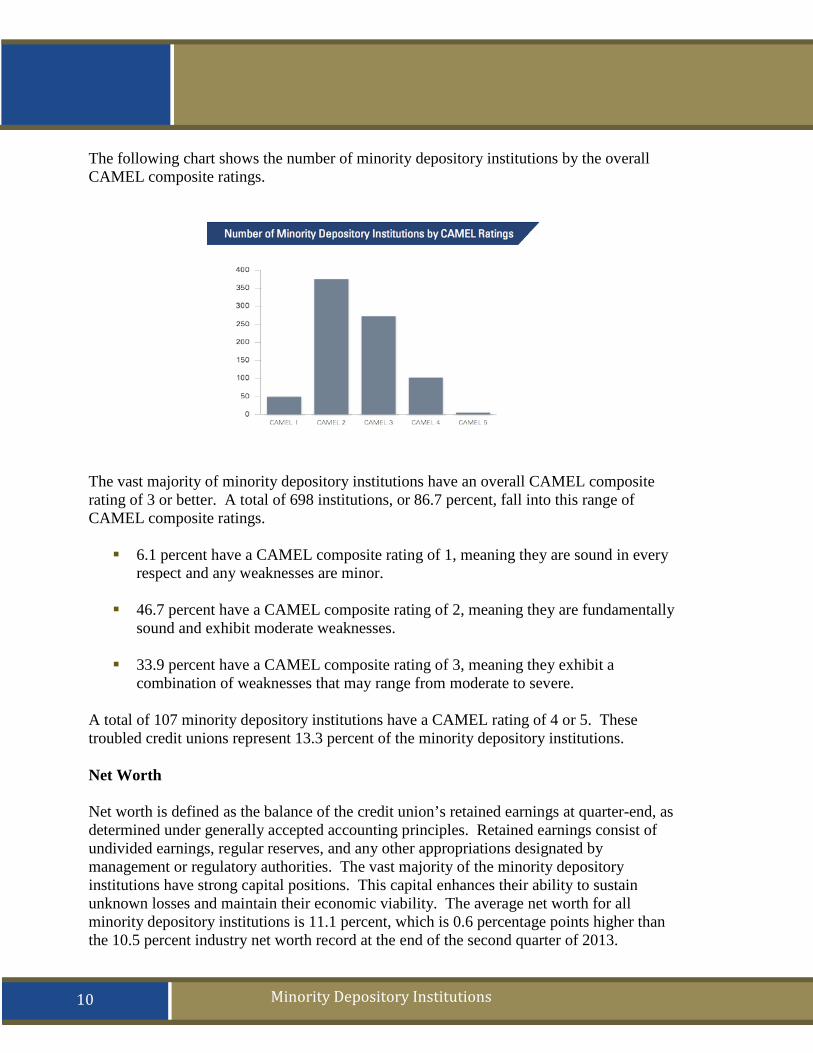
The following chart shows the number of minority depository institutions by the overall CAMEL composite ratings.
The vast majority of minority depository institutions have an overall CAMEL composite rating of 3 or better. A total of 698 institutions, or 86.7 percent, fall into this range of CAMEL composite ratings. 6.1 percent have a CAMEL composite rating of 1, meaning they are sound in every
respect and any weaknesses are minor. 46.7 percent have a CAMEL composite rating of 2, meaning they are fundamentally
sound and exhibit moderate weaknesses. 33.9 percent have a CAMEL composite rating of 3, meaning they exhibit a
combination of weaknesses that may range from moderate to severe. A total of 107 minority depository institutions have a CAMEL rating of 4 or 5. These troubled credit unions represent 13.3 percent of the minority depository institutions. Net Worth Net worth is defined as the balance of the credit union’s retained earnings at quarter-end, as determined under generally accepted accounting principles. Retained earnings consist of undivided earnings, regular reserves, and any other appropriations designated by management or regulatory authorities. The vast majority of the minority depository institutions have strong capital positions. This capital enhances their ability to sustain unknown losses and maintain their economic viability. The average net worth for all minority depository institutions is 11.1 percent, which is 0.6 percentage points higher than the 10.5 percent industry net worth record at the end of the second quarter of 2013.
10
Annual Report to Congress • 2013
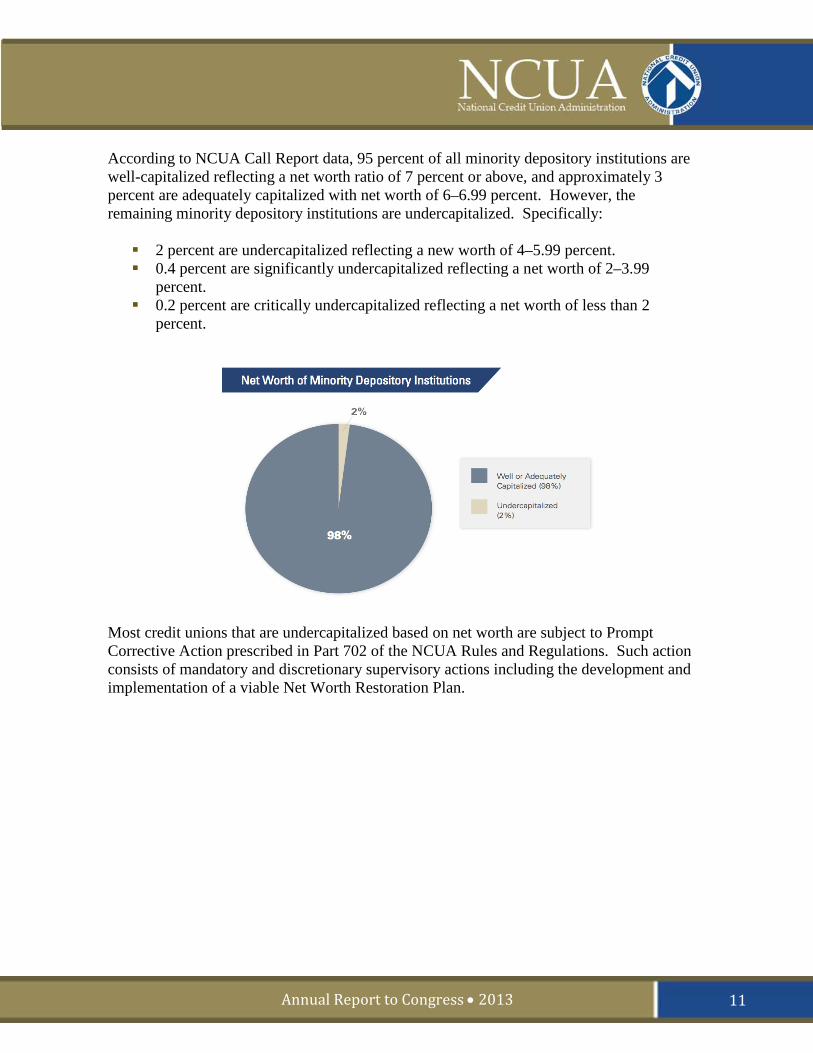
According to NCUA Call Report data, 95 percent of all minority depository institutions are well-capitalized reflecting a net worth ratio of 7 percent or above, and approximately 3 percent are adequately capitalized with net worth of 6–6.99 percent. However, the remaining minority depository institutions are undercapitalized. Specifically: 2 percent are undercapitalized reflecting a new worth of 4–5.99 percent. 0.4 percent are significantly undercapitalized reflecting a net worth of 2–3.99
percent. 0.2 percent are critically undercapitalized reflecting a net worth of less than 2
percent.
Most credit unions that are undercapitalized based on net worth are subject to Prompt Corrective Action prescribed in Part 702 of the NCUA Rules and Regulations. Such action consists of mandatory and discretionary supervisory actions including the development and implementation of a viable Net Worth Restoration Plan.
11

OFEAR Act
Minority Depository Institutions
Minority Depository Institutions Preservation Program Benefits
The Minority Depository Institutions Preservation Program will offer a variety of initiatives to help preserve and strengthen the viability of minority-owned depository institutions. Currently, these initiatives primarily pertain to technical assistance, educational opportunities, and merger assistance. NCUA’s OMWI will administer the program and provide oversight in ensuring minority depository institutions receive needed benefits. Specifically, OMWI will: Assist in facilitating the technical assistance between the agency’s Office of Small
Credit Union Initiatives (OSCUI) and eligible minority depository institutions.
Identify minority depository institutions that would benefit from OSCUI’s program initiatives and assist them in either obtaining the needed assistance or participating in those programs.
Encourage eligible minority depository institutions to apply for financial assistance and attend free workshops offered by OSCUI.
Aid in collaborating partnerships between minority depository institutions and other organizations as a means of providing technical assistance and educational opportunities.
Help locate mentor partners to assist in strengthening operations and obtaining technical and operational assistance, such as management and staff training, expertise in technical areas, free equipment, or assistance with projects.
Encourage minority depository institutions interested in acquiring failing minority depository institutions to register on NCUA’s Merger Partner Registry and invite them to bid on mergers or purchase and assumptions involving failing minority depository institutions.
Assist regions in identifying merger partner candidates for involuntary mergers or acquisitions of failing minority depository institutions.
Encourage organizations interested in being considered for a position as an interim manager of a minority depository institution placed into conservatorship to complete and submit a NCUA Vendor Registration Form. This form is used for vendors who wish to contract with NCUA.
Partner with NCUA offices and other organizations in providing training and educational opportunities to minority depository institutions.
12
Annual Report to Congress • 2013
The program benefits are designed to help credit unions thrive, and will depend upon the composition of the minority depository institution. Given that 92 percent are classified as either a low-income designated or a small credit union (with assets of $50 million or less), the technical assistance and training will be provided mostly by initiatives offered through OSCUI. OSCUI’s program initiatives include: Consulting Services. This program provides consulting services to newly chartered and small and low-income designated credit unions for a variety of operational and management matters. NCUA’s Economic Development Specialists work directly with the credit unions. The consulting services include assistance with budgeting, management and staff training, policy development, new product or service development, regulatory compliance, marketing plans, strategic plans, business plans, field of membership expansion, funding opportunities, succession planning, Net Worth Restoration Plans, and assistance to groups wishing to apply for a new credit union charter. NCUA performed consulting services for 167 minority depository institutions during the period from July 1, 2012, to June 30, 2013. Of all credit unions in the consulting program (485), these minority depository institutions represented 34 percent. Appendix 3 contains a list of these minority depository institutions. The most common consulting services performed for the minority depository institutions involved strategic planning, budgeting, operational assistance, lending, grant writing, strategic issues, Net Worth Restoration Plans, recordkeeping, and marketing. Grants and Loans. This program is also known as the Community Development Revolving Loan Fund. Established by Congress, the fund makes loans and grants to low-income designated credit unions. Congress established this fund to stimulate economic development in low-income communities. The funds for grants and loans come from congressional appropriations and loan interest and principal repayments. In 2012, NCUA awarded grants for the following purposes: Financial Literacy and Education in School Branches New Product and Service Development Staff, Officials and Board Member Training Student and Job Creation Internship Volunteer Income Tax Assistance Urgent or Emergency Needs
Loan proceeds were used for the following purposes: developing new products and services for members; improving technology; opening branch locations; providing alternatives to payday lending; and expanding outreach services.
13
OFEAR Act
Minority Depository Institutions
As of June 30, 2013, a total of 501 minority depository institutions were designated as low-income, which represented 62 percent of all minority depository institutions. The 501 minority depository institutions also represent 26 percent of all (1,643) credit unions designated low-income. In 2012, a total of 19 minority depository institutions received grants totaling $94,567 for urgent or emergency needs. These funds equal 40 percent of the total urgent needs grants of $237,161 made to all credit unions. In addition, 37 received other grant awards totaling $518,860, which represent 38 percent of those grant awards totaling $1,367,000. In regards to loans, two minority depository institutions received an aggregate amount of $310,000 out of more than $3 million in loans approved in 2012. Appendix 3 contains listings of the minority depository institutions that received these grants and loans. Training Programs. NCUA offers training, through OSCUI, to credit unions, regardless of asset size, in various forms, such as NCUA-sponsored workshops, clinics, boot camps, videos, webinars, and OSCUI FOCUS Newsletters. All training is provided at no cost to all credit unions. In the reporting period covered in 2012 and 2013, workshops, clinics, and boot camps were held in New York, Syracuse, Buffalo, Newark, Philadelphia, Pittsburgh, Baton Rouge, Birmingham, Indianapolis, Collinsville, Nashville, Dallas, Omaha, Quincy, Greenville, Seattle, Columbus, Ontario, San Juan, St. Croix, and Honolulu. Some of the workshop, clinic and boot camp topics included: Hidden in Plain Sight – Dishonest Employees Electronic Services Bank Secrecy Act Understanding the Financial Statements Leadership Development Regulatory Compliance Understanding the Key Ratios for Board Members Succession Planning Fair Lending Strategic Planning Improving Internal Controls
From 2012 to June 2013, attendees from minority depository institutions represented 30 percent of all officials and staff who attended the workshops.
14

Annual Report to Congress • 2013
In 2013, other forms of training have been provided to credit unions through videos and webinars that can be found on NCUA’s website. Some of the topics featured include: Supervisory Committee Training Risk-Based Lending Regulatory Compliance Bottom Line Results through Marketing Secondary Capital Net Worth Restoration Plans Credit Union Mergers Examination Issues Budget Preparation
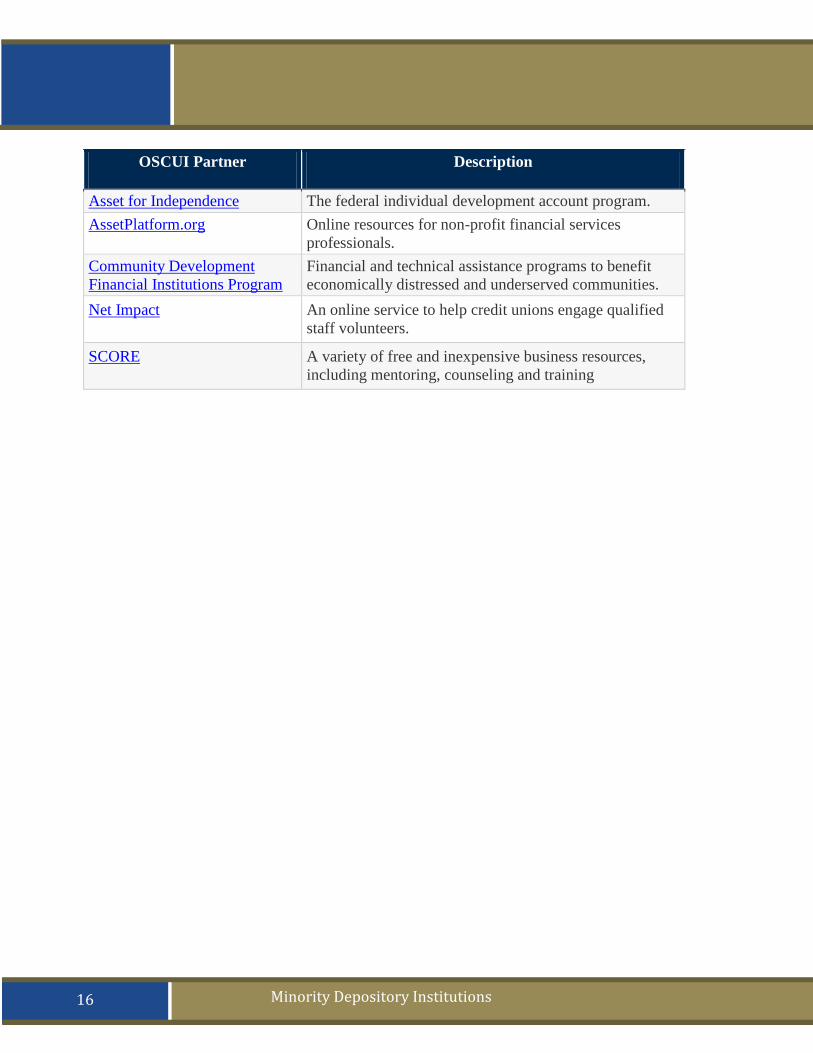
Outreach and Partnerships Programs. OSCUI also focused on improving the agency’s communications and education with newly chartered, low-income and smaller credit unions through the FOCUS Newsletter. Published monthly, the electronic newsletter focuses on helping these small credit unions achieve success by providing news, educational articles, and upcoming events relating to grant and loan rounds, and training. The FOCUS Newsletter is available online at http://go.usa.gov/WxhT. Additionally, the agency developed a new online search engine to help get answers to frequently asked questions called “FAQ+.” FAQ+ provides answers to common questions credit union managers and volunteers ask about things like training opportunities, grants and other subjects. This feature improves service to small credit unions, low-income credit unions and new credit unions by helping them become better informed and more efficient. This search engine can be assessed through OSCUI’s microsite on NCUA’s website. It also provides access to documents, videos, agency forms, and other resources. Collaborating with government agencies, industry leaders, and other nonprofits is the one of the most effective ways to achieve NCUA’s goals of sustaining small credit unions’ operations. OSCUI’s partners with the following organizations to accomplish its outreach objectives:
15
OFEAR Act
Minority Depository Institutions
OSCUI Partner Description
Asset for Independence The federal individual development account program. AssetPlatform.org Online resources for non-profit financial services
professionals. Community Development Financial Institutions Program
Financial and technical assistance programs to benefit economically distressed and underserved communities.
Net Impact An online service to help credit unions engage qualified staff volunteers.
SCORE A variety of free and inexpensive business resources, including mentoring, counseling and training
16
Annual Report to Congress • 2013
NCUA’s Outreach to Stakeholders
NCUA performed outreach to minority credit unions and trade associations serving minority depository institutions during the reporting. These trade associations included the National Federation of Community Development Credit Unions, African American Credit Union Coalition, and National Latino Credit Unions and Professionals. NCUA attended, exhibited, and gave speeches at their annual conferences. The agency also sent letters and held meetings with these organizations to obtain their input on issues that impact the minority depository institution community. Examples of situations where NCUA’s OWMI sought the trades’ input include the proposed Minority Depository Institutions Definition and the proposed Minority Depository Institutions Preservation Program Interpretive Ruling and Policy Statement. Below are examples illustrating some of these outreach events. National Federation of Community Development Credit Unions’ 2013 Annual Conference
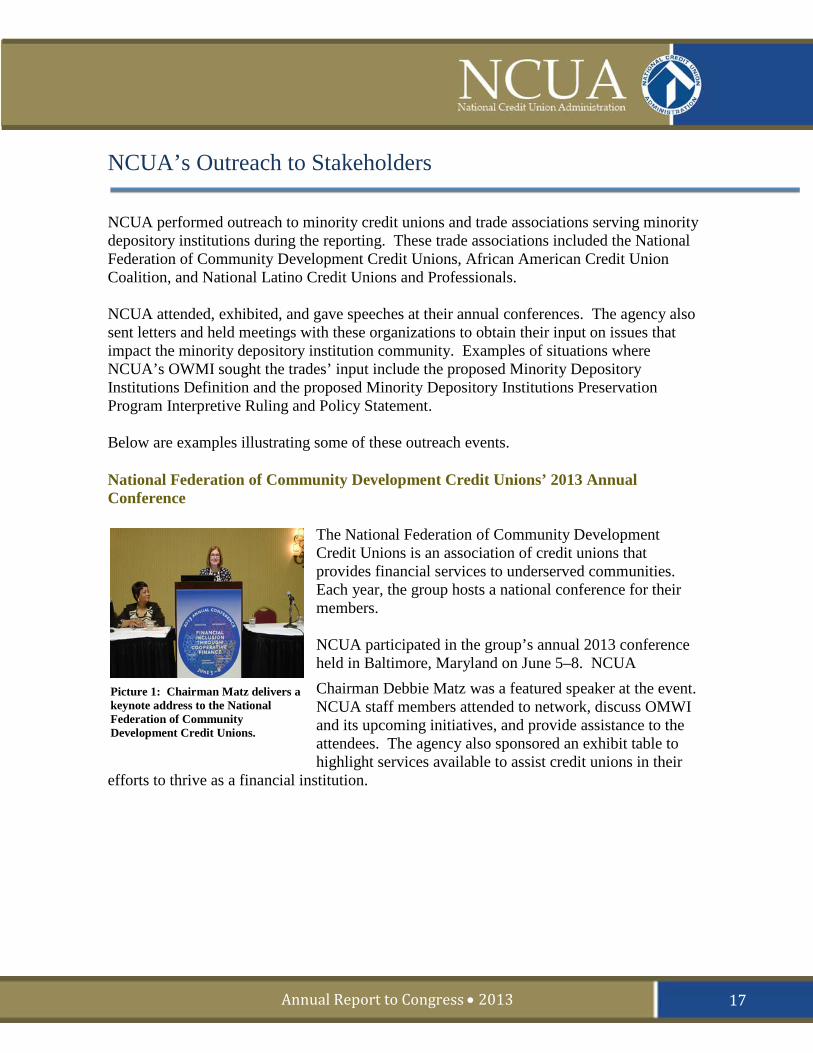
The National Federation of Community Development Credit Unions is an association of credit unions that provides financial services to underserved communities. Each year, the group hosts a national conference for their members. NCUA participated in the group’s annual 2013 conference held in Baltimore, Maryland on June 5–8. NCUA Chairman Debbie Matz was a featured speaker at the event. NCUA staff members attended to network, discuss OMWI and its upcoming initiatives, and provide assistance to the attendees. The agency also sponsored an exhibit table to highlight services available to assist credit unions in their
efforts to thrive as a financial institution.
Picture 1: Chairman Matz delivers a keynote address to the National Federation of Community Development Credit Unions.
17
OFEAR Act
Minority Depository Institutions
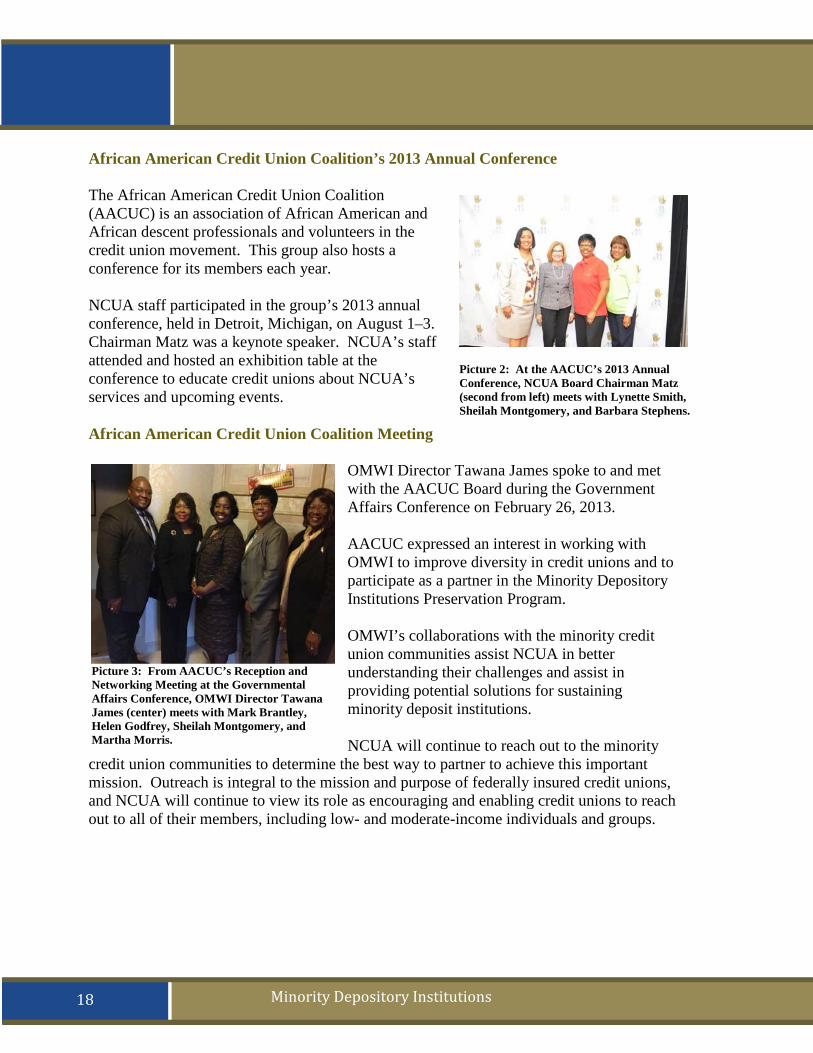
African American Credit Union Coalition’s 2013 Annual Conference The African American Credit Union Coalition (AACUC) is an association of African American and African descent professionals and volunteers in the credit union movement. This group also hosts a conference for its members each year. NCUA staff participated in the group’s 2013 annual conference, held in Detroit, Michigan, on August 1–3. Chairman Matz was a keynote speaker. NCUA’s staff attended and hosted an exhibition table at the conference to educate credit unions about NCUA’s services and upcoming events. African American Credit Union Coalition Meeting
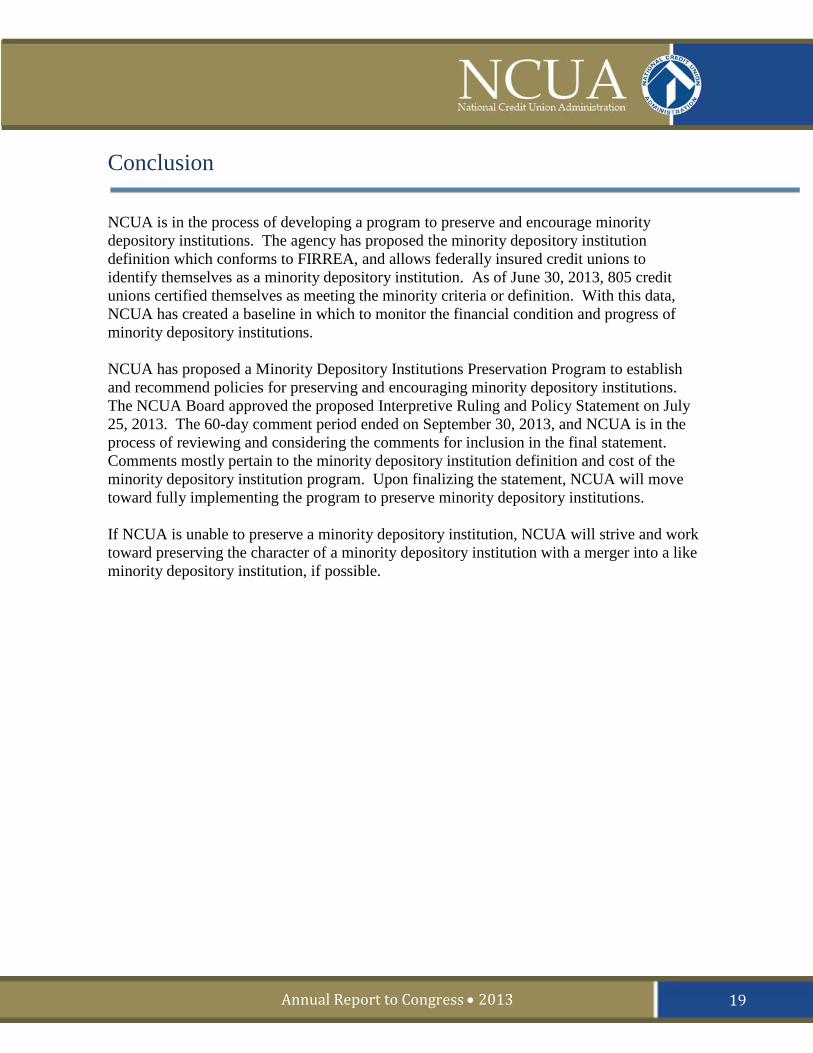
OMWI Director Tawana James spoke to and met with the AACUC Board during the Government Affairs Conference on February 26, 2013. AACUC expressed an interest in working with OMWI to improve diversity in credit unions and to participate as a partner in the Minority Depository Institutions Preservation Program. OMWI’s collaborations with the minority credit union communities assist NCUA in better understanding their challenges and assist in providing potential solutions for sustaining minority deposit institutions. NCUA will continue to reach out to the minority
credit union communities to determine the best way to partner to achieve this important mission. Outreach is integral to the mission and purpose of federally insured credit unions, and NCUA will continue to view its role as encouraging and enabling credit unions to reach out to all of their members, including low- and moderate-income individuals and groups.
Picture 3: From AACUC’s Reception and Networking Meeting at the Governmental Affairs Conference, OMWI Director Tawana James (center) meets with Mark Brantley, Helen Godfrey, Sheilah Montgomery, and Martha Morris.
Picture 2: At the AACUC’s 2013 Annual Conference, NCUA Board Chairman Matz (second from left) meets with Lynette Smith, Sheilah Montgomery, and Barbara Stephens.
18
Annual Report to Congress • 2013
Conclusion
NCUA is in the process of developing a program to preserve and encourage minority depository institutions. The agency has proposed the minority depository institution definition which conforms to FIRREA, and allows federally insured credit unions to identify themselves as a minority depository institution. As of June 30, 2013, 805 credit unions certified themselves as meeting the minority criteria or definition. With this data, NCUA has created a baseline in which to monitor the financial condition and progress of minority depository institutions. NCUA has proposed a Minority Depository Institutions Preservation Program to establish and recommend policies for preserving and encouraging minority depository institutions. The NCUA Board approved the proposed Interpretive Ruling and Policy Statement on July 25, 2013. The 60-day comment period ended on September 30, 2013, and NCUA is in the process of reviewing and considering the comments for inclusion in the final statement. Comments mostly pertain to the minority depository institution definition and cost of the minority depository institution program. Upon finalizing the statement, NCUA will move toward fully implementing the program to preserve minority depository institutions. If NCUA is unable to preserve a minority depository institution, NCUA will strive and work toward preserving the character of a minority depository institution with a merger into a like minority depository institution, if possible.
19
OFEAR Act
Minority Depository Institutions
Appendix 1: Proposed Minority Depository Institutions Preservation Program Interpretive Ruling and Policy Statement
7535-01-U NATIONAL CREDIT UNION ADMINISTRATION RIN: 3133-AE16 Minority Depository Institution Preservation Program AGENCY: National Credit Union Administration. ACTION: Proposed Interpretive Ruling and Policy Statement 13-1, with request for comments. SUMMARY: The National Credit Union Administration (NCUA) recognizes the importance of minority credit unions and the unique challenges they often face in serving their communities. NCUA is establishing a Minority Depository Institution Preservation Program to encourage the preservation of Minority Depository Institutions. The program, to be administered by NCUA’s Office of Minority and Women Inclusion, would consist of outreach efforts, various forms of technical assistance, and educational opportunities to benefit eligible credit unions. DATES: Comments must be received on or before [Insert date 60 days from date of publication in the FEDERAL REGISTER]. ADDRESSES: You may submit comments by any of the following methods (Please send comments by one method only): Federal eRulemaking Portal: http://www.regulations.gov. Follow the instructions for
submitting comments. NCUA Web Site: http://www.ncua.gov/Legal/Regs/Pages/PropRegs.aspx. Follow the
instructions for submitting comments. E-mail: Address to [email protected]. Include “[Your name]—Comments on
Proposed IRPS 13-1, Minority Depository Institution Preservation Program” in the e-mail subject line.
Fax: (703) 518-6319. Use the subject line described above for e-mail. Mail: Address to Mary Rupp, Secretary of the Board, National Credit Union
Administration, 1775 Duke Street, Alexandria, Virginia 22314-3428. Hand Delivery/Courier: Same as mail address.
PUBLIC INSPECTION: You can view all public comments on NCUA’s website at http://www.ncua.gov/Legal/Regs/Pages/PropRegs.aspx as submitted, except for those we cannot post for technical reasons. NCUA will not edit or remove any identifying or contact
20
Annual Report to Congress • 2013
information from the public comments submitted. You may inspect paper copies of comments in NCUA’s law library at 1775 Duke Street, Alexandria, Virginia 22314, by appointment weekdays between 9 a.m. and 3 p.m. To make an appointment, call (703) 518-6546 or send an e-mail to [email protected]. FOR FURTHER INFORMATION CONTACT: Tawana James, Director, Office of Minority and Women Inclusion, at (703) 518-1651; or Cynthia Vaughn, Diversity Outreach Program Analyst, Office of Minority and Women Inclusion, at (703) 518-1653. SUPPLEMENTARY INFORMATION: I. Background In 1989, Congress enacted the Financial Institutions Reform, Recovery and Enforcement Act (FIRREA)10 in response to the failure of the Federal Savings and Loan Insurance Corporation (FSLIC). FSLIC insured the deposits of insolvent savings & loan institutions. Section 308 of FIRREA established goals for preserving and promoting minority depository institutions11. When established, Section 308 applied only to the Federal Deposit Insurance Corporation (FDIC) and Office of Thrift Supervision (OTS).12 The FDIC and OTS developed various initiatives, such as training, technical assistance, and educational programs, aimed at preserving federally insured banks and savings institutions that meet FIRREA’s definition of a minority depository institution (MDI).13 In 2010, Congress enacted the Dodd Frank Wall Street Reform and Consumer Protection Act (Dodd Frank)14. Section 367(4)(A) of Dodd Frank amended FIRREA §308 to require NCUA, OCC, and FRB to comply with its goals to preserve and encourage MDIs.15 In addition, Dodd Frank §367(4)(B) requires these agencies, along with FDIC, to each submit an annual report to Congress describing actions taken to carry out FIRREA §308.16 II. Interpretive Ruling and Policy Statement (IRPS) 13-1 1. Why is the NCUA Board proposing this IRPS?
10 Pub. L. 101-73, 103 Stat. 183 11 12 U.S.C. 1463 note (a) 12 The Office of the Comptroller of the Currency (OCC) and Board of Governors of the Federal Reserve System (FRB) also initiated MDI programs to comply with the spirit of FIRREA §308, even though they were not originally required to do so. The OTS became part of the OCC on July 21, 2011. OCC now administers the OTS MDI Program. 13 12 U.S.C. 1463 note (b) 14 Pub. L. 111-203, 124 Stat. 1376; 12 U.S.C. 5301 et seq. 15 124 Stat. 1556. 16 124 Stat. 1556.
21
OFEAR Act
Minority Depository Institutions
The NCUA Board is proposing this IRPS as the basis for establishing a Minority Depository Institution Preservation Program (MDI Program) designed to achieve the goals of preserving and encouraging Minority Depository Institutions (MDIs) as FIRREA §308 directs. Recognizing the important role of MDIs in minority communities, the NCUA Board envisions a program of proactive steps and outreach efforts to promote and preserve minority ownership in the credit union industry. To this end, the IRPS prescribes an MDI Program featuring the eligibility criteria, initiatives and benefits. 2. What are the goals and objectives of the MDI Program?
The MDI Program embraces goals and objectives related to credit union viability and access. Specifically, the program is consistent with NCUA’s mission and the following two goals identified in NCUA’s current strategic plan:
To ensure a safe, sound, and healthy credit union system; and To promote access to credit unions for all eligible persons.
The program also follows the preservation goals and objectives of FIRREA §308 for MDIs17 namely:
To preserve the present number of MDIs; To preserve the minority character of MDIs in cases involving (involuntary)
mergers or acquisitions of an MDI by following the priority of the prescribed “general preference guidelines” in identifying a merger or acquisition partner;18
To provide technical assistance to prevent insolvency of MDIs not now insolvent; To promote and encourage the creation of new MDIs; and. To provide for training, technical assistance, and educational programs.
3. Who would be eligible to participate in the MDI Program?
A credit union meeting the definition of an MDI is eligible to participate in the MDI Preservation Program. In defining an MDI, NCUA proposes to adapt criteria consistent with FIRREA §308’s criteria for a minority depository institution.19 Accordingly, NCUA is proposing to define a Minority Depository Institution as follows:
17 Dodd Frank §367(4)(A) expanded the application of FIRREA §308 to NCUA. 18 In priority, the general preference guidelines for identifying an involuntary merger/acquisition partner are: (a) Same type of MDI in the same city; (b) Same type of MDI in the same state; (c) Same type of MDI nationwide; (d) Any type of MDI in the same city; (e) Any type of MDI in the same state; (f) Any type of MDI nationwide; and (g) Any other bidders (for merger/acquisition partners). 12 U.S.C. 1463 note (a)(2). Rules concerning FOM, least cost to NCUSIF, and safety and soundness still apply to all mergers. 19 12 U.S.C. 1463 note (b)(1). Compare 12 U.S.C. 5452(g)(3).
22
Annual Report to Congress • 2013
(a) A federally insured credit union with more than 50 percent of its current or eligible potential members falling within any of the eligible minority groups; and
(b) A federally insured credit union with more than 50 percent of the current management officials falling within any of the eligible minority groups.
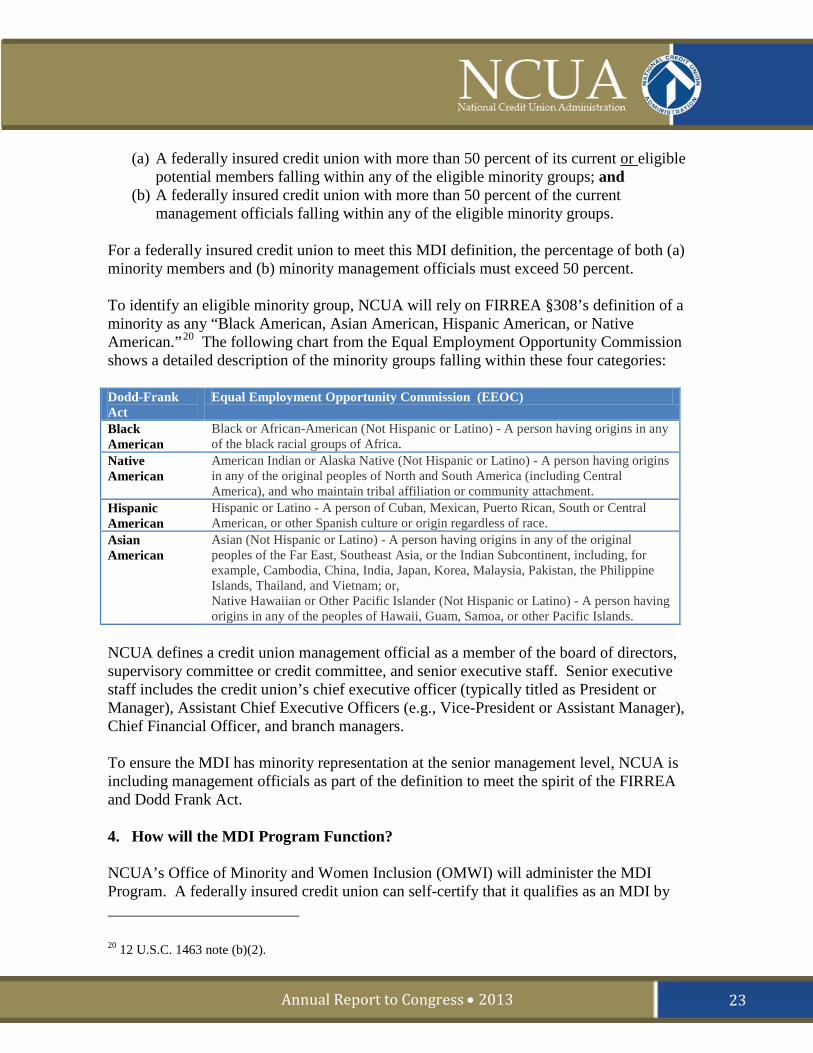
For a federally insured credit union to meet this MDI definition, the percentage of both (a) minority members and (b) minority management officials must exceed 50 percent. To identify an eligible minority group, NCUA will rely on FIRREA §308’s definition of a minority as any “Black American, Asian American, Hispanic American, or Native American.”20 The following chart from the Equal Employment Opportunity Commission shows a detailed description of the minority groups falling within these four categories: Dodd-Frank Act
Equal Employment Opportunity Commission (EEOC)
Black American
Black or African-American (Not Hispanic or Latino) - A person having origins in any of the black racial groups of Africa.
Native American
American Indian or Alaska Native (Not Hispanic or Latino) - A person having origins in any of the original peoples of North and South America (including Central America), and who maintain tribal affiliation or community attachment.
Hispanic American
Hispanic or Latino - A person of Cuban, Mexican, Puerto Rican, South or Central American, or other Spanish culture or origin regardless of race.
Asian American
Asian (Not Hispanic or Latino) - A person having origins in any of the original peoples of the Far East, Southeast Asia, or the Indian Subcontinent, including, for example, Cambodia, China, India, Japan, Korea, Malaysia, Pakistan, the Philippine Islands, Thailand, and Vietnam; or, Native Hawaiian or Other Pacific Islander (Not Hispanic or Latino) - A person having origins in any of the peoples of Hawaii, Guam, Samoa, or other Pacific Islands.
NCUA defines a credit union management official as a member of the board of directors, supervisory committee or credit committee, and senior executive staff. Senior executive staff includes the credit union’s chief executive officer (typically titled as President or Manager), Assistant Chief Executive Officers (e.g., Vice-President or Assistant Manager), Chief Financial Officer, and branch managers. To ensure the MDI has minority representation at the senior management level, NCUA is including management officials as part of the definition to meet the spirit of the FIRREA and Dodd Frank Act. 4. How will the MDI Program Function? NCUA’s Office of Minority and Women Inclusion (OMWI) will administer the MDI Program. A federally insured credit union can self-certify that it qualifies as an MDI by
20 12 U.S.C. 1463 note (b)(2).
23
OFEAR Act
Minority Depository Institutions
affirmatively answering one of following two questions21 on NCUA’s Credit Union Online System (CU Online System) accessible from our website (www.ncua.gov) or the CU Profile when submitting a Call Report:
(a) Does your credit union have more than 50 percent of its current members and current management officials who are Black American, Native American, Hispanic American, or Asian American?
(b) Does your credit union have more than 50 percent of its eligible potential members22 and current management officials who are Black American, Native American, Hispanic American, or Asian American?
The credit union must certify that the eligibility criteria for members and management officials have been met. Credit unions with $50 million or less in assets may self-certify based solely on knowledge of their membership. However, the management officials must also meet the 50 percent MDI criterion. Credit unions with assets over $50 million may rely on one of the following methods to determine the minority composition of its current membership or its potential field of membership (FOM): (A) Ascertain the minority membership composition using demographics data from the U.S.
Census by either: (1) The area(s) where the current or potential membership resides; or (2) The area(s) consisting of the credit union’s service area(s)23 as prescribed in the
FOM designated by the credit union’s charter. If the U.S. Census data (e.g., census tracts, zip codes, townships, boroughs, cities, counties, etc.) shows the area’s population is comprised mostly of eligible minorities, the credit union may assume its membership or service area(s) have that minority composition.
(B) Use Home Mortgage Disclosure Act (HMDA) to calculate the reported number of minority mortgage applicants divided by the total number of mortgage applicants within
21 NCUA is changing the questions to inquire about the minority representation among members and management officials separately. NCUA is currently pursuing OMB approval for this change in conjunction with other changes to the call report. 22 Potential members correspond with the same definition used for FOM expansions, which include the community population for community chartered credit unions; total employees for occupational groups(s); and total members for associational groups. There are no adjustments for family members. 23 A federal credit union's service area is the area that can reasonably be served by the service facilities accessible to the groups within the field of membership. The service area will most often coincide with the geographic area primarily served by the service facility. For a community credit union, this is the geographic community it serves as identified in the charter and FOM. For multiple common bond credit unions, it can be the areas where the select groups, in the charter and FOM, are located.
24
Annual Report to Congress • 2013
the credit union’s membership. If the share of minority applicants meets or exceeds the 50 percent threshold, the membership component may be met.
(C) Elect to voluntarily collect data from members who choose to self-identify themselves as minority and use the data to determine the credit union’s share of minority representation. The credit union may wish to consider using an unbiased party to administer the collection process. For example, data can be collected through a member survey assessing future services desired or during the mail election ballots.
(D) Use any other reasonable form of data, such as membership address list, employer’s demographic analysis of employees, etc.
A credit union with assets greater than $50 million that self-identifies as an MDI should maintain some form of documentation demonstrating how it determined the minority eligibility criteria of (a) membership and (b) management officials were met.24 Such documentation may consist of demographic data analysis obtained from the U.S. Census Bureau (www.census.gov), HDMA, or any other reasonable form of data (e.g., sponsor employee demographic or members’ zip code analysis). When a credit union self-identifies as an MDI regardless of asset size, OMWI may assess the legitimacy of the certification (or the underlying data). If there is doubt that the credit union meets both minority criteria based on (a) membership and (b) management officials, the NCUA’s OWMI will:
1) Notify the credit union in writing about its findings. 2) Provide the credit union an opportunity to submit documentation and/or rationale
to support its MDI self-identification within 60 days of receiving OMWI’s notification.
3) Review the credit union’s information and inform the credit union on whether it meets the minority criteria based on the information submitted within 60 days of OMWI’s receipt.
4) Deny the MDI designation if the credit union provides either no information or, in NCUA’s discretion, insufficient information or rationale to support the certification on both minority criteria (a) membership and (b) management officials.
A federally insured credit union may appeal the agency’s denial of an MDI designation to the NCUA Board within 60 days of the date of OMWI’s notice of denial.25
24 See sections 3(a) and 3(b) supra. 25 Such an appeal must be filed with NCUA’s OMWI Director and accompanied by documentation that demonstrates the federally insured credit union meets the MCU eligibility requirements. On appeal, the NCUA Board will determine whether the OMWI Director correctly applied the minority eligibility criteria.
25
OFEAR Act
Minority Depository Institutions
NCUA plans to develop and use a tool to determine the minority composition of a credit union’s membership using their members’ zip code data obtained from an AIRES download (similar to the current low-income designation tool). NCUA will periodically review and determine whether an MDI continues to meet the MDI definition. Changes in the MDI definition can occur from FOM expansions (e.g., mergers, purchase and assumptions, new groups added to the FOM, or charter conversions) as well as changes in the management officials (e.g., elections, new hires, separations, etc.). An MDI should assess whether it continues to meet the MDI definition at least once a year (e.g., December 31st call report cycle), and update its status on NCUA’s Credit Union Online system or Credit Union Profile of the Call Report system, if necessary. Participation in the MDI Program is voluntary. An MDI may discontinue its participation at any time by updating its status on NCUA’s Credit Union Online system. Upon such action, the credit union would not be eligible to participate in any MDI Program initiatives (e.g., MDI merger/acquisition preference consideration, MDI partnerships, etc.). 5. What are the benefits of participating in the MDI Program? NCUA seeks to provide MDI Program participants with a variety of benefits to assist in preserving the economic viability of their institutions. These benefits include facilitating technical assistance and educational opportunities to MDIs in coordination with NCUA’s Office of Small Credit Union Initiatives (OSCUI). Such technical assistance may include participating in the agency’s Small Credit Union Program,26 including:
(1) participation in Small Credit Union Consulting Program; (2) Economic Development Specialist assistance in addressing examination concerns or
topics of interest; (3) participation in an NCUA sponsored workshop; or (4) assistance in obtaining a grant or a loan through NCUA’s Community Development
Revolving Loan Fund (CDRLF). OMWI may aid in collaborating partnerships between MDIs and other organizations (e.g., MDIs, OSCUI, and other sources) as a means of providing technical and/or operational assistance to MDIs. The technical and/or operational assistance may include training for officials and staff, expertise in technical areas (e.g., marketing, bidding on merger proposals, etc.), equipment and financial assistance for specific projects/goals, etc. Additionally, OMWI may assist in locating a CU mentor or merger partner for an MDI.
26 The Small Credit Union Program’s initiatives are generally offered to credit unions that have less than $50 million in assets or are low-income designated. Grants and loans from the CDRLF are only available to low-income designated credit unions. The workshops are open to all credit unions.
26
Annual Report to Congress • 2013
NCUA will publish a list of federally insured MDIs on its website to enable organizations (e.g., banks, MDIs, third parties) to identify MDIs with which to partner, mentor, provide resources, and/or establish business relationships. For example, banks can obtain Community Reinvestment Act (CRA) credit for investing in MDIs. If a bank has an unused building, the bank could lease the space to an MDI for free or at low cost, and receive a corresponding CRA credit. NCUA will monitor the financial condition of MDIs, and will provide an annual report to Congress on the overall financial condition of MDIs. Through this process, the agency will also identify MDIs that might benefit from the MDI Program’s support and technical assistance, such as mentoring, partnerships, workshops, roundtables, associations with other credit unions, and support through programs such as NCUA’s Small Credit Union Program or the U.S. Treasury’s Community Development Financial Institutions Fund. NCUA will attempt to preserve the minority character of failing MDIs that go through the involuntary merger or acquisition process by using the General Preference Guidelines outlined in Section 308 to the FIRREA. In the event of the merger of a troubled MDI, NCUA will invite MDIs that qualify to bid on failing MDIs, along with non-MDI credit unions. Such actions would only occur on involuntary mergers/acquisitions. However, OMWI will offer assistance in locating an MDI partner for those MDIs wishing to voluntarily merge their operations into another MDI. To be considered an acquirer, an MDI must document its desire to acquire an MDI by registering itself on NCUA’s Merger Registry via the CU Online System. Additionally, if any organization wishes to be considered as a candidate for managing a conservatorship of an MDI, it should document its interest by completing an NCUA Vendor Registration Form (NCUA 1772). The vendor registration form can be accessed, completed and submitted on NCUA’s website under Procurement/Contracting Opportunities. The form can also be accessed via the following link: http://www.ncua.gov/about/Documents/Procurement/VendorRegistration.pdf. OMWI will provide a list of diverse candidates to the regions for consideration as the interim Chief Executive Officer/Manager of the MDI. Finally, NCUA will provide assistance to groups that may be interested in chartering a new MDI. Staff will be available to discuss the application process with such groups. III. Regulatory Procedures Regulatory Flexibility Act The Regulatory Flexibility Act (RFA) requires NCUA to prepare an analysis to describe any significant economic impact a proposed IRPS may have on a substantial number of small entities (currently defined by NCUA as credit unions with under $50 million in assets). In this case, credit unions under $50 million in assets can self-certify their credit unions as
27
OFEAR Act
Minority Depository Institutions
meeting the MDI definition based solely on their knowledge of their current or potential membership without any supporting documentation. Also, the economic impact of the MDI Program on small entities would be significantly beneficial in that the MDI Program offers various forms of technical assistance and educational opportunities to eligible credit unions, including those that qualify as small entities, at no cost. NCUA therefore certifies that the proposed IRPS will not have a significant adverse economic impact on a substantial number of credit unions under $50 million in assets. Accordingly, no regulatory flexibility analysis is required. Paperwork Reduction Act The Paperwork Reduction Act of 1995 (PRA) applies to rulemakings in which an agency creates a new paperwork burden on regulated entities or modifies an existing burden. For purposes of the PRA, a paperwork burden may take the form of either a reporting or a recordkeeping requirement, both referred to as information collections. NCUA has determined that the procedure for credit unions to self-identify as meeting the definition of an MDI creates a new information collection requirement. As required, NCUA has applied to the Office of Management and Budget (OMB) for approval of the information collection procedure described below. To participate in the MDI program, a credit union must answer two questions based on the minority composition of its (1) current or potential membership and (2) current management officials. The credit union must ascertain whether the minority ratio of the credit union members exceeds 50 percent and the ratio of current management officials exceeds 50 percent. The credit union may use (a) U.S. Census data (e.g., census tracts, zip codes, townships, boroughs, cities, counties, etc.) indicating that either the area where the credit union’s potential membership resides, or which is its service area, is comprised mostly of eligible minorities; (b) Home Mortgage Disclosure Act (HMDA) data indicating that the ratio of minority mortgage applicants exceeds 50 percent of total mortgage applicants [within the credit union membership]; (c) voluntary collection of race, ethnicity, origin data from membership; or (d) any other reasonable form of data that support the minority composition of the membership The credit union may answer the questions regarding minority membership and management composition on NCUA’s Credit Union Online System or in its Call Report.27 If the credit union answers “yes” to both questions, it will qualify as an MDI and be eligible to participate in the MDI program. NCUA estimates that, with reasonable access to the internet, it typically would take credit union staff approximately 45 minutes to (1) locate, download and review the U.S. Census or HMDA data needed; (2) assess the minority composition of its membership; and (3) assess
27 In 2011, NCUA published a PRA notice to insert the MCU self-identification questions into the Call Report. 76 FR 54498 (Sept. 1, 2011); 76 FR 62456 (Oct. 7, 2011).
28
Annual Report to Congress • 2013
the minority composition of its management officials to support the credit union’s answers to the two MDI self-identification questions. Certain credit unions must retain the supporting documentation in its files for verification of its MDI eligibility. NCUA has determined that 802 credit unions would qualify as MDIs based on their answers to the two questions as of June 17, 2013. Of the 802 credit unions, 671 credit unions have assets of $50 million or less. NCUA proposes to allow these 671 credit unions to self-identify as an MDI based solely on the knowledge of their membership. As a result, the aggregate information collection burden for the remaining 131 credit unions to self-identify as an MDI is 98.25 hours (45 minutes x 131 MDIs ÷ 60 minutes). Also, we estimate that approximately five percent of the 671 credit unions whose self-certification is based on knowledge of membership may be subject to question. Thus, the aggregate information collection burden for those 40 credit unions (671 x .05) is 30 hours (45 minutes x 40 MDIs ÷ 60 minutes). Total hours estimated are 128.25 hours annually. Organizations and individuals wishing to submit comments on this information collection requirement should direct them to the Office of Information and Regulatory Affairs, OMB, Attn: Shagufta Ahmed, Room 10226, New Executive Office Building, Washington, DC 20503, with a copy to the Secretary of the Board, National Credit Union Administration, 1775 Duke Street, Alexandria, Virginia 22314-3428. The PRA requires OMB to make a decision concerning the collection of information contained in the proposed regulation between 30 and 60 days after publication of this document in the Federal Register. NCUA considers comments by the public on this proposed collection of information in: Evaluating whether the proposed collection of information is necessary for the
proper performance of the functions of the NCUA, including whether the information will have a practical use;
Evaluating the accuracy of the NCUA's estimate of the burden of the proposed collection of information, including the validity of the methodology and assumptions used;
Enhancing the quality, usefulness, and clarity of the information to be collected; and Minimizing the burden of collection of information on those who are to respond,
including through the use of appropriate automated, electronic, mechanical, or other technological collection techniques or other forms of information technology (e.g., permitting electronic submission of responses).
Executive Order 13132 Executive Order 13132 encourages independent regulatory agencies to consider the impact of their actions on state and local interests. NCUA, an independent regulatory agency as defined in 44 U.S.C. 3502(5), voluntarily complies with the executive order to adhere to fundamental federalism principles. This IRPS would not have a substantial direct effect on the states, on the relationship between the national government and the states, or on the distribution of power and responsibilities among the various levels of government. NCUA
29
OFEAR Act
Minority Depository Institutions
has determined that this proposed rule does not constitute a policy that has federalism implications for purposes of the executive order. Assessment of Federal Regulations and Policies on Families NCUA has determined that this IRPS will not affect family well-being within the meaning of Section 654 of the Treasury and General Government Appropriations Act, 1999, Public Law 105–277, 112 Stat. 2681 (1998). Agency Regulatory Goal The Board’s goal is to promulgate clear and understandable regulations that impose minimal regulatory burden. We request your comments on whether this IRPS is understandable and minimally intrusive if implemented as proposed. By the National Credit Union Administration Board on July 25, 2013.
Mary Rupp Secretary of the Board
30
Annual Report to Congress • 2013
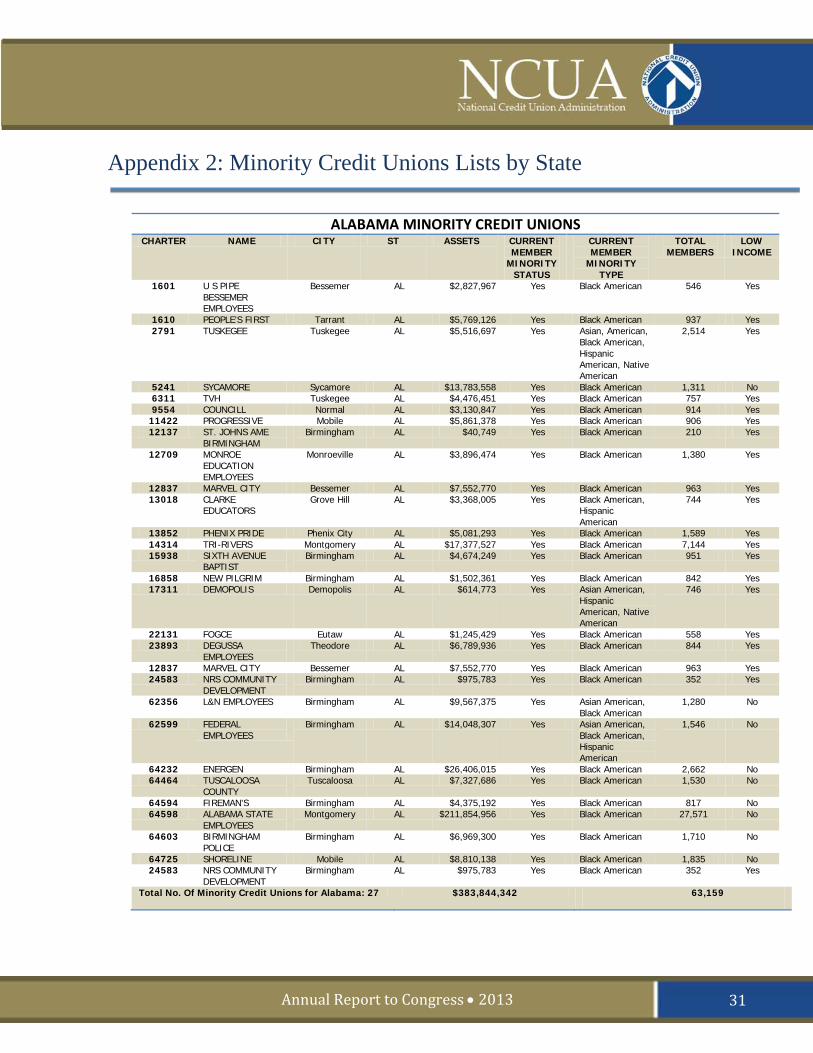
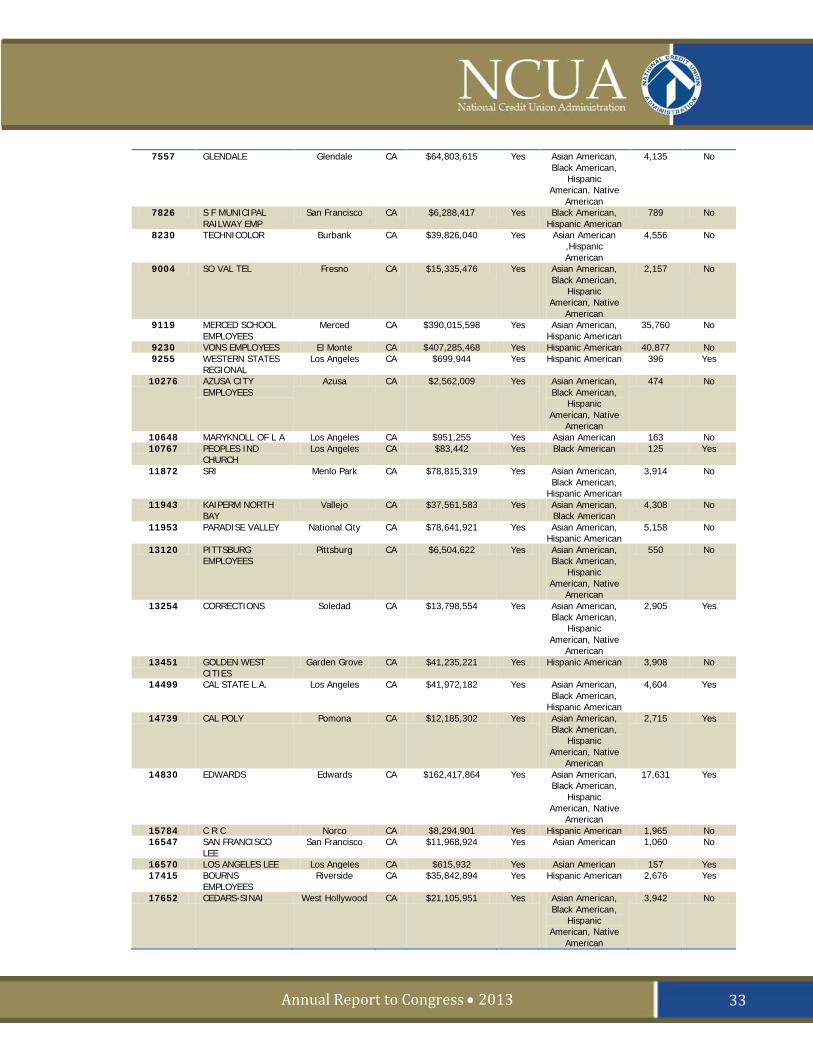
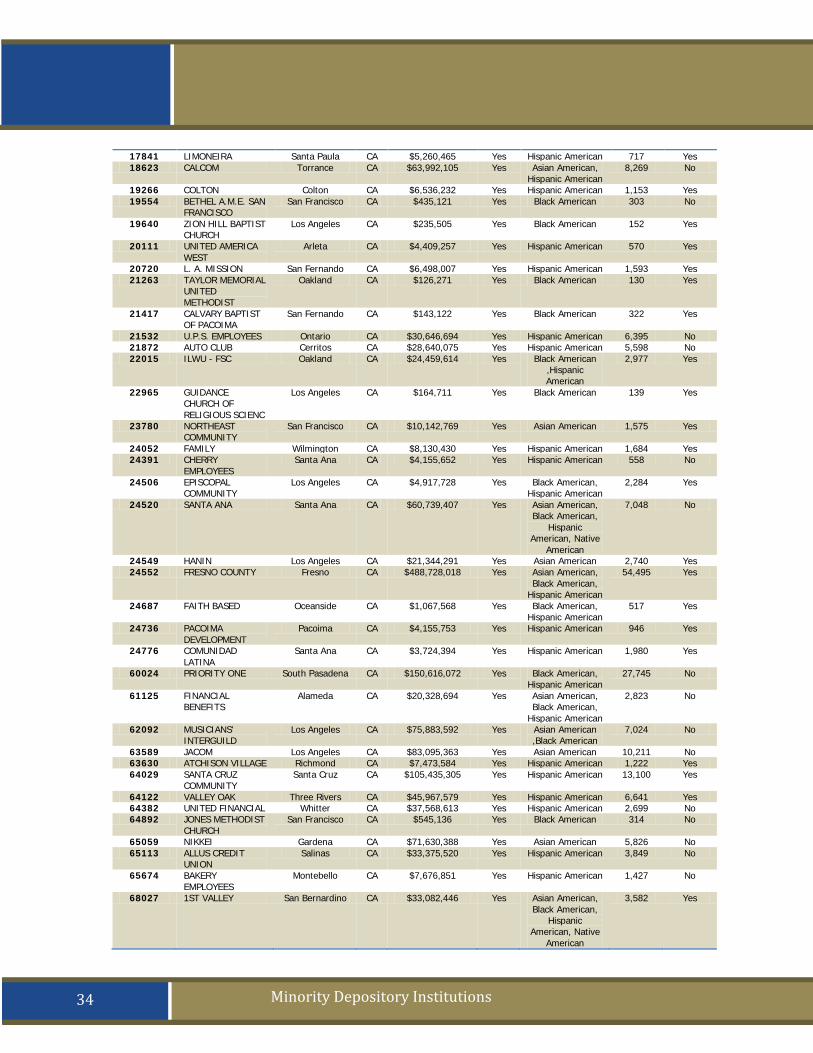
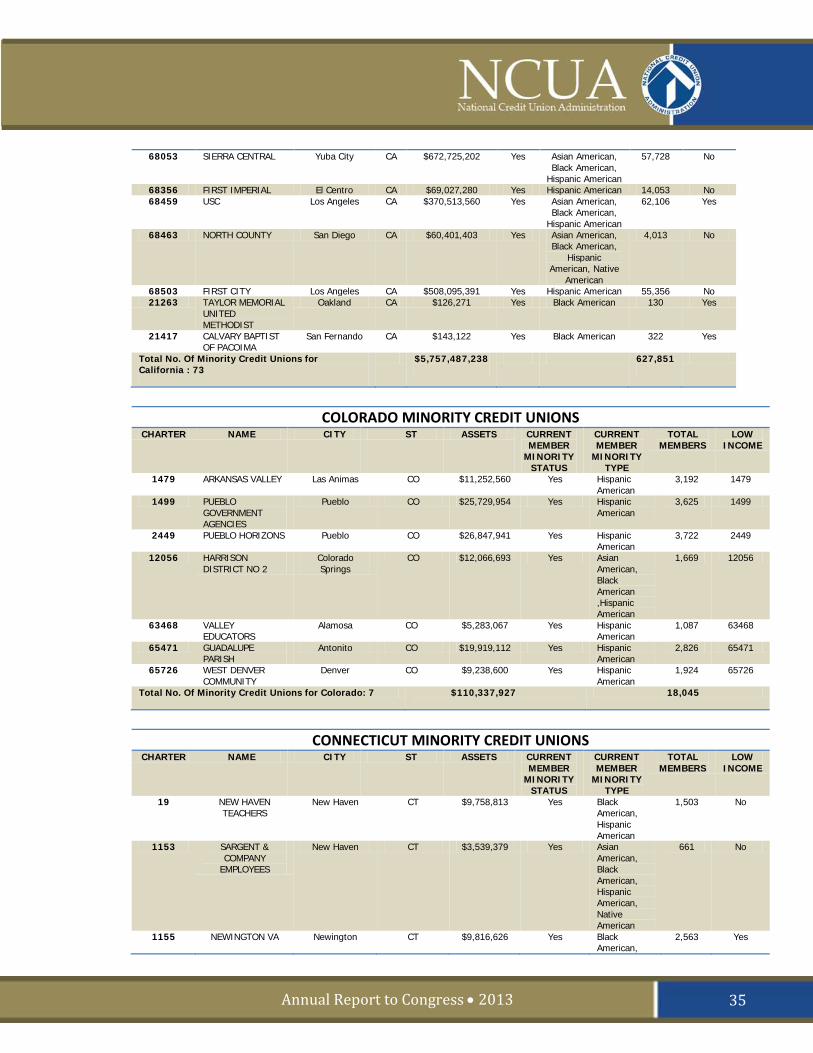
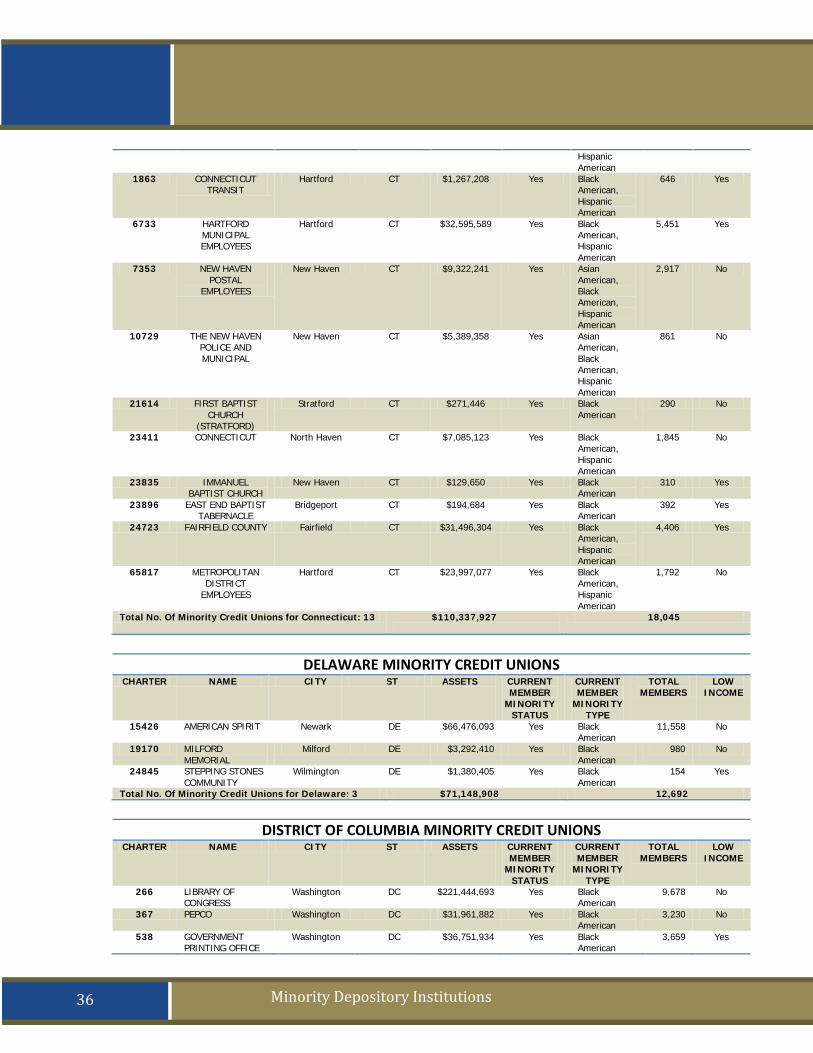
Appendix 2: Minority Credit Unions Lists by State
ALABAMA MINORITY CREDIT UNIONS
CHARTER NAME CITY ST ASSETS CURRENT MEMBER
MINORITY STATUS
CURRENT MEMBER
MINORITY TYPE
TOTAL MEMBERS
LOW INCOME
1601 U S PIPE BESSEMER EMPLOYEES
Bessemer AL $2,827,967 Yes Black American 546 Yes
1610 PEOPLE'S FIRST Tarrant AL $5,769,126 Yes Black American 937 Yes 2791 TUSKEGEE Tuskegee AL $5,516,697 Yes Asian, American,
Black American, Hispanic American, Native American
2,514 Yes
5241 SYCAMORE Sycamore AL $13,783,558 Yes Black American 1,311 No 6311 TVH Tuskegee AL $4,476,451 Yes Black American 757 Yes 9554 COUNCILL Normal AL $3,130,847 Yes Black American 914 Yes
11422 PROGRESSIVE Mobile AL $5,861,378 Yes Black American 906 Yes 12137 ST. JOHNS AME
BIRMINGHAM Birmingham AL $40,749 Yes Black American 210 Yes
12709 MONROE EDUCATION EMPLOYEES
Monroeville AL $3,896,474 Yes Black American 1,380 Yes
12837 MARVEL CITY Bessemer AL $7,552,770 Yes Black American 963 Yes 13018 CLARKE
EDUCATORS Grove Hill AL $3,368,005 Yes Black American,
Hispanic American
744 Yes
13852 PHENIX PRIDE Phenix City AL $5,081,293 Yes Black American 1,589 Yes 14314 TRI-RIVERS Montgomery AL $17,377,527 Yes Black American 7,144 Yes 15938 SIXTH AVENUE
BAPTIST Birmingham AL $4,674,249 Yes Black American 951 Yes
16858 NEW PILGRIM Birmingham AL $1,502,361 Yes Black American 842 Yes 17311 DEMOPOLIS Demopolis AL $614,773 Yes Asian American,
Hispanic American, Native American
746 Yes
22131 FOGCE Eutaw AL $1,245,429 Yes Black American 558 Yes 23893 DEGUSSA
EMPLOYEES Theodore AL $6,789,936 Yes Black American 844 Yes
12837 MARVEL CITY Bessemer AL $7,552,770 Yes Black American 963 Yes 24583 NRS COMMUNITY
DEVELOPMENT Birmingham AL $975,783 Yes Black American 352 Yes
62356 L&N EMPLOYEES Birmingham AL $9,567,375 Yes Asian American, Black American
1,280 No
62599 FEDERAL EMPLOYEES
Birmingham AL $14,048,307 Yes Asian American, Black American, Hispanic American
1,546 No
64232 ENERGEN Birmingham AL $26,406,015 Yes Black American 2,662 No 64464 TUSCALOOSA
COUNTY Tuscaloosa AL $7,327,686 Yes Black American 1,530 No
64594 FIREMAN'S Birmingham AL $4,375,192 Yes Black American 817 No 64598 ALABAMA STATE
EMPLOYEES Montgomery AL $211,854,956 Yes Black American 27,571 No
64603 BIRMINGHAM POLICE
Birmingham AL $6,969,300 Yes Black American 1,710 No
64725 SHORELINE Mobile AL $8,810,138 Yes Black American 1,835 No 24583 NRS COMMUNITY
DEVELOPMENT Birmingham AL $975,783 Yes Black American 352 Yes
Total No. Of Minority Credit Unions for Alabama: 27 $383,844,342 63,159
31

OFEAR Act
Minority Depository Institutions
ARIZONA MINORITY CREDIT UNIONS CHARTER NAME CITY ST ASSETS CURRENT
MEMBER MINORITY
STATUS
CURRENT MEMBER
MINORITY TYPE
TOTAL MEMBERS
LOW INCOME
4915 A. E. A. YUMA AZ $237,971,766 Yes Hispanic American
41,049 Yes
9552 APC EMPLOYEES Tucson AZ $1,182,656 Yes Hispanic American
210 No
9897 SOUTHEASTERN ARIZONA
Douglas AZ $28,701,619 Yes Hispanic American
5,569 Yes
61451 JACL Glendale AZ $860,879 Yes Asian American
190 No
24435 U.P. EMPLOYEES North Little Rock AR $4,332,615 Yes Black American
1,280 Yes
Total No. Of Minority Credit Unions for Arizona: 4 $268,716,920 47,018
ARKANSAS MINORITY CREDIT UNIONS
CHARTER NAME CITY ST ASSETS CURRENT MEMBER
MINORITY STATUS
CURRENT MEMBER
MINORITY TYPE
TOTAL MEMBERS
LOW INCOME
7700 ARKANSAS AM & N COLLEGE
Pine Bluff AR $2,286,717 Yes Black American 947 Yes
18474 COMBINED Hot Springs AR $7,851,594 Yes Black American 2,400 Yes 24423 PINE BLUFF
POSTAL Pine Bluff AR $780,690 Yes Black American 149 Yes
24433 ARKANSAS TEACHERS
Little Rock AR $1,124,408 Yes Black American 497 Yes
24435 U.P. EMPLOYEES North Little Rock
AR $4,332,615 Yes Black American 1,280 Yes
Total No. Of Minority Credit Unions for Arkansas: 5 $16,376,024 5,273
CALIFORNIA MINORITY CREDIT UNIONS
CHARTER NAME CITY ST ASSETS CURRENT MEMBER MINORITY STATUS
CURRENT MEMBER
MINORITY TYPE
TOTAL MEMBERS
LOW INCOME
1207 LOS ANGELES Glendale CA $771,689,523 Yes Asian American, Black American
,Hispanic American
51,989 No
1500 A M Gardena CA $19,750,793 Yes Asian American, Black American,
Hispanic American
4,679 No
3526 SCHOOLS Compton CA $112,178,981 Yes Asian American, Black American,
Hispanic American, Native
American
16,876 Yes
4393 SUNKIST EMPLOYEES
Van Nuys CA $6,108,155 Yes Hispanic American 913 Yes
4633 CAMINO Montebello CA $126,631,177 Yes Hispanic American 11,980 Yes 4900 COOPERATIVE
CENTER Berkeley CA $103,033,255 Yes Asian American
,Black American, Hispanic
American, Native American
13,350 Yes
6061 NORTH HOLLYWOOD
North Hollywood CA $4,507,619 Yes Asian American ,Black American,
Hispanic American, Native
American
914 No
6135 DAIJO Orange CA $2,680,133 Yes Asian American 361 No
32
Annual Report to Congress • 2013
7557 GLENDALE Glendale CA $64,803,615 Yes Asian American, Black American,
Hispanic American, Native
American
4,135 No
7826 S F MUNICIPAL RAILWAY EMP
San Francisco CA $6,288,417 Yes Black American, Hispanic American
789 No
8230 TECHNICOLOR Burbank CA $39,826,040 Yes Asian American ,Hispanic American
4,556 No
9004 SO VAL TEL Fresno CA $15,335,476 Yes Asian American, Black American,
Hispanic American, Native
American
2,157 No
9119 MERCED SCHOOL EMPLOYEES
Merced CA $390,015,598 Yes Asian American, Hispanic American
35,760 No
9230 VONS EMPLOYEES El Monte CA $407,285,468 Yes Hispanic American 40,877 No 9255 WESTERN STATES
REGIONAL Los Angeles CA $699,944 Yes Hispanic American 396 Yes
10276 AZUSA CITY EMPLOYEES
Azusa CA $2,562,009 Yes Asian American, Black American,
Hispanic American, Native
American
474 No
10648 MARYKNOLL OF L A Los Angeles CA $951,255 Yes Asian American 163 No 10767 PEOPLES IND
CHURCH Los Angeles CA $83,442 Yes Black American 125 Yes
11872 SRI Menlo Park CA $78,815,319 Yes Asian American, Black American,
Hispanic American
3,914 No
11943 KAIPERM NORTH BAY
Vallejo CA $37,561,583 Yes Asian American, Black American
4,308 No
11953 PARADISE VALLEY National City CA $78,641,921 Yes Asian American, Hispanic American
5,158 No
13120 PITTSBURG EMPLOYEES
Pittsburg CA $6,504,622 Yes Asian American, Black American,
Hispanic American, Native
American
550 No
13254 CORRECTIONS Soledad CA $13,798,554 Yes Asian American, Black American,
Hispanic American, Native
American
2,905 Yes
13451 GOLDEN WEST CITIES
Garden Grove CA $41,235,221 Yes Hispanic American 3,908 No
14499 CAL STATE L.A. Los Angeles CA $41,972,182 Yes Asian American, Black American,
Hispanic American
4,604 Yes
14739 CAL POLY Pomona CA $12,185,302 Yes Asian American, Black American,
Hispanic American, Native
American
2,715 Yes
14830 EDWARDS Edwards CA $162,417,864 Yes Asian American, Black American,
Hispanic American, Native
American
17,631 Yes
15784 C R C Norco CA $8,294,901 Yes Hispanic American 1,965 No 16547 SAN FRANCISCO
LEE San Francisco CA $11,968,924 Yes Asian American 1,060 No
16570 LOS ANGELES LEE Los Angeles CA $615,932 Yes Asian American 157 Yes 17415 BOURNS
EMPLOYEES Riverside CA $35,842,894 Yes Hispanic American 2,676 Yes
17652 CEDARS-SINAI West Hollywood CA $21,105,951 Yes Asian American, Black American,
Hispanic American, Native
American
3,942 No
33
OFEAR Act
Minority Depository Institutions
17841 LIMONEIRA Santa Paula CA $5,260,465 Yes Hispanic American 717 Yes 18623 CALCOM Torrance CA $63,992,105 Yes Asian American,
Hispanic American 8,269 No
19266 COLTON Colton CA $6,536,232 Yes Hispanic American 1,153 Yes 19554 BETHEL A.M.E. SAN
FRANCISCO San Francisco CA $435,121 Yes Black American 303 No
19640 ZION HILL BAPTIST CHURCH
Los Angeles CA $235,505 Yes Black American 152 Yes
20111 UNITED AMERICA WEST
Arleta CA $4,409,257 Yes Hispanic American 570 Yes
20720 L. A. MISSION San Fernando CA $6,498,007 Yes Hispanic American 1,593 Yes 21263 TAYLOR MEMORIAL
UNITED METHODIST
Oakland CA $126,271 Yes Black American 130 Yes
21417 CALVARY BAPTIST OF PACOIMA
San Fernando CA $143,122 Yes Black American 322 Yes
21532 U.P.S. EMPLOYEES Ontario CA $30,646,694 Yes Hispanic American 6,395 No 21872 AUTO CLUB Cerritos CA $28,640,075 Yes Hispanic American 5,598 No 22015 ILWU - FSC Oakland CA $24,459,614 Yes Black American
,Hispanic American
2,977 Yes
22965 GUIDANCE CHURCH OF RELIGIOUS SCIENC
Los Angeles CA $164,711 Yes Black American 139 Yes
23780 NORTHEAST COMMUNITY
San Francisco CA $10,142,769 Yes Asian American 1,575 Yes
24052 FAMILY Wilmington CA $8,130,430 Yes Hispanic American 1,684 Yes 24391 CHERRY
EMPLOYEES Santa Ana CA $4,155,652 Yes Hispanic American 558 No
24506 EPISCOPAL COMMUNITY
Los Angeles CA $4,917,728 Yes Black American, Hispanic American
2,284 Yes
24520 SANTA ANA Santa Ana CA $60,739,407 Yes Asian American, Black American,
Hispanic American, Native
American
7,048 No
24549 HANIN Los Angeles CA $21,344,291 Yes Asian American 2,740 Yes 24552 FRESNO COUNTY Fresno CA $488,728,018 Yes Asian American,
Black American, Hispanic American
54,495 Yes
24687 FAITH BASED Oceanside CA $1,067,568 Yes Black American, Hispanic American
517 Yes
24736 PACOIMA DEVELOPMENT
Pacoima CA $4,155,753 Yes Hispanic American 946 Yes
24776 COMUNIDAD LATINA
Santa Ana CA $3,724,394 Yes Hispanic American 1,980 Yes
60024 PRIORITY ONE South Pasadena CA $150,616,072 Yes Black American, Hispanic American
27,745 No
61125 FINANCIAL BENEFITS
Alameda CA $20,328,694 Yes Asian American, Black American,
Hispanic American
2,823 No
62092 MUSICIANS' INTERGUILD
Los Angeles CA $75,883,592 Yes Asian American ,Black American
7,024 No
63589 JACOM Los Angeles CA $83,095,363 Yes Asian American 10,211 No 63630 ATCHISON VILLAGE Richmond CA $7,473,584 Yes Hispanic American 1,222 Yes 64029 SANTA CRUZ
COMMUNITY Santa Cruz CA $105,435,305 Yes Hispanic American 13,100 Yes
64122 VALLEY OAK Three Rivers CA $45,967,579 Yes Hispanic American 6,641 Yes 64382 UNITED FINANCIAL Whitter CA $37,568,613 Yes Hispanic American 2,699 No 64892 JONES METHODIST
CHURCH San Francisco CA $545,136 Yes Black American 314 No
65059 NIKKEI Gardena CA $71,630,388 Yes Asian American 5,826 No 65113 ALLUS CREDIT
UNION Salinas CA $33,375,520 Yes Hispanic American 3,849 No
65674 BAKERY EMPLOYEES
Montebello CA $7,676,851 Yes Hispanic American 1,427 No
68027 1ST VALLEY San Bernardino CA $33,082,446 Yes Asian American, Black American,
Hispanic American, Native
American
3,582 Yes
34
Annual Report to Congress • 2013
68053 SIERRA CENTRAL Yuba City CA $672,725,202 Yes Asian American, Black American,
Hispanic American
57,728 No
68356 FIRST IMPERIAL El Centro CA $69,027,280 Yes Hispanic American 14,053 No 68459 USC Los Angeles CA $370,513,560 Yes Asian American,
Black American, Hispanic American
62,106 Yes
68463 NORTH COUNTY San Diego CA $60,401,403 Yes Asian American, Black American,
Hispanic American, Native
American
4,013 No
68503 FIRST CITY Los Angeles CA $508,095,391 Yes Hispanic American 55,356 No 21263 TAYLOR MEMORIAL
UNITED METHODIST
Oakland CA $126,271 Yes Black American 130 Yes
21417 CALVARY BAPTIST OF PACOIMA
San Fernando CA $143,122 Yes Black American 322 Yes
Total No. Of Minority Credit Unions for California : 73
$5,757,487,238
627,851
COLORADO MINORITY CREDIT UNIONS
CHARTER NAME CITY ST ASSETS CURRENT MEMBER
MINORITY STATUS
CURRENT MEMBER
MINORITY TYPE
TOTAL MEMBERS
LOW INCOME
1479 ARKANSAS VALLEY Las Animas CO $11,252,560 Yes Hispanic American
3,192 1479
1499 PUEBLO GOVERNMENT AGENCIES
Pueblo CO $25,729,954 Yes Hispanic American
3,625 1499
2449 PUEBLO HORIZONS Pueblo CO $26,847,941 Yes Hispanic American
3,722 2449
12056 HARRISON DISTRICT NO 2
Colorado Springs
CO $12,066,693 Yes Asian American, Black American ,Hispanic American
1,669 12056
63468 VALLEY EDUCATORS
Alamosa CO $5,283,067 Yes Hispanic American
1,087 63468
65471 GUADALUPE PARISH
Antonito CO $19,919,112 Yes Hispanic American
2,826 65471
65726 WEST DENVER COMMUNITY
Denver CO $9,238,600 Yes Hispanic American
1,924 65726
Total No. Of Minority Credit Unions for Colorado: 7 $110,337,927
18,045
CONNECTICUT MINORITY CREDIT UNIONS
CHARTER NAME CITY ST ASSETS CURRENT MEMBER
MINORITY STATUS
CURRENT MEMBER
MINORITY TYPE
TOTAL MEMBERS
LOW INCOME
19 NEW HAVEN TEACHERS
New Haven CT $9,758,813 Yes Black American, Hispanic American
1,503 No
1153 SARGENT & COMPANY
EMPLOYEES
New Haven CT $3,539,379 Yes Asian American, Black American, Hispanic American, Native American
661 No
1155 NEWINGTON VA Newington CT $9,816,626 Yes Black American,
2,563 Yes
35
OFEAR Act
Minority Depository Institutions
Hispanic American
1863 CONNECTICUT TRANSIT
Hartford CT $1,267,208 Yes Black American, Hispanic American
646 Yes
6733 HARTFORD MUNICIPAL EMPLOYEES
Hartford CT $32,595,589 Yes Black American, Hispanic American
5,451 Yes
7353 NEW HAVEN POSTAL
EMPLOYEES
New Haven CT $9,322,241 Yes Asian American, Black American, Hispanic American
2,917 No
10729 THE NEW HAVEN POLICE AND MUNICIPAL
New Haven CT $5,389,358 Yes Asian American, Black American, Hispanic American
861 No
21614 FIRST BAPTIST CHURCH
(STRATFORD)
Stratford CT $271,446 Yes Black American
290 No
23411 CONNECTICUT North Haven CT $7,085,123 Yes Black American, Hispanic American
1,845 No
23835 IMMANUEL BAPTIST CHURCH
New Haven CT $129,650 Yes Black American
310 Yes
23896 EAST END BAPTIST TABERNACLE
Bridgeport CT $194,684 Yes Black American
392 Yes
24723 FAIRFIELD COUNTY Fairfield CT $31,496,304 Yes Black American, Hispanic American
4,406 Yes
65817 METROPOLITAN DISTRICT
EMPLOYEES
Hartford CT $23,997,077 Yes Black American, Hispanic American
1,792 No
Total No. Of Minority Credit Unions for Connecticut: 13 $110,337,927
18,045
DELAWARE MINORITY CREDIT UNIONS
CHARTER NAME CITY ST ASSETS CURRENT MEMBER
MINORITY STATUS
CURRENT MEMBER
MINORITY TYPE
TOTAL MEMBERS
LOW INCOME
15426 AMERICAN SPIRIT Newark DE $66,476,093 Yes Black American
11,558 No
19170 MILFORD MEMORIAL
Milford DE $3,292,410 Yes Black American
980 No
24845 STEPPING STONES COMMUNITY
Wilmington DE $1,380,405 Yes Black American
154 Yes
Total No. Of Minority Credit Unions for Delaware: 3 $71,148,908 12,692
DISTRICT OF COLUMBIA MINORITY CREDIT UNIONS
CHARTER NAME CITY ST ASSETS CURRENT MEMBER
MINORITY STATUS
CURRENT MEMBER
MINORITY TYPE
TOTAL MEMBERS
LOW INCOME
266 LIBRARY OF CONGRESS
Washington DC $221,444,693 Yes Black American
9,678 No
367 PEPCO Washington DC $31,961,882 Yes Black American
3,230 No
538 GOVERNMENT PRINTING OFFICE
Washington DC $36,751,934 Yes Black American
3,659 Yes
36
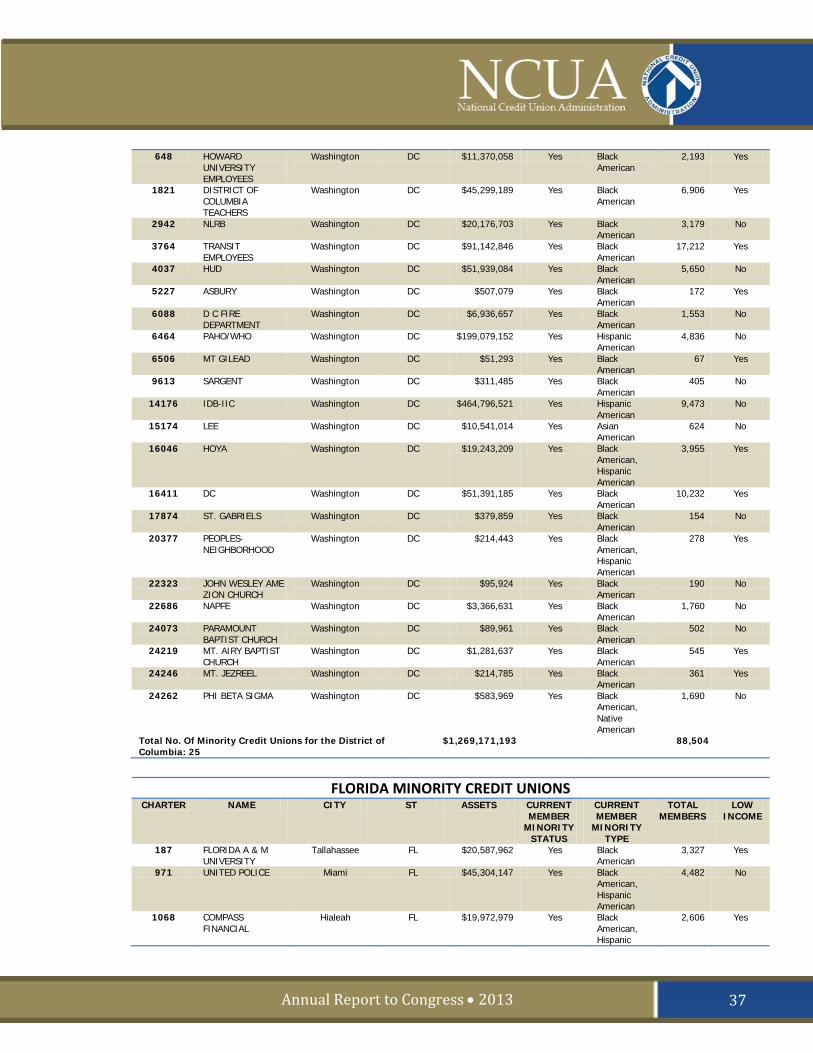
Annual Report to Congress • 2013
648 HOWARD UNIVERSITY EMPLOYEES
Washington DC $11,370,058 Yes Black American
2,193 Yes
1821 DISTRICT OF COLUMBIA TEACHERS
Washington DC $45,299,189 Yes Black American
6,906 Yes
2942 NLRB Washington DC $20,176,703 Yes Black American
3,179 No
3764 TRANSIT EMPLOYEES
Washington DC $91,142,846 Yes Black American
17,212 Yes
4037 HUD Washington DC $51,939,084 Yes Black American
5,650 No
5227 ASBURY Washington DC $507,079 Yes Black American
172 Yes
6088 D C FIRE DEPARTMENT
Washington DC $6,936,657 Yes Black American
1,553 No
6464 PAHO/WHO Washington DC $199,079,152 Yes Hispanic American
4,836 No
6506 MT GILEAD Washington DC $51,293 Yes Black American
67 Yes
9613 SARGENT Washington DC $311,485 Yes Black American
405 No
14176 IDB-IIC Washington DC $464,796,521 Yes Hispanic American
9,473 No
15174 LEE Washington DC $10,541,014 Yes Asian American
624 No
16046 HOYA Washington DC $19,243,209 Yes Black American, Hispanic American
3,955 Yes
16411 DC Washington DC $51,391,185 Yes Black American
10,232 Yes
17874 ST. GABRIELS Washington DC $379,859 Yes Black American
154 No
20377 PEOPLES-NEIGHBORHOOD
Washington DC $214,443 Yes Black American, Hispanic American
278 Yes
22323 JOHN WESLEY AME ZION CHURCH
Washington DC $95,924 Yes Black American
190 No
22686 NAPFE Washington DC $3,366,631 Yes Black American
1,760 No
24073 PARAMOUNT BAPTIST CHURCH
Washington DC $89,961 Yes Black American
502 No
24219 MT. AIRY BAPTIST CHURCH
Washington DC $1,281,637 Yes Black American
545 Yes
24246 MT. JEZREEL Washington DC $214,785 Yes Black American
361 Yes
24262 PHI BETA SIGMA Washington DC $583,969 Yes Black American, Native American
1,690 No
Total No. Of Minority Credit Unions for the District of Columbia: 25
$1,269,171,193
88,504
FLORIDA MINORITY CREDIT UNIONS
CHARTER NAME CITY ST ASSETS CURRENT MEMBER
MINORITY STATUS
CURRENT MEMBER
MINORITY TYPE
TOTAL MEMBERS
LOW INCOME
187 FLORIDA A & M UNIVERSITY
Tallahassee FL $20,587,962 Yes Black American
3,327 Yes
971 UNITED POLICE Miami FL $45,304,147 Yes Black American, Hispanic American
4,482 No
1068 COMPASS FINANCIAL
Hialeah FL $19,972,979 Yes Black American, Hispanic
2,606 Yes
37
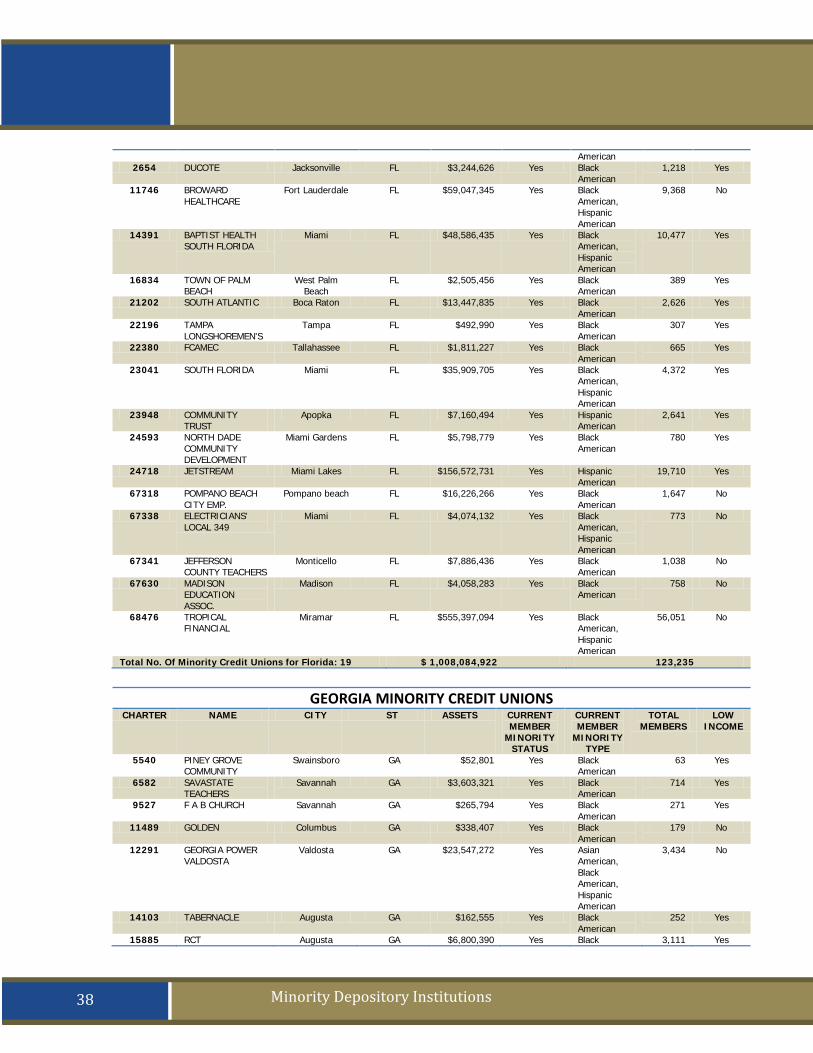
OFEAR Act
Minority Depository Institutions
American 2654 DUCOTE Jacksonville FL $3,244,626 Yes Black
American 1,218 Yes
11746 BROWARD HEALTHCARE
Fort Lauderdale FL $59,047,345 Yes Black American, Hispanic American
9,368 No
14391 BAPTIST HEALTH SOUTH FLORIDA
Miami FL $48,586,435 Yes Black American, Hispanic American
10,477 Yes
16834 TOWN OF PALM BEACH
West Palm Beach
FL $2,505,456 Yes Black American
389 Yes
21202 SOUTH ATLANTIC Boca Raton FL $13,447,835 Yes Black American
2,626 Yes
22196 TAMPA LONGSHOREMEN'S
Tampa FL $492,990 Yes Black American
307 Yes
22380 FCAMEC Tallahassee FL $1,811,227 Yes Black American
665 Yes
23041 SOUTH FLORIDA Miami FL $35,909,705 Yes Black American, Hispanic American
4,372 Yes
23948 COMMUNITY TRUST
Apopka FL $7,160,494 Yes Hispanic American
2,641 Yes
24593 NORTH DADE COMMUNITY DEVELOPMENT
Miami Gardens FL $5,798,779 Yes Black American
780 Yes
24718 JETSTREAM Miami Lakes FL $156,572,731 Yes Hispanic American
19,710 Yes
67318 POMPANO BEACH CITY EMP.
Pompano beach FL $16,226,266 Yes Black American
1,647 No
67338 ELECTRICIANS' LOCAL 349
Miami FL $4,074,132 Yes Black American, Hispanic American
773 No
67341 JEFFERSON COUNTY TEACHERS
Monticello FL $7,886,436 Yes Black American
1,038 No
67630 MADISON EDUCATION ASSOC.
Madison FL $4,058,283 Yes Black American
758 No
68476 TROPICAL FINANCIAL
Miramar FL $555,397,094 Yes Black American, Hispanic American
56,051 No
Total No. Of Minority Credit Unions for Florida: 19 $ 1,008,084,922 123,235
GEORGIA MINORITY CREDIT UNIONS
CHARTER NAME CITY ST ASSETS CURRENT MEMBER
MINORITY STATUS
CURRENT MEMBER
MINORITY TYPE
TOTAL MEMBERS
LOW INCOME
5540 PINEY GROVE COMMUNITY
Swainsboro GA $52,801 Yes Black American
63 Yes
6582 SAVASTATE TEACHERS
Savannah GA $3,603,321 Yes Black American
714 Yes
9527 F A B CHURCH Savannah GA $265,794 Yes Black American
271 Yes
11489 GOLDEN Columbus GA $338,407 Yes Black American
179 No
12291 GEORGIA POWER VALDOSTA
Valdosta GA $23,547,272 Yes Asian American, Black American, Hispanic American
3,434 No
14103 TABERNACLE Augusta GA $162,555 Yes Black American
252 Yes
15885 RCT Augusta GA $6,800,390 Yes Black 3,111 Yes
38
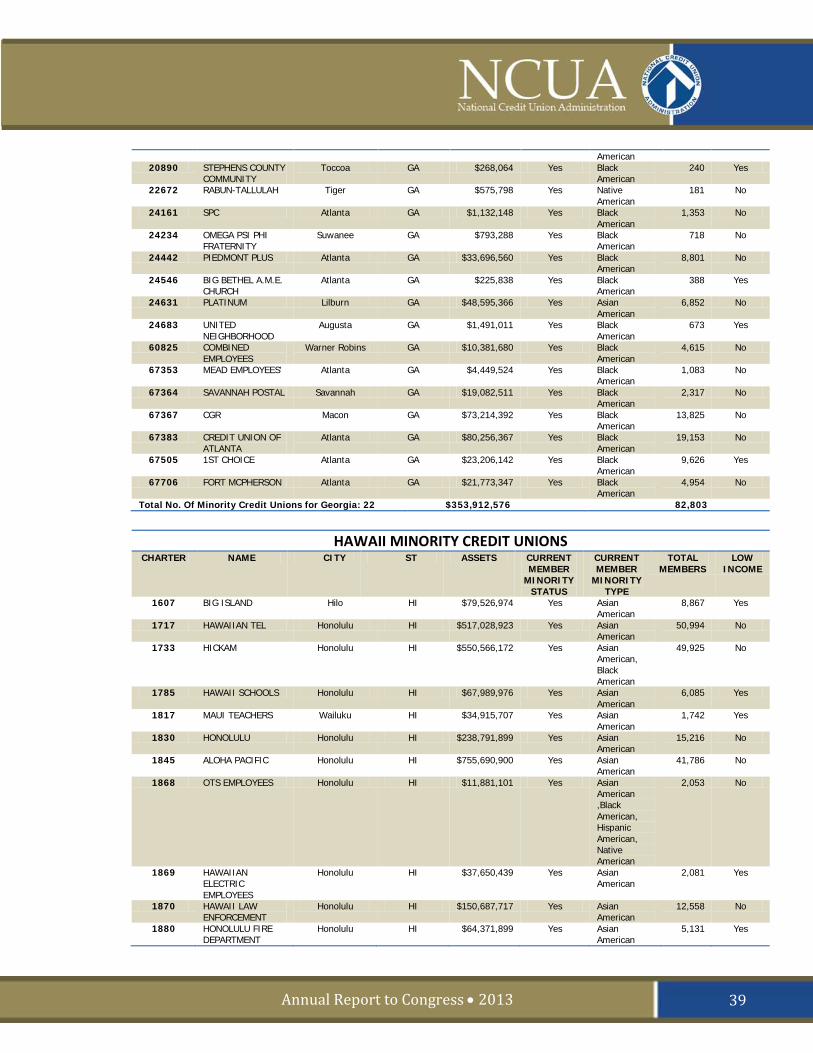
Annual Report to Congress • 2013
American 20890 STEPHENS COUNTY
COMMUNITY Toccoa GA $268,064 Yes Black
American 240 Yes
22672 RABUN-TALLULAH Tiger GA $575,798 Yes Native American
181 No
24161 SPC Atlanta GA $1,132,148 Yes Black American
1,353 No
24234 OMEGA PSI PHI FRATERNITY
Suwanee GA $793,288 Yes Black American
718 No
24442 PIEDMONT PLUS Atlanta GA $33,696,560 Yes Black American
8,801 No
24546 BIG BETHEL A.M.E. CHURCH
Atlanta GA $225,838 Yes Black American
388 Yes
24631 PLATINUM Lilburn GA $48,595,366 Yes Asian American
6,852 No
24683 UNITED NEIGHBORHOOD
Augusta GA $1,491,011 Yes Black American
673 Yes
60825 COMBINED EMPLOYEES
Warner Robins GA $10,381,680 Yes Black American
4,615 No
67353 MEAD EMPLOYEES' Atlanta GA $4,449,524 Yes Black American
1,083 No
67364 SAVANNAH POSTAL Savannah GA $19,082,511 Yes Black American
2,317 No
67367 CGR Macon GA $73,214,392 Yes Black American
13,825 No
67383 CREDIT UNION OF ATLANTA
Atlanta GA $80,256,367 Yes Black American
19,153 No
67505 1ST CHOICE Atlanta GA $23,206,142 Yes Black American
9,626 Yes
67706 FORT MCPHERSON Atlanta GA $21,773,347 Yes Black American
4,954 No
Total No. Of Minority Credit Unions for Georgia: 22 $353,912,576 82,803
HAWAII MINORITY CREDIT UNIONS
CHARTER NAME CITY ST ASSETS CURRENT MEMBER
MINORITY STATUS
CURRENT MEMBER
MINORITY TYPE
TOTAL MEMBERS
LOW INCOME
1607 BIG ISLAND Hilo HI $79,526,974 Yes Asian American
8,867 Yes
1717 HAWAIIAN TEL Honolulu HI $517,028,923 Yes Asian American
50,994 No
1733 HICKAM Honolulu HI $550,566,172 Yes Asian American, Black American
49,925 No
1785 HAWAII SCHOOLS Honolulu HI $67,989,976 Yes Asian American
6,085 Yes
1817 MAUI TEACHERS Wailuku HI $34,915,707 Yes Asian American
1,742 Yes
1830 HONOLULU Honolulu HI $238,791,899 Yes Asian American
15,216 No
1845 ALOHA PACIFIC Honolulu HI $755,690,900 Yes Asian American
41,786 No
1868 OTS EMPLOYEES Honolulu HI $11,881,101 Yes Asian American ,Black American, Hispanic American, Native American
2,053 No
1869 HAWAIIAN ELECTRIC EMPLOYEES
Honolulu HI $37,650,439 Yes Asian American
2,081 Yes
1870 HAWAII LAW ENFORCEMENT
Honolulu HI $150,687,717 Yes Asian American
12,558 No
1880 HONOLULU FIRE DEPARTMENT
Honolulu HI $64,371,899 Yes Asian American
5,131 Yes
39
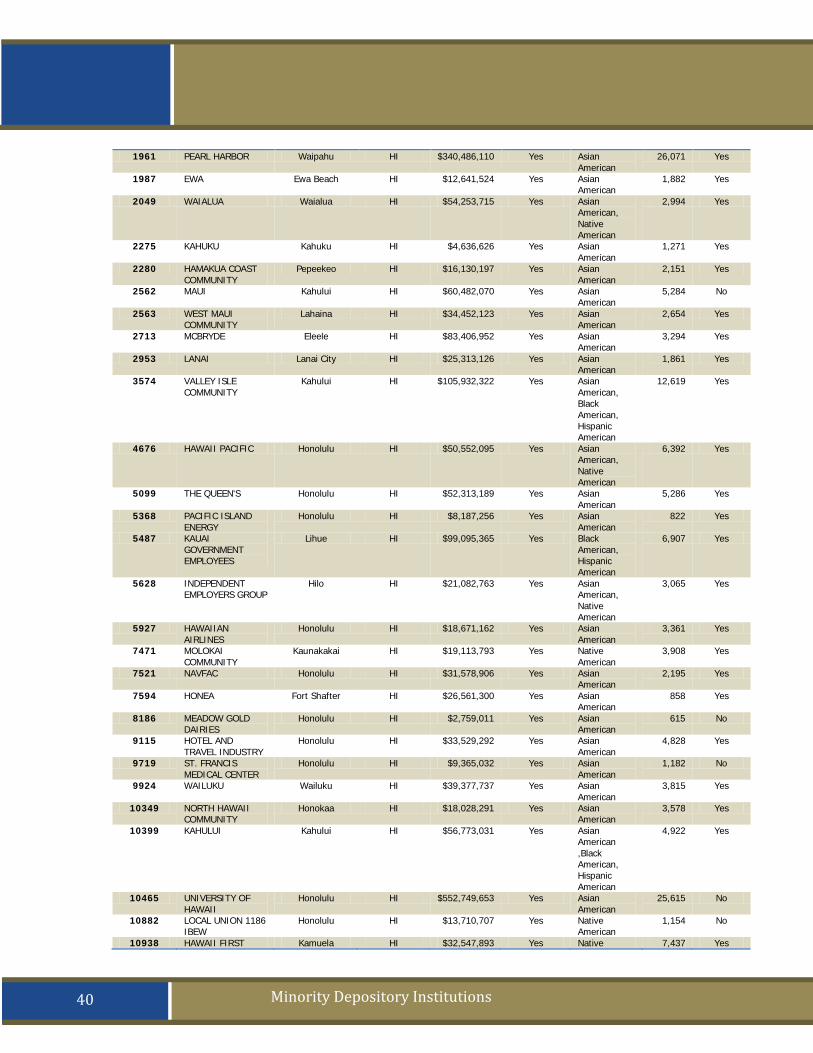
OFEAR Act
Minority Depository Institutions
1961 PEARL HARBOR Waipahu HI $340,486,110 Yes Asian American
26,071 Yes
1987 EWA Ewa Beach HI $12,641,524 Yes Asian American
1,882 Yes
2049 WAIALUA Waialua HI $54,253,715 Yes Asian American, Native American
2,994 Yes
2275 KAHUKU Kahuku HI $4,636,626 Yes Asian American
1,271 Yes
2280 HAMAKUA COAST COMMUNITY
Pepeekeo HI $16,130,197 Yes Asian American
2,151 Yes
2562 MAUI Kahului HI $60,482,070 Yes Asian American
5,284 No
2563 WEST MAUI COMMUNITY
Lahaina HI $34,452,123 Yes Asian American
2,654 Yes
2713 MCBRYDE Eleele HI $83,406,952 Yes Asian American
3,294 Yes
2953 LANAI Lanai City HI $25,313,126 Yes Asian American
1,861 Yes
3574 VALLEY ISLE COMMUNITY
Kahului HI $105,932,322 Yes Asian American, Black American, Hispanic American
12,619 Yes
4676 HAWAII PACIFIC Honolulu HI $50,552,095 Yes Asian American, Native American
6,392 Yes
5099 THE QUEEN'S Honolulu HI $52,313,189 Yes Asian American
5,286 Yes
5368 PACIFIC ISLAND ENERGY
Honolulu HI $8,187,256 Yes Asian American
822 Yes
5487 KAUAI GOVERNMENT EMPLOYEES
Lihue HI $99,095,365 Yes Black American, Hispanic American
6,907 Yes
5628 INDEPENDENT EMPLOYERS GROUP
Hilo HI $21,082,763 Yes Asian American, Native American
3,065 Yes
5927 HAWAIIAN AIRLINES
Honolulu HI $18,671,162 Yes Asian American
3,361 Yes
7471 MOLOKAI COMMUNITY
Kaunakakai HI $19,113,793 Yes Native American
3,908 Yes
7521 NAVFAC Honolulu HI $31,578,906 Yes Asian American
2,195 Yes
7594 HONEA Fort Shafter HI $26,561,300 Yes Asian American
858 Yes
8186 MEADOW GOLD DAIRIES
Honolulu HI $2,759,011 Yes Asian American
615 No
9115 HOTEL AND TRAVEL INDUSTRY
Honolulu HI $33,529,292 Yes Asian American
4,828 Yes
9719 ST. FRANCIS MEDICAL CENTER
Honolulu HI $9,365,032 Yes Asian American
1,182 No
9924 WAILUKU Wailuku HI $39,377,737 Yes Asian American
3,815 Yes
10349 NORTH HAWAII COMMUNITY
Honokaa HI $18,028,291 Yes Asian American
3,578 Yes
10399 KAHULUI Kahului HI $56,773,031 Yes Asian American ,Black American, Hispanic American
4,922 Yes
10465 UNIVERSITY OF HAWAII
Honolulu HI $552,749,653 Yes Asian American
25,615 No
10882 LOCAL UNION 1186 IBEW
Honolulu HI $13,710,707 Yes Native American
1,154 No
10938 HAWAII FIRST Kamuela HI $32,547,893 Yes Native 7,437 Yes
40

Annual Report to Congress • 2013
American 11332 LEAHI Honolulu HI $2,324,219 Yes Asian
American 640 Yes
11494 KUAKINI MEDICAL AND DENTAL
Honolulu HI $43,869,705 Yes Asian American
2,744 Yes
11553 KAMEHAMEHA Honolulu HI $39,447,658 Yes Asian American
4,611 No
13001 SHERATON HAWAII Honolulu HI $20,827,889 Yes Asian American
2,420 Yes
13158 HAWAII NATIONAL GUARD
Honolulu HI $19,005,699 Yes Asian American
2,290 Yes
20187 PRINCE KUHIO Honolulu HI $9,415,108 Yes Black American, Hispanic American
1,625 Yes
24630 CU HAWAII Hilo HI $239,188,981 Yes Asian American
25,725 Yes
24796 GARDEN ISLAND Lihue HI $88,213,221 Yes Asian American
8,230 Yes
24830 OAHU Honolulu HI $49,947,734 Yes Asian American
4,752 No
24839 HAWAII CENTRAL Honolulu HI $173,364,492 Yes Asian American
14,632 No
Total No. Of Minority Credit Unions for Hawaii: 49 $5,018,437,654 410,128
IDAHO MINORITY CREDIT UNIONS
CHARTER NAME CITY ST ASSETS CURRENT MEMBER
MINORITY STATUS
CURRENT MEMBER
MINORITY TYPE
TOTAL MEMBERS
LOW INCOME
82534 M.A.P. Burley ID $1,764,367 Yes Hispanic American
1,297 No
Total No. Of Minority Credit Unions for Idaho: 1 $1,764,367 1,297
ILLINOIS MINORITY CREDIT UNIONS
CHARTER NAME CITY ST ASSETS CURRENT MEMBER
MINORITY STATUS
CURRENT MEMBER
MINORITY TYPE
TOTAL MEMBERS
LOW INCOME
2370 METROPOLITAN "L" Oak Park IL $6,683,627 Yes Black American
1,683 Yes
2467 NORTH SIDE L Chicago IL $8,671,525 Yes Black American
2,406 Yes
2495 CHICAGO AVENUE GARAGE
Chicago IL $7,597,781 Yes Black American
891 Yes
2498 74TH STREET DEPOT
Evergreen Park IL $8,509,069 Yes Black American
738 Yes
2505 77TH STREET DEPOT
Chicago IL $16,172,075 Yes Black American, Hispanic American
3,743 Yes
2529 KEDZIE AVENUE DEPOT
Chicago IL $3,204,967 Yes Black American
734 Yes
2566 BEVERLY BUS GARAGE
Evergreen Park IL $4,186,990 Yes Black American
1,040 Yes
7256 COMMUNITY Chicago IL $136,433 Yes Black American
224 Yes
13533 CTA SOUTH Chicago IL $1,171,015 Yes Black American
599 Yes
14058 ST. MARTIN DE PORRES PARISH
Chicago IL $198,994 Yes Black American
124 Yes
15240 RESURRECTION LUTHERAN
Chicago IL $200,538 Yes Black American
127 Yes
15454 SHILOH ENGLEWOOD
Chicago IL $250,846 Yes Black American
148 Yes
15673 ISRAEL METHCOMM
Chicago IL $1,135,780 Yes Black American
219 Yes
15812 SHILOH BAPTIST Waukegan IL $318,309 Yes Black 169 No
41
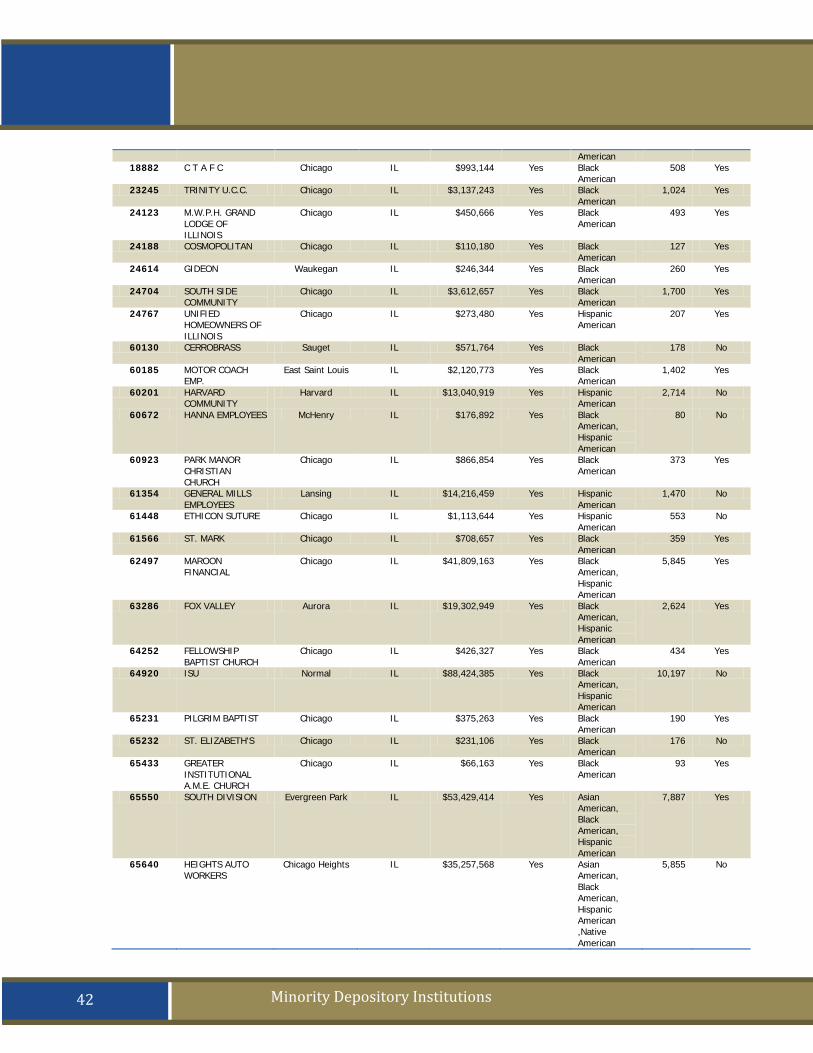
OFEAR Act
Minority Depository Institutions
American 18882 C T A F C Chicago IL $993,144 Yes Black
American 508 Yes
23245 TRINITY U.C.C. Chicago IL $3,137,243 Yes Black American
1,024 Yes
24123 M.W.P.H. GRAND LODGE OF ILLINOIS
Chicago IL $450,666 Yes Black American
493 Yes
24188 COSMOPOLITAN Chicago IL $110,180 Yes Black American
127 Yes
24614 GIDEON Waukegan IL $246,344 Yes Black American
260 Yes
24704 SOUTH SIDE COMMUNITY
Chicago IL $3,612,657 Yes Black American
1,700 Yes
24767 UNIFIED HOMEOWNERS OF ILLINOIS
Chicago IL $273,480 Yes Hispanic American
207 Yes
60130 CERROBRASS Sauget IL $571,764 Yes Black American
178 No
60185 MOTOR COACH EMP.
East Saint Louis IL $2,120,773 Yes Black American
1,402 Yes
60201 HARVARD COMMUNITY
Harvard IL $13,040,919 Yes Hispanic American
2,714 No
60672 HANNA EMPLOYEES McHenry IL $176,892 Yes Black American, Hispanic American
80 No
60923 PARK MANOR CHRISTIAN CHURCH
Chicago IL $866,854 Yes Black American
373 Yes
61354 GENERAL MILLS EMPLOYEES
Lansing IL $14,216,459 Yes Hispanic American
1,470 No
61448 ETHICON SUTURE Chicago IL $1,113,644 Yes Hispanic American
553 No
61566 ST. MARK Chicago IL $708,657 Yes Black American
359 Yes
62497 MAROON FINANCIAL
Chicago IL $41,809,163 Yes Black American, Hispanic American
5,845 Yes
63286 FOX VALLEY Aurora IL $19,302,949 Yes Black American, Hispanic American
2,624 Yes
64252 FELLOWSHIP BAPTIST CHURCH
Chicago IL $426,327 Yes Black American
434 Yes
64920 ISU Normal IL $88,424,385 Yes Black American, Hispanic American
10,197 No
65231 PILGRIM BAPTIST Chicago IL $375,263 Yes Black American
190 Yes
65232 ST. ELIZABETH'S Chicago IL $231,106 Yes Black American
176 No
65433 GREATER INSTITUTIONAL A.M.E. CHURCH
Chicago IL $66,163 Yes Black American
93 Yes
65550 SOUTH DIVISION Evergreen Park IL $53,429,414 Yes Asian American, Black American, Hispanic American
7,887 Yes
65640 HEIGHTS AUTO WORKERS
Chicago Heights IL $35,257,568 Yes Asian American, Black American, Hispanic American ,Native American
5,855 No
42

Annual Report to Congress • 2013
65932 CHICAGO MUNICIPAL EMPLOYEES
Chicago IL $35,217,383 Yes Black American, Hispanic American
17,126 No
65960 MONUMENTAL Chicago IL $39,494 Yes Black American
65 No
66089 BEREAN Chicago IL $95,983 Yes Black American
238 Yes
66200 BAGUMBAYAN Chicago IL $75,253 Yes Asian American
43 No
66296 ST. HELENA PARISH
Chicago IL $95,023 Yes Black American
238 Yes
66300 IMPERIAL Springfield IL $39,329 Yes Black American
170 Yes
67024 MT. ZION Zion IL $243,770 Yes Black American
274 No
68368 ACCESS Broadview IL $57,263,521 Yes Black American, Hispanic American
7,032 No
68472 CANAAN Urbana IL $293,671 Yes Black American
446 Yes
95826 CHICAGO POST OFFICE EMPLOYEES
Chicago IL $17,727,264 Yes Black American
4,360 No
Total No. Of Minority Credit Unions for Illinois: 48 $450,490,654 87,586
INDIANA MINORITY CREDIT UNIONS
CHARTER NAME CITY ST ASSETS CURRENT MEMBER
MINORITY STATUS
CURRENT MEMBER
MINORITY TYPE
TOTAL MEMBERS
LOW INCOME
169 GARY FIREFIGHTERS ASSOCIATION
Gary IN $2,101,387 Yes Black American
402 Yes
2711 PROFINANCE Merrillville IN $14,566,961 Yes Black American
2,058 Yes
3251 GARY POLICE DEPARTMENT EMPLOYEES
Gary IN $1,567,445 Yes Black American
209 No
6204 RIVER BEND South Bend IN $5,135,272 Yes Black American ,Hispanic American
906 Yes
8295 ST. MONICA Gary IN $180,553 Yes Black American
182 Yes
15757 MT ZION INDIANAPOLIS
Indianapolis IN $720,628 Yes Black American
483 Yes
16126 GARY MUNICIPAL EMPLOYEES
Gary IN $417,934 Yes Black American
180 Yes
19505 ALL SEASONS Indianapolis IN $9,044,642 Yes Black American
1,581 No
24781 UNION BAPTIST CHURCH
Fort Wayne IN $221,889 Yes Black American
298 Yes
Total No. Of Minority Credit Unions for Indiana: 9 $33,956,711 6,299
KANSAS MINORITY CREDIT UNIONS
CHARTER NAME CITY ST ASSETS CURRENT MEMBER
MINORITY STATUS
CURRENT MEMBER
MINORITY TYPE
TOTAL MEMBERS
LOW INCOME
8216 QUINDARO HOMES Kansas City KS $1,264,070 Yes Asian American, Black American, Native American
259 Yes
63319 CREDIT UNION OF EMPORIA
Emporia KS $18,261,894 Yes Hispanic American
3,323 No
Total No. Of Minority Credit Unions for Kansas: 2 $19,525,964 3,582
43
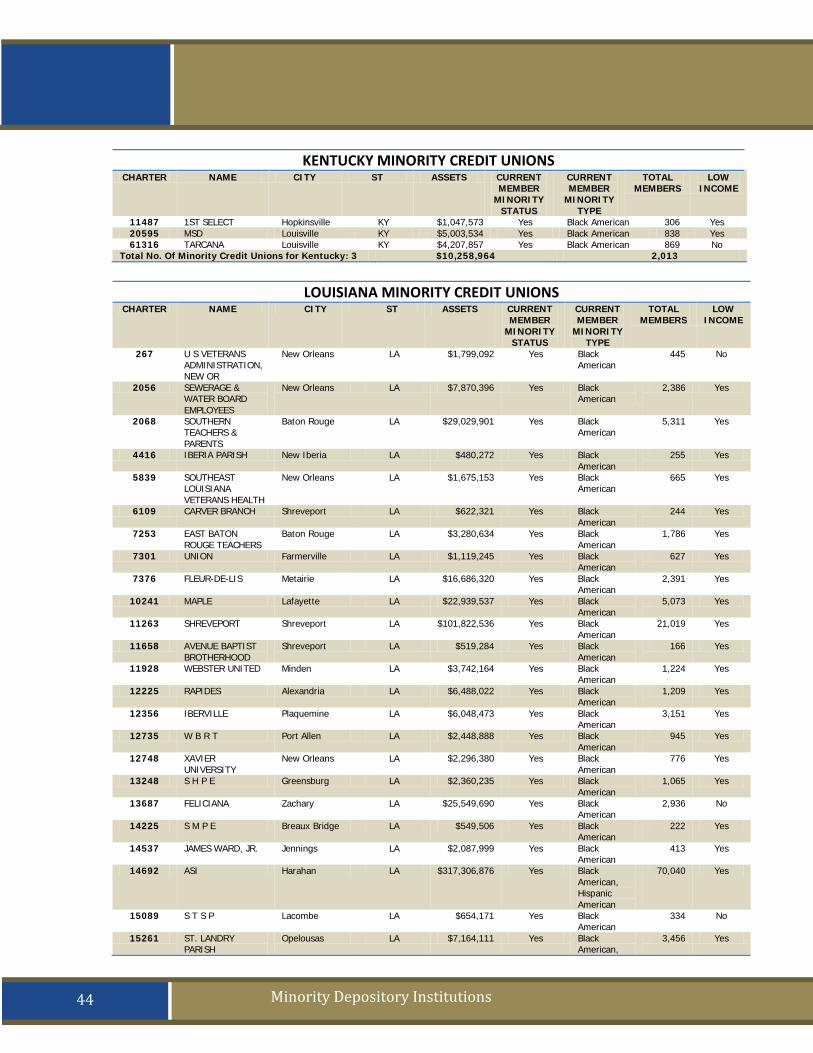
OFEAR Act
Minority Depository Institutions
KENTUCKY MINORITY CREDIT UNIONS CHARTER NAME CITY ST ASSETS CURRENT
MEMBER MINORITY
STATUS
CURRENT MEMBER
MINORITY TYPE
TOTAL MEMBERS
LOW INCOME
11487 1ST SELECT Hopkinsville KY $1,047,573 Yes Black American 306 Yes 20595 MSD Louisville KY $5,003,534 Yes Black American 838 Yes 61316 TARCANA Louisville KY $4,207,857 Yes Black American 869 No
Total No. Of Minority Credit Unions for Kentucky: 3 $10,258,964 2,013
LOUISIANA MINORITY CREDIT UNIONS
CHARTER NAME CITY ST ASSETS CURRENT MEMBER
MINORITY STATUS
CURRENT MEMBER
MINORITY TYPE
TOTAL MEMBERS
LOW INCOME
267 U S VETERANS ADMINISTRATION, NEW OR
New Orleans LA $1,799,092 Yes Black American
445 No
2056 SEWERAGE & WATER BOARD EMPLOYEES
New Orleans LA $7,870,396 Yes Black American
2,386 Yes
2068 SOUTHERN TEACHERS & PARENTS
Baton Rouge LA $29,029,901 Yes Black American
5,311 Yes
4416 IBERIA PARISH New Iberia LA $480,272 Yes Black American
255 Yes
5839 SOUTHEAST LOUISIANA VETERANS HEALTH
New Orleans LA $1,675,153 Yes Black American
665 Yes
6109 CARVER BRANCH Shreveport LA $622,321 Yes Black American
244 Yes
7253 EAST BATON ROUGE TEACHERS
Baton Rouge LA $3,280,634 Yes Black American
1,786 Yes
7301 UNION Farmerville LA $1,119,245 Yes Black American
627 Yes
7376 FLEUR-DE-LIS Metairie LA $16,686,320 Yes Black American
2,391 Yes
10241 MAPLE Lafayette LA $22,939,537 Yes Black American
5,073 Yes
11263 SHREVEPORT Shreveport LA $101,822,536 Yes Black American
21,019 Yes
11658 AVENUE BAPTIST BROTHERHOOD
Shreveport LA $519,284 Yes Black American
166 Yes
11928 WEBSTER UNITED Minden LA $3,742,164 Yes Black American
1,224 Yes
12225 RAPIDES Alexandria LA $6,488,022 Yes Black American
1,209 Yes
12356 IBERVILLE Plaquemine LA $6,048,473 Yes Black American
3,151 Yes
12735 W B R T Port Allen LA $2,448,888 Yes Black American
945 Yes
12748 XAVIER UNIVERSITY
New Orleans LA $2,296,380 Yes Black American
776 Yes
13248 S H P E Greensburg LA $2,360,235 Yes Black American
1,065 Yes
13687 FELICIANA Zachary LA $25,549,690 Yes Black American
2,936 No
14225 S M P E Breaux Bridge LA $549,506 Yes Black American
222 Yes
14537 JAMES WARD, JR. Jennings LA $2,087,999 Yes Black American
413 Yes
14692 ASI Harahan LA $317,306,876 Yes Black American, Hispanic American
70,040 Yes
15089 S T S P Lacombe LA $654,171 Yes Black American
334 No
15261 ST. LANDRY PARISH
Opelousas LA $7,164,111 Yes Black American,
3,456 Yes
44
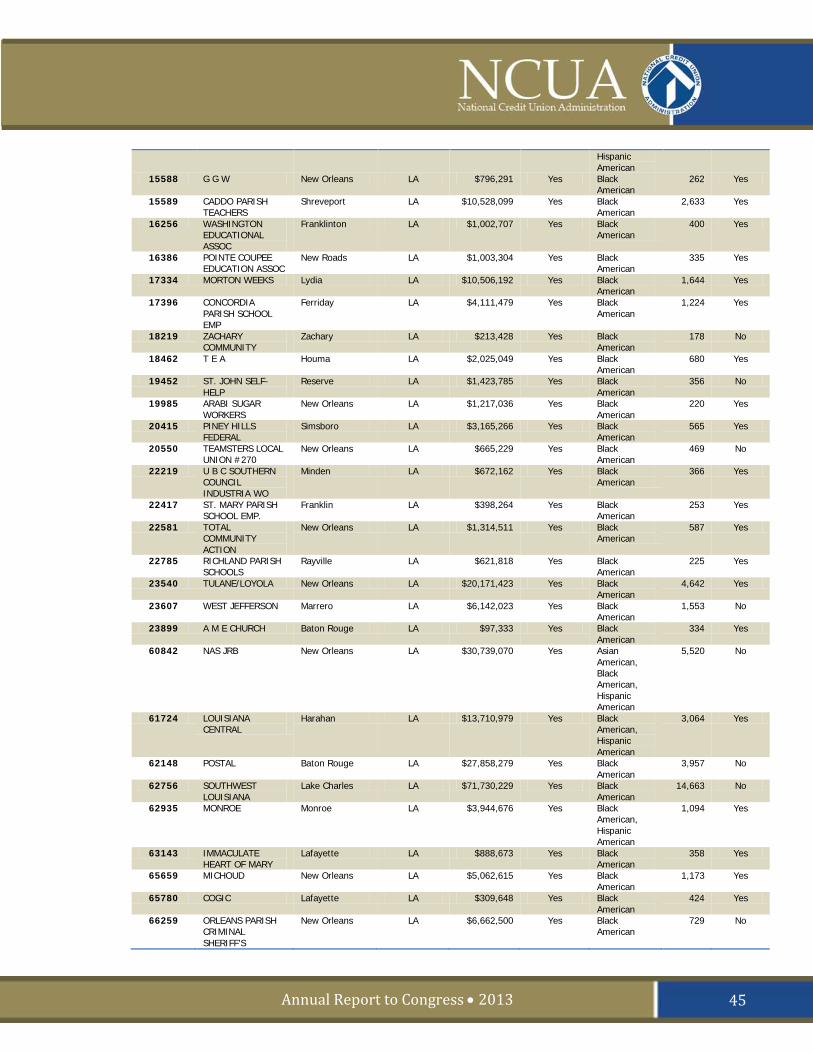
Annual Report to Congress • 2013
Hispanic American
15588 G G W New Orleans LA $796,291 Yes Black American
262 Yes
15589 CADDO PARISH TEACHERS
Shreveport LA $10,528,099 Yes Black American
2,633 Yes
16256 WASHINGTON EDUCATIONAL ASSOC
Franklinton LA $1,002,707 Yes Black American
400 Yes
16386 POINTE COUPEE EDUCATION ASSOC
New Roads LA $1,003,304 Yes Black American
335 Yes
17334 MORTON WEEKS Lydia LA $10,506,192 Yes Black American
1,644 Yes
17396 CONCORDIA PARISH SCHOOL EMP
Ferriday LA $4,111,479 Yes Black American
1,224 Yes
18219 ZACHARY COMMUNITY
Zachary LA $213,428 Yes Black American
178 No
18462 T E A Houma LA $2,025,049 Yes Black American
680 Yes
19452 ST. JOHN SELF-HELP
Reserve LA $1,423,785 Yes Black American
356 No
19985 ARABI SUGAR WORKERS
New Orleans LA $1,217,036 Yes Black American
220 Yes
20415 PINEY HILLS FEDERAL
Simsboro LA $3,165,266 Yes Black American
565 Yes
20550 TEAMSTERS LOCAL UNION #270
New Orleans LA $665,229 Yes Black American
469 No
22219 U B C SOUTHERN COUNCIL INDUSTRIA WO
Minden LA $672,162 Yes Black American
366 Yes
22417 ST. MARY PARISH SCHOOL EMP.
Franklin LA $398,264 Yes Black American
253 Yes
22581 TOTAL COMMUNITY ACTION
New Orleans LA $1,314,511 Yes Black American
587 Yes
22785 RICHLAND PARISH SCHOOLS
Rayville LA $621,818 Yes Black American
225 Yes
23540 TULANE/LOYOLA New Orleans LA $20,171,423 Yes Black American
4,642 Yes
23607 WEST JEFFERSON Marrero LA $6,142,023 Yes Black American
1,553 No
23899 A M E CHURCH Baton Rouge LA $97,333 Yes Black American
334 Yes
60842 NAS JRB New Orleans LA $30,739,070 Yes Asian American, Black American, Hispanic American
5,520 No
61724 LOUISIANA CENTRAL
Harahan LA $13,710,979 Yes Black American, Hispanic American
3,064 Yes
62148 POSTAL Baton Rouge LA $27,858,279 Yes Black American
3,957 No
62756 SOUTHWEST LOUISIANA
Lake Charles LA $71,730,229 Yes Black American
14,663 No
62935 MONROE Monroe LA $3,944,676 Yes Black American, Hispanic American
1,094 Yes
63143 IMMACULATE HEART OF MARY
Lafayette LA $888,673 Yes Black American
358 Yes
65659 MICHOUD New Orleans LA $5,062,615 Yes Black American
1,173 Yes
65780 COGIC Lafayette LA $309,648 Yes Black American
424 Yes
66259 ORLEANS PARISH CRIMINAL SHERIFF'S
New Orleans LA $6,662,500 Yes Black American
729 No
45
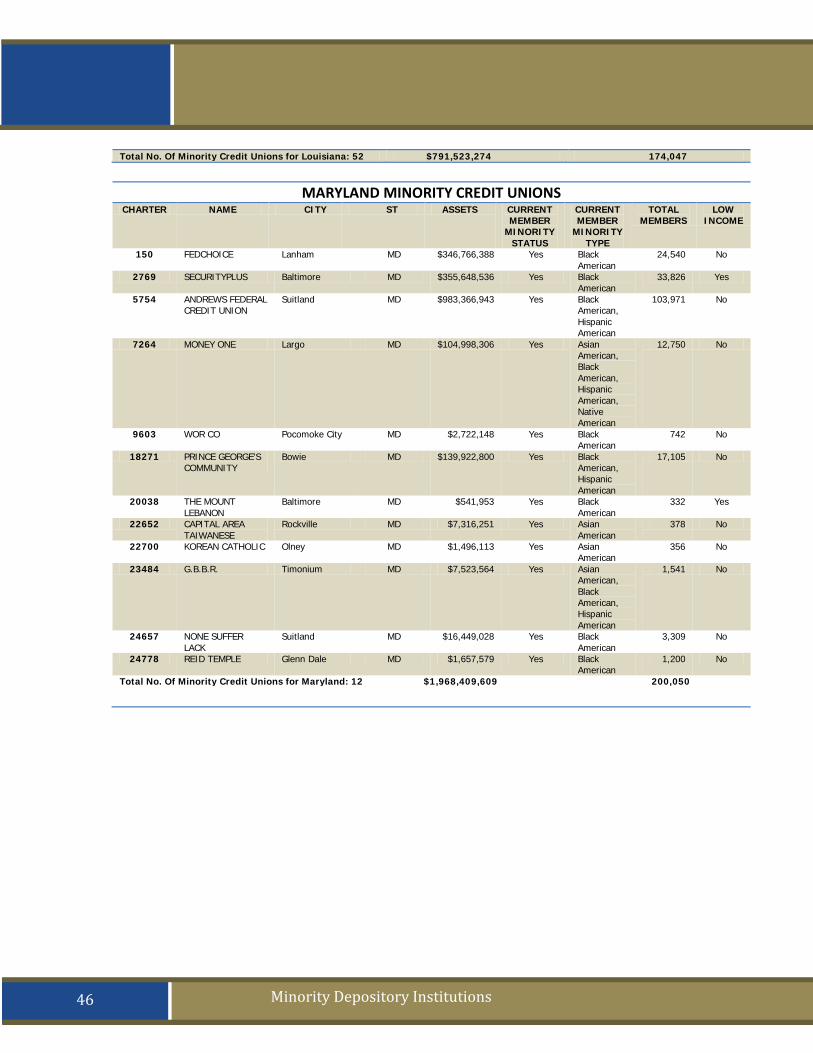
OFEAR Act
Minority Depository Institutions
Total No. Of Minority Credit Unions for Louisiana: 52 $791,523,274 174,047
MARYLAND MINORITY CREDIT UNIONS
CHARTER NAME CITY ST ASSETS CURRENT MEMBER
MINORITY STATUS
CURRENT MEMBER
MINORITY TYPE
TOTAL MEMBERS
LOW INCOME
150 FEDCHOICE Lanham MD $346,766,388 Yes Black American
24,540 No
2769 SECURITYPLUS Baltimore MD $355,648,536 Yes Black American
33,826 Yes
5754 ANDREWS FEDERAL CREDIT UNION
Suitland MD $983,366,943 Yes Black American, Hispanic American
103,971 No
7264 MONEY ONE Largo MD $104,998,306 Yes Asian American, Black American, Hispanic American, Native American
12,750 No
9603 WOR CO Pocomoke City MD $2,722,148 Yes Black American
742 No
18271 PRINCE GEORGE'S COMMUNITY
Bowie MD $139,922,800 Yes Black American, Hispanic American
17,105 No
20038 THE MOUNT LEBANON
Baltimore MD $541,953 Yes Black American
332 Yes
22652 CAPITAL AREA TAIWANESE
Rockville MD $7,316,251 Yes Asian American
378 No
22700 KOREAN CATHOLIC Olney MD $1,496,113 Yes Asian American
356 No
23484 G.B.B.R. Timonium MD $7,523,564 Yes Asian American, Black American, Hispanic American
1,541 No
24657 NONE SUFFER LACK
Suitland MD $16,449,028 Yes Black American
3,309 No
24778 REID TEMPLE Glenn Dale MD $1,657,579 Yes Black American
1,200 No
Total No. Of Minority Credit Unions for Maryland: 12 $1,968,409,609 200,050
46
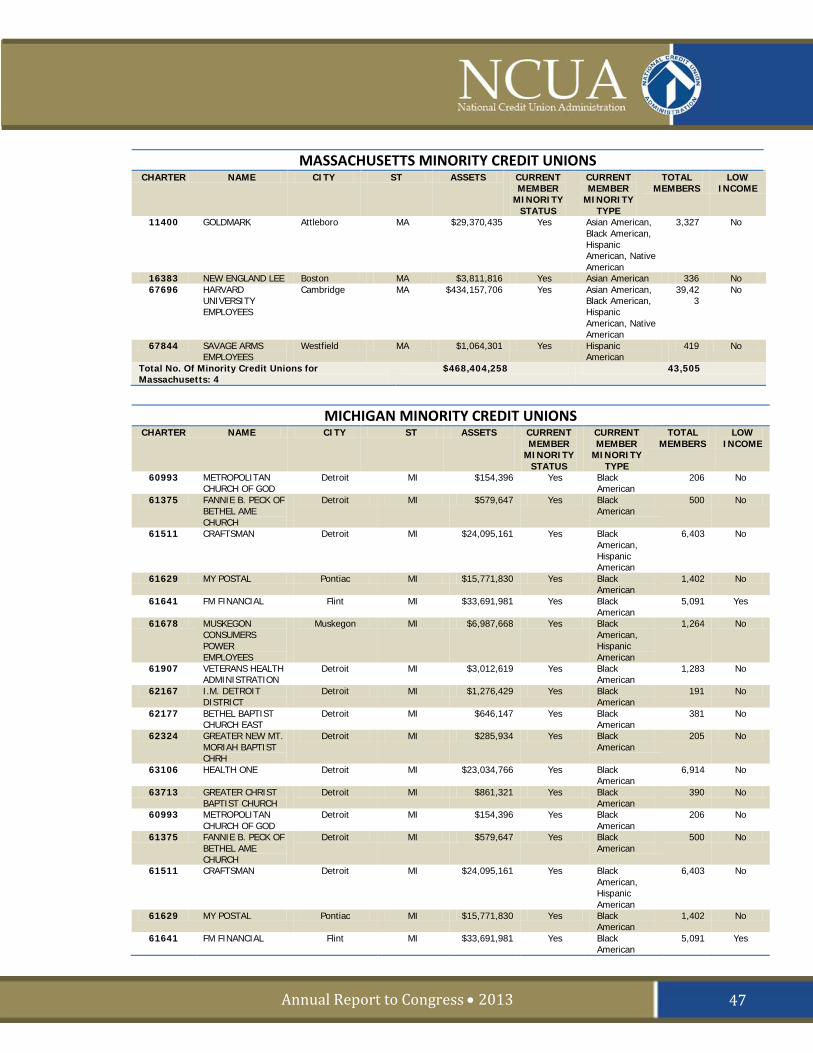
Annual Report to Congress • 2013
MASSACHUSETTS MINORITY CREDIT UNIONS CHARTER NAME CITY ST ASSETS CURRENT
MEMBER MINORITY
STATUS
CURRENT MEMBER
MINORITY TYPE
TOTAL MEMBERS
LOW INCOME
11400 GOLDMARK Attleboro MA $29,370,435 Yes Asian American, Black American, Hispanic American, Native American
3,327 No
16383 NEW ENGLAND LEE Boston MA $3,811,816 Yes Asian American 336 No 67696 HARVARD
UNIVERSITY EMPLOYEES
Cambridge MA $434,157,706 Yes Asian American, Black American, Hispanic American, Native American
39,423
No
67844 SAVAGE ARMS EMPLOYEES
Westfield MA $1,064,301 Yes Hispanic American
419 No
Total No. Of Minority Credit Unions for Massachusetts: 4
$468,404,258 43,505
MICHIGAN MINORITY CREDIT UNIONS
CHARTER NAME CITY ST ASSETS CURRENT MEMBER
MINORITY STATUS
CURRENT MEMBER
MINORITY TYPE
TOTAL MEMBERS
LOW INCOME
60993 METROPOLITAN CHURCH OF GOD
Detroit MI $154,396 Yes Black American
206 No
61375 FANNIE B. PECK OF BETHEL AME CHURCH
Detroit MI $579,647 Yes Black American
500 No
61511 CRAFTSMAN Detroit MI $24,095,161 Yes Black American, Hispanic American
6,403 No
61629 MY POSTAL Pontiac MI $15,771,830 Yes Black American
1,402 No
61641 FM FINANCIAL Flint MI $33,691,981 Yes Black American
5,091 Yes
61678 MUSKEGON CONSUMERS POWER EMPLOYEES
Muskegon MI $6,987,668 Yes Black American, Hispanic American
1,264 No
61907 VETERANS HEALTH ADMINISTRATION
Detroit MI $3,012,619 Yes Black American
1,283 No
62167 I.M. DETROIT DISTRICT
Detroit MI $1,276,429 Yes Black American
191 No
62177 BETHEL BAPTIST CHURCH EAST
Detroit MI $646,147 Yes Black American
381 No
62324 GREATER NEW MT. MORIAH BAPTIST CHRH
Detroit MI $285,934 Yes Black American
205 No
63106 HEALTH ONE Detroit MI $23,034,766 Yes Black American
6,914 No
63713 GREATER CHRIST BAPTIST CHURCH
Detroit MI $861,321 Yes Black American
390 No
60993 METROPOLITAN CHURCH OF GOD
Detroit MI $154,396 Yes Black American
206 No
61375 FANNIE B. PECK OF BETHEL AME CHURCH
Detroit MI $579,647 Yes Black American
500 No
61511 CRAFTSMAN Detroit MI $24,095,161 Yes Black American, Hispanic American
6,403 No
61629 MY POSTAL Pontiac MI $15,771,830 Yes Black American
1,402 No
61641 FM FINANCIAL Flint MI $33,691,981 Yes Black American
5,091 Yes
47
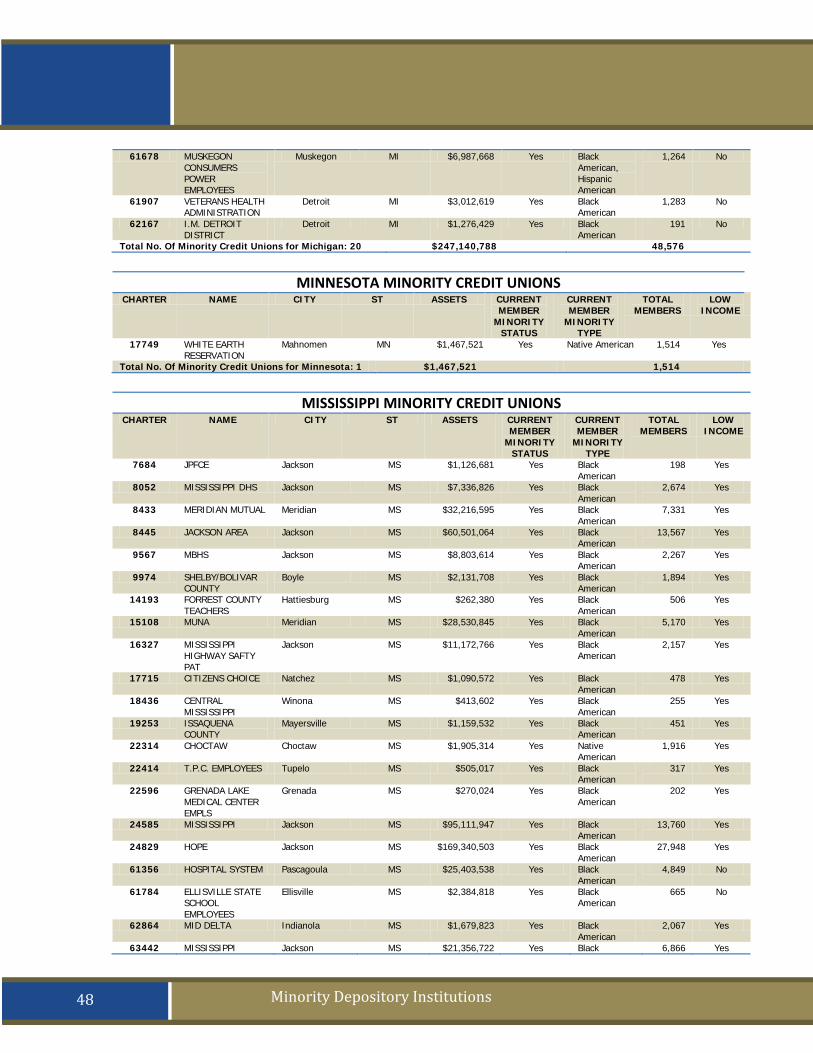
OFEAR Act
Minority Depository Institutions
61678 MUSKEGON CONSUMERS POWER EMPLOYEES
Muskegon MI $6,987,668 Yes Black American, Hispanic American
1,264 No
61907 VETERANS HEALTH ADMINISTRATION
Detroit MI $3,012,619 Yes Black American
1,283 No
62167 I.M. DETROIT DISTRICT
Detroit MI $1,276,429 Yes Black American
191 No
Total No. Of Minority Credit Unions for Michigan: 20 $247,140,788 48,576
MINNESOTA MINORITY CREDIT UNIONS
CHARTER NAME CITY ST ASSETS CURRENT MEMBER
MINORITY STATUS
CURRENT MEMBER
MINORITY TYPE
TOTAL MEMBERS
LOW INCOME
17749 WHITE EARTH RESERVATION
Mahnomen MN $1,467,521 Yes Native American 1,514 Yes
Total No. Of Minority Credit Unions for Minnesota: 1 $1,467,521 1,514
MISSISSIPPI MINORITY CREDIT UNIONS
CHARTER NAME CITY ST ASSETS CURRENT MEMBER
MINORITY STATUS
CURRENT MEMBER
MINORITY TYPE
TOTAL MEMBERS
LOW INCOME
7684 JPFCE Jackson MS $1,126,681 Yes Black American
198 Yes
8052 MISSISSIPPI DHS Jackson MS $7,336,826 Yes Black American
2,674 Yes
8433 MERIDIAN MUTUAL Meridian MS $32,216,595 Yes Black American
7,331 Yes
8445 JACKSON AREA Jackson MS $60,501,064 Yes Black American
13,567 Yes
9567 MBHS Jackson MS $8,803,614 Yes Black American
2,267 Yes
9974 SHELBY/BOLIVAR COUNTY
Boyle MS $2,131,708 Yes Black American
1,894 Yes
14193 FORREST COUNTY TEACHERS
Hattiesburg MS $262,380 Yes Black American
506 Yes
15108 MUNA Meridian MS $28,530,845 Yes Black American
5,170 Yes
16327 MISSISSIPPI HIGHWAY SAFTY PAT
Jackson MS $11,172,766 Yes Black American
2,157 Yes
17715 CITIZENS CHOICE Natchez MS $1,090,572 Yes Black American
478 Yes
18436 CENTRAL MISSISSIPPI
Winona MS $413,602 Yes Black American
255 Yes
19253 ISSAQUENA COUNTY
Mayersville MS $1,159,532 Yes Black American
451 Yes
22314 CHOCTAW Choctaw MS $1,905,314 Yes Native American
1,916 Yes
22414 T.P.C. EMPLOYEES Tupelo MS $505,017 Yes Black American
317 Yes
22596 GRENADA LAKE MEDICAL CENTER EMPLS
Grenada MS $270,024 Yes Black American
202 Yes
24585 MISSISSIPPI Jackson MS $95,111,947 Yes Black American
13,760 Yes
24829 HOPE Jackson MS $169,340,503 Yes Black American
27,948 Yes
61356 HOSPITAL SYSTEM Pascagoula MS $25,403,538 Yes Black American
4,849 No
61784 ELLISVILLE STATE SCHOOL EMPLOYEES
Ellisville MS $2,384,818 Yes Black American
665 No
62864 MID DELTA Indianola MS $1,679,823 Yes Black American
2,067 Yes
63442 MISSISSIPPI Jackson MS $21,356,722 Yes Black 6,866 Yes
48
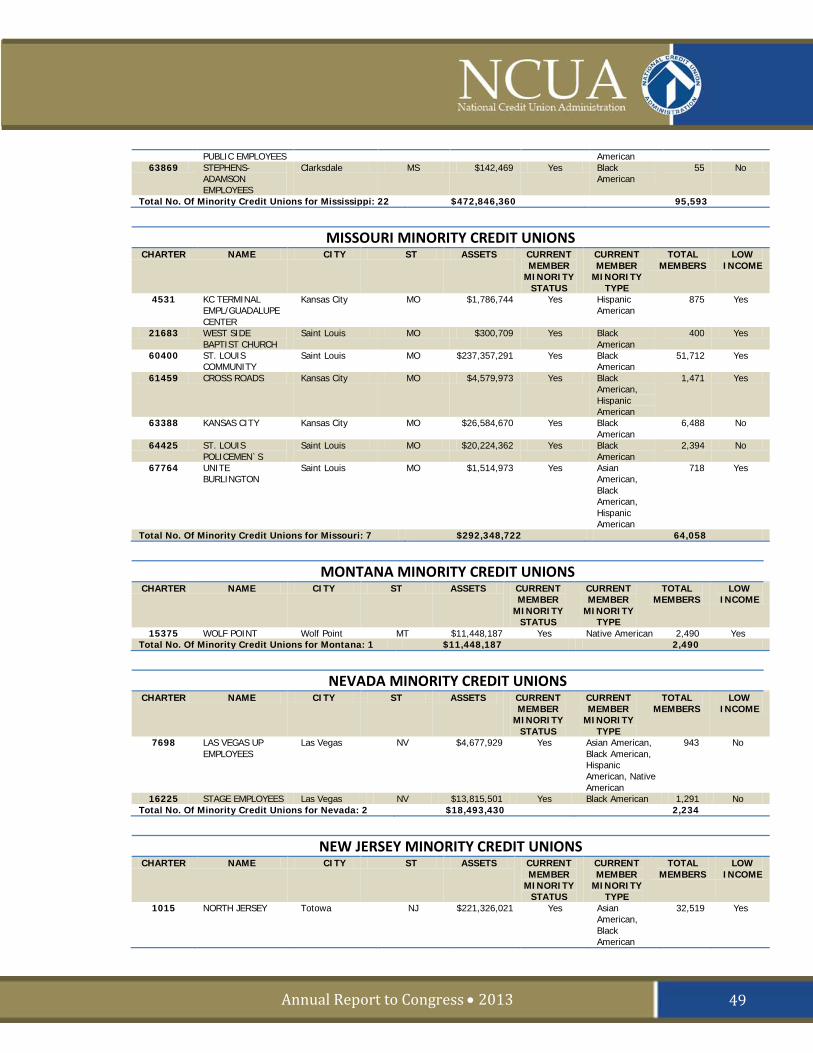
Annual Report to Congress • 2013
PUBLIC EMPLOYEES American 63869 STEPHENS-
ADAMSON EMPLOYEES
Clarksdale MS $142,469 Yes Black American
55 No
Total No. Of Minority Credit Unions for Mississippi: 22 $472,846,360 95,593
MISSOURI MINORITY CREDIT UNIONS
CHARTER NAME CITY ST ASSETS CURRENT MEMBER
MINORITY STATUS
CURRENT MEMBER
MINORITY TYPE
TOTAL MEMBERS
LOW INCOME
4531 KC TERMINAL EMPL/GUADALUPE CENTER
Kansas City MO $1,786,744 Yes Hispanic American
875 Yes
21683 WEST SIDE BAPTIST CHURCH
Saint Louis MO $300,709 Yes Black American
400 Yes
60400 ST. LOUIS COMMUNITY
Saint Louis MO $237,357,291 Yes Black American
51,712 Yes
61459 CROSS ROADS Kansas City MO $4,579,973 Yes Black American, Hispanic American
1,471 Yes
63388 KANSAS CITY Kansas City MO $26,584,670 Yes Black American
6,488 No
64425 ST. LOUIS POLICEMEN`S
Saint Louis MO $20,224,362 Yes Black American
2,394 No
67764 UNITE BURLINGTON
Saint Louis MO $1,514,973 Yes Asian American, Black American, Hispanic American
718 Yes
Total No. Of Minority Credit Unions for Missouri: 7 $292,348,722 64,058
MONTANA MINORITY CREDIT UNIONS
CHARTER NAME CITY ST ASSETS CURRENT MEMBER
MINORITY STATUS
CURRENT MEMBER
MINORITY TYPE
TOTAL MEMBERS
LOW INCOME
15375 WOLF POINT Wolf Point MT $11,448,187 Yes Native American 2,490 Yes Total No. Of Minority Credit Unions for Montana: 1 $11,448,187 2,490
NEVADA MINORITY CREDIT UNIONS
CHARTER NAME CITY ST ASSETS CURRENT MEMBER
MINORITY STATUS
CURRENT MEMBER
MINORITY TYPE
TOTAL MEMBERS
LOW INCOME
7698 LAS VEGAS UP EMPLOYEES
Las Vegas NV $4,677,929 Yes Asian American, Black American, Hispanic American, Native American
943 No
16225 STAGE EMPLOYEES Las Vegas NV $13,815,501 Yes Black American 1,291 No Total No. Of Minority Credit Unions for Nevada: 2 $18,493,430 2,234
NEW JERSEY MINORITY CREDIT UNIONS
CHARTER NAME CITY ST ASSETS CURRENT MEMBER
MINORITY STATUS
CURRENT MEMBER
MINORITY TYPE
TOTAL MEMBERS
LOW INCOME
1015 NORTH JERSEY Totowa NJ $221,326,021 Yes Asian American, Black American
32,519 Yes
49
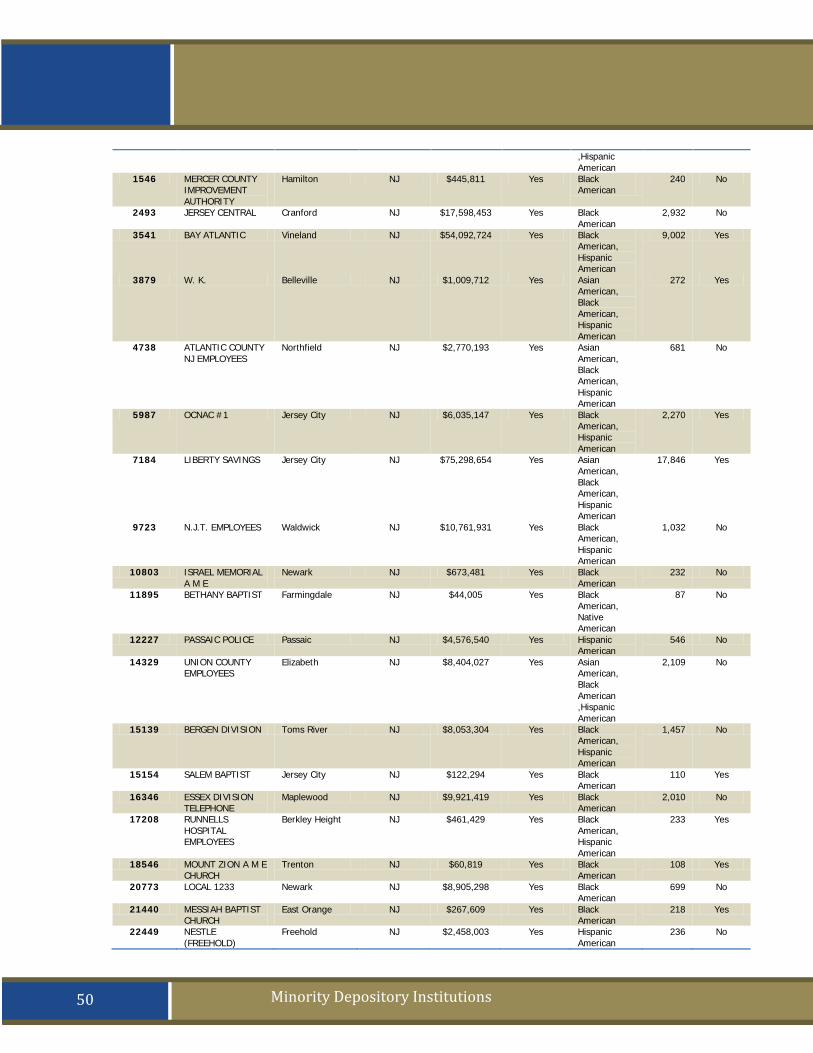
OFEAR Act
Minority Depository Institutions
,Hispanic American
1546 MERCER COUNTY IMPROVEMENT AUTHORITY
Hamilton NJ $445,811 Yes Black American
240 No
2493 JERSEY CENTRAL Cranford NJ $17,598,453 Yes Black American
2,932 No
3541 BAY ATLANTIC Vineland NJ $54,092,724 Yes Black American, Hispanic American
9,002 Yes
3879 W. K. Belleville NJ $1,009,712 Yes Asian American, Black American, Hispanic American
272 Yes
4738 ATLANTIC COUNTY NJ EMPLOYEES
Northfield NJ $2,770,193 Yes Asian American, Black American, Hispanic American
681 No
5987 OCNAC #1 Jersey City NJ $6,035,147 Yes Black American, Hispanic American
2,270 Yes
7184 LIBERTY SAVINGS Jersey City NJ $75,298,654 Yes Asian American, Black American, Hispanic American
17,846 Yes
9723 N.J.T. EMPLOYEES Waldwick NJ $10,761,931 Yes Black American, Hispanic American
1,032 No
10803 ISRAEL MEMORIAL A M E
Newark NJ $673,481 Yes Black American
232 No
11895 BETHANY BAPTIST Farmingdale NJ $44,005 Yes Black American, Native American
87 No
12227 PASSAIC POLICE Passaic NJ $4,576,540 Yes Hispanic American
546 No
14329 UNION COUNTY EMPLOYEES
Elizabeth NJ $8,404,027 Yes Asian American, Black American ,Hispanic American
2,109 No
15139 BERGEN DIVISION Toms River NJ $8,053,304 Yes Black American, Hispanic American
1,457 No
15154 SALEM BAPTIST Jersey City NJ $122,294 Yes Black American
110 Yes
16346 ESSEX DIVISION TELEPHONE
Maplewood NJ $9,921,419 Yes Black American
2,010 No
17208 RUNNELLS HOSPITAL EMPLOYEES
Berkley Height NJ $461,429 Yes Black American, Hispanic American
233 Yes
18546 MOUNT ZION A M E CHURCH
Trenton NJ $60,819 Yes Black American
108 Yes
20773 LOCAL 1233 Newark NJ $8,905,298 Yes Black American
699 No
21440 MESSIAH BAPTIST CHURCH
East Orange NJ $267,609 Yes Black American
218 Yes
22449 NESTLE (FREEHOLD)
Freehold NJ $2,458,003 Yes Hispanic American
236 No
50

Annual Report to Congress • 2013
EMPLOYEES 23265 HELPING OTHER
PEOPLE EXCEL Lakewood NJ $36,423 Yes Black
American 89 Yes
23615 HEARD A.M.E. Roselle NJ $284,467 Yes Black American
242 Yes
23678 GOYA FOODS EMPLOYEES
Secaucus NJ $9,136,619 Yes Hispanic American
846 No
24115 ST. ANDREW KIM Palisades Park NJ $2,598,513 Yes Asian American
757 No
24167 NEW COMMUNITY Newark NJ $3,480,674 Yes Black American, Hispanic American
3,030 Yes
24810 1ST BERGEN Hackensack NJ $1,758,507 Yes Black American, Hispanic American
1,330 Yes
62796 NEWARK BOARD OF EDUCATION EMPLOYEES
Newark NJ $34,510,421 Yes Asian American, Black American
5,224 No
62855 DIVISION 819 TRANSIT EMPLOYEES
Irvington NJ $22,939,034 Yes Black American
2,056 No
63512 CITY OF TRENTON EMPLOYEES
Trenton NJ $1,274,174 Yes Black American, Hispanic American
572 No
66159 NEWARK POST OFFICE EMPLOYEES
Newark NJ $4,149,126 Yes Black American
1,129 No
66276 FIRST BAPTIST CHURCH CRANFORD NJ
Cranford NJ $112,061 Yes Black American
180 No
68195 RENAISSANCE COMMUNITY DEVELOPMENT C
Somerset NJ $1,119,600 Yes Black American, Hispanic American, Native American
690 Yes
68249 FRANKLIN-ST. JOHNS
Newark NJ $219,174 Yes Black American
250 Yes
Total No. Of Minority Credit Unions for New Jersey: 34 $514,905,667 91,234
NEW MEXICO MINORITY CREDIT UNIONS
CHARTER NAME CITY ST ASSETS CURRENT MEMBER
MINORITY STATUS
CURRENT MEMBER
MINORITY TYPE
TOTAL MEMBERS
LOW INCOME
808 U.S. NEW MEXICO Albuquerque NM $761,559,893 Yes Asian American, Black American, Hispanic American, Native American
69,972 No
964 SOUTHWEST Albuquerque NM $53,537,409 Yes Hispanic American, Native American
4,801 No
1838 FORT BAYARD Santa Clara NM $4,663,306 Yes Hispanic American
1,285 Yes
7027 INTERNATIONALITES
Carlsbad NM $8,677,530 Yes Hispanic American
1,172 Yes
7999 TELCO ROSWELL NEW MEXICO
Roswell NM $6,317,526 Yes Hispanic American
1,079 Yes
8475 OTERO Alamogordo NM $268,290,088 Yes Asian American, Black
33,050 Yes
51

OFEAR Act
Minority Depository Institutions
American, Hispanic American, Native American
9093 ROSWELL COMMUNITY
Roswell NM $25,222,548 Yes Hispanic American
2,274 Yes
9566 EDDY Carlsbad NM $62,179,655 Yes Hispanic American
6,555 No
9771 CHINO Silver City NM $26,943,927 Yes Hispanic American
5,849 Yes
12633 NEW MEXICO CORRECTIONAL EMPL
Santa Fe NM $1,354,807 Yes Hispanic American
348 Yes
16754 FOUR CORNERS Kirtland NM $22,076,899 Yes Native American
4,741 Yes
60467 ZIA Los Alamos NM $135,221,642 Yes Hispanic American
12,766 No
61559 DEMING SCHOOLS EMPLOYEES
Deming NM $4,772,699 Yes Hispanic American
672 No
61946 RINCONES PRESBYTERIAN
Chacon NM $3,599,545 Yes Hispanic American
653 Yes
62289 ST. GERTRUDE'S Mora NM $1,776,786 Yes Hispanic American
635 Yes
62573 RIO GRANDE Albuquerque NM $236,063,100 Yes Asian American, Black American, Hispanic American, Native American
25,086 No
65513 STATE EMPLOYEES Santa Fe NM $342,232,712 Yes Hispanic American
35,605 No
66097 CUBA Cuba NM $11,633,822 Yes Hispanic American ,Native American
2,057 Yes
66109 ESTACADO Lovington NM $12,064,131 Yes Hispanic American
2,246 No
66143 CHAVES COUNTY SCHOOL EMPLOYEES
Roswell NM $22,908,632 Yes Hispanic American
2,610 Yes
66149 GUADALUPE Santa Fe NM $131,423,531 Yes Hispanic American
14,074 Yes
66252 QUESTA Questa NM $6,780,948 Yes Hispanic American
889 Yes
68244 FIRST FINANCIAL Albuquerque NM $416,661,519 Yes Black American, Hispanic American, Native American
56,129 Yes
Total No. Of Minority Credit Unions for New Mexico: 23 $2,565,962,655 284,548
52

Annual Report to Congress • 2013
NEW YORK MINORITY CREDIT UNIONS CHARTER NAME CITY ST ASSETS CURRENT
MEMBER MINORITY
STATUS
CURRENT MEMBER
MINORITY TYPE
TOTAL MEMBERS
LOW INCOME
132 MOUNT VERNON NY POSTAL EMPLOYEES
Mount Vernon NY $2,203,578 Yes Black American
309 No
165 NEW YORK STATE EMPLOYEES
New York NY $2,311,818 Yes Black American
1,206 Yes
798 TRANSIT AUTHORITY DIVISION B
New York NY $5,123,188 Yes Black American, Hispanic American
1,750 No
903 MATTEAWAN Beacon NY $25,347,378 Yes Black American, Hispanic American
2,234 No
1343 EMPIRT 207 New York NY $3,999,295 Yes Black American, Hispanic American
810 No
1532 LOMTO Woodside NY $249,684,427 Yes Asian American, Black American ,Hispanic American
3,127 No
2184 ST. MARTIN'S New York NY $236,291 Yes Black American
222 Yes
3714 UNIVERSITY SETTLEMENT
New York NY $849,647 Yes Asian American ,Hispanic American
199 Yes
4170 ABYSSINIAN BAPTIST CHURCH
New York NY $1,181,412 Yes Black American
344 Yes
4246 FAR ROCKAWAY POSTAL
Far Rockaway NY $657,035 Yes Black American
88 No
4441 SING SING EMPLOYEES
Ossining NY $5,687,100 Yes Hispanic American
1,311 Yes
5022 ST. MARKS New York NY $230,549 Yes Black American, Hispanic American
129 Yes
5127 CHURCH OF THE MASTER
New York NY $651,788 Yes Black American
383 Yes
5263 ST. AUGUSTINE PRESBYTERIAN
Bronx NY $113,257 Yes Black American, Hispanic American
120 Yes
5655 UNION CONGREGATIONAL
New York NY $387,243 Yes Black American
138 Yes
7172 ST. PHILIP'S CHURCH
New York NY $1,667,887 Yes Black American
436 Yes
7504 CONCORD Brooklyn NY $8,855,490 Yes Black American
1,335 Yes
7883 GRACE CONGREGATIONAL CHURCH
New York NY $227,000 Yes Black American
155 Yes
8950 ALL SOULS New York NY $274,753 Yes Black American
212 Yes
11380 FIDELIS New York NY $359,650 Yes Black American
313 Yes
11702 UNION SETTLEMENT
New York NY $6,111,885 Yes Black American, Hispanic American
3,495 Yes
12085 CORNERSTONE BAPTIST CHURCH
Brooklyn NY $122,006 Yes Black American
283 Yes
15067 TRANSFIGURATION Brooklyn NY $7,056,878 Yes Hispanic 2,458 Yes
53
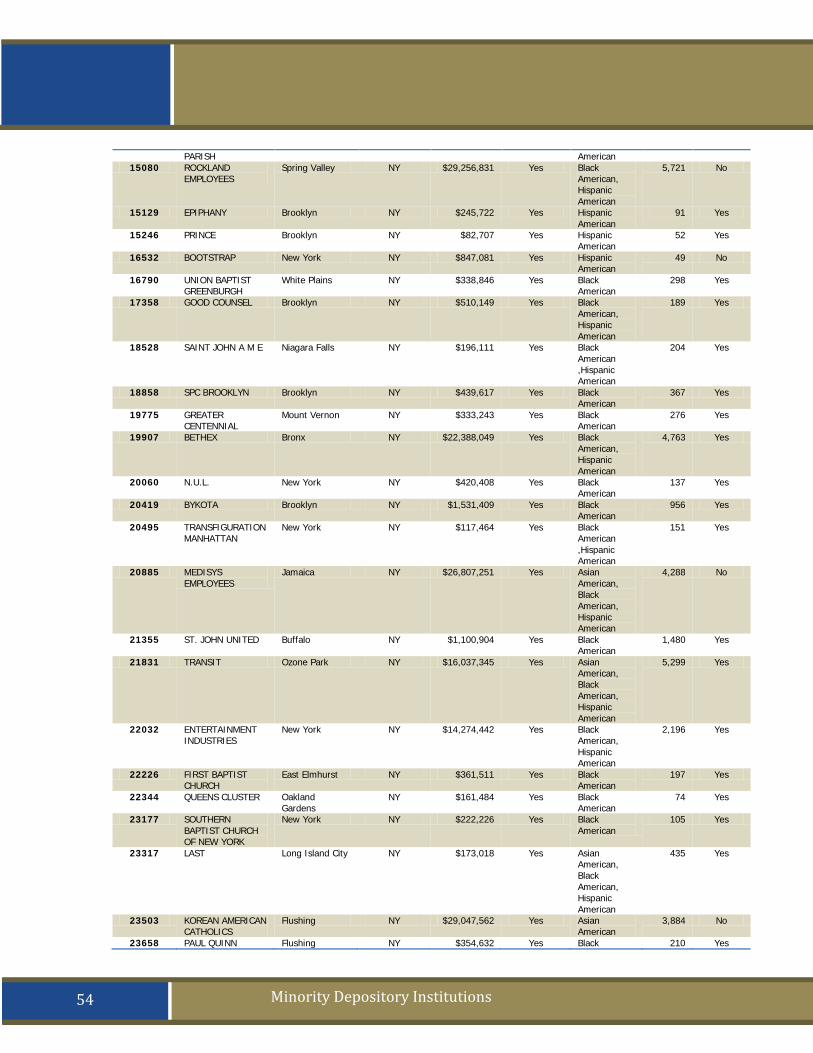
OFEAR Act
Minority Depository Institutions
PARISH American 15080 ROCKLAND
EMPLOYEES Spring Valley NY $29,256,831 Yes Black
American, Hispanic American
5,721 No
15129 EPIPHANY Brooklyn NY $245,722 Yes Hispanic American
91 Yes
15246 PRINCE Brooklyn NY $82,707 Yes Hispanic American
52 Yes
16532 BOOTSTRAP New York NY $847,081 Yes Hispanic American
49 No
16790 UNION BAPTIST GREENBURGH
White Plains NY $338,846 Yes Black American
298 Yes
17358 GOOD COUNSEL Brooklyn NY $510,149 Yes Black American, Hispanic American
189 Yes
18528 SAINT JOHN A M E Niagara Falls NY $196,111 Yes Black American ,Hispanic American
204 Yes
18858 SPC BROOKLYN Brooklyn NY $439,617 Yes Black American
367 Yes
19775 GREATER CENTENNIAL
Mount Vernon NY $333,243 Yes Black American
276 Yes
19907 BETHEX Bronx NY $22,388,049 Yes Black American, Hispanic American
4,763 Yes
20060 N.U.L. New York NY $420,408 Yes Black American
137 Yes
20419 BYKOTA Brooklyn NY $1,531,409 Yes Black American
956 Yes
20495 TRANSFIGURATION MANHATTAN
New York NY $117,464 Yes Black American ,Hispanic American
151 Yes
20885 MEDISYS EMPLOYEES
Jamaica NY $26,807,251 Yes Asian American, Black American, Hispanic American
4,288 No
21355 ST. JOHN UNITED Buffalo NY $1,100,904 Yes Black American
1,480 Yes
21831 TRANSIT Ozone Park NY $16,037,345 Yes Asian American, Black American, Hispanic American
5,299 Yes
22032 ENTERTAINMENT INDUSTRIES
New York NY $14,274,442 Yes Black American, Hispanic American
2,196 Yes
22226 FIRST BAPTIST CHURCH
East Elmhurst NY $361,511 Yes Black American
197 Yes
22344 QUEENS CLUSTER Oakland Gardens
NY $161,484 Yes Black American
74 Yes
23177 SOUTHERN BAPTIST CHURCH OF NEW YORK
New York NY $222,226 Yes Black American
105 Yes
23317 LAST Long Island City NY $173,018 Yes Asian American, Black American, Hispanic American
435 Yes
23503 KOREAN AMERICAN CATHOLICS
Flushing NY $29,047,562 Yes Asian American
3,884 No
23658 PAUL QUINN Flushing NY $354,632 Yes Black 210 Yes
54
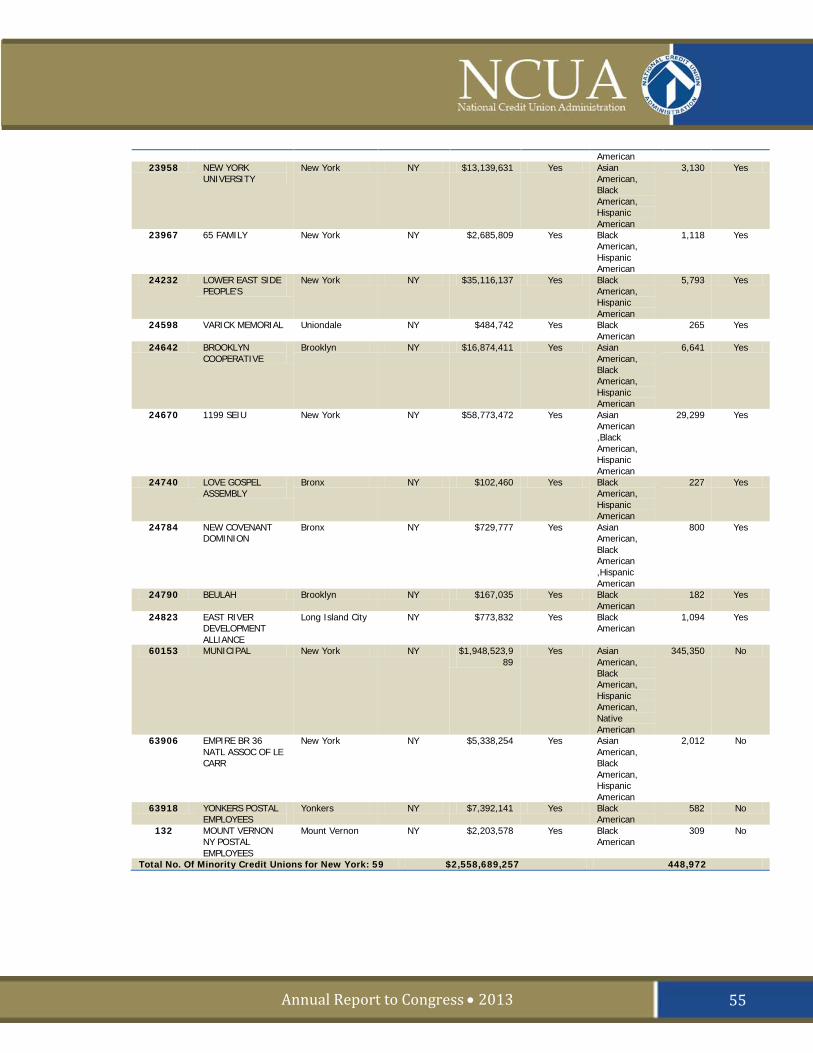
Annual Report to Congress • 2013
American 23958 NEW YORK
UNIVERSITY New York NY $13,139,631 Yes Asian
American, Black American, Hispanic American
3,130 Yes
23967 65 FAMILY New York NY $2,685,809 Yes Black American, Hispanic American
1,118 Yes
24232 LOWER EAST SIDE PEOPLE'S
New York NY $35,116,137 Yes Black American, Hispanic American
5,793 Yes
24598 VARICK MEMORIAL Uniondale NY $484,742 Yes Black American
265 Yes
24642 BROOKLYN COOPERATIVE
Brooklyn NY $16,874,411 Yes Asian American, Black American, Hispanic American
6,641 Yes
24670 1199 SEIU New York NY $58,773,472 Yes Asian American ,Black American, Hispanic American
29,299 Yes
24740 LOVE GOSPEL ASSEMBLY
Bronx NY $102,460 Yes Black American, Hispanic American
227 Yes
24784 NEW COVENANT DOMINION
Bronx NY $729,777 Yes Asian American, Black American ,Hispanic American
800 Yes
24790 BEULAH Brooklyn NY $167,035 Yes Black American
182 Yes
24823 EAST RIVER DEVELOPMENT ALLIANCE
Long Island City NY $773,832 Yes Black American
1,094 Yes
60153 MUNICIPAL New York NY $1,948,523,989
Yes Asian American, Black American, Hispanic American, Native American
345,350 No
63906 EMPIRE BR 36 NATL ASSOC OF LE CARR
New York NY $5,338,254 Yes Asian American, Black American, Hispanic American
2,012 No
63918 YONKERS POSTAL EMPLOYEES
Yonkers NY $7,392,141 Yes Black American
582 No
132 MOUNT VERNON NY POSTAL EMPLOYEES
Mount Vernon NY $2,203,578 Yes Black American
309 No
Total No. Of Minority Credit Unions for New York: 59 $2,558,689,257 448,972
55

OFEAR Act
Minority Depository Institutions
NORTH CAROLINA MINORITY CREDIT UNIONS CHARTER NAME CITY ST ASSETS CURRENT
MEMBER MINORITY
STATUS
CURRENT MEMBER
MINORITY TYPE
TOTAL MEMBERS
LOW INCOME
3685 INTERNAL REVENUE EMPLOYEES
Greensboro NC $25,971,850 Yes Black American
1,270 No
19826 SHAW UNIVERSITY Raleigh NC $546,988 Yes Black American
135 Yes
24802 SELF-HELP Durham NC $579,747,918 Yes Hispanic American
49,713 Yes
63595 MOUNT VERNON BAPTIST CHURCH
Durham NC $200,767 Yes Black American
235 No
64034 GREATER KINSTON Kinston NC $10,879,266 Yes Black American
5,715 Yes
68121 GENERATIONS COMMUNITY
Durham NC $23,086,753 Yes Black American, Hispanic American
9,044 Yes
68593 FIRST LEGACY COMMUNITY
Charlotte NC $40,462,066 Yes Black American
10,275 Yes
Total No. Of Minority Credit Unions for North Carolina: 7
$680,895,608 76,387
OHIO MINORITY CREDIT UNIONS
CHARTER NAME CITY ST ASSETS CURRENT MEMBER
MINORITY STATUS
CURRENT MEMBER
MINORITY TYPE
TOTAL MEMBERS
LOW INCOME
2538 RTA HAYDEN E. Cleveland OH $1,695,138 Yes Black American
662 Yes
5352 TOLEDO TEAMSTERS
Toledo OH $4,571,486 Yes Black American
1,338 Yes
5525 SHILOH BAPTIST CHURCH
Columbus OH $230,314 Yes Black American
323 No
6207 CARMEL BROTHERHOOD
Cincinnati OH $251,838 Yes Black American
149 Yes
14469 YHA SOUTH UNIT Youngstown OH $1,728,945 Yes Black American
658 Yes
14798 BETHEL COMMUNITY
Dayton OH $254,062 Yes Asian American, Black American, Hispanic American
224 Yes
17555 STEEL VALLEY Cleveland OH $45,233,074 Yes Black American, Hispanic American
9,318 Yes
18562 MT ZION WOODLAWN
Cincinnati OH $95,539 Yes Black American
358 Yes
20186 CHILDREN'S MEDICAL CENTER
Cincinnati OH $31,214,855 Yes Asian American ,Black American, Hispanic American
7,319 No
21226 PROMEDICA Toledo OH $51,269,318 Yes Asian American, Black American, Hispanic American
7,096 No
22151 CLEVELAND CHURCH OF CHRIST
Cleveland OH $249,690 Yes Black American
571 Yes
24578 TOLEDO URBAN Toledo OH $4,115,875 Yes Black American
2,020 Yes
56
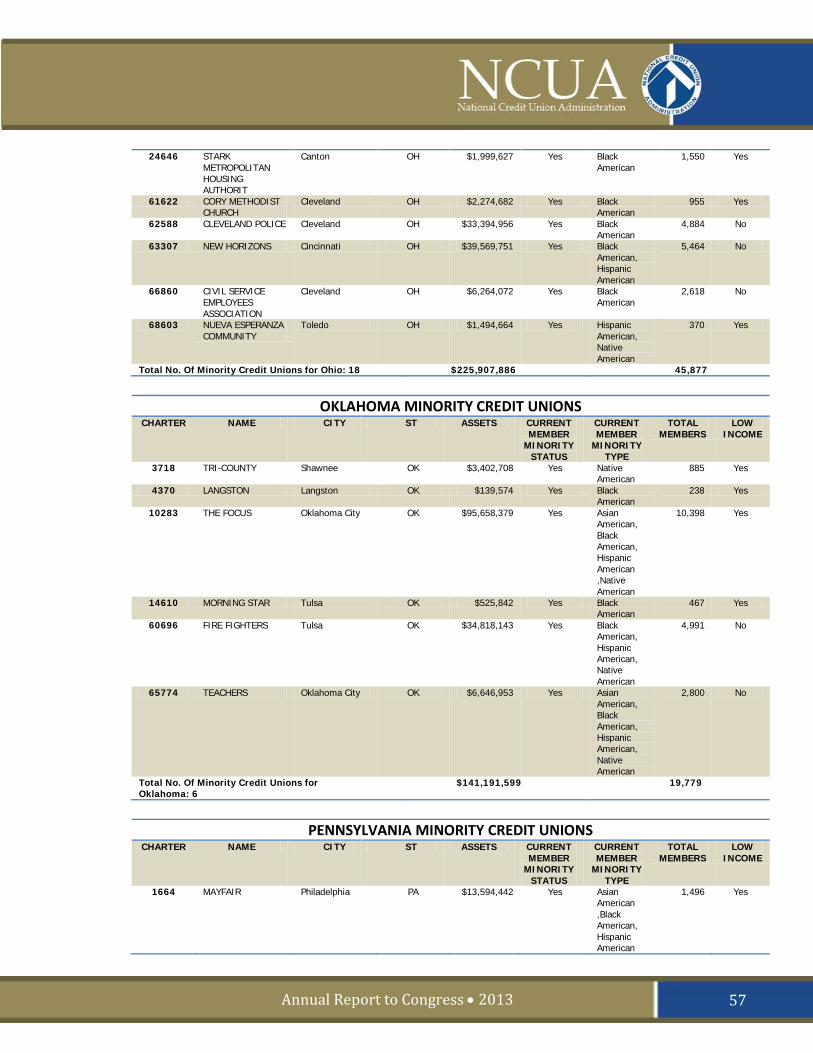
Annual Report to Congress • 2013
24646 STARK METROPOLITAN HOUSING AUTHORIT
Canton OH $1,999,627 Yes Black American
1,550 Yes
61622 CORY METHODIST CHURCH
Cleveland OH $2,274,682 Yes Black American
955 Yes
62588 CLEVELAND POLICE Cleveland OH $33,394,956 Yes Black American
4,884 No
63307 NEW HORIZONS Cincinnati OH $39,569,751 Yes Black American, Hispanic American
5,464 No
66860 CIVIL SERVICE EMPLOYEES ASSOCIATION
Cleveland OH $6,264,072 Yes Black American
2,618 No
68603 NUEVA ESPERANZA COMMUNITY
Toledo OH $1,494,664 Yes Hispanic American, Native American
370 Yes
Total No. Of Minority Credit Unions for Ohio: 18 $225,907,886 45,877
OKLAHOMA MINORITY CREDIT UNIONS
CHARTER NAME CITY ST ASSETS CURRENT MEMBER
MINORITY STATUS
CURRENT MEMBER
MINORITY TYPE
TOTAL MEMBERS
LOW INCOME
3718 TRI-COUNTY Shawnee OK $3,402,708 Yes Native American
885 Yes
4370 LANGSTON Langston OK $139,574 Yes Black American
238 Yes
10283 THE FOCUS Oklahoma City OK $95,658,379 Yes Asian American, Black American, Hispanic American ,Native American
10,398 Yes
14610 MORNING STAR Tulsa OK $525,842 Yes Black American
467 Yes
60696 FIRE FIGHTERS Tulsa OK $34,818,143 Yes Black American, Hispanic American, Native American
4,991 No
65774 TEACHERS Oklahoma City OK $6,646,953 Yes Asian American, Black American, Hispanic American, Native American
2,800 No
Total No. Of Minority Credit Unions for Oklahoma: 6
$141,191,599 19,779
PENNSYLVANIA MINORITY CREDIT UNIONS
CHARTER NAME CITY ST ASSETS CURRENT MEMBER
MINORITY STATUS
CURRENT MEMBER
MINORITY TYPE
TOTAL MEMBERS
LOW INCOME
1664 MAYFAIR Philadelphia PA $13,594,442 Yes Asian American ,Black American, Hispanic American
1,496 Yes
57
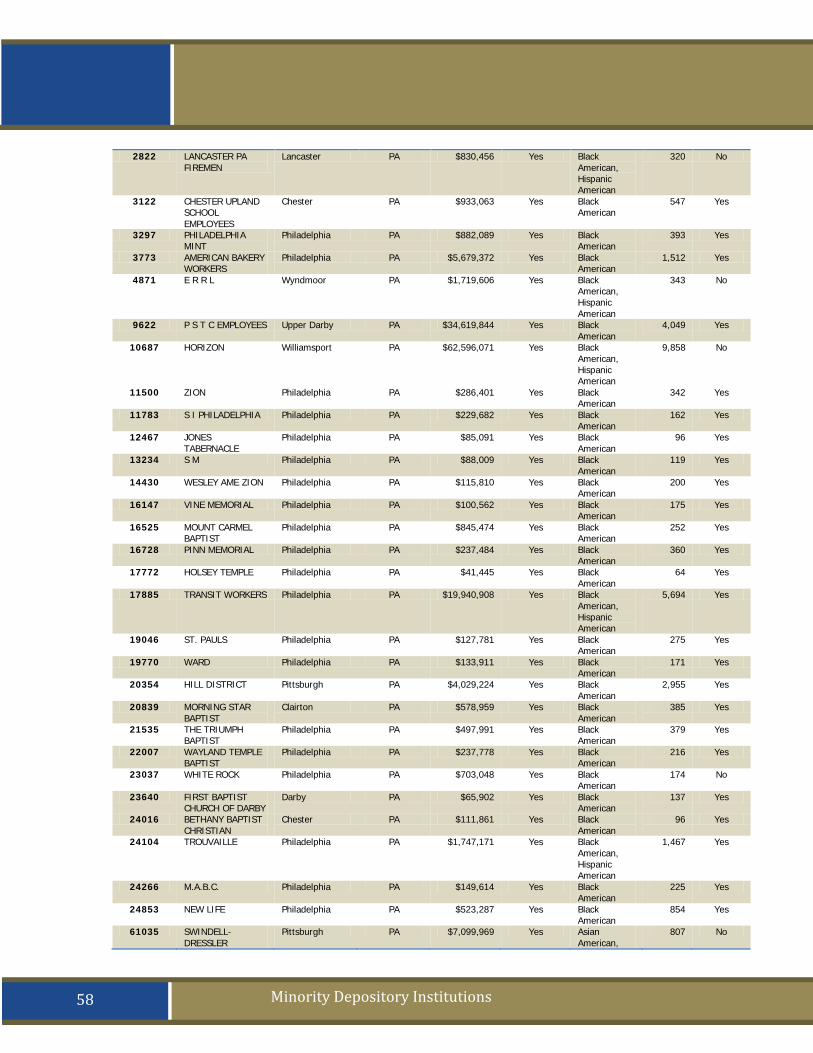
OFEAR Act
Minority Depository Institutions
2822 LANCASTER PA FIREMEN
Lancaster PA $830,456 Yes Black American, Hispanic American
320 No
3122 CHESTER UPLAND SCHOOL EMPLOYEES
Chester PA $933,063 Yes Black American
547 Yes
3297 PHILADELPHIA MINT
Philadelphia PA $882,089 Yes Black American
393 Yes
3773 AMERICAN BAKERY WORKERS
Philadelphia PA $5,679,372 Yes Black American
1,512 Yes
4871 E R R L Wyndmoor PA $1,719,606 Yes Black American, Hispanic American
343 No
9622 P S T C EMPLOYEES Upper Darby PA $34,619,844 Yes Black American
4,049 Yes
10687 HORIZON Williamsport PA $62,596,071 Yes Black American, Hispanic American
9,858 No
11500 ZION Philadelphia PA $286,401 Yes Black American
342 Yes
11783 S I PHILADELPHIA Philadelphia PA $229,682 Yes Black American
162 Yes
12467 JONES TABERNACLE
Philadelphia PA $85,091 Yes Black American
96 Yes
13234 S M Philadelphia PA $88,009 Yes Black American
119 Yes
14430 WESLEY AME ZION Philadelphia PA $115,810 Yes Black American
200 Yes
16147 VINE MEMORIAL Philadelphia PA $100,562 Yes Black American
175 Yes
16525 MOUNT CARMEL BAPTIST
Philadelphia PA $845,474 Yes Black American
252 Yes
16728 PINN MEMORIAL Philadelphia PA $237,484 Yes Black American
360 Yes
17772 HOLSEY TEMPLE Philadelphia PA $41,445 Yes Black American
64 Yes
17885 TRANSIT WORKERS Philadelphia PA $19,940,908 Yes Black American, Hispanic American
5,694 Yes
19046 ST. PAULS Philadelphia PA $127,781 Yes Black American
275 Yes
19770 WARD Philadelphia PA $133,911 Yes Black American
171 Yes
20354 HILL DISTRICT Pittsburgh PA $4,029,224 Yes Black American
2,955 Yes
20839 MORNING STAR BAPTIST
Clairton PA $578,959 Yes Black American
385 Yes
21535 THE TRIUMPH BAPTIST
Philadelphia PA $497,991 Yes Black American
379 Yes
22007 WAYLAND TEMPLE BAPTIST
Philadelphia PA $237,778 Yes Black American
216 Yes
23037 WHITE ROCK Philadelphia PA $703,048 Yes Black American
174 No
23640 FIRST BAPTIST CHURCH OF DARBY
Darby PA $65,902 Yes Black American
137 Yes
24016 BETHANY BAPTIST CHRISTIAN
Chester PA $111,861 Yes Black American
96 Yes
24104 TROUVAILLE Philadelphia PA $1,747,171 Yes Black American, Hispanic American
1,467 Yes
24266 M.A.B.C. Philadelphia PA $149,614 Yes Black American
225 Yes
24853 NEW LIFE Philadelphia PA $523,287 Yes Black American
854 Yes
61035 SWINDELL-DRESSLER
Pittsburgh PA $7,099,969 Yes Asian American,
807 No
58
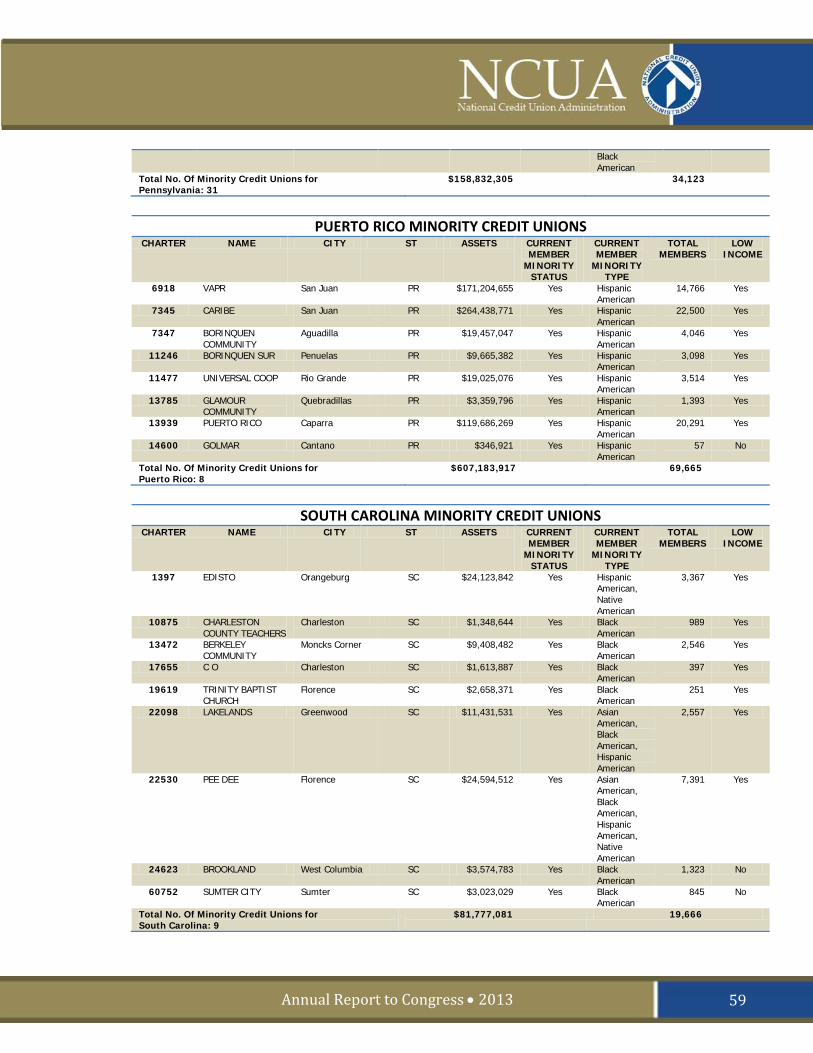
Annual Report to Congress • 2013
Black American
Total No. Of Minority Credit Unions for Pennsylvania: 31
$158,832,305 34,123
PUERTO RICO MINORITY CREDIT UNIONS
CHARTER NAME CITY ST ASSETS CURRENT MEMBER
MINORITY STATUS
CURRENT MEMBER
MINORITY TYPE
TOTAL MEMBERS
LOW INCOME
6918 VAPR San Juan PR $171,204,655 Yes Hispanic American
14,766 Yes
7345 CARIBE San Juan PR $264,438,771 Yes Hispanic American
22,500 Yes
7347 BORINQUEN COMMUNITY
Aguadilla PR $19,457,047 Yes Hispanic American
4,046 Yes
11246 BORINQUEN SUR Penuelas PR $9,665,382 Yes Hispanic American
3,098 Yes
11477 UNIVERSAL COOP Rio Grande PR $19,025,076 Yes Hispanic American
3,514 Yes
13785 GLAMOUR COMMUNITY
Quebradillas PR $3,359,796 Yes Hispanic American
1,393 Yes
13939 PUERTO RICO Caparra PR $119,686,269 Yes Hispanic American
20,291 Yes
14600 GOLMAR Cantano PR $346,921 Yes Hispanic American
57 No
Total No. Of Minority Credit Unions for Puerto Rico: 8
$607,183,917 69,665
SOUTH CAROLINA MINORITY CREDIT UNIONS
CHARTER NAME CITY ST ASSETS CURRENT MEMBER
MINORITY STATUS
CURRENT MEMBER
MINORITY TYPE
TOTAL MEMBERS
LOW INCOME
1397 EDISTO Orangeburg SC $24,123,842 Yes Hispanic American, Native American
3,367 Yes
10875 CHARLESTON COUNTY TEACHERS
Charleston SC $1,348,644 Yes Black American
989 Yes
13472 BERKELEY COMMUNITY
Moncks Corner SC $9,408,482 Yes Black American
2,546 Yes
17655 C O Charleston SC $1,613,887 Yes Black American
397 Yes
19619 TRINITY BAPTIST CHURCH
Florence SC $2,658,371 Yes Black American
251 Yes
22098 LAKELANDS Greenwood SC $11,431,531 Yes Asian American, Black American, Hispanic American
2,557 Yes
22530 PEE DEE Florence SC $24,594,512 Yes Asian American, Black American, Hispanic American, Native American
7,391 Yes
24623 BROOKLAND West Columbia SC $3,574,783 Yes Black American
1,323 No
60752 SUMTER CITY Sumter SC $3,023,029 Yes Black American
845 No
Total No. Of Minority Credit Unions for South Carolina: 9
$81,777,081 19,666
59
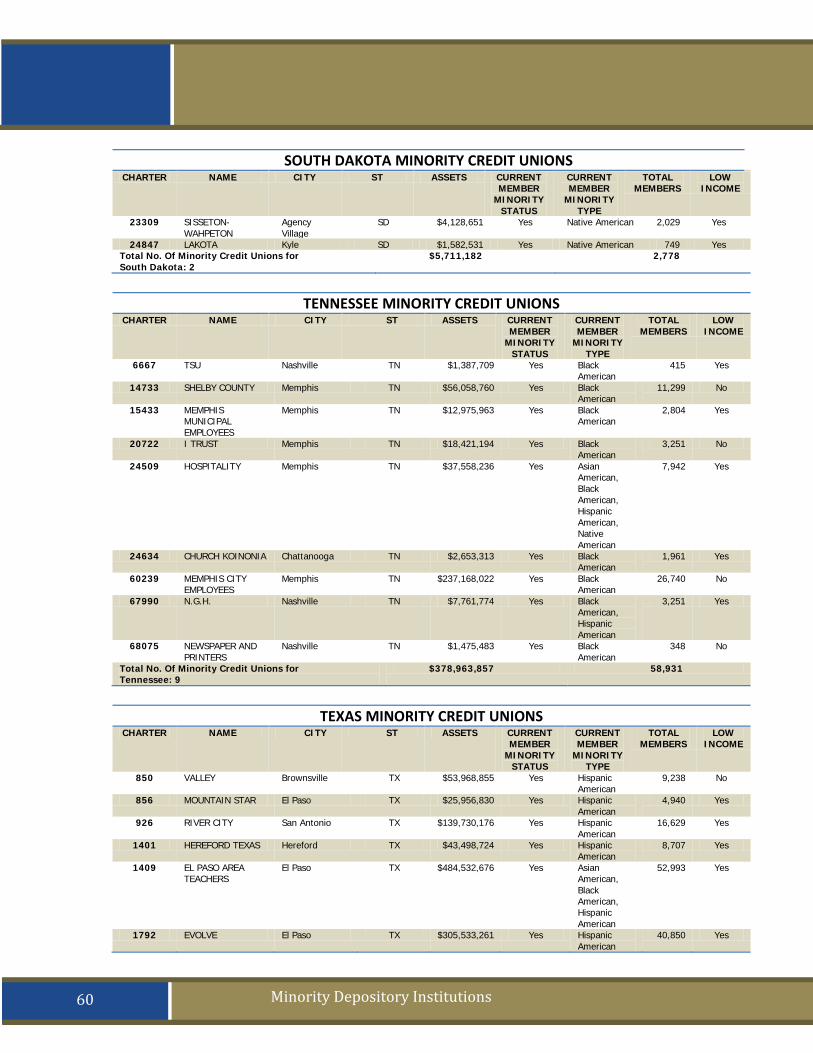
OFEAR Act
Minority Depository Institutions
SOUTH DAKOTA MINORITY CREDIT UNIONS CHARTER NAME CITY ST ASSETS CURRENT
MEMBER MINORITY
STATUS
CURRENT MEMBER
MINORITY TYPE
TOTAL MEMBERS
LOW INCOME
23309 SISSETON-WAHPETON
Agency Village
SD $4,128,651 Yes Native American 2,029 Yes
24847 LAKOTA Kyle SD $1,582,531 Yes Native American 749 Yes Total No. Of Minority Credit Unions for South Dakota: 2
$5,711,182 2,778
TENNESSEE MINORITY CREDIT UNIONS
CHARTER NAME CITY ST ASSETS CURRENT MEMBER
MINORITY STATUS
CURRENT MEMBER
MINORITY TYPE
TOTAL MEMBERS
LOW INCOME
6667 TSU Nashville TN $1,387,709 Yes Black American
415 Yes
14733 SHELBY COUNTY Memphis TN $56,058,760 Yes Black American
11,299 No
15433 MEMPHIS MUNICIPAL EMPLOYEES
Memphis TN $12,975,963 Yes Black American
2,804 Yes
20722 I TRUST Memphis TN $18,421,194 Yes Black American
3,251 No
24509 HOSPITALITY Memphis TN $37,558,236 Yes Asian American, Black American, Hispanic American, Native American
7,942 Yes
24634 CHURCH KOINONIA Chattanooga TN $2,653,313 Yes Black American
1,961 Yes
60239 MEMPHIS CITY EMPLOYEES
Memphis TN $237,168,022 Yes Black American
26,740 No
67990 N.G.H. Nashville TN $7,761,774 Yes Black American, Hispanic American
3,251 Yes
68075 NEWSPAPER AND PRINTERS
Nashville TN $1,475,483 Yes Black American
348 No
Total No. Of Minority Credit Unions for Tennessee: 9
$378,963,857 58,931
TEXAS MINORITY CREDIT UNIONS
CHARTER NAME CITY ST ASSETS CURRENT MEMBER
MINORITY STATUS
CURRENT MEMBER
MINORITY TYPE
TOTAL MEMBERS
LOW INCOME
850 VALLEY Brownsville TX $53,968,855 Yes Hispanic American
9,238 No
856 MOUNTAIN STAR El Paso TX $25,956,830 Yes Hispanic American
4,940 Yes
926 RIVER CITY San Antonio TX $139,730,176 Yes Hispanic American
16,629 Yes
1401 HEREFORD TEXAS Hereford TX $43,498,724 Yes Hispanic American
8,707 Yes
1409 EL PASO AREA TEACHERS
El Paso TX $484,532,676 Yes Asian American, Black American, Hispanic American
52,993 Yes
1792 EVOLVE El Paso TX $305,533,261 Yes Hispanic American
40,850 Yes
60
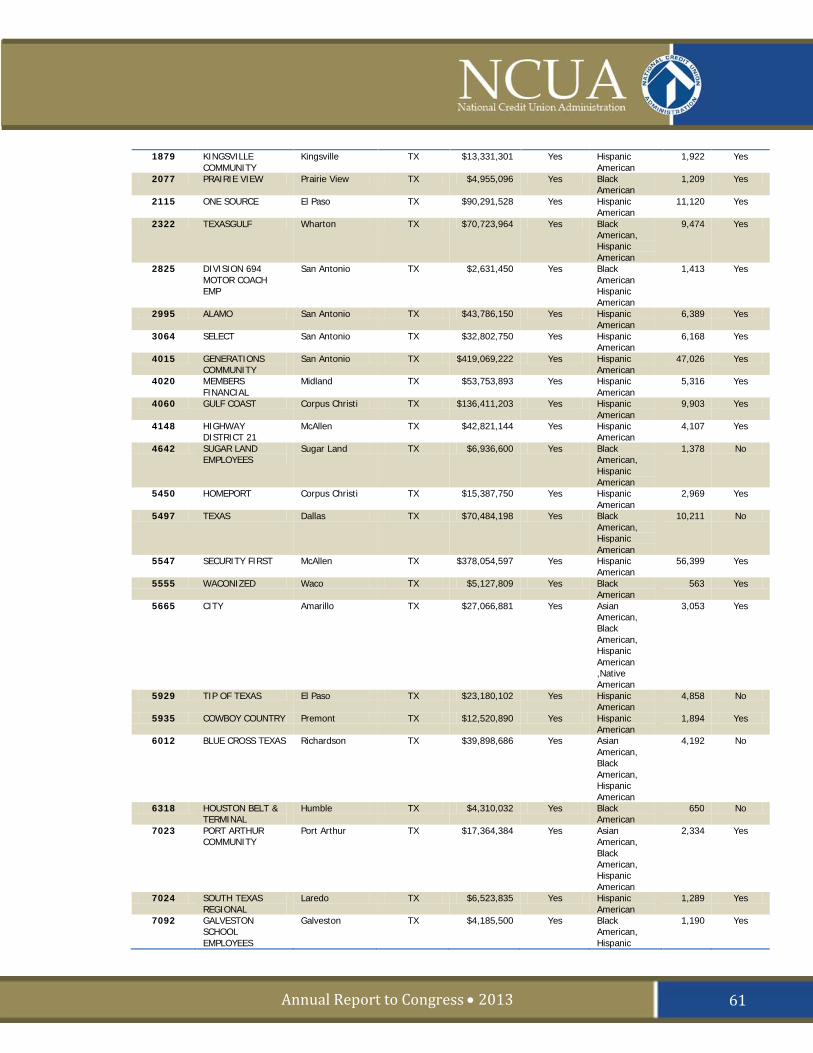
Annual Report to Congress • 2013
1879 KINGSVILLE COMMUNITY
Kingsville TX $13,331,301 Yes Hispanic American
1,922 Yes
2077 PRAIRIE VIEW Prairie View TX $4,955,096 Yes Black American
1,209 Yes
2115 ONE SOURCE El Paso TX $90,291,528 Yes Hispanic American
11,120 Yes
2322 TEXASGULF Wharton TX $70,723,964 Yes Black American, Hispanic American
9,474 Yes
2825 DIVISION 694 MOTOR COACH EMP
San Antonio TX $2,631,450 Yes Black American Hispanic American
1,413 Yes
2995 ALAMO San Antonio TX $43,786,150 Yes Hispanic American
6,389 Yes
3064 SELECT San Antonio TX $32,802,750 Yes Hispanic American
6,168 Yes
4015 GENERATIONS COMMUNITY
San Antonio TX $419,069,222 Yes Hispanic American
47,026 Yes
4020 MEMBERS FINANCIAL
Midland TX $53,753,893 Yes Hispanic American
5,316 Yes
4060 GULF COAST Corpus Christi TX $136,411,203 Yes Hispanic American
9,903 Yes
4148 HIGHWAY DISTRICT 21
McAllen TX $42,821,144 Yes Hispanic American
4,107 Yes
4642 SUGAR LAND EMPLOYEES
Sugar Land TX $6,936,600 Yes Black American, Hispanic American
1,378 No
5450 HOMEPORT Corpus Christi TX $15,387,750 Yes Hispanic American
2,969 Yes
5497 TEXAS Dallas TX $70,484,198 Yes Black American, Hispanic American
10,211 No
5547 SECURITY FIRST McAllen TX $378,054,597 Yes Hispanic American
56,399 Yes
5555 WACONIZED Waco TX $5,127,809 Yes Black American
563 Yes
5665 CITY Amarillo TX $27,066,881 Yes Asian American, Black American, Hispanic American ,Native American
3,053 Yes
5929 TIP OF TEXAS El Paso TX $23,180,102 Yes Hispanic American
4,858 No
5935 COWBOY COUNTRY Premont TX $12,520,890 Yes Hispanic American
1,894 Yes
6012 BLUE CROSS TEXAS Richardson TX $39,898,686 Yes Asian American, Black American, Hispanic American
4,192 No
6318 HOUSTON BELT & TERMINAL
Humble TX $4,310,032 Yes Black American
650 No
7023 PORT ARTHUR COMMUNITY
Port Arthur TX $17,364,384 Yes Asian American, Black American, Hispanic American
2,334 Yes
7024 SOUTH TEXAS REGIONAL
Laredo TX $6,523,835 Yes Hispanic American
1,289 Yes
7092 GALVESTON SCHOOL EMPLOYEES
Galveston TX $4,185,500 Yes Black American, Hispanic
1,190 Yes
61
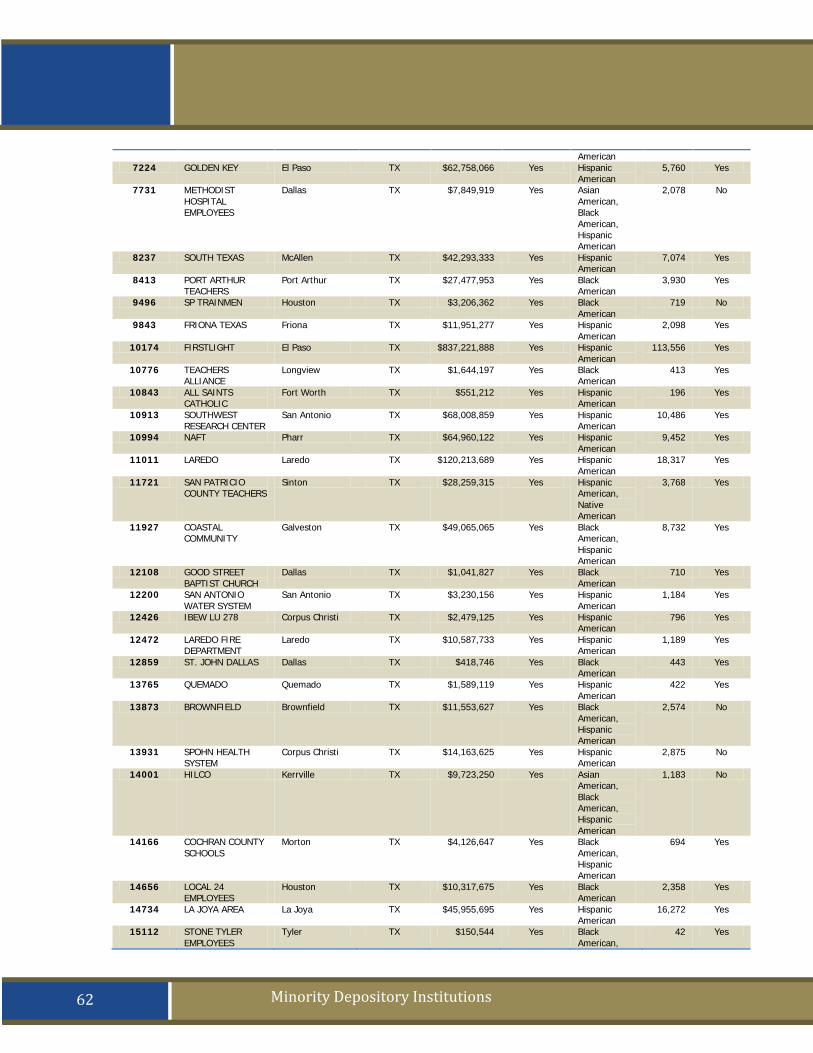
OFEAR Act
Minority Depository Institutions
American 7224 GOLDEN KEY El Paso TX $62,758,066 Yes Hispanic
American 5,760 Yes
7731 METHODIST HOSPITAL EMPLOYEES
Dallas TX $7,849,919 Yes Asian American, Black American, Hispanic American
2,078 No
8237 SOUTH TEXAS McAllen TX $42,293,333 Yes Hispanic American
7,074 Yes
8413 PORT ARTHUR TEACHERS
Port Arthur TX $27,477,953 Yes Black American
3,930 Yes
9496 SP TRAINMEN Houston TX $3,206,362 Yes Black American
719 No
9843 FRIONA TEXAS Friona TX $11,951,277 Yes Hispanic American
2,098 Yes
10174 FIRSTLIGHT El Paso TX $837,221,888 Yes Hispanic American
113,556 Yes
10776 TEACHERS ALLIANCE
Longview TX $1,644,197 Yes Black American
413 Yes
10843 ALL SAINTS CATHOLIC
Fort Worth TX $551,212 Yes Hispanic American
196 Yes
10913 SOUTHWEST RESEARCH CENTER
San Antonio TX $68,008,859 Yes Hispanic American
10,486 Yes
10994 NAFT Pharr TX $64,960,122 Yes Hispanic American
9,452 Yes
11011 LAREDO Laredo TX $120,213,689 Yes Hispanic American
18,317 Yes
11721 SAN PATRICIO COUNTY TEACHERS
Sinton TX $28,259,315 Yes Hispanic American, Native American
3,768 Yes
11927 COASTAL COMMUNITY
Galveston TX $49,065,065 Yes Black American, Hispanic American
8,732 Yes
12108 GOOD STREET BAPTIST CHURCH
Dallas TX $1,041,827 Yes Black American
710 Yes
12200 SAN ANTONIO WATER SYSTEM
San Antonio TX $3,230,156 Yes Hispanic American
1,184 Yes
12426 IBEW LU 278 Corpus Christi TX $2,479,125 Yes Hispanic American
796 Yes
12472 LAREDO FIRE DEPARTMENT
Laredo TX $10,587,733 Yes Hispanic American
1,189 Yes
12859 ST. JOHN DALLAS Dallas TX $418,746 Yes Black American
443 Yes
13765 QUEMADO Quemado TX $1,589,119 Yes Hispanic American
422 Yes
13873 BROWNFIELD Brownfield TX $11,553,627 Yes Black American, Hispanic American
2,574 No
13931 SPOHN HEALTH SYSTEM
Corpus Christi TX $14,163,625 Yes Hispanic American
2,875 No
14001 HILCO Kerrville TX $9,723,250 Yes Asian American, Black American, Hispanic American
1,183 No
14166 COCHRAN COUNTY SCHOOLS
Morton TX $4,126,647 Yes Black American, Hispanic American
694 Yes
14656 LOCAL 24 EMPLOYEES
Houston TX $10,317,675 Yes Black American
2,358 Yes
14734 LA JOYA AREA La Joya TX $45,955,695 Yes Hispanic American
16,272 Yes
15112 STONE TYLER EMPLOYEES
Tyler TX $150,544 Yes Black American,
42 Yes
62
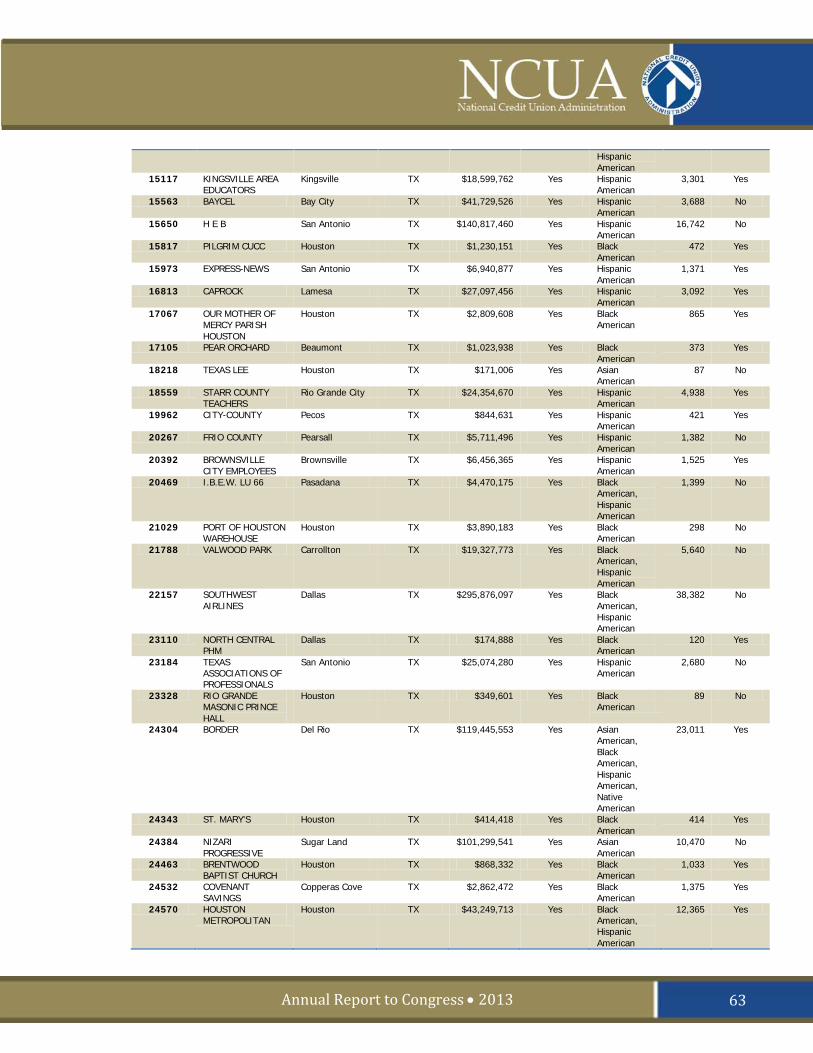
Annual Report to Congress • 2013
Hispanic American
15117 KINGSVILLE AREA EDUCATORS
Kingsville TX $18,599,762 Yes Hispanic American
3,301 Yes
15563 BAYCEL Bay City TX $41,729,526 Yes Hispanic American
3,688 No
15650 H E B San Antonio TX $140,817,460 Yes Hispanic American
16,742 No
15817 PILGRIM CUCC Houston TX $1,230,151 Yes Black American
472 Yes
15973 EXPRESS-NEWS San Antonio TX $6,940,877 Yes Hispanic American
1,371 Yes
16813 CAPROCK Lamesa TX $27,097,456 Yes Hispanic American
3,092 Yes
17067 OUR MOTHER OF MERCY PARISH HOUSTON
Houston TX $2,809,608 Yes Black American
865 Yes
17105 PEAR ORCHARD Beaumont TX $1,023,938 Yes Black American
373 Yes
18218 TEXAS LEE Houston TX $171,006 Yes Asian American
87 No
18559 STARR COUNTY TEACHERS
Rio Grande City TX $24,354,670 Yes Hispanic American
4,938 Yes
19962 CITY-COUNTY Pecos TX $844,631 Yes Hispanic American
421 Yes
20267 FRIO COUNTY Pearsall TX $5,711,496 Yes Hispanic American
1,382 No
20392 BROWNSVILLE CITY EMPLOYEES
Brownsville TX $6,456,365 Yes Hispanic American
1,525 Yes
20469 I.B.E.W. LU 66 Pasadana TX $4,470,175 Yes Black American, Hispanic American
1,399 No
21029 PORT OF HOUSTON WAREHOUSE
Houston TX $3,890,183 Yes Black American
298 No
21788 VALWOOD PARK Carrollton TX $19,327,773 Yes Black American, Hispanic American
5,640 No
22157 SOUTHWEST AIRLINES
Dallas TX $295,876,097 Yes Black American, Hispanic American
38,382 No
23110 NORTH CENTRAL PHM
Dallas TX $174,888 Yes Black American
120 Yes
23184 TEXAS ASSOCIATIONS OF PROFESSIONALS
San Antonio TX $25,074,280 Yes Hispanic American
2,680 No
23328 RIO GRANDE MASONIC PRINCE HALL
Houston TX $349,601 Yes Black American
89 No
24304 BORDER Del Rio TX $119,445,553 Yes Asian American, Black American, Hispanic American, Native American
23,011 Yes
24343 ST. MARY'S Houston TX $414,418 Yes Black American
414 Yes
24384 NIZARI PROGRESSIVE
Sugar Land TX $101,299,541 Yes Asian American
10,470 No
24463 BRENTWOOD BAPTIST CHURCH
Houston TX $868,332 Yes Black American
1,033 Yes
24532 COVENANT SAVINGS
Copperas Cove TX $2,862,472 Yes Black American
1,375 Yes
24570 HOUSTON METROPOLITAN
Houston TX $43,249,713 Yes Black American, Hispanic American
12,365 Yes
63
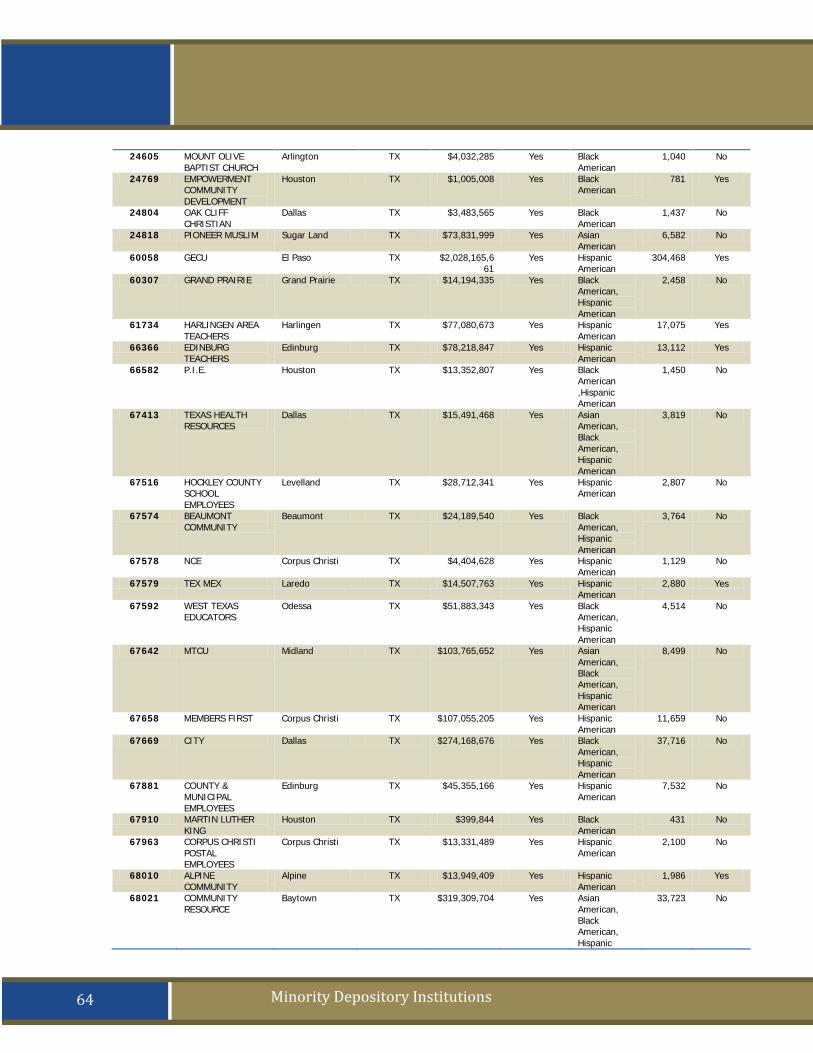
OFEAR Act
Minority Depository Institutions
24605 MOUNT OLIVE BAPTIST CHURCH
Arlington TX $4,032,285 Yes Black American
1,040 No
24769 EMPOWERMENT COMMUNITY DEVELOPMENT
Houston TX $1,005,008 Yes Black American
781 Yes
24804 OAK CLIFF CHRISTIAN
Dallas TX $3,483,565 Yes Black American
1,437 No
24818 PIONEER MUSLIM Sugar Land TX $73,831,999 Yes Asian American
6,582 No
60058 GECU El Paso TX $2,028,165,661
Yes Hispanic American
304,468 Yes
60307 GRAND PRAIRIE Grand Prairie TX $14,194,335 Yes Black American, Hispanic American
2,458 No
61734 HARLINGEN AREA TEACHERS
Harlingen TX $77,080,673 Yes Hispanic American
17,075 Yes
66366 EDINBURG TEACHERS
Edinburg TX $78,218,847 Yes Hispanic American
13,112 Yes
66582 P.I.E. Houston TX $13,352,807 Yes Black American ,Hispanic American
1,450 No
67413 TEXAS HEALTH RESOURCES
Dallas TX $15,491,468 Yes Asian American, Black American, Hispanic American
3,819 No
67516 HOCKLEY COUNTY SCHOOL EMPLOYEES
Levelland TX $28,712,341 Yes Hispanic American
2,807 No
67574 BEAUMONT COMMUNITY
Beaumont TX $24,189,540 Yes Black American, Hispanic American
3,764 No
67578 NCE Corpus Christi TX $4,404,628 Yes Hispanic American
1,129 No
67579 TEX MEX Laredo TX $14,507,763 Yes Hispanic American
2,880 Yes
67592 WEST TEXAS EDUCATORS
Odessa TX $51,883,343 Yes Black American, Hispanic American
4,514 No
67642 MTCU Midland TX $103,765,652 Yes Asian American, Black American, Hispanic American
8,499 No
67658 MEMBERS FIRST Corpus Christi TX $107,055,205 Yes Hispanic American
11,659 No
67669 CITY Dallas TX $274,168,676 Yes Black American, Hispanic American
37,716 No
67881 COUNTY & MUNICIPAL EMPLOYEES
Edinburg TX $45,355,166 Yes Hispanic American
7,532 No
67910 MARTIN LUTHER KING
Houston TX $399,844 Yes Black American
431 No
67963 CORPUS CHRISTI POSTAL EMPLOYEES
Corpus Christi TX $13,331,489 Yes Hispanic American
2,100 No
68010 ALPINE COMMUNITY
Alpine TX $13,949,409 Yes Hispanic American
1,986 Yes
68021 COMMUNITY RESOURCE
Baytown TX $319,309,704 Yes Asian American, Black American, Hispanic
33,723 No
64
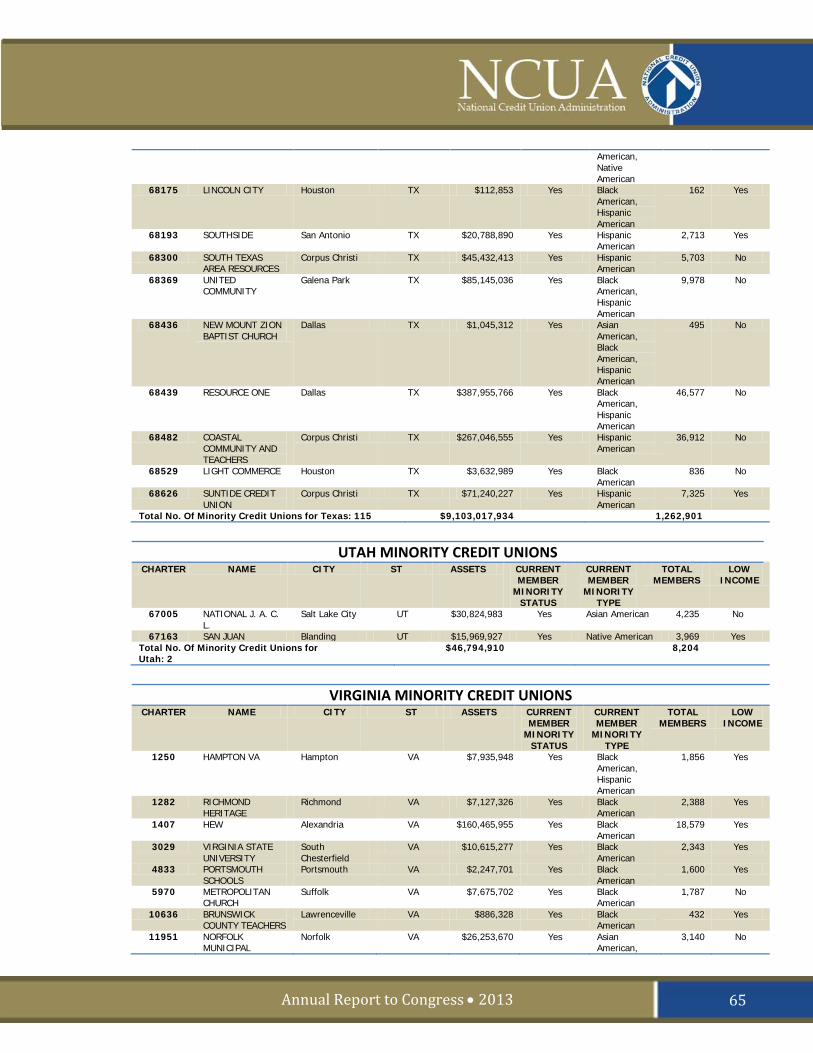
Annual Report to Congress • 2013
American, Native American
68175 LINCOLN CITY Houston TX $112,853 Yes Black American, Hispanic American
162 Yes
68193 SOUTHSIDE San Antonio TX $20,788,890 Yes Hispanic American
2,713 Yes
68300 SOUTH TEXAS AREA RESOURCES
Corpus Christi TX $45,432,413 Yes Hispanic American
5,703 No
68369 UNITED COMMUNITY
Galena Park TX $85,145,036 Yes Black American, Hispanic American
9,978 No
68436 NEW MOUNT ZION BAPTIST CHURCH
Dallas TX $1,045,312 Yes Asian American, Black American, Hispanic American
495 No
68439 RESOURCE ONE Dallas TX $387,955,766 Yes Black American, Hispanic American
46,577 No
68482 COASTAL COMMUNITY AND TEACHERS
Corpus Christi TX $267,046,555 Yes Hispanic American
36,912 No
68529 LIGHT COMMERCE Houston TX $3,632,989 Yes Black American
836 No
68626 SUNTIDE CREDIT UNION
Corpus Christi TX $71,240,227 Yes Hispanic American
7,325 Yes
Total No. Of Minority Credit Unions for Texas: 115 $9,103,017,934 1,262,901
UTAH MINORITY CREDIT UNIONS
CHARTER NAME CITY ST ASSETS CURRENT MEMBER
MINORITY STATUS
CURRENT MEMBER
MINORITY TYPE
TOTAL MEMBERS
LOW INCOME
67005 NATIONAL J. A. C. L.
Salt Lake City UT $30,824,983 Yes Asian American 4,235 No
67163 SAN JUAN Blanding UT $15,969,927 Yes Native American 3,969 Yes Total No. Of Minority Credit Unions for Utah: 2
$46,794,910 8,204
VIRGINIA MINORITY CREDIT UNIONS
CHARTER NAME CITY ST ASSETS CURRENT MEMBER
MINORITY STATUS
CURRENT MEMBER
MINORITY TYPE
TOTAL MEMBERS
LOW INCOME
1250 HAMPTON VA Hampton VA $7,935,948 Yes Black American, Hispanic American
1,856 Yes
1282 RICHMOND HERITAGE
Richmond VA $7,127,326 Yes Black American
2,388 Yes
1407 HEW Alexandria VA $160,465,955 Yes Black American
18,579 Yes
3029 VIRGINIA STATE UNIVERSITY
South Chesterfield
VA $10,615,277 Yes Black American
2,343 Yes
4833 PORTSMOUTH SCHOOLS
Portsmouth VA $2,247,701 Yes Black American
1,600 Yes
5970 METROPOLITAN CHURCH
Suffolk VA $7,675,702 Yes Black American
1,787 No
10636 BRUNSWICK COUNTY TEACHERS
Lawrenceville VA $886,328 Yes Black American
432 Yes
11951 NORFOLK MUNICIPAL
Norfolk VA $26,253,670 Yes Asian American,
3,140 No
65
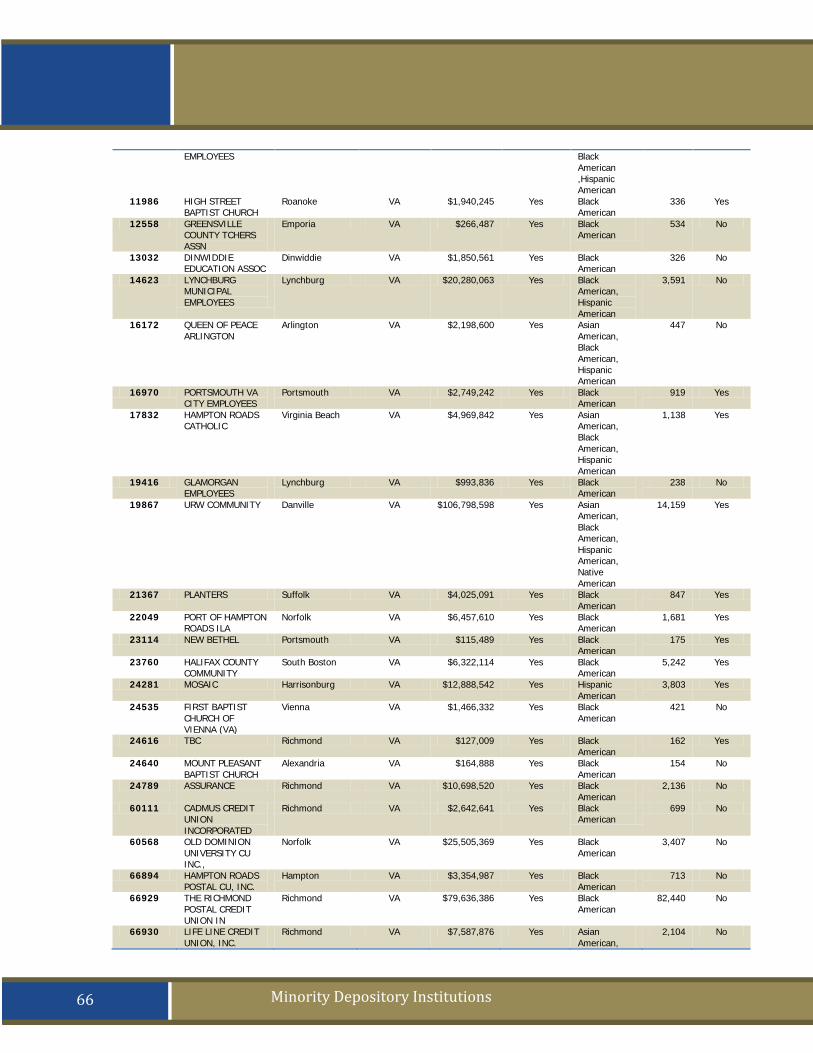
OFEAR Act
Minority Depository Institutions
EMPLOYEES Black American ,Hispanic American
11986 HIGH STREET BAPTIST CHURCH
Roanoke VA $1,940,245 Yes Black American
336 Yes
12558 GREENSVILLE COUNTY TCHERS ASSN
Emporia VA $266,487 Yes Black American
534 No
13032 DINWIDDIE EDUCATION ASSOC
Dinwiddie VA $1,850,561 Yes Black American
326 No
14623 LYNCHBURG MUNICIPAL EMPLOYEES
Lynchburg VA $20,280,063 Yes Black American, Hispanic American
3,591 No
16172 QUEEN OF PEACE ARLINGTON
Arlington VA $2,198,600 Yes Asian American, Black American, Hispanic American
447 No
16970 PORTSMOUTH VA CITY EMPLOYEES
Portsmouth VA $2,749,242 Yes Black American
919 Yes
17832 HAMPTON ROADS CATHOLIC
Virginia Beach VA $4,969,842 Yes Asian American, Black American, Hispanic American
1,138 Yes
19416 GLAMORGAN EMPLOYEES
Lynchburg VA $993,836 Yes Black American
238 No
19867 URW COMMUNITY Danville VA $106,798,598 Yes Asian American, Black American, Hispanic American, Native American
14,159 Yes
21367 PLANTERS Suffolk VA $4,025,091 Yes Black American
847 Yes
22049 PORT OF HAMPTON ROADS ILA
Norfolk VA $6,457,610 Yes Black American
1,681 Yes
23114 NEW BETHEL Portsmouth VA $115,489 Yes Black American
175 Yes
23760 HALIFAX COUNTY COMMUNITY
South Boston VA $6,322,114 Yes Black American
5,242 Yes
24281 MOSAIC Harrisonburg VA $12,888,542 Yes Hispanic American
3,803 Yes
24535 FIRST BAPTIST CHURCH OF VIENNA (VA)
Vienna VA $1,466,332 Yes Black American
421 No
24616 TBC Richmond VA $127,009 Yes Black American
162 Yes
24640 MOUNT PLEASANT BAPTIST CHURCH
Alexandria VA $164,888 Yes Black American
154 No
24789 ASSURANCE Richmond VA $10,698,520 Yes Black American
2,136 No
60111 CADMUS CREDIT UNION INCORPORATED
Richmond VA $2,642,641 Yes Black American
699 No
60568 OLD DOMINION UNIVERSITY CU INC.,
Norfolk VA $25,505,369 Yes Black American
3,407 No
66894 HAMPTON ROADS POSTAL CU, INC.
Hampton VA $3,354,987 Yes Black American
713 No
66929 THE RICHMOND POSTAL CREDIT UNION IN
Richmond VA $79,636,386 Yes Black American
82,440 No
66930 LIFE LINE CREDIT UNION, INC.
Richmond VA $7,587,876 Yes Asian American,
2,104 No
66
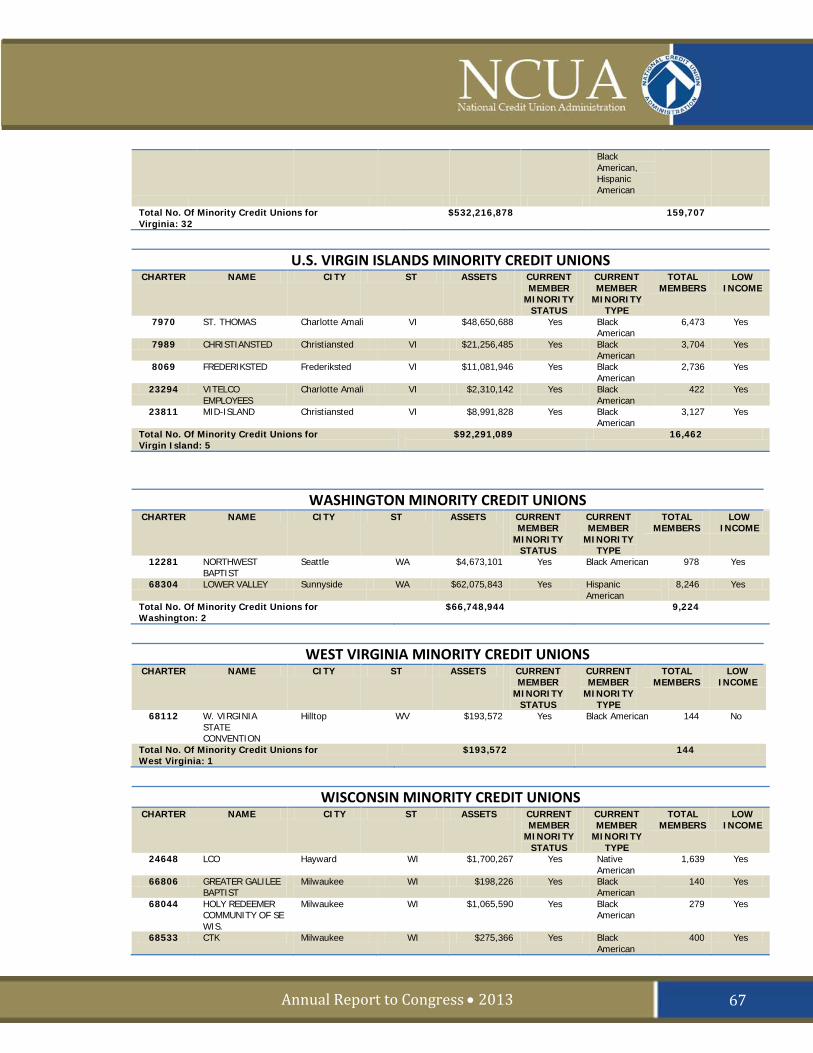
Annual Report to Congress • 2013
Black American, Hispanic American
Total No. Of Minority Credit Unions for Virginia: 32
$532,216,878 159,707
U.S. VIRGIN ISLANDS MINORITY CREDIT UNIONS
CHARTER NAME CITY ST ASSETS CURRENT MEMBER
MINORITY STATUS
CURRENT MEMBER
MINORITY TYPE
TOTAL MEMBERS
LOW INCOME
7970 ST. THOMAS Charlotte Amali VI $48,650,688 Yes Black American
6,473 Yes
7989 CHRISTIANSTED Christiansted VI $21,256,485 Yes Black American
3,704 Yes
8069 FREDERIKSTED Frederiksted VI $11,081,946 Yes Black American
2,736 Yes
23294 VITELCO EMPLOYEES
Charlotte Amali VI $2,310,142 Yes Black American
422 Yes
23811 MID-ISLAND Christiansted VI $8,991,828 Yes Black American
3,127 Yes
Total No. Of Minority Credit Unions for Virgin Island: 5
$92,291,089 16,462
WASHINGTON MINORITY CREDIT UNIONS CHARTER NAME CITY ST ASSETS CURRENT
MEMBER MINORITY
STATUS
CURRENT MEMBER
MINORITY TYPE
TOTAL MEMBERS
LOW INCOME
12281 NORTHWEST BAPTIST
Seattle WA $4,673,101 Yes Black American 978 Yes
68304 LOWER VALLEY Sunnyside WA $62,075,843 Yes Hispanic American
8,246 Yes
Total No. Of Minority Credit Unions for Washington: 2
$66,748,944 9,224
WEST VIRGINIA MINORITY CREDIT UNIONS
CHARTER NAME CITY ST ASSETS CURRENT MEMBER
MINORITY STATUS
CURRENT MEMBER
MINORITY TYPE
TOTAL MEMBERS
LOW INCOME
68112 W. VIRGINIA STATE CONVENTION
Hilltop WV $193,572 Yes Black American 144 No
Total No. Of Minority Credit Unions for West Virginia: 1
$193,572 144
WISCONSIN MINORITY CREDIT UNIONS
CHARTER NAME CITY ST ASSETS CURRENT MEMBER
MINORITY STATUS
CURRENT MEMBER
MINORITY TYPE
TOTAL MEMBERS
LOW INCOME
24648 LCO Hayward WI $1,700,267 Yes Native American
1,639 Yes
66806 GREATER GALILEE BAPTIST
Milwaukee WI $198,226 Yes Black American
140 Yes
68044 HOLY REDEEMER COMMUNITY OF SE WIS.
Milwaukee WI $1,065,590 Yes Black American
279 Yes
68533 CTK Milwaukee WI $275,366 Yes Black American
400 Yes
67
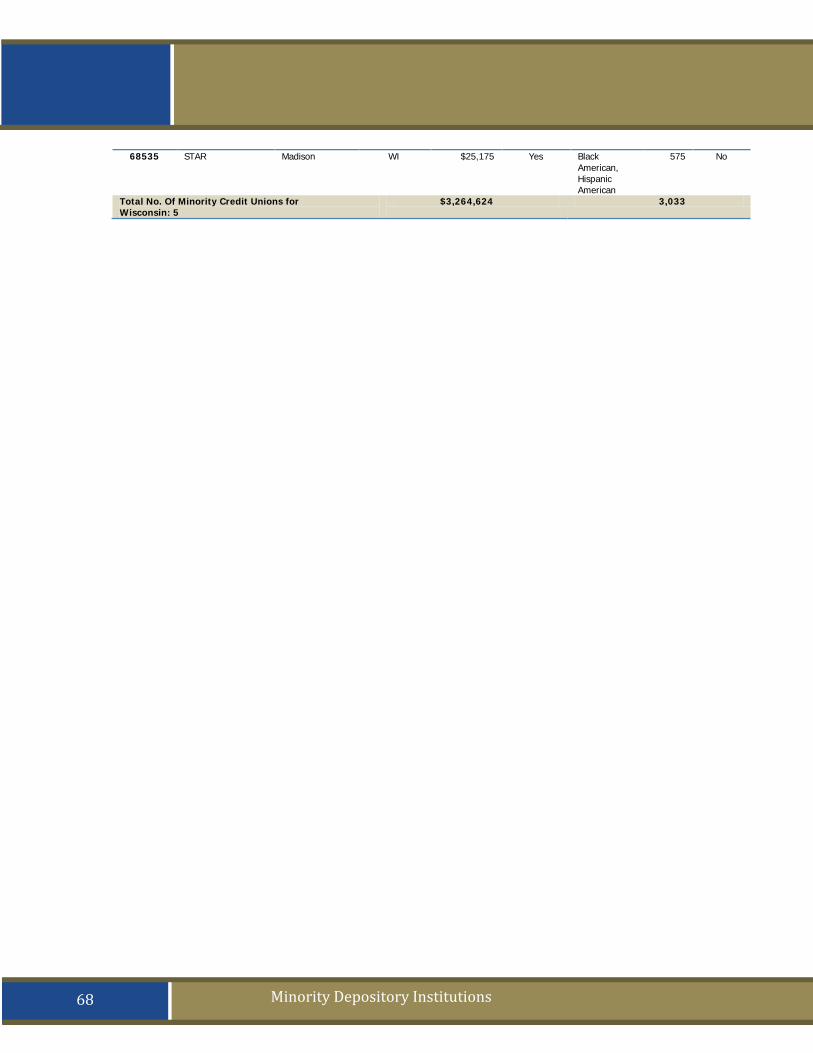
OFEAR Act
Minority Depository Institutions
68535 STAR Madison WI $25,175 Yes Black American, Hispanic American
575 No
Total No. Of Minority Credit Unions for Wisconsin: 5
$3,264,624 3,033
68
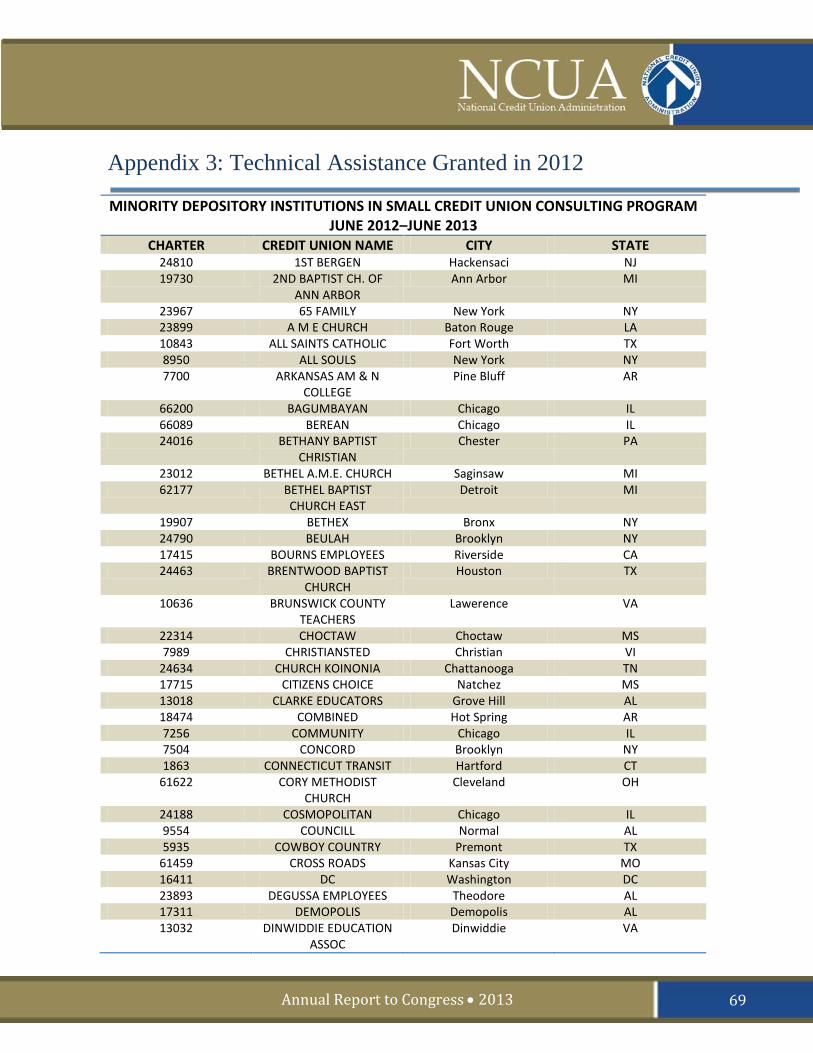
Annual Report to Congress • 2013
Appendix 3: Technical Assistance Granted in 2012
MINORITY DEPOSITORY INSTITUTIONS IN SMALL CREDIT UNION CONSULTING PROGRAM JUNE 2012–JUNE 2013
CHARTER CREDIT UNION NAME CITY STATE 24810 1ST BERGEN Hackensaci NJ 19730 2ND BAPTIST CH. OF
ANN ARBOR Ann Arbor MI
23967 65 FAMILY New York NY 23899 A M E CHURCH Baton Rouge LA 10843 ALL SAINTS CATHOLIC Fort Worth TX 8950 ALL SOULS New York NY 7700 ARKANSAS AM & N
COLLEGE Pine Bluff AR
66200 BAGUMBAYAN Chicago IL 66089 BEREAN Chicago IL 24016 BETHANY BAPTIST
CHRISTIAN Chester PA
23012 BETHEL A.M.E. CHURCH Saginsaw MI 62177 BETHEL BAPTIST
CHURCH EAST Detroit MI
19907 BETHEX Bronx NY 24790 BEULAH Brooklyn NY 17415 BOURNS EMPLOYEES Riverside CA 24463 BRENTWOOD BAPTIST
CHURCH Houston TX
10636 BRUNSWICK COUNTY TEACHERS
Lawerence VA
22314 CHOCTAW Choctaw MS 7989 CHRISTIANSTED Christian VI
24634 CHURCH KOINONIA Chattanooga TN 17715 CITIZENS CHOICE Natchez MS 13018 CLARKE EDUCATORS Grove Hill AL 18474 COMBINED Hot Spring AR 7256 COMMUNITY Chicago IL 7504 CONCORD Brooklyn NY 1863 CONNECTICUT TRANSIT Hartford CT
61622 CORY METHODIST CHURCH
Cleveland OH
24188 COSMOPOLITAN Chicago IL 9554 COUNCILL Normal AL 5935 COWBOY COUNTRY Premont TX
61459 CROSS ROADS Kansas City MO 16411 DC Washington DC 23893 DEGUSSA EMPLOYEES Theodore AL 17311 DEMOPOLIS Demopolis AL 13032 DINWIDDIE EDUCATION
ASSOC Dinwiddie VA
69
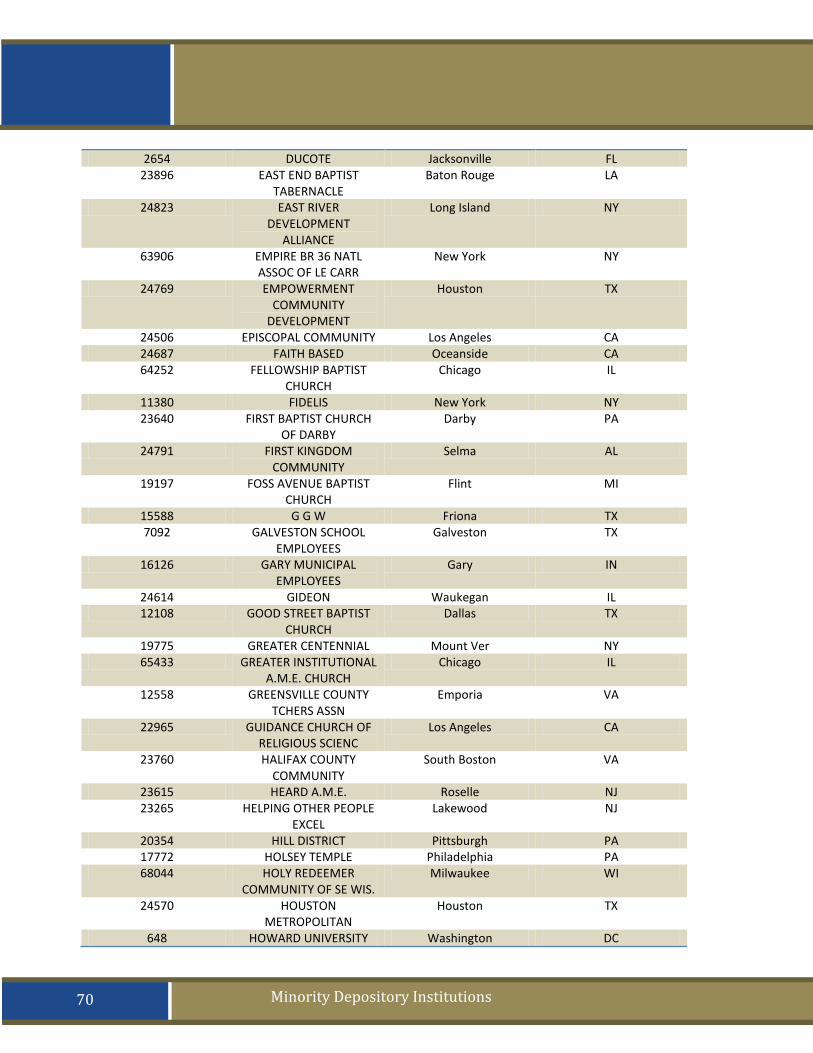
OFEAR Act
Minority Depository Institutions
2654 DUCOTE Jacksonville FL 23896 EAST END BAPTIST
TABERNACLE Baton Rouge LA
24823 EAST RIVER DEVELOPMENT
ALLIANCE
Long Island NY
63906 EMPIRE BR 36 NATL ASSOC OF LE CARR
New York NY
24769 EMPOWERMENT COMMUNITY
DEVELOPMENT
Houston TX
24506 EPISCOPAL COMMUNITY Los Angeles CA 24687 FAITH BASED Oceanside CA 64252 FELLOWSHIP BAPTIST
CHURCH Chicago IL
11380 FIDELIS New York NY 23640 FIRST BAPTIST CHURCH
OF DARBY Darby PA
24791 FIRST KINGDOM COMMUNITY
Selma AL
19197 FOSS AVENUE BAPTIST CHURCH
Flint MI
15588 G G W Friona TX 7092 GALVESTON SCHOOL
EMPLOYEES Galveston TX
16126 GARY MUNICIPAL EMPLOYEES
Gary IN
24614 GIDEON Waukegan IL 12108 GOOD STREET BAPTIST
CHURCH Dallas TX
19775 GREATER CENTENNIAL Mount Ver NY 65433 GREATER INSTITUTIONAL
A.M.E. CHURCH Chicago IL
12558 GREENSVILLE COUNTY TCHERS ASSN
Emporia VA
22965 GUIDANCE CHURCH OF RELIGIOUS SCIENC
Los Angeles CA
23760 HALIFAX COUNTY COMMUNITY
South Boston VA
23615 HEARD A.M.E. Roselle NJ 23265 HELPING OTHER PEOPLE
EXCEL Lakewood NJ
20354 HILL DISTRICT Pittsburgh PA 17772 HOLSEY TEMPLE Philadelphia PA 68044 HOLY REDEEMER
COMMUNITY OF SE WIS. Milwaukee WI
24570 HOUSTON METROPOLITAN
Houston TX
648 HOWARD UNIVERSITY Washington DC
70
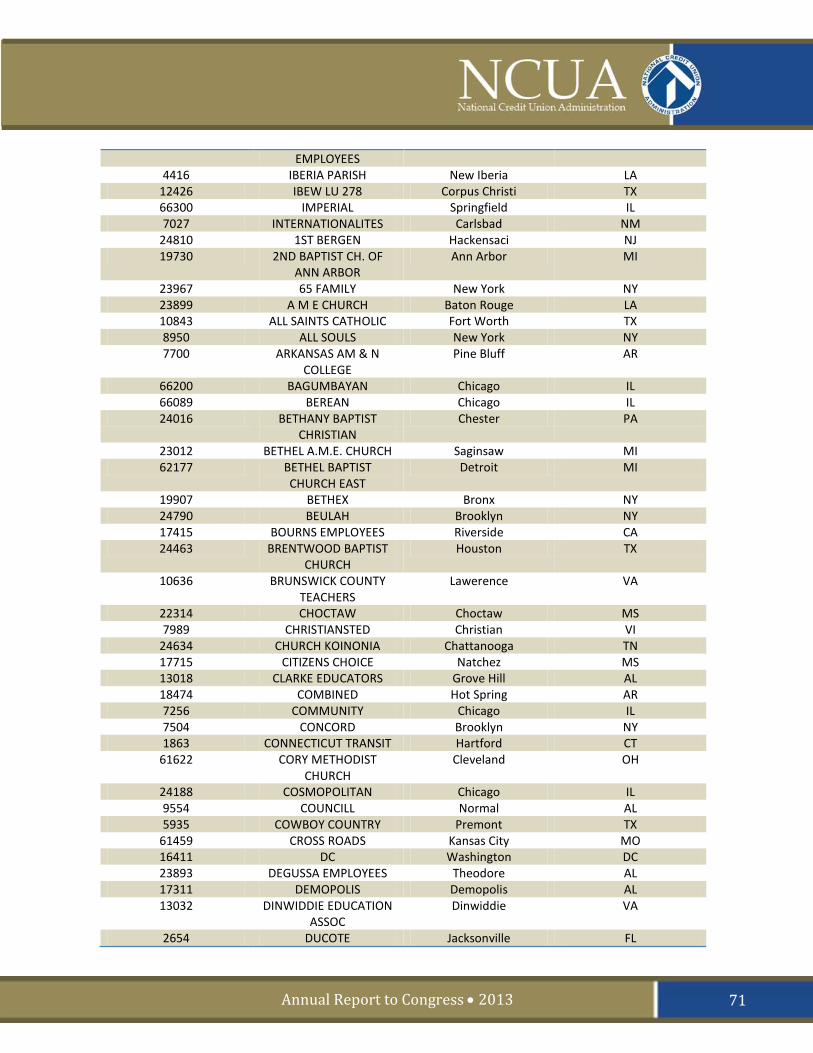
Annual Report to Congress • 2013
EMPLOYEES 4416 IBERIA PARISH New Iberia LA
12426 IBEW LU 278 Corpus Christi TX 66300 IMPERIAL Springfield IL 7027 INTERNATIONALITES Carlsbad NM
24810 1ST BERGEN Hackensaci NJ 19730 2ND BAPTIST CH. OF
ANN ARBOR Ann Arbor MI
23967 65 FAMILY New York NY 23899 A M E CHURCH Baton Rouge LA 10843 ALL SAINTS CATHOLIC Fort Worth TX 8950 ALL SOULS New York NY 7700 ARKANSAS AM & N
COLLEGE Pine Bluff AR
66200 BAGUMBAYAN Chicago IL 66089 BEREAN Chicago IL 24016 BETHANY BAPTIST
CHRISTIAN Chester PA
23012 BETHEL A.M.E. CHURCH Saginsaw MI 62177 BETHEL BAPTIST
CHURCH EAST Detroit MI
19907 BETHEX Bronx NY 24790 BEULAH Brooklyn NY 17415 BOURNS EMPLOYEES Riverside CA 24463 BRENTWOOD BAPTIST
CHURCH Houston TX
10636 BRUNSWICK COUNTY TEACHERS
Lawerence VA
22314 CHOCTAW Choctaw MS 7989 CHRISTIANSTED Christian VI
24634 CHURCH KOINONIA Chattanooga TN 17715 CITIZENS CHOICE Natchez MS 13018 CLARKE EDUCATORS Grove Hill AL 18474 COMBINED Hot Spring AR 7256 COMMUNITY Chicago IL 7504 CONCORD Brooklyn NY 1863 CONNECTICUT TRANSIT Hartford CT
61622 CORY METHODIST CHURCH
Cleveland OH
24188 COSMOPOLITAN Chicago IL 9554 COUNCILL Normal AL 5935 COWBOY COUNTRY Premont TX
61459 CROSS ROADS Kansas City MO 16411 DC Washington DC 23893 DEGUSSA EMPLOYEES Theodore AL 17311 DEMOPOLIS Demopolis AL 13032 DINWIDDIE EDUCATION
ASSOC Dinwiddie VA
2654 DUCOTE Jacksonville FL
71
OFEAR Act
Minority Depository Institutions
23896 EAST END BAPTIST TABERNACLE
Baton Rouge LA
24823 EAST RIVER DEVELOPMENT
ALLIANCE
Long Island NY
63906 EMPIRE BR 36 NATL ASSOC OF LE CARR
New York NY
24769 EMPOWERMENT COMMUNITY
DEVELOPMENT
Houston TX
24506 EPISCOPAL COMMUNITY Los Angeles CA 24687 FAITH BASED Oceanside CA 64252 FELLOWSHIP BAPTIST
CHURCH Chicago IL
11380 FIDELIS New York NY 23640 FIRST BAPTIST CHURCH
OF DARBY Darby PA
24791 FIRST KINGDOM COMMUNITY
Selma AL
19197 FOSS AVENUE BAPTIST CHURCH
Flint MI
15588 G G W Friona TX 7092 GALVESTON SCHOOL
EMPLOYEES Galveston TX
16126 GARY MUNICIPAL EMPLOYEES
Gary IN
24614 GIDEON Waukegan IL 12108 GOOD STREET BAPTIST
CHURCH Dallas TX
19775 GREATER CENTENNIAL Mount Ver NY 65433 GREATER INSTITUTIONAL
A.M.E. CHURCH Chicago IL
12558 GREENSVILLE COUNTY TCHERS ASSN
Emporia VA
22965 GUIDANCE CHURCH OF RELIGIOUS SCIENC
Los Angeles CA
23760 HALIFAX COUNTY COMMUNITY
South Boston VA
23615 HEARD A.M.E. Roselle NJ 23265 HELPING OTHER PEOPLE
EXCEL Lakewood NJ
20354 HILL DISTRICT Pittsburgh PA 17772 HOLSEY TEMPLE Philadelphia PA 68044 HOLY REDEEMER
COMMUNITY OF SE WIS. Milwaukee WI
24570 HOUSTON METROPOLITAN
Houston TX
648 HOWARD UNIVERSITY EMPLOYEES
Washington DC
72
Annual Report to Congress • 2013
4416 IBERIA PARISH New Iberia LA 12426 IBEW LU 278 Corpus Christi TX 66300 IMPERIAL Springfield IL 7027 INTERNATIONALITES Carlsbad NM
15673 ISRAEL METHCOMM Chicago IL 14537 JAMES WARD, JR. Jennings LA 12467 JONES TABERNACLE Philadelphia PA 7684 JPFCE Jackson MS
15117 KINGSVILLE AREA EDUCATORS
Kingsville TX
20720 L. A. MISSION San Fernando CA 4370 LANGSTON Langston OK
24648 LCO Hayward WI 68529 LIGHT COMMERCE Houston TX 68175 LINCOLN CITY Houston TX 3491 LINCOLN USDA Lincoln NE
24266 M.A.B.C. Philadelphia PA 8186 MEADOW GOLD DAIRIES Honolulu HI
15433 MEMPHIS MUNICIPAL EMPLOYEES
Memphis TN
1546 MERCER COUNTY IMPROVEMENT
AUTHORITY
Hamilton NJ
60993 METROPOLITAN CHURCH OF GOD
Detroit MI
65659 MICHOUD New Orleans LA 19170 MILFORD MEMORIAL Milford DE 62935 MONROE Monroe LA 17334 MORTON WEEKS Lydia LA 24640 MOUNT PLEASANT
BAPTIST CHURCH Alexandria VA
18546 MOUNT ZION A M E CHURCH
Trenton NJ
856 MOUNTAIN STAR El Paso TX 15108 MUNA Meridan MS 7521 NAVFAC Honolulu HI
24167 NEW COMMUNITY Newark NJ 24784 NEW COVENANT
DOMINION Bronx NY
12633 NEW MEXICO CORRECTIONAL EMPL
Santa Fe NM
16858 NEW PILGRIM Birmingham AL 24030 NEW RISING STAR Detroit MI 4562 NEW YORK METRO New York NY
12281 NORTHWEST BAPTIST Seattle WA 68603 NUEVA ESPERANZA
COMMUNITY Toledo OH
5987 OCNAC #1 Jersey City NJ 60923 PARK MANOR CHRISTIAN Chicago IL
73
OFEAR Act
Minority Depository Institutions
CHURCH 23658 PAUL QUINN Flushing NY 17105 PEAR ORCHARD Beaumont TX 10767 PEOPLES IND CHURCH Los Angeles CA 15817 PILGRIM CUCC Houston TX 16728 PINN MEMORIAL Philadelphia PA 13120 PITTSBURG EMPLOYEES Pittsburgh CA 16386 POINTE COUPEE
EDUCATION ASSOC New Roads LA
22049 PORT OF HAMPTON ROADS ILA
Norfolk VA
16970 PORTSMOUTH VA CITY EMPLOYEES
Portsmouth VA
2077 PRAIRIE VIEW Prairie View TX 22344 QUEENS CLUSTER Oakland NY 13765 QUEMADO Quemado TX 68195 RENAISSANCE
COMMUNITY DEVELOPMENT C
Somerset NJ
1282 RICHMOND HERITAGE Richmond VA 6204 RIVER BEND South Beach IN 2538 RTA HAYDEN E Cleveland OH
17208 RUNNELLS HOSPITAL EMPLOYEES
Berkeley NJ
13248 S H P E Greensbury LA 15154 SALEM BAPTIST Jersey City NJ 12200 SAN ANTONIO WATER
SYSTEM San Antonio TX
67163 SAN JUAN Blanding UT
9974 SHELBY/BOLIVAR COUNTY
Boyle MS
13001 SHERATON HAWAII Honolulu HI 15454 SHILOH ENGLEWOOD Chicago IL
65550 SOUTH DIVISION Evergreen IL 8237 SOUTH TEXAS McAllen TX 7024 SOUTH TEXAS REGIONAL Laredo TX 5839 SOUTHEAST LOUISIANA
VETERANS HEALTH New Orleans LA
23177 SOUTHERN BAPTIST CHURCH OF NEW YORK
New York NY
68193 SOUTHSIDE San Antonio TX
18858 SPC BROOKLYN Brooklyn NY 12137 ST. JOHNS AME
BIRMINGHAM Birmingham AL
15261 ST. LANDRY PARISH Opelousa LA
61566 ST. MARK Chicago IL
74
Annual Report to Congress • 2013
5022 ST. MARKS New York NY 14058 ST. MARTIN DE PORRES
PARISH Chicago IL
24343 ST. MARY'S Houston TX 8295 ST. MONICA Gary IN
19046 ST. PAULS Philadelphia PA
7172 ST. PHILIP'S CHURCH New York NY 20890 STEPHENS COUNTY
COMMUNITY Toccoa GA
4393 SUNKIST EMPLOYEES Van Nuys CA
22414 T.P.C. EMPLOYEES Tupelo MS 14103 TABERNACLE Augusta GA
149 TACOMIS Washington DC 22196 TAMPA
LONGSHOREMEN'S Tampa FL
21263 TAYLOR MEMORIAL UNITED METHODIST
Oakland CA
10776 TEACHERS ALLIANCE Longview TX 20038 THE MOUNT LEBANON Baltimore MD
21535 THE TRIUMPH BAPTIST Philadelphia PA 5352 TOLEDO TEAMSTERS Toledo OH
24578 TOLEDO URBAN Toledo OH 16834 TOWN OF PALM BEACH West Palm Fl
20495 TRANSFIGURATION MANHATTAN
New York NY
23540 TULANE/LOYOLA New Orleans LA 22219 U B C SOUTHERN
COUNCIL INDUSTRIA WO Minden LA
1601 U S PIPE BESSEMER EMPLOYEES
Bessemer AL
24767 UNIFIED HOMEOWNERS OF ILLINOIS
Chicago IL
11702 UNION SETTLEMENT New York NY 3714 UNIVERSITY
SETTLEMENT New York NY
63468 VALLEY EDUCATORS Alamosa CO
3879 W. K. Belleville NJ 65726 WEST DENVER
COMMUNITY Denver CO
9603 WOR CO Pocomoke MD
Total Minority Credit Unions: 167
75
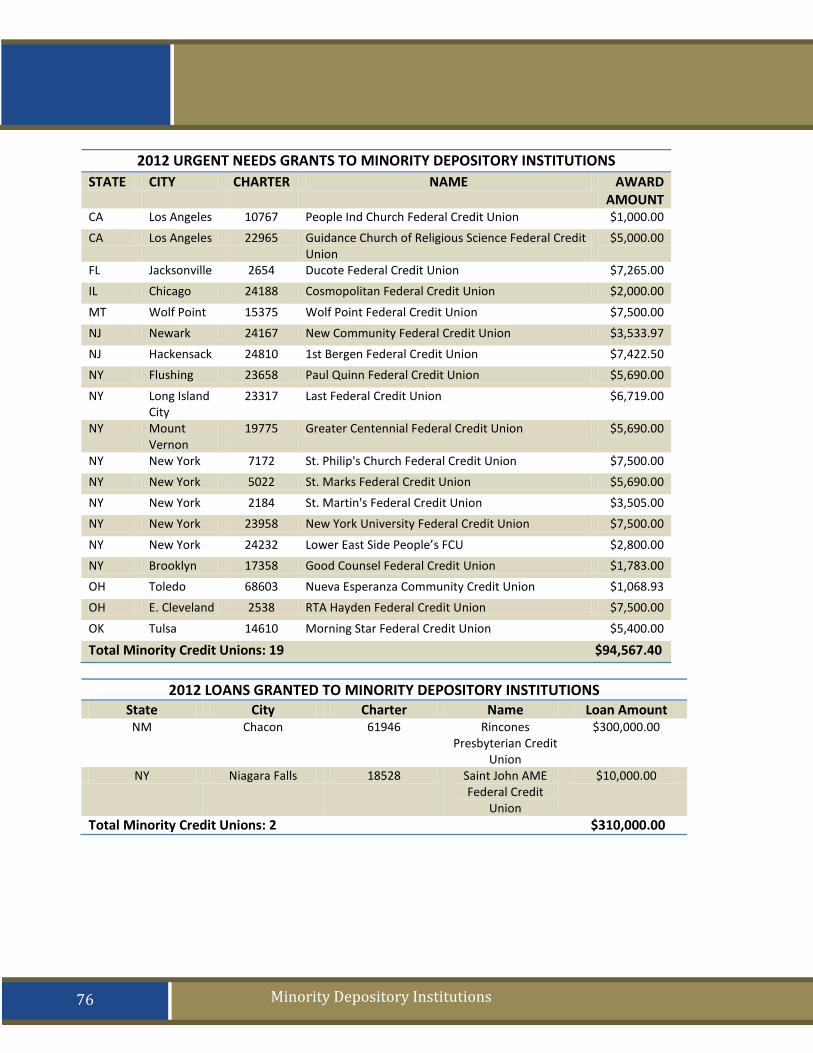
OFEAR Act
Minority Depository Institutions
2012 URGENT NEEDS GRANTS TO MINORITY DEPOSITORY INSTITUTIONS STATE CITY CHARTER NAME AWARD
AMOUNT CA Los Angeles 10767 People Ind Church Federal Credit Union $1,000.00 CA Los Angeles 22965 Guidance Church of Religious Science Federal Credit
Union $5,000.00
FL Jacksonville 2654 Ducote Federal Credit Union $7,265.00 IL Chicago 24188 Cosmopolitan Federal Credit Union $2,000.00
MT Wolf Point 15375 Wolf Point Federal Credit Union $7,500.00 NJ Newark 24167 New Community Federal Credit Union $3,533.97 NJ Hackensack 24810 1st Bergen Federal Credit Union $7,422.50 NY Flushing 23658 Paul Quinn Federal Credit Union $5,690.00
NY Long Island City
23317 Last Federal Credit Union $6,719.00
NY Mount Vernon
19775 Greater Centennial Federal Credit Union $5,690.00
NY New York 7172 St. Philip's Church Federal Credit Union $7,500.00 NY New York 5022 St. Marks Federal Credit Union $5,690.00 NY New York 2184 St. Martin's Federal Credit Union $3,505.00 NY New York 23958 New York University Federal Credit Union $7,500.00
NY New York 24232 Lower East Side People’s FCU $2,800.00 NY Brooklyn 17358 Good Counsel Federal Credit Union $1,783.00 OH Toledo 68603 Nueva Esperanza Community Credit Union $1,068.93 OH E. Cleveland 2538 RTA Hayden Federal Credit Union $7,500.00
OK Tulsa 14610 Morning Star Federal Credit Union $5,400.00
Total Minority Credit Unions: 19 $94,567.40
2012 LOANS GRANTED TO MINORITY DEPOSITORY INSTITUTIONS State City Charter Name Loan Amount NM Chacon 61946 Rincones
Presbyterian Credit Union
$300,000.00
NY Niagara Falls 18528 Saint John AME Federal Credit
Union
$10,000.00
Total Minority Credit Unions: 2 $310,000.00
76

Annual Report to Congress • 2013
2012 GRANT AWARDS FOR MINORITY DEPOSITORY INSTITUTIONS State City Charter Name Grant Award
AL Phenix City 13852 Phenix Pride Federal Credit
Union
$21,928.00
AL Montgomery 14314 Tri-Rivers Federal Credit Union
$5,000.00
CA Los Angeles 14499 Cal State L.A. Federal Credit
Union
$16,770.00
CA Santa Cruz 64029 Santa Cruz Community Credit
Union
$17,024.88
CA Three Rivers 64122 Valley Oak Credit Union
$25,000.00
CO Antonito 65471 Guadalupe Parish Credit Union
$18,512.66
GA Atlanta 67505 1st Choice Credit Union
$7,222.00
IL Urbana 68472 Canaan Credit Union
$25,000.00
IL Chicago 60923 Park Manor Christian Church
Credit Union
$3,800.00
IN Gary 8295 St. Monica Federal Credit Union
$13,475.00
LA New Iberia 4416 Iberia Parish Credit Union
$8,629.99
LA Monroe 1725 Monroe Telco Federal Credit
Union
$3,000.00
LA Simsboro 20415 Piney Hills Federal Credit Union
$15,837.00
LA New Orleans 2056 Sewerage & Water Board Employees
Federal Credit Union
$20,000.00
LA New Orleans 23540 Tulane/Loyola Federal Credit
Union
$5,000.00
MD Baltimore 20038 The Mount Lebanon Federal
Credit Union
$1,100.00
MI Flint 61641 FM Financial Credit Union
$21,972.00
MO Saint Louis 60400 St. Louis Community Credit
Union
$2,180.00
MS Jackson 63442 Mississippi Public $20,950.00
77

OFEAR Act
Minority Depository Institutions
Employees Credit Union
NC Durham 24802 Self-Help Federal Credit Union
$6,428.42
NJ Hackensack 24810 1st Bergen Federal Credit Union
$25,000.00
NM Santa Fe 66149 Guadalupe Credit Union
$10,000.00
NY Bronx 19907 Bethex Federal Credit Union
$14,600.00
NY Long Isl. City 24823 East River Development
Alliance Federal Credit Union
$17,000.00
NY Bronx 24740 Love Gospel Assembly Federal
Credit Union
$23,155.00
NY New York 24232 Lower East Side People's Federal
Credit Union
$6,500.00
NY Flushing 23658 Paul Quinn Federal Credit Union
$10,543.00
NY New York 3714 University Settlement Federal
Credit Union
$9,725.00
SC Greenwood 17831 Self Memorial Hospital Federal
Credit Union
$25,000.00
TX Del Rio 24304 Border Federal Credit Union
$21,426.00
TX Houston 24463 Brentwood Baptist Church Federal
Credit Union
$7,400.00
TX Galveston 11927 Coastal Community Federal Credit
Union
$8,100.00
TX El Paso 10174 Firstlight Federal Credit Union
$24,534.00
TX Corpus Christi 12426 IBEW LU 278 Federal Credit
Union
$15,135.00
TX Kingsville 1879 Kingsville Community Federal
Credit Union
$2,000.00
TX Laredo 11011 Laredo Federal Credit Union
$23,500.00
TX San Antonio 3064 Select Federal Credit Union
$16,411.98
Total Minority Credit Unions: 37 $518,859.93
78