Embed Size (px)
Citation preview
National Culture and Stock Price Crash Risk∗
Tung Lam Dang† Robert Faff‡ Luong Hoang Luong§ Lily Nguyen¶
First version: January, 2016This version: January, 2017
∗Corresponding author: Lily Nguyen. Nguyen gratefully acknowledges the financial support from theAustralian Research Council (ARC) to this project.†Department of Finance, The University of Danang, Danang, Vietnam, [email protected], +84
9 1585 8458.‡UQ Business School, The University of Queensland, Australia, [email protected], +61 7 3346
8055.§UNSW Business School, The University of New South Wales, Australia,
[email protected], +61 3 9466 8035.¶La Trobe Business School, La Trobe University, Australia, [email protected], +61 3 947
93971.

National Culture and Stock Price Crash Risk
Abstract
We examine the relation between individualism and stock price crash risk. Using a sample of 36
countries over the period 2000–2009, we find that firms in individualistic cultures are associated
with higher stock price crash risk. We further explore possible explanations for this positive
effect of individualism on stock price crash. We find that individualism instills confidence in
both traders and managers, whose aggressive trading and bad-news hoarding lead to stock price
crash risk. Overall, our findings suggest that national culture is an important determinant of
stock price crash risk.
JEL Classifications: G12; G15.
Keywords: National culture; Individualism; Stock price crash risk.
1 Introduction
Stock price crash risk refers to the likelihood of a sudden, drastic decline in stock price, which
captures asymmetry in risk attributes and thus is important for investment decisions and risk
management. One stream of literature attributes stock price crashes to excessive trading behav-
ior of overconfident investors, causing excess volatility and possible crashes (e.g., Chen et al.,
2001; Hong and Stein, 2003). Another stream of literature (e.g., Hutton et al., 2009; Jin and
Myers, 2006; Kothari et al., 2009) shows that stock price crashes result from managers’ hoarding
of bad news, a behavior that leads to stock price crashes if bad news is accumulated beyond
a threshold level. Given that the effect of culture on the behavior of individuals is well docu-
mented in the literature (North, 1990; Williamson, 2000), the question whether culture affects
the trading behavior of investors and bad-news hoarding behavior of managers remains largely
unanswered. We fill this gap by examining the relation between culture and stock price crash
risk.
We follow existing literature (e.g., Liang Shao, 2010) and use Hofstede (2001)’s individualism
index as a proxy for national culture because of its dominant position in cross-cultural studies.
According to Hofstede (2001), individualism reflects the degree to which people focus on their
internal attributes, such as their own abilities, to differentiate themselves from others. Using a
sample of 19,080 firms from 36 countries over a period from 2000 to 2009, we find that individ-
ualism has a positive effect on stock price crash risk. This effect remains valid under various
robustness checks including an instrumental variable (IV) approach and a hierarchical linear
estimation model. Our findings suggest that firms headquartered in individualistic countries
are associated with higher stock price crash risk.
After establishing a positive effect of individualism and stock price crash risk, we turn to ex-
ploring possible mechanisms under which individualism leads to stock price crash risk. Previous
research (e.g., Chui et al., 2010; Ferris et al., 2013; Kagitcibasi, 1997; Markus and Kitayama,
1991) shows that individualistic cultures engender overconfidence, the tendency of individuals
to think that they are better than they actually are in terms of several individual characteris-
tics such as ability, judgment, or prospects for successful life outcomes. We consider two ways
in which individualism has a positive effect on stock price crash risk through overconfidence:
overconfidence of traders and overconfidence of managers.
First, we examine whether the positive effect of individualism on stock price crash risk
1
stems from trading activities by overconfident investors. It can be argued that traders from
individualistic cultures are more overconfident because research has shown that people from
individualistic cultures tend to be more overconfident (e.g., Kagitcibasi, 1997; Markus and Ki-
tayama, 1991). In addition, trading activities of overconfident traders can lead to higher stock
price risk. Overconfident traders often overestimate the accuracy of their own evaluations re-
sulting in an underestimation of risk and increasing the differences of opinions among them,
leading to excessive trading and excess volatility (Grinblatt and Keloharju, 2009; Markus and
Kitayama, 1991; Odean, 1998; Statman et al., 2006). Therefore, excessive trading of overconfi-
dent traders and excess volatility can increase stock price crash risk. Indeed, Hong and Stein
(2003) theoretically show that a stock price crash is caused by differences in opinions of in-
vestors, which is a form of overconfidence whereby each investor irrationally thinks that his
private signal is more precise than the others’.
We therefore argue that if individualism instills overconfidence in traders whose excessive
trading leads to stock price crashes, then the positive effect of individualism on stock price crash
risk should be stronger where the presence of overconfident traders are most likely in evidence.
Given that behavioral finance models predict higher trading volume in the markets where there
are more overconfident traders (e.g., Odean, 1998), we use trading volume as a proxy for the
presence of overconfident traders and find that the positive relation between individualism
and stock price crash risk becomes more pronounced in stocks with higher trading volume,
which supports our conjecture that one way individualism has a positive effect on stock price
crash risk is through trading activities by investors whose individualistic cultures engender their
overconfidence.
Second, the positive effect of individualism on stock price crash risk can also arise from bad-
news hoarding behavior of overconfident managers. Since people from individualistic cultures
tend to be more overconfident (e.g., Kagitcibasi, 1997; Markus and Kitayama, 1991), it can be
argued that managers from individualistic cultures are more likely to be overconfident. There-
fore, if these managers engage in bad-news hoarding activities, it can lead to higher stock price
crash risk. Overconfident managers often overestimate the returns to and their own ability to
control the outcomes of the investment projects that they undertake, as well as ignoring or
explaining away privately observed negative feedback on such projects and engaging in corpo-
rate risk-taking (e.g., Heaton, 2002; Malmendier and Tate, 2005, 2008; Malmendier et al., 2011).
Therefore, if overconfident managers misperceive ongoing negative NPV projects as value creat-
2
ing and continue these projects for extended period of time, poor performance of these projects
will accumulate, and, beyond a tipping point, will lead to stock price crashes.
Existing literature has provided support for bad-news stockpiling by overconfident managers
from different perspectives. Ahmed and Duellman (2013) find that overconfident managers tend
to delay loss recognition, a form of bad-news hoarding behavior. Schrand and Zechman (2012)
find that earnings misstatements, another form of bad-news hoarding, are largely a result of
managerial overconfidence because managers are overoptimistic that future performance will
be sufficient to cover the reversal or that the misstatements will go undetected. As a result, a
firm’s “bad news” could be withheld for too long and its bad performance accumulates, making
its future stock price crashes more likely. Using the U.S. sample, Kim et al. (2016) document
that compared with firms with non-overconfident managers, firms with overconfident managers
are associated with higher stock price crash risk.
Along this line, we argue that if individualism encourages overconfidence in managers whose
bad-news hoarding causes stock price crash risk, then the positive effect of individualism on stock
price crash risk should be stronger in firms run by overconfident managers. Due to the unavail-
ability of international data on managerial overconfidence, we follow Schrand and Zechman
(2012), Hirshleifer et al. (2012), and Ahmed and Duellman (2013) to use several investment-
based proxies for managerial overconfidence, such as overinvestment and risky investment. We
find that the positive effect of individualism on stock price crash risk is more pronounced in
firms with more overconfident managers. This finding supports our hypothesis that individ-
ualism leads to stock price crashes through the bad-news hoarding behavior of overconfident
managers.
Our study makes two contributions to the literature. First, it adds to a strand of the
literature that links culture to financial markets and corporate decisions. Existing research doc-
uments that national culture plays an important role in corporate capital structure (Chui et al.,
2002), country-level financial systems (Kwok and Solomon, 2006), life insurance consumption
(Chui and Kwok, 2007), momentum profits (Chui et al., 2010), home bias in international asset
allocation (Beugelsdijk and Frijns, 2010), cash holdings Chen et al. (2015), and stock price
synchronocity (Eun et al., 2015). We provide evidence in support of the link between culture
and stock price crash risk.
Second, we contribute to a growing body of the literature that examines the factors con-
tributing stock price crash risk. Extant research shows that earnings management (Hutton
3
et al., 2009), equity incentives to CEOs (Kim et al., 2011a), complex tax shelters (Kim et al.,
2011b), institutional ownership (An and Zhang, 2013), the adoption of international financial
reporting system (DeFond et al., 2015), audit quality (Robin and Hao, 2015), accounting con-
servatism (Kim and Zhang, 2016), overconfident managers (Kim et al., 2016), and corporate
governance (Andreou et al., 2016) all affect stock price crash risk. Our study documents a
dimension of culture as a factor that can contribute to stock price crash risk.
Our study is closely related to Callen and Fang (2015), who examine the relationship be-
tween religiosity at the county level and stock price crash risk in the U.S. They find that firms
headquartered in counties with higher levels of religiosity exhibit lower levels of future stock
price crash risk, consistent with the view that religion, as a set of social norms, is associated with
managerial bad-news hoarding. We focus on national culture in a cross-country analysis rather
than in the U.S. only. Our findings are consistent with the view that individualism encour-
ages bad-news hoarding behavior of overconfident managers and aggressive trading behavior of
overconfident traders.
The remainder of this study is organized as follows. Section 2 describes sample data and
variable constructions. Section 3 presents emprical findings and robustness checks. Section 4
discusses possible mechanisms. Section 5 concludes.
2 Data, Variable Construction, and Descriptive Statistics
2.1 Data
We collect data on stock prices, stock returns, and exchange rates from Datastream, and firm-
level accounting data from Worldscope for all publicly traded firms from 36 countries over the
period from 2000 to 2009. Following the literature (e.g., Hutton et al., 2009; Jin and Myers, 2006;
Kim et al., 2011a), we exclude firms with less than 26 weeks in a given year of stock trading
data, financial and utility firms, and American Depository Receipts and Global Depository
Receipts. We also drop observations with negative sales and year-end stock prices less than
$1. We obtain culture data from Hofstede (2001) and macroeconomic data the World Bank
World Development Indicators (WDI) database. We exclude observations with missing values
for culture and control variables and observations with insufficient information for constructing
the crash risk measures. We winsorize all variables (except the crash dummy) at the top and
bottom 1% to mitigate the effect of outliers. The final sample has 100,751 firm-year observations
4
for 19,080 firms from 36 countries.
2.2 Stock Price Crash Risk
As in Jin and Myers (2006), we first estimate firm-specific weekly returns for firm i in week t
using the following expanded market model:
rijt = αi + β1rmjt + β2(rUSt + EXjt) + β3rmjt−1 + β4(rUSt−1 + EXjt−1) (1)
+ β5rmjt−2 + β6(rUSt−2 + EXjt−2) + β7rmjt+1 + β8(rUSt+1 + EXjt+1)
+ β9rmjt+2 + β10(rUSt+2 + EXjt+2) + εijt,
where rijt is the return on stock i in country j in week t, rmjt is the market return for country
j in week t, calculated as the equally weighted average of all weekly individual stock returns in
country j in week t (excluding stock i), and rUSt is the U.S. market return in week t. EXjt
is the change in country j’s U.S. dollar exchange rate and εijt represents unspecified factors.
The expression rUSt + EXjt translates U.S. market returns into local currency units. To allow
for nonsynchronous trading, we also include lead and lag terms for the market index returns
(Dimson, 1979).
To minimize potential data errors, we set to missing all those weekly stock returns that
exceed 200%. We require that each country’s weekly market portfolio consist of at least 10
stocks. In computing the weekly market returns, we also exclude the returns within the 0.1%
extremes at the top and bottom of each country’s stock return distribution. Finally, each
country and each stock must have at least 24 weekly observations during a particular year.
The firm-specific weekly return for firm i in week t, denoted by Wit, is defined as the natural
logarithm of one plus the residual return (εit) from the above regression equation.
Following prior work (e.g., Kim et al., 2011a), we use three measures of firm-specific crash
risk. The first measure is the negative conditional skewness of firm-specific weekly returns over
the fiscal year (NCSKEW ), computed by taking the negative of the third central moment of
firm-specific weekly returns for each year and normalizing it by the sample variance of firm-
specific weekly returns raised to 3/2. The negative transformation creates a variable that
increases in value as the return distribution becomes increasingly negatively skewed. Therefore,
the higher the NCSKEW is, the higher is the likelihood of extreme firm-specific negative
5
outliers. Specifically, we compute NCSKEW for each firm i in fiscal year t as:
NCSKEWit = −n (n− 1)
32∑n
j=1
(Wijt −W it
)3(n− 1)(n− 2)
(∑nj=1
(Wijt −W it
)2) 32
(2)
where Wit is the firm-specific weekly return, W it is the average firm-specific return, and n is
the number of observations in fiscal year t.
Our second measure of crash risk is the down-to-up volatility measure (DUV OL) of the crash
likelihood. For each firm i over a fiscal year t, firm-specific weekly returns are separated into
two groups: “down” weeks when the returns are below the annual mean, and “up” weeks when
the returns are above the annual mean. The standard deviation for each of these subsamples is
calculated separately. For each firm i in fiscal year t, DUV OL is computed as the natural log
of the ratio of the standard deviation on down weeks to the standard deviation on up weeks:
DUV OLit = ln
[(nu − 1)
∑DOWN
(Wit −W it
)2(nd − 1)
∑UP
(Wit −W it
)2], (3)
where nd and nu are the number of down and up weeks, respectively. A larger value of DUV OL
suggests that the stock is more “crash-prone”.
Our third measure of stock price crash risk, CRASH, is based on the number of crash
weeks. A week is a crash week if the firm experiences a firm-specific weekly return that are 3.2
standard deviations below its mean. We define CRASH as a dummy variable equal to 1 if the
firm experiences at least one crash week during a fiscal year, and 0 otherwise.
2.3 Culture
As in Shao et al. (2013), we use the individualism index of Hofstede (2001) as the proxy for
national culture (IDV ) because this measure holds a dominant position in cross-cultural studies.
Individualism reflects the degree to which people in a country tend to have an independent,
rather than interdependent, self-construal. Individualistic values emphasize independence and
encourage the pursuit of individual achievements. A higher individualism score indicates a more
individualistic culture.
6
2.4 Control Variables
As in prior work, such as Chen et al. (2001), Hutton et al. (2009), and Kim et al. (2011b), we
construct the following firm-level variables, all measured in year t− 1 except ROA:
• DTURN : detrended turnover, defined as the difference between the average monthly
share turnover over the current fiscal-year period and the average monthly share turnover
over the previous fiscal-year period, where monthly share turnover is calculated as the
monthly trading volume divided by the total number of shares outstanding during the
month. DTURN is used as a proxy for investor belief heterogeneity (Chen et al., 2001).
• SIGMA: the standard deviation of firm-specific weekly returns over the fiscal-year period.
Chen et al. (2001) find that more volatile stocks are more likely to crash in the future.
• RET : the mean of firm-specific weekly returns over the fiscal-year period, times 100.
Chen et al. (2001) find that firms with high past returns are more likely to crash.
• MCAP : firm size, defined as the natural log of the market value of equity measured at
the end of fiscal year. Hutton et al. (2009) find that larger firms are more likely to crash.
• MTB: the ratio of the market value of equity to the book value of equity at the end of
fiscal year. Hutton et al. (2009) find that growth stocks are more crash-prone.
• LEV : financial leverage, calculated as the long-term debt divided by total assets at the
end of fiscal year. Hutton et al. (2009), for example, find that more leveraged firms are
more risky and crash-prone.
• ROA: return on assets, computed as the contemporaneous operating income divided by
lagged total assets. Hutton et al. (2009) and Kim et al. (2011b) find that firms with good
operating performance is less likely to crash.
• DISACC: the three-year moving sum of the absolute value of annual discretionary accru-
als, where discretionary accruals are estimated from the modified Jones model (Dechow
and Sloan, 1995). DISACC is used as a measure of the firm’s earnings management.
Hutton et al. (2009) find that opaque firms are more likely to crash.
• BIG4: A dummy variable equal to 1 if the firm is audited by a Top 4 auditor and 0
otherwise. We follow the literature on audit quality (e.g., Mark and Zhang, 2014) to use
BIG4 as a proxy for the transparency of the firm’s accounting statements. Dechow and
Sloan (1995) find that an increase in the transparency broadly reduces crash risk among
nonfinancial firms.
7
• NCSKEW : the negative skewness of past firm-specific returns, included to capture the
potential persistence of the third central moment (Kim et al., 2011b).
For the country-level variables, we follow Hu et al. (2015) and Shao et al. (2013) and use
the following control variables:
• Disclosure: a measure of the level of financial disclosure and availability of information
to investors, from Jin and Myers (2006), used to control for the country-level opacity.
• Anti−Self Dealing Index: anti-self-dealing index, a measure of country-level governance
from La Porta (1998).
• Rule of Law: the rule of law indicator of Kaufmann et al. (2011), included to capture
perceptions of the extent to which agents have confidence in and abide by the rules of
society, and in particular, the quality of contract enforcement, property rights, the police,
and the courts, as well as the likelihood of crime and violence.
• Creditor Rights: the creditor protection index of Djankov et al. (2007).
• GDP : the natural log of GDP per capita in U.S. dollars, which controls for a country’s
macroeconomic environments.
• GDPGrowth: the growth in a country’s GDP, which captures a country’s macroeconomic
conditions.
• Stock Market: the market capitalization of a country’s stock market scaled by its GDP,
used to control for a country’s stock market size.
2.5 Descriptive Statistics
We compute, for each year, mean cross-sectional crash risk measures and firm and country char-
acteristics for the period from 2000 to 2009. Table 1 shows the time-series summary statistics
on these cross-sectional averages. For crash risk, the average NCSKEW is −0.196 over our
sample period, the average DUV OL is −0.120, and the average CRASH is 0.115. The average
individualism score (IDV ) is 0.651 with a standard deviation of 0.239. On average, a firm in our
sample has a log market value of equity of 18.161, a market-to-book ratio of 2.069, a leverage
ratio of 24.3%, and an ROA of −13.0%.
[Insert Table 1 about here]
8
3 Results and Discussion
3.1 Univariate Analysis
Figure 1 shows plots of country averages of crash risk measures against country individualism
scores. All three plots show a broadly positive association between crash risk and individualism.
[Insert Figure 1 about here]
Next, we split our sample into firms from high- versus low-individualism countries. We
classify a firm into the high- (low-) subsample if it is headquartered in a country whose individ-
ualism score is above (below) the cross-sectional median of the entire sample. Table 2 reports
the mean and median statistics on crash risk for these sub-samples, along with the tests for the
difference in means of crash risk between these groups. The difference in means of crash risk
between the high-IDV and low-IDV subsamples is positive and statistically significant across
all three crash risk measures, suggesting that crash risk is greater in the high-IDV subsample
than in the low-IDV one. This univariate result supports our hypothesis that individualism is
positively associated with stock price crash risk.
[Insert Table 2 about here]
Overall, the univariate analyses in this section provide support for a positive relation between
individualism and stock price crash risk.
3.2 Baseline Regressions
To examine the effect of individualism on stock price crash risk, we estimate the following model:
CrashRiskijt = α+ β1IDVj + γ′Controlijt−1 + ωk + φt + εijt, (4)
where i, j, k, and t denote firm, country, industry, and year, respectively. The dependent
variable, CrashRisk, refers to NCSKEW , DUV OL, or CRASH. Control is a vector of firm-
and country-level characteristics as discussed in Section 2.4, all measured in year t− 1, except
ROA. The regression is estimated by pooled OLS with industry and year fixed effects and
robust standard errors clustered at the firm level. Our independent variable of interest is the
9
country individualism score (IDV ). If β1 is positive and statistically significant, then we find
support for a positive effect of individualism on stock price crash risk.
[Insert Table 3 about here]
Table 3 reports the regression results for equation (4). In the regression of NCSKEW
on IDV and other control variables as shown in column 1, the coefficient on IDV is positive
and statistically significant at the 1% level, suggesting a positive effect of individualism on
stock price crash risk. A coefficient estimate of 0.128 on IDV indicates that stock price crash
risk increases by 12.8% for every 1 percentage point increase in the individualism index. This
result is economically significant. Columns 2 and 3 show the regression results for DUV OL
and CRASH, respectively. Similar results obtain as the coefficients on IDV are all positively
and strongly significant at the 1% level. As in the NCSKEW regression, the results are also
of economic significance.
Turning to the firm-level control variables, we see that the coefficient estimate of BIG4
is negative and significant as shown in columns 1 and 2, suggesting that firms with greater
transparency, captured by the use of Big 4 auditing firms for their accounting statements, are
associated with lower future stock price crash risk. DeFond et al. (2015) find that the increased
transparency broadly reduces crash risk among nonfinancial firms. Consistent with Hutton
et al. (2009), the coefficient on DISACC is significantly positive in all regressions, suggesting
that firms more likely to manage reported earnings are more likely to crash. For the remaining
control variables, the results are all consistent with prior work in the crash risk literature in
terms of sign and significance.
As for the country-level control variables, we find that firms domiciled in countries with more
transparent information environments, better creditor protection rights, more well-developed
stock markets, and higher GDP growth rates are less crash-prone.
3.3 Instrumental Variable Regressions
While the baseline results support our hypothesis that culture has a positive effect on crash
risk, we cannot rule out the possibility that our culture variable is endogenous, because time-
varying country and firm unobservables omitted from the regressions can be correlated with
both individualism and crash risk. To address this important concern, we use an instrumental
variable (IV) approach. Based on prior work, we use two sets of instruments as follows.
10
First, we follow Shao et al. (2013) and use three instruments, namely, (1) genetic distance
from the United States (Genetic Distance), (2) the license to drop pronouns (Pronoun Drop),
and (3) British Rule (British Rule). Genetic Distance, from Spolaore and Wacziarg (2009),
is the FST distance1 that measures a genetic distance from the United States. This measure
aggregates differences in the distribution of gene variants across populations, and thus captures
the degree of genealogical relatedness of different populations, which has been shown to be
highly correlated with individualism. Pronoun Drop, from Kashima and Kashima (1998), is a
dummy variable related to the requirement to use pronouns in a language (the license to drop
pronouns), which equals 1 if a country’s grammatical rules license person-indexing pronoun
drop and 0 otherwise. According to Kashima and Kashima (1998) and Shao et al. (2013),
Pronoun Drop is associated with the degree of psychological differentiation between the speaker
and the social context of speech and inversely correlated with individualism. British Rule is a
dummy variable equal to 1 if a country has historically been under the British rule (Treisman,
2000) and 0 otherwise. A colony of Britain should share some similarities in cultural values.
Shao et al. (2013) find that Pronoun Drop is highly correlated with individualism when British
Rule is incorporated.
To check the relevance of the instruments, in Panel A of Table 4 we present the first-stage
regressions, where we regress IDV on the instruments and the same set of independent variables
as in the baseline regressions. Column 1 shows that all the instruments have strongly significant
coefficients. The p-value of the F -test for the joint significance of instruments, shown at the
bottom of the panel, is close to 0, thus rejecting the null hypothesis of weak instruments. The
overidentification tests with p-value for both Sargan and Basmann statistics are all larger than
0.1 for all the crash risk measures (not reported for brevity), suggesting that the instruments
for individualism are valid. In addition, it is reasonable to assume that these instruments are
uncorrelated with stock price crash risk because there is no economic mechanism under which
the instruments affect stock price crash risk other than through culture.
Columns 2–4 show that the coefficient estimates on the fitted individualism (IDVFitted) are
all positive and significant at the 1% level (except for the NCSKEW regression), suggesting
1FST distance, also known as “coancestor coefficients”, is based on indices of heterozygosity, which refers tothe probability that two alleles at a given locus selected at random from two populations will be different (see,for example, Spolaore and Wacziarg, 2009):
FST is
{= 0 if the allele distributions are equal across the two population,
> 0 if otherwise.
11
that the positive effect of individualism on stock price crash risk is unlikely to be driven by
omitted unobservables.
[Insert Table 4 about here]
The second set of instruments that we use are based on Kwok and Solomon (2006) and
Li et al. (2013): religion (Religion), demography (Ethnic Fractionalization), and geography
(Geography). Religion, from La Porta (1998), is the percentage of people in the Protestant,
Roman Catholic, and Muslim religious faiths in 1980. Ethnic Fractionalization, from Alesina
et al. (2003), is measured as the degree of ethnic heterogeneity in a given country. We use the
continent of a country as a proxy for geography. According to Li et al. (2013), these variables
are selected as potential determinants of culture based on theory and data availability. Panel B
of Table 4 reports the two-stage least squares (2SLS) regression results. The regressions control
for firm- and country-level characteristics, as well as industry and year fixed effects.
Panel B of Table 4 reports the 2SLS regression results with this set of instruments. The
first-stage results show that the instruments are highly correlated with individualism. The null
hypothesis of weak instruments is strongly rejected at the 1% level, with p-value of the F -test
for the joint significance of the instruments close to 0. As before, the coefficient estimates of the
fitted IDV as shown in columns 2–4 are all positive and strongly significant at the 1% level,
which again suggests that our results on the positive effect of individualism on stock price crash
risk still hold.
3.4 Hierarchical Linear Regressions
A further issue is that our data can be viewed as multilevel data. At the country level, we have
firms from 36 countries. At the firm level, we have 19,080 firms. We therefore follow Li et al.
(2013) and Shao et al. (2013) to employ a hierarchical linear model (HLM) regression where
the set of firms within countries form the base-level observations while the countries serve as
the higher-level observations. The power of HLMs comes from their ability to correctly pool
firm-level effects across countries while also examining country-level relations.
We closely follow Li et al. (2013) in preparing the data for the HLM regression. First, we
center each country-level independent variable by its grand mean (averaged across countries)
so that every transformed variable has a mean of zero, and we add the suffix “−ctry” to each
of these variables. Second, we center each firm-level independent variable by its grand mean
12
(averaged across firms and countries for a given fiscal year), so that every transformed variable
has a mean of zero. Third, we create country-level mean values (averaged within a country)
on those grand-mean-centered variables in step 2 and add the suffix “−ctrymean” to each of
these variables. Finally, we create within-country residuals by taking the grand-mean adjusted
variables in step 2 and subtracting the corresponding within-country means in step 3. We name
these firm-level deviations separately from their corresponding country-level means by adding
the suffix “−firmdev”.
Table 5 presents the HLM regressions, all of which include industry and year fixed effects.
The coefficient estimates of IDV are all positive and strongly significant at the 1% level, sug-
gesting a positive effect of individualism on stock price crash risk. These results provide support
for the baseline results on the relationship between individualism and crash risk.
[Insert Table 5 about here]
3.5 Additional Robustness Tests
To provide further robustness, we conduct several tests. First, we use alternative measures for
individualism because these proxies for culture can allay the concern that our baseline results
are only valid to the choice of a particular proxy. Following Chen et al. (2015), we use the
World Value Survey (WVS) on individualism as an alternative measure of individualism. An
advantage of using these data is that the measure is time-varying and thus mitigates a common
problem with time-invariability in country-level proxies for culture. The World Value Survey
covers 97 countries and is carried out in 7 waves, namely, 1981–1984, 1985–1988, 1989–1993,
1994–1998, 1999–2004, 2005–2009, and 2010–2014. We run the same regressions as in equation
(4) using the WVS individualism data for the periods 1999–2004, 2005–2009, and 2010–2014.
Since the WVS individualism index is time-varying, we are able to include country fixed effects
to control for any time-invariant country characteristics. Columns 1–3 in Panel A of Table 6
show the regressions with the alternative proxy for individualism, where we include country
fixed effects. As we can see, the coefficient estimate of the WVS individualism measure remains
positive and strongly significant at the 1% level, corroborating earlier results on the relation
between culture and crash risk.
[Insert Table 6 about here]
13
We also use an updated version of the individualism index as in Tang and Koveos (2008). To
allow for the updated components of cultural dimensions of Hofstede (2001), Tang and Koveos
(2008) establish a framework in which changes in economic conditions are the source of cultural
dynamics, while the endurance of institutional characteristics is the foundation for cultural
stability. A major advantage of Tang and Koveos (2008) is that they develop an integrated
empirical model to update Hofstede (2001)’s dimensions of culture, so that it provides a more
up-to-date and reliable reflection of each country’s true cultural predisposition. In columns
4–6 in Panel A of Table 6, we report the baseline regressions using Tang and Koveos (2008)’s
measure of individualism. Again, we find support for the positive effect of individualism on
stock price crash risk.
In the second test, we add more controls for country-level variables, such as additional
dimensions of cultures of Hofstede (2001) and country religion. Specifically, we include the power
distance scores (PDI), uncertainty avoidance (UAI), and masculinity scores (MAS). We use
the percentage of people in the Protestant (Protestantism), Roman Catholic (Catholicism), and
Muslim (Muslism) religious faiths in 1980 from La Porta (1998) as proxies for religion. Panel B
of Table 6 shows the same regressions as in equation 4 but with these additional controls. We
continue to find support for a positive effect of individualism on crash risk after controlling for
these variables.
To sum up, we show that the baseline regression results still hold under these robustness
tests.
4 Possible Mechanisms
After establishing a positive relation between culture and stock price crash risk, we now attempt
to identify possible mechanisms under which individualism positively affects crash risk. We
acknowledge that these underlying mechanisms are not necessarily mutually exclusive, and if
anything, may jointly contribute to this positive relation.
4.1 Trading by Overconfident Investors
First, traders from individualistic cultures are more overconfident because literature (e.g., Kag-
itcibasi, 1997; Markus and Kitayama, 1991) has shown that people from individualistic culture
tend to be more overconfident. For example, Chui et al. (2010) document the specific evidence
14
that individualism is directly linked to overconfident traders as it is highly correlated with
trading volume and volatility.
Second, overconfident investors’ trading activities can cause stock price crashes. The theo-
retical models of Odean (1998) and Daniel et al. (1998) show that overconfidence induces traders
to trade more aggressively even in the face of transaction costs and adverse expected payoffs.
In their models, overconfident traders place too much weight on their own views and too little
weight on other investors’ views when forming judgments about the value of a security. These
traders expect high profits from trading on their opinions, and their aggressive trading generates
excess volatility, which can lead to stock price crashes. Hong and Stein (2003) document that
investor belief heterogeneity, which is a form of trader overconfidence whereby each investor
irrationally thinks that his private signal is more precise than the others’, causes stock price
crashes.
These two streams of the literature suggest that overconfident investors’ trading activities
can be a channel through which individualism leads to stock price crashes. We thus argue that
if individualism induces overconfidence in investors whose trading activities causes stock price
crashes, then the positive effect of individualism on stock price crash risk should be stronger
when there are more overconfident traders in the market. To test this conjecture, we use
trading volume as a proxy for the presence of overconfident traders because behavioral finance
models predict higher trading volume in the presence of overconfident traders (e.g., Daniel and
Hirshleifer, 2015; Odean, 1998). We estimate the following regression model:
CrashRiskijt = α+ β1IDVj + β2IDVj ×OTit−1 + β3OTit−1 (5)
+ γ′Controlijt−1 + ωk + φt + εijt,
where i, j, k, and t denote firm, country, industry, and year, respectively. OT proxies for the
presence of overconfident traders in the markets and is measured by trading volume. All the
other variables are the same as in equation (4). The regression is estimated by pooled OLS
with industry and year fixed effects and robust standard errors clustered at the firm level. Our
interest is in the coefficient estimates of IDV (β1) and the interaction term IDV ×DTURN
(β2). If these coefficients are positive and statistically significant, then we find support for the
hypothesis that the positive relation between individualism and stock price crash risk is stronger
in the presence of overconfident traders.
15
[Insert Table 7 about here]
Table 7 reports the results for the regression equation (5). Columns 1–3 show that the
coefficient estimates of both IDV and IDV ×DTURN are positive and statistically significant
regardless of which measure of crash risk is used, suggesting that the positive effect of individ-
ualism on stock price crash risk is more pronounced for higher trading volume stocks. These
results lend support to our hypothesis that the positive effect of individualism on stock price
crash risk arises from trading activities of investors whose overconfidence is fostered by their
individualistic cultures.
4.2 Bad-news Hoarding by Overconfident Managers
The positive effect of individualism on stock price crash risk may also stem from bad news
hoarding behavior of overconfident managers.
Literature shows that managers from individualistic cultures are more overconfident be-
cause people in more individualistic cultures are generally more overconfident (e.g., Kagitcibasi,
1997; Markus and Kitayama, 1991). Ferris et al. (2013) observe that although an interna-
tional phenomenon, overconfidence is most commonly observed in individuals who head firms
headquartered in Christian countries that encourage individualism, because managers in these
individualistic cultures are more likely to undertake complex acquisitions.
Overconfident managers often engage in bad-news hoarding behavior, which can cause crash
risk. Overconfident managers’ bad-news hoarding may occur in different ways. Ahmed and
Duellman (2013) find that overconfident managers tend to delay loss recognition, a form of bad-
news hoarding. Overconfident managers tend to overestimate the returns to their investment
projects (e.g., Heaton, 2002; Malmendier and Tate, 2005, 2008; Malmendier et al., 2011), and,
thus, misperceive poorly performing negative net present value (NPV) projects as positive NPV
projects, leading to delayed loss recognition. Schrand and Zechman (2012) find that earnings
misstatements, another form of bad-news hoarding, are largely a result of managerial overcon-
fidence because managers are overoptimistic about their firms’ future performance. Hribar and
Yang (2016) find that overconfident managers are more likely to issue overly optimistic earnings
forecasts and are more likely to have earnings that miss such forecasts. Taken together, these
studies suggest that bad news hoarded by overconfident managers can be accumulated, which
makes their firms’ stock prices more likely to crash. Indeed, Kim et al. (2016) find that U.S.
16
firms with overconfident managers are associated with higher stock price crash risk compared
with firms run by nonoverconfident ones.
In the spirit of this discussion, we argue that if individualism instills overconfidence in
managers, who often engage in bad-news hoarding activities that could eventually lead to stock
price crashes, then the positive effect of individualism on stock price crash risk should be
stronger in firms run by overconfident managers. To test this hypothesis, we follow Schrand
and Zechman (2012) and Ahmed and Duellman (2013) and use several investment-based proxies
for overconfident managers, namely, overinvestment and risky investments. These proxies are
based on the findings that firms with overconfident CEOs have larger capital expenditures and
tend to overinvest in capital projects (e.g., Malmendier and Tate, 2005). The first proxy of
managerial overconfidence is the amount of excess investment in assets from the residual of
a regression of total asset growth on sales growth run by industry-year (OV ERINV EST ).
OV ERINV EST equals 1 if the residual from the excess investment regression is greater than
0, and 0 otherwise. Intuitively, if assets are growing at a faster rate than sales, then it suggests
that managers are overinvesting in their company relative to their peers. The second measure
(CAPEX) is a dichotomous variable, equal to 1 if the firm’s capital expenditures deflated by
lagged total assets in a given year is greater than the median capital expenditures scaled by
lagged total assets in the same year for the industry where the firm belongs, and 0 otherwise.
Since Hirshleifer et al. (2012) find that overconfident managers prefer corporate risk-taking, we
use research and development expenses as a percentage of total assets (R&D) as another proxy
for overconfident mangers.
To examine whether managerial bad-news hoarding is a plausible channel through which
individualism has a positive effect on stock price crash risk, we estimate the following model:
CrashRiskijt = α+ β1IDVj + β2IDVj ×OMit−1 + β3OMit−1 (6)
+ γ′Controlijt−1 + ωk + φt + εijt,
where i, j, k, and t denote firm, country, industry, and year, respectively. OM indicates
the presence of overconfident managers and is proxied by overinvestment (OV ERINV EST ),
capital expenditure (CAPEX), or research and development to total assets (R&D). All the
other variables are the same as in equation (4). We estimate the regressions with the pooled
OLS, where we include industry and year fixed effects and use robust standard errors clustered
17
at the firm level. Our interest is in the coefficient estimates of IDV (β1) and the interaction
term, IDV ×DTURN (β2).
[Insert Table 8 about here]
Table 8 reports the results for the regression equation (6). Columns 1–9 show that the
positive effect of individualism on stock price crash risk is more pronounced in firms with
overinvestment and risky investment because the coefficient estimates of both IDV and IDV ×
OM are positive and strongly significant at the 1% level in all model specifications, regardless
of which measure is used for OM . These results support our hypothesis that bad-news hoarding
activities by managers, whose overconfidence is fostered by their individualistic cultures, cause
stock price crashes.
5 Conclusion
We examine the effect of national culture on stock price crash risk, a currently unexplored
question in the literature. We find that individualism has a positive effect on stock price
crash risk, which suggests that firms headquartered in individualistic countries are associated
with higher stock price crash risk. We also find that this positive effect becomes stronger for
firms with high trading volume, overinvestment, and risky investments. Our results suggest
that individualistic cultures encourage overconfident managers’ bad-news hoarding activities,
and overconfident investors’ aggressive trading behavior, which eventually can lead stock price
crashes. This is the first study to document national culture as a potential factor contributing
to stock price crash risk.
18
References
Ahmed, A. S. and S. Duellman (2013). Managerial overconfidence and accounting conservatism.Journal of Accounting Research 51 (1), 1–30.
Alesina, A., A. Devleeschauwer, W. Easterly, S. Kurlat, and R. Wacziarg (2003). Fractionaliza-tion. Journal of Economic Growth 8 (2), 155–194.
An, H. and T. Zhang (2013). Stock price synchronicity, crash risk, and institutional investors.Journal of Corporate Finance 21, 1–15.
Andreou, P. C., C. Antoniou, J. Horton, and C. Louca (2016). Corporate governance andfirm-specific stock price crashes. European Financial Management 22 (5), 916–956.
Beugelsdijk, S. and B. Frijns (2010). A cultural explanation of the foreign bias in internationalasset allocation. Journal of Banking and Finance 34 (9), 2121–2131.
Callen, J. L. and X. Fang (2015). Religion and stock price crash risk. Journal of Financial andQuantitative Analysis 50 (1-2), 169–195.
Chen, J., H. Hong, and J. C. Stein (2001). Forecasting crashes: trading volume, past returns,and conditional skewness in stock prices. Journal of Financial Economics 61 (3), 345–381.
Chen, Y., P. Y. Dou, S. G. Rhee, C. Truong, and M. Veeraraghavan (2015). National cultureand corporate cash holdings around the world. Journal of Banking and Finance 50, 1–18.
Chui, A. C. W. and C. C. Y. Kwok (2007). National culture and life insurance consumption.Journal of International Business Studies 39 (1), 88–101.
Chui, A. C. W., A. E. Lloyd, and C. C. Y. Kwok (2002). The determination of capital struc-ture: Is national culture a missing piece to the puzzle? Journal of International BusinessStudies 33 (1), 99–127.
Chui, A. C. W., S. Titman, and K. C. J. Wei (2010). Individualism and momentum around theworld. Journal of Finance 65 (1), 361–392.
Daniel, K. and D. Hirshleifer (2015). Overconfident investors, predictable returns, and excessivetrading. Journal of Economic Perspectives 29 (4), 61–88.
Daniel, K., D. Hirshleifer, and A. Subrahmanyam (1998). Investor psychology and securitymarket under- and over-reactions. Journal of Finance 53 (6), 1839–1885.
Dechow, P. M. and R. G. Sloan (1995). Detecting earnings management. Accounting Re-view 70 (2), 193–225.
DeFond, M. L., H. Mingyi, L. Siqi, and L. Yinghua (2015). Does mandatory IFRS adoptionaffect crash risk? Accounting Review 90 (1), 265–299.
Dimson, E. (1979). Risk measurement when shares are subject to infrequent trading. Journalof Financial Economics 7 (2), 197–226.
Djankov, S., C. McLiesh, and A. Shleifer (2007). Private credit in 129 countries. 84 (2), 299–329.
Eun, C. S., L. Wang, and S. C. Xiao (2015). Culture and R2. 115 (2), 283–303.
Ferris, S. P., N. Jayaraman, and S. Sabherwal (2013). CEO overconfidence and internationalmerger and acquisition activity. Journal of Financial and Quantitative Analysis 48 (1), 137–164.
19
Grinblatt, M. and M. Keloharju (2009). Sensation seeking, overconfidence, and trading activity.Journal of Finance 64 (2), 549–578.
Heaton, J. B. (2002). Managerial optimism and corporate finance. Financial Management 31 (2),33–45.
Hirshleifer, D., A. Low, and S. H. Teoh (2012). Are overconfident CEOs better innovators?Journal of Finance 67 (4), 1457–1498.
Hofstede, G. (2001). Culture’s consequences: Comparing values, behaviors, institutions, andorganizations across nations. Sage Publication.
Hong, H. and J. C. Stein (2003). Differences of opinion, short-sales constraints, and marketcrashes. Review of Financial Studies 16 (2), 487–525.
Hribar, P. and H. Yang (2016). CEO overconfidence and management forecasting. ContemporaryAccounting Research, 33 (1), 204–227.
Hu, J., J.-B. Kim, and W. Zhang (2015). Insider trading and stock price crashes: Internationalevidence from a natural experiment. Available at SSRN: http://ssrn.com/abstract=2359069or http://dx.doi.org/10.2139/ssrn.2359069 .
Hutton, A. P., A. J. Marcus, and H. Tehranian (2009). Opaque financial reports, R2, and crashrisk. Journal of Financial Economics 94 (1), 67–86.
Jin, L. and S. C. Myers (2006). R2 around the world: New theory and new tests. Journal ofFinancial Economics 79 (2), 257–292.
Kagitcibasi, C. (1997). Individualism and collectivism. In J. W, B. Marshall, H. Segall, andC. Kagitcibasi (Eds.), Handbook of Cross-cultural Psychology. Boston: Allyn & Bacon.
Kashima, E. S. and Y. Kashima (1998). Culture and language: The case of cultural dimensionsand personal pronoun use. Journal of Cross-Cultural Psychology 29 (3), 461–486.
Kaufmann, D., A. Kraay, and M. Mastruzzi (2011). The worldwide governance indicators:Methodology and analytical issues. Hague Journal on the Rule of Law 3 (2), 220–246.
Kim, J.-B., Y. Li, and L. Zhang (2011a). CFOs versus CEOs: Equity incentives and crashes.Journal of Financial Economics 101 (3), 713–730.
Kim, J.-B., Y. Li, and L. Zhang (2011b). Corporate tax avoidance and stock price crash risk:Firm-level analysis. Journal of Financial Economics 100 (3), 639–662.
Kim, J.-B., Z. Wang, and L. Zhang (2016). CEO overconfidence and stock price crash risk.Contemporary Accounting Research 33 (4), 1720–1749.
Kim, J.-B. and L. Zhang (2016). Accounting conservatism and stock price crash risk: Firm-levelevidence. Contemporary Accounting Research 33 (1), 412–441.
Kothari, S. P., S. Shu, and P. D. Wysocki (2009, March). Do managers withhold bad news?Journal of Accounting Research 47 (1), 241–276.
Kwok, C. C. Y. and T. Solomon (2006). National culture and financial systems. Journal ofInternational Business Studies 37 (2), 227–247.
La Porta, R. (1998). Law and finance. Journal of Political Economy 106 (6), 1113–1155.
Li, K., D. Griffin, H. Yue, and L. Zhao (2013). How does culture influence corporate risk-taking?Journal of Corporate Finance 23, 1–22.
20
Liang Shao, Chuck CY Kwok, O. G. (2010). National culture and dividend policy. Journal ofInternational Business Studies 41 (8), 1391–1414.
Malmendier, U. and G. Tate (2005). CEO overconfidence and corporate investment. Journalof Finance 60 (6), 2661–2700.
Malmendier, U. and G. Tate (2008). Who makes acquisitions? CEO overconfidence and themarket’s reaction. Journal of Financial Economics 89 (1), 20–43.
Malmendier, U., G. Tate, and J. Yan (2011). Overconfidence and early-life experiences: Theeffect of managerial traits on corporate financial policies. Journal of Finance 66 (5), 1687–1733.
Mark, D. and J. Zhang (2014). A review of archival auditing research. Journal of Accountingand Economics 58 (23), 275–326.
Markus, H. R. and S. Kitayama (1991). Culture and the self: Implications for cognition,emotion, and motivation. Psychological Review 98 (2), 224–253.
North, D. C. (1990). Institutions, Institutional Change and Economic Performance. Cambride,UK: Cambridge University Press.
Odean, T. (1998). Volume, volatility, price, and profit when all traders are above average.Journal of Finance 53 (6), 1887–1934.
Robin, A. J. and Z. Hao (2015). Do industry-specialist auditors influence stock price crash risk?Auditing: A Journal of Practice and Theory 34 (3), 47–79.
Schrand, C. M. and S. L. C. Zechman (2012). Executive overconfidence and the slippery slopeto financial misreporting. Journal of Accounting and Economics 53 (1-2), 311–329.
Shao, L., C. C. Y. Kwok, and R. Zhang (2013). National culture and corporate investment.Journal of International Business Studies 44 (7), 745–763.
Spolaore, E. and R. Wacziarg (2009). The diffusion of development. Quarterly Journal ofEconomics 124 (2), 469–529.
Statman, M., S. Thorley, and K. Vorkink (2006). Investor overconfidence and trading volume.Review of Financial Studies 19 (4), 1531–1565.
Tang, L. and P. E. Koveos (2008). A framework to update Hofstede’s cultural value indices: Eco-nomic dynamics and institutional stability. Journal of International Business Studies 39 (6),1045–1063.
Treisman, D. (2000). The causes of corruption: A cross-national study. 76 (3), 399–457.
Williamson, O. E. (2000). The new institutional economics: Taking stock, looking ahead.Journal of Economic Literature 38 (3), 595–613.
21
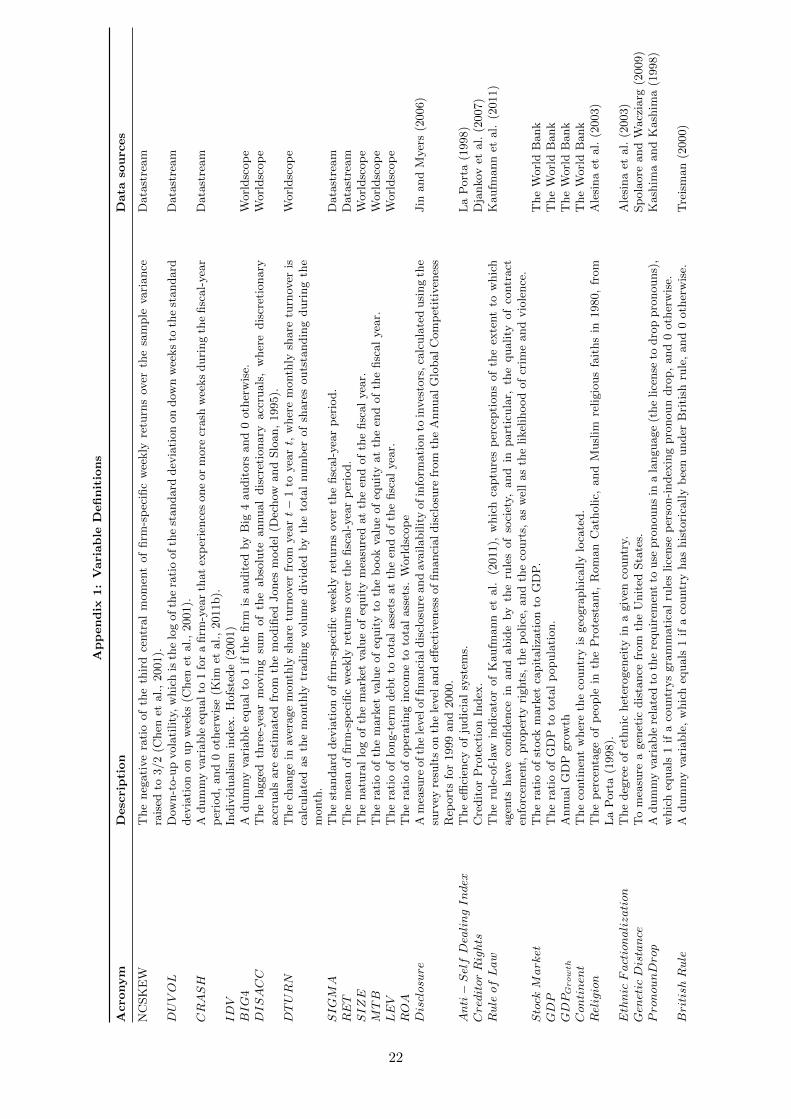
App
endix
1:
Vari
able
Definit
ions
Acro
nym
Desc
ripti
on
Data
sourc
es
NC
SK
EW
The
neg
ati
ve
rati
oof
the
thir
dce
ntr
al
mom
ent
of
firm
-sp
ecifi
cw
eekly
retu
rns
over
the
sam
ple
vari
ance
rais
edto
3/2
(Chen
etal.,
2001).
Data
stre
am
DUVOL
Dow
n-t
o-u
pvola
tility
,w
hic
his
the
log
of
the
rati
oof
the
standard
dev
iati
on
on
dow
nw
eeks
toth
est
andard
dev
iati
on
on
up
wee
ks
(Chen
etal.,
2001).
Data
stre
am
CRASH
Adum
my
vari
able
equalto
1fo
ra
firm
-yea
rth
at
exp
erie
nce
sone
or
more
crash
wee
ks
duri
ng
the
fisc
al-
yea
rp
erio
d,
and
0oth
erw
ise
(Kim
etal.,
2011b).
Data
stre
am
IDV
Indiv
idualism
index
.H
ofs
tede
(2001)
BIG
4A
dum
my
vari
able
equal
to1
ifth
efirm
isaudit
edby
Big
4audit
ors
and
0oth
erw
ise.
Worl
dsc
op
eDISACC
The
lagged
thre
e-yea
rm
ovin
gsu
mof
the
abso
lute
annual
dis
cret
ionary
acc
ruals
,w
her
edis
cret
ionary
acc
ruals
are
esti
mate
dfr
om
the
modifi
edJones
model
(Dec
how
and
Slo
an,
1995).
Worl
dsc
op
e
DTURN
The
change
inav
erage
month
lysh
are
turn
over
from
yea
rt−
1to
yea
rt,
wher
em
onth
lysh
are
turn
over
isca
lcula
ted
as
the
month
lytr
adin
gvolu
me
div
ided
by
the
tota
lnum
ber
of
share
souts
tandin
gduri
ng
the
month
.
Worl
dsc
op
e
SIGM
AT
he
standard
dev
iati
on
of
firm
-sp
ecifi
cw
eekly
retu
rns
over
the
fisc
al-
yea
rp
erio
d.
Data
stre
am
RET
The
mea
nof
firm
-sp
ecifi
cw
eekly
retu
rns
over
the
fisc
al-
yea
rp
erio
d.
Data
stre
am
SIZE
The
natu
ral
log
of
the
mark
etva
lue
of
equit
ym
easu
red
at
the
end
of
the
fisc
al
yea
r.W
orl
dsc
op
eM
TB
The
rati
oof
the
mark
etva
lue
of
equit
yto
the
book
valu
eof
equit
yat
the
end
of
the
fisc
al
yea
r.W
orl
dsc
op
eLEV
The
rati
oof
long-t
erm
deb
tto
tota
lass
ets
at
the
end
of
the
fisc
al
yea
r.W
orl
dsc
op
eROA
The
rati
oof
op
erati
ng
inco
me
toto
tal
ass
ets.
Worl
dsc
op
eDisclosure
Am
easu
reofth
ele
vel
offinanci
aldis
closu
reand
availabilit
yofin
form
ati
on
toin
ves
tors
,ca
lcula
ted
usi
ng
the
surv
eyre
sult
son
the
level
and
effec
tiven
ess
of
financi
aldis
closu
refr
om
the
AnnualG
lobalC
om
pet
itiv
enes
sR
eport
sfo
r1999
and
2000.
Jin
and
Myer
s(2
006)
Anti−
SelfDea
lingIndex
The
effici
ency
of
judic
ial
syst
ems.
La
Port
a(1
998)
Creditor
Rights
Cre
dit
or
Pro
tect
ion
Index
.D
jankov
etal.
(2007)
Rule
ofLaw
The
rule
-of-
law
indic
ato
rof
Kaufm
ann
etal.
(2011),
whic
hca
ptu
res
per
cepti
ons
of
the
exte
nt
tow
hic
hagen
tshav
eco
nfiden
cein
and
abid
eby
the
rule
sof
soci
ety,
and
inpart
icula
r,th
equality
of
contr
act
enfo
rcem
ent,
pro
per
tyri
ghts
,th
ep
olice
,and
the
court
s,as
wel
las
the
likel
ihood
of
crim
eand
vio
lence
.
Kaufm
ann
etal.
(2011)
Stock
Mark
etT
he
rati
oof
stock
mark
etca
pit
aliza
tion
toG
DP
.T
he
Worl
dB
ank
GDP
The
rati
oof
GD
Pto
tota
lp
opula
tion.
The
Worl
dB
ank
GDPGrowth
Annual
GD
Pgro
wth
The
Worl
dB
ank
Con
tinen
tT
he
conti
nen
tw
her
eth
eco
untr
yis
geo
gra
phic
ally
loca
ted.
The
Worl
dB
ank
Religion
The
per
centa
ge
of
peo
ple
inth
eP
rote
stant,
Rom
an
Cath
olic,
and
Musl
imre
ligio
us
fait
hs
in1980,
from
La
Port
a(1
998).
Ale
sina
etal.
(2003)
Ethnic
Factionalization
The
deg
ree
of
ethnic
het
erogen
eity
ina
giv
enco
untr
y.A
lesi
na
etal.
(2003)
Gen
etic
Distance
To
mea
sure
agen
etic
dis
tance
from
the
Unit
edSta
tes.
Sp
ola
ore
and
Wacz
iarg
(2009)
Pronou
nDrop
Adum
my
vari
able
rela
ted
toth
ere
quir
emen
tto
use
pro
nouns
ina
language
(the
lice
nse
todro
ppro
nouns)
,w
hic
heq
uals
1if
aco
untr
ys
gra
mm
ati
cal
rule
slice
nse
per
son-i
ndex
ing
pro
noun
dro
p,
and
0oth
erw
ise.
Kash
ima
and
Kash
ima
(1998)
British
Rule
Adum
my
vari
able
,w
hic
heq
uals
1if
aco
untr
yhas
his
tori
cally
bee
nunder
Bri
tish
rule
,and
0oth
erw
ise.
Tre
ism
an
(2000)
22
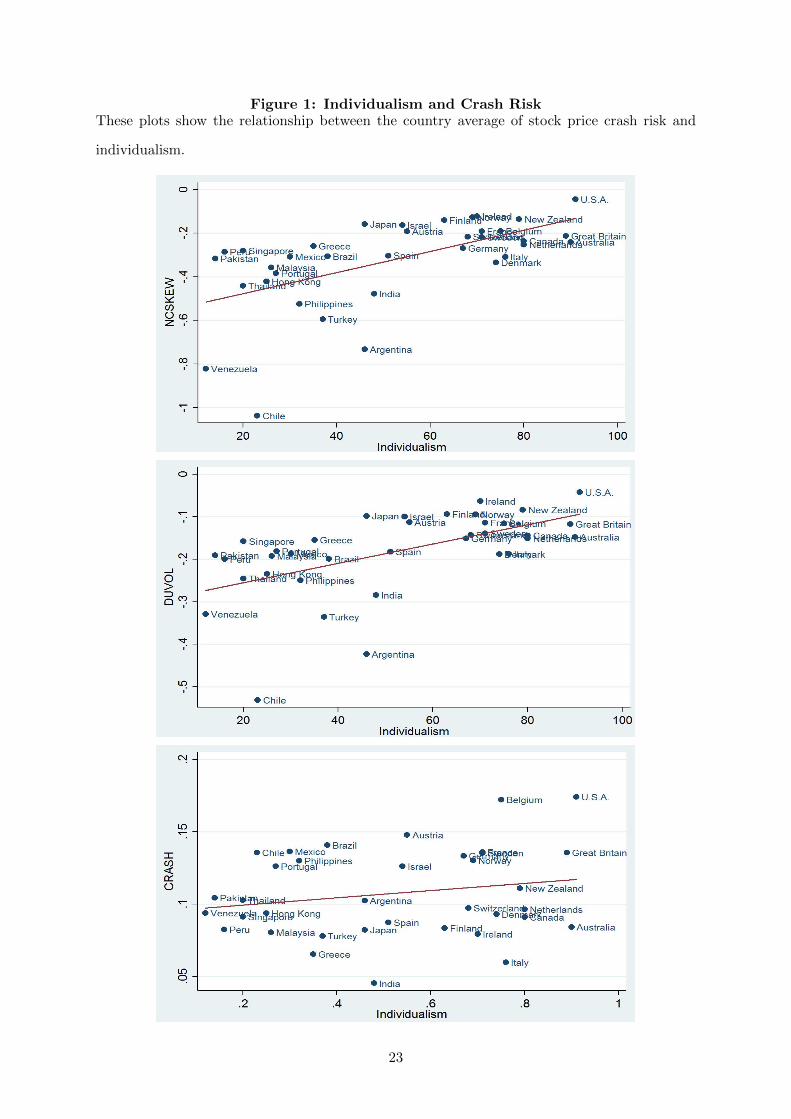
Figure 1: Individualism and Crash RiskThese plots show the relationship between the country average of stock price crash risk and
individualism.
23
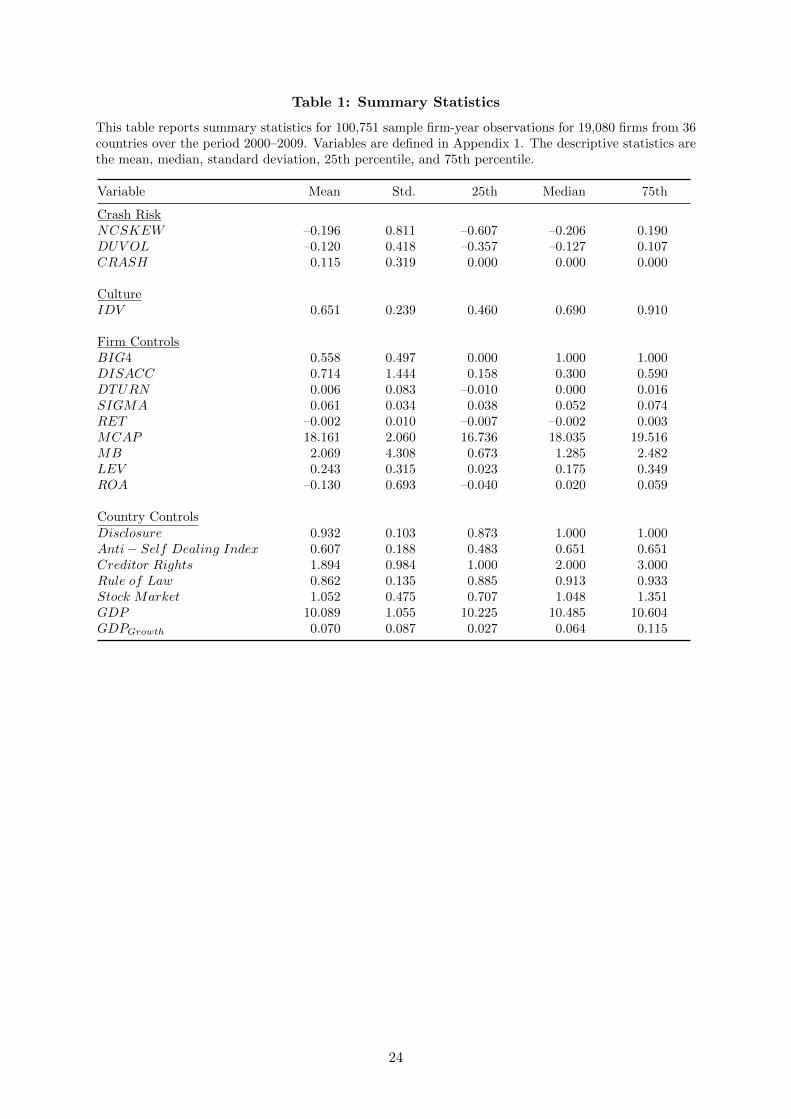
Table 1: Summary Statistics
This table reports summary statistics for 100,751 sample firm-year observations for 19,080 firms from 36countries over the period 2000–2009. Variables are defined in Appendix 1. The descriptive statistics arethe mean, median, standard deviation, 25th percentile, and 75th percentile.
Variable Mean Std. 25th Median 75th
Crash RiskNCSKEW –0.196 0.811 –0.607 –0.206 0.190DUV OL –0.120 0.418 –0.357 –0.127 0.107CRASH 0.115 0.319 0.000 0.000 0.000
CultureIDV 0.651 0.239 0.460 0.690 0.910
Firm ControlsBIG4 0.558 0.497 0.000 1.000 1.000DISACC 0.714 1.444 0.158 0.300 0.590DTURN 0.006 0.083 –0.010 0.000 0.016SIGMA 0.061 0.034 0.038 0.052 0.074RET –0.002 0.010 –0.007 –0.002 0.003MCAP 18.161 2.060 16.736 18.035 19.516MB 2.069 4.308 0.673 1.285 2.482LEV 0.243 0.315 0.023 0.175 0.349ROA –0.130 0.693 –0.040 0.020 0.059
Country ControlsDisclosure 0.932 0.103 0.873 1.000 1.000Anti− Self Dealing Index 0.607 0.188 0.483 0.651 0.651Creditor Rights 1.894 0.984 1.000 2.000 3.000Rule of Law 0.862 0.135 0.885 0.913 0.933Stock Market 1.052 0.475 0.707 1.048 1.351GDP 10.089 1.055 10.225 10.485 10.604GDPGrowth 0.070 0.087 0.027 0.064 0.115
24
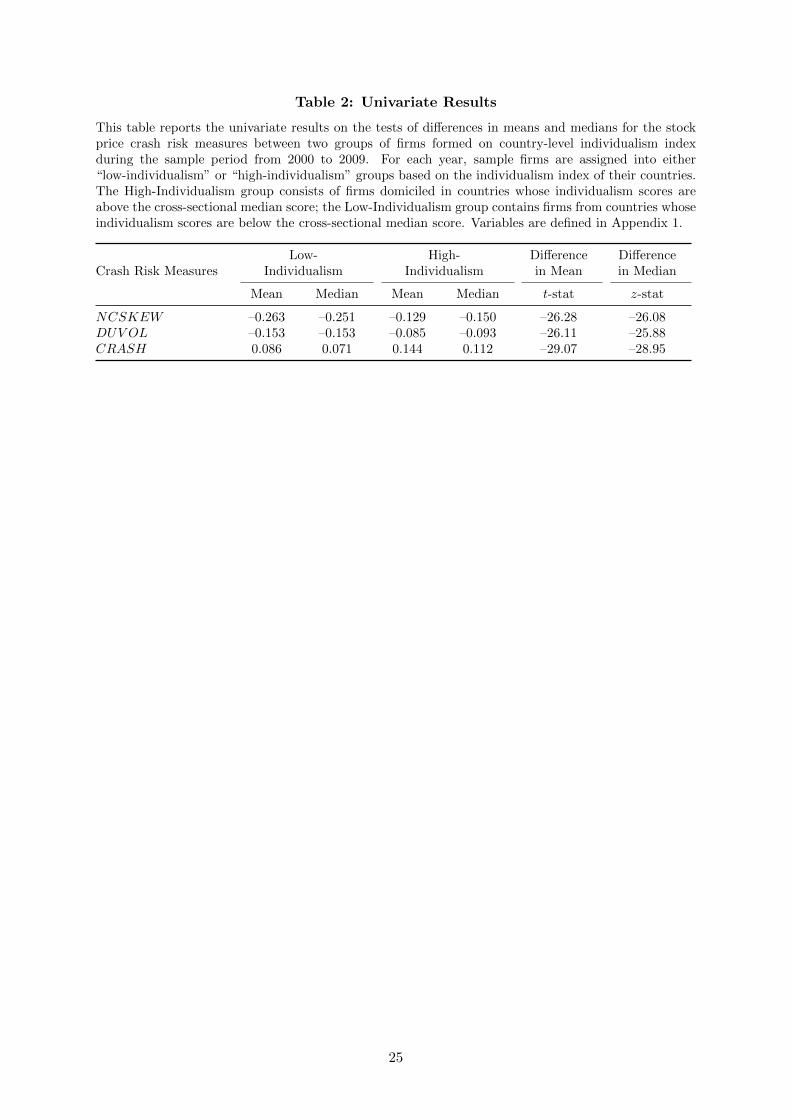
Table 2: Univariate Results
This table reports the univariate results on the tests of differences in means and medians for the stockprice crash risk measures between two groups of firms formed on country-level individualism indexduring the sample period from 2000 to 2009. For each year, sample firms are assigned into either“low-individualism” or “high-individualism” groups based on the individualism index of their countries.The High-Individualism group consists of firms domiciled in countries whose individualism scores areabove the cross-sectional median score; the Low-Individualism group contains firms from countries whoseindividualism scores are below the cross-sectional median score. Variables are defined in Appendix 1.
Low- High- Difference DifferenceCrash Risk Measures Individualism Individualism in Mean in Median
Mean Median Mean Median t-stat z-stat
NCSKEW –0.263 –0.251 –0.129 –0.150 –26.28 –26.08DUV OL –0.153 –0.153 –0.085 –0.093 –26.11 –25.88CRASH 0.086 0.071 0.144 0.112 –29.07 –28.95
25
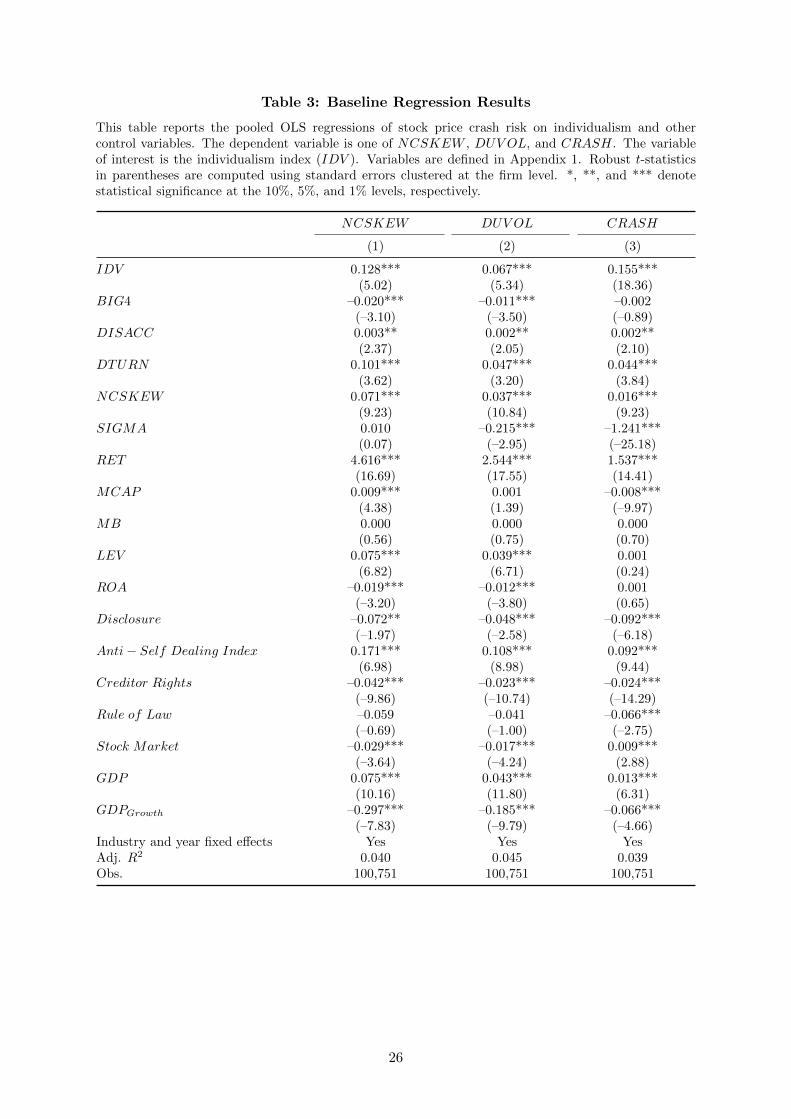
Table 3: Baseline Regression Results
This table reports the pooled OLS regressions of stock price crash risk on individualism and othercontrol variables. The dependent variable is one of NCSKEW , DUV OL, and CRASH. The variableof interest is the individualism index (IDV ). Variables are defined in Appendix 1. Robust t-statisticsin parentheses are computed using standard errors clustered at the firm level. *, **, and *** denotestatistical significance at the 10%, 5%, and 1% levels, respectively.
NCSKEW DUV OL CRASH
(1) (2) (3)
IDV 0.128*** 0.067*** 0.155***(5.02) (5.34) (18.36)
BIG4 –0.020*** –0.011*** –0.002(–3.10) (–3.50) (–0.89)
DISACC 0.003** 0.002** 0.002**(2.37) (2.05) (2.10)
DTURN 0.101*** 0.047*** 0.044***(3.62) (3.20) (3.84)
NCSKEW 0.071*** 0.037*** 0.016***(9.23) (10.84) (9.23)
SIGMA 0.010 –0.215*** –1.241***(0.07) (–2.95) (–25.18)
RET 4.616*** 2.544*** 1.537***(16.69) (17.55) (14.41)
MCAP 0.009*** 0.001 –0.008***(4.38) (1.39) (–9.97)
MB 0.000 0.000 0.000(0.56) (0.75) (0.70)
LEV 0.075*** 0.039*** 0.001(6.82) (6.71) (0.24)
ROA –0.019*** –0.012*** 0.001(–3.20) (–3.80) (0.65)
Disclosure –0.072** –0.048*** –0.092***(–1.97) (–2.58) (–6.18)
Anti− Self Dealing Index 0.171*** 0.108*** 0.092***(6.98) (8.98) (9.44)
Creditor Rights –0.042*** –0.023*** –0.024***(–9.86) (–10.74) (–14.29)
Rule of Law –0.059 –0.041 –0.066***(–0.69) (–1.00) (–2.75)
Stock Market –0.029*** –0.017*** 0.009***(–3.64) (–4.24) (2.88)
GDP 0.075*** 0.043*** 0.013***(10.16) (11.80) (6.31)
GDPGrowth –0.297*** –0.185*** –0.066***(–7.83) (–9.79) (–4.66)
Industry and year fixed effects Yes Yes YesAdj. R2 0.040 0.045 0.039Obs. 100,751 100,751 100,751
26
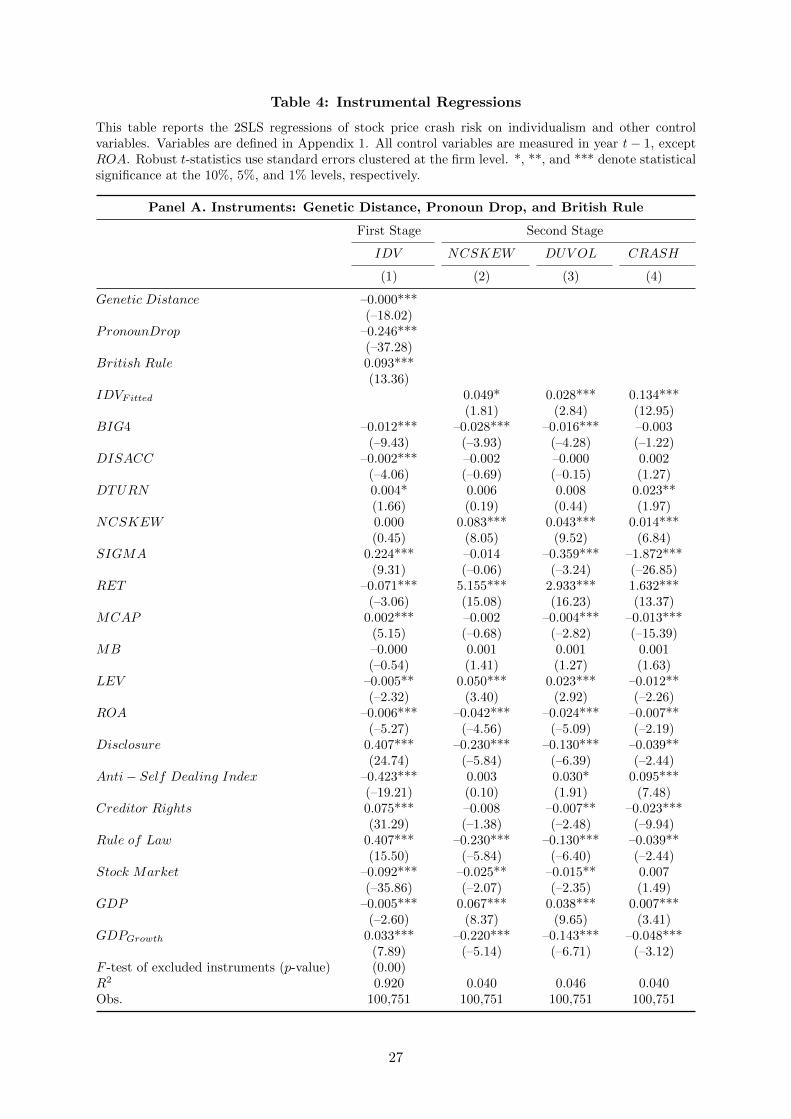
Table 4: Instrumental Regressions
This table reports the 2SLS regressions of stock price crash risk on individualism and other controlvariables. Variables are defined in Appendix 1. All control variables are measured in year t− 1, exceptROA. Robust t-statistics use standard errors clustered at the firm level. *, **, and *** denote statisticalsignificance at the 10%, 5%, and 1% levels, respectively.
Panel A. Instruments: Genetic Distance, Pronoun Drop, and British Rule
First Stage Second Stage
IDV NCSKEW DUV OL CRASH
(1) (2) (3) (4)
Genetic Distance –0.000***(–18.02)
PronounDrop –0.246***(–37.28)
British Rule 0.093***(13.36)
IDVFitted 0.049* 0.028*** 0.134***(1.81) (2.84) (12.95)
BIG4 –0.012*** –0.028*** –0.016*** –0.003(–9.43) (–3.93) (–4.28) (–1.22)
DISACC –0.002*** –0.002 –0.000 0.002(–4.06) (–0.69) (–0.15) (1.27)
DTURN 0.004* 0.006 0.008 0.023**(1.66) (0.19) (0.44) (1.97)
NCSKEW 0.000 0.083*** 0.043*** 0.014***(0.45) (8.05) (9.52) (6.84)
SIGMA 0.224*** –0.014 –0.359*** –1.872***(9.31) (–0.06) (–3.24) (–26.85)
RET –0.071*** 5.155*** 2.933*** 1.632***(–3.06) (15.08) (16.23) (13.37)
MCAP 0.002*** –0.002 –0.004*** –0.013***(5.15) (–0.68) (–2.82) (–15.39)
MB –0.000 0.001 0.001 0.001(–0.54) (1.41) (1.27) (1.63)
LEV –0.005** 0.050*** 0.023*** –0.012**(–2.32) (3.40) (2.92) (–2.26)
ROA –0.006*** –0.042*** –0.024*** –0.007**(–5.27) (–4.56) (–5.09) (–2.19)
Disclosure 0.407*** –0.230*** –0.130*** –0.039**(24.74) (–5.84) (–6.39) (–2.44)
Anti− Self Dealing Index –0.423*** 0.003 0.030* 0.095***(–19.21) (0.10) (1.91) (7.48)
Creditor Rights 0.075*** –0.008 –0.007** –0.023***(31.29) (–1.38) (–2.48) (–9.94)
Rule of Law 0.407*** –0.230*** –0.130*** –0.039**(15.50) (–5.84) (–6.40) (–2.44)
Stock Market –0.092*** –0.025** –0.015** 0.007(–35.86) (–2.07) (–2.35) (1.49)
GDP –0.005*** 0.067*** 0.038*** 0.007***(–2.60) (8.37) (9.65) (3.41)
GDPGrowth 0.033*** –0.220*** –0.143*** –0.048***(7.89) (–5.14) (–6.71) (–3.12)
F -test of excluded instruments (p-value) (0.00)R2 0.920 0.040 0.046 0.040Obs. 100,751 100,751 100,751 100,751
27
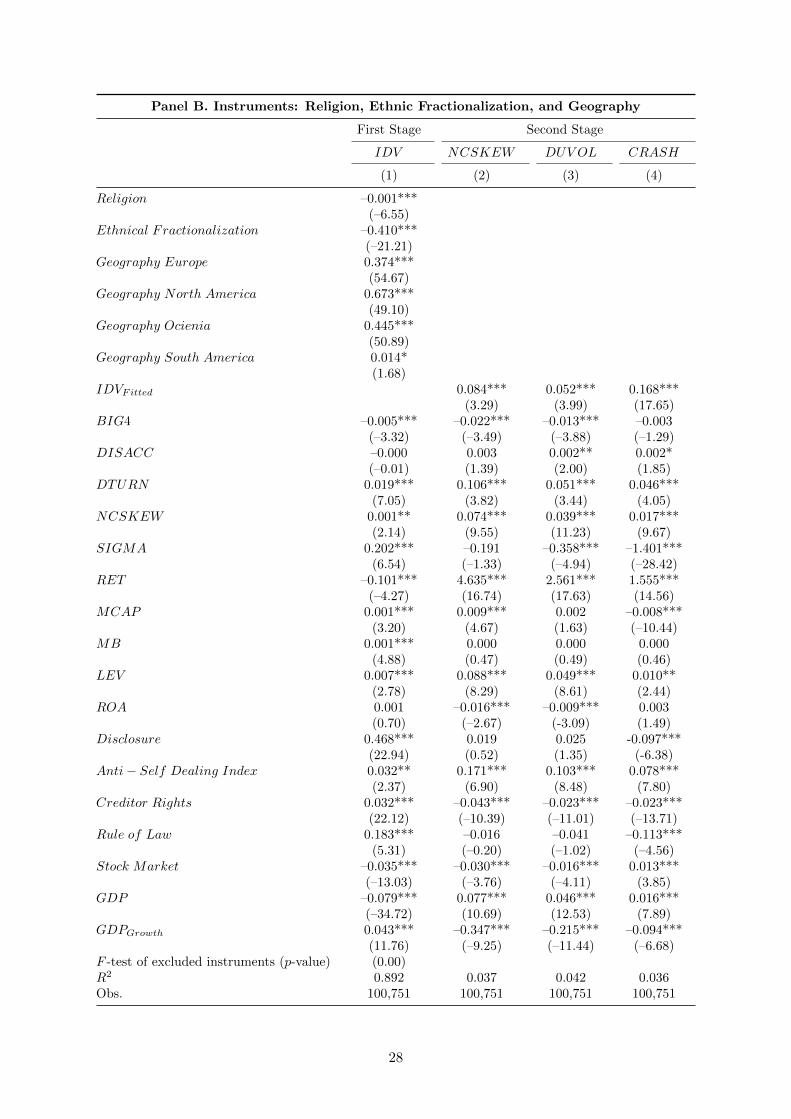
Panel B. Instruments: Religion, Ethnic Fractionalization, and Geography
First Stage Second Stage
IDV NCSKEW DUV OL CRASH
(1) (2) (3) (4)
Religion –0.001***(–6.55)
Ethnical Fractionalization –0.410***(–21.21)
Geography Europe 0.374***(54.67)
Geography North America 0.673***(49.10)
Geography Ocienia 0.445***(50.89)
Geography South America 0.014*(1.68)
IDVFitted 0.084*** 0.052*** 0.168***(3.29) (3.99) (17.65)
BIG4 –0.005*** –0.022*** –0.013*** –0.003(–3.32) (–3.49) (–3.88) (–1.29)
DISACC –0.000 0.003 0.002** 0.002*(–0.01) (1.39) (2.00) (1.85)
DTURN 0.019*** 0.106*** 0.051*** 0.046***(7.05) (3.82) (3.44) (4.05)
NCSKEW 0.001** 0.074*** 0.039*** 0.017***(2.14) (9.55) (11.23) (9.67)
SIGMA 0.202*** –0.191 –0.358*** –1.401***(6.54) (–1.33) (–4.94) (–28.42)
RET –0.101*** 4.635*** 2.561*** 1.555***(–4.27) (16.74) (17.63) (14.56)
MCAP 0.001*** 0.009*** 0.002 –0.008***(3.20) (4.67) (1.63) (–10.44)
MB 0.001*** 0.000 0.000 0.000(4.88) (0.47) (0.49) (0.46)
LEV 0.007*** 0.088*** 0.049*** 0.010**(2.78) (8.29) (8.61) (2.44)
ROA 0.001 –0.016*** –0.009*** 0.003(0.70) (–2.67) (-3.09) (1.49)
Disclosure 0.468*** 0.019 0.025 -0.097***(22.94) (0.52) (1.35) (-6.38)
Anti− Self Dealing Index 0.032** 0.171*** 0.103*** 0.078***(2.37) (6.90) (8.48) (7.80)
Creditor Rights 0.032*** –0.043*** –0.023*** –0.023***(22.12) (–10.39) (–11.01) (–13.71)
Rule of Law 0.183*** –0.016 –0.041 –0.113***(5.31) (–0.20) (–1.02) (–4.56)
Stock Market –0.035*** –0.030*** –0.016*** 0.013***(–13.03) (–3.76) (–4.11) (3.85)
GDP –0.079*** 0.077*** 0.046*** 0.016***(–34.72) (10.69) (12.53) (7.89)
GDPGrowth 0.043*** –0.347*** –0.215*** –0.094***(11.76) (–9.25) (–11.44) (–6.68)
F -test of excluded instruments (p-value) (0.00)R2 0.892 0.037 0.042 0.036Obs. 100,751 100,751 100,751 100,751
28
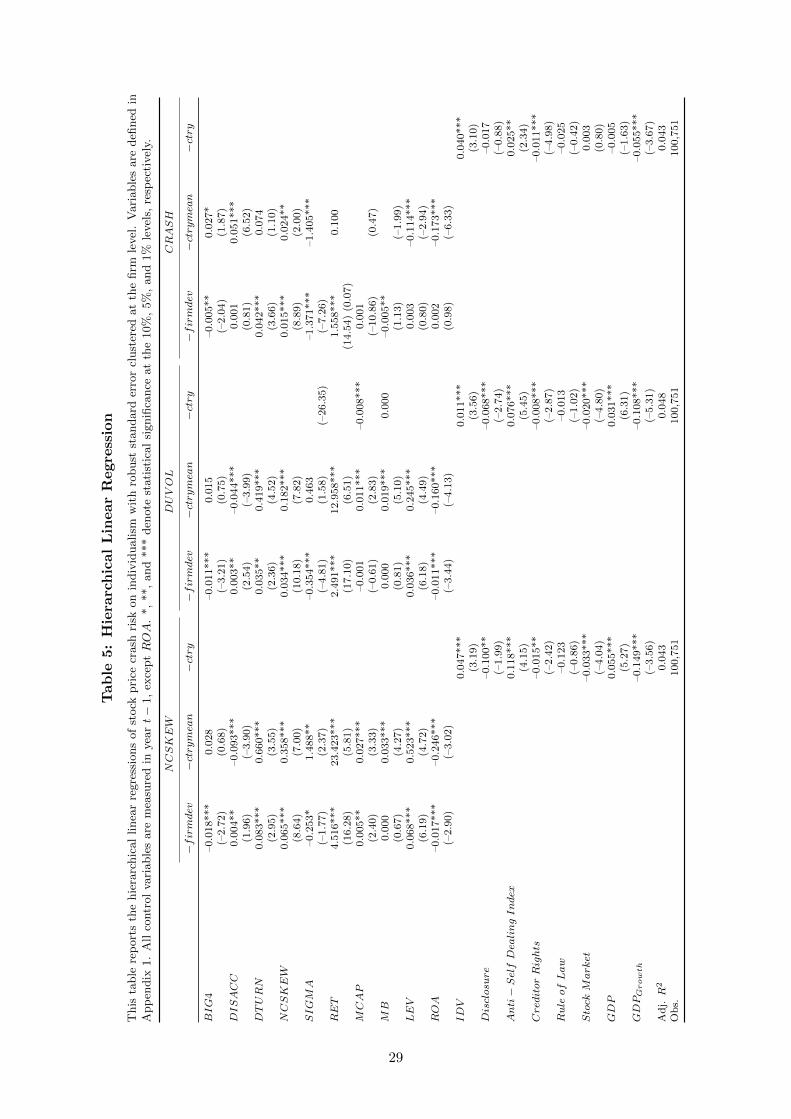
Tab
le5:
Hie
rarc
hic
al
Lin
ear
Regre
ssio
n
This
table
rep
ort
sth
ehie
rarc
hic
al
linea
rre
gre
ssio
ns
of
stock
pri
cecr
ash
risk
on
indiv
idualism
wit
hro
bust
standard
erro
rcl
ust
ered
at
the
firm
level
.V
ari
able
sare
defi
ned
inA
pp
endix
1.
All
contr
ol
vari
able
sare
mea
sure
din
yea
rt−
1,
exce
ptROA
.*,
**,
and
***
den
ote
stati
stic
al
signifi
cance
at
the
10%
,5%
,and
1%
level
s,re
spec
tivel
y.
NCSKEW
DUVOL
CRASH
−firmdev
−ctrymea
n−ctry
−firmdev
−ctrymea
n−ctry
−firmdev
−ctrymea
n−ctry
BIG
4–0.0
18***
0.0
28
–0.0
11***
0.0
15
–0.0
05**
0.0
27*
(–2.7
2)
(0.6
8)
(–3.2
1)
(0.7
5)
(–2.0
4)
(1.8
7)
DISACC
0.0
04**
–0.0
93***
0.0
03**
–0.0
44***
0.0
01
0.0
51***
(1.9
6)
(–3.9
0)
(2.5
4)
(–3.9
9)
(0.8
1)
(6.5
2)
DTURN
0.0
83***
0.6
60***
0.0
35**
0.4
19***
0.0
42***
0.0
74
(2.9
5)
(3.5
5)
(2.3
6)
(4.5
2)
(3.6
6)
(1.1
0)
NCSKEW
0.0
65***
0.3
58***
0.0
34***
0.1
82***
0.0
15***
0.0
24**
(8.6
4)
(7.0
0)
(10.1
8)
(7.8
2)
(8.8
9)
(2.0
0)
SIGM
A–0.2
53*
1.4
88**
–0.3
54***
0.4
63
–1.3
71***
–1.4
05***
(–1.7
7)
(2.3
7)
(–4.8
1)
(1.5
8)
(–26.3
5)
(–7.2
6)
RET
4.5
16***
23.4
23***
2.4
91***
12.9
58***
1.5
58***
0.1
00
(16.2
8)
(5.8
1)
(17.1
0)
(6.5
1)
(14.5
4)
(0.0
7)
MCAP
0.0
05**
0.0
27***
–0.0
01
0.0
11***
–0.0
08***
0.0
01
(2.4
0)
(3.3
3)
(–0.6
1)
(2.8
3)
(–10.8
6)
(0.4
7)
MB
0.0
00
0.0
33***
0.0
00
0.0
19***
0.0
00
–0.0
05**
(0.6
7)
(4.2
7)
(0.8
1)
(5.1
0)
(1.1
3)
(–1.9
9)
LEV
0.0
68***
0.5
23***
0.0
36***
0.2
45***
0.0
03
–0.1
14***
(6.1
9)
(4.7
2)
(6.1
8)
(4.4
9)
(0.8
0)
(–2.9
4)
ROA
–0.0
17***
–0.2
46***
–0.0
11***
–0.1
60***
0.0
02
–0.1
73***
(–2.9
0)
(–3.0
2)
(–3.4
4)
(–4.1
3)
(0.9
8)
(–6.3
3)
IDV
0.0
47***
0.0
11***
0.0
40***
(3.1
9)
(3.5
6)
(3.1
0)
Disclosu
re
–0.1
00**
–0.0
68***
–0.0
17
(–1.9
9)
(–2.7
4)
(–0.8
8)
Anti−
SelfDea
lingIndex
0.1
18***
0.0
76***
0.0
25**
(4.1
5)
(5.4
5)
(2.3
4)
Cred
itorRights
–0.0
15**
–0.0
08***
–0.0
11***
(–2.4
2)
(–2.8
7)
(–4.9
8)
Rule
ofLaw
–0.1
23
–0.0
13
–0.0
25
(–0.8
6)
(–1.0
2)
(–0.4
2)
Stock
Market
–0.0
33***
–0.0
20***
0.0
03
(–4.0
4)
(–4.8
0)
(0.8
0)
GDP
0.0
55***
0.0
31***
–0.0
05
(5.2
7)
(6.3
1)
(–1.6
3)
GDPGrowth
–0.1
49***
–0.1
08***
–0.0
55***
(–3.5
6)
(–5.3
1)
(–3.6
7)
Ad
j.R
20.0
43
0.0
48
0.0
43
Ob
s.100,7
51
100,7
51
100,7
51
29
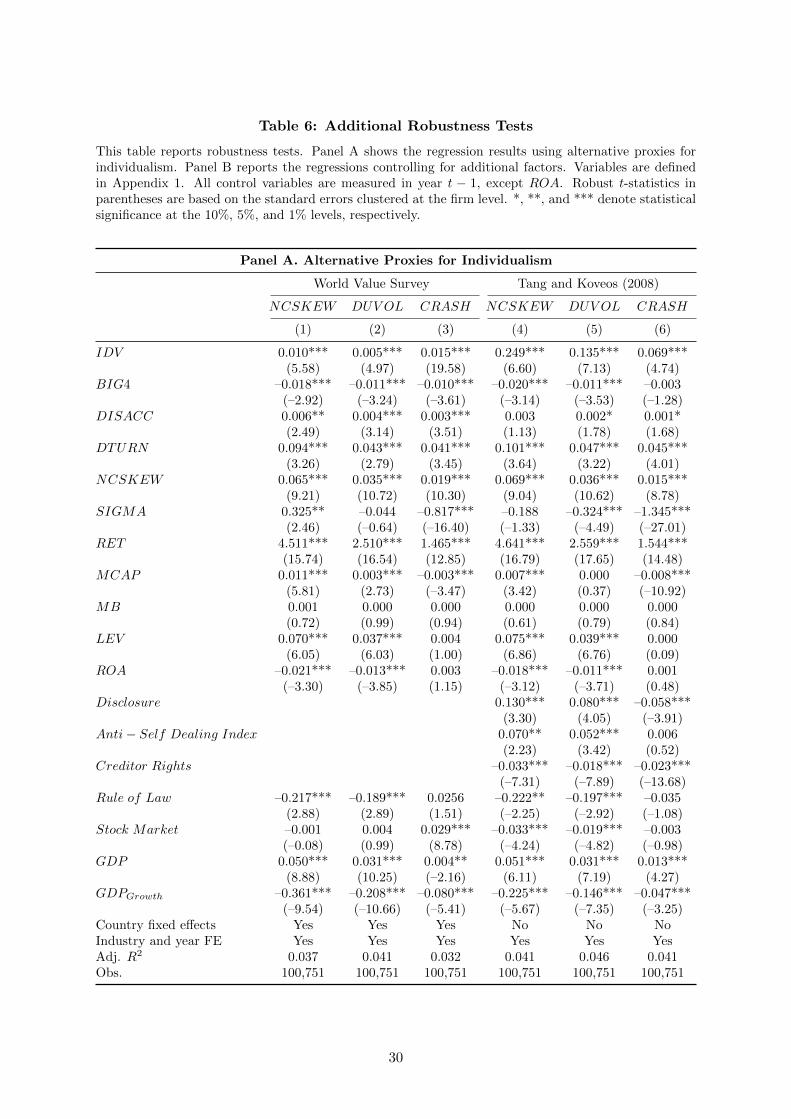
Table 6: Additional Robustness Tests
This table reports robustness tests. Panel A shows the regression results using alternative proxies forindividualism. Panel B reports the regressions controlling for additional factors. Variables are definedin Appendix 1. All control variables are measured in year t − 1, except ROA. Robust t-statistics inparentheses are based on the standard errors clustered at the firm level. *, **, and *** denote statisticalsignificance at the 10%, 5%, and 1% levels, respectively.
Panel A. Alternative Proxies for Individualism
World Value Survey Tang and Koveos (2008)
NCSKEW DUV OL CRASH NCSKEW DUV OL CRASH
(1) (2) (3) (4) (5) (6)
IDV 0.010*** 0.005*** 0.015*** 0.249*** 0.135*** 0.069***(5.58) (4.97) (19.58) (6.60) (7.13) (4.74)
BIG4 –0.018*** –0.011*** –0.010*** –0.020*** –0.011*** –0.003(–2.92) (–3.24) (–3.61) (–3.14) (–3.53) (–1.28)
DISACC 0.006** 0.004*** 0.003*** 0.003 0.002* 0.001*(2.49) (3.14) (3.51) (1.13) (1.78) (1.68)
DTURN 0.094*** 0.043*** 0.041*** 0.101*** 0.047*** 0.045***(3.26) (2.79) (3.45) (3.64) (3.22) (4.01)
NCSKEW 0.065*** 0.035*** 0.019*** 0.069*** 0.036*** 0.015***(9.21) (10.72) (10.30) (9.04) (10.62) (8.78)
SIGMA 0.325** –0.044 –0.817*** –0.188 –0.324*** –1.345***(2.46) (–0.64) (–16.40) (–1.33) (–4.49) (–27.01)
RET 4.511*** 2.510*** 1.465*** 4.641*** 2.559*** 1.544***(15.74) (16.54) (12.85) (16.79) (17.65) (14.48)
MCAP 0.011*** 0.003*** –0.003*** 0.007*** 0.000 –0.008***(5.81) (2.73) (–3.47) (3.42) (0.37) (–10.92)
MB 0.001 0.000 0.000 0.000 0.000 0.000(0.72) (0.99) (0.94) (0.61) (0.79) (0.84)
LEV 0.070*** 0.037*** 0.004 0.075*** 0.039*** 0.000(6.05) (6.03) (1.00) (6.86) (6.76) (0.09)
ROA –0.021*** –0.013*** 0.003 –0.018*** –0.011*** 0.001(–3.30) (–3.85) (1.15) (–3.12) (–3.71) (0.48)
Disclosure 0.130*** 0.080*** –0.058***(3.30) (4.05) (–3.91)
Anti− Self Dealing Index 0.070** 0.052*** 0.006(2.23) (3.42) (0.52)
Creditor Rights –0.033*** –0.018*** –0.023***(–7.31) (–7.89) (–13.68)
Rule of Law –0.217*** –0.189*** 0.0256 –0.222** –0.197*** –0.035(2.88) (2.89) (1.51) (–2.25) (–2.92) (–1.08)
Stock Market –0.001 0.004 0.029*** –0.033*** –0.019*** –0.003(–0.08) (0.99) (8.78) (–4.24) (–4.82) (–0.98)
GDP 0.050*** 0.031*** 0.004** 0.051*** 0.031*** 0.013***(8.88) (10.25) (–2.16) (6.11) (7.19) (4.27)
GDPGrowth –0.361*** –0.208*** –0.080*** –0.225*** –0.146*** –0.047***(–9.54) (–10.66) (–5.41) (–5.67) (–7.35) (–3.25)
Country fixed effects Yes Yes Yes No No NoIndustry and year FE Yes Yes Yes Yes Yes YesAdj. R2 0.037 0.041 0.032 0.041 0.046 0.041Obs. 100,751 100,751 100,751 100,751 100,751 100,751
30
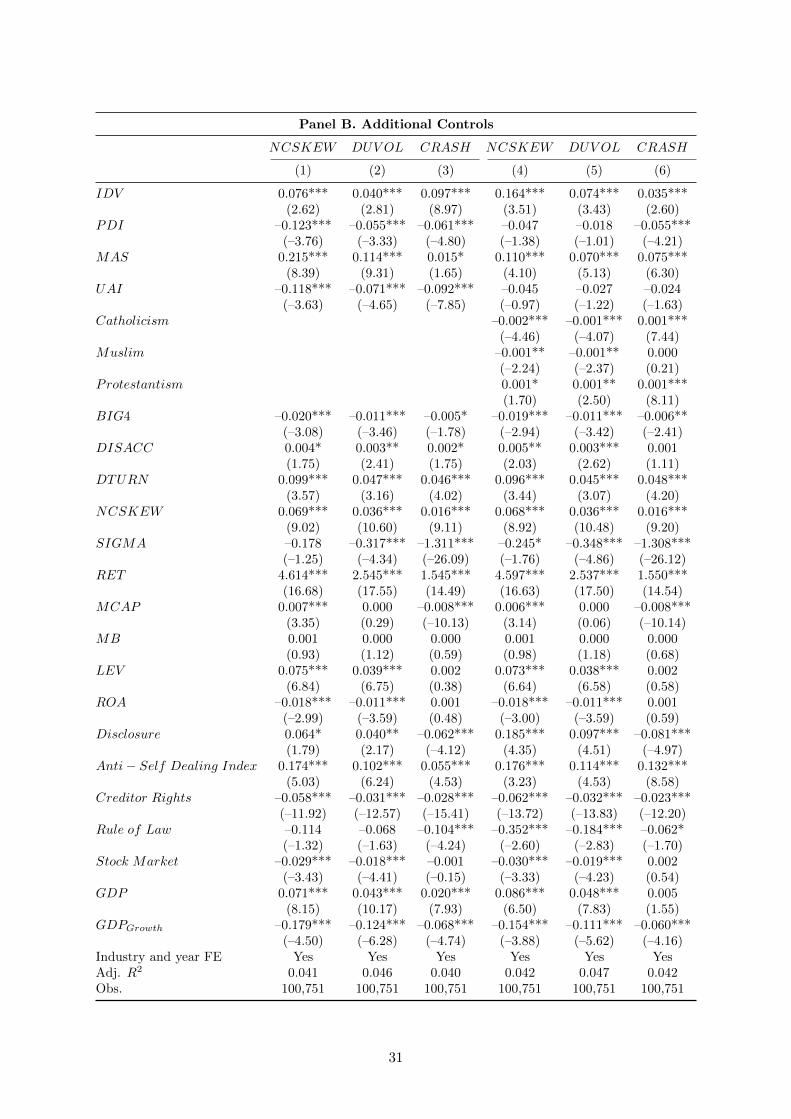
Panel B. Additional Controls
NCSKEW DUV OL CRASH NCSKEW DUV OL CRASH
(1) (2) (3) (4) (5) (6)
IDV 0.076*** 0.040*** 0.097*** 0.164*** 0.074*** 0.035***(2.62) (2.81) (8.97) (3.51) (3.43) (2.60)
PDI –0.123*** –0.055*** –0.061*** –0.047 –0.018 –0.055***(–3.76) (–3.33) (–4.80) (–1.38) (–1.01) (–4.21)
MAS 0.215*** 0.114*** 0.015* 0.110*** 0.070*** 0.075***(8.39) (9.31) (1.65) (4.10) (5.13) (6.30)
UAI –0.118*** –0.071*** –0.092*** –0.045 –0.027 –0.024(–3.63) (–4.65) (–7.85) (–0.97) (–1.22) (–1.63)
Catholicism –0.002*** –0.001*** 0.001***(–4.46) (–4.07) (7.44)
Muslim –0.001** –0.001** 0.000(–2.24) (–2.37) (0.21)
Protestantism 0.001* 0.001** 0.001***(1.70) (2.50) (8.11)
BIG4 –0.020*** –0.011*** –0.005* –0.019*** –0.011*** –0.006**(–3.08) (–3.46) (–1.78) (–2.94) (–3.42) (–2.41)
DISACC 0.004* 0.003** 0.002* 0.005** 0.003*** 0.001(1.75) (2.41) (1.75) (2.03) (2.62) (1.11)
DTURN 0.099*** 0.047*** 0.046*** 0.096*** 0.045*** 0.048***(3.57) (3.16) (4.02) (3.44) (3.07) (4.20)
NCSKEW 0.069*** 0.036*** 0.016*** 0.068*** 0.036*** 0.016***(9.02) (10.60) (9.11) (8.92) (10.48) (9.20)
SIGMA –0.178 –0.317*** –1.311*** –0.245* –0.348*** –1.308***(–1.25) (–4.34) (–26.09) (–1.76) (–4.86) (–26.12)
RET 4.614*** 2.545*** 1.545*** 4.597*** 2.537*** 1.550***(16.68) (17.55) (14.49) (16.63) (17.50) (14.54)
MCAP 0.007*** 0.000 –0.008*** 0.006*** 0.000 –0.008***(3.35) (0.29) (–10.13) (3.14) (0.06) (–10.14)
MB 0.001 0.000 0.000 0.001 0.000 0.000(0.93) (1.12) (0.59) (0.98) (1.18) (0.68)
LEV 0.075*** 0.039*** 0.002 0.073*** 0.038*** 0.002(6.84) (6.75) (0.38) (6.64) (6.58) (0.58)
ROA –0.018*** –0.011*** 0.001 –0.018*** –0.011*** 0.001(–2.99) (–3.59) (0.48) (–3.00) (–3.59) (0.59)
Disclosure 0.064* 0.040** –0.062*** 0.185*** 0.097*** –0.081***(1.79) (2.17) (–4.12) (4.35) (4.51) (–4.97)
Anti− Self Dealing Index 0.174*** 0.102*** 0.055*** 0.176*** 0.114*** 0.132***(5.03) (6.24) (4.53) (3.23) (4.53) (8.58)
Creditor Rights –0.058*** –0.031*** –0.028*** –0.062*** –0.032*** –0.023***(–11.92) (–12.57) (–15.41) (–13.72) (–13.83) (–12.20)
Rule of Law –0.114 –0.068 –0.104*** –0.352*** –0.184*** –0.062*(–1.32) (–1.63) (–4.24) (–2.60) (–2.83) (–1.70)
Stock Market –0.029*** –0.018*** –0.001 –0.030*** –0.019*** 0.002(–3.43) (–4.41) (–0.15) (–3.33) (–4.23) (0.54)
GDP 0.071*** 0.043*** 0.020*** 0.086*** 0.048*** 0.005(8.15) (10.17) (7.93) (6.50) (7.83) (1.55)
GDPGrowth –0.179*** –0.124*** –0.068*** –0.154*** –0.111*** –0.060***(–4.50) (–6.28) (–4.74) (–3.88) (–5.62) (–4.16)
Industry and year FE Yes Yes Yes Yes Yes YesAdj. R2 0.041 0.046 0.040 0.042 0.047 0.042Obs. 100,751 100,751 100,751 100,751 100,751 100,751
31
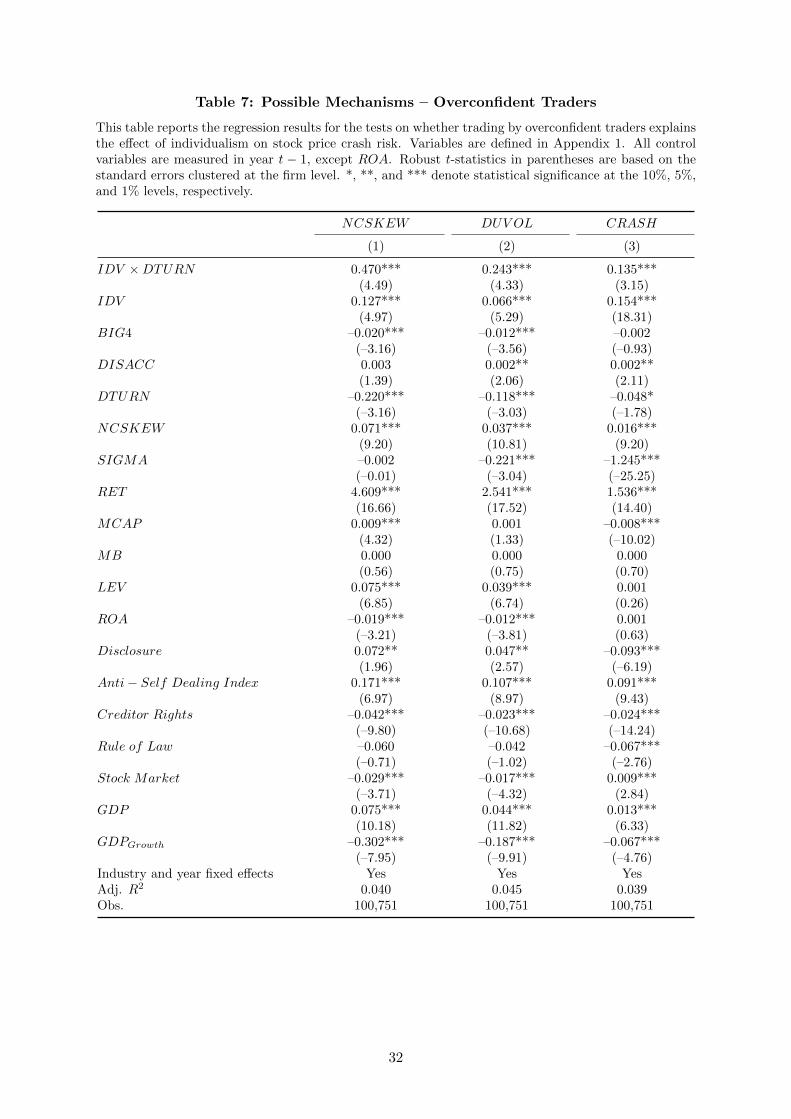
Table 7: Possible Mechanisms – Overconfident Traders
This table reports the regression results for the tests on whether trading by overconfident traders explainsthe effect of individualism on stock price crash risk. Variables are defined in Appendix 1. All controlvariables are measured in year t − 1, except ROA. Robust t-statistics in parentheses are based on thestandard errors clustered at the firm level. *, **, and *** denote statistical significance at the 10%, 5%,and 1% levels, respectively.
NCSKEW DUV OL CRASH
(1) (2) (3)
IDV ×DTURN 0.470*** 0.243*** 0.135***(4.49) (4.33) (3.15)
IDV 0.127*** 0.066*** 0.154***(4.97) (5.29) (18.31)
BIG4 –0.020*** –0.012*** –0.002(–3.16) (–3.56) (–0.93)
DISACC 0.003 0.002** 0.002**(1.39) (2.06) (2.11)
DTURN –0.220*** –0.118*** –0.048*(–3.16) (–3.03) (–1.78)
NCSKEW 0.071*** 0.037*** 0.016***(9.20) (10.81) (9.20)
SIGMA –0.002 –0.221*** –1.245***(–0.01) (–3.04) (–25.25)
RET 4.609*** 2.541*** 1.536***(16.66) (17.52) (14.40)
MCAP 0.009*** 0.001 –0.008***(4.32) (1.33) (–10.02)
MB 0.000 0.000 0.000(0.56) (0.75) (0.70)
LEV 0.075*** 0.039*** 0.001(6.85) (6.74) (0.26)
ROA –0.019*** –0.012*** 0.001(–3.21) (–3.81) (0.63)
Disclosure 0.072** 0.047** –0.093***(1.96) (2.57) (–6.19)
Anti− Self Dealing Index 0.171*** 0.107*** 0.091***(6.97) (8.97) (9.43)
Creditor Rights –0.042*** –0.023*** –0.024***(–9.80) (–10.68) (–14.24)
Rule of Law –0.060 –0.042 –0.067***(–0.71) (–1.02) (–2.76)
Stock Market –0.029*** –0.017*** 0.009***(–3.71) (–4.32) (2.84)
GDP 0.075*** 0.044*** 0.013***(10.18) (11.82) (6.33)
GDPGrowth –0.302*** –0.187*** –0.067***(–7.95) (–9.91) (–4.76)
Industry and year fixed effects Yes Yes YesAdj. R2 0.040 0.045 0.039Obs. 100,751 100,751 100,751
32
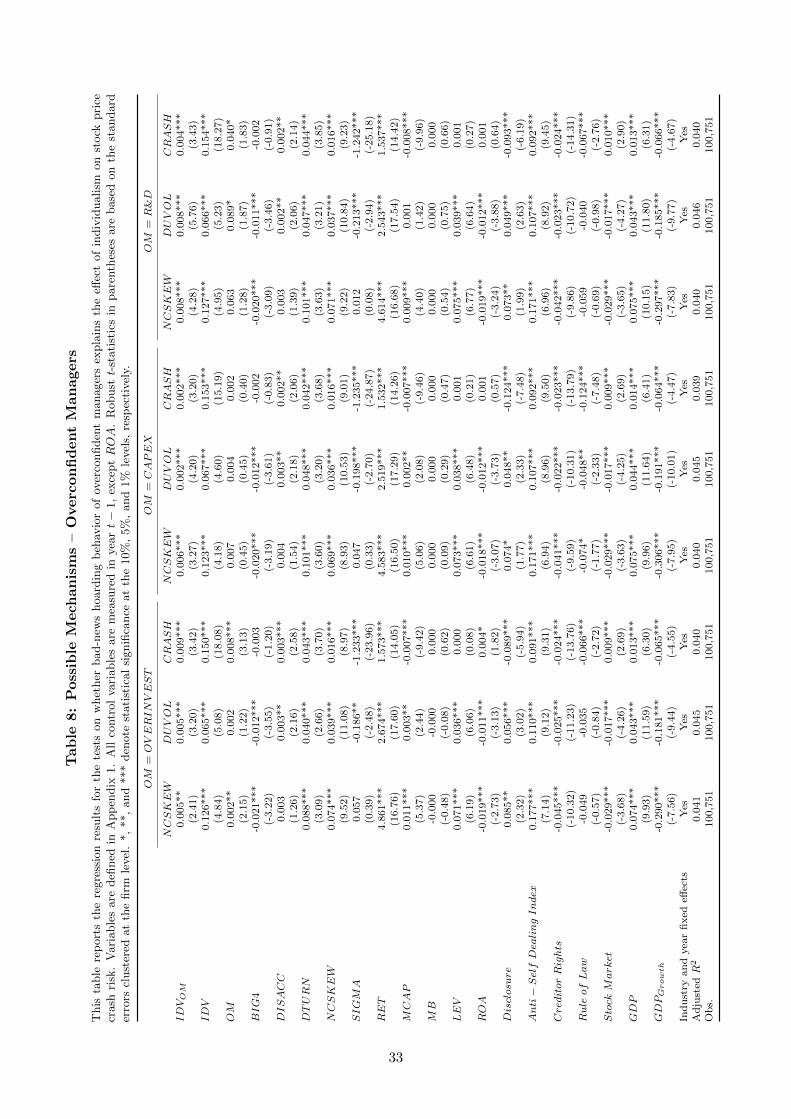
Tab
le8:
Poss
ible
Mech
an
ism
s–
Overc
on
fid
ent
Man
agers
This
table
rep
ort
sth
ere
gre
ssio
nre
sult
sfo
rth
ete
sts
on
whet
her
bad-n
ews
hoard
ing
beh
avio
rof
over
confiden
tm
anager
sex
pla
ins
the
effec
tof
indiv
idualism
on
stock
pri
cecr
ash
risk
.V
ari
able
sare
defi
ned
inA
pp
endix
1.
All
contr
ol
vari
able
sare
mea
sure
din
yea
rt−
1,
exce
ptROA
.R
obust
t-st
ati
stic
sin
pare
nth
eses
are
base
don
the
standard
erro
rscl
ust
ered
at
the
firm
level
.*,
**,
and
***
den
ote
stati
stic
al
signifi
cance
at
the
10%
,5%
,and
1%
level
s,re
spec
tivel
y.
OM
=OVERINVEST
OM
=CAPEX
OM
=R
&D
NCSKEW
DUVOL
CRASH
NCSKEW
DUVOL
CRASH
NCSKEW
DUVOL
CRASH
IDVOM
0.0
05**
0.0
05***
0.0
09***
0.0
06***
0.0
02***
0.0
02***
0.0
08***
0.0
08***
0.0
04***
(2.4
1)
(3.2
0)
(3.4
2)
(3.2
7)
(4.2
0)
(3.2
0)
(4.2
8)
(5.7
6)
(3.4
3)
IDV
0.1
26***
0.0
65***
0.1
50***
0.1
23***
0.0
67***
0.1
53***
0.1
27***
0.0
66***
0.1
54***
(4.8
4)
(5.0
8)
(18.0
8)
(4.1
8)
(4.6
0)
(15.1
9)
(4.9
5)
(5.2
3)
(18.2
7)
OM
0.0
02**
0.0
02
0.0
08***
0.0
07
0.0
04
0.0
02
0.0
63
0.0
89*
0.0
40*
(2.1
5)
(1.2
2)
(3.1
3)
(0.4
5)
(0.4
5)
(0.4
0)
(1.2
8)
(1.8
7)
(1.8
3)
BIG
4-0
.021***
-0.0
12***
-0.0
03
-0.0
20***
-0.0
12***
-0.0
02
-0.0
20***
-0.0
11***
-0.0
02
(-3.2
2)
(-3.5
5)
(-1.2
0)
(-3.1
9)
(-3.6
1)
(-0.8
3)
(-3.0
9)
(-3.4
6)
(-0.9
1)
DISACC
0.0
03
0.0
03**
0.0
03***
0.0
04
0.0
03**
0.0
02**
0.0
03
0.0
02**
0.0
02**
(1.2
6)
(2.1
6)
(2.5
8)
(1.5
4)
(2.1
8)
(2.0
6)
(1.3
9)
(2.0
6)
(2.1
4)
DTURN
0.0
88***
0.0
40***
0.0
43***
0.1
01***
0.0
48***
0.0
42***
0.1
01***
0.0
47***
0.0
44***
(3.0
9)
(2.6
6)
(3.7
0)
(3.6
0)
(3.2
0)
(3.6
8)
(3.6
3)
(3.2
1)
(3.8
5)
NCSKEW
0.0
74***
0.0
39***
0.0
16***
0.0
69***
0.0
36***
0.0
16***
0.0
71***
0.0
37***
0.0
16***
(9.5
2)
(11.0
8)
(8.9
7)
(8.9
3)
(10.5
3)
(9.0
1)
(9.2
2)
(10.8
4)
(9.2
3)
SIGM
A0.0
57
-0.1
86**
-1.2
33***
0.0
47
-0.1
98***
-1.2
35***
0.0
12
-0.2
13***
-1.2
42***
(0.3
9)
(-2.4
8)
(-23.9
6)
(0.3
3)
(-2.7
0)
(-24.8
7)
(0.0
8)
(-2.9
4)
(-25.1
8)
RET
4.8
61***
2.6
74***
1.5
73***
4.5
83***
2.5
19***
1.5
32***
4.6
14***
2.5
43***
1.5
37***
(16.7
6)
(17.6
0)
(14.0
5)
(16.5
0)
(17.2
9)
(14.2
6)
(16.6
8)
(17.5
4)
(14.4
2)
MCAP
0.0
11***
0.0
03**
-0.0
07***
0.0
10***
0.0
02**
-0.0
07***
0.0
09***
0.0
01
-0.0
08***
(5.3
7)
(2.4
4)
(-9.4
2)
(5.0
6)
(2.0
8)
(-9.4
6)
(4.4
0)
(1.4
2)
(-9.9
6)
MB
-0.0
00
-0.0
00
0.0
00
0.0
00
0.0
00
0.0
00
0.0
00
0.0
00
0.0
00
(-0.4
8)
(-0.0
8)
(0.6
2)
(0.0
9)
(0.2
9)
(0.4
7)
(0.5
4)
(0.7
5)
(0.6
6)
LEV
0.0
71***
0.0
36***
0.0
00
0.0
73***
0.0
38***
0.0
01
0.0
75***
0.0
39***
0.0
01
(6.1
9)
(6.0
6)
(0.0
8)
(6.6
1)
(6.4
8)
(0.2
1)
(6.7
7)
(6.6
4)
(0.2
7)
ROA
-0.0
19***
-0.0
11***
0.0
04*
-0.0
18***
-0.0
12***
0.0
01
-0.0
19***
-0.0
12***
0.0
01
(-2.7
3)
(-3.1
3)
(1.8
2)
(-3.0
7)
(-3.7
3)
(0.5
7)
(-3.2
4)
(-3.8
8)
(0.6
4)
Disclosu
re
0.0
85**
0.0
56***
-0.0
89***
0.0
74*
0.0
48**
-0.1
24***
0.0
73**
0.0
49***
-0.0
93***
(2.3
2)
(3.0
2)
(-5.9
4)
(1.7
7)
(2.3
3)
(-7.4
8)
(1.9
9)
(2.6
3)
(-6.1
9)
Anti−
SelfDea
lingIndex
0.1
77***
0.1
10***
0.0
91***
0.1
71***
0.1
07***
0.0
92***
0.1
71***
0.1
07***
0.0
92***
(7.1
4)
(9.1
2)
(9.3
1)
(6.9
4)
(8.9
6)
(9.5
0)
(6.9
6)
(8.9
2)
(9.4
5)
Cred
itorRights
-0.0
45***
-0.0
25***
-0.0
24***
-0.0
41***
-0.0
22***
-0.0
23***
-0.0
42***
-0.0
23***
-0.0
24***
(-10.3
2)
(-11.2
3)
(-13.7
6)
(-9.5
9)
(-10.3
1)
(-13.7
9)
(-9.8
6)
(-10.7
2)
(-14.3
1)
Rule
ofLaw
-0.0
49
-0.0
35
-0.0
66***
-0.0
74*
-0.0
48**
-0.1
24***
-0.0
59
-0.0
40
-0.0
67***
(-0.5
7)
(-0.8
4)
(-2.7
2)
(-1.7
7)
(-2.3
3)
(-7.4
8)
(-0.6
9)
(-0.9
8)
(-2.7
6)
Stock
Market
-0.0
29***
-0.0
17***
0.0
09***
-0.0
29***
-0.0
17***
0.0
09***
-0.0
29***
-0.0
17***
0.0
10***
(-3.6
8)
(-4.2
6)
(2.6
9)
(-3.6
3)
(-4.2
5)
(2.6
9)
(-3.6
5)
(-4.2
7)
(2.9
0)
GDP
0.0
74***
0.0
43***
0.0
13***
0.0
75***
0.0
44***
0.0
14***
0.0
75***
0.0
43***
0.0
13***
(9.9
3)
(11.5
9)
(6.3
0)
(9.9
6)
(11.6
4)
(6.4
1)
(10.1
5)
(11.8
0)
(6.3
1)
GDPGrowth
-0.2
90***
-0.1
81***
-0.0
65***
-0.3
06***
-0.1
91***
-0.0
64***
-0.2
97***
-0.1
85***
-0.0
66***
(-7.5
6)
(-9.4
4)
(-4.5
5)
(-7.9
5)
(-10.0
1)
(-4.4
7)
(-7.8
3)
(-9.7
7)
(-4.6
7)
Ind
ust
ryan
dyea
rfi
xed
effec
tsY
esY
esY
esY
esY
esY
esY
esY
esY
esA
dju
sted
R2
0.0
41
0.0
45
0.0
40
0.0
40
0.0
45
0.0
39
0.0
40
0.0
46
0.0
40
Ob
s.100,7
51
100,7
51
100,7
51
100,7
51
100,7
51
100,7
51
100,7
51
100,7
51
100,7
51
33