Embed Size (px)
Citation preview
National Electrical Contractors Association – National Office
NATIONAL ELECTRICAL CONTRACTORS ASSOCIATION (NECA)
Financial Statements
For the Year Ended 30 June 2016
National Electrical Contractors Association – National Office
2
FINANCIAL STATEMENTS 2015–16
Contents
Independent Audit Report 3
Certificate by Prescribed Designated Officer 5
Operating Report 6
Committee of Management Statement 8
Statement of Comprehensive Income 10
Statement of Financial Position 11
Statement of Changes in Equity 12
Cash Flow Statement 13
Recovery of Wages Activity 14
Notes to and Forming Part of the Financial Statements 15 - 58
National Electrical Contractors Association – National Office
5
CERTIFICATE BY PRESCRIBED DESIGNATED OFFICER
Certificate for the period ended 30 June 2016
I, Suresh Manickam, being the Secretary of the National Electrical Contractors Association – National Office certify:
that the documents lodged herewith are copies of the full report for the National Electrical Contractors Association – National Office for the period ended 30 June 2016 referred to in s.268 of the Fair Work (Registered Organisations) Act 2009; and
that the full report was provided to members of the reporting unit on / /16; and
that the full report was presented to a general meeting of members of the reporting unit on 16/11/16 in accordance with s.266 of the Fair Work (Registered Organisations) Act 2009.
Signature of prescribed designated officer
Name of prescribed designated officer SURESH MANICKAM
Title of prescribed designated officer CEO AND SECRETARY
Dated: .............................................................................................................................................

National Electrical Contractors Association - National Office
OPERATING REPORT BY THE COMMITTEE
The committee presents its report on the reporting unit for the financial year ended 30'' June2016. The report covers the results of the National Electrical Contractors Association - NationalOffice (the reporting unit) and controlled entities.
Review of principal activities, the results of those activities and any significant changesin the nature of those activities during the year
The reporting unit is the National Office of the organisation whose principal activities involverepresenting the interests of its members in the electrical and communications contracting industry.Its principal activities, and through its Chapters, include industrial relations, health and safety,legal, training, business-support services and advocacy representation with government, industrybodies, training bodies and in the industrial tribunals. A review of those activities presents thesame as in the previous reporting period, such that there were no significant changes in the natureof those activities. Members are directed to the NECA 2015 Annual Review for further information.
The profit of the reporting unit and it's controlled entities for the financial year, after providing forincome tax, amounted to $1,528,182 (2015: $1,440,681).
Significant changes in financial affairs
No significant change in the financial affairs of the reporting unit occurred during the year.
Significant Events
No significant events occurred relating to the reporting unit during the year.
After balance date events
No matters or circumstances have arisen since the end of the financial year which significant!yaffected or may affect the operations of the reporting unit, the results of those operations, or thestate of affairs of the reporting unit in future financial years,
Right of members to resign
Members may resign from the Association in accordance with Rule 11, Resignation fromMembership, of the Federal rules of the National Electrical Contractors Association. Ruleconforms with Section I 74 of the Fair Work (Registered Organisations) Act 2009.
National Electrical Contractors Association - National Office
OPERATING REPORT BY THE COMMITTEE (cont'd)
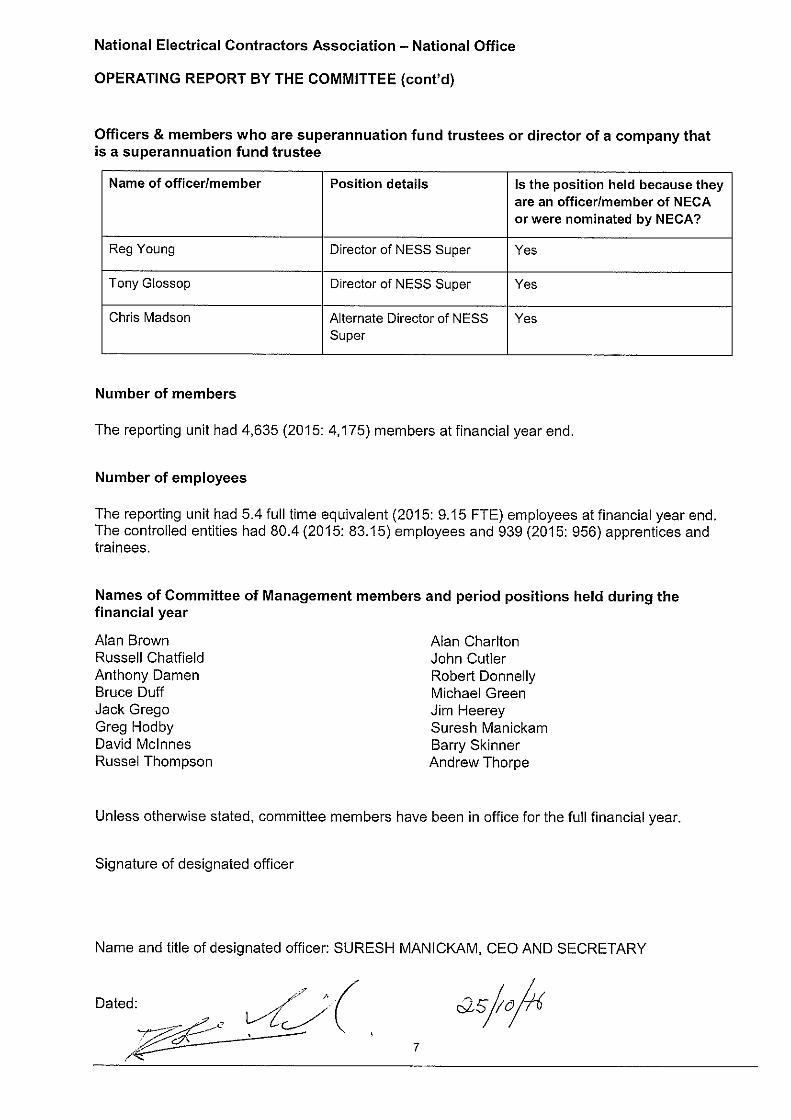
Officers & members who are superannuation fund trustees or director of a company thatis a superannuation fund trustee
Name of officer/member
Reg Young
Tony Glossop
Chris Madson
Number of members
Position details
The reporting unit had 4,635 (2015: 4,175) members at financial year end
Number of employees
The reporting unit had 5.4 full time equivalent (2015: 9.15 FTE) employees at financial year end.The controlled entities had 80.4 (2015: 83.15) employees and 939 (2015: 956) apprentices andtrainees.
Director of NESS Super
Director of NESS Super
Alternate Director of NESS
Super
Names of Committee of Management members and period positions held during thefinancial year
A1an BrownRussell Chaffield
Arithony DarnenBruce Duff
Jack GregoGreg HodbyDavid MCInnes
Russel Thornpson
Is the position held because theyare an officerlinember of NECA
or were nominated by NECA?
Yes
Yes
Yes
Unless otherwise stated, committee members have been in office for the full financial year.
Signature of designated officer
Name and title of designated officer: SURESH MANICKAM, CEO AND SECRETARY
A1an CharltonJohn Cutler
Robert DonnellyMIChael Green
Jim HeereySuresh Manickam
Barry SkinnerAndrew Thorpe
Dated:
if~~ ^Z:;/"^C ,2774,7
National Electrical Contractors Association - National Office
COMMITTEE OF MANAGEMENT STATEMENT
for the period ended 30 June 2016
On the 21/10 12016 the Committee of Management of the National Electrical ContractorsAssociation - National Office passed the following resolution in relation to the general purposefinancial report (GPFR) for the year ended 30 June 2016:
The Committee of Management declares that in its opinion:
(a) the financial statements and notes comply with the Australian AccountingStandards;
(b) the financial statements and notes comply with the reporting guidelines of theGeneral Manager;
(c) the financial statements and notes give a true and fair view of the financialperformance, financial position and cash flows of the reporting unit for the financial yearto which they relate;
(d) there are reasonable grounds to believe that the reporting unit will be able to pay itsdebts as and when they become due and payable; and
(e) during the financial year to which the GPFR relates and since the end of that year:
co meetings of the committee of management were held in accordance with therules of the organisation including the rules of a branch concerned; and
(ii) the financial affairs of the reporting unit have been managed in accordancewith the rules of the organisation including the rules of a branch concerned; and
(iii) the financial records of the reporting unit have been kept and maintained inaccordance with the RO Act; and
(iv) where the organisation consists of two or more reporting units, the financialrecords of the reporting unit have been kept, as far as practicable, in aconsistent manner with each of the other reporting units of the organisation; and
(v) where information has been sought in any request by a member of thereporting unit or General Manager duly made under section 272 of the RO Acthas been provided to the member or General Manager; and
(vi) where any order for inspection of financial records has been made by theFair Work Commission under section 273 of the RO Act, there has beencompliance.
(f) where the reporting unit has not derived revenue from undertaking recovery ofwages activity, include the statement 'no revenue has been derived from undertakingrecovery of wages activity during the reporting period' or
(9) where the reporting unit has derived revenue from undertaking recovery of wagesactivity:
) the financial report on recovery of wages activity has been fairly andaccurately prepared in accordance with the requirements of the reportingguidelines of the General Manager; and
) the committee of management instructed the auditor to include in the scopeof the audit required under subsection 257(, ) of the RO Act all recovery ofwages activity by the reporting unit from which revenues had been derived forthe financial year in respect of such activity; and
8
National Electrical Contractors Association - National Office
(Iii) no fees or reimbursements of expenses in relation to recovery of wagesactivity or donations or other contributions were deducted from moniesrecovered from employers on behalf of workers other than reported in thefinancial report on recovery of wages activity and the notes to the financialstatements; and
(iv) that prior to engaging in any recovery of wages activity, the organisation hasdisclosed to members by way of a written policy all fees to be charged orreimbursement of expenses required for recovery of wages activity, and anylikely request for donations or other contributions in acting for a worker inrecovery of wages activity; and
(v) no fees or reimbursements of expenses in relation to recovery of wagesactivity or donations or other contributions were deducted from moniesrecovered from employers on behalf of workers until distributions of recoveredmoney were made to the workers,
This declaration is made in accordance with a resolution of the minit e of Management.
Signature of designated officer , .~' , *
Name and title of designated officer
Dated: ;!. S 11 011^
SURESH MANICKAM, CEO AND SECRETARY
9
National Electrical Contractors Association – National Office
10
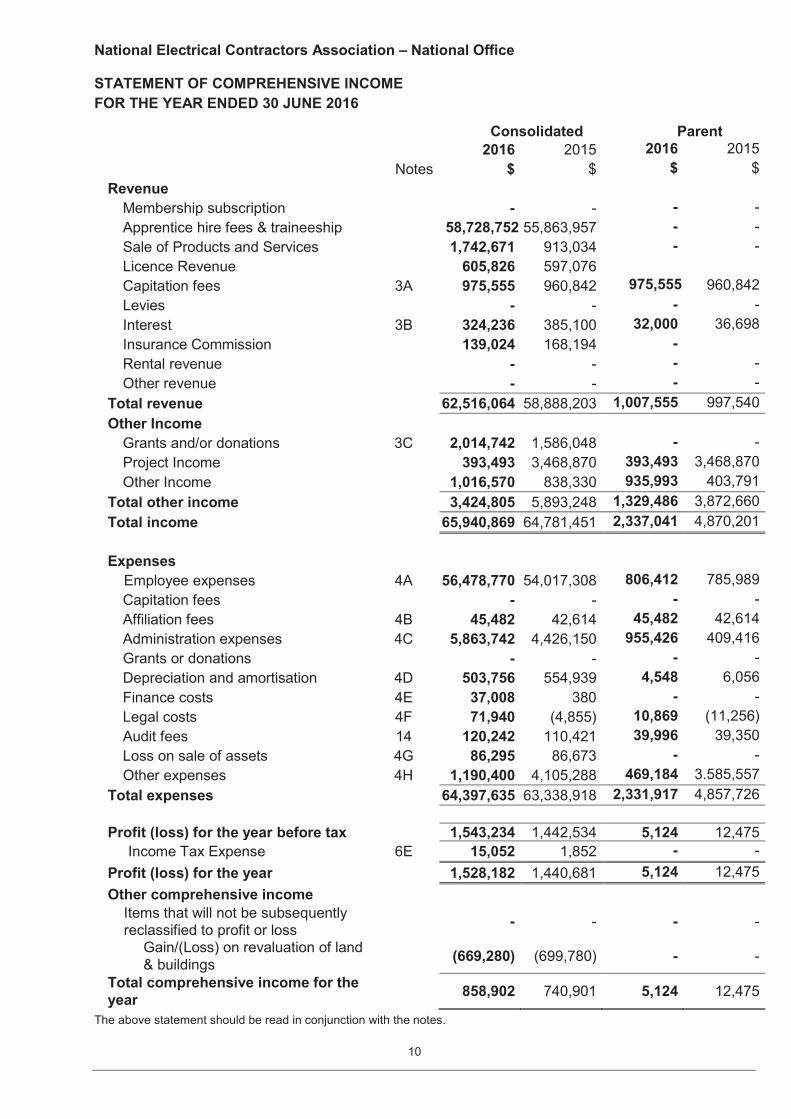
STATEMENT OF COMPREHENSIVE INCOME FOR THE YEAR ENDED 30 JUNE 2016
Consolidated Parent 2016 2015 2016 2015 Notes $ $ $ $
Revenue Membership subscription - - - - Apprentice hire fees & traineeship 58,728,752 55,863,957 - - Sale of Products and Services 1,742,671 913,034 - - Licence Revenue 605,826 597,076 Capitation fees 3A 975,555 960,842 975,555 960,842 Levies - - - - Interest 3B 324,236 385,100 32,000 36,698 Insurance Commission 139,024 168,194 - Rental revenue - - - - Other revenue - - - - Total revenue 62,516,064 58,888,203 1,007,555 997,540 Other Income Grants and/or donations 3C 2,014,742 1,586,048 - - Project Income 393,493 3,468,870 393,493 3,468,870 Other Income 1,016,570 838,330 935,993 403,791 Total other income 3,424,805 5,893,248 1,329,486 3,872,660 Total income 65,940,869 64,781,451 2,337,041 4,870,201 Expenses Employee expenses 4A 56,478,770 54,017,308 806,412 785,989 Capitation fees - - - - Affiliation fees 4B 45,482 42,614 45,482 42,614 Administration expenses 4C 5,863,742 4,426,150 955,426 409,416 Grants or donations - - - - Depreciation and amortisation 4D 503,756 554,939 4,548 6,056 Finance costs 4E 37,008 380 - - Legal costs 4F 71,940 (4,855) 10,869 (11,256) Audit fees 14 120,242 110,421 39,996 39,350 Loss on sale of assets 4G 86,295 86,673 - - Other expenses 4H 1,190,400 4,105,288 469,184 3.585,557 Total expenses 64,397,635 63,338,918 2,331,917 4,857,726 Profit (loss) for the year before tax 1,543,234 1,442,534 5,124 12,475 Income Tax Expense 6E 15,052 1,852 - - Profit (loss) for the year 1,528,182 1,440,681 5,124 12,475 Other comprehensive income
Items that will not be subsequently reclassified to profit or loss - - - -
Gain/(Loss) on revaluation of land & buildings (669,280) (699,780) - -
Total comprehensive income for the year 858,902 740,901 5,124 12,475
The above statement should be read in conjunction with the notes.
National Electrical Contractors Association – National Office
11
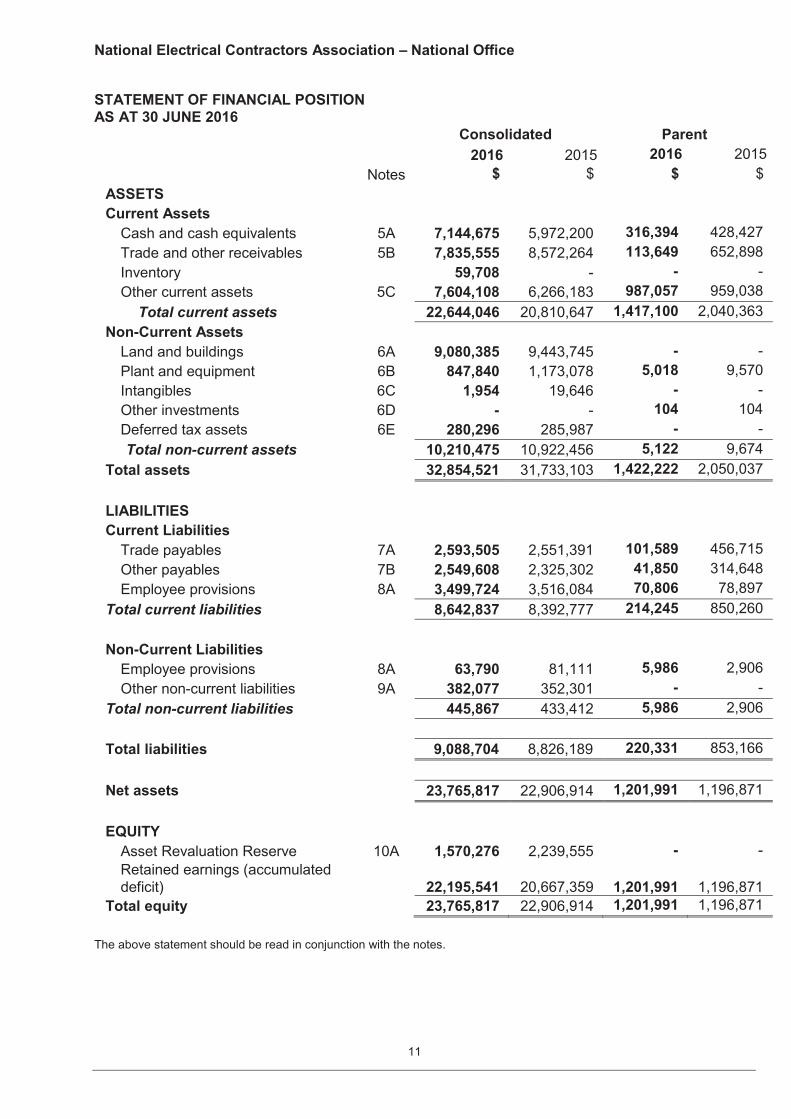
STATEMENT OF FINANCIAL POSITION AS AT 30 JUNE 2016
Consolidated Parent 2016 2015 2016 2015 Notes $ $ $ $
ASSETS Current Assets Cash and cash equivalents 5A 7,144,675 5,972,200 316,394 428,427 Trade and other receivables 5B 7,835,555 8,572,264 113,649 652,898 Inventory 59,708 - - - Other current assets 5C 7,604,108 6,266,183 987,057 959,038 Total current assets 22,644,046 20,810,647 1,417,100 2,040,363 Non-Current Assets Land and buildings 6A 9,080,385 9,443,745 - - Plant and equipment 6B 847,840 1,173,078 5,018 9,570 Intangibles 6C 1,954 19,646 - - Other investments 6D - - 104 104 Deferred tax assets 6E 280,296 285,987 - - Total non-current assets 10,210,475 10,922,456 5,122 9,674 Total assets 32,854,521 31,733,103 1,422,222 2,050,037 LIABILITIES Current Liabilities Trade payables 7A 2,593,505 2,551,391 101,589 456,715 Other payables 7B 2,549,608 2,325,302 41,850 314,648 Employee provisions 8A 3,499,724 3,516,084 70,806 78,897 Total current liabilities 8,642,837 8,392,777 214,245 850,260 Non-Current Liabilities Employee provisions 8A 63,790 81,111 5,986 2,906 Other non-current liabilities 9A 382,077 352,301 - - Total non-current liabilities 445,867 433,412 5,986 2,906 Total liabilities 9,088,704 8,826,189 220,331 853,166 Net assets 23,765,817 22,906,914 1,201,991 1,196,871 EQUITY Asset Revaluation Reserve 10A 1,570,276 2,239,555 - - Retained earnings (accumulated
deficit) 22,195,541
20,667,359
1,201,991
1,196,871
Total equity 23,765,817 22,906,914 1,201,991 1,196,871 The above statement should be read in conjunction with the notes.
National Electrical Contractors Association – National Office
12
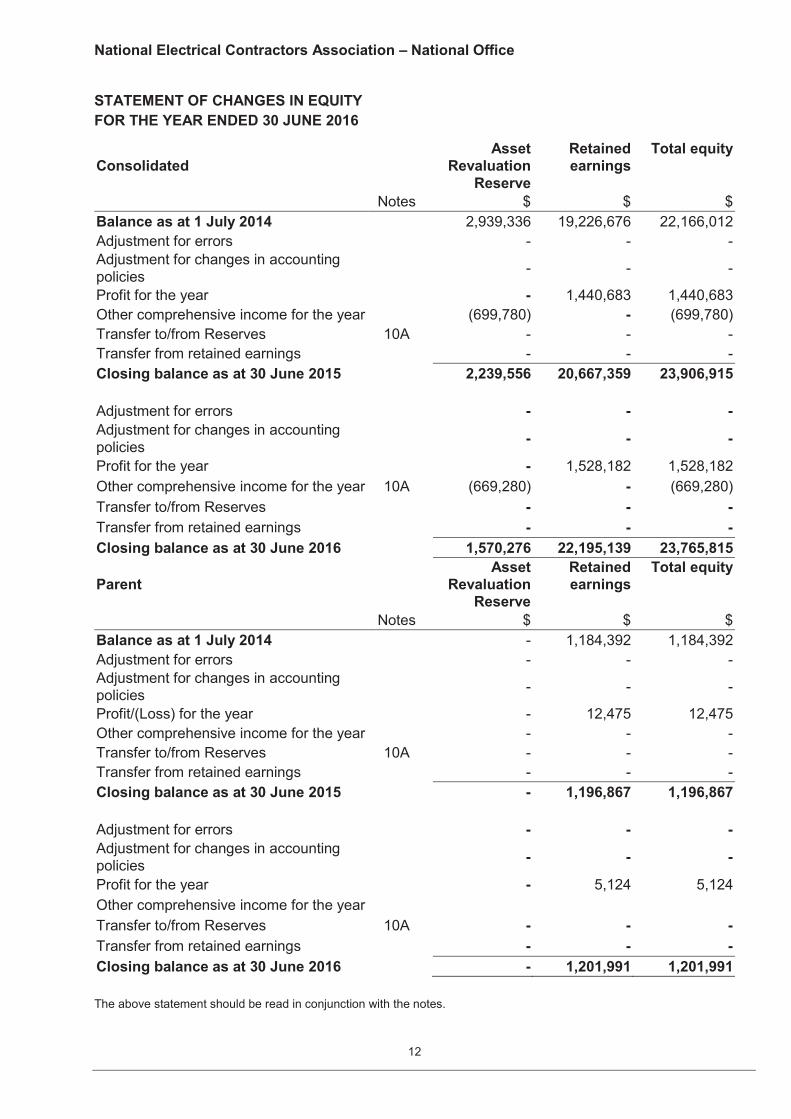
STATEMENT OF CHANGES IN EQUITY FOR THE YEAR ENDED 30 JUNE 2016
Consolidated Asset
Revaluation Reserve
Retained earnings
Total equity
Notes $ $ $ Balance as at 1 July 2014 2,939,336 19,226,676 22,166,012 Adjustment for errors - - - Adjustment for changes in accounting policies - - -
Profit for the year - 1,440,683 1,440,683 Other comprehensive income for the year (699,780) - (699,780) Transfer to/from Reserves 10A - - - Transfer from retained earnings - - - Closing balance as at 30 June 2015 2,239,556 20,667,359 23,906,915 Adjustment for errors - - - Adjustment for changes in accounting policies - - -
Profit for the year - 1,528,182 1,528,182 Other comprehensive income for the year 10A (669,280) - (669,280) Transfer to/from Reserves - - - Transfer from retained earnings - - - Closing balance as at 30 June 2016 1,570,276 22,195,139 23,765,815
Parent Asset
Revaluation Reserve
Retained earnings
Total equity
Notes $ $ $ Balance as at 1 July 2014 - 1,184,392 1,184,392 Adjustment for errors - - - Adjustment for changes in accounting policies - - -
Profit/(Loss) for the year - 12,475 12,475 Other comprehensive income for the year - - - Transfer to/from Reserves 10A - - - Transfer from retained earnings - - - Closing balance as at 30 June 2015 - 1,196,867 1,196,867 Adjustment for errors - - - Adjustment for changes in accounting policies - - -
Profit for the year - 5,124 5,124 Other comprehensive income for the year Transfer to/from Reserves 10A - - - Transfer from retained earnings - - - Closing balance as at 30 June 2016 - 1,201,991 1,201,991 The above statement should be read in conjunction with the notes.
National Electrical Contractors Association – National Office
13
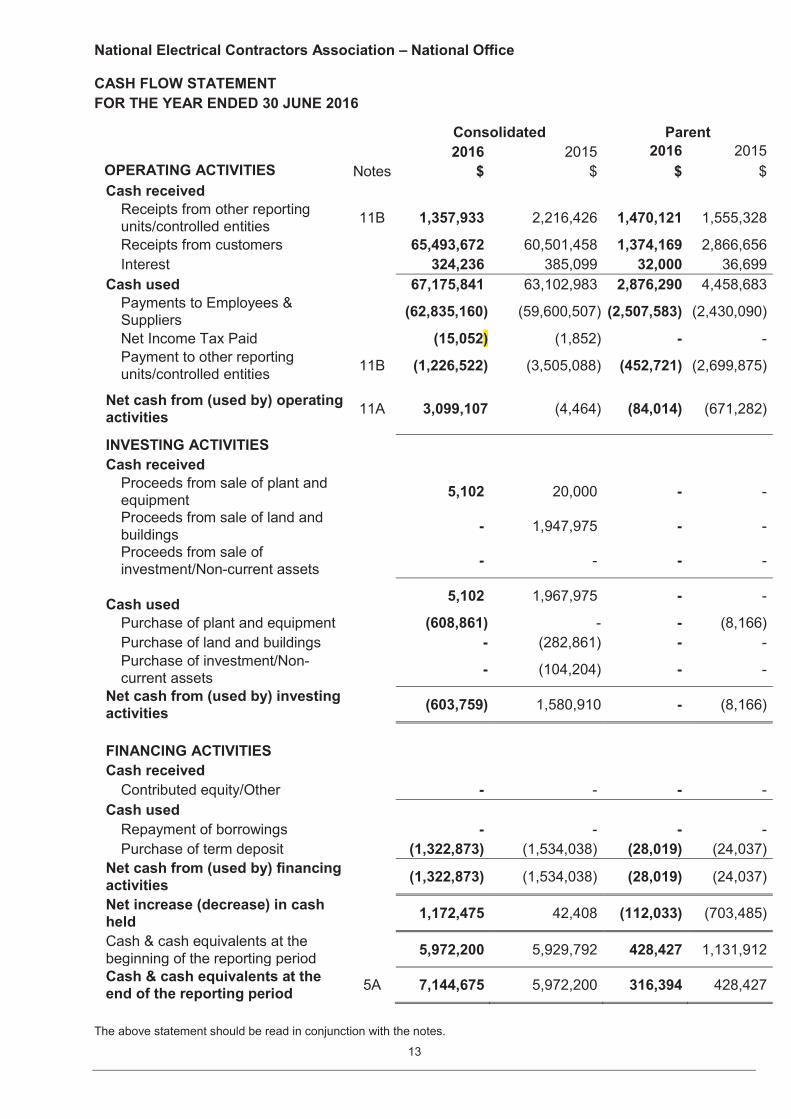
CASH FLOW STATEMENT FOR THE YEAR ENDED 30 JUNE 2016
Consolidated Parent 2016 2015 2016 2015
OPERATING ACTIVITIES Notes $ $ $ $ Cash received Receipts from other reporting
units/controlled entities 11B 1,357,933 2,216,426 1,470,121 1,555,328
Receipts from customers 65,493,672 60,501,458 1,374,169 2,866,656 Interest 324,236 385,099 32,000 36,699 Cash used 67,175,841 63,102,983 2,876,290 4,458,683 Payments to Employees &
Suppliers (62,835,160) (59,600,507) (2,507,583) (2,430,090)
Net Income Tax Paid (15,052) (1,852) - - Payment to other reporting
units/controlled entities 11B (1,226,522) (3,505,088) (452,721) (2,699,875)
Net cash from (used by) operating activities 11A 3,099,107
(4,464)
(84,014) (671,282)
INVESTING ACTIVITIES Cash received Proceeds from sale of plant and
equipment 5,102 20,000 - -
Proceeds from sale of land and buildings - 1,947,975 - -
Proceeds from sale of investment/Non-current assets - - - -
Cash used 5,102 1,967,975 - -
Purchase of plant and equipment (608,861) - - (8,166) Purchase of land and buildings - (282,861) - - Purchase of investment/Non-
current assets - (104,204) - -
Net cash from (used by) investing activities (603,759) 1,580,910 - (8,166)
FINANCING ACTIVITIES Cash received Contributed equity/Other - - - - Cash used Repayment of borrowings - - - - Purchase of term deposit (1,322,873) (1,534,038) (28,019) (24,037) Net cash from (used by) financing activities (1,322,873) (1,534,038) (28,019) (24,037)
Net increase (decrease) in cash held 1,172,475 42,408 (112,033) (703,485)
Cash & cash equivalents at the beginning of the reporting period 5,972,200 5,929,792 428,427 1,131,912
Cash & cash equivalents at the end of the reporting period 5A 7,144,675 5,972,200 316,394 428,427
The above statement should be read in conjunction with the notes.
National Electrical Contractors Association – National Office
14
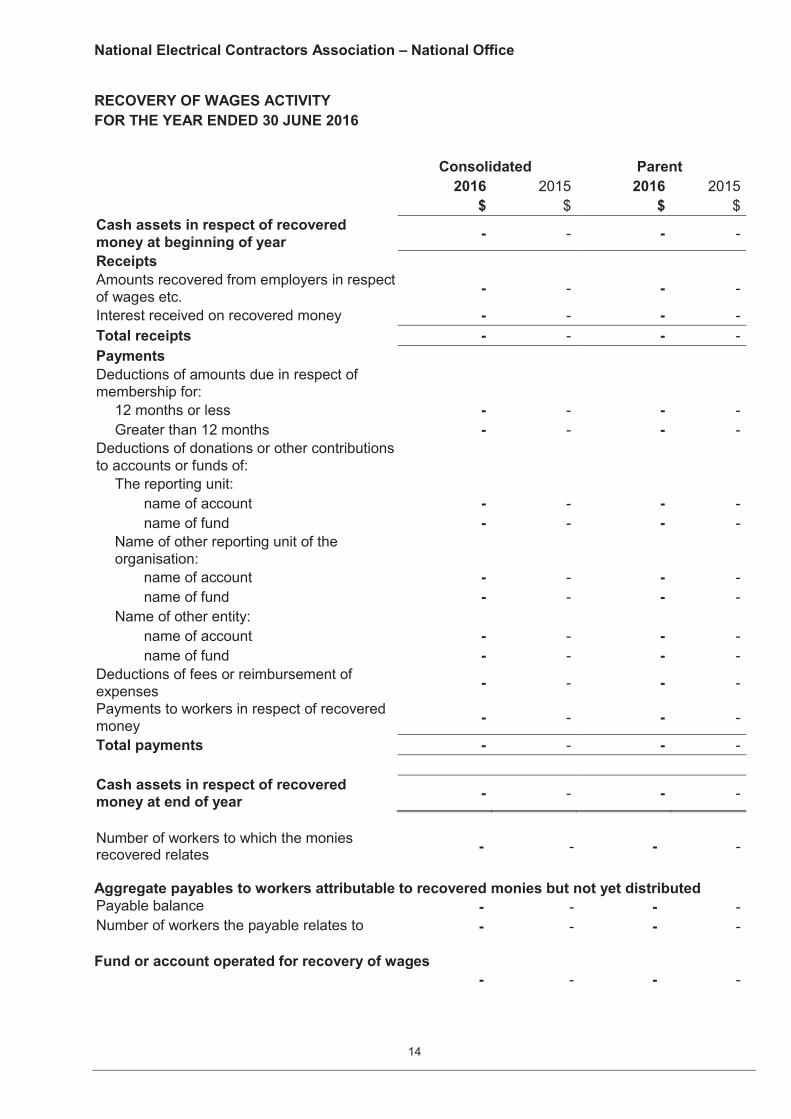
RECOVERY OF WAGES ACTIVITY FOR THE YEAR ENDED 30 JUNE 2016
Consolidated Parent 2016 2015 2016 2015 $ $ $ $ Cash assets in respect of recovered money at beginning of year - - - -
Receipts Amounts recovered from employers in respect of wages etc. - - - -
Interest received on recovered money - - - - Total receipts - - - - Payments Deductions of amounts due in respect of membership for:
12 months or less - - - - Greater than 12 months - - - -
Deductions of donations or other contributions to accounts or funds of:
The reporting unit: name of account - - - - name of fund - - - -
Name of other reporting unit of the organisation:
name of account - - - - name of fund - - - -
Name of other entity: name of account - - - - name of fund - - - -
Deductions of fees or reimbursement of expenses - - - -
Payments to workers in respect of recovered money - - - -
Total payments - - - - Cash assets in respect of recovered money at end of year - - - -
Number of workers to which the monies recovered relates - - - -
Aggregate payables to workers attributable to recovered monies but not yet distributed Payable balance - - - - Number of workers the payable relates to - - - - Fund or account operated for recovery of wages - - - -
National Electrical Contractors Association – National Office
15
Index to the Notes of the Financial Statements
Note 1 Summary of significant accounting policies
Note 2 Events after the reporting period
Note 3 Income
Note 4 Expenses
Note 5 Current assets
Note 6 Non-current assets
Note 7 Current liabilities
Note 8 Provisions
Note 9 Non-current liabilities
Note 10 Equity
Note 11 Cash flow
Note 12 Contingent liabilities, assets and commitments
Note 13 Related party disclosures
Note 14 Remuneration of auditors
Note 15 Financial instruments
Note 16 Fair value measurements
Note 17 Investments in Subsidiaries and Associates
Note 18 Association Details
Note 19 Section 272 Fair Work (Registered Organisations) Act 2009
Note 20 Recovery of Wages Activity
Note 21 Business combinations
National Electrical Contractors Association – National Office
16
NOTES TO THE FINANCIAL STATEMENTS FOR THE YEAR ENDED 30 JUNE 2016
Note 1 Summary of significant accounting policies
The financial statements cover the National Electrical Contractors Association (NECA) as a consolidated entity. The National Electrical Contractors Association ("NECA") is an association of employers registered under the Fair Work (Registered Organisations) Act 2009.
1.1 Going Concern
NECA Legal Pty Ltd NECA Legal Pty Ltd has a net assets deficiency of $521,180 as at 30 June 2016. The net assets deficiency is due to NECA Legal having a loan payable to NECA NSW Chapter amounting to $607,458. NECA Legal has received a guarantee of continuing financial support from NECA National Office to allow the company to meet its liabilities. NECA Training Ltd NECA Training Ltd has a net assets deficiency of $202,973 as at 30 June 2016. The net assets deficiency is due to NECA Training Ltd having a loan payable to NECA NSW Chapter amounting to $305,000. NECA Training Ltd has received a guarantee of continuing financial support from NECA National Office to allow the company to meet its liabilities.
Australian Cabler Registration Services Pty Ltd ACRS has incurred a net profit after tax amounting to $35,120 for the year ended 30 June 2016 and a net profit after tax amounting to $22,100 for the year ended 30 June 2015. NECA National Office, as the parent, has provided a letter of support which will allow the company to pay its debts as and when they fall due. NECA Trade Services Pty Ltd NECA Trade Services Pty Ltd commenced trading during this financial year has a net assets deficiency of $183,404 as at 30 June 2016. The net assets deficiency is due to NECA Trade Services Pty Ltd being in its first year of trading having a loan payable to NECA NSW Chapter of $300,000. NECA Trade Services Pty Ltd has received a guarantee of continuing financial support from NECA National Office to allow the company to meet its liabilities. Notwithstanding the above factors, National Electrical Contractors Association and its controlled entities have made a consolidated profit of $1,528,182 and have a positive consolidated working capital of $14,001,209. The committee is therefore confident that NECA can access funding to provide financial support to the above four controlled entities which will enable them to pay their debts as and when they fall due. The financial support will continue to be made available until at least 12 months from the date of signing of these consolidated financial statements.
1.2 Basis of preparation of the financial statements The financial statements are general purpose financial statements and have been prepared in accordance with Australian Accounting Standards and Interpretations issued by the Australian Accounting Standards Board (AASB) that apply for the reporting period and the Fair Work (Registered Organisation) Act 2009. For the purpose of preparing the general purpose financial statements, NECA is a not-for-profit entity. The financial statements have been prepared on an accrual basis and in accordance with the historical cost, except for certain assets and liabilities measured at fair value, as explained in the accounting policies below. Historical cost is generally based on the fair values of the consideration given in exchange for assets. Except where stated, no allowance is made for the effect of changing prices on the results or the financial position. The financial statements are presented in Australian dollars.
National Electrical Contractors Association – National Office
17
NOTES TO THE FINANCIAL STATEMENTS FOR THE YEAR ENDED 30 JUNE 2016
1.3 Comparative amounts When required by Accounting Standards, comparative figures have been adjusted to conform to changes in presentation for the current financial year.
1.4 Significant accounting judgements and estimates
No accounting assumptions or estimates have been identified that have a significant risk of causing a material adjustment to the carrying amounts of assets and liabilities within the next reporting period.
1.5 New Australian Accounting Standards Adoption of New Australian Accounting Standard requirements No accounting standard has been adopted earlier than the application date stated in the standard. The accounting policies adopted are consistent with those of the previous financial year..
1.6 Basis of consolidation
Pursuant to section 242 of the Fair Work (Registered Organisations ) Act 2009 where an organisation is divided into branches, each branch will be a reporting unit unless a certificate is issued by the General Manager stating that the organisation is, for the purpose of compliance with that Part of the Act, divided into reporting units on an alternative basis. Alternative reporting units are: (a) the whole of the organisation; or (b) a combination of 2 or more branches of the organisation. Each branch of an organisation must be in one, and only one, reporting unit. All state chapters of NECA are separate reporting units. All other controlled entities are consolidated in the NECA National consolidation and are treated as one reporting unit. Pursuant to section 253, as soon as practicable after the end of each financial year, a reporting unit must cause a general purpose financial report to be prepared, in accordance with the Australian Accounting Standards, from the financial records kept under subsection 252(1) in relation to the financial year. These GPFR are required to comply with Tier 1 reporting requirements of AASB 1053. For purposes of the consolidation, the parent comprises the National Electrical Contractors Association - National Office and the subsidiaries and associates of NECA National that are not otherwise required to report as separate reporting units. Refer to note 17 for the entities comprising this reporting unit. In preparing the consolidated financial statements, all inter group balances and transactions between entities in the Association have been eliminated on consolidation. Accounting policies of subsidiaries have been changed where necessary to ensure consistency with those adopted by the parent entity.
National Electrical Contractors Association – National Office
18
NOTES TO THE FINANCIAL STATEMENTS FOR THE YEAR ENDED 30 JUNE 2016
1.7 Investment in associates and joint arrangements
Investments in associates are recognised in the financial statements by applying the equity method of accounting, whereby the investment is initially recognised at cost and adjusted thereafter for the post-acquisition change in the reporting unit's share of net assets of the associate entity. In addition, the reporting unit's share of the profit or loss of the associate company is included in the reporting unit's profit or loss.
Profits and losses resulting from transactions between the reporting unit and the associate are eliminated to the extent of the reporting unit's interest in the associate.
When the reporting unit's share of losses in an associate equals or exceeds its interest in the associate, the reporting unit discontinues recognising its share of further losses unless it has incurred legal or constructive obligations or made payments on behalf of the associate. Upon the associate subsequently making profits, the reporting unit will resume recognising its share of those profits once its share of the profits equals the share of the losses not recognised.
Details of the reporting unit's investments in associates are shown at Note 17.
1.8 Revenue Revenue is measured at the fair value of the consideration received or receivable. Revenue from subscriptions is accounted for on an accrual basis and is recorded as revenue in the year to which it relates. Revenue from the sale of goods is recognised when, the risks and rewards of ownership have been transferred to the buyer, the entity retains no managerial involvement or effective control over the goods, the revenue and transaction costs incurred can be reliably measured, and it is probable that the economic benefits associated with the transaction will flow to the entity. Revenue from the rendering of services is recognised upon the delivery of the service to the customer.
Receivables for goods and services, which have 30 day terms, are recognised at the nominal amounts due less any impairment allowance account. Collectability of debts is reviewed at end of the reporting period. Allowances are made when collectability of the debt is no longer probable. Interest revenue is recognised on an accrual basis using the effective interest method.
Contributions for the ElectroComms Contracting Foundation are recognised as revenue when the right to receive a contribution has been established. Licence fees received in advance are carried forward as a liability in the Balance Sheet to be amortised into income for the relevant years. Licence revenue for 1 year & 3 year licences is recognised proportionally over the period to which it relates.
National Electrical Contractors Association – National Office
19
NOTES TO THE FINANCIAL STATEMENTS FOR THE YEAR ENDED 30 JUNE 2016
1.9 Government grants
Government grants are not recognised until there is reasonable assurance that the reporting unit will comply with the conditions attaching to them and that the grants will be received.
Government grants are recognised in profit or loss on a systematic basis over the periods in which the reporting unit recognises as expenses the related costs for which the grants are intended to compensate. Specifically, government grants whose primary condition is that the [reporting unit] should purchase, construct otherwise acquire non-current assets are recognised as deferred revenue in the statement of financial position and transferred to profit or loss on a systematic and rational basis over the useful lives of the related assets.
Government grants that are receivable as compensation for expenses or losses already incurred or for the purpose of giving immediate financial support to the reporting unit with no future related costs are recognised in profit or loss in the period in which they become receivable.
1.10 Gains Sale of assets Gains and losses from disposal of assets are recognised when control of the asset has passed to the buyer.
1.11 Capitation fees and levies Capitation fees and levies are recognised on an accrual basis and recorded as a revenue and/or expense in the year to which it relates.
1.12 Employee benefits
A liability is recognised for benefits accruing to employees in respect of wages and salaries, annual leave, long service leave and termination benefits when it is probable that settlement will be required and they are capable of being measured reliably. Liabilities for short-term employee benefits (as defined in AASB 119 Employee Benefits) and termination benefits which are expected to be settled within twelve months of the end of reporting period are measured at their nominal amounts. The nominal amount is calculated with regard to the rates expected to be paid on settlement of the liability. Other long-term employee benefits which are expected to be settled beyond twelve months are measured as the present value of the estimated future cash outflows to be made by the reporting unit in respect of services provided by employees up to reporting date. Payments to defined contribution retirement benefit plans are recognised as an expense when employees have rendered service entitling them to the contributions.
National Electrical Contractors Association – National Office
20
NOTES TO THE FINANCIAL STATEMENTS FOR THE YEAR ENDED 30 JUNE 2016
1.13 Leases
Leases are classified as finance leases whenever the terms of the lease transfer substantially all the risks and rewards of ownership to the lessee. All other leases are classified as operating leases. Where an asset is acquired by means of a finance lease, the asset is capitalised at either the fair value of the lease property or, if lower, the present value of minimum lease payments at the inception of the contract and a liability is recognised at the same time and for the same amount. The discount rate used is the interest rate implicit in the lease. Leased assets are amortised over the period of the lease. Lease payments are allocated between the principal component and the interest expense. Operating lease payments are expensed on a straight-line basis which is representative of the pattern of benefits derived from the leased assets. Rental revenue from operating leases is recognised on a straight-line basis over the term of the relevant lease. Initial direct costs incurred in negotiating and arranging an operating lease are added to the carrying amount of the leased asset and recognised on a straight-line basis over the lease term.
1.14 Borrowing costs All borrowing costs are recognised in profit and loss in the period in which they are incurred.
1.15 Cash Cash is recognised at its nominal amount. Cash and cash equivalents includes cash on hand, deposits held at call with bank, other short-term highly liquid investments with original maturity of 3 months or less that are readily convertible to known amounts of cash and subject to insignificant risk of changes in value and bank overdrafts. Bank overdrafts are shown within short-term borrowings in current liabilities on the consolidated statement of financial position.
1.16 Financial instruments Financial assets and financial liabilities are recognised when a [reporting unit] entity becomes a party to the contractual provisions of the instrument.
Financial assets and financial liabilities are initially measured at fair value. Transaction costs that are directly attributable to the acquisition or issue of financial assets and financial liabilities (other than financial assets and financial liabilities at fair value through profit or loss) are added to or deducted from the fair value of the financial assets or financial liabilities, as appropriate, on initial recognition. Transaction costs directly attributable to the acquisition of financial assets or financial liabilities at fair value through profit or loss are recognised immediately in profit or loss.
National Electrical Contractors Association – National Office
21
NOTES TO THE FINANCIAL STATEMENTS FOR THE YEAR ENDED 30 JUNE 2016
1.17 Financial assets
Financial assets are classified into the following specified categories: financial assets at fair value through profit or loss, held-to-maturity investments, available-for-sale financial assets and loans and receivables. The classification depends on the nature and purpose of the financial assets and is determined at the time of initial recognition. All regular way purchases or sales of financial assets are recognised and derecognised upon trade date basis. Regular way purchases or sales are purchases or sales of financial assets that require delivery of assets within the time frame established by regulation or convention in the marketplace. Fair value through profit or loss Financial assets are classified as at fair value through profit or loss when the financial asset is either held for trading or it is designated as at fair value through profit or loss. A financial asset is classified as held for trading if:
it has been acquired principally for the purpose of selling it in the near term; or on initial recognition it is part of a portfolio of identified financial instruments that the
reporting unit manages together and has a recent actual pattern of short-term profit-taking; or it is a derivative that is not designated and effective as a hedging instrument.
A financial asset other than a financial asset held for trading may be designated as at fair value through profit or loss upon initial recognition if:
such designation eliminates or significantly reduces a measurement or recognition inconsistency that would otherwise arise; or the financial asset forms part of a group of financial assets or financial liabilities or
both, which is managed and its performance is evaluated on a fair value basis, in accordance with the reporting units documented risk management or investment strategy, and information about the grouping is provided internally on that basis; or it forms part of a contract containing one or more embedded derivatives, and AASB
139 ‘Financial Instruments: Recognition and Measurement’ permits the entire combined contract (asset or liability) to be designated as at fair value through profit or loss.
Financial assets at fair value through profit or loss are stated at fair value, with any gains or losses arising on remeasurement recognised in profit or loss. The net gain or loss recognised in profit or loss incorporates any dividend or interest earned on the financial asset and is included in the ‘other gains and losses’ line item in the statement of comprehensive income. Held-to-maturity investments Financial assets with fixed or determinable payments and fixed maturity dates that the reporting unit has the positive intent and ability to hold to maturity are classified as held-to-maturity investments. Held-to-maturity investments are measured at amortised cost using the effective interest method less any impairment.
National Electrical Contractors Association – National Office
22
NOTES TO THE FINANCIAL STATEMENTS FOR THE YEAR ENDED 30 JUNE 2016
1.17 Financial assets (cont’d) Available-for-sale Listed shares and listed redeemable notes held by the reporting unit that are traded in an active market are classified as available-for-sale and are stated at fair value. The reporting unit also has investments in unlisted shares that are not traded in an active market but that are also classified as available-for-sale financial assets and stated at fair value. Gains and losses arising from changes in fair value are recognised in other comprehensive income and accumulated in the investments revaluation reserve, with the exception of impairment losses, interest calculated using the effective interest method, and foreign exchange gains and losses on monetary assets, which are recognised in profit or loss. Where the investment is disposed of or is determined to be impaired, the cumulative gain or loss previously accumulated in the investments revaluation reserve is reclassified to profit or loss. Dividends on available-for-sale equity instruments are recognised in profit or loss when the reporting unit right to receive the dividends is established. The fair value of available-for-sale monetary assets denominated in a foreign currency is determined in that foreign currency and translated at the spot rate at the end of the reporting period. The foreign exchange gains and losses that are recognised in profit or loss are determined based on the amortised cost of the monetary asset. Other foreign exchange gains and losses are recognised in other comprehensive income. Loan and receivables Trade receivables, loans and other receivables that have fixed or determinable payments that are not quoted in an active market are classified as ‘loans and receivables’. Loans and receivables are measured at amortised cost using the effective interest method less impairment. Interest is recognised by applying the effective interest rate, except for short-term receivables when the recognition of interest would be immaterial. Effective interest method The effective interest method is a method of calculating the amortised cost of a debt instrument and of allocating interest income over the relevant period. The effective interest rate is the rate that exactly discounts estimated future cash receipts through the expected life of the financial asset, or, when appropriate, a shorter period, to the net carrying amount on initial recognition. Income is recognised on an effective interest rate basis except for debt instruments other than those financial assets that are recognised at fair value through profit or loss. Impairment of financial assets Financial assets, other than those at fair value through profit or loss, are assessed for impairment at the end of each reporting period. Financial assets are considered to be impaired when there is objective evidence that, as a result of one or more events that occurred after the initial recognition of the financial asset, the estimated future cash flows of the investment have been affected. For certain categories of financial asset, such as trade receivables, assets that are assessed not to be impaired individually are, in addition, assessed for impairment on a collective basis. Objective evidence of impairment for a portfolio of receivables could include the reporting
National Electrical Contractors Association – National Office
23
NOTES TO THE FINANCIAL STATEMENTS FOR THE YEAR ENDED 30 JUNE 2016
1.17 Financial assets (cont’d) Impairment of financial assets (cont’d) units past experience of collecting payments, an increase in the number of delayed payments in the portfolio past the average credit period of 60 days, as well as observable changes in national or local economic conditions that correlate with default on receivables. For financial assets carried at amortised cost, the amount of the impairment loss recognised is the difference between the asset’s carrying amount and the present value of estimated future cash flows, discounted at the financial asset’s original effective interest rate.
For financial assets carried at cost, the amount of the impairment loss is measured as the difference between the asset’s carrying amount and the present value of the estimated future cash flows discounted at the current market rate of return for a similar financial asset. Such impairment loss will not be reversed in subsequent periods. The carrying amount of the financial asset is reduced by the impairment loss directly for all financial assets with the exception of trade receivables, where the carrying amount is reduced through the use of an allowance account. When a trade receivable is considered uncollectible, it is written off against the allowance account. Subsequent recoveries of amounts previously written off are credited against the allowance account. Changes in the carrying amount of the allowance account are recognised in profit or loss. When an available-for-sale financial asset is considered to be impaired, cumulative gains or losses previously recognised in other comprehensive income are reclassified to profit or loss in the period. For financial assets measured at amortised cost, if, in a subsequent period, the amount of the impairment loss decreases and the decrease can be related objectively to an event occurring after the impairment was recognised, the previously recognised impairment loss is reversed through profit or loss to the extent that the carrying amount of the investment at the date the impairment is reversed does not exceed what the amortised cost would have been had the impairment not been recognised. In respect of available-for-sale equity securities, impairment losses previously recognised in profit or loss are not reversed through profit or loss. Any increase in fair value subsequent to an impairment loss is recognised in other comprehensive income and accumulated under the heading of investments revaluation reserve. In respect of available-for-sale debt securities, impairment losses are subsequently reversed through profit or loss if an increase in the fair value of the investment can be objectively related to an event occurring after the recognition of the impairment loss. Derecognition of financial assets The reporting unit derecognises a financial asset only when the contractual rights to the cash flows from the asset expire, or when it transfers the financial asset and substantially all the risks and rewards of ownership of the asset to another entity. The difference between the asset’s carrying amount and the sum of the consideration received and receivable and the cumulative gain or loss that had been recognised in other comprehensive income and accumulated in equity is recognised in profit or loss.
National Electrical Contractors Association – National Office
24
NOTES TO THE FINANCIAL STATEMENTS FOR THE YEAR ENDED 30 JUNE 2016
1.18 Financial Liabilities
Financial liabilities are classified as either financial liabilities ‘at fair value through profit or loss’ or other financial liabilities. Financial liabilities are recognised and derecognised upon ‘trade date’. Fair value through profit or loss
Financial liabilities are classified as at fair value through profit or loss when the financial liability is either held for trading or it is designated as at fair value through profit or loss.
A financial liability is classified as held for trading if:
it has been acquired principally for the purpose of repurchasing it in the near term; or on initial recognition it is part of a portfolio of identified financial instruments that the
reporting unit manages together and has a recent actual pattern of short-term profit-taking; or it is a derivative that is not designated and effective as a hedging instrument.
A financial liability other than a financial liability held for trading may be designated as at fair value through profit or loss upon initial recognition if:
such designation eliminates or significantly reduces a measurement or recognition inconsistency that would otherwise arise; or the financial liability forms part of a group of financial assets or financial liabilities or
both, which is managed and its performance is evaluated on a fair value basis, in accordance with the reporting units documented risk management or investment strategy, and information about the grouping is provided internally on that basis; or it forms part of a contract containing one or more embedded derivatives, and AASB
139 ‘Financial Instruments: Recognition and Measurement’ permits the entire combined contract (asset or liability) to be designated as at fair value through profit or loss.
Financial liabilities at fair value through profit or loss are stated at fair value, with any gains or losses arising on remeasurement recognised in profit or loss. The net gain or loss recognised in profit or loss incorporates any interest paid on the financial liability and is included in the ‘other gains and losses’ line item in the statement of comprehensive income. Other financial liabilities
Other financial liabilities, including borrowings and trade and other payables, are initially measured at fair value, net of transaction costs. Other financial liabilities are subsequently measured at amortised cost using the effective interest method, with interest expense recognised on an effective yield basis.
Derecognition of financial liabilities The reporting unit derecognises financial liabilities when, and only when, the reporting units obligations are discharged, cancelled or they expire. The difference between the carrying amounts of the financial liability derecognised and the consideration paid and payable is recognised in profit or loss.
National Electrical Contractors Association – National Office
25
NOTES TO THE FINANCIAL STATEMENTS FOR THE YEAR ENDED 30 JUNE 2016
1.19 Contingent Liabilities and Contingent Assets
Contingent liabilities and contingent assets are not recognised in the Statement of Financial Position but are reported in the relevant notes. They may arise from uncertainty as to the existence of a liability or asset or represent an existing liability or asset in respect of which the amount cannot be reliably measured. Contingent assets are disclosed when settlement is probable but not virtually certain, and contingent liabilities are disclosed when settlement is greater than remote.
1.20 Land, Buildings, Plant and Equipment Asset Recognition Threshold Purchases of land, buildings, plant and equipment are recognised initially at cost in the Statement of Financial Position. The initial cost of an asset includes an estimate of the cost of dismantling and removing the item and restoring the site on which it is located.
Revaluations—Land and Buildings Following initial recognition at cost, land and buildings are carried at fair value less subsequent accumulated depreciation and accumulated impairment losses. Revaluations are performed with sufficient frequency such that the carrying amount of assets do not differ materially from those that would be determined using fair values as at the reporting date. Revaluation adjustments are made on a class basis. Any revaluation increment is credited to equity under the heading of asset revaluation reserve except to the extent that it reversed a previous revaluation decrement of the same asset class that was previously recognised in the surplus/deficit. Revaluation decrements for a class of assets are recognised directly in the profit or loss except to the extent that they reverse a previous revaluation increment for that class. Any accumulated depreciation as at the revaluation date is eliminated against the gross carrying amount of the asset and the asset is restated to the revalued amount.
Computer software is recognised as an asset in accordance with the requirement of AASB 116. This asset is carried at cost less any accumulated depreciation and any accumulated impairment loss. Depreciation Depreciable property, plant and equipment assets are written-off to their estimated residual values over their estimated useful life using, in all cases, the straight line method of depreciation. Depreciation rates (useful lives), residual values and methods are reviewed at each reporting date and necessary adjustments are recognised in the current, or current and future reporting periods, as appropriate.
National Electrical Contractors Association – National Office
26
NOTES TO THE FINANCIAL STATEMENTS FOR THE YEAR ENDED 30 JUNE 2016
1.20 Land, Buildings, Plant and Equipment (cont’d)
Depreciation (cont’d)
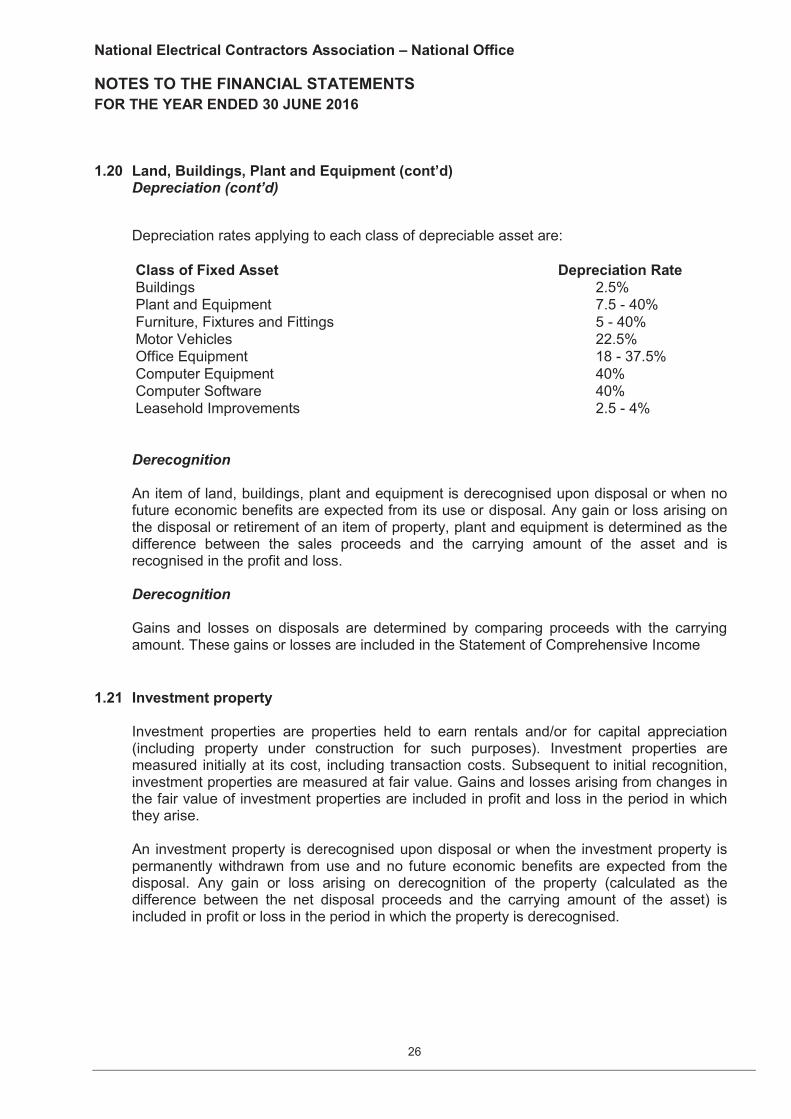
Depreciation rates applying to each class of depreciable asset are: Class of Fixed Asset Depreciation Rate Buildings 2.5% Plant and Equipment 7.5 - 40% Furniture, Fixtures and Fittings 5 - 40% Motor Vehicles 22.5% Office Equipment 18 - 37.5% Computer Equipment 40% Computer Software 40% Leasehold Improvements 2.5 - 4%
Derecognition An item of land, buildings, plant and equipment is derecognised upon disposal or when no future economic benefits are expected from its use or disposal. Any gain or loss arising on the disposal or retirement of an item of property, plant and equipment is determined as the difference between the sales proceeds and the carrying amount of the asset and is recognised in the profit and loss. Derecognition Gains and losses on disposals are determined by comparing proceeds with the carrying amount. These gains or losses are included in the Statement of Comprehensive Income
1.21 Investment property Investment properties are properties held to earn rentals and/or for capital appreciation (including property under construction for such purposes). Investment properties are measured initially at its cost, including transaction costs. Subsequent to initial recognition, investment properties are measured at fair value. Gains and losses arising from changes in the fair value of investment properties are included in profit and loss in the period in which they arise. An investment property is derecognised upon disposal or when the investment property is permanently withdrawn from use and no future economic benefits are expected from the disposal. Any gain or loss arising on derecognition of the property (calculated as the difference between the net disposal proceeds and the carrying amount of the asset) is included in profit or loss in the period in which the property is derecognised.
National Electrical Contractors Association – National Office
27
NOTES TO THE FINANCIAL STATEMENTS FOR THE YEAR ENDED 30 JUNE 2016
1.22 Intangibles
An internally-generated intangible asset arising from the Association's development such as Training development and website costs is recognised only if the Association can demonstrate all of the following conditions in accordance with AASB 138 Intangible Assets:
the technical feasibility of completing the intangible asset so that it will be available for use or sale;
the intention to complete the intangible asset and use or sell it;
the ability to use or sell the intangible asset;
the probability that the asset created will generate future economic benefits;
the availability of adequate technical, financial and other resources to complete the development and to use or sell the intangible asset; and
the ability to measure reliably the expenditure attributable to the intangible asset during development The Association’s internally-generated intangibles are amortised on a straight-line basis over its estimated useful life of three years. Where no internally-generated intangible asset can be recognised, development expenditure is charged to the statement of comprehensive income in the period in which it is incurred.
The estimated useful lives and depreciation method are reviewed at each year-end, with the effect of any changes in estimate accounted for on a prospective basis.
Any impairment losses are recognised in the Statement of Comprehensive Income in accordance with the requirements of AASB 136 Impairment of Assets.
For website costs, the requirements of AASB Interpretation 132 Website costs have been complied with.
Derecognition An intangible asset is derecognised on disposal, or when no future economic benefits are expected from use or disposal. Gains or losses arising from derecognition of an intangible asset, measured as the difference between the net disposal proceeds and the carrying amount of the asset are recognised in profit and loss when the asset is derecognised.
1.23 Impairment for non-financial assets All assets are assessed for impairment at the end of each reporting period to the extent that there is an impairment trigger. Where indications of impairment exist, the asset’s recoverable amount is estimated and an impairment adjustment made if the asset’s recoverable amount is less than its carrying amount.
National Electrical Contractors Association – National Office
28
NOTES TO THE FINANCIAL STATEMENTS FOR THE YEAR ENDED 30 JUNE 2016
1.23 Impairment for non-financial assets (cont’d) The recoverable amount of an asset is the higher of its fair value less costs of disposal and its value in use. Value in use is the present value of the future cash flows expected to be derived from the asset. Where the future economic benefit of an asset is not primarily dependent on the asset’s ability to generate future cash flows, and the asset would be replaced if the [reporting unit] were deprived of the asset, its value in use is taken to be its depreciated replacement cost.
1.24 Non-current assets held for sale Non-current assets are classified as held for sale if their carrying amount will be recovered principally through a sale transaction rather than through continuing use. This condition is regarded as met only when the sale is highly probable and the non-current asset is available for immediate sale in its present condition. Management must be committed to the sale, which should be expected to qualify for recognition as a completed sale within one year from the date of classification.
Non-current assets classified as held for sale are measured at the lower of their previous carrying amount and fair value less costs of disposal.
1.25 Taxation The Association as an “Association of Employers” is exempt from income tax under section 50.1 of the Income Tax Assessment Act 1997 however still has obligation for Fringe Benefits Tax (FBT) and the Goods and Services Tax (GST).
Some subsidiaries however, that fall under the control of the Association are for profit entities that are subject to income tax. The relevant tax treatments for these entities are set out below.
The income tax expense (revenue) for the year comprises current income tax expense (income) and deferred tax expense (income).
Current income tax expense charged to the profit or loss is the tax payable on taxable income calculated using applicable income tax rates enacted, or substantially enacted, as at the end of the reporting period. Current tax liabilities (assets) are therefore measured at the amounts expected to be paid to (recovered from) the relevant taxation authority.
Deferred income tax expense reflects movements in deferred tax asset and deferred tax liability balances during the year as well as unused tax losses.
Current and deferred income tax expense (income) is charged or credited directly to equity instead of the profit or loss when the tax relates to items that are credited or charged directly to equity.
Deferred tax assets and liabilities are ascertained based on temporary differences arising between the tax bases of assets and liabilities and their carrying amounts in the financial statements. Deferred tax assets also result where amounts have been fully expensed but future tax deductions are available. No deferred income tax will be recognised from the initial recognition of an asset or liability, excluding a business combination, where there is no effect on accounting or taxable profit or loss.
National Electrical Contractors Association – National Office
29
NOTES TO THE FINANCIAL STATEMENTS FOR THE YEAR ENDED 30 JUNE 2016
1.25 Taxation (cont’d)
Deferred tax assets and liabilities are calculated at the tax rates that are expected to apply to the period when the asset is realised or the liability is settled, based on tax rates enacted or substantively enacted at the end of the reporting year. Their measurement also reflects the manner in which management expects to recover or settle the carrying amount of the related asset or liability.
Deferred tax assets relating to temporary differences and unused tax losses are recognised only to the extent that it is probable that future taxable profit will be available against which the benefits of the deferred tax asset can be utilised. Revenues, expenses and assets are recognised net of GST except:
where the amount of GST incurred is not recoverable from the Australian Taxation Office; and
for receivables and payables.
The net amount of GST recoverable from, or payable to, the taxation authority is included as part of receivables or payables. Cash flows are included in the cash flow statement on a gross basis. The GST component of cash flows arising from investing and financing activities which is recoverable from, or payable to, the Australian Taxation Office is classified within operating cash flows.
1.26 Fair value measurement
The reporting unit measures financial instruments, such as, financial asset as at fair value through the profit and loss, available for sale financial assets, and non-financial assets such as land and buildings and investment properties, at fair value at each balance sheet date. Also, fair values of financial instruments measured at amortised cost are disclosed in Note 16A. Fair value is the price that would be received to sell an asset or paid to transfer a liability in an orderly transaction between market participants at the measurement date. The fair value measurement is based on the presumption that the transaction to sell the asset or transfer the liability takes place either:
-In the principal market for the asset or liability, or -In the absence of a principal market, in the most advantageous market for the asset or liability
The principal or the most advantageous market must be accessible by the [reporting unit].The fair value of an asset or a liability is measured using the assumptions that market participants would use when pricing the asset or liability, assuming that market participants act in their economic best interest. A fair value measurement of a non-financial asset takes into account a market participant's ability to generate economic benefits by using the asset in its highest and best use or by selling it to another market participant that would use the asset in its highest and best use.
National Electrical Contractors Association – National Office
30
NOTES TO THE FINANCIAL STATEMENTS FOR THE YEAR ENDED 30 JUNE 2016
1.26 Fair value measurement (cont’d) The reporting unit uses valuation techniques that are appropriate in the circumstances and for which sufficient data are available to measure fair value, maximising the use of relevant observable inputs and minimising the use of unobservable inputs. All assets and liabilities for which fair value is measured or disclosed in the financial statements are categorised within the fair value hierarchy, described as follows, based on the lowest level input that is significant to the fair value measurement as a whole:
Level 1—Quoted (unadjusted) market prices in active markets for identical assets or liabilities Level 2—Valuation techniques for which the lowest level input that is significant to
the fair value measurement is directly or indirectly observable Level 3—Valuation techniques for which the lowest level input that is significant to
the fair value measurement is unobservable
For assets and liabilities that are recognised in the financial statements on a recurring basis, the [reporting unit] determines whether transfers have occurred between Levels in the hierarchy by re-assessing categorisation (based on the lowest level input that is significant to the fair value measurement as a whole) at the end of each reporting period.
External valuers are involved for valuation of significant assets, such as land and buildings and investment properties. Selection criteria include market knowledge, reputation, independence and whether professional standards are maintained. For the purpose of fair value disclosures, the [reporting unit] has determined classes of assets and liabilities on the basis of the nature, characteristics and risks of the asset or liability and the level of the fair value hierarchy.
National Electrical Contractors Association – National Office
31
NOTES TO THE FINANCIAL STATEMENTS FOR THE YEAR ENDED 30 JUNE 2016
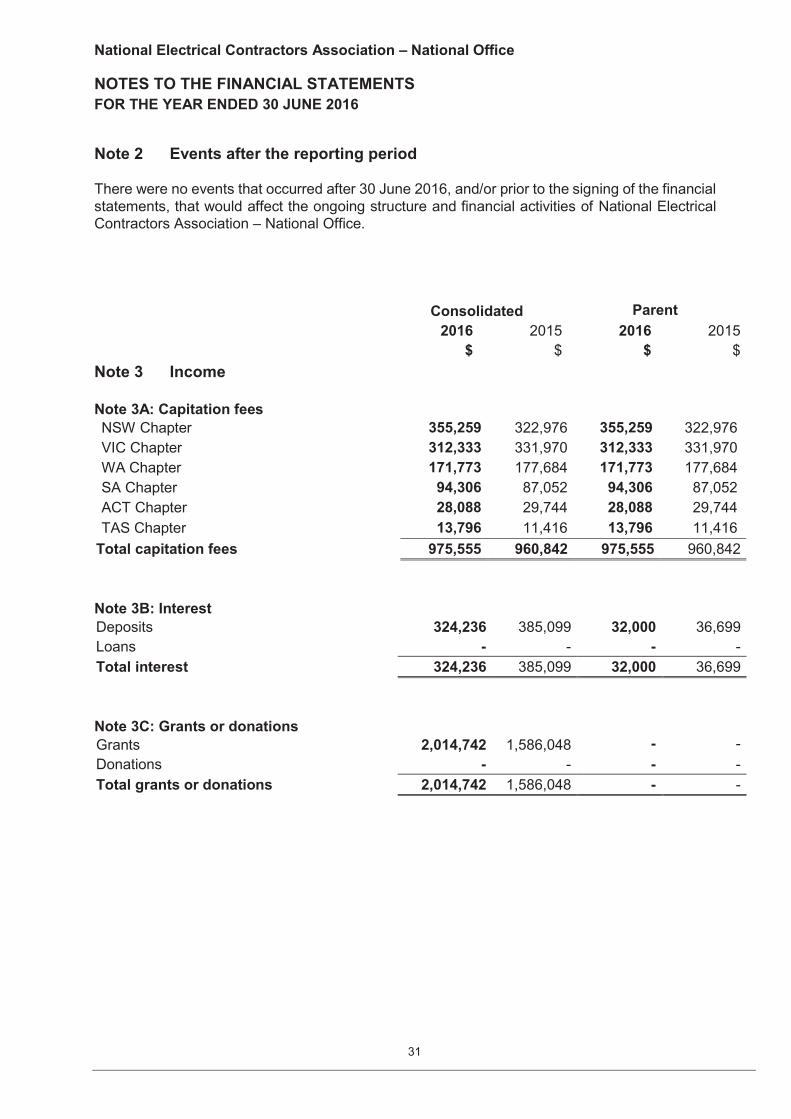
Note 2 Events after the reporting period There were no events that occurred after 30 June 2016, and/or prior to the signing of the financial statements, that would affect the ongoing structure and financial activities of National Electrical Contractors Association – National Office. Consolidated Parent 2016 2015 2016 2015 $ $ $ $ Note 3 Income Note 3A: Capitation fees
NSW Chapter 355,259 322,976 355,259 322,976 VIC Chapter 312,333 331,970 312,333 331,970 WA Chapter 171,773 177,684 171,773 177,684 SA Chapter 94,306 87,052 94,306 87,052 ACT Chapter 28,088 29,744 28,088 29,744 TAS Chapter 13,796 11,416 13,796 11,416
Total capitation fees 975,555 960,842 975,555 960,842 Note 3B: Interest Deposits 324,236 385,099 32,000 36,699 Loans - - - - Total interest 324,236 385,099 32,000 36,699 Note 3C: Grants or donations Grants 2,014,742 1,586,048 - - Donations - - - - Total grants or donations 2,014,742 1,586,048 - -
National Electrical Contractors Association – National Office
32
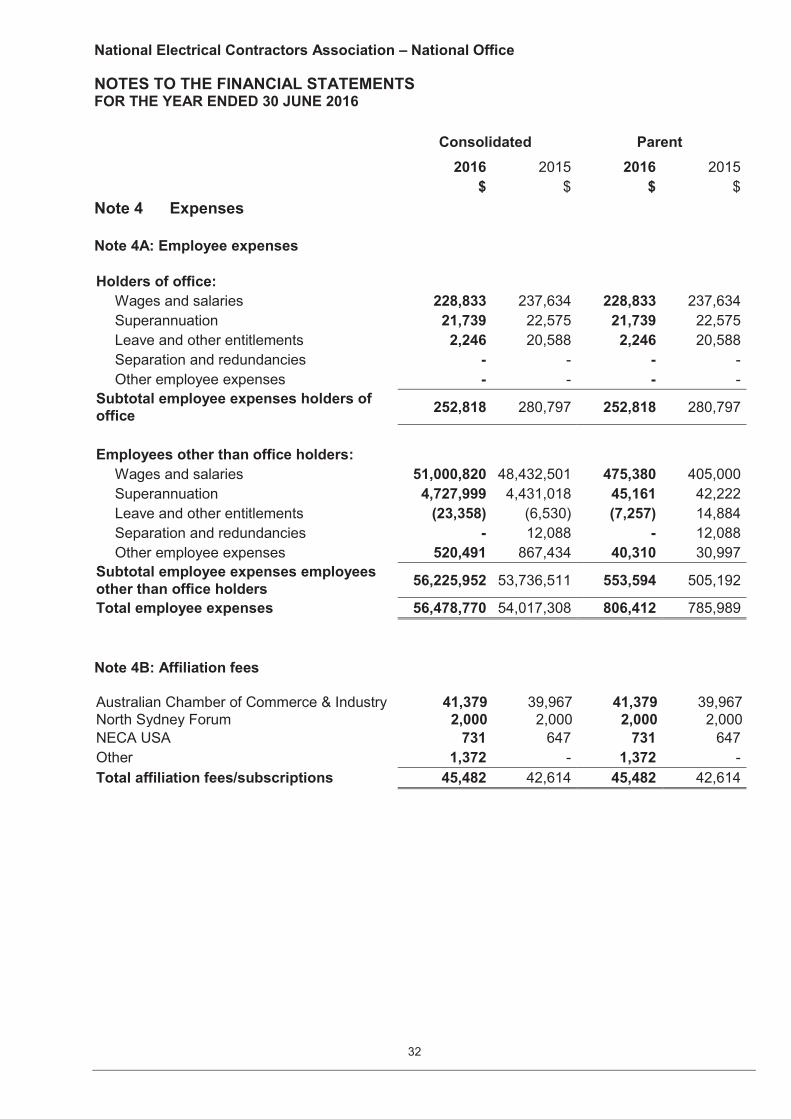
NOTES TO THE FINANCIAL STATEMENTS FOR THE YEAR ENDED 30 JUNE 2016 Consolidated Parent 2016 2015 2016 2015 $ $ $ $ Note 4 Expenses Note 4A: Employee expenses
Holders of office:
Wages and salaries 228,833 237,634 228,833 237,634 Superannuation 21,739 22,575 21,739 22,575 Leave and other entitlements 2,246 20,588 2,246 20,588 Separation and redundancies - - - - Other employee expenses - - - -
Subtotal employee expenses holders of office 252,818 280,797 252,818 280,797
Employees other than office holders:
Wages and salaries 51,000,820 48,432,501 475,380 405,000 Superannuation 4,727,999 4,431,018 45,161 42,222 Leave and other entitlements (23,358) (6,530) (7,257) 14,884 Separation and redundancies - 12,088 - 12,088 Other employee expenses 520,491 867,434 40,310 30,997
Subtotal employee expenses employees other than office holders 56,225,952 53,736,511 553,594 505,192
Total employee expenses 56,478,770 54,017,308 806,412 785,989 Note 4B: Affiliation fees Australian Chamber of Commerce & Industry 41,379 39,967 41,379 39,967 North Sydney Forum 2,000 2,000 2,000 2,000 NECA USA 731 647 731 647 Other 1,372 - 1,372 - Total affiliation fees/subscriptions 45,482 42,614 45,482 42,614
National Electrical Contractors Association – National Office
33
NOTES TO THE FINANCIAL STATEMENTS FOR THE YEAR ENDED 30 JUNE 2016
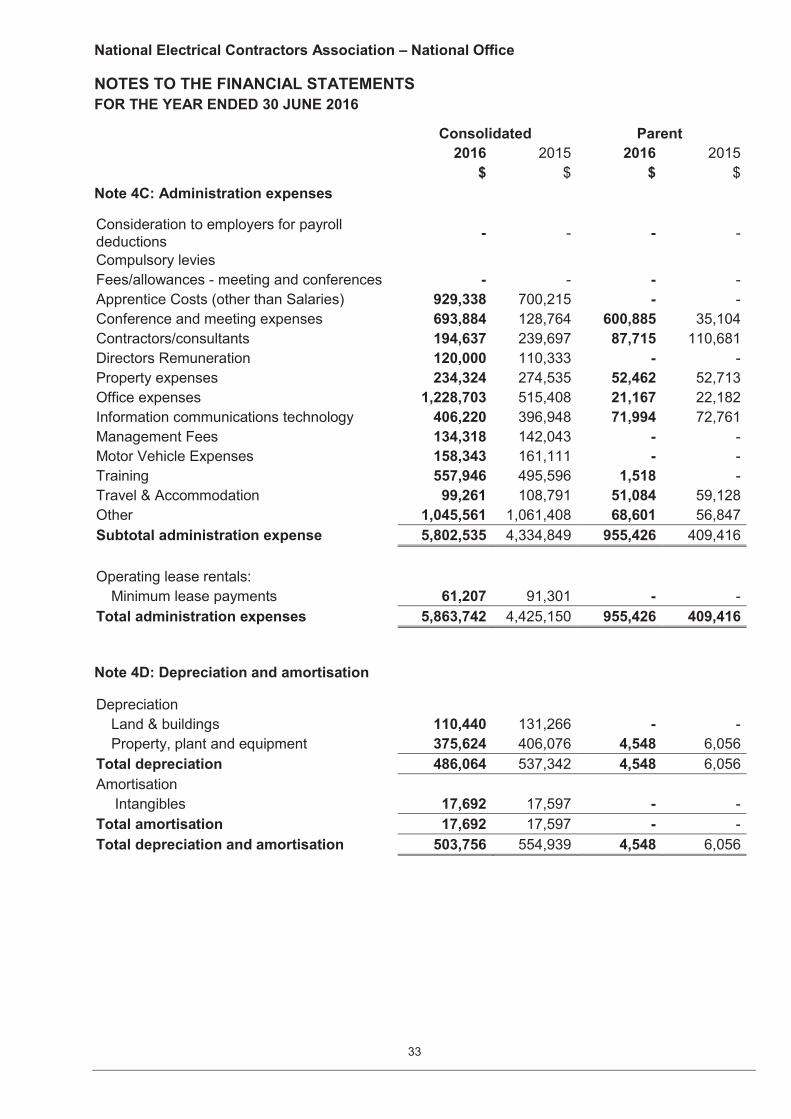
Consolidated Parent 2016 2015 2016 2015 $ $ $ $ Note 4C: Administration expenses Consideration to employers for payroll deductions - - - -
Compulsory levies Fees/allowances - meeting and conferences - - - - Apprentice Costs (other than Salaries) 929,338 700,215 - - Conference and meeting expenses 693,884 128,764 600,885 35,104 Contractors/consultants 194,637 239,697 87,715 110,681 Directors Remuneration 120,000 110,333 - - Property expenses 234,324 274,535 52,462 52,713 Office expenses 1,228,703 515,408 21,167 22,182 Information communications technology 406,220 396,948 71,994 72,761 Management Fees 134,318 142,043 - - Motor Vehicle Expenses 158,343 161,111 - - Training 557,946 495,596 1,518 - Travel & Accommodation 99,261 108,791 51,084 59,128 Other 1,045,561 1,061,408 68,601 56,847 Subtotal administration expense 5,802,535 4,334,849 955,426 409,416 Operating lease rentals:
Minimum lease payments 61,207 91,301 - - Total administration expenses 5,863,742 4,425,150 955,426 409,416 Note 4D: Depreciation and amortisation Depreciation
Land & buildings 110,440 131,266 - - Property, plant and equipment 375,624 406,076 4,548 6,056
Total depreciation 486,064 537,342 4,548 6,056 Amortisation
Intangibles 17,692 17,597 - - Total amortisation 17,692 17,597 - - Total depreciation and amortisation 503,756 554,939 4,548 6,056
National Electrical Contractors Association – National Office
34
NOTES TO THE FINANCIAL STATEMENTS FOR THE YEAR ENDED 30 JUNE 2016
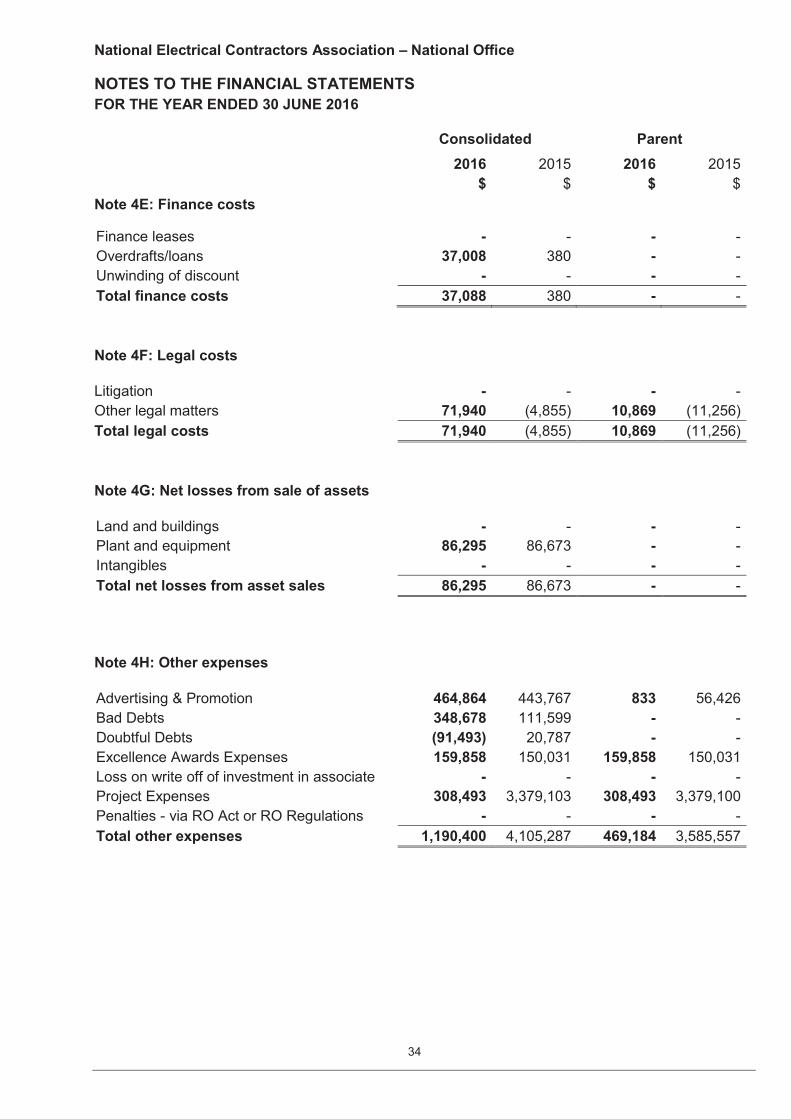
Consolidated Parent 2016 2015 2016 2015 $ $ $ $ Note 4E: Finance costs Finance leases - - - - Overdrafts/loans 37,008 380 - - Unwinding of discount - - - - Total finance costs 37,088 380 - - Note 4F: Legal costs Litigation - - - - Other legal matters 71,940 (4,855) 10,869 (11,256) Total legal costs 71,940 (4,855) 10,869 (11,256) Note 4G: Net losses from sale of assets Land and buildings - - - - Plant and equipment 86,295 86,673 - - Intangibles - - - - Total net losses from asset sales 86,295 86,673 - - Note 4H: Other expenses Advertising & Promotion 464,864 443,767 833 56,426 Bad Debts 348,678 111,599 - - Doubtful Debts (91,493) 20,787 - - Excellence Awards Expenses 159,858 150,031 159,858 150,031 Loss on write off of investment in associate - - - - Project Expenses 308,493 3,379,103 308,493 3,379,100 Penalties - via RO Act or RO Regulations - - - - Total other expenses 1,190,400 4,105,287 469,184 3,585,557
National Electrical Contractors Association – National Office
35
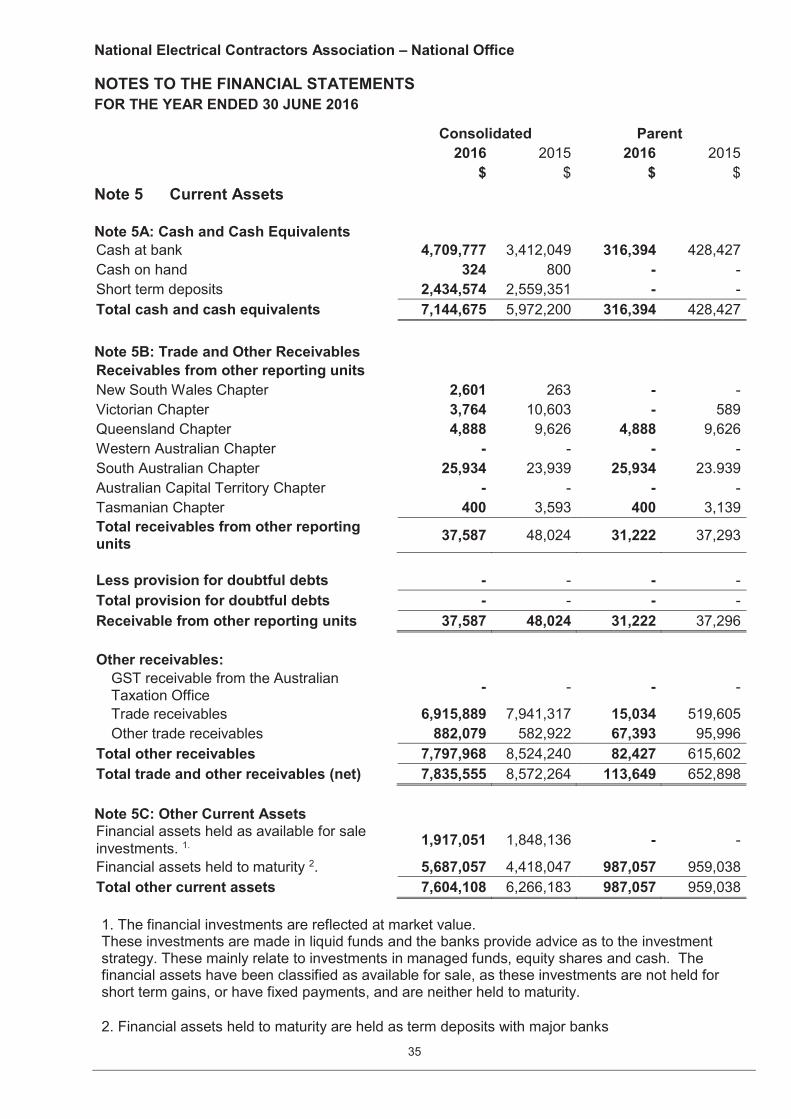
NOTES TO THE FINANCIAL STATEMENTS FOR THE YEAR ENDED 30 JUNE 2016
Consolidated Parent 2016 2015 2016 2015 $ $ $ $ Note 5 Current Assets Note 5A: Cash and Cash Equivalents Cash at bank 4,709,777 3,412,049 316,394 428,427 Cash on hand 324 800 - - Short term deposits 2,434,574 2,559,351 - - Total cash and cash equivalents 7,144,675 5,972,200 316,394 428,427 Note 5B: Trade and Other Receivables Receivables from other reporting units New South Wales Chapter 2,601 263 - - Victorian Chapter 3,764 10,603 - 589 Queensland Chapter 4,888 9,626 4,888 9,626 Western Australian Chapter - - - - South Australian Chapter 25,934 23,939 25,934 23.939 Australian Capital Territory Chapter - - - - Tasmanian Chapter 400 3,593 400 3,139 Total receivables from other reporting units 37,587 48,024 31,222 37,293
Less provision for doubtful debts - - - - Total provision for doubtful debts - - - - Receivable from other reporting units 37,587 48,024 31,222 37,296 Other receivables:
GST receivable from the Australian Taxation Office - - - -
Trade receivables 6,915,889 7,941,317 15,034 519,605 Other trade receivables 882,079 582,922 67,393 95,996
Total other receivables 7,797,968 8,524,240 82,427 615,602 Total trade and other receivables (net) 7,835,555 8,572,264 113,649 652,898 Note 5C: Other Current Assets Financial assets held as available for sale investments. 1. 1,917,051 1,848,136 - -
Financial assets held to maturity 2. 5,687,057 4,418,047 987,057 959,038 Total other current assets 7,604,108 6,266,183 987,057 959,038 1. The financial investments are reflected at market value. These investments are made in liquid funds and the banks provide advice as to the investment strategy. These mainly relate to investments in managed funds, equity shares and cash. The financial assets have been classified as available for sale, as these investments are not held for short term gains, or have fixed payments, and are neither held to maturity. 2. Financial assets held to maturity are held as term deposits with major banks
National Electrical Contractors Association – National Office
36
NOTES TO THE FINANCIAL STATEMENTS FOR THE YEAR ENDED 30 JUNE 2016
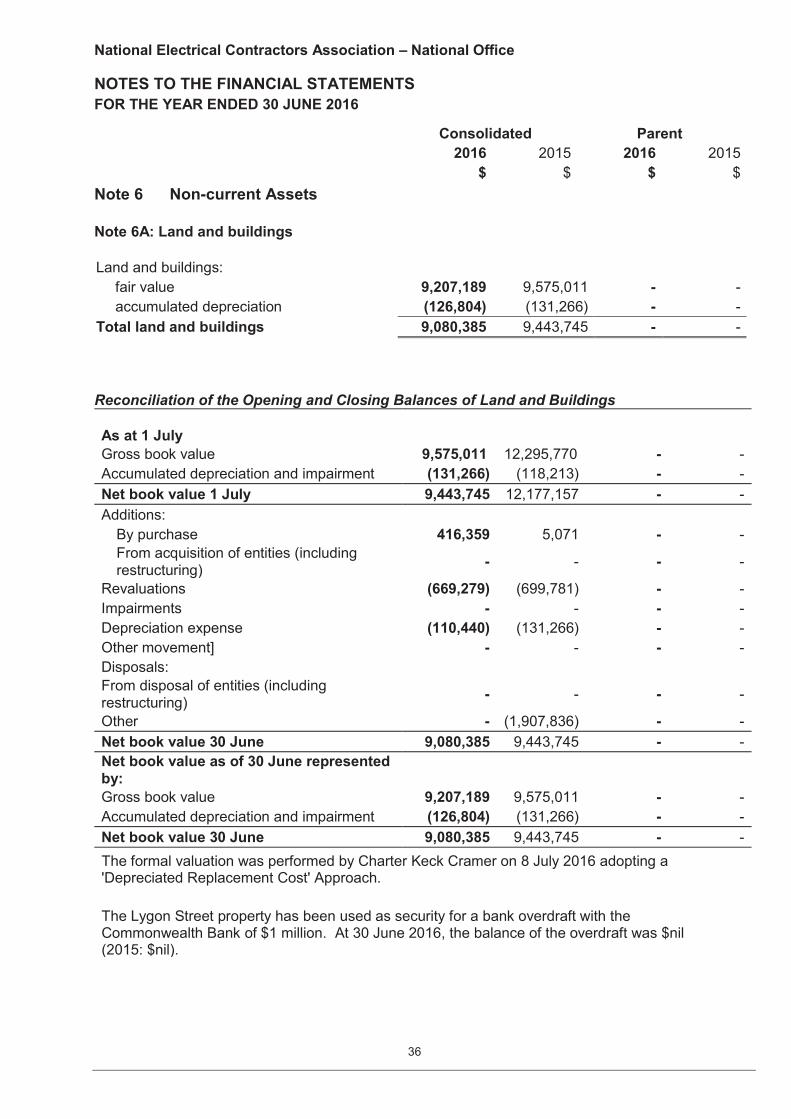
Consolidated Parent 2016 2015 2016 2015 $ $ $ $ Note 6 Non-current Assets Note 6A: Land and buildings Land and buildings:
fair value 9,207,189 9,575,011 - - accumulated depreciation (126,804) (131,266) - -
Total land and buildings 9,080,385 9,443,745 - - Reconciliation of the Opening and Closing Balances of Land and Buildings As at 1 July
Gross book value 9,575,011 12,295,770 - - Accumulated depreciation and impairment (131,266) (118,213) - - Net book value 1 July 9,443,745 12,177,157 - - Additions:
By purchase 416,359 5,071 - - From acquisition of entities (including restructuring) - - - -
Revaluations (669,279) (699,781) - - Impairments - - - - Depreciation expense (110,440) (131,266) - - Other movement] - - - - Disposals: From disposal of entities (including restructuring) - - - -
Other - (1,907,836) - - Net book value 30 June 9,080,385 9,443,745 - - Net book value as of 30 June represented by:
Gross book value 9,207,189 9,575,011 - - Accumulated depreciation and impairment (126,804) (131,266) - - Net book value 30 June 9,080,385 9,443,745 - - The formal valuation was performed by Charter Keck Cramer on 8 July 2016 adopting a 'Depreciated Replacement Cost' Approach. The Lygon Street property has been used as security for a bank overdraft with the Commonwealth Bank of $1 million. At 30 June 2016, the balance of the overdraft was $nil (2015: $nil).
National Electrical Contractors Association – National Office
37
NOTES TO THE FINANCIAL STATEMENTS FOR THE YEAR ENDED 30 JUNE 2016
Note 6 Non-current Assets (cont’d) Note 6A: Land and buildings (cont’d)
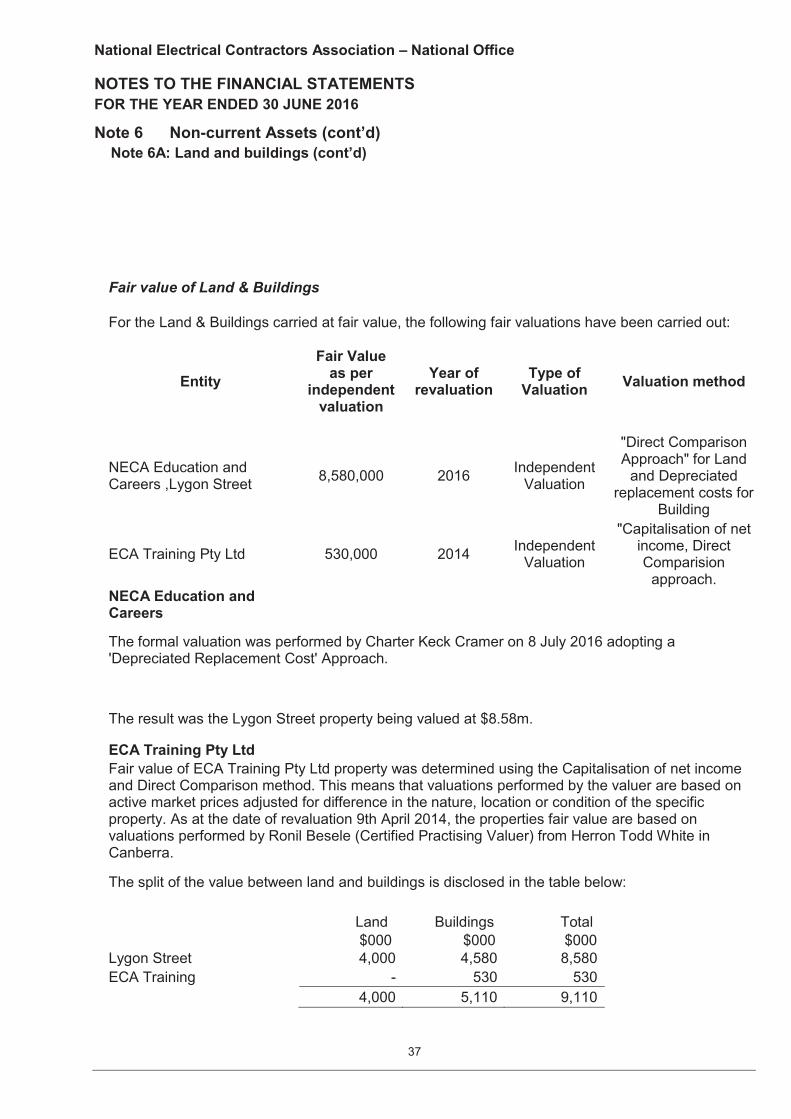
Fair value of Land & Buildings For the Land & Buildings carried at fair value, the following fair valuations have been carried out:
Entity Fair Value
as per independent
valuation
Year of revaluation
Type of Valuation Valuation method
NECA Education and Careers ,Lygon Street 8,580,000 2016 Independent
Valuation
"Direct Comparison Approach" for Land
and Depreciated replacement costs for
Building
ECA Training Pty Ltd 530,000 2014 Independent Valuation
"Capitalisation of net income, Direct Comparision
approach. NECA Education and Careers
The formal valuation was performed by Charter Keck Cramer on 8 July 2016 adopting a 'Depreciated Replacement Cost' Approach.
The result was the Lygon Street property being valued at $8.58m.
ECA Training Pty Ltd Fair value of ECA Training Pty Ltd property was determined using the Capitalisation of net income and Direct Comparison method. This means that valuations performed by the valuer are based on active market prices adjusted for difference in the nature, location or condition of the specific property. As at the date of revaluation 9th April 2014, the properties fair value are based on valuations performed by Ronil Besele (Certified Practising Valuer) from Herron Todd White in Canberra. The split of the value between land and buildings is disclosed in the table below: Land Buildings Total $000 $000 $000 Lygon Street 4,000 4,580 8,580 ECA Training - 530 530 4,000 5,110 9,110
National Electrical Contractors Association – National Office
38
NOTES TO THE FINANCIAL STATEMENTS FOR THE YEAR ENDED 30 JUNE 2016
Note 6 Non-current Assets (cont’d) Note 6A: Land and buildings (cont’d)
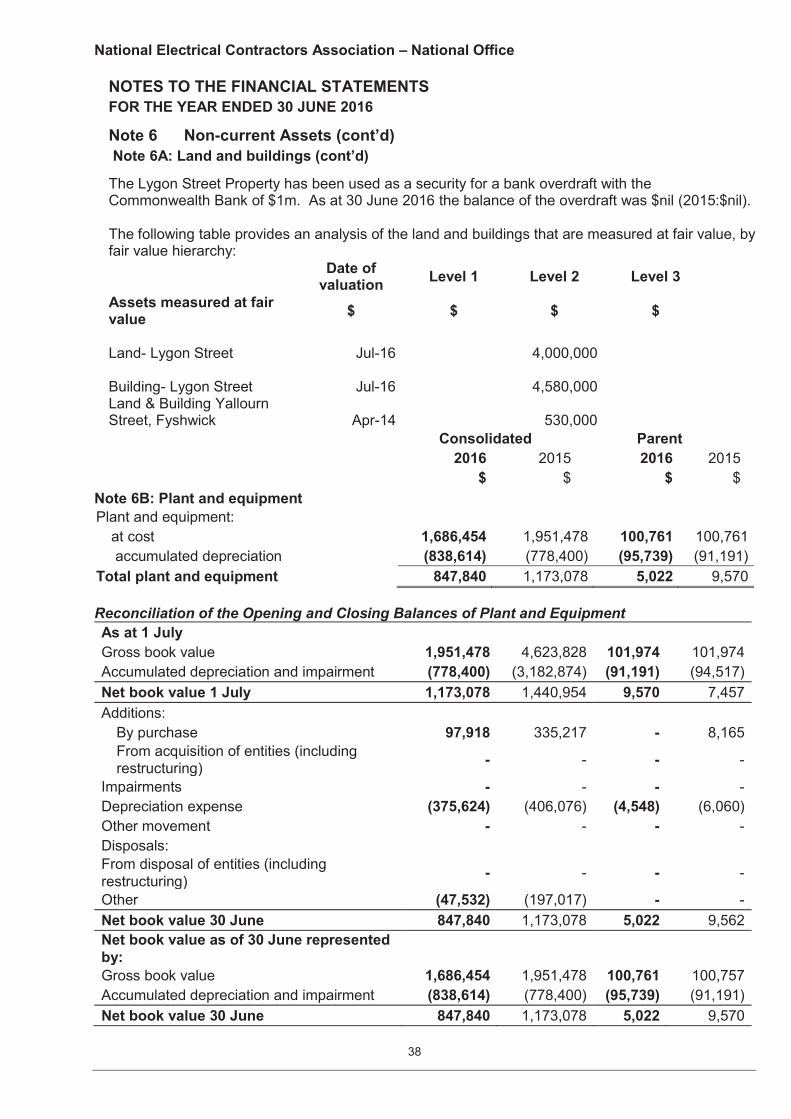
The Lygon Street Property has been used as a security for a bank overdraft with the Commonwealth Bank of $1m. As at 30 June 2016 the balance of the overdraft was $nil (2015:$nil). The following table provides an analysis of the land and buildings that are measured at fair value, by fair value hierarchy: Date of
valuation Level 1 Level 2 Level 3
Assets measured at fair value $ $ $ $
Land- Lygon Street Jul-16
4,000,000
Building- Lygon Street Jul-16
4,580,000
Land & Building Yallourn Street, Fyshwick Apr-14
530,000
Consolidated Parent 2016 2015 2016 2015 $ $ $ $ Note 6B: Plant and equipment Plant and equipment:
at cost 1,686,454 1,951,478 100,761 100,761 accumulated depreciation (838,614) (778,400) (95,739) (91,191)
Total plant and equipment 847,840 1,173,078 5,022 9,570 Reconciliation of the Opening and Closing Balances of Plant and Equipment As at 1 July Gross book value 1,951,478 4,623,828 101,974 101,974 Accumulated depreciation and impairment (778,400) (3,182,874) (91,191) (94,517) Net book value 1 July 1,173,078 1,440,954 9,570 7,457 Additions:
By purchase 97,918 335,217 - 8,165 From acquisition of entities (including restructuring) - - - -
Impairments - - - - Depreciation expense (375,624) (406,076) (4,548) (6,060) Other movement - - - - Disposals: From disposal of entities (including restructuring) - - - -
Other (47,532) (197,017) - - Net book value 30 June 847,840 1,173,078 5,022 9,562 Net book value as of 30 June represented by:
Gross book value 1,686,454 1,951,478 100,761 100,757 Accumulated depreciation and impairment (838,614) (778,400) (95,739) (91,191) Net book value 30 June 847,840 1,173,078 5,022 9,570
National Electrical Contractors Association – National Office
39
NOTES TO THE FINANCIAL STATEMENTS FOR THE YEAR ENDED 30 JUNE 2016
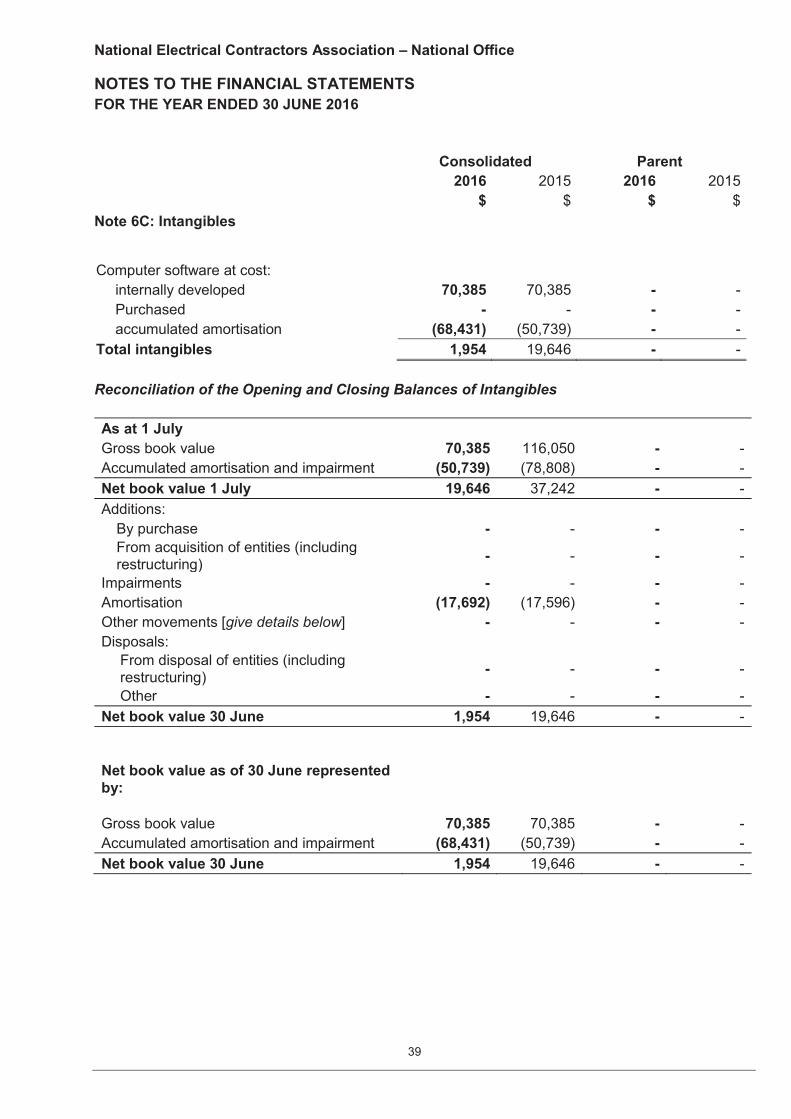
Consolidated Parent 2016 2015 2016 2015 $ $ $ $ Note 6C: Intangibles
Computer software at cost: internally developed 70,385 70,385 - - Purchased - - - - accumulated amortisation (68,431) (50,739) - -
Total intangibles 1,954 19,646 - - Reconciliation of the Opening and Closing Balances of Intangibles As at 1 July Gross book value 70,385 116,050 - - Accumulated amortisation and impairment (50,739) (78,808) - - Net book value 1 July 19,646 37,242 - - Additions:
By purchase - - - - From acquisition of entities (including restructuring) - - - -
Impairments - - - - Amortisation (17,692) (17,596) - - Other movements [give details below] - - - - Disposals:
From disposal of entities (including restructuring) - - - -
Other - - - - Net book value 30 June 1,954 19,646 - - Net book value as of 30 June represented by:
Gross book value 70,385 70,385 - - Accumulated amortisation and impairment (68,431) (50,739) - - Net book value 30 June 1,954 19,646 - -
National Electrical Contractors Association – National Office
40
NOTES TO THE FINANCIAL STATEMENTS FOR THE YEAR ENDED 30 JUNE 2016
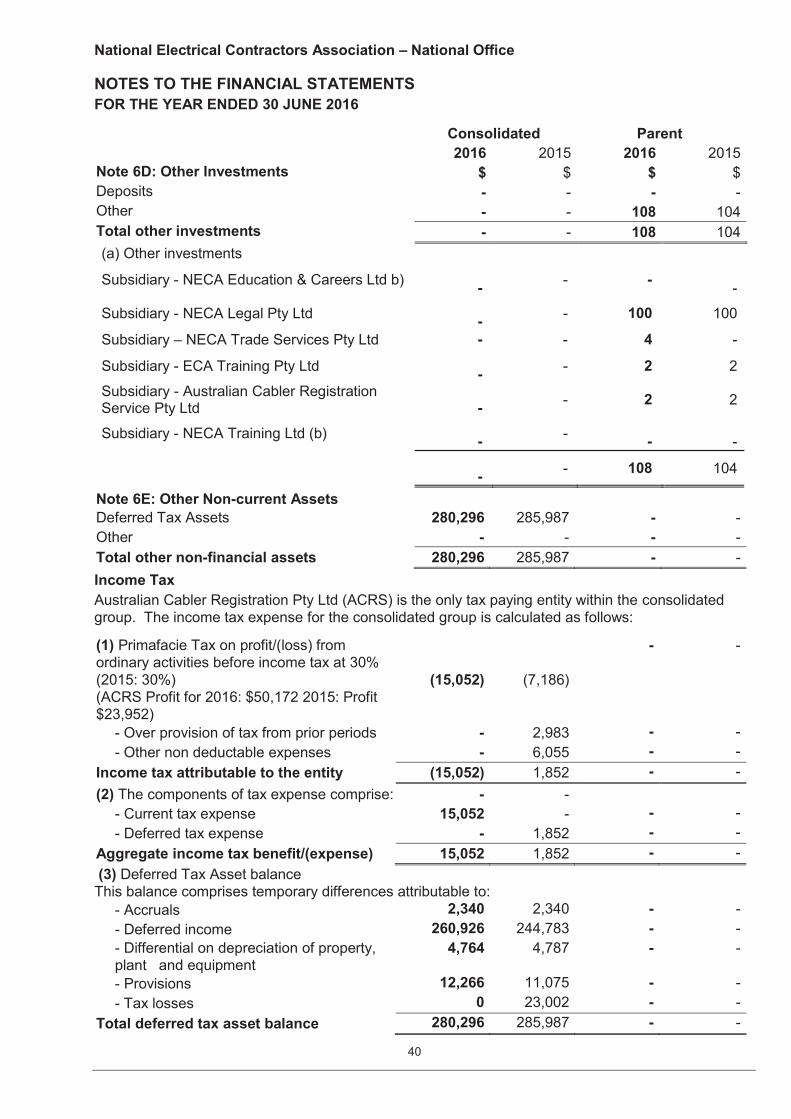
Consolidated Parent 2016 2015 2016 2015 Note 6D: Other Investments $ $ $ $ Deposits - - - - Other - - 108 104 Total other investments - - 108 104 (a) Other investments
Subsidiary - NECA Education & Careers Ltd b) - - -
-
Subsidiary - NECA Legal Pty Ltd - - 100 100
Subsidiary – NECA Trade Services Pty Ltd - - 4 -
Subsidiary - ECA Training Pty Ltd - - 2 2
Subsidiary - Australian Cabler Registration Service Pty Ltd
- - 2 2
Subsidiary - NECA Training Ltd (b) - -
-
-
- - 108 104
Note 6E: Other Non-current Assets Deferred Tax Assets 280,296 285,987 - - Other - - - - Total other non-financial assets 280,296 285,987 - - Income Tax Australian Cabler Registration Pty Ltd (ACRS) is the only tax paying entity within the consolidated group. The income tax expense for the consolidated group is calculated as follows:
(1) Primafacie Tax on profit/(loss) from ordinary activities before income tax at 30% (2015: 30%) (ACRS Profit for 2016: $50,172 2015: Profit $23,952)
(15,052) (7,186)
- -
- Over provision of tax from prior periods - 2,983 - - - Other non deductable expenses - 6,055 - -
Income tax attributable to the entity (15,052) 1,852 - - (2) The components of tax expense comprise: - -
- Current tax expense 15,052 - - - - Deferred tax expense - 1,852 - -
Aggregate income tax benefit/(expense) 15,052 1,852 - - (3) Deferred Tax Asset balance This balance comprises temporary differences attributable to:
- Accruals 2,340 2,340 - - - Deferred income 260,926 244,783 - - - Differential on depreciation of property, plant and equipment
4,764 4,787 - -
- Provisions 12,266 11,075 - - - Tax losses 0 23,002 - -
Total deferred tax asset balance 280,296 285,987 - -
National Electrical Contractors Association – National Office
41
NOTES TO THE FINANCIAL STATEMENTS FOR THE YEAR ENDED 30 JUNE 2016
Consolidated Parent
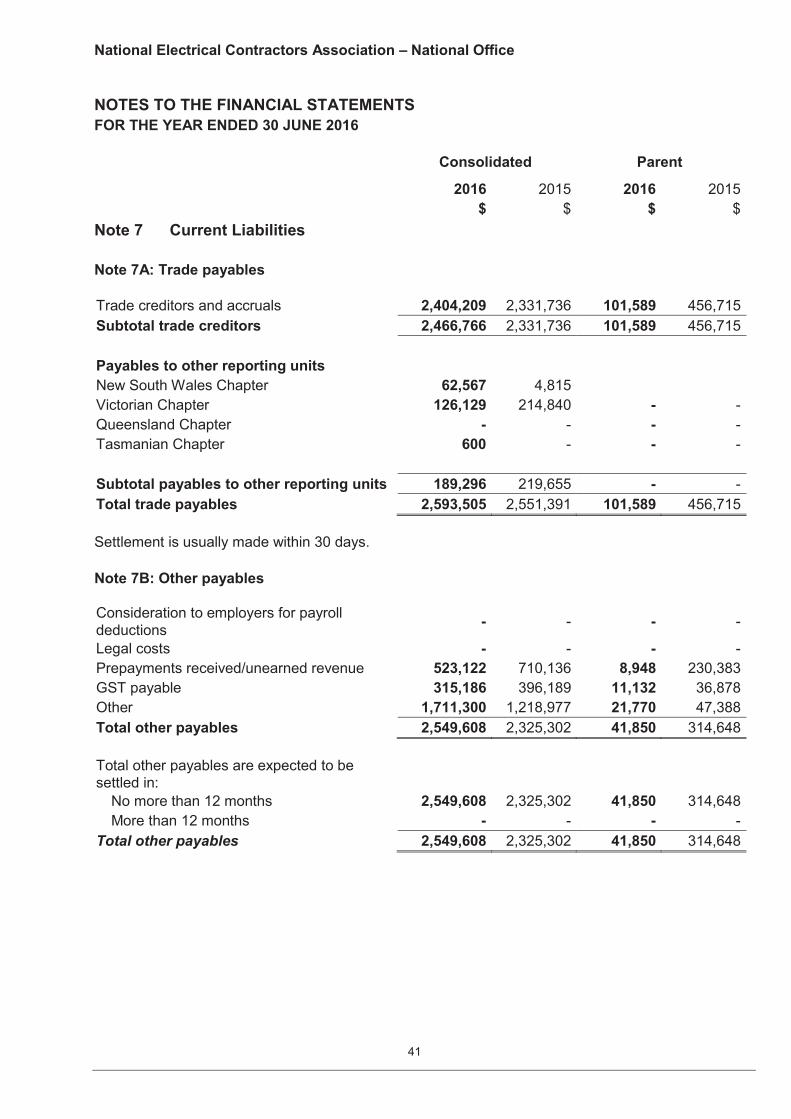
2016 2015 2016 2015 $ $ $ $ Note 7 Current Liabilities Note 7A: Trade payables Trade creditors and accruals 2,404,209 2,331,736 101,589 456,715 Subtotal trade creditors 2,466,766 2,331,736 101,589 456,715 Payables to other reporting units New South Wales Chapter 62,567 4,815 Victorian Chapter 126,129 214,840 - - Queensland Chapter - - - - Tasmanian Chapter 600 - - - Subtotal payables to other reporting units 189,296 219,655 - - Total trade payables 2,593,505 2,551,391 101,589 456,715 Settlement is usually made within 30 days. Note 7B: Other payables Consideration to employers for payroll deductions - - - -
Legal costs - - - - Prepayments received/unearned revenue 523,122 710,136 8,948 230,383 GST payable 315,186 396,189 11,132 36,878 Other 1,711,300 1,218,977 21,770 47,388 Total other payables 2,549,608 2,325,302 41,850 314,648 Total other payables are expected to be settled in:
No more than 12 months 2,549,608 2,325,302 41,850 314,648 More than 12 months - - - -
Total other payables 2,549,608 2,325,302 41,850 314,648
National Electrical Contractors Association – National Office
42
NOTES TO THE FINANCIAL STATEMENTS FOR THE YEAR ENDED 30 JUNE 2016
Consolidated Parent
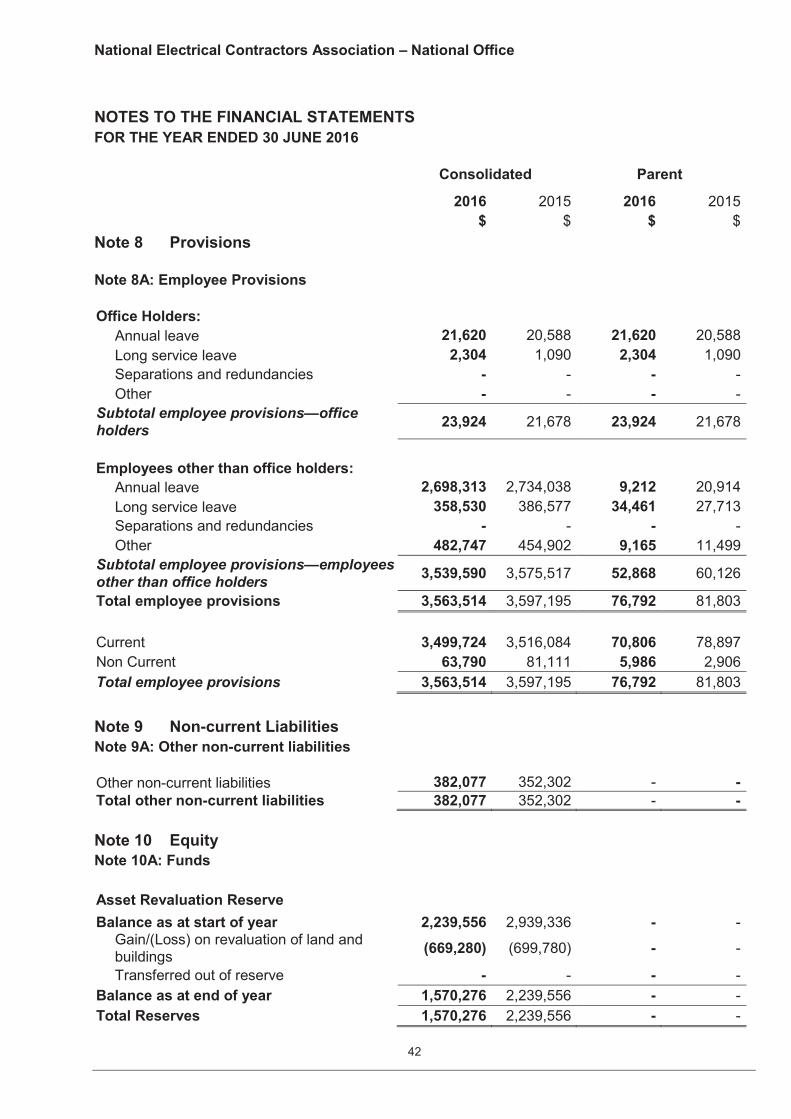
2016 2015 2016 2015 $ $ $ $ Note 8 Provisions Note 8A: Employee Provisions Office Holders:
Annual leave 21,620 20,588 21,620 20,588 Long service leave 2,304 1,090 2,304 1,090 Separations and redundancies - - - - Other - - - -
Subtotal employee provisions—office holders 23,924 21,678 23,924 21,678
Employees other than office holders:
Annual leave 2,698,313 2,734,038 9,212 20,914 Long service leave 358,530 386,577 34,461 27,713 Separations and redundancies - - - - Other 482,747 454,902 9,165 11,499
Subtotal employee provisions—employees other than office holders 3,539,590 3,575,517 52,868 60,126
Total employee provisions 3,563,514 3,597,195 76,792 81,803 Current 3,499,724 3,516,084 70,806 78,897 Non Current 63,790 81,111 5,986 2,906 Total employee provisions 3,563,514 3,597,195 76,792 81,803 Note 9 Non-current Liabilities Note 9A: Other non-current liabilities Other non-current liabilities 382,077 352,302 - - Total other non-current liabilities 382,077 352,302 - - Note 10 Equity Note 10A: Funds Asset Revaluation Reserve
Balance as at start of year 2,239,556 2,939,336 - - Gain/(Loss) on revaluation of land and buildings (669,280) (699,780) - -
Transferred out of reserve - - - - Balance as at end of year 1,570,276 2,239,556 - - Total Reserves 1,570,276 2,239,556 - -
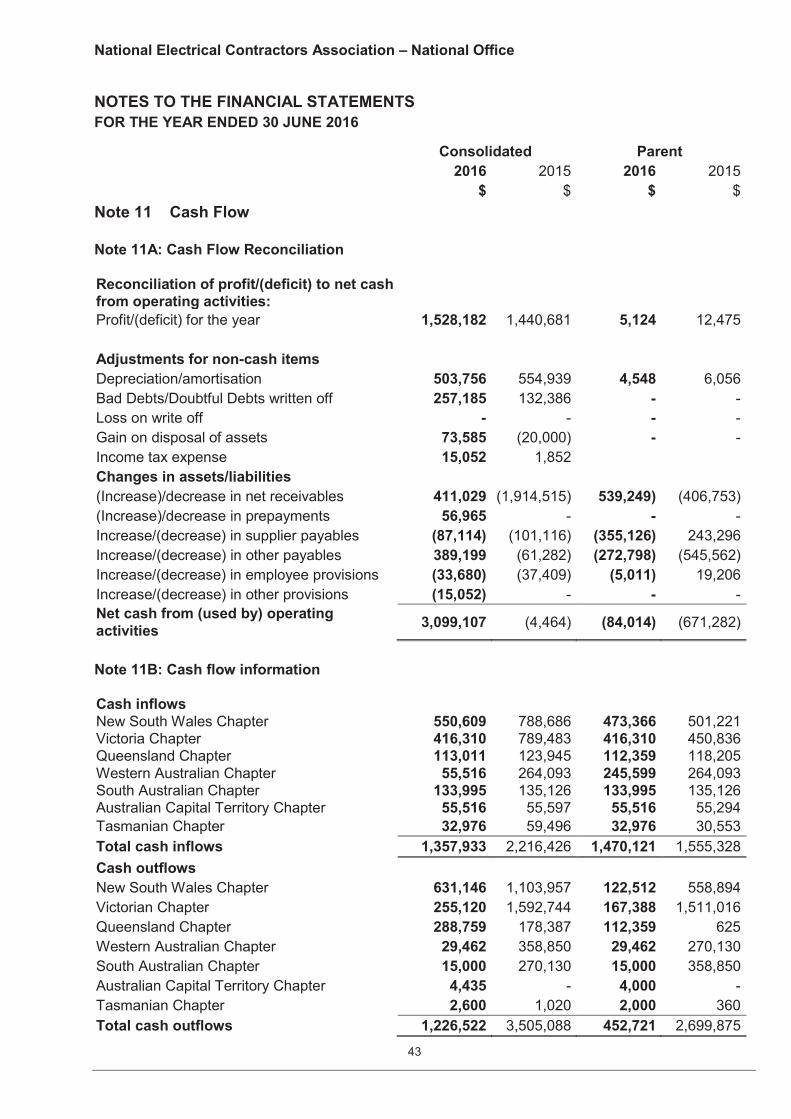
National Electrical Contractors Association – National Office
43
NOTES TO THE FINANCIAL STATEMENTS FOR THE YEAR ENDED 30 JUNE 2016
Consolidated Parent 2016 2015 2016 2015 $ $ $ $ Note 11 Cash Flow Note 11A: Cash Flow Reconciliation Reconciliation of profit/(deficit) to net cash from operating activities:
Profit/(deficit) for the year 1,528,182 1,440,681 5,124 12,475 Adjustments for non-cash items Depreciation/amortisation 503,756 554,939 4,548 6,056 Bad Debts/Doubtful Debts written off 257,185 132,386 - - Loss on write off - - - - Gain on disposal of assets 73,585 (20,000) - - Income tax expense 15,052 1,852 Changes in assets/liabilities (Increase)/decrease in net receivables 411,029 (1,914,515) 539,249) (406,753) (Increase)/decrease in prepayments 56,965 - - - Increase/(decrease) in supplier payables (87,114) (101,116) (355,126) 243,296 Increase/(decrease) in other payables 389,199 (61,282) (272,798) (545,562) Increase/(decrease) in employee provisions (33,680) (37,409) (5,011) 19,206 Increase/(decrease) in other provisions (15,052) - - - Net cash from (used by) operating activities 3,099,107 (4,464) (84,014) (671,282)
Note 11B: Cash flow information Cash inflows New South Wales Chapter 550,609 788,686 473,366 501,221 Victoria Chapter 416,310 789,483 416,310 450,836 Queensland Chapter 113,011 123,945 112,359 118,205 Western Australian Chapter 55,516 264,093 245,599 264,093 South Australian Chapter 133,995 135,126 133,995 135,126 Australian Capital Territory Chapter 55,516 55,597 55,516 55,294 Tasmanian Chapter 32,976 59,496 32,976 30,553 Total cash inflows 1,357,933 2,216,426 1,470,121 1,555,328 Cash outflows New South Wales Chapter 631,146 1,103,957 122,512 558,894 Victorian Chapter 255,120 1,592,744 167,388 1,511,016 Queensland Chapter 288,759 178,387 112,359 625 Western Australian Chapter 29,462 358,850 29,462 270,130 South Australian Chapter 15,000 270,130 15,000 358,850 Australian Capital Territory Chapter 4,435 - 4,000 - Tasmanian Chapter 2,600 1,020 2,000 360 Total cash outflows 1,226,522 3,505,088 452,721 2,699,875
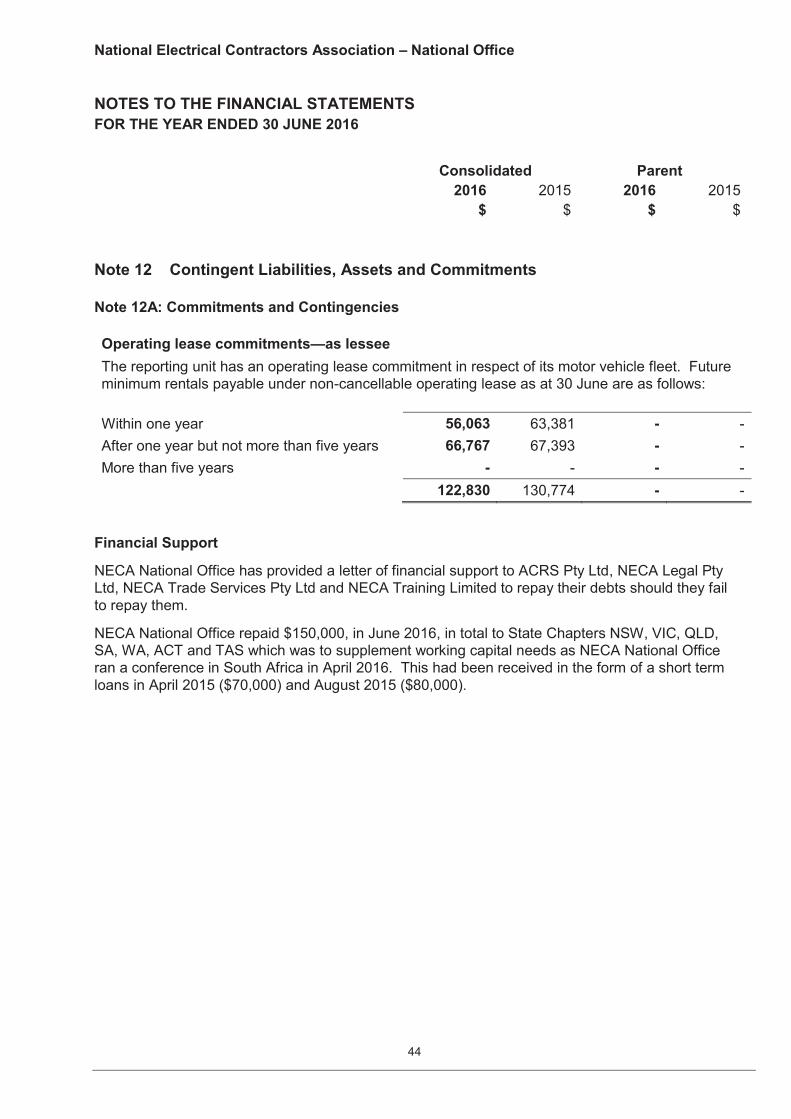
National Electrical Contractors Association – National Office
44
NOTES TO THE FINANCIAL STATEMENTS FOR THE YEAR ENDED 30 JUNE 2016
Consolidated Parent 2016 2015 2016 2015 $ $ $ $ Note 12 Contingent Liabilities, Assets and Commitments Note 12A: Commitments and Contingencies Operating lease commitments—as lessee The reporting unit has an operating lease commitment in respect of its motor vehicle fleet. Future minimum rentals payable under non-cancellable operating lease as at 30 June are as follows: Within one year 56,063 63,381 - - After one year but not more than five years 66,767 67,393 - - More than five years - - - - 122,830 130,774 - -
Financial Support
NECA National Office has provided a letter of financial support to ACRS Pty Ltd, NECA Legal Pty Ltd, NECA Trade Services Pty Ltd and NECA Training Limited to repay their debts should they fail to repay them.
NECA National Office repaid $150,000, in June 2016, in total to State Chapters NSW, VIC, QLD, SA, WA, ACT and TAS which was to supplement working capital needs as NECA National Office ran a conference in South Africa in April 2016. This had been received in the form of a short term loans in April 2015 ($70,000) and August 2015 ($80,000).
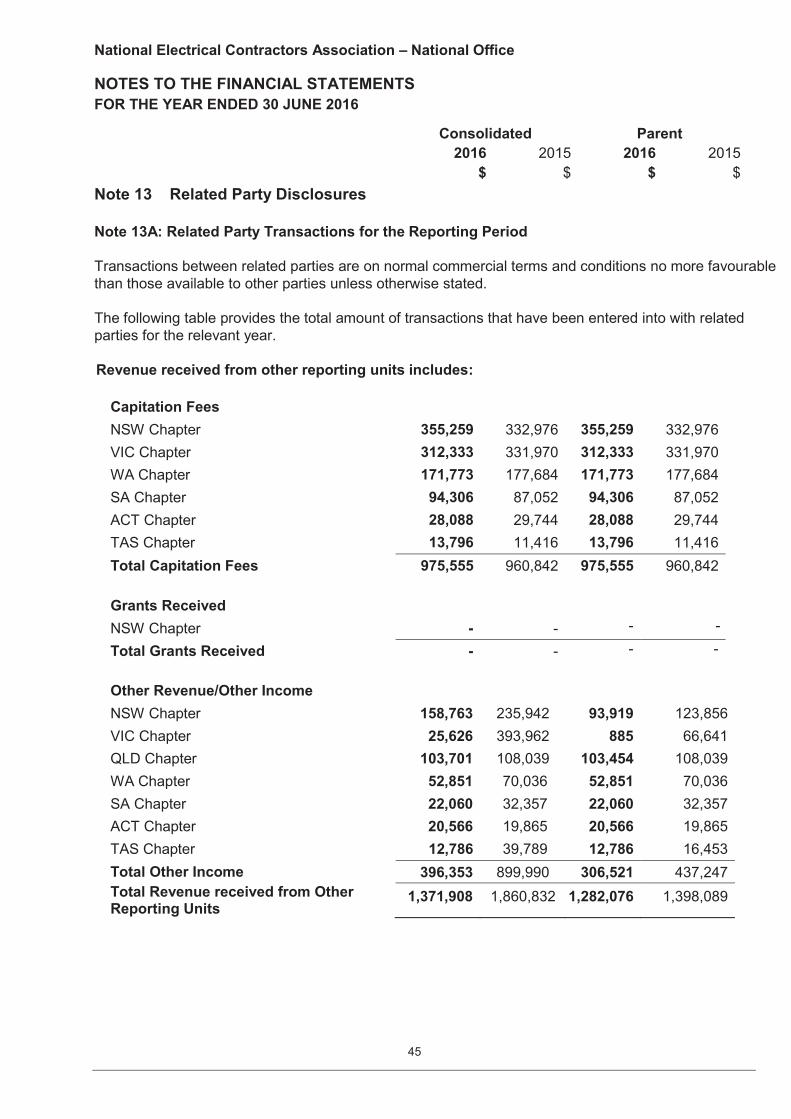
National Electrical Contractors Association – National Office
45
NOTES TO THE FINANCIAL STATEMENTS FOR THE YEAR ENDED 30 JUNE 2016
Consolidated Parent 2016 2015 2016 2015 $ $ $ $ Note 13 Related Party Disclosures Note 13A: Related Party Transactions for the Reporting Period Transactions between related parties are on normal commercial terms and conditions no more favourable than those available to other parties unless otherwise stated. The following table provides the total amount of transactions that have been entered into with related parties for the relevant year. Revenue received from other reporting units includes:
Capitation Fees
NSW Chapter 355,259 332,976 355,259 332,976 VIC Chapter 312,333 331,970 312,333 331,970 WA Chapter 171,773 177,684 171,773 177,684 SA Chapter 94,306 87,052 94,306 87,052 ACT Chapter 28,088 29,744 28,088 29,744 TAS Chapter 13,796 11,416 13,796 11,416 Total Capitation Fees 975,555 960,842 975,555 960,842
Grants Received
NSW Chapter - - - - -
Total Grants Received - - - -
Other Revenue/Other Income
NSW Chapter 158,763 235,942 93,919 123,856 VIC Chapter 25,626 393,962 885 66,641 QLD Chapter 103,701 108,039 103,454 108,039 WA Chapter 52,851 70,036 52,851 70,036 SA Chapter 22,060 32,357 22,060 32,357 ACT Chapter 20,566 19,865 20,566 19,865 TAS Chapter 12,786 39,789 12,786 16,453 Total Other Income 396,353 899,990 306,521 437,247 Total Revenue received from Other Reporting Units
1,371,908 1,860,832 1,282,076 1,398,089
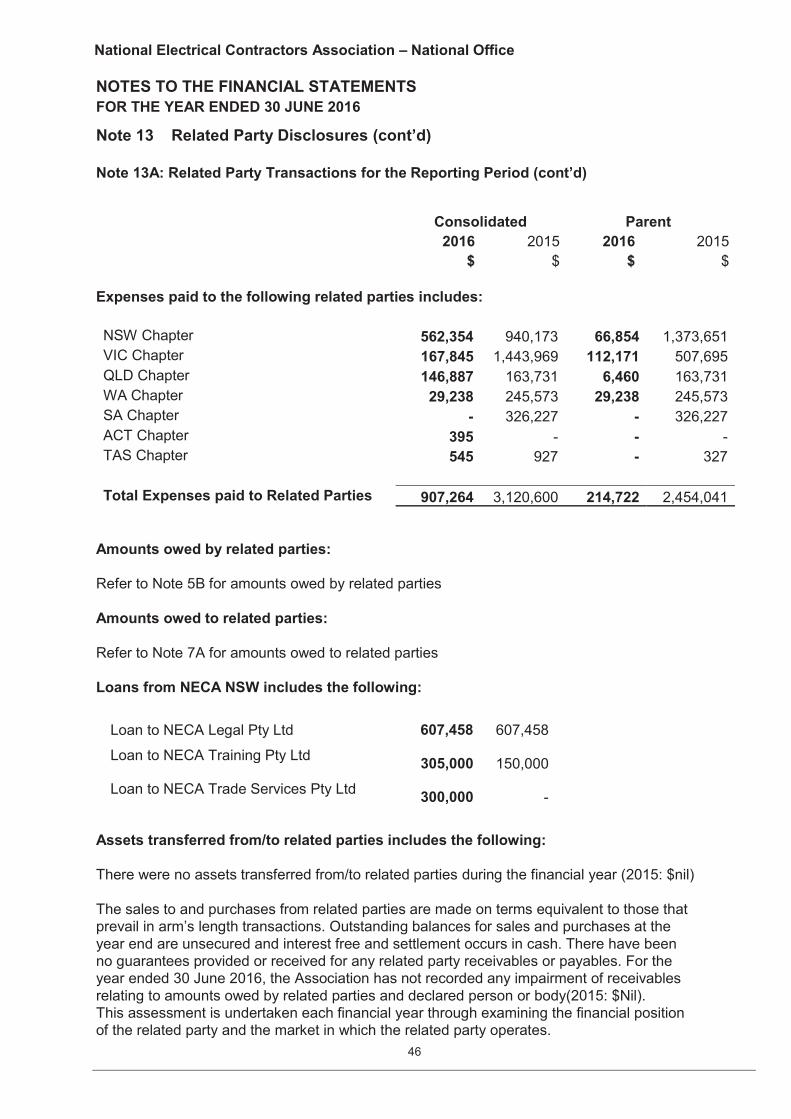
National Electrical Contractors Association – National Office
46
NOTES TO THE FINANCIAL STATEMENTS FOR THE YEAR ENDED 30 JUNE 2016
Note 13 Related Party Disclosures (cont’d) Note 13A: Related Party Transactions for the Reporting Period (cont’d)
Consolidated Parent 2016 2015 2016 2015 $ $ $ $ Expenses paid to the following related parties includes:
NSW Chapter 562,354 940,173 66,854 1,373,651 VIC Chapter 167,845 1,443,969 112,171 507,695 QLD Chapter 146,887 163,731 6,460 163,731 WA Chapter 29,238 245,573 29,238 245,573 SA Chapter - 326,227 - 326,227 ACT Chapter 395 - - - TAS Chapter 545 927 - 327 Total Expenses paid to Related Parties 907,264 3,120,600 214,722 2,454,041
Amounts owed by related parties: Refer to Note 5B for amounts owed by related parties Amounts owed to related parties: Refer to Note 7A for amounts owed to related parties Loans from NECA NSW includes the following:
Loan to NECA Legal Pty Ltd 607,458 607,458
Loan to NECA Training Pty Ltd 305,000 150,000
Loan to NECA Trade Services Pty Ltd 300,000 -
Assets transferred from/to related parties includes the following: There were no assets transferred from/to related parties during the financial year (2015: $nil) The sales to and purchases from related parties are made on terms equivalent to those that prevail in arm’s length transactions. Outstanding balances for sales and purchases at the year end are unsecured and interest free and settlement occurs in cash. There have been no guarantees provided or received for any related party receivables or payables. For the year ended 30 June 2016, the Association has not recorded any impairment of receivables relating to amounts owed by related parties and declared person or body(2015: $Nil). This assessment is undertaken each financial year through examining the financial position of the related party and the market in which the related party operates.
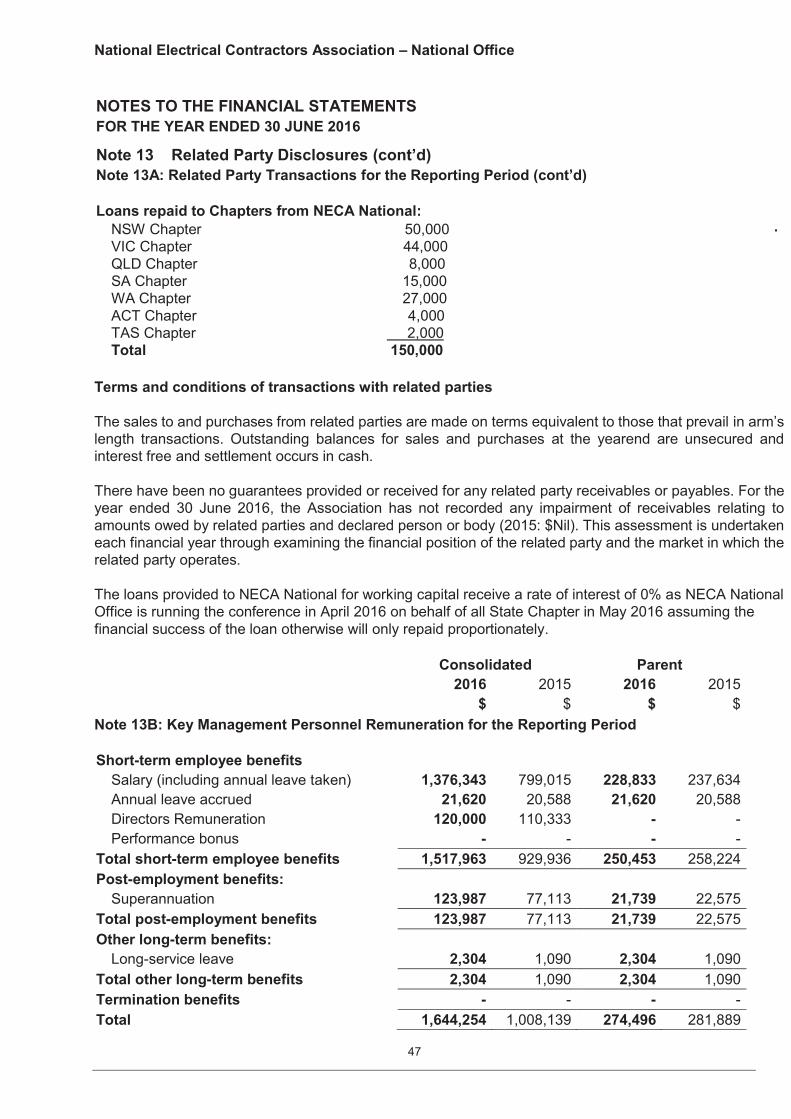
National Electrical Contractors Association – National Office
47
NOTES TO THE FINANCIAL STATEMENTS FOR THE YEAR ENDED 30 JUNE 2016
Note 13 Related Party Disclosures (cont’d) Note 13A: Related Party Transactions for the Reporting Period (cont’d)
Loans repaid to Chapters from NECA National: NSW Chapter 50,000 VIC Chapter 44,000 QLD Chapter 8,000 SA Chapter 15,000 WA Chapter 27,000 ACT Chapter 4,000 TAS Chapter 2,000 Total 150,000
-
Terms and conditions of transactions with related parties The sales to and purchases from related parties are made on terms equivalent to those that prevail in arm’s length transactions. Outstanding balances for sales and purchases at the yearend are unsecured and interest free and settlement occurs in cash. There have been no guarantees provided or received for any related party receivables or payables. For the year ended 30 June 2016, the Association has not recorded any impairment of receivables relating to amounts owed by related parties and declared person or body (2015: $Nil). This assessment is undertaken each financial year through examining the financial position of the related party and the market in which the related party operates. The loans provided to NECA National for working capital receive a rate of interest of 0% as NECA National Office is running the conference in April 2016 on behalf of all State Chapter in May 2016 assuming the financial success of the loan otherwise will only repaid proportionately. Consolidated Parent 2016 2015 2016 2015 $ $ $ $ Note 13B: Key Management Personnel Remuneration for the Reporting Period Short-term employee benefits
Salary (including annual leave taken) 1,376,343 799,015 228,833 237,634 Annual leave accrued 21,620 20,588 21,620 20,588 Directors Remuneration 120,000 110,333 - - Performance bonus - - - -
Total short-term employee benefits 1,517,963 929,936 250,453 258,224 Post-employment benefits:
Superannuation 123,987 77,113 21,739 22,575 Total post-employment benefits 123,987 77,113 21,739 22,575 Other long-term benefits:
Long-service leave 2,304 1,090 2,304 1,090 Total other long-term benefits 2,304 1,090 2,304 1,090 Termination benefits - - - - Total 1,644,254 1,008,139 274,496 281,889
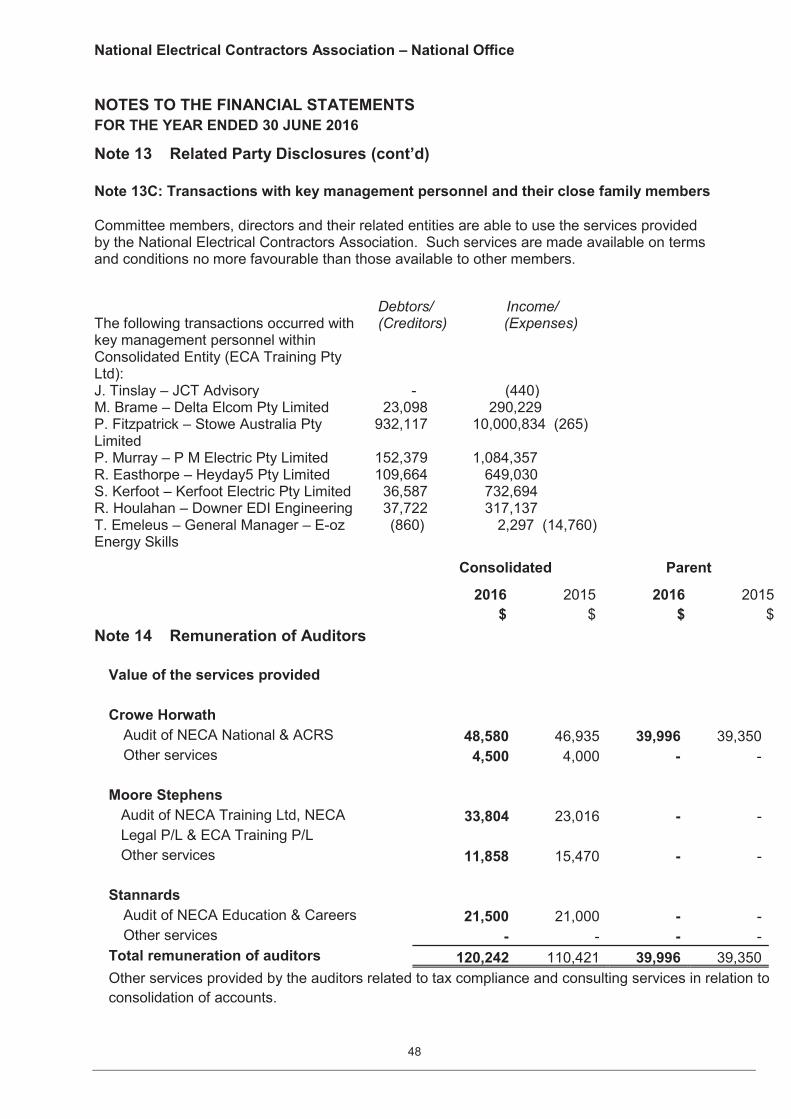
National Electrical Contractors Association – National Office
48
NOTES TO THE FINANCIAL STATEMENTS FOR THE YEAR ENDED 30 JUNE 2016
Note 13 Related Party Disclosures (cont’d) Note 13C: Transactions with key management personnel and their close family members Committee members, directors and their related entities are able to use the services provided by the National Electrical Contractors Association. Such services are made available on terms and conditions no more favourable than those available to other members.
The following transactions occurred with key management personnel within Consolidated Entity (ECA Training Pty Ltd):
Debtors/ Income/ (Creditors) (Expenses)
J. Tinslay – JCT Advisory - (440) M. Brame – Delta Elcom Pty Limited 23,098 290,229 P. Fitzpatrick – Stowe Australia Pty Limited
932,117 10,000,834 (265)
P. Murray – P M Electric Pty Limited 152,379 1,084,357 R. Easthorpe – Heyday5 Pty Limited 109,664 649,030 S. Kerfoot – Kerfoot Electric Pty Limited 36,587 732,694 R. Houlahan – Downer EDI Engineering 37,722 317,137 T. Emeleus – General Manager – E-oz Energy Skills
(860) 2,297 (14,760)
Consolidated Parent
2016 2015 2016 2015 $ $ $ $ Note 14 Remuneration of Auditors
Value of the services provided
Crowe Horwath
Audit of NECA National & ACRS 48,580 46,935 39,996 39,350 Other services 4,500 4,000 - -
Moore Stephens Audit of NECA Training Ltd, NECA 33,804 23,016 - - Legal P/L & ECA Training P/L Other services 11,858 15,470 - - Stannards
Audit of NECA Education & Careers 21,500 21,000 - - Other services - - - -
Total remuneration of auditors 120,242 110,421 39,996 39,350 Other services provided by the auditors related to tax compliance and consulting services in relation to consolidation of accounts.
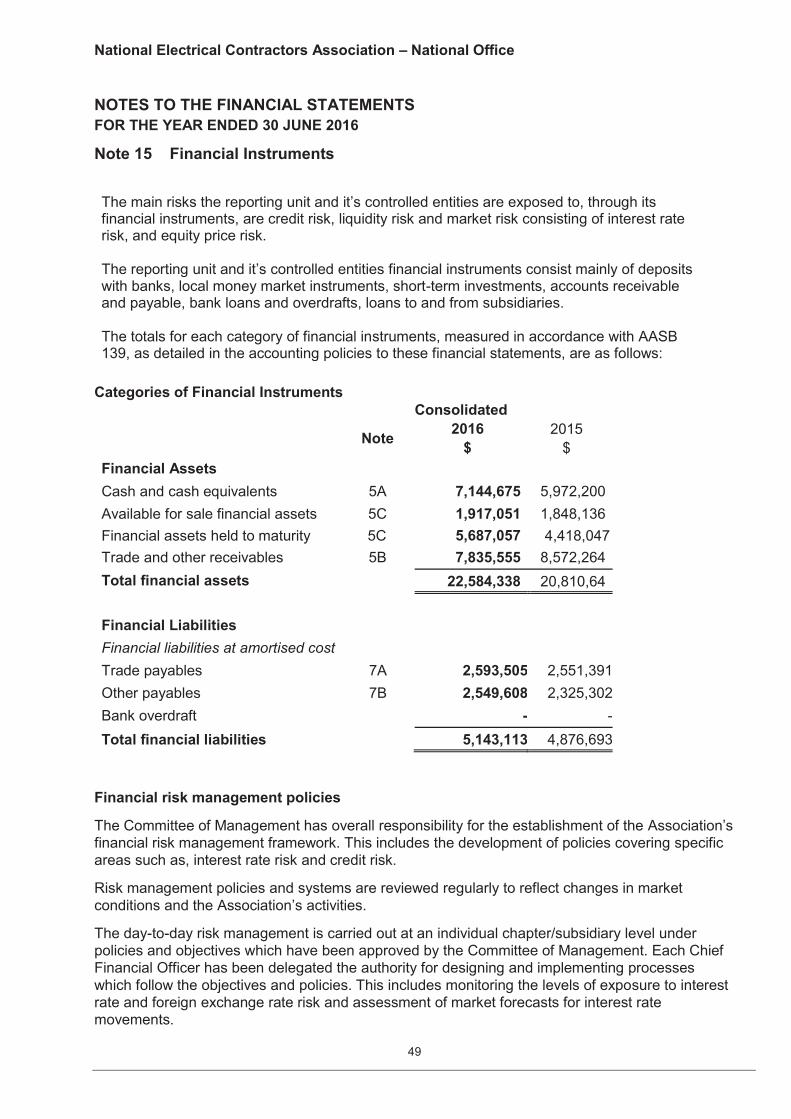
National Electrical Contractors Association – National Office
49
NOTES TO THE FINANCIAL STATEMENTS FOR THE YEAR ENDED 30 JUNE 2016
Note 15 Financial Instruments
The main risks the reporting unit and it’s controlled entities are exposed to, through its financial instruments, are credit risk, liquidity risk and market risk consisting of interest rate risk, and equity price risk. The reporting unit and it’s controlled entities financial instruments consist mainly of deposits with banks, local money market instruments, short-term investments, accounts receivable and payable, bank loans and overdrafts, loans to and from subsidiaries. The totals for each category of financial instruments, measured in accordance with AASB 139, as detailed in the accounting policies to these financial statements, are as follows:
Categories of Financial Instruments Consolidated Note 2016 2015
$ $ Financial Assets
Cash and cash equivalents 5A 7,144,675 5,972,200 Available for sale financial assets 5C 1,917,051 1,848,136 Financial assets held to maturity 5C 5,687,057 4,418,047 Trade and other receivables 5B 7,835,555 8,572,264 Total financial assets 22,584,338 20,810,64 Financial Liabilities
Financial liabilities at amortised cost
Trade payables 7A 2,593,505 2,551,391 Other payables 7B 2,549,608 2,325,302 Bank overdraft - - Total financial liabilities 5,143,113 4,876,693
Financial risk management policies
The Committee of Management has overall responsibility for the establishment of the Association’s financial risk management framework. This includes the development of policies covering specific areas such as, interest rate risk and credit risk.
Risk management policies and systems are reviewed regularly to reflect changes in market conditions and the Association’s activities.
The day-to-day risk management is carried out at an individual chapter/subsidiary level under policies and objectives which have been approved by the Committee of Management. Each Chief Financial Officer has been delegated the authority for designing and implementing processes which follow the objectives and policies. This includes monitoring the levels of exposure to interest rate and foreign exchange rate risk and assessment of market forecasts for interest rate movements.
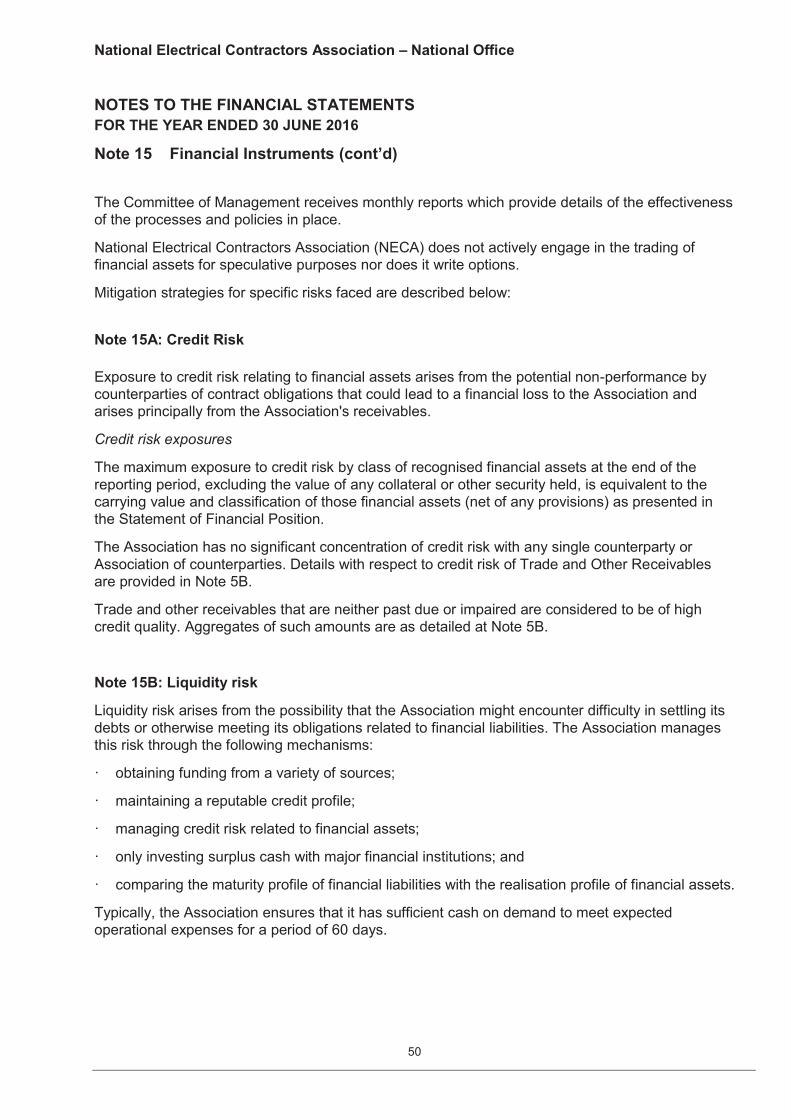
National Electrical Contractors Association – National Office
50
NOTES TO THE FINANCIAL STATEMENTS FOR THE YEAR ENDED 30 JUNE 2016
Note 15 Financial Instruments (cont’d)
The Committee of Management receives monthly reports which provide details of the effectiveness of the processes and policies in place.
National Electrical Contractors Association (NECA) does not actively engage in the trading of financial assets for speculative purposes nor does it write options.
Mitigation strategies for specific risks faced are described below:
Note 15A: Credit Risk Exposure to credit risk relating to financial assets arises from the potential non-performance by counterparties of contract obligations that could lead to a financial loss to the Association and arises principally from the Association's receivables.
Credit risk exposures
The maximum exposure to credit risk by class of recognised financial assets at the end of the reporting period, excluding the value of any collateral or other security held, is equivalent to the carrying value and classification of those financial assets (net of any provisions) as presented in the Statement of Financial Position.
The Association has no significant concentration of credit risk with any single counterparty or Association of counterparties. Details with respect to credit risk of Trade and Other Receivables are provided in Note 5B.
Trade and other receivables that are neither past due or impaired are considered to be of high credit quality. Aggregates of such amounts are as detailed at Note 5B.
Note 15B: Liquidity risk
Liquidity risk arises from the possibility that the Association might encounter difficulty in settling its debts or otherwise meeting its obligations related to financial liabilities. The Association manages this risk through the following mechanisms:
· obtaining funding from a variety of sources;
· maintaining a reputable credit profile;
· managing credit risk related to financial assets;
· only investing surplus cash with major financial institutions; and
· comparing the maturity profile of financial liabilities with the realisation profile of financial assets.
Typically, the Association ensures that it has sufficient cash on demand to meet expected operational expenses for a period of 60 days.
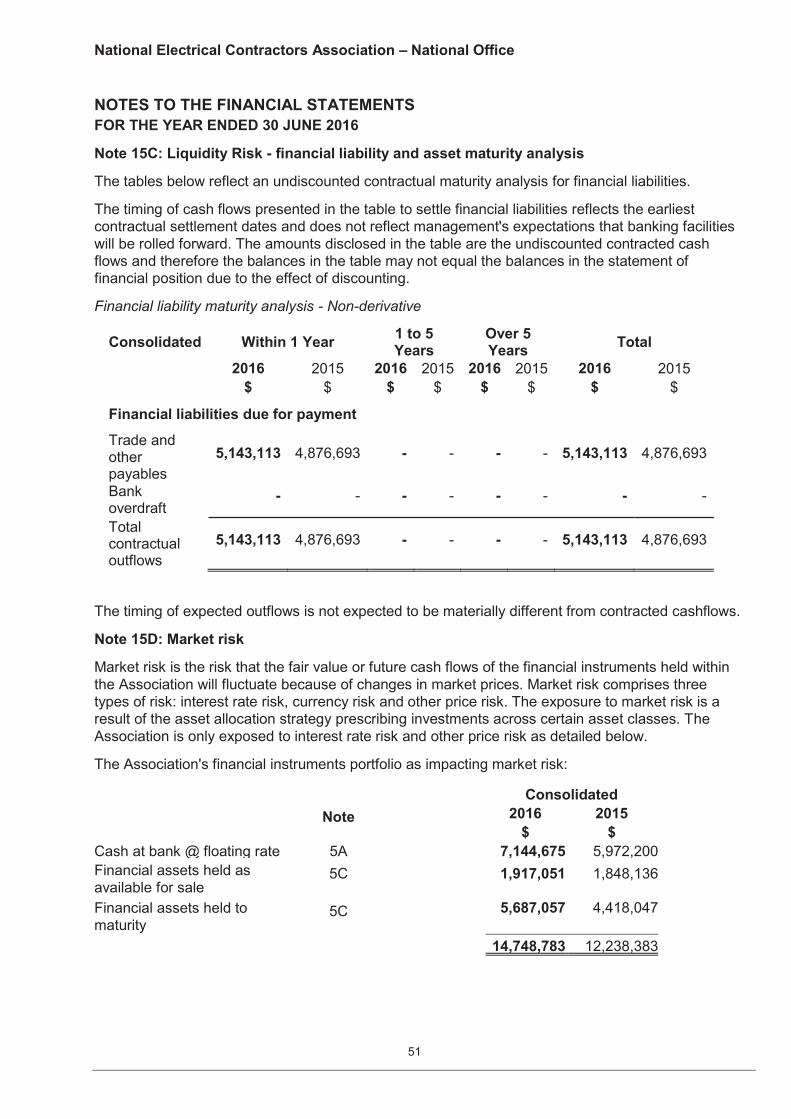
National Electrical Contractors Association – National Office
51
NOTES TO THE FINANCIAL STATEMENTS FOR THE YEAR ENDED 30 JUNE 2016
Note 15C: Liquidity Risk - financial liability and asset maturity analysis
The tables below reflect an undiscounted contractual maturity analysis for financial liabilities.
The timing of cash flows presented in the table to settle financial liabilities reflects the earliest contractual settlement dates and does not reflect management's expectations that banking facilities will be rolled forward. The amounts disclosed in the table are the undiscounted contracted cash flows and therefore the balances in the table may not equal the balances in the statement of financial position due to the effect of discounting.
Financial liability maturity analysis - Non-derivative
Consolidated Within 1 Year 1 to 5 Years
Over 5 Years Total
2016 2015 2016 2015 2016 2015 2016 2015 $ $ $ $ $ $ $ $
Financial liabilities due for payment
Trade and other payables
5,143,113 4,876,693 - - - - 5,143,113 4,876,693
Bank overdraft
- - - - - - - -
Total contractual outflows
5,143,113 4,876,693 - - - - 5,143,113 4,876,693
The timing of expected outflows is not expected to be materially different from contracted cashflows.
Note 15D: Market risk
Market risk is the risk that the fair value or future cash flows of the financial instruments held within the Association will fluctuate because of changes in market prices. Market risk comprises three types of risk: interest rate risk, currency risk and other price risk. The exposure to market risk is a result of the asset allocation strategy prescribing investments across certain asset classes. The Association is only exposed to interest rate risk and other price risk as detailed below.
The Association's financial instruments portfolio as impacting market risk: Consolidated Note 2016 2015
$ $ Cash at bank @ floating rate 5A 7,144,675 5,972,200 Financial assets held as available for sale
5C 1,917,051 1,848,136
Financial assets held to maturity
5C 5,687,057 4,418,047 14,748,783 12,238,383
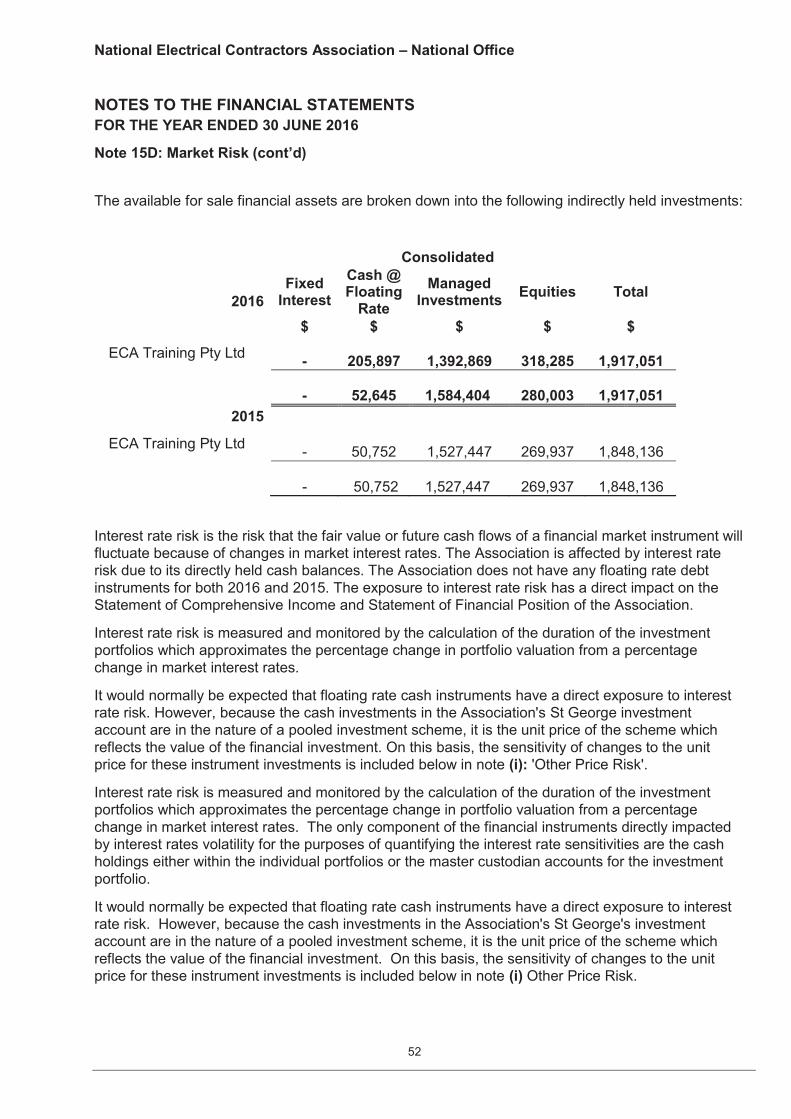
National Electrical Contractors Association – National Office
52
NOTES TO THE FINANCIAL STATEMENTS FOR THE YEAR ENDED 30 JUNE 2016
Note 15D: Market Risk (cont’d)
The available for sale financial assets are broken down into the following indirectly held investments:
Consolidated
2016 Fixed
Interest Cash @ Floating
Rate Managed
Investments Equities Total
$ $ $ $ $
ECA Training Pty Ltd -
205,897
1,392,869
318,285
1,917,051
-
52,645
1,584,404
280,003
1,917,051
2015 ECA Training Pty Ltd
-
50,752
1,527,447
269,937
1,848,136
-
50,752 1,527,447
269,937
1,848,136
Interest rate risk is the risk that the fair value or future cash flows of a financial market instrument will fluctuate because of changes in market interest rates. The Association is affected by interest rate risk due to its directly held cash balances. The Association does not have any floating rate debt instruments for both 2016 and 2015. The exposure to interest rate risk has a direct impact on the Statement of Comprehensive Income and Statement of Financial Position of the Association.
Interest rate risk is measured and monitored by the calculation of the duration of the investment portfolios which approximates the percentage change in portfolio valuation from a percentage change in market interest rates.
It would normally be expected that floating rate cash instruments have a direct exposure to interest rate risk. However, because the cash investments in the Association's St George investment account are in the nature of a pooled investment scheme, it is the unit price of the scheme which reflects the value of the financial investment. On this basis, the sensitivity of changes to the unit price for these instrument investments is included below in note (i): 'Other Price Risk'.
Interest rate risk is measured and monitored by the calculation of the duration of the investment portfolios which approximates the percentage change in portfolio valuation from a percentage change in market interest rates. The only component of the financial instruments directly impacted by interest rates volatility for the purposes of quantifying the interest rate sensitivities are the cash holdings either within the individual portfolios or the master custodian accounts for the investment portfolio.
It would normally be expected that floating rate cash instruments have a direct exposure to interest rate risk. However, because the cash investments in the Association's St George's investment account are in the nature of a pooled investment scheme, it is the unit price of the scheme which reflects the value of the financial investment. On this basis, the sensitivity of changes to the unit price for these instrument investments is included below in note (i) Other Price Risk.
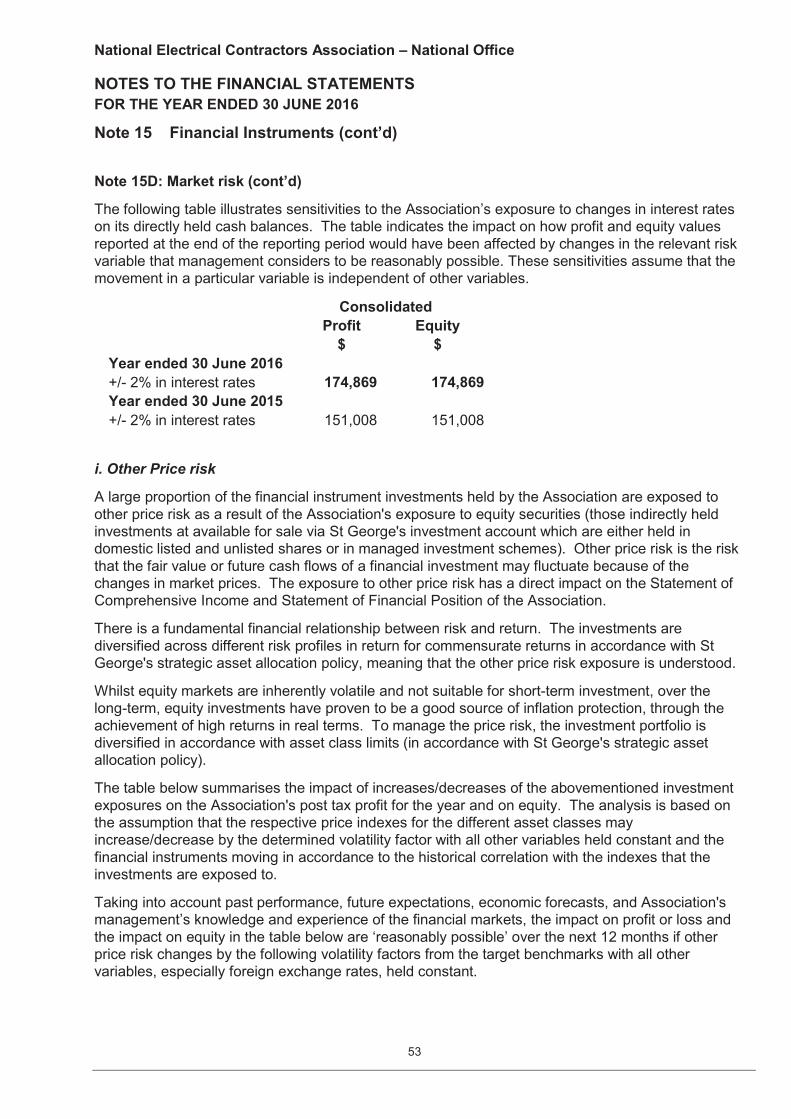
National Electrical Contractors Association – National Office
53
NOTES TO THE FINANCIAL STATEMENTS FOR THE YEAR ENDED 30 JUNE 2016
Note 15 Financial Instruments (cont’d)
Note 15D: Market risk (cont’d)
The following table illustrates sensitivities to the Association’s exposure to changes in interest rates on its directly held cash balances. The table indicates the impact on how profit and equity values reported at the end of the reporting period would have been affected by changes in the relevant risk variable that management considers to be reasonably possible. These sensitivities assume that the movement in a particular variable is independent of other variables.
Consolidated Profit Equity
$ $ Year ended 30 June 2016 +/- 2% in interest rates 174,869 174,869 Year ended 30 June 2015 +/- 2% in interest rates 151,008 151,008
i. Other Price risk
A large proportion of the financial instrument investments held by the Association are exposed to other price risk as a result of the Association's exposure to equity securities (those indirectly held investments at available for sale via St George's investment account which are either held in domestic listed and unlisted shares or in managed investment schemes). Other price risk is the risk that the fair value or future cash flows of a financial investment may fluctuate because of the changes in market prices. The exposure to other price risk has a direct impact on the Statement of Comprehensive Income and Statement of Financial Position of the Association.
There is a fundamental financial relationship between risk and return. The investments are diversified across different risk profiles in return for commensurate returns in accordance with St George's strategic asset allocation policy, meaning that the other price risk exposure is understood.
Whilst equity markets are inherently volatile and not suitable for short-term investment, over the long-term, equity investments have proven to be a good source of inflation protection, through the achievement of high returns in real terms. To manage the price risk, the investment portfolio is diversified in accordance with asset class limits (in accordance with St George's strategic asset allocation policy).
The table below summarises the impact of increases/decreases of the abovementioned investment exposures on the Association's post tax profit for the year and on equity. The analysis is based on the assumption that the respective price indexes for the different asset classes may increase/decrease by the determined volatility factor with all other variables held constant and the financial instruments moving in accordance to the historical correlation with the indexes that the investments are exposed to.
Taking into account past performance, future expectations, economic forecasts, and Association's management’s knowledge and experience of the financial markets, the impact on profit or loss and the impact on equity in the table below are ‘reasonably possible’ over the next 12 months if other price risk changes by the following volatility factors from the target benchmarks with all other variables, especially foreign exchange rates, held constant.
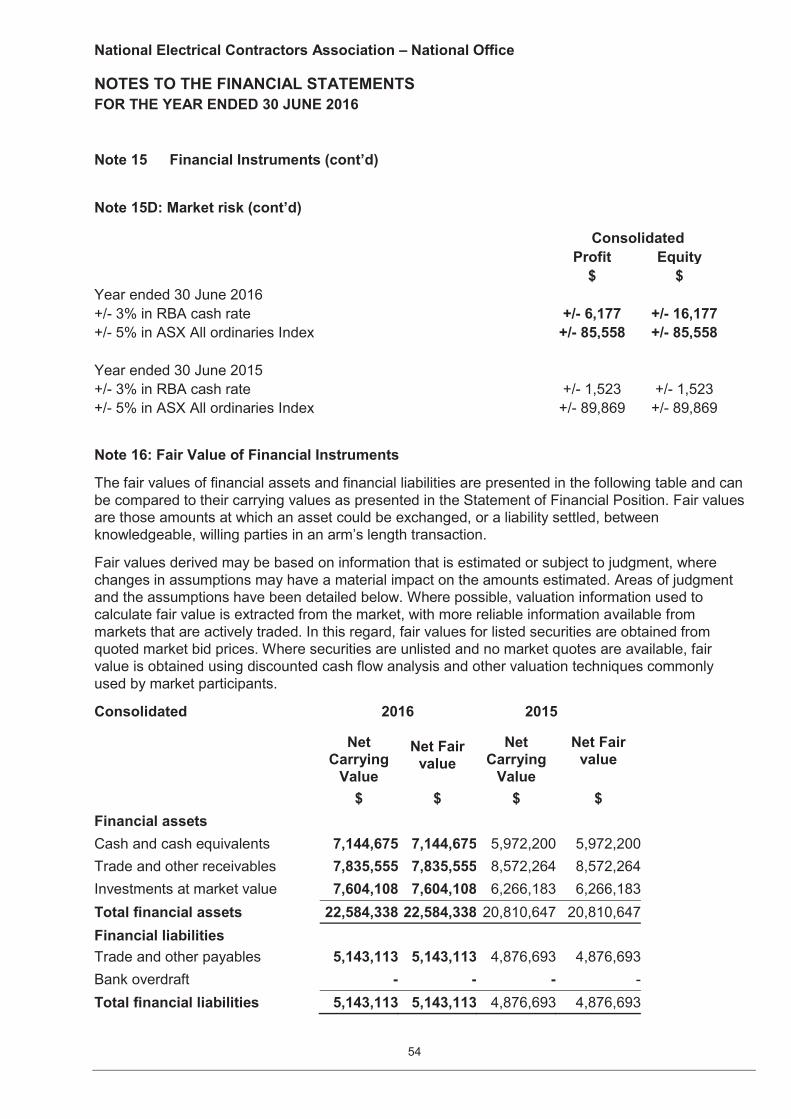
National Electrical Contractors Association – National Office
54
NOTES TO THE FINANCIAL STATEMENTS FOR THE YEAR ENDED 30 JUNE 2016
Note 15 Financial Instruments (cont’d)
Note 15D: Market risk (cont’d)
Consolidated Profit Equity $ $ Year ended 30 June 2016 +/- 3% in RBA cash rate +/- 6,177 +/- 16,177 +/- 5% in ASX All ordinaries Index +/- 85,558 +/- 85,558 Year ended 30 June 2015 +/- 3% in RBA cash rate +/- 1,523 +/- 1,523 +/- 5% in ASX All ordinaries Index +/- 89,869 +/- 89,869
Note 16: Fair Value of Financial Instruments
The fair values of financial assets and financial liabilities are presented in the following table and can be compared to their carrying values as presented in the Statement of Financial Position. Fair values are those amounts at which an asset could be exchanged, or a liability settled, between knowledgeable, willing parties in an arm’s length transaction.
Fair values derived may be based on information that is estimated or subject to judgment, where changes in assumptions may have a material impact on the amounts estimated. Areas of judgment and the assumptions have been detailed below. Where possible, valuation information used to calculate fair value is extracted from the market, with more reliable information available from markets that are actively traded. In this regard, fair values for listed securities are obtained from quoted market bid prices. Where securities are unlisted and no market quotes are available, fair value is obtained using discounted cash flow analysis and other valuation techniques commonly used by market participants.
Consolidated 2016 2015
Net
Carrying Value
Net Fair value
Net Carrying
Value
Net Fair value
$ $ $ $ Financial assets Cash and cash equivalents 7,144,675 7,144,675 5,972,200 5,972,200 Trade and other receivables 7,835,555 7,835,555 8,572,264 8,572,264 Investments at market value 7,604,108 7,604,108 6,266,183 6,266,183 Total financial assets 22,584,338 22,584,338 20,810,647 20,810,647 Financial liabilities Trade and other payables 5,143,113 5,143,113 4,876,693 4,876,693 Bank overdraft - - - - Total financial liabilities 5,143,113 5,143,113 4,876,693 4,876,693
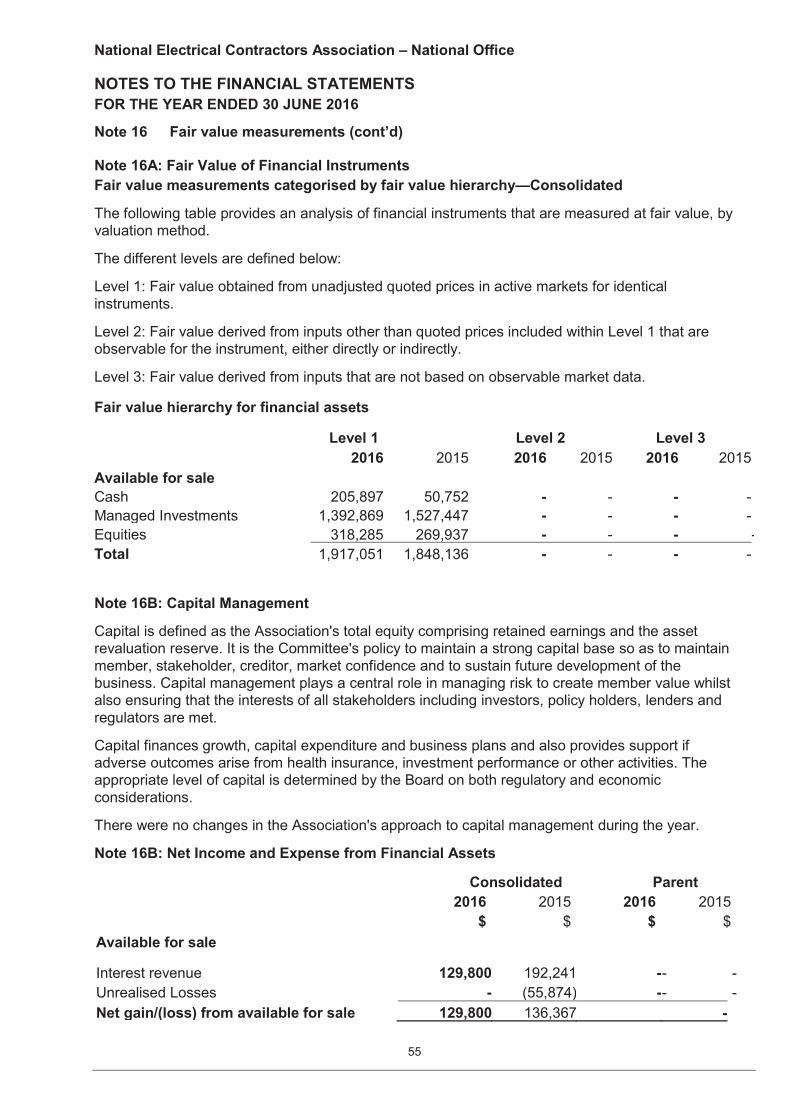
National Electrical Contractors Association – National Office
55
NOTES TO THE FINANCIAL STATEMENTS FOR THE YEAR ENDED 30 JUNE 2016
Note 16 Fair value measurements (cont’d) Note 16A: Fair Value of Financial Instruments Fair value measurements categorised by fair value hierarchy—Consolidated
The following table provides an analysis of financial instruments that are measured at fair value, by valuation method.
The different levels are defined below:
Level 1: Fair value obtained from unadjusted quoted prices in active markets for identical instruments.
Level 2: Fair value derived from inputs other than quoted prices included within Level 1 that are observable for the instrument, either directly or indirectly.
Level 3: Fair value derived from inputs that are not based on observable market data.
Fair value hierarchy for financial assets
Level 1 Level 2 Level 3 2016 2015 2016 2015 2016 2015
Available for sale Cash 205,897 50,752 - - - - Managed Investments 1,392,869 1,527,447 - - - - Equities 318,285 269,937 - - - -Total 1,917,051 1,848,136 - - - -
Note 16B: Capital Management
Capital is defined as the Association's total equity comprising retained earnings and the asset revaluation reserve. It is the Committee's policy to maintain a strong capital base so as to maintain member, stakeholder, creditor, market confidence and to sustain future development of the business. Capital management plays a central role in managing risk to create member value whilst also ensuring that the interests of all stakeholders including investors, policy holders, lenders and regulators are met.
Capital finances growth, capital expenditure and business plans and also provides support if adverse outcomes arise from health insurance, investment performance or other activities. The appropriate level of capital is determined by the Board on both regulatory and economic considerations.
There were no changes in the Association's approach to capital management during the year.
Note 16B: Net Income and Expense from Financial Assets
Consolidated Parent 2016 2015 2016 2015 $ $ $ $ Available for sale
Interest revenue 129,800 192,241 - - - Unrealised Losses - (55,874) - - - Net gain/(loss) from available for sale 129,800 136,367 -
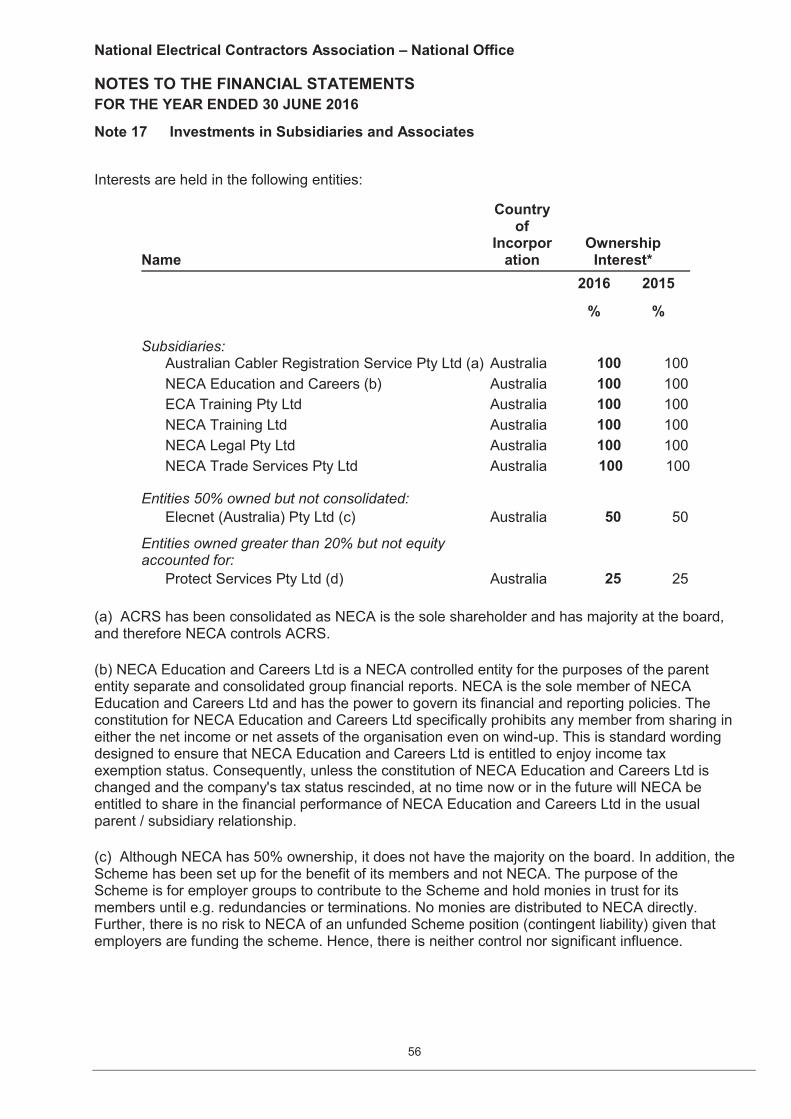
National Electrical Contractors Association – National Office
56
NOTES TO THE FINANCIAL STATEMENTS FOR THE YEAR ENDED 30 JUNE 2016
Note 17 Investments in Subsidiaries and Associates
Interests are held in the following entities:
Name
Country of
Incorporation
Ownership Interest*
2016
%
2015
%
Subsidiaries: Australian Cabler Registration Service Pty Ltd (a) Australia 100 100 NECA Education and Careers (b) Australia 100 100 ECA Training Pty Ltd Australia 100 100 NECA Training Ltd Australia 100 100 NECA Legal Pty Ltd Australia 100 100 NECA Trade Services Pty Ltd Australia 100 100
Entities 50% owned but not consolidated:
Elecnet (Australia) Pty Ltd (c) Australia 50 50
Entities owned greater than 20% but not equity accounted for:
Protect Services Pty Ltd (d) Australia 25 25
(a) ACRS has been consolidated as NECA is the sole shareholder and has majority at the board, and therefore NECA controls ACRS.
(b) NECA Education and Careers Ltd is a NECA controlled entity for the purposes of the parent entity separate and consolidated group financial reports. NECA is the sole member of NECA Education and Careers Ltd and has the power to govern its financial and reporting policies. The constitution for NECA Education and Careers Ltd specifically prohibits any member from sharing in either the net income or net assets of the organisation even on wind-up. This is standard wording designed to ensure that NECA Education and Careers Ltd is entitled to enjoy income tax exemption status. Consequently, unless the constitution of NECA Education and Careers Ltd is changed and the company's tax status rescinded, at no time now or in the future will NECA be entitled to share in the financial performance of NECA Education and Careers Ltd in the usual parent / subsidiary relationship.
(c) Although NECA has 50% ownership, it does not have the majority on the board. In addition, the Scheme has been set up for the benefit of its members and not NECA. The purpose of the Scheme is for employer groups to contribute to the Scheme and hold monies in trust for its members until e.g. redundancies or terminations. No monies are distributed to NECA directly. Further, there is no risk to NECA of an unfunded Scheme position (contingent liability) given that employers are funding the scheme. Hence, there is neither control nor significant influence.
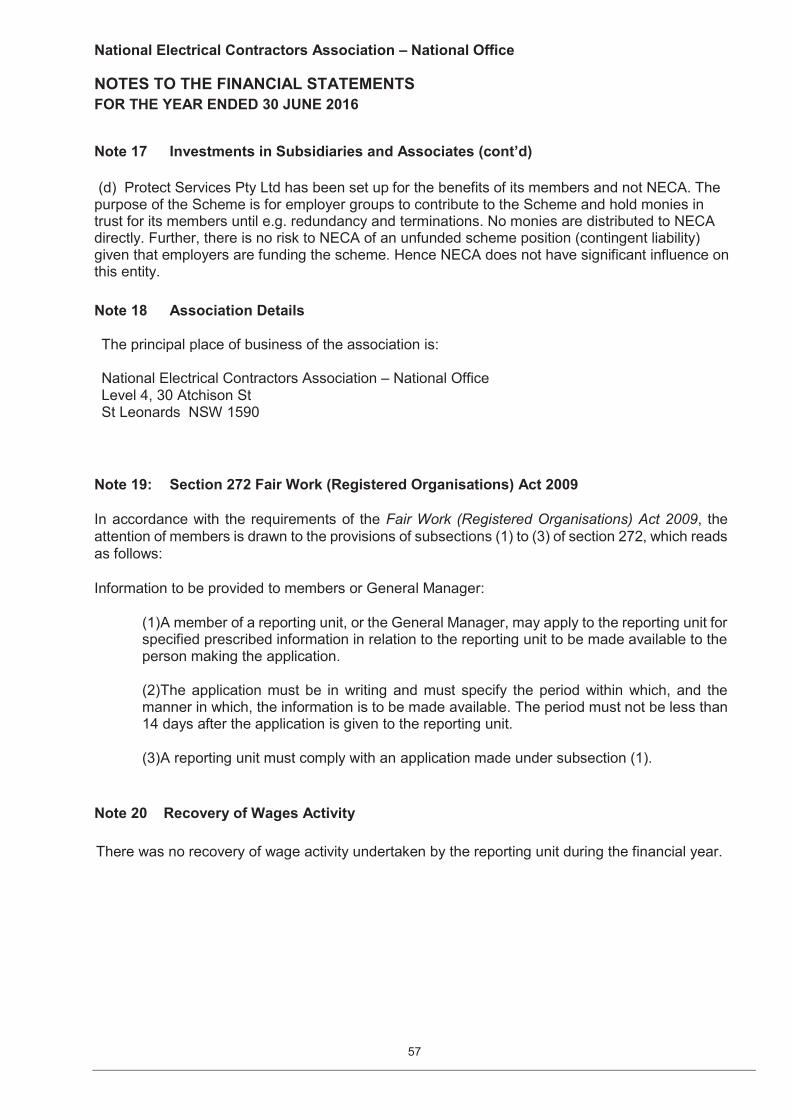
National Electrical Contractors Association – National Office
57
NOTES TO THE FINANCIAL STATEMENTS FOR THE YEAR ENDED 30 JUNE 2016
Note 17 Investments in Subsidiaries and Associates (cont’d)
(d) Protect Services Pty Ltd has been set up for the benefits of its members and not NECA. The purpose of the Scheme is for employer groups to contribute to the Scheme and hold monies in trust for its members until e.g. redundancy and terminations. No monies are distributed to NECA directly. Further, there is no risk to NECA of an unfunded scheme position (contingent liability) given that employers are funding the scheme. Hence NECA does not have significant influence on this entity. Note 18 Association Details
The principal place of business of the association is:
National Electrical Contractors Association – National Office Level 4, 30 Atchison St St Leonards NSW 1590
Note 19: Section 272 Fair Work (Registered Organisations) Act 2009 In accordance with the requirements of the Fair Work (Registered Organisations) Act 2009, the attention of members is drawn to the provisions of subsections (1) to (3) of section 272, which reads as follows: Information to be provided to members or General Manager:
(1) A member of a reporting unit, or the General Manager, may apply to the reporting unit for specified prescribed information in relation to the reporting unit to be made available to the person making the application.
(2) The application must be in writing and must specify the period within which, and the manner in which, the information is to be made available. The period must not be less than 14 days after the application is given to the reporting unit.
(3) A reporting unit must comply with an application made under subsection (1).
Note 20 Recovery of Wages Activity
There was no recovery of wage activity undertaken by the reporting unit during the financial year.
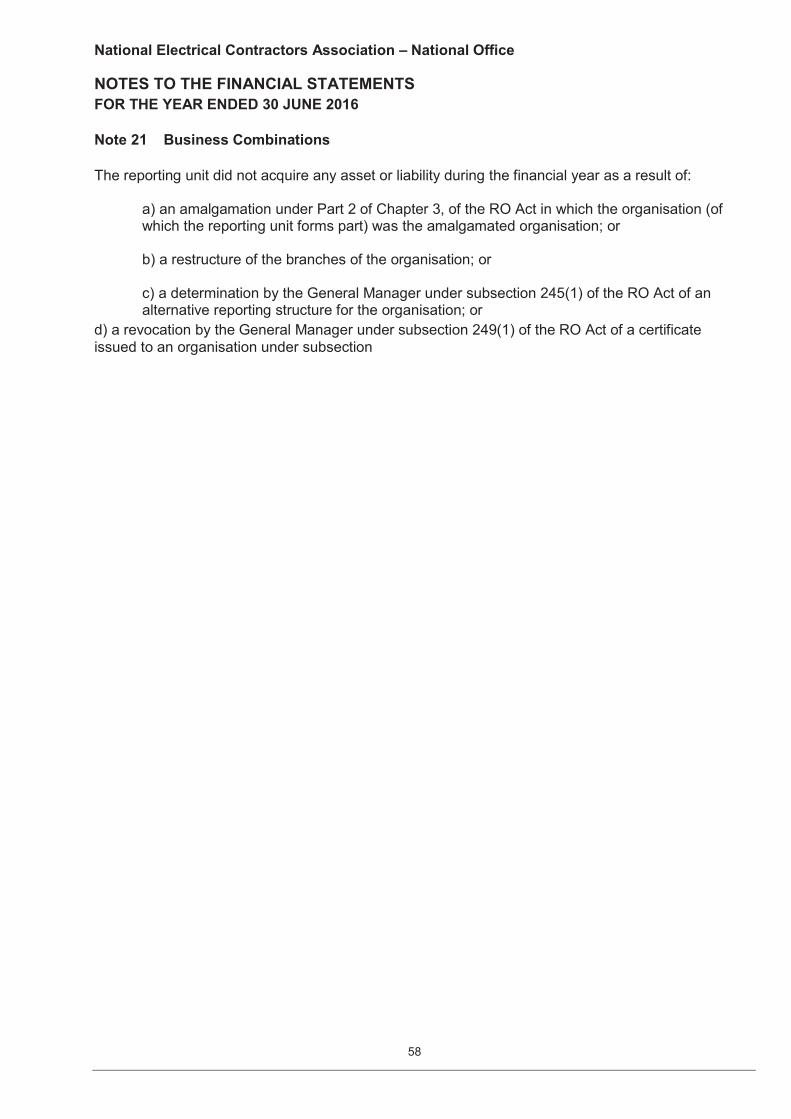
National Electrical Contractors Association – National Office
58
NOTES TO THE FINANCIAL STATEMENTS FOR THE YEAR ENDED 30 JUNE 2016
Note 21 Business Combinations
The reporting unit did not acquire any asset or liability during the financial year as a result of:
a) an amalgamation under Part 2 of Chapter 3, of the RO Act in which the organisation (of which the reporting unit forms part) was the amalgamated organisation; or
b) a restructure of the branches of the organisation; or
c) a determination by the General Manager under subsection 245(1) of the RO Act of an alternative reporting structure for the organisation; or
d) a revocation by the General Manager under subsection 249(1) of the RO Act of a certificate issued to an organisation under subsection