Embed Size (px)
Citation preview

National Evaluation of Welfare-to-Work Strategies
Implementation, Participation Patterns, Costs, and Two-Year Impacts of the Portland (Oregon)
Welfare-to-Work Program
U.S. Department of Health and Human Services Administration for Children and Families
Office of the Assistant Secretary for Planning and Evaluation
U.S. Department of Education Office of the Under Secretary
Office of Vocational and Adult Education
May 1998
Prepared by:
Susan Scrivener Gayle Hamilton
Mary Farrell Stephen Freedman Daniel Friedlander
Marisa Mitchell Jodi Nudelman
Christine Schwartz
Manpower Demonstration Research Corporation

The Manpower Demonstration Research Corporation (MDRC) is conducting the National Evaluation of Welfare-to-Work Strategies under a contract with the U.S. Department of Health and Human Services (HHS), funded by HHS under a competitive award, Contract No. HHS-100-89-0030. HHS is also receiving funding for the evaluation from the U.S. Department of Education. The study of one of the sites in the evaluation, Riverside County (California), is also conducted under a contract from the California Department of Social Services (CDSS). CDSS, in turn, is receiving funding from the California State Job Training Coordinating Council, the California Department of Education, HHS, and the Ford Foundation. Additional funding to support the Child Outcomes portion of the study is provided by the following foundations: the Foundation for Child Development, the William T. Grant Foundation, and an anonymous funder. The findings and conclusions presented herein do not necessarily represent the official positions or policies of the funders. Other Publications from This Evaluation
From Welfare to Work. Judith M. Gueron and Edward Pauly. 1991. New York: Russell Sage Foundation. The Saturation Work Initiative Model in San Diego: A Five-Year Follow-up Study. Daniel Friedlander and Gayle Hamilton. 1993. New York: MDRC. Early Lessons from Seven Sites. Gayle Hamilton and Thomas Brock. 1994. Washington, D.C.: U.S. Department of Health and Human Services and U.S. Department of Education. Five Years After: The Long-Term Effects of Welfare-to-Work Programs. Daniel Friedlander and Gary Burtless. 1995. New York: Russell Sage Foundation. Adult Education for People on AFDC: A Synthesis of Research. U.S. Department of Education and U.S. Department of Health and Human Services. Prepared by Edward Pauly, MDRC. 1995. Washington, D.C.: U.S. Department of Health and Human Services, Office of the Assistant Secretary for Planning and Evaluation. Early Findings on Program Impacts in Three Sites. U.S. Department of Health and Human Services and U.S. Department of Education. Prepared by Stephen Freedman and Daniel Friedlander, MDRC. 1995. Washington, D.C.: U.S. Department of Health and Human Services, Office of the Assistant Secretary for Planning and Evaluation. How Well Are They Faring? AFDC Families with Preschool-Aged Children in Atlanta at the Outset of the JOBS Evaluation. U.S. Department of Health and Human Services and U.S. Department of Education. Prepared by Kristin A. Moore, Martha J. Zaslow, Mary Jo Coiro, Suzanne M. Miller, Child Trends, Inc., and Ellen B. Magenheim, Swarthmore College. 1995. Washington, D.C.: U.S. Department of Health and Human Services, Office of the Assistant Secretary for Planning and Evaluation. Monthly Participation Rates in Three Sites and Factors Affecting Participation Levels in Welfare-to-Work Programs. U.S. Department of Health and Human Services and U.S. Department of Education. Prepared by Gayle Hamilton, MDRC. 1995. Washington, D.C.: U.S. Department of Health and Human Services, Office of the Assistant Secretary for Planning and Evaluation. Work First: How to Implement an Employment-Focused Approach to Welfare Reform. Amy Brown, 1997. New York: MDRC. Changing to a Work First Strategy: Lessons from Los Angeles County’s GAIN Program for Welfare Recipients. Evan Weissman. 1997. New York: MDRC. Educating Welfare Recipients for Employment and Empowerment: Case Studies of Promising Programs. U.S. Department of Education and U.S. Department of Health and Human Services. Prepared by Janet Quint, MDRC. Forthcoming. Evaluating Two Welfare-to-Work Program Approaches: Two-Year Findings on the Labor Force Attachment and Human Capital Development Programs in Three Sites. U.S. Department of Health and Human Services and U.S. Department of Education. Prepared by Gayle Hamilton, Thomas Brock, Mary Farrell, Daniel Friedlander, and Kristen Harknett, MDRC. 1997. Washington, D.C.: U.S. Department of Health and Human Services, Administration for Children and Families and Office of the Assistant Secretary for Planning and Evaluation.

-iii-
Contents Acknowledgments ix Executive Summary ES-1 Chapter 1 Introduction 1 I. Research Design, Research Questions, and Data Sources 2
A. Research Design 2 B. Research Questions 5 C. Data Sources 5
II. Portland’s Evaluation Context 7
A. Interpreting the Results 7 B. Program Environment 7 C. Sample Characteristics 9
III. Contents of the Report 12
2 Implementation of the Portland JOBS Program 13 I. Overview of Welfare-to-Work Policy in Portland, 1980s and 1990s 13
II. Overview of the Implementation of Portland’s Program 14
III. Organizational Structure of the Program 15
IV. Program Staffing Structure 17
A. Staff Descriptions and Duties 17 B. Staff Caseloads and Characteristics 18 C. Partnership Between Welfare Department Staff and JOBS Staff 18
V. Program Activity Components, Sequence, and Emphasis 20
A. Activity Sequence and Emphasis 22 B. Content of Program Activities 24
VI. Child Care and Support Services 26
A. Child Care 27 B. Transportation Assistance and Ancillary Expenses 28 C. Health Coverage 28
VII. Program Messages and LFA/HCD Orientation 28
A. Staff’s Preferences Regarding the LFA and HCD Approaches 29 B. Staff’s Views on Job Selectivity 32

-iv-
VIII. Personalized Attention and Encouragement 33
IX. Participation Monitoring 35
X. Rule Enforcement and Sanctioning 37
XI. Staff Training, Evaluation, and Job Satisfaction 38
XII. Perceptions of the Effectiveness of JOBS 42 3 Participation Patterns in the Portland JOBS Program 44
I. Participation Measures and AFDC Dynamics 44
II. Overview of Participation Patterns 45
III. Assignment Patterns 46
IV. Participation Rates and Length of Stay in Activities 49
V. Part-Time Employment While JOBS-Mandatory 53
VI. Sanctioning 53
VII. Overview of “Paths” Through the Program 55
VIII. Coverage with a Welfare-to-Work Obligation 59
IX. Participation Among Program Group Members in Employment-Related Activities Outside JOBS 61
X. Comparison of Participation Levels with What Would Have Happened in the Absence of the Program 62 4 Cost of the Portland JOBS Program 65
I. Major Components of the Cost Analysis 66
II. JOBS-Related Cost per Program Group Member 68
A. JOBS-Related Expenditures by the Welfare Department (Figure 4.1, Box 1) 68 B. JOBS-Related Expenditures by Non-Welfare Agencies (Figure 4.1, Box 2) 74 C. Total JOBS-Related Cost (Figure 4.1, Box 3) 74
III. Non-JOBS Cost per Program Group Member 77
A. Non-JOBS Expenditures by the Welfare Department (Figure 4.1, Box 4) 77 B. Non-JOBS Expenditures by Non-Welfare Agencies (Figure 4.1, Box 5) 79 C. Total Non-JOBS Cost (Figure 4.1, Box 6) 79
IV. Gross Cost per Program Group Member (Figure 4.1, Box 7) 79

-v-
V. Gross Cost per Control Group Member 80
A. Welfare Department Cost (Figure 4.1, Box 8) 80 B. Non-Welfare Agency Cost (Figure 4.1, Box 9) 80 C. Total Gross Cost per Control Group Member (Figure 4.1, Box 10) 83
VI. Net Cost per Program Group Member (Figure 4.1, Box 11) 83
VII. Education Attainment Subgroups 84 5 Impacts of the Portland JOBS Program 85 I. Key Findings 85
II. Analysis Issues 86
III. Impacts on Attainment of Education or Training Credentials 87
IV. Impacts on Employment and Earnings 87
A. Employment and Earnings Over Time 91 B. Job Quality 91 V. Impacts on Public Assistance 97
A. AFDC Receipt 97 B. Food Stamp Receipt 98
VI. Impacts on Employment and Welfare Status After Two Years 99
VII. Impacts on Total Measured Income 101
A. Income from Earnings, AFDC, and Food Stamps 101 B. Survey-Based Measures of Respondent and Household Income 102
VIII. Impacts on Health Care Coverage 102
IX. Impacts for Key Subgroups 105
A. High School Diploma/GED Subgroups 107 B. Most Disadvantaged Subgroup 107 C. Subgroup Impacts Over Time 107
Appendices Appendix A: Supplementary Tables to Chapter 1 109 Appendix B: Items Used to Create Scales for the Income Maintenance, Integrated, and JOBS Staff Surveys 115 Appendix C: Supplementary Tables to Chapter 2 129 Appendix D: Supplementary Tables and Figure to Chapter 3 137 Appendix E: Supplementary Table to Chapter 4 145 Appendix F: Supplementary Tables and Figure to Chapter 5 147 References 174

-vi-
List of Tables and Figures
Table 1.1 Characteristics of the Program Environment 10 1.2 Selected Characteristics of Sample Members 11 2.1 Caseloads and Characteristics of Program Staff 19 3.1 Summary of Rates of Participation Within a Two-Year Follow-Up Period, by High School Diploma/GED Status 50 3.2 Length of Participation Within a Two-Year Follow-Up Period, by High School Diploma/GED Status 52 3.3 Summary of Sanction Activity Within a Two-Year Follow-Up Period, by High School Diploma/GED Status 54 3.4 Two-Year Impacts on Participation in Job Search, Education, Training, and Work Experience, and Sanctioning 63 4.1 Estimated Unit Costs for Employment-Related Activities (in 1993 Dollars) 70 4.2 Estimated JOBS Cost per Program Group Member Within Two Years After Orientation, by Agency (in 1993 Dollars) 72 4.3 Estimated Support Service Cost per Program Group Member Within Two Years After Orientation (in 1993 Dollars) 73 4.4 Estimated Total Gross Costs and Net Costs Within Two Years After Orientation (in 1993 Dollars) for the Full Sample, and by High School Diploma/GED Status 81 5.1 Impacts on Education or Training Credentials at the End of Two Years for Respondents, by High School Diploma/GED Status at Study Entry 88 5.2 Two-Year Impacts on Employment, Earnings, AFDC, Food Stamps, and Combined Income 89 5.3 Impacts on Job Characteristics at the End of Two Years for All Respondents and Those Employed at Interview 96 5.4 Impact on Total Respondent and Household Income in the Last Month of Follow-Up 103 5.5 Impacts on Employment, Earnings, and AFDC for Selected Subgroups 106 A.1 Additional Selected Characteristics of Sample Members 110 A.2 Attitudes and Opinions of Sample Members 112 C.1 Selected Income Maintenance and Integrated Staff Survey Measures 130 C.2 Selected Integrated and JOBS Staff Survey Measures 132 C.3 Selected Client Survey Measures 135 D.1 Rates of Participation Within a Two-Year Follow-Up Period, by High School Diploma/GED Status and Youngest Child's Age 138 D.2 Participation of Program Group Members in Job Search, Education, Training, and Work Experience, Within a Two-Year Follow-Up Period, by Whether Participation was Part of JOBS or Outside of JOBS 141
-vii-
Table D.3 Two-Year Impacts on Participation in Job Search, Education, Training, and Work Experience, and Sanctioning Based on Client Survey Data Only 142 D.4 Two-Year Impacts on Participation in Job Search, Education, Training and Work Experience, and Sanctioning, by High School Diploma/GED Status 143 E.1 Estimated Support Service Cost per Program Group Member Within Two Years After Orientation (in 1993 Dollars), by Age of Youngest Child at Study Entry 146 F.1 Two-Year Impacts on Employment, Earnings, AFDC, and Food Stamps 148 F.2 For Single-Parent Sample Members Randomly Assigned Through December 1993: Three-Year Impacts on Employment, Earnings, AFDC, and Food Stamps 151 F.3 Impact on Health Care Coverage for Respondents and Respondents' Children as of the End of Two Years 155 F.4 For Sample Members with a High School Diploma or GED: Two-Year Impacts on Employment, Earnings, AFDC, and Food Stamps 156 F.5 For Sample Members Without a High School Diploma or GED: Two-Year Impacts on Employment, Earnings, AFDC, and Food Stamps 159 F.6 For the "Most Disadvantaged" Sample Members: Two-Year Impacts on Employment, Earnings, AFDC, and Food Stamps 162 F.7 Three-Year Impacts on Employment, Earnings, AFDC, and Food Stamps for Single-Parent Sample Members with a High School Diploma or GED Randomly Assigned Through December 1993 165 F.8 Three-Year Impacts on Employment, Earnings, AFDC, and Food Stamps for Single-Parent Sample Members Without a High School Diploma or GED Randomly Assigned Through December 1993 168 F.9 Three-Year Impacts on Employment, Earnings, AFDC, and Food Stamps for Single-Parent "Most Disadvantaged" Sample Members Randomly Assigned Through December 1993 171
Figure 1.1 Steps Leading from Income Maintenance to Attendance at BASIS Testing Session and Random Assignment 3 2.1 Relations Between Income Maintenance Workers and JOBS 21 2.2 Employment Preparation Strategy 30 2.3 Personalized Attention and Encouragement 34 2.4 Participation Monitoring 36 2.5 Rule Enforcement and Sanctioning 39 2.6 Staff Training, Supervision, and Evaluation 40 2.7 Perceptions of the Effectiveness of JOBS 43 3.1 Assignment Patterns Within a Two-Year Follow-Up Period 47 3.2 AFDC and JOBS Statuses Within a Two-Year Follow-Up Period, by Follow-Up Month 56 3.3 Distribution of Sample Members by Descriptive (Not Causal) Activity Sequences Within a Two-Year Follow-Up Period 57

-viii-
Figure 3.4 Proportion of JOBS-Mandatory Months in Various JOBS Statuses Within a Two-Year Follow-Up Period 60 4.1 Major Components of Gross and Net Costs 67 4.2 Percentage Distribution of Two-Year JOBS Program-Related Costs per Program Group Member, by Activity and Support Service 75 5.1 Quarterly Impacts on Earnings and AFDC Payments 92 5.2 Relative Contributions of Employment Duration, Earnings on the Job, and Job Finding to the Two-Year Earnings Impact 94 5.3 Employment and AFDC Status at the End of Year 2 100 D.1 Average Number of Months Receiving AFDC, JOBS-Mandatory, and Participating in a JOBS Activity, Sanctioned, or Employed Within a Two-Year Follow-Up Period 140 F.1 Distribution of Sample Members According to Year 2 Income and the Poverty Threshold 154

-ix-
Acknowledgments
This evaluation could not have taken place without the unwavering cooperation and commitment of the Oregon Adult and Family Services (AFS) and the Steps to Success staff. The top management staff set the tone for this support: Kevin Concannon and Gary Weeks, the present and past Directors of the Department of Human Resources (DHR); Sandie Hoback and Stephen Minnich, the present and past Administrators of the AFS Division of DHR, and Jerry Burns and Debbie White, the former Managers of the AFS JOBS Unit. Their willingness to submit their welfare-to-work program to an ambitious, long-term study, with its elaborate research design and rigorous data requirements, merits special recognition. Special thanks go also to Susan Blanche-Kappler, the site liaison with MDRC and the U.S. Department of Health and Human Services, who has overseen the implementation of the evaluation and has provided ongoing guidance and input.
A number of AFS management information systems personnel facilitated the access and utilization of state administrative and cost datasets: Margaret Armontrout, Edward Buckner, Ward Kent, Larry Morris, and Bob Putman.
At the AFS District Two office, thanks are due to the current regional manager, Maureen Casterline, and her predecessor, Jean Stryker, as well as their staff for their support in implementing the evaluation research design: Judith Brown, David Flock, Frank Gembinski, Erma Hepburn, Jean Pullen, and Marge Reinhart.
Many AFS branch office managers in Multnomah and Washington counties provided assistance over the course of the evaluation: Pat Adair, Rod Brown, June Cook, Cathy Craner, Oren Cyphers, Hilda Davis, Bob Earnest, Carol Eckel, Dorothy Fuller, Angel Grogen, Veda Latin, Bruce Lowry, Linda Montgomery, Ann Pickar, Kei Quitevis, Will Reinhart, Pam Ruddell, C. L. Thames, and Roger Zwemke.
Thanks also go to Jodi Davich, Mardica Hicks, Maureen Judge-Morris, Nan Poppe, and Julie Wyckoff-Byers, the Steps to Success program managers at the Mt. Hood and Portland Community College Districts, as well as their staff for conducting the random assignment procedures and participating in a multitude of research activities.
The contribution of these people, plus many more too numerous to mention, made the evaluation in Oregon a success.

ES-1
Executive Summary
Few domestic issues have generated as much attention over the past decade as welfare reform. Persistent dissatisfaction with the Aid to Families with Dependent Children (AFDC) program — the nation’s principal safety net for poor families — spurred the enactment in August 1996 of the Personal Responsibility and Work Opportunity Reconciliation Act.1 Among its pro-visions, the law replaced AFDC with a block grant program, Temporary Assistance for Needy Families (TANF), and created financial incentives for states to run mandatory, work-focused welfare-to-work programs.
Welfare-to-work programs provide services such as job search assistance, education, and training to help welfare recipients prepare for and find jobs. States have run versions of these programs to serve part of the welfare caseload for the past three decades. Various facets of the 1996 law, however, magnify the need for effective strategies to move people more quickly into jobs and off welfare. First, states may not use federal funds to support most families for longer than five years and may impose even shorter time limits on assistance (they may also elect to use state funds to support families beyond five years). Second, to prevent reductions in their block grants, states must meet demanding “participation standards” by engaging large proportions of TANF recipients in work or work-related activities. To meet these standards, most states will have to engage a wider cross section of the caseload in work or program activities than they did previously. Third, states’ TANF plans must include how the states will require recipients to work after two years of assistance.
As states and localities transform their welfare-to-work programs in response to the fed-eral legislation, the need to learn about programs that have moved substantial numbers of people into work and off welfare increases. The two-year findings presented in this report show the Portland, Oregon, welfare-to-work program run between early 1993 and mid 1996 to be among the most successful large-scale mandatory welfare-to-work programs studied, producing large increases in employment and earnings and equally large reductions in welfare receipt for a broad cross section of the welfare caseload. The positive effects remained very strong at the end of the two-year period studied, and preliminary data suggest they will continue into the third year.
This report is the latest from an evaluation of mandatory welfare-to-work programs in seven sites called the National Evaluation of Welfare-to-Work Strategies (NEWWS Evaluation), conducted by the Manpower Demonstration Research Corporation (MDRC) under contract to the U.S. Department of Health and Human Services, with support from the U.S. Department of Education. The report examines the mandatory welfare-to-work program run in Portland (Mult-nomah and Washington counties). Through the program, Portland provided employment and support services to a broad cross section of the AFDC caseload, including parents with children as young as one year old. These people were required to participate in program activities or face reductions in their welfare grants. Although the program studied was designed and implemented prior to the 1996 reform, its overarching goal was similar to that of the new law: to foster the self-sufficiency of adult recipients through increased employment and decreased welfare receipt.
1Pub. L. No. 104-193.
ES-2
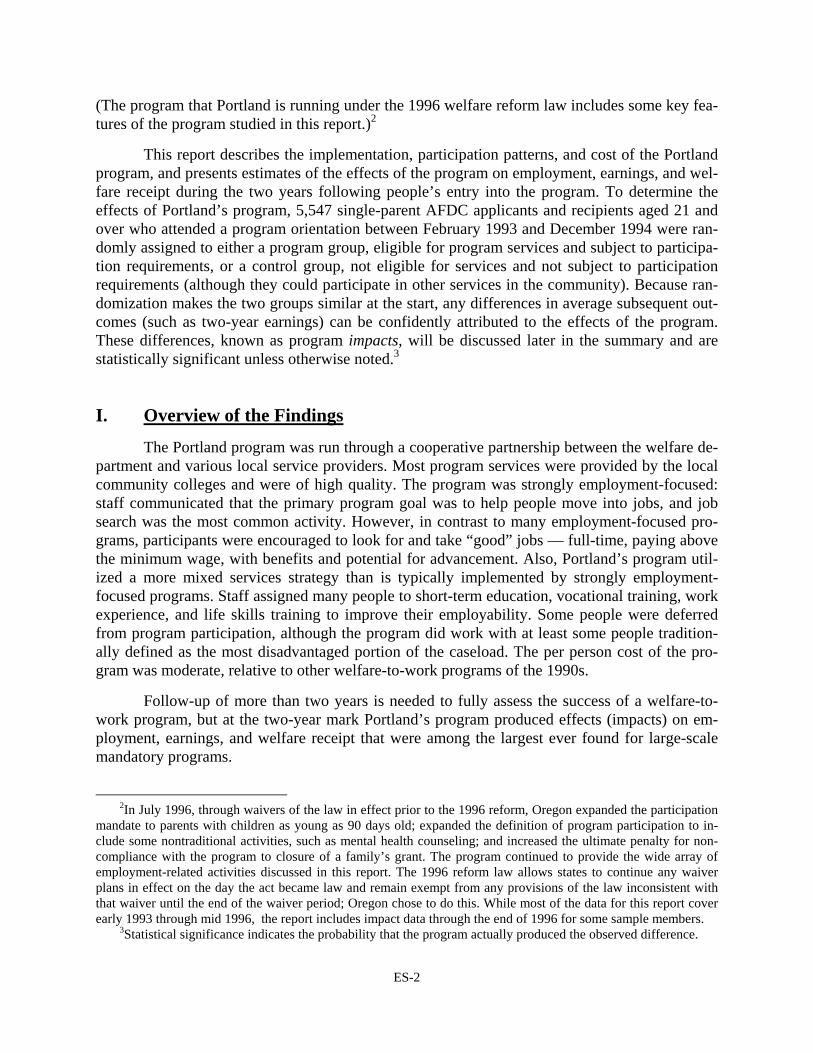
(The program that Portland is running under the 1996 welfare reform law includes some key fea-tures of the program studied in this report.)2
This report describes the implementation, participation patterns, and cost of the Portland program, and presents estimates of the effects of the program on employment, earnings, and wel-fare receipt during the two years following people’s entry into the program. To determine the effects of Portland’s program, 5,547 single-parent AFDC applicants and recipients aged 21 and over who attended a program orientation between February 1993 and December 1994 were ran-domly assigned to either a program group, eligible for program services and subject to participa-tion requirements, or a control group, not eligible for services and not subject to participation requirements (although they could participate in other services in the community). Because ran-domization makes the two groups similar at the start, any differences in average subsequent out-comes (such as two-year earnings) can be confidently attributed to the effects of the program. These differences, known as program impacts, will be discussed later in the summary and are statistically significant unless otherwise noted.3
I. Overview of the Findings
The Portland program was run through a cooperative partnership between the welfare de-partment and various local service providers. Most program services were provided by the local community colleges and were of high quality. The program was strongly employment-focused: staff communicated that the primary program goal was to help people move into jobs, and job search was the most common activity. However, in contrast to many employment-focused pro-grams, participants were encouraged to look for and take “good” jobs — full-time, paying above the minimum wage, with benefits and potential for advancement. Also, Portland’s program util-ized a more mixed services strategy than is typically implemented by strongly employment-focused programs. Staff assigned many people to short-term education, vocational training, work experience, and life skills training to improve their employability. Some people were deferred from program participation, although the program did work with at least some people tradition-ally defined as the most disadvantaged portion of the caseload. The per person cost of the pro-gram was moderate, relative to other welfare-to-work programs of the 1990s.
Follow-up of more than two years is needed to fully assess the success of a welfare-to-work program, but at the two-year mark Portland’s program produced effects (impacts) on em-ployment, earnings, and welfare receipt that were among the largest ever found for large-scale mandatory programs.
2In July 1996, through waivers of the law in effect prior to the 1996 reform, Oregon expanded the participation
mandate to parents with children as young as 90 days old; expanded the definition of program participation to in-clude some nontraditional activities, such as mental health counseling; and increased the ultimate penalty for non-compliance with the program to closure of a family’s grant. The program continued to provide the wide array of employment-related activities discussed in this report. The 1996 reform law allows states to continue any waiver plans in effect on the day the act became law and remain exempt from any provisions of the law inconsistent with that waiver until the end of the waiver period; Oregon chose to do this. While most of the data for this report cover early 1993 through mid 1996, the report includes impact data through the end of 1996 for some sample members.
3Statistical significance indicates the probability that the program actually produced the observed difference.

ES-3
• The Portland program substantially increased employment and produced unusually large increases in earnings. The program raised employment lev-els by 11 percentage points over two years (relative to the control group). More than one out of every four welfare recipients who normally would not have worked in an unsubsidized job during the two-year follow-up period did so as a result of the program. In addition, two-year earnings were increased by over $1,800 per sample member, a 35 percent increase over the control group’s earnings. These earnings gains are the largest found in the National Evaluation of Welfare-to-Work Strategies and approach the largest gains found for a large-scale mandatory program (those in the Riverside, California, GAIN program of the late 1980s).
• Unlike many programs that produce immediate impacts on employment and earnings, the Portland program increased job quality. At the end of two years, the program increased the proportion of people working at full-time jobs by 13 percentage points and, among those employed (a nonexperi-mental comparison), increased average hourly pay by $0.86. It increased the proportion of people with employer-provided health benefits by 10 percentage points.
• The program reduced welfare expenditures by 17 percent over the two-year follow-up period. Relative to the average total welfare payments that people in the control group received over the two years, the program reduced per person expenditures by almost $1,200. By the end of the follow-up period, only 41 percent of program group members were receiving welfare compared to 53 percent of control group members, a decrease of 12 percentage points.
• Portland’s impacts were widespread: both recipients with relatively few barriers to employment and those typically considered very hard to place achieved employment and earnings gains and AFDC reductions. Few other programs have attained such consistent impacts. Employment, earn-ings, and AFDC impacts were produced for those who entered the program with a high school diploma or GED (high school equivalency certificate) and those who had neither credential, as well as for the “most disadvantaged” (sample members who entered without a high school diploma or GED, had not worked during the prior year, and had received AFDC for at least two years prior to program entry).
• Over the two-year follow-up period, program group members’ average combined income from earnings, AFDC, and Food Stamps was not sub-stantially higher than that of control group members. However, more positive results at the end of the follow-up period suggest that the pro-gram group may become financially better off in the future. Program group members’ two-year earnings gains were largely offset by losses in AFDC and Food Stamps. Quarterly impact trends suggest that income gains

ES-4
may emerge in the third year of follow-up.
Portland’s program was unusually successful in moving people into jobs, increasing their earnings, and moving them off welfare. This success occurred in a specific context: Portland’s caseload was predominantly white, minimizing the chances of racial discrimination in the labor market; a high percentage of the caseload entered the program with a high school diploma or GED certificate; and Portland’s economy was very strong during the study period, with low un-employment and substantial job growth.
II. Portland’s Evaluation Context
A. Interpreting the Results
To illustrate the magnitude of Portland’s accomplishments, this report makes a number of comparisons. The primary comparison — to show the net effects or impacts of the program — is between people in the program group and those in the control group. In addition, Portland’s pro-gram is compared with other programs to show the relative effectiveness of Portland’s approach. Specifically, this summary makes three types of explicit cross-program comparisons:
• Between Portland’s program and the three work first and three skills-building programs studied in Atlanta, Grand Rapids, and Riverside as part of the NEWWS Evaluation. (See the accompanying text box for a brief description of the programs in the evaluation.) Analyses similar to those re-ported here for Portland have been completed for these six programs; thus, rigorous comparisons can be made and Portland’s place on the work first/skills-building continuum can be estimated.
• Between Portland’s program and the other 10 programs in the NEWWS Evaluation (which include the three work first and three skills-building pro-grams) on measures for which data have been collected for all programs. This places Portland in the context of a wide range of welfare-to-work programs.4
4For two-year results for the work first and skills-building programs, see Gayle Hamilton, Thomas Brock, Mary
Farrell, Daniel Friedlander, and Kristen Harknett, Evaluating Two Welfare-to-Work Program Approaches: Two-Year Findings on the Labor Force Attachment and Human Capital Development Programs in Three Sites (Wash-ington, DC: U.S. Department of Health and Human Services, Administration for Children and Families and Office of the Assistant Secretary for Planning and Evaluation, 1997). For a description of all 11 programs, see Gayle Ham-ilton and Thomas Brock, The JOBS Evaluation: Early Lessons from Seven Sites (Washington, DC: U.S. Department of Health and Human Services and U.S. Department of Education, 1994). The two-year impacts for all programs will appear in a forthcoming report.
ES-5
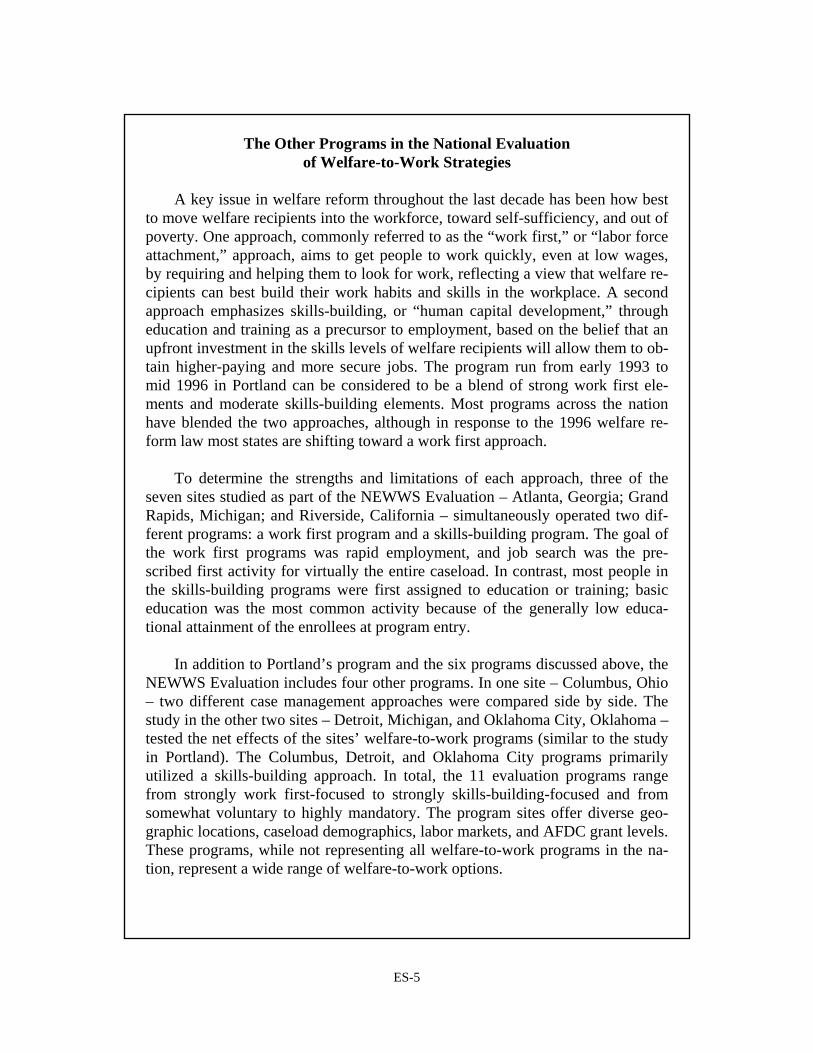
The Other Programs in the National Evaluation
of Welfare-to-Work Strategies
A key issue in welfare reform throughout the last decade has been how best to move welfare recipients into the workforce, toward self-sufficiency, and out of poverty. One approach, commonly referred to as the “work first,” or “labor force attachment,” approach, aims to get people to work quickly, even at low wages, by requiring and helping them to look for work, reflecting a view that welfare re-cipients can best build their work habits and skills in the workplace. A second approach emphasizes skills-building, or “human capital development,” through education and training as a precursor to employment, based on the belief that an upfront investment in the skills levels of welfare recipients will allow them to ob-tain higher-paying and more secure jobs. The program run from early 1993 to mid 1996 in Portland can be considered to be a blend of strong work first ele-ments and moderate skills-building elements. Most programs across the nation have blended the two approaches, although in response to the 1996 welfare re-form law most states are shifting toward a work first approach.
To determine the strengths and limitations of each approach, three of the seven sites studied as part of the NEWWS Evaluation – Atlanta, Georgia; Grand Rapids, Michigan; and Riverside, California – simultaneously operated two dif-ferent programs: a work first program and a skills-building program. The goal of the work first programs was rapid employment, and job search was the pre-scribed first activity for virtually the entire caseload. In contrast, most people in the skills-building programs were first assigned to education or training; basic education was the most common activity because of the generally low educa-tional attainment of the enrollees at program entry.
In addition to Portland’s program and the six programs discussed above, the NEWWS Evaluation includes four other programs. In one site – Columbus, Ohio – two different case management approaches were compared side by side. The study in the other two sites – Detroit, Michigan, and Oklahoma City, Oklahoma – tested the net effects of the sites’ welfare-to-work programs (similar to the study in Portland). The Columbus, Detroit, and Oklahoma City programs primarily utilized a skills-building approach. In total, the 11 evaluation programs range from strongly work first-focused to strongly skills-building-focused and from somewhat voluntary to highly mandatory. The program sites offer diverse geo-graphic locations, caseload demographics, labor markets, and AFDC grant levels. These programs, while not representing all welfare-to-work programs in the na-tion, represent a wide range of welfare-to-work options.

ES-6
• Between Portland’s program and the Greater Avenues for Independence (GAIN) program run in Riverside, California, in the late 1980s, which produced very large increases in employment and earnings, and large de-creases in welfare receipt, and is often considered the benchmark for other programs. (This program is distinct from the work first and skills-building programs run in Riverside for the NEWWS Evaluation discussed in the text box.) 5
B. Sample and Program Environment
The results presented in this report should be considered in the context of Portland’s re-search sample and program environment. Compared to the samples in the other NEWWS Evaluation sites, the Portland sample had relatively high prior lifetime employment levels, but average prior recent employment (defined as work in the year before program entry). More sam-ple members in Portland than in the other sites had a high school diploma or GED at program entry, but the average highest grade completed in school was similar across all the sites (about 11th grade). Portland’s sample fell in the middle of the range of prior AFDC receipt. The sample in Portland was predominantly white, non-Hispanic, as is the general population in the Pacific Northwest, minimizing the chances of racial discrimination in the labor market.
AFDC grant levels in Oregon were significantly higher than the national average. Port-land’s labor market was strong, with relatively low unemployment rates, decreasing through most of the follow-up period, and high employment growth. The caseload and labor market can affect the results of a welfare-to-work program in many ways. Throughout the summary, these effects will be noted when relevant.
III. Findings on Program Implementation and Participation
• Portland’s program was designed and implemented through an unusually strong partnership between the welfare department and various local service providers, including the local community colleges, chambers of commerce, JTPA agencies, the state Employment Department, and oth-ers. Program services were of high quality.
Although state legislators and administrators defined the basic parameters of Oregon’s welfare-to-work program, each district in the state was given the freedom to implement the pro-gram as it saw fit. The Portland area welfare offices designed the program in cooperation with local community agencies; major budgeting and programming decisions were reached jointly.
5For presentation of findings, see James Riccio, Daniel Friedlander, and Stephen Freedman, GAIN: Benefits,
Costs, and Three-Year Impacts of a Welfare-to-Work Program (New York: MDRC, 1994); and Stephen Freedman, Daniel Friedlander, Winston Lin, and Amanda Schweder, Five-Year Impacts on Employment, Earnings, and AFDC Receipt (New York: MDRC, 1996).

ES-7
Job search, education, training, and work experience services were provided by the local com-munity colleges (with job search provided by the chambers of commerce in one study county), under contract with the welfare agency, and case management services were provided by both the welfare agency and the community colleges. Field researchers and program participants rated Portland’s program services highly compared to services in other programs.
• People active in the program were assigned to “integrated” case manag-ers responsible for both welfare eligibility and employment, training, and social services. The integrated staff were often supplemented by case managers employed by the community colleges. Caseload sizes were at the low end of the 11 programs in the NEWWS Evaluation.
In Portland, integrated case managers, employed by the welfare department, were respon-sible for all aspects of program participants’ cases and had sole authority for all decisions, such as making activity referrals, authorizing support services, and imposing financial penalties for program noncompliance. In many instances, case managers employed by the community col-leges worked in cooperation with the integrated staff and helped recommend services, checked up on attendance, and provided quick intervention if problems in attendance or progress arose.
• Portland’s program was focused on employment; however, rather than urging people to take “any” jobs (the approach typical of most work first programs), staff encouraged people to seek and accept “good” jobs — full-time jobs paying more than minimum wage with benefits and poten-tial for advancement.
The primary goal of Portland’s program was to move people into the labor market. For applicants, the employment message was apparent even before they entered the program: at AFDC application, people were assigned to an initial work search activity to be completed prior to the welfare-to-work program orientation, which took place about a month later. (Since this initial activity occurred prior to random assignment, which took place in conjunction with orien-tation sessions, any effects it may have had are not reflected in the program group/control group differences discussed in this report.) Among post-orientation activities, job search (including job club and other job search activities) was the one most commonly assigned and utilized. Program staff told people in all activities, including education and training, that their goal should be to achieve self-sufficiency through paid work.
Job club, job development, and job placement activities in Portland were particularly well supported. Full-time job developers used various methods to link participants to job oppor-tunities, such as working closely with employers to discover unadvertised openings and sending them flyers “advertising” their linking service. Other staff worked to connect program group members with existing leads through the state Employment Department.
Portland also had an individualized work experience component in which program staff custom-designed work experience positions based on people’s skills and interests. Positions were in both nonprofit organizations and for-profit companies. (Participation was voluntary in the for-profit work slots.) Staff reported that many work experience positions led to unsubsidized jobs.
In Portland, “good” jobs, rather than “any” jobs, were considered the preferable path to

ES-8
self-sufficiency. One standard used to measure the welfare district’s and service providers’ per-formance was an average wage-of-placement that was always much higher than the minimum wage (for example, in 1994 Oregon’s minimum wage was $4.75 and the average wage-of-placement target was $6.00). Another standard concerned “AFDC recidivism” — the percentage of individuals who returned to the welfare rolls — and encouraged staff to promote jobs that were likely to last. If a service provider’s performance was more than 20 percent below any of the standards in a quarter, provider and welfare staff were required to write a corrective plan de-scribing how they would meet the standard in the future; ultimately the provider risked losing its contract with the welfare department. (During the follow-up period for this report, standards-related issues did not lead to written corrective plans or loss of contracts by providers.) Job de-velopers actively sought positions that paid above the minimum wage and provided room for ad-vancement. Some staff did not discourage participants from accepting low-paying jobs, but usually only when there was potential for advancement. It is important to note that “good” jobs would probably have been more difficult to develop and find in a poor economy, and a more dis-advantaged caseload would have been less able to be selective when choosing work.
• The Portland program used a mixed services strategy: most people par-ticipated in job search, but many also participated in short-term educa-tion, vocational training, work experience, and life skills training.
There was no single uniform path through the program. Although Portland aimed to move people into the labor market, at one-on-one meetings directly following program orienta-tion, case managers evaluated some people — based on a confluence of factors including work history, educational status, and reading and math skills — as not ready to go immediately into job search. During the period studied, about half of first activity assignments were to job search and half were to other activities (over time, an increasing proportion of people were first as-signed to job search). Some people who completed job search without finding work subsequently took part in education or training, and many people who first participated in a non-job search activity subsequently participated in job search (if they remained on the welfare rolls). Activities were especially varied for those who entered the program without a high school diploma or GED certificate, with many participating in basic education.
The goal of education, training, and work experience activities was to prepare individuals relatively quickly for unsubsidized employment; thus, Portland staff encouraged short-term par-ticipation. Program group members who took part in program activities participated for about five months over the two-year follow-up, similar to the average length of stay in the three work first programs in the NEWWS Evaluation and shorter than the average length of stay in the three skills-building programs.
• Many people were not assigned by a case manager to a program activity, although the program worked with at least some individuals traditionally defined as the most disadvantaged.
About one-third of program group members were not assigned to an activity in the three months following random assignment. During this period, about half of these nonassigned indi-viduals were “deferred” from participation by a case manager; most others became nonmandatory for the program because they left AFDC or experienced a status change such as pregnancy. Most of those initially deferred were never assigned to an activity during the two-year follow-up (although

ES-9
case managers encouraged many of these people to seek services outside the program, such as re-medial education or mental health counseling).
During field research, case managers reported that people with very low skills, serious physical or mental health problems, or exceptionally low motivation levels often were not referred to program activities. However, as mentioned, Portland’s program produced employment and AFDC impacts for all subgroups of the sample, including the most disadvantaged portion of the caseload, defined using education, employment, and AFDC receipt indicators (as noted below, the program increased participation for this group). Thus, while case managers were somewhat selec-tive in whom they assigned to activities, they were, in fact, working with at least some of those who are traditionally viewed, according to objective measures, as the most disadvantaged portion of the caseload.
• Compared to what would have happened in the absence of a welfare-to-work program, Portland’s program dramatically increased participation in job search and, to a lesser extent, increased participation in basic edu-cation, vocational training or college, and work experience.
Control group members’ level of self-initiated activity represents what would have hap-pened if program group members had had no exposure to Portland’s welfare-to-work program. As Figure 1 shows, most control group participation was in basic education and vocational train-ing or college. Program group members were seven times more likely to engage in job search than their control group counterparts during the two-year follow-up period (for the program group, this “job search” measure included some participation in life skills training classes, which covered issues such as career exploration, résumé preparation, time management, and problem-solving). Program group members were also more likely to participate in basic education, includ-ing GED preparation classes, vocational training or college, and work experience.
The program substantially increased participation in activities for a broad cross section of the caseload — both those with a high school diploma or GED (“graduates”) and those without (“nongraduates”), and the most disadvantaged.
• Overall, Portland’s program was strongly mandatory. Sanctioning rates were high compared to rates in programs run in the 1980s, but fall in the middle of the range of rates for the six 1990s work first and skills-building programs in Atlanta, Grand Rapids, and Riverside studied as part of the NEWWS Evaluation.
Staff closely monitored those assigned to or engaged in program activities. Most Portland staff tried to encourage participation and compliance with program requirements using positive encouragement, emphasizing the potential benefits for the individual and her family. If, after lengthy cajoling, people did not eventually comply, staff imposed financial sanctions (AFDC grant reductions). Twenty-one percent of program group members were sanctioned during the two-year follow-up period and the average sanction lasted about five months. In the six pro-grams

ES-10
0
10
20
30
40
50
60
70
80
90
100
Job search Basiceducation
Vocationaltraining or
college
Workexperience
Perc
ent
Program group
Control group
Figure 1
Rates of Participation, by Program or Control Group Status
run in Atlanta, Grand Rapids, and Riverside, sanction rates ranged from 9 to 42 percent and sanctions lasted for an average of eight months.
IV. Findings on Program Costs
• Excluding spending that would have occurred without any special wel-fare-to-work program, the two-year net per person cost of Portland’s program was $2,017. This net cost is higher than the average net cost for the three work first programs studied as part of the NEWWS Evaluation ($1,550) and much lower than the average net cost for the three skills-building programs ($3,077).
The costs estimated in this report consist of all costs associated with providing employ-ment services and related support services to sample members; costs associated with authorizing and processing welfare payments are not included. The gross cost per program group member during the two-year follow-up period consists of costs paid by the welfare department and non-welfare agencies while sample members were enrolled in Portland’s program as well as for em-ployment and support services after they exited the program and, in some cases, left AFDC. The two-year gross cost per Portland program group member was $4,027. The welfare department paid about two-thirds of this cost; the remainder was paid by schools and other agencies. The proportion of costs covered by the welfare department is high compared to the other programs studied in the NEWWS Evaluation. The welfare department in Portland contracted out, and thus

ES-11
paid for, most of the program services, whereas most programs rely more on noncontracted out-side agencies.
The net cost per program group member during the two-year follow-up period is the gross cost per program group member minus what would have been spent in the absence of a mandatory welfare-to-work program, as measured by the cost per control group member. Control group members were not eligible to take part in program activities, but could enroll on their own in other employment-related activities in the community and were eligible for activity- and em-ployment-related welfare department support services. Thus, control group costs include expen-ditures for all of the nonprogram activities and support services utilized by control group members during the two-year follow-up period. As Table 1 shows, Portland’s two-year net cost per program group member was $2,017. This net cost is higher than the average net cost per work first sample member and much lower than the average net cost per skills-building sample member. (A five-year benefit-cost analysis will eventually be completed as part of the NEWWS Evaluation.)
• Compared to the six programs studied in Atlanta, Grand Rapids, and Riverside, the cost of support services in Portland was very high because of high monthly child care payments and extensive use of child care bene-fits both while people were participating in program activities and during employment. For parents with younger children, these factors were even more pronounced.
Support services accounted for 38 percent of Portland’s gross costs (see Table 1). A large proportion of the support service costs — $1,422 per program group member — was for child care. Total child care costs in the six work first and skills-building programs ranged from $88 to $794 per person. In Portland, 50 percent of program group members received payments for child care services while they were enrolled in the program, compared to 17 to 31 percent in the six work first and skills-building programs. Twenty-six percent in Portland received employment-related child care payments (including transitional child care, provided for up to one year for those who left AFDC for work, and Employment-Related Day Care, provided with no time limit to those not eligible for transitional care) compared to no more than 7 percent in any of the other programs studied.
The high rates of child care use for both program participation and employment in Port-land probably reflect the strong emphasis that staff placed on securing child care arrangements and having a backup option. The high rates of employment-related child care use also reflect Portland’s large impact on employment. Furthermore, it is possible that Portland’s integrated case managers were more likely than the traditional case managers in the other sites to know the two facts that qualify an individual for transitional benefits: namely, that the individual has re-ceived AFDC for at least three of the past six months and is leaving AFDC for employment. Staff who perform a dual role may also be more inclined to authorize benefits automatically, without a special request from a parent or other staff member.

ES-12
Table 1
Two-Year Gross and Net Costs (in 1993 Dollars)
Gross Cost per Program Gross Cost per Control Net Cost per ProgramProgram Group Member Group Member Group Member
PortlandOperating costs $2,486 $1,420 $1,066Support services 1,541 590 951Total 4,027 2,010 2,017
Average of three work first programsOperating costs 2,768 1,546 1,222Support services 499 171 328Total 3,267 1,717 1,550
Average of three skills-building programsOperating costs 4,088 1,481 2,607Support services 637 166 471Total 4,724 1,647 3,077
NOTE: Rounding may cause slight discrepancies in calculating the sums and differences.
Child care costs in Portland were particularly high for parents with younger children. As mentioned, Portland required parents with children as young as age 1 to participate in the pro-gram. The child care costs for those entering the program with a child under age 3 were more than twice the costs for parents entering the program with no children under age 3 ($2,144 com-pared to $936). Parents with younger children at program entry had higher average monthly child care payments and higher rates of child care receipt and received payments for a longer time than those without young children. It is interesting to note that although Grand Rapids also required participation from parents with children as young as age 1, per person child care costs in the Grand Rapids work first and skills-building programs ($367 and $542, respectively) were much lower than in Portland, owing to lower monthly payments and much lower rates of child care use.
V. Findings on Program Impacts
A. Impacts on Receipt of Education or Training Credentials
• For those entering the program without a high school diploma or GED certificate, the program substantially increased the number who obtained a GED certificate or a trade license or certificate. The increase in GED receipt rivals increases found for skills-building programs offering exten-sive, long-term education; the increase in trade license receipt exceeds that of any similar program studied.
Of individuals who entered Portland’s program without a high school diploma or GED certificate (“nongraduates”), 16 percent of program group members received a GED during the two years following random assignment compared to 5 percent of the control group, an 11 per-centage point increase. As mentioned earlier, many nongraduates attended basic education
ES-13
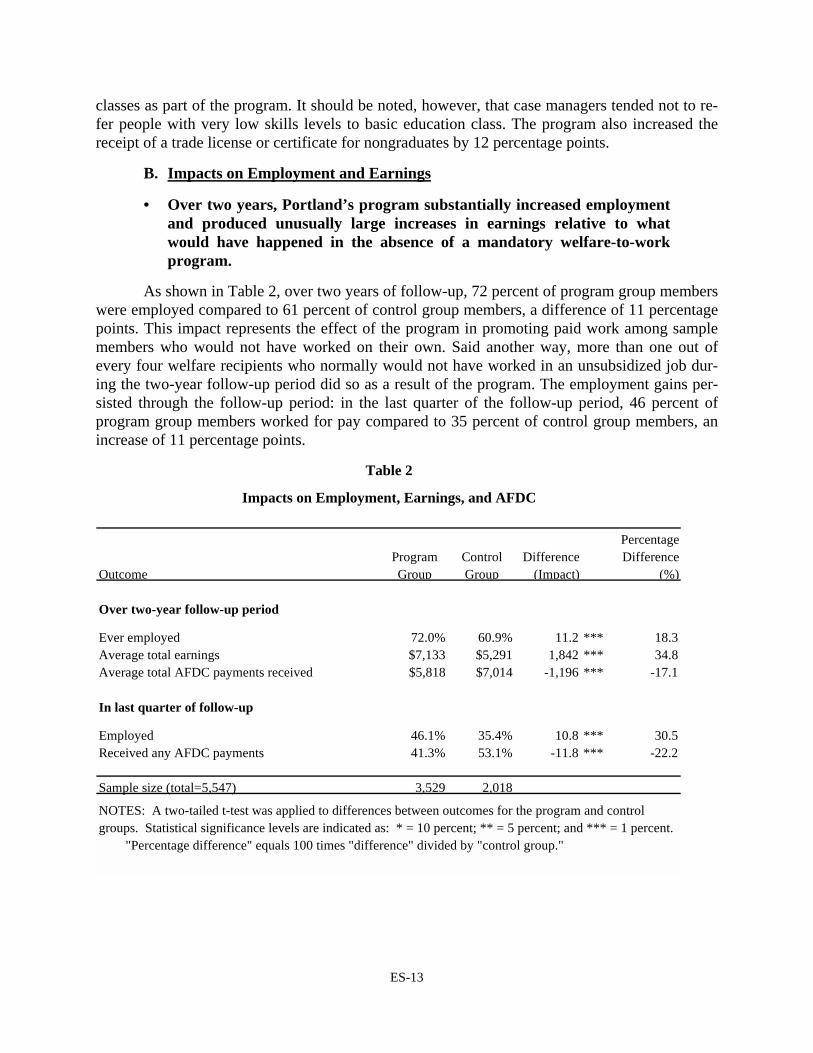
classes as part of the program. It should be noted, however, that case managers tended not to re-fer people with very low skills levels to basic education class. The program also increased the receipt of a trade license or certificate for nongraduates by 12 percentage points.
B. Impacts on Employment and Earnings
• Over two years, Portland’s program substantially increased employment and produced unusually large increases in earnings relative to what would have happened in the absence of a mandatory welfare-to-work program.
As shown in Table 2, over two years of follow-up, 72 percent of program group members were employed compared to 61 percent of control group members, a difference of 11 percentage points. This impact represents the effect of the program in promoting paid work among sample members who would not have worked on their own. Said another way, more than one out of every four welfare recipients who normally would not have worked in an unsubsidized job dur-ing the two-year follow-up period did so as a result of the program. The employment gains per-sisted through the follow-up period: in the last quarter of the follow-up period, 46 percent of program group members worked for pay compared to 35 percent of control group members, an increase of 11 percentage points.
Table 2
Impacts on Employment, Earnings, and AFDC
OutcomeProgram Group
Control Group
Difference (Impact)
Percentage Difference
(%)
Over two-year follow-up period
Ever employed 72.0% 60.9% 11.2 *** 18.3Average total earnings $7,133 $5,291 1,842 *** 34.8Average total AFDC payments received $5,818 $7,014 -1,196 *** -17.1
In last quarter of follow-up
Employed 46.1% 35.4% 10.8 *** 30.5Received any AFDC payments 41.3% 53.1% -11.8 *** -22.2
Sample size (total=5,547) 3,529 2,018
NOTES: A two-tailed t-test was applied to differences between outcomes for the program and control groups. Statistical significance levels are indicated as: * = 10 percent; ** = 5 percent; and *** = 1 percent. "Percentage difference" equals 100 times "difference" divided by "control group."

ES-14
Program group members earned, on average, $7,133 over the two-year period, and con-trol group members earned $5,291. (These averages include those who did and did not work dur-ing the follow-up period.) This difference of $1,842, a 35 percent increase above the control group average, is the largest earnings impact measured among the programs studied as part of the NEWWS Evaluation (two-year impacts have been found in 8 of the other 10 programs and range from $367 to $1,276), and it approaches the magnitude of the largest earnings impact at-tained by a large-scale mandatory welfare-to-work initiative (the Riverside GAIN program of the late 1980s increased two-year earnings by $2,103, or 56 percent).
In Portland, just over one-half of the earnings impact resulted from job finding (increases in employment levels), about one-quarter came from increased employment duration (program group members finding jobs sooner and/or finding jobs that last longer than do control group members), and one-seventh resulted from increased earnings on the job (higher hourly wages, more hours of work per week, and/or more weeks of work in a quarter).6 In other words, better job quality (the combination of longer employment duration and higher earnings on the job) ac-counted for nearly 40 percent of the total impact on earnings. This result was relatively uncom-mon for welfare-to-work programs of the 1980s and has not been found for all employment-focused programs of the 1990s.
• The earnings gains began immediately after program entry and remained strong throughout the follow-up period.
The quarterly average earnings for the program and control groups are plotted in the up-per panel of Figure 2. The strong early impact is similar to that found for the three work first programs studied as part of the NEWWS Evaluation. However, in contrast to the work first pro-grams in Atlanta, Grand Rapids, and Riverside, the earnings gains in Portland did not diminish during the follow-up period (the impacts in the work first programs peaked between one and one and a half years after random assignment, and then grew smaller as increasing numbers of con-trol group members got jobs). In Portland, the quarterly impact increased throughout most of the two years. Program group members earned an average of $1,155 in quarter 9, $309 (37 percent) more than the control group.
• Program group members in Portland got better jobs, on average, than control group members: the program substantially increased full-time employment and average hourly pay and increased the proportion of people with employer-provided health insurance.
Survey results provide further evidence that the program increased job quality. At the end of two years, 40 percent of program group members were working at full-time jobs (providing at least 30 hours of work) compared to 27 percent of control group members, an increase of 13 per-centage points. Twenty-four percent of program group members had employer-provided health benefits at the end of two years compared to 14 percent of control group members, a 10 percent-age point increase. (These results include zeros for those not working at the end of two years.)
6The sum of the three contributions does not equal 100 percent because a small portion of the earnings impact is
attributable to interactions among the components.

ES-15
Figure 2
Average Quarterly Earnings and AFDC Payments for Program and Control Group Members
Ear
ning
s
$0
$200
$400
$600
$800
$1,000
$1,200
Q1 Q2 Q3 Q4 Q5 Q6 Q7 Q8 Q9Quarter
Program groupControl group
AFD
C P
aym
ents
$0
$200
$400
$600
$800
$1,000
$1,200
Q1 Q2 Q3 Q4 Q5 Q6 Q7 Q8 Q9Quarter
Program groupControl group
Portland’s program achieved these gains by helping more people find work, but also by helping program group members find jobs at higher pay and with more benefits than control group mem-bers found on their own initiative. Program group members employed at the end of two years averaged $7.34 per hour in wages, $0.86 above the average wage levels earned by employed control group members — the biggest gain of any program in the NEWWS Evaluation. Em-ployed program group members were also more likely to be working full time and receiving

ES-16
health benefits from their employers. These results suggest that the program’s emphasis on wait-ing for “good” jobs paid off.
C. Impacts on AFDC Receipt and Payments
• The program produced substantial decreases in AFDC receipt and pay-ments over the two-year follow-up period. AFDC savings occurred im-mediately after program entry and continued throughout the follow-up period.
As shown in Table 2, over the two-year follow-up period, the program group received $1,196 less in AFDC payments than the control group, a 17 percent reduction. This impact on AFDC is among the largest found in the 11 NEWWS Evaluation programs and is similar in magnitude to the decrease produced by the 1980s Riverside GAIN program ($1,399, or 14 per-cent). Portland’s AFDC reduction resulted almost exclusively from program group members re-ceiving AFDC for fewer months than control group members, as opposed to lower monthly grants for those on assistance.
As the lower panel of Figure 2 illustrates, the impact on AFDC payments remained large throughout the follow-up period. By the end of the follow-up period, only 41 percent of program group members were receiving welfare compared to 53 percent of control group members, a de-crease of 12 percentage points.
D. Impacts for Subgroups and Three-Year Impacts for an Early Cohort
• Portland’s program produced substantial impacts for a broad cross sec-tion of the caseload, both recipients with relatively few barriers to em-ployment and those typically considered very hard to place. Few programs have attained the level of consistency of impacts attained by the Portland program.
Table 3 shows cumulative two-year earnings and AFDC payment information for high school graduates and nongraduates, as well as the most disadvantaged sample members — as mentioned earlier, a subgroup of nongraduates who did not work for pay in the year prior to pro-gram entry and had received AFDC for more than two years prior to program entry. Earnings and AFDC payments for control group members reveal how each subgroup would have fared without the program intervention. Graduates in the control group had the highest average earn-ings and the lowest average AFDC payments, while the most disadvantaged control group mem-bers had the lowest earnings and highest AFDC payments. Portland’s program substantially increased earnings and decreased AFDC payments for all three groups, and in each case earnings gains were larger than AFDC losses.7
Earnings and AFDC impacts were produced for all three subgroups during the first year
7Analysis not presented in this report shows that substantial impacts were also found for subgroups with and
without young children (those with children age 2 or under, 3 to 5, and 6 or over).

ES-17
Table 3
Impacts on Earnings and AFDC for Subgroups
Sample Program Control DifferencePercentage Difference
Outcome and Subgroup Size Group Group (Impact) (%)
Cumulative earnings over two yearsHigh school diploma or GED 3,622 $8,403 $6,257 2,146 *** 34.3No high school diploma or GED 1,872 $4,591 $3,315 1,277 *** 38.5Most disadvantaged 897 $2,912 $1,796 1,116 *** 62.1
Cumulative AFDC payments over two yearsHigh school diploma or GED 3,622 $5,286 $6,656 -1,370 *** -20.6No high school diploma or GED 1,872 $6,844 $7,745 -900 *** -11.6Most disadvantaged 897 $8,181 $9,022 -842 *** -9.3
NOTES: A two-tailed t-test was applied to differences between outcomes for the program and control groups. Statistical significance levels are indicated as: * = 10 percent; ** = 5 percent; and *** = 1 percent. "Percentage difference" equals 100 times "difference" divided by "control group."
of follow-up and remained strong through the end of the second year (quarterly trends by sub-group are not illustrated here). However, impacts for graduates were most immediate, achieving statistical significance in the second quarter of follow-up. Impacts for nongraduates and the most disadvantaged first became statistically significant, in the third and fourth quarters, respectively. These differences likely reflect the fact that a higher proportion of graduates were first assigned to job search, which has been found to produce more immediate impacts than other activities. Also, it is typically easier for graduates than nongraduates to find jobs (especially “good” jobs).
• Impact results for an early cohort, for whom more follow-up is available, suggest that the strong employment, earnings, and AFDC impacts will persist and possibly grow during the third year of follow-up.
Three-year employment, earnings, and AFDC payment data are available for individuals who entered the program during the first year of random assignment. For this early cohort, the program group earned an average of $1,217 more than the control group in the second year of follow-up and $1,402 more in the third year; the early cohort program group received an average of $737 less in AFDC payments than the control group in the second year of follow-up and $756 less in the third year.
E. Impacts on Measured Income
• Measured over the two-year follow-up period, average combined income from earnings, AFDC, and Food Stamps was not substantially higher for program group members than for control group members. However, more positive results at the end of the follow-up period suggest that the program group may become financially better off in the future.
Over the two-year follow-up period, although earnings gains ($1,842) exceeded AFDC

ES-18
losses ($1,196) by $646, program group members also lost $456 in Food Stamp benefits. The average two-year combined income from earnings, AFDC, and Food Stamp benefits (calculated using administrative records) for program group members was $16,886 compared to a combined income for control group members of $16,696. The resulting net gain of $191 (a 1 percent in-crease) is not statistically significant.
In the second year of follow-up, the program moved a small portion of program group members out of poverty (measured using combined income, as defined above). Twenty-one per-cent of program group members had a combined income at or above the federal poverty level compared to 17 percent of control group members. However, the program also moved a small portion of program group members below 50 percent of the poverty level (33 percent of program group members had a combined income below 50 percent of the poverty level compared to 31 percent of control group members).
Program group/control group differences in combined income grew larger over time and first achieved statistical significance at the end of two years; in the last quarter of follow-up, pro-gram group members’ average combined income from earnings, AFDC, and Food Stamps totaled $2,051, $80 higher than the average combined income for control group members. The analysis also draws on client survey data that include a much wider range of sources for estimat-ing income, including regular or odd jobs, AFDC, Food Stamps, Supplemental Security Income, unemployment insurance, and child support (not including Earned Income Tax Credit [EITC] receipt or other tax credits available to low-income families in Oregon). These data show that average individual and household income in the last month of follow-up was higher for program group members than for control group members, although the increases are not statistically sig-nificant. Similar impacts were found when average EITC receipt and out-of-pocket child care payments were included to estimate total net individual and household income.
The increase in income measured at the end of the two years suggests that program group income may be higher than control group income in the third year of follow-up. Three-year find-ings for the early cohort offer additional evidence: for the early cohort, the impact on combined income from earnings, AFDC, and Food Stamps (calculated using administrative records) in the third year of follow-up ($369) surpassed that of the second year ($215 and not statistically sig-nificant).
F. Impacts on Total Health Insurance Coverage
• The program’s success in moving large numbers of people off welfare and into the labor market may have had an unintended negative consequence: although the program increased the proportion of people with employer-provided health insurance at the end of the two-year follow-up period, some people who left AFDC (and automatic Medicaid coverage) for work did not find alternative sources of health insurance. Overall, program group members and their children incurred a small, not statistically sig-nificant, reduction in health insurance coverage.
At random assignment, all program and control group members had health care coverage because they were receiving AFDC and thus were automatically covered under Medicaid. Two years after program entry, coverage rates had decreased as some people had left welfare and did

ES-19
not replace their Medicaid coverage with coverage from employers or other sources. At the end of the follow-up period, 81 percent of program group members and their children had health care coverage from some source compared to 86 percent of control group members and their children. This 5 percentage point difference is not statistically significant, but is just beyond the statistical significance benchmark applied to the other impacts in this report.
The decrease was generated by those who left AFDC (and automatic Medicaid coverage) for work. As mentioned above, the program increased the proportion of people with employer-provided health coverage, but some people in the program group moved into jobs that did not provide health insurance. Some received coverage from another source, such as Transitional Medicaid or the Oregon Health Plan (the statewide initiative that offers health care coverage for low-income families). However, some people found jobs that did not provide health insurance and did not obtain alternative coverage.
VI. Discussion and Implications of the Findings
A. Comparisons Between the Portland and Riverside GAIN Programs
• Portland’s program shared two key features with the successful GAIN program run in Riverside, California, in the late 1980s. Both were em-ployment-focused, mixed services programs; however, Portland empha-sized job quality, whereas Riverside encouraged participants to take any job.
The Riverside GAIN (Greater Avenues for Independence) program of the late 1980s pro-duced large employment and earnings gains and welfare reductions and is often considered the benchmark for other welfare-to-work programs. Portland’s two-year results are similar in magni-tude to those in Riverside; however, the people served and the local environments differed in a number of ways. A higher proportion of Portland’s sample had a high school diploma or GED at program entry and were white (and thus likely faced less racial discrimination in the labor mar-ket). Portland mandated participation for parents with children as young as age 1; 68 percent of the sample had children under age 6. Riverside mandated participation only for parents with children aged 6 or over. As mentioned earlier, Portland’s labor market was strong, with low and decreasing unemployment and steadily growing employment. Riverside’s employment growth was high, but unemployment rates were high and increased throughout the follow-up period.
Despite these differences, impacts were quite similar. Both programs substantially in-creased employment levels and produced the largest earnings gains ever found for mandatory welfare-to-work programs. The Portland program increased two-year earnings by $1,842, a 35 percent increase, and the Riverside GAIN program increased two-year earnings by $2,103, a 56 percent increase. Both programs had large impacts on AFDC payments as well: the Portland pro-gram reduced payments by 17 percent over two years ($1,196), and Riverside GAIN reduced payments by 14 percent ($1,399).8 In both programs, earnings gains, in dollars, were about one and a half times the amount of AFDC reductions. Both programs produced impacts for a wide
8Owing to inflation and differing costs-of-living, a dollar change had a different value in the two sites.

ES-20
range of subgroups, including the more disadvantaged members of the caseload.
The Portland and Riverside GAIN programs both communicated a strong and pervasive message that employment was the chief program goal. Both programs enforced this message through extensive use of job search activities and through the use of job developers to assist re-cipients in gaining access to job opportunities. Although job search was the most common activ-ity in both programs, many people participated in other activities, including basic education, and, in Portland, vocational training, work experience, and life skills training. Overall participation patterns were similar for the two programs. About three-fifths of the program group in each site ever participated in a program activity. Both programs substantially increased participation in job search and basic education (compared to the activity levels of control group members), and Portland’s program also increased participation in work experience. Only Portland increased the proportion of people who received a GED certificate or a trade license or certificate.
The programs communicated differing levels of job selectivity. As previously discussed, Portland staff encouraged participants to wait for “good” jobs. In sharp contrast, staff in the Riv-erside GAIN program consistently communicated that any job was worthwhile; they encouraged quick entry into the labor market and communicated that low-paying or part-time jobs should not be turned down. This difference was both reflected in and fostered by the ways each program used performance standards. Portland’s standards encouraged placing participants in jobs paying higher than minimum wage that were likely to last; in contrast, Riverside’s individual monthly job placement standards for case managers reflected and emphasized the importance of quickly placing people in any job.
These divergent messages likely contributed to the programs’ somewhat different com-position of the earnings impacts. Earnings impacts in both programs resulted from increases in the proportion of individuals employed and the number of quarters that individuals were em-ployed. Portland’s impacts, however, were also due to program group members earning more on the job than their control group counterparts. Survey results from the two programs corroborate this difference: according to client responses, if one considers only those who were working at the end of the follow-up period, Portland’s program substantially increased average hourly pay, but Riverside program group members earned slightly less per hour than their control group counterparts.
B. Factors Influencing Portland’s Impacts
Research has shown that a variety of program approaches can produce positive effects. While it is difficult to distinguish which of many program features and environmental factors may have fueled Portland’s unusual success, it is likely to be due to a combination of factors. Portland’s program may have worked particularly well in the specific environment in which it was implemented: Portland’s caseload was not as disadvantaged as some of the populations in the other six NEWWS Evaluation sites, and the labor market in the Portland area during the fol-low-up period was strong, allowing people to find and obtain “good” jobs. Furthermore, Oregon has a history of progressive social legislation, including generously funded welfare programs and a state minimum wage that is higher than the federal standard. Although this study cannot prove the causality of any program feature or set of features, the report suggests a number of influential factors.

ES-21
• Three key features of the Portland program have previously been found to be associated with successful welfare-to-work programs: a strong em-ployment focus, a mixed services strategy, and close monitoring of par-ticipation in mandated activities.
Portland’s strong employment message and extensive use of job search, coupled with a willingness to impose sanctions for program noncompliance, affected how much and how seri-ously people looked for a job. Portland also offered strong job development and placement ser-vices, which provided a direct link to employers and job openings not otherwise available or apparent. Although, in previous studies, increasing participation in job search alone has not been found to be consistently related to large impacts, this combination of message, willingness to impose sanctions, and program services (similar to the combination in Riverside GAIN) proba-bly increased participants’ incentive and opportunity to get a job, and thus increased job finding.
Programs employing a mixed services strategy upon program entry (again, such as River-side GAIN) also have been found to be more effective than programs that offer only job search or programs that rely mainly on long-term skills-building education and training services; the findings for Portland corroborate this. The non-job search services, designed to improve employ-ability, were targeted, and participants were not allowed to “languish” in activities, but were en-couraged to complete activities and then look for work.
Staff closely monitored people in program activities and followed up quickly when atten-dance problems arose. Staff communicated the importance of participating in activities, empha-sizing the potential benefits for recipients and their families. When people did not eventually comply with program requirements, staff imposed financial sanctions. (However, the sanction rate in Portland was substantially lower than the rate in some other programs.)
• Other important aspects of the Portland program included a strong part-nership with community agencies, high-quality services, and an inte-grated case management structure; the program also increased receipt of GEDs and trade certificates. Less is currently known, however, about the link between these factors and welfare-to-work program impacts.
As discussed earlier, Portland’s program was designed and implemented through a strong partnership between the welfare agency and various contractor service agencies. Typically, wel-fare departments that contract out various portions of their welfare-to-work programs do so after the program model is chosen and planned; the contractors simply implement the program as the welfare department envisioned. Portland’s arrangement allowed the contractors to participate in defining the program from the ground up, which fostered a sense of “ownership” and a strong commitment to the program in the contractor agencies.
Overall, Portland’s services were of high quality: the job club and job development and placement services were unusually well supported and creative; the basic education classes were more highly rated by participants than classes in the other programs in the NEWWS Evaluation; and staff had relatively more experience in employment-related positions.
It is possible that combining the income maintenance and the employment and training aspects of welfare recipients’ cases yields some positive results. Compared to traditional case
ES-22
management, which requires people to interact with two separate workers, integrated case man-agement may allow staff to work sooner with recipients on employment preparation and mini-mize communication breakdowns between different groups of staff. Integrated case management has also been hypothesized to help change the “eligibility-compliance culture” of the average welfare office to a “self-sufficiency culture” that focuses more on moving people into the labor market and off welfare than on validating individuals’ credentials to remain on welfare.9 In Port-land, once people were active in the program, all of their interactions were with staff who dealt with employment and training issues (integrated case managers, supplementary case managers at the community colleges, and activity instructors). Various indicators suggest that most of these staff communicated a self-sufficiency message to clients. Furthermore, in surveys, an over-whelming majority of Portland staff (more than in the other 10 NEWWS Evaluation programs) expressed confidence that the program could help people become self-supporting.10
For those entering the program without a high school diploma or GED, Portland’s pro-gram increased the receipt of a GED certificate and a trade certificate or license. Although no consistent relationship has been found between acquisition of a GED or trade certificate and im-pacts, some research suggests that it may contribute to a program’s success.
C. Issues of Particular Relevance in the Current Welfare Environment
• Portland’s program offered supports for those participating in activities and those working, including parents with young children. The extensive use of child care benefits resulted in a substantial cost, but also may have enabled parents to move from welfare to work.
States must engage a large portion of the caseload in work or work-related activities to meet the 1996 welfare law’s increased participation-level targets and must reduce the number of people who return to the welfare rolls and eventually reach a time limit. Thus, the 1996 law in-creases the importance of providing adequate supports, including child care benefits, both for those participating in program services and for those working. The Portland program provided child care benefits for a large portion of the caseload, including parents of younger children. Al-though the resulting average child care costs were quite high, it is possible that the support en-abled some program group members to participate, and to accept and keep jobs, who would not have been able to do so otherwise.
• Given the 1996 welfare law’s focus on increasing work and promoting self-sufficiency, it is notable that the Portland program both produced immediate impacts on employment and earnings and increased full-time employment and hourly wages.
9Mary Jo Bane and David T. Ellwood, Welfare Realities: From Rhetoric to Reform (Cambridge: Harvard Uni-
versity Press, 1994). 10Two-year results from Columbus — the site in the NEWWS Evaluation that tested integrated and traditional
case management side by side — indicate that recipients with integrated case managers had significantly higher rates of participation in program activities and significantly lower welfare payments than recipients with traditional case managers. However, there was no difference between the two groups’ employment rates and earnings. See Thomas Brock and Kristen Harknett, Welfare-to-Work Case Management: A Comparison of Two Models (New York: MDRC, 1998).
ES-23
Typically, programs that produce immediate increases in employment do so by causing some welfare recipients to find jobs faster than they otherwise would have, but participants usu-ally find the same kinds of low-wage jobs as control group members. Portland succeeded in moving many recipients quickly into jobs, as well as changing the types of jobs that they had at the end of the two-year follow-up period. This may be a result of Portland’s simultaneous focus on moving people into the labor market and encouraging them to find “good” jobs (in the context of a strong labor market). Portland’s approach may serve as a model of how to rethink an em-ployment-focused model in the context of a strong labor market.
• While Portland’s program was very successful in reducing joblessness and decreasing the proportion of people on AFDC, many people were re-ceiving AFDC benefits and not employed at the end of two years.
The 1996 welfare reform law includes an expectation that all TANF recipients work after receiving two years of federal assistance. Also, some states have imposed two-year time limits on TANF receipt. Although Portland did not impose a work requirement or time limits during the period studied, the program findings can shed some light on how an employment-focused, mixed services program might fare in the short term.
Portland’s substantial impacts remained at the end of the two-year follow-up period: 46 percent of the program group worked for pay in the last quarter of follow-up compared to 35 percent of the control group, an 11 percentage point increase. Similarly, 33 percent of the pro-gram group worked for pay and did not receive any AFDC payments in the last quarter com-pared to 24 percent of the control group, a 9 percentage point increase.
However, despite the positive effects of the program, about two-fifths of program group members were receiving AFDC at the end of the two-year period; moreover, about one-quarter were both receiving AFDC benefits and not working. Although these proportions are lower than in many previously studied programs, these results offer a caution as states strive to achieve very rapid self-sufficiency for virtually all welfare recipients.
• Like the work first and skills-building programs studied as part of the NEWWS Evaluation, Portland probably would have failed to meet the participation rates called for in the 1996 welfare law, even though the program achieved many of the law’s aims: it engaged many people in employment-related activities or imposed financial sanctions on them, in-creased the number of people who worked during the follow-up period, and decreased welfare expenditures.
The 1996 law specifies that eventually at least one-half of all recipients of federal welfare benefits must be participating intensively (20 to 30 hours per week) in subsidized or unsubsi-dized work or in employment-related activities. Although Portland’s program was not operated under the new law’s rules or designed to meet its standards, the extent to which Portland im-posed a welfare obligation on sample members can highlight the challenges of these participa-tion standards.
Sample members in Portland were “covered” by the program — participating in an activ-ity (for at least one hour, but usually much more), employed, or sanctioned for nonparticipation
ES-24
— in 38 percent of the follow-up months in which they were receiving AFDC and subject to a participation requirement. In contrast to the standards in the 1996 law, this calculation consid-ers only those who were “mandatory” for program participation, not all AFDC recipients. Furthermore, it does not take into account the number of hours each week in which people were participating or employed, but simply counts people as fulfilling a welfare obligation if they were participating or employed at all, or sanctioned, at any point in a month.
“Coverage” rates in Atlanta, Grand Rapids, and Riverside were similar to or higher than the rate in Portland. However, extensive analysis of participation in these three sites showed that monthly participation rates calculated similarly to those contained in the 1996 welfare law proba-bly would have been quite low.11 This suggests that monthly participation rates would also have been quite low in Portland by the new federal standard.
VII. Future Research
This report contains valuable information on an unusually effective welfare-to-work pro-gram. Additional follow-up and information will offer a more complete picture of Portland’s ef-fects. Future documents — as part of the full, seven-site evaluation — will provide up to five years of follow-up on the Portland sample members, analyze the program’s impacts on a wider array of outcomes and for more subgroups, examine the extent to which the program had “spill-over” effects on sample members’ children, and compare the program’s five-year costs with the five-year benefits.
11Many AFDC recipients in the three sites did not participate or work for 20 hours in every week of a month for
a variety of reasons. For example, they were waiting for an activity to begin, were having child care or transporta-tion problems, or were sick or had a sick family member. In some instances, staff had temporarily “lost track” of them.

-1-
Chapter 1
Introduction
Few domestic issues have generated as much attention over the past few years as welfare reform. Persistent dissatisfaction with the Aid to Families with Dependent Children (AFDC) program — the nation’s principal safety net for poor families — spurred the enactment in August 1996 of the Personal Responsibility and Work Opportunity Reconciliation Act.1 Among its pro-visions, the law replaced AFDC with a block grant program, Temporary Assistance for Needy Families (TANF), limited families to five years of federal TANF assistance, and created finan-cial incentives for states to run mandatory, work-focused welfare-to-work programs.
Yet debate over welfare and its reform was not new. In 1988, Congress passed the Family Support Act (FSA), which marked a major shift in the philosophy of welfare by establishing a system of mutual obligation within the AFDC entitlement structure. Under this system, govern-ment was to provide education, employment, and support services to AFDC recipients who were, in turn, required to participate in the Job Opportunities and Basic Skills Training (JOBS) pro-gram created by the act to equip them for work. Although the overarching goal of both laws is similar — to foster the self-sufficiency of recipients through increased employment and de-creased welfare receipt — the FSA differs from the 1996 legislation in important ways. For ex-ample, under the FSA assistance was not time-limited. The FSA encouraged the use of education and training, whereas the new law promotes activities such as job search and work experience. The 1996 law institutes much higher levels of participation in work activities and expands the proportion of recipients who are expected to participate, and states’ TANF plans must include how the state will require recipients to work after two years of assistance.
As states and localities transform their welfare-to-work programs in response to the 1996 legislation, the need to learn about programs that have moved many people into work and off welfare increases. The two-year findings presented in this report show the Portland JOBS pro-gram run from 1993 to mid 1996 to be among the most successful mandatory welfare-to-work programs studied, producing large increases in employment and earnings and equally large re-ductions in welfare receipt for a broad cross section of the welfare caseload. The positive effects remained very strong at the end of the two-year period studied, and preliminary data suggest they will continue into the third year.
This report is the latest from an evaluation of welfare-to-work programs in seven sites called the National Evaluation of Welfare-to-Work Strategies (the NEWWS Evaluation, for-merly called the National JOBS Evaluation), conducted by the Manpower Demonstration Re-search Corporation (MDRC) under contract to the U.S. Department of Health and Human Services, with support from the U.S. Department of Education. The report examines the manda-tory welfare-to-work program run in Portland, Oregon (Multnomah and Washington counties). Through the program, Portland provided job search, education, training, work experience, and support services to a broad cross section of the AFDC caseload, including parents with children
1Pub. L. No. 104-193.

-2-
as young as age 1, who were, in turn, required to participate in program activities or face reduc-tions in their welfare grants. (The program that Portland is running under the new welfare law shares some key features with the program studied in this report.)2 The primary goals of the evaluation in Portland are to describe the types of services and messages that JOBS enrollees received and, using a random assignment research design, to estimate the effects of that treat-ment on subsequent labor market participation and welfare receipt.
I. Research Design, Research Questions, and Data Sources
A. Research Design
To produce reliable estimates of the effectiveness of Portland’s JOBS program, the evaluation used a random assignment experimental design. This involved assigning approved AFDC applicants and recipients, through a completely random process, to one of two groups: a program group, eligible for JOBS services and subject to program participation requirements, or a control group, not eligible for JOBS services and not subject to participation requirements. The random process ensures that any differences in various outcomes between the two research groups that emerge during the follow-up period can be confidently attributed to the JOBS pro-gram rather than to differences in the characteristics of people in the groups. These differences in outcomes are known as impacts.
The random assignment process in Portland began in February 1993 and ended in De-cember 1994. Only individuals aged 21 or over were eligible for random assignment.3 The steps leading to random assignment are depicted in Figure 1.1. Separate paths into the JOBS program are depicted for applicants and recipients. New AFDC applicants met with an income mainte-
2In July 1996, through waivers of the FSA, Oregon instituted some changes in its JOBS program. The 1996
federal law allows states to continue any JOBS waiver plans in effect on the day the act became law and remain exempt from any provisions of the act inconsistent with that waiver until the end of the waiver period. Electing this option, Oregon will continue its JOBS program as reformed in July 1996. (Oregon’s waiver plan was approved un-der the FSA to continue until 2003.) See Chapter 2 for details about Portland’s program run from 1993 through mid 1996 and some information on the program changes implemented in July 1996. While most of the data for this re-port cover early 1993 through mid 1996, the report includes impact data through the end of 1996 for some sample members.
3Portland operated a separate program for teens. Other individuals not eligible for random assignment in Port-land included sample members in an evaluation of New Chance, another program; people with limited English lan-guage skills (Portland ran a program for non-English speakers); people in the Homeless Families Project, a special program with intensive case management; and people who had participated in an approved JOBS activity in the past 60 days. Heads of both single-parent and two-parent AFDC cases were randomly assigned, but only the single par-ents are discussed in this report. The two-parent sample members will be analyzed in a future document.
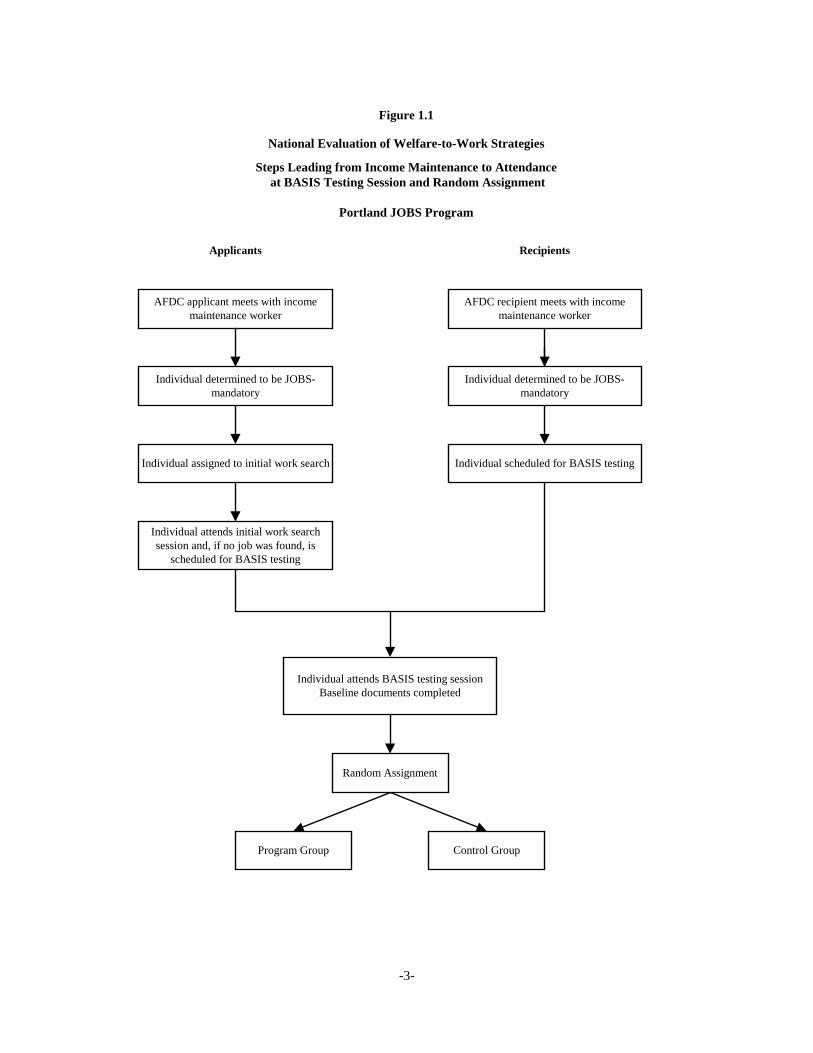
-3-
National Evaluation of Welfare-to-Work Strategies
Steps Leading from Income Maintenance to Attendance at BASIS Testing Session and Random Assignment
Portland JOBS Program
Figure 1.1
Applicants Recipients
AFDC applicant meets with incomemaintenance worker
Individual determined to be JOBS-mandatory
Individual assigned to initial work search
Individual attends initial work searchsession and, if no job was found, is
scheduled for BASIS testing
Individual attends BASIS testing sessionBaseline documents completed
Individual scheduled for BASIS testing
AFDC recipient meets with incomemaintenance worker
Individual determined to be JOBS-mandatory
Program Group Control Group
Random Assignment

-4-
nance (IM) worker at the welfare office. Those determined to be JOBS-mandatory4 were re-quired to immediately begin initial work search (IWS), an independent job search activity that typically lasted three to four weeks. IWS participants were required to attend check-in sessions with staff (see Chapter 2 for more detail). At the final session, those who had not yet found a job and had been approved to receive AFDC were scheduled for an Oregon Basic Adult Skills In-ventory System (BASIS) testing session. During the random assignment period, ongoing AFDC recipients were not subject to the IWS requirement.5 At their six-month AFDC eligibility rede-termination meeting, recipients met with an IM worker and, if determined to be JOBS-mandatory, were scheduled for a BASIS testing session.
On the day of BASIS testing, staff completed baseline paperwork for each individual, recording standard client characteristics such as educational background and AFDC history, and then clients completed the BASIS reading and math tests. During the testing session, staff phoned MDRC and each individual present was randomly assigned to either the program group or the control group.6 Those in the program group were mandated to participate in the JOBS pro-gram while those in the control group were not eligible to participate in the program and were not subject to any JOBS-related sanctions, but could participate in other services in the commu-nity. (Control group members could receive AFDC, Food Stamps, and Medicaid and were eligi-ble for support services, including child care assistance, if they enrolled in an activity on their own or became employed.) After completing the BASIS test, control group members received a “control debriefing,” during which they were notified that they were not being required to par-ticipate in JOBS and were given a list of local social service contacts. Program group members attended a group JOBS orientation where they heard about the purpose of the program, available JOBS services, and program requirements, and were scheduled to meet with a case manager, usually on a later day. At the one-on-one meeting, the client and her case manager discussed the client’s interests and skills and decided on a first activity assignment. (Chapter 2 explores this meeting in more depth.)
As in all welfare-to-work programs, many individuals who were referred to JOBS did not attend a JOBS orientation; some had found employment on their own or through IWS, others were not approved for or were no longer receiving AFDC, and still others chose not to attend. This attrition between AFDC application or redetermination and JOBS orientation, as well as the effects of the IWS mandate for applicants in Portland, will be examined in a future document.7 Also, interviews with Portland staff suggested that not all individuals who met the federal defini-tion of JOBS-mandatory were referred to the JOBS program, particularly in the early part of the study period. Staff had some discretion in determining who to refer to the program and evidence
4During the period covered in this report, Oregon mandated JOBS participation for any single-parent AFDC re-cipient whose youngest child was at least 1 year old and who did not meet certain federal exemption criteria. Ex-emption reasons included working 30 hours or more per week, having a disabling illness, being in at least the second trimester of pregnancy, or living in a remote area that made JOBS activities inaccessible. Exempt people could volunteer for the program, but they were not randomly assigned. AFDC applicants were not technically JOBS-mandatory until they began to receive AFDC.
5Portland broadened the IWS mandate to include recipients in late 1995 and early 1996. 6While the proportion of individuals randomly assigned to the program and control groups changed at several
points in the evaluation, overall, 64 percent of those randomly assigned became part of the program group. 7Some JOBS-mandatory individuals were randomly assigned at AFDC application or redetermination prior to
JOBS enrollment (orientation) as part of a special study of IWS and the possible deterrence effects of JOBS.

-5-
suggests they tended not to refer some of the “harder-to-serve” people (for example, people with serious personal or family problems or extremely low motivation levels). In any case, only indi-viduals who attended JOBS orientation are included in the sample for this report.
B. Research Questions
This report will address the following questions:
• Implementation: How did Portland execute its JOBS program? Specifically, what services and messages did welfare clients in Portland receive?
• Participation: Did the program succeed in engaging a substantial proportion of individuals in JOBS program services? What types of services did people receive? How long did people participate? How did participation levels in the JOBS program group compare with self-initiated participation levels in the control group?
• Cost: What were the costs of Portland’s JOBS program and what accounts for these costs? How do these costs compare with the costs of other services used by control group members? How do the costs compare with those from previ-ously studied programs?
• Impacts: Within the follow-up period, did Portland’s program, relative to the experiences of the control group, increase educational attainment, employ-ment, and earnings and reduce public assistance receipt? Did individuals’ measured income increase as a result of the program?
C. Data Sources
This report’s findings cover a two-year follow-up period. The data sources and sizes of the samples examined for each type of analysis in the report are described below.
Unemployment Insurance, AFDC, and Food Stamp Records Data. Employment, earnings, and public assistance impacts were computed using automated Oregon unemployment insurance (UI) records data and AFDC and Food Stamp administrative records. Two years of UI, AFDC, and Food Stamp records are available for all of the 5,547 single-parent sample members (3,529 program group members and 2,018 control group members). These 5,547 individuals, randomly assigned from February 1993 to December 1994, are considered the “full sample.” Three years of data are available for an early cohort assigned between February and December 1993, composing about 60 percent of the full sample.
Two-Year Client Survey. Some client opinions and participation rates examined in this report, as well as some income and job characteristic measures, are based on results compiled from a survey administered approximately two years after random assignment to a sample of program and control group members. The survey sample was randomly selected from individuals who were randomly assigned between March 1993 and February 1994. Survey respondents were interviewed about issues such as their participation in education and training activities, their per-ceptions about the JOBS program, and if they had received a GED or high school diploma in the

-6-
past two years. The responses of 610 sample members are included in this report. Eighty percent of fielded surveys were completed.
JOBS and Income Maintenance Case File Data. Findings on the patterns of participa-tion in program activities presented in Chapter 3 are based on information collected from the re-view of 185 program group members’ JOBS and income maintenance (IM) case files. These 185 individuals are a random subsample of the single-parent AFDC recipients who were randomly assigned between March 1993 and June 1994 and are demographically representative of the full sample. The majority of this case file sample responded to the Two-Year Client Survey.
In reviews of case files, MDRC staff recorded sample members’ enrollment in activities, length of stay in JOBS, changes in JOBS-mandatory status, sanctions, and deferrals over a two-year period. Case file documents consulted include standard program forms, case notes, and cor-respondence between the individuals, their case managers, and JOBS activity providers. Data collectors also consulted printouts from computer systems used by staff to record AFDC pay-ment information and JOBS participation information. Because individuals in the control group were not eligible for services through the JOBS program, no case file reviews were conducted for control group members.8
Cost Data. The cost analysis used data from state and local fiscal records, program par-ticipation records, supportive service payment records, Two-Year Client Survey responses, and case file participation records. Sample sizes vary by data source and, except for the case file data, include individuals assigned to both the program and control groups.
Field Research. MDRC staff observed the JOBS program and interviewed case manag-ers, service providers, program administrators, and enrollees in Portland. Information was col-lected about a range of issues, such as management philosophies and structure, the degree to which a participation mandate was enforced, the availability of services, the nature of interac-tions between staff and program participants, and the relationships among welfare department staff and outside service providers. Most of the field research was conducted in 1994. Informa-tion gathered in these visits is used throughout the report, but particularly in Chapter 2.
Staff Surveys. Integrated case managers, JOBS staff, income maintenance (IM) workers, and immediate supervisors were surveyed about their opinions of JOBS, experiences administer-ing the program, and attitudes toward their clients. These surveys were administered in Decem-ber 1993 and covered all 33 integrated case managers and supervisors, all 27 JOBS staff, and a subsample of 81 IM workers and supervisors. The completion rates were 88 percent for the inte-grated staff, 93 percent for the JOBS staff, and 100 percent for the IM staff. (See Chapter 2 for a discussion of these three types of staff.)
JOBS Enrollees’ Characteristics, Attitudes, and Opinions as of Random Assign-ment. Standard client characteristics data, such as educational background and AFDC history, were collected by welfare staff during routine interviews with individuals at the BASIS testing session, and are available for all individuals in the full sample. Scores on the Oregon BASIS
8Periodically, MDRC staff reviewed the case file records of randomly selected control group members. These reviews confirmed that few, if any, control group members received JOBS services while residing in the counties of random assignment.
-7-
reading and math tests are also available for 5,285 individuals, representing about 95 percent of the full sample. Data on attitudes and opinions about welfare-to-work programs and employment prospects were collected through a brief client-completed Private Opinion Survey (POS) admin-istered at the BASIS testing session, and are available for 5,230 individuals, representing a 94 percent response rate.9
II. Portland’s Evaluation Context
A. Interpreting the Results
To understand the magnitude of Portland’s accomplishments, this report makes a number of comparisons. The primary comparison — to show the net effects or impacts of the program — is between people in the program group and those in the control group. In addition, in order to assess the relative effectiveness of Portland’s approach, the report compares the nature and im-pact of the Portland program with the programs and results from other welfare-to-work programs studied as part of the NEWWS Evaluation.10 (See the accompanying text box for a brief descrip-tion of the programs in the evaluation.) Specifically, this report makes two types of explicit cross-program comparisons:
• Between Portland’s program and the three labor force attachment (LFA) and three human capital development (HCD) programs studied in At-lanta, Grand Rapids, and Riverside as part of the NEWWS Evaluation. Analyses similar to those reported here for Portland have been completed for these six programs; thus, rigorous comparisons can be made and Portland’s place on the LFA/HCD continuum can be estimated.
• Between Portland’s program and the other 10 programs in the NEWWS Evaluation (which include the three LFA and three HCD programs), on measures for which data have been collected for all programs. This places Portland in the context of a wide range of welfare-to-work programs.11
B. Program Environment
Portland, located in Multnomah County, is the largest metropolitan area in Oregon. The study area also includes neighboring Washington County and encompasses urban, suburban, and
9See Appendix C in Hamilton and Brock, 1994, for a copy of the POS instrument. 10The manner in which this report presents its findings draws heavily upon Hamilton et al., 1997. 11For two-year results for the LFA and HCD programs, see Hamilton et al., 1997. For a description of all 11
programs in the evaluation, see Hamilton and Brock, 1994. The two-year impacts for all 11 programs will be pre-sented in a forthcoming report..

-8-
The Other Programs in the National Evaluation of Welfare-to-Work Strategies
A key issue in welfare reform throughout the last decade has been how best to
move welfare recipients into the workforce, toward self-sufficiency, and out of pov-erty. One approach, commonly referred to as the “labor force attachment” (LFA) ap-proach, aims to get people to work quickly, even at low wages, by requiring and helping them to look for work, reflecting a view that welfare recipients can best build their work habits and skills in the workplace. A second approach, often called the “human capital development” (HCD) approach, emphasizes skills-building through education and training as a precursor to employment, based on the belief that an up-front investment in the skills levels of welfare recipients will allow them to obtain higher-paying and more secure jobs. The program run from 1993 to mid 1996 in Port-land can be considered to be a blend of strong LFA elements and moderate HCD ele-ments. Most programs across the nation have blended the two approaches, although in response to the 1996 welfare reform law most states are shifting toward an LFA ap-proach.
To determine the strengths and limitations of each approach, three of the seven
sites studied as part of the NEWWS Evaluation – Atlanta, Georgia; Grand Rapids, Michigan; and Riverside, California – simultaneously operated particular versions of these two different approaches: an LFA program and an HCD program. The goal of the LFA programs was rapid employment, and job search was the prescribed first ac-tivity for virtually the entire caseload. In contrast, most people in the HCD programs were first assigned to education or training; basic education was the most common ac-tivity because of the generally low educational attainment of the enrollees at program entry.
In addition to Portland’s program and the six programs discussed above, the
NEWWS Evaluation includes four other programs. In one site – Columbus, Ohio – different case management approaches were compared side by side. “Traditional” case management required clients to interact with two staff members: one worker who processed welfare benefits and another worker who enrolled people in employ-ment activities. “Integrated” case management required clients to interact with one worker for both welfare eligibility and employment services. The study in the other two sites – Detroit, Michigan, and Oklahoma City, Oklahoma – tested the net effects of the sites’ welfare-to-work programs (similar to the study in Portland). The Colum-bus, Detroit, and Oklahoma City programs primarily utilized an HCD approach. In to-tal, the 11 evaluation programs range from strongly LFA-focused to strongly HCD-focused and from somewhat voluntary to highly mandatory. The program sites offer diverse geographic locations, caseload demographics, labor markets, and AFDC grant levels. However, because of NEWWS Evaluation selection criteria, the programs were all “mature” welfare-to-work programs, relatively free of the transitional prob-lems associated with the start-up of a complex, multi-component program such as JOBS. These programs, while not representing all welfare-to-work programs in the nation, represent a wide range of welfare-to-work options.

-9-
some rural areas.12 Its major industries and occupational fields include computers and informa-tion technology, health and hospitals, lumber and paper products, and government. Table 1.1 shows some characteristics of the Portland area. The follow-up period for this report was charac-terized by population growth as well as a strong economy. The unemployment rate was rela-tively low and decreased throughout most of the follow-up period and employment grew by 9 percent. Oregon sets its minimum wage above the federal level; it remained at $4.75 from 1993 to 1996, $.50 over the federal level of $4.25.13
The AFDC caseload decreased throughout the follow-up period, from 11,961 to 10,097, a reduction of 16 percent. Despite this decline, the annual JOBS caseload increased by 12 percent from 1993 to 1996, reflecting Oregon’s push to involve an increasing proportion of its AFDC caseload in JOBS. Oregon’s AFDC grant level remained constant from 1993 through 1996; a family of three with no earned income received $460 a month, considerably higher than the 1993 national median grant level for a family of three of $367. Food Stamp benefit levels in Portland increased slightly over this period.
Under the Family Support Act, all states were required to disregard some income when calculating the AFDC grant: $30 and an additional one-third of earnings in the first four months of employment and $30 for the next eight months of employment. AFDC recipients in Oregon received this standard earnings disregard.
C. Sample Characteristics
As described in the previous section, immediately prior to random assignment case man-agers recorded some standard characteristics about individuals. All sample members included in this report were single-parent heads of AFDC cases when they were randomly assigned. As shown in Table 1.2, 93 percent were female and the average age was 30. The majority of the sample was white, minimizing the chances of racial discrimination in the labor market. When the sample was selected, Oregon required single parents with children as young as age 1 to partici-pate in JOBS. Consequently, 41 percent of the sample had a youngest child aged 2 or under, 28 percent had a youngest child aged 3 to 5, and 32 percent had a youngest child aged 6 or over. Sample members had an average of two children.
Seventy-seven percent of the sample had ever worked full-time for six months or more for one employer, a higher proportion than in the other six NEWWS Evaluation sites, and 39 percent had worked in the year prior to random assignment, about average for the sites.14 Only 34 percent did not have a high school diploma or GED certificate at random assignment com-pared to 39 to 45 percent in the other sites, but the average highest grade completed in school was similar across all the sites (about 11th grade). One-third of the sample in Portland had low scores
12Approximately four-fifths of the sample were randomly assigned in Multnomah County, and approximately
one-fifth were randomly assigned in Washington County. 13On October 1, 1996, the federal minimum wage increased to $4.75. 14The numbers discussed in this section refer to the full samples in each of the seven sites. Some measures in
earlier reports were calculated for partial samples, thus some numbers presented here may differ slightly from those previously presented (for example, in Hamilton and Brock, 1994, and Hamilton et al., 1997).

-10-
Table 1.1
National Evaluation of Welfare-to-Work Strategies
Characteristics of the Program Environment
Portland JOBS Program
Characteristic Portland
Population, 1990a 895,441
Population growth, 1990-1995 (%)b 9.9
AFDC caseloadc
1993 11,9611994 11,9811995 11,2311996 10,097
JOBS caseloadd
1993 2,3671994 2,2981995 2,4571996 2,630
AFDC grant level for a family of three ($)1993-1996 460
Food Stamp benefit level for a family of three ($)e
1993 2921994 2921995 3041996 304
Minimum wage ($)f
1993-1996 4.75
Unemployment rate (%)g
1993 6.61994 4.91995 4.11996 5.2
Employment growth, 1993-1996 (%)h 8.8SOURCES: U.S. Bureau of the Census; U.S. Department of Labor, Bureau of Labor Statistics; State of Oregon, Adult and Family Services Division; site contacts.
NOTES: aData are for Multnomah and Washington counties. bPopulation growth figures were calculated using data from the U.S. Bureau of the Census. cAFDC caseload figures are for single-parent cases. The caseload figures refer to a monthly average. Caseload figures are for the state fiscal year for Multnomah and Washington counties. dAnnual average monthly counts of total individuals who enrolled in JOBS activities as reported by Multnomah County. The average monthly counts for Washington County were 501 for 1993, 501 for 1994, 568 for 1995, and 571 for 1996. eFood Stamp benefits are based on maximum AFDC benefits shown. fOregon sets a minimum wage above the federal minimum wage, which was $4.25 until October 1, 1996, when it changed to $4.75. gUnemployment rates for Multnomah County are shown. Unemployment rates for Washington County were 5.3 percent in 1993, 3.7 percent in 1994, 3.1 percent in 1995, and 3.9 percent in 1996. Unemployment rates are not seasonally adjusted. hEmployment growth figures were calculated using data from the U.S. Department of Labor, Bureau of Labor Statistics. Growth for Multnomah County is shown. Washington County's growth for 1993-1996 is 14.2 percent.

-11-
Table 1.2
National Evaluation of Welfare-to-Work StrategiesSelected Characteristics of Sample Members
Portland JOBS Program
No HighHigh School SchoolDiploma or Diploma or
Characteristic Full Sample GED GED
Demographic characteristics
Sex (%)Male 6.8 7.4 5.7Female 93.2 92.6 94.3
Average age (years) 30.3 30.8 29.3
Ethnicity (%)White 69.6 70.2 68.6Black 20.2 20.3 19.8Hispanic 3.9 3.2 5.1Native American 2.9 2.7 3.3Other 3.5 3.6 3.3
Family status
Youngest child's age (%)2 years and under 40.5 39.0 43.53 to 5 27.7 27.6 27.86 and over 31.8 33.4 28.8
Average number of children 2.0 1.9 2.2
Labor force status
Ever worked full time for six months or morefor one employer (%) 77.0 82.5 66.5
Any earnings in past 12 months (%) 39.0 42.9 31.3
Education and basic skills levels
No high school diploma or GED (%) 34.1 0.0 100.0
Highest grade completed (average) 11.2 11.9 10.0
Scored below 215 on the BASISliteracy test (%) 3.6 2.1 6.5
Scored below 215 on the BASISmath test (%) 32.5 21.3 54.0
Public assistance status
Received AFDC for two years or more (cumulatively) prior to random assignment (%)a 62.4 59.4 68.1
Sample sizeb 5,547 3,622 1,872SOURCES: MDRC calculations from information routinely collected by welfare staff and from BASIS skills test data.NOTES: aThis refers to the total number of months accumulated from one or more spells on an individual's own or spouse's AFDC case. It does not include AFDC receipt under a parent's name. bFifty-three individuals in the full sample did not indicate whether they had a high school diploma or GED at random assignment. These individuals are excluded from the subgroup analysis.

-12-
on the BASIS math test (compared to 35 to 61 percent in the other sites).15 Sixty-two percent of the sample members had received AFDC, on their own or spouse’s case, for at least two years cumulatively during their adult life. The sample in Portland falls about in the middle of the range of extent of prior AFDC receipt among the evaluation sites. Overall, Portland’s sample is among the less disadvantaged samples in the NEWWS Evaluation.16
III. Contents of the Report
Chapter 2 describes how the JOBS program was implemented in Portland. Specifically, it examines various program practices and characteristics, including case management practices, relations between staff members, services provided and the messages communicated to clients, program participation monitoring, and program rule enforcement and sanctioning methods. It also discusses the perceptions of staff and clients about the effectiveness of the JOBS program.
Chapter 3 presents data on the proportion of eligible individuals who were assigned to and participated in program activities, their lengths of stay in the program, and the “paths” they took through the program. It examines the proportion of Portland’s JOBS-mandatory caseload “covered” by the program requirement and also explores the extent to which the program re-sulted in more employment-related activity among AFDC recipients than they would have initi-ated on their own (by comparing program group activity participation with the experiences of the control group).
Chapter 4 provides two-year cost estimates for Portland’s JOBS program, including esti-mates of the costs of various program components and support services provided to participants. It also examines how these costs were divided between the welfare department and other agen-cies. The costs of the program for program group members are compared to costs incurred for control group members. This information will be used later in the NEWWS Evaluation’s benefit-cost analysis to develop five-year net cost and net benefit estimates.
Chapter 5 presents impact findings. It discusses how the Portland JOBS program affected receipt of an education or training credential, employment, earnings, AFDC and Food Stamp re-ceipt, and total measured income, relative to what would have happened in the absence of the program. Two-year impact estimates are provided for the full sample and for a few key sub-groups: those with a high school diploma or GED at program entry; those without a high school diploma or GED; and those who were “most disadvantaged” at program entry, defined by AFDC, education, and employment history. This report also presents three-year impacts for the portion of the sample assigned to a research group in the first year of random assignment.
15According to the developer of the BASIS test, Comprehensive Adult Student Assessment System (CASAS),
scores below 215 on the math test indicate achievement levels that would make it difficult for individuals to obtain or keep jobs other than those that require only minimal achievement levels. The reading test administered in Port-land was different from, and not comparable to, the tests administered in the other NEWWS Evaluation sites.
16See Appendix Table A.1 for some additional selected characteristics of Portland’s sample. Also see Appendix Table A.2 for Portland clients’ responses to the Private Opinion Survey.

-13-
Chapter 2
Implementation of the Portland JOBS Program
The Family Support Act gave states significant flexibility in designing and implementing their JOBS programs. This chapter describes how the JOBS program was implemented in Port-land. It presents findings on a variety of dimensions that have been hypothesized to be relevant to program success or failure:1 program staffing structure; available activity components and support services; program messages; the level of attention, encouragement, and monitoring that clients receive; mandatoriness; staff training and job satisfaction; and staff and client views about the program.
The data for this chapter are primarily from the staff and client surveys, MDRC field re-search completed in 1994, and numerous subsequent site visits and discussions with staff. The staff and client survey data are presented in figures that place the findings for Portland in the context of findings from all of the programs in the National Evaluation of Welfare-to-Work Strategies. This illustrates how Portland fares on various program dimensions, compared with a wide range of other programs. (See text box in Chapter 1 for a discussion of the other programs.)
The chapter briefly discusses welfare-to-work policy in Oregon in the 1980s and 1990s. It then provides an overview and a detailed discussion of the implementation findings for Port-land’s JOBS program.
I. Overview of Welfare-to-Work Policy in Portland, 1980s and 1990s
One criterion for selection as a site in the NEWWS Evaluation was previous experience in running a welfare-to-work program. Portland had run both a Work Incentive (WIN) program focused on job search, throughout the 1980s, and a program that emphasized long-term educa-tion and training, implemented in 1988 as a demonstration in some welfare offices across the state, including a few in the Portland area. Following passage of the FSA, Oregon began its JOBS program in October 1990. Notable for its two-track strategy to serve a broad cross section of the mandatory caseload, the program targeted intensive education and training services on in-dividuals with the greatest skills deficits, while emphasizing job search and work experience for the most job-ready.
Although Oregon’s early JOBS program equally emphasized these two approaches, by 1993, when Portland entered this study, the program had become much more focused on quick entry into the labor market. A confluence of events led to this result: in the state’s 1990 election, Oregonians approved a ballot measure rolling back property taxes for five years. Two years later,
1Hamilton and Brock, 1994; Riccio et al., 1989; Bardach, 1993.

-14-
the state projected a $1 billion budget shortfall for the 1993-1995 biennium.2 Concurrently, Ore-gon’s AFDC caseload was growing and many state policymakers were becoming convinced that quickly moving recipients into jobs was more effective and efficient than providing long-term education and training to increase their self-sufficiency. Thus, in 1992, the legislature directed state welfare administrators to develop a plan to cope with the impending loss of dollars and to make the JOBS program more employment-focused; Portland administrators complied. (This will be more fully discussed in later sections of the chapter.)3
In July 1996, Oregon implemented further changes in its JOBS program through waivers of the FSA. Some key changes included extending the participation mandate to parents with children as young as 90 days old; expanding the range of activities that count as participation in JOBS to include human service activities, such as mental health counseling; and changing the ultimate penalty for failure to comply with program requirements to closure of a family’s AFDC case. The program continued to provide the wide array of employment-related activities dis-cussed in this report. Oregon is continuing this program under the 1996 welfare law.4
II. Overview of the Implementation of Portland’s Program
Portland’s program was run through a strong cooperative partnership between the welfare department and various local service providers. Most program services were provided by the community colleges and were of high quality. The welfare department employed “integrated” case managers who were responsible for both the welfare eligibility and the employment and training aspects of JOBS participants’ cases. The integrated case managers were supplemented by case managers employed by the community colleges, and average caseload sizes were at the low end of the 11 NEWWS Evaluation programs. Relations between the welfare department and the contractors were very good. Portland staff, as well as clients, strongly believed in the efficacy of the program.
The program was strongly employment-focused: staff communicated that the primary goal of the program was to help people move into jobs, and job search was the most common activity. The employment focus intensified throughout the follow-up period, with more individu-als over time assigned to job search upon program entry, and increasing monthly job placement standards. In contrast to many programs, participants were encouraged to look for and take
2The measure required the state to reimburse the school districts for any lost tax revenues and thus increased
competition for general funds. 3In 1993, Portland began a demonstration program, the JOBS Employment Retention Initiative (JERI), to test
the effects on job retention of providing case management and support services to newly employed clients. Mathe-matica Policy Research, Inc. is conducting an evaluation of the program. Some Portland NEWWS Evaluation pro-gram group members were included in the JERI study; MDRC analysis found that the sample members who were eligible for JERI services did not have significantly different two-year employment, earnings, or AFDC outcomes than those who were not. For information, see Haimson, Hershey, and Rangarajan, 1995; Haimson and Hershey, 1997.
4The 1996 law allows states to continue any waiver plans in effect on the day the act became law and remain exempt from any provisions of the law inconsistent with that waiver until the end of the waiver period.

-15-
“good” jobs — full-time jobs paying above the minimum wage, with benefits and potential for advancement.
Portland’s program utilized a more mixed services strategy than is typically implemented by strongly employment-focused programs. After attending a group JOBS orientation session, JOBS clients met with program staff to discuss their skills and a first program activity assign-ment. Those who were determined to be job-ready were usually first assigned to job search, and those who were not ready to enter the labor market were commonly assigned to a life skills train-ing class, usually a precursor to short-term education, training, or work experience. The purpose of non-job search activities was to improve the individual’s employability. Some individuals with barriers to participation or work were deferred by staff from program participation.
Portland staff emphasized to clients the importance of securing child care, both to facili-tate participation in JOBS and to allow clients to move to (and remain in) jobs. Staff in Portland monitored client progress rather closely. Most staff tried to encourage participation and compli-ance with program requirements using positive encouragement, emphasizing the potential benefit for the client and her family. If, after lengthy cajoling, clients did not eventually comply, staff then imposed financial sanctions. Compared to other welfare-to-work programs, Portland’s pro-gram can be considered strongly mandatory.
III. Organizational Structure of the Program
The State of Oregon required local welfare administrators to involve various local service providers (such as community colleges and local JTPA agencies)5 in both the planning and im-plementation of their JOBS programs, but gave them a high degree of autonomy. It gave each local welfare district general program guidelines to follow, along with a planning budget and a charge to devise its own program model. The state’s objective was to foster in local-level staff a feeling of “ownership” about the JOBS program rather than a sense that it was imposed on them from above.
Working within state parameters, the District 2 welfare offices (encompassing Mult-nomah and Washington counties), the two area community colleges, the local chambers of com-merce, JTPA agencies, and the Oregon Employment Department designed the District 2 JOBS program. Together, they evaluated the state guidelines and the needs of their clients and decided what the focus of the program would be, as well as which organizations could best provide vari-ous program services. When the state imposed budget cuts and mandated a stronger labor market focus, the partners worked together to decide how to allocate the more limited funds and how to change the program. All major budgeting and programming decisions were reached jointly. Field researchers concluded that this active partnership fostered in both the welfare department and the contractor agencies a strong commitment to the program as well as a sense of ownership and re-sponsibility.
5 Agencies developed under the Job Training Partnership Act of 1982.

-16-
The resulting program offered services across a variety of community agencies. The wel-fare department contracted out job search, education, training, work experience, and case man-agement to Mt. Hood Community College, which operated a program called Steps to Success. Mt. Hood further subcontracted with Portland Community College, which also operated a Steps to Success office, and with the local chambers of commerce and the Oregon Employment De-partment. Steps to Success provided job search services, life skills training, basic education, and vocational training; the chambers of commerce in Washington County and the Employment De-partment also provided job search services; and both the welfare department and Steps to Suc-cess provided case management services. The contractors and subcontractors provided JOBS services in-house and almost all JOBS activities were provided by these agencies.6 Many welfare departments contract out parts of their welfare-to-work programs; Portland was distinctive in that the contractors were full partners in the design and implementation of the program.
The value placed on fluid organization and decentralized decision-making was illustrated in other ways. The managers of the local branch offices were rotated from office to office. Each of the welfare branch offices and contractor offices was provided with a general program frame-work, but was given flexibility in areas such as designing activity components and organizing case management. For example, life skills training classes in one contractor office were not iden-tical to classes in another contractor office. Also, program management encouraged staff to con-tribute to and participate in decision-making. During a field interview, one case manager said:
We have very supportive management. We are included in everything. They ask us, “What do you think your program should be?”
Other staff mentioned instances in which case managers had contributed to the development of new activity components or had lobbied successfully to prevent unwanted changes to the pro-gram.
Reliance on nonhierarchical, decentralized decision-making and policy-implementing is unusual in a government and service area typically dominated by large bureaucracies. Field ob-servations and interviews reveal that this affected Portland’s program in at least two important, related ways. First, since the district and individual offices were given the freedom to experi-ment, some program practices varied from office to office and some changed over time, more so than in most welfare-to-work programs (key variations and changes will be noted in this chap-ter).7 Second, this opportunity to experiment and the resulting dynamic program, while some-times creating confusion, may have prevented staff complacency by encouraging them to actively evaluate the program and by frequently challenging them to learn new program compo-nents or practices.
6There are five welfare branch offices in Multnomah County (Albina, East Portland, North Portland, Northeast
Portland, and Southeast Portland) and two branch offices in Washington County (Beaverton and Hillsboro). Clients from Albina, North Portland, and Northeast Portland receive services at the Steps to Success North office; clients from East Portland and Southeast Portland go to Steps to Success East; and clients from the two Washington County branch offices are served at the Steps to Success West office and the Beaverton and Hillsboro chambers of commerce.
7The variations across offices were not large enough to suggest that clients received significantly different pro-gram treatments.

-17-
IV. Program Staffing Structure
A. Staff Descriptions and Duties
A client’s experience in Portland’s program was defined, in part, by interactions with program staff. Three main categories of staff interacted with clients: income maintenance (IM) workers and integrated case managers, both employed by the welfare department, and JOBS staff, employed by the contractor agencies.8 IM workers had a welfare eligibility function, inte-grated case managers had primary responsibility for all of the welfare eligibility and employment and training aspects of active JOBS clients’ cases, and JOBS staff supplemented the work of the integrated case managers.
1. Income Maintenance Workers. IM workers did not carry a JOBS caseload. Rather, they controlled entry into the program: they were responsible for identifying mandatory AFDC applicants and recipients and referring them to JOBS. Thus, they were usually the first to communicate to clients about JOBS, covering issues such as what services the program offered and what the mandatory participation requirement meant. IM workers also worked with clients who had stopped attending the JOBS program (because of a lengthy deferral or sanction or JOBS case closure).9
2. Integrated Case Managers. Once a client became active in the program, she was assigned to an integrated case manager, responsible for all of her welfare, support service, and employment and training needs.10 Integrated case managers monitored clients’ AFDC eligibility, authorized support services, made activity referrals, performed conciliation for those with atten-dance problems, and imposed financial sanctions for noncompliance with JOBS requirements. They were generalists who worked with clients at the beginning, middle, and end stages of par-ticipation, and who could assign clients to any type of activity.
In Multnomah County, some integrated case managers were “outstationed” at the com-munity college Steps to Success offices. Through most of the follow-up period, these case man-agers worked only with individuals in job search activities, while those in the education and training activities were managed from the welfare office. Some integrated case managers re-ported that being located on-site at the activity provider allowed for better tracking of client at-tendance and progress and facilitated contact with clients and JOBS staff.
3. JOBS Staff. JOBS staff were employed by the contractor agencies. Some per-formed case management duties and others had more specialized roles. Some JOBS participants were assigned to a “JOBS case manager,” employed by the community colleges, in addition to their primary welfare department integrated case manager. The JOBS case manager supple-
8To facilitate cross-program comparisons, the terms for staff used in this report differ from the terms used in
Portland. Activity instructors are not discussed. 9Reflecting the philosophy that all AFDC recipients should be engaged in some kind of self-sufficiency activity,
in 1995 and 1996 the welfare branch offices phased many IM workers into integrated case management. By the end of 1996, very few pure IM positions existed.
10Clients usually first met with their integrated case manager at a meeting following JOBS orientation. Occa-sionally, the meeting was conducted by an IM worker and a JOBS staff member, and clients were not assigned to an integrated case manager until after they were assigned to a first activity.
-18-
mented the work of the integrated case managers and the division of labor was flexible (duties sometimes overlapped). Often, the JOBS case manager conducted the JOBS group orientation session during which program group members received in-depth information about the program and participated in a meeting with the client following orientation, during which the client’s first program assignment was determined. JOBS case managers assisted clients with support services, discussed goals, tracked attendance and provided intervention for attendance problems, and helped decide what subsequent activities clients should attend. Sometimes JOBS case managers and integrated case managers met with clients in three-way meetings; other times, JOBS case managers met one-on-one with clients and passed on recommendations to the integrated case managers. However, all final decisions were made by the welfare department integrated case manager.
Some JOBS staff performed more specialized duties. For example, some provided guid-ance with job search efforts (“placement specialists”), some were job developers, and some worked to coordinate work experience positions for clients. At least one full-time staff member from the Oregon Employment Department worked at the contractor offices, connecting JOBS clients with Employment Department job listings.11
B. Staff Caseloads and Characteristics
Table 2.1 summarizes caseload (for staff doing case management) and characteristic in-formation for the three types of staff working with clients in Portland, based on staff survey re-sponses. As is typical in welfare-to-work programs, the average caseload of the IM workers was larger than the caseloads of the staff who perform education and training duties (190 for the IM workers compared with 95 for the integrated case managers and 89 for the JOBS staff). Caseloads were on the low side compared to caseloads in other programs in the NEWWS Evaluation.
Portland staff had more extensive prior experience as JTPA caseworkers and in other employment-related positions than staff in the other NEWWS Evaluation sites for which this analysis has been done. The majority of each of the three types of staff were white women, simi-lar to Portland’s caseload (see Table 1.2).
C. Partnership Between Welfare Department Staff and JOBS Staff
In Portland, there was a strong partnership between the welfare department staff (IM workers and integrated case managers) and JOBS staff. This may reflect, in part, the overarching organizational partnership between the welfare department and the contractor agencies.
In particular, the relationship between integrated case managers and JOBS staff was quite good. Evidence shows that this was facilitated by the outstationing of many integrated case man-agers at the contractor offices. The flexible division of labor between integrated case managers and JOBS staff required and probably fostered cooperation. In interviews, most staff discussed a
11By 1996, no JOBS staff acted as general full-time case managers; rather, all performed specialized duties.

-19-
Table 2.1
National Evaluation of Welfare-to-Work Strategies
Caseloads and Characteristics of Program Staff
Portland JOBS Program
Welfare Department Staff Contractor StaffIncome Maintenance Integrated JOBS
Characteristic Workers Case Managers Staff
Average caseload sizea 190 95 89
Average number of years employed with agency 12.3 12.1 3.8
Average number of years in current position 5.5 4.5 2.8
Percent with prior experience in an employment-related field 18.5 41.4 64.0 Percent with prior experience as a(n):
Caseworker in a WIN or other employment and training programb 17.7 35.7 12.5
JTPA caseworkerb 5.1 3.7 50.0Employment counselor, trainer,
or job developerb 14.1 32.1 63.6
Percent with prior experience asan income maintenance workerb n/a n/a 13.6
Highest degree/diploma earned (%)High school graduatec 12.8 17.2 0.0Some college 37.2 34.5 4.8Associate's degree 5.1 3.5 4.8Bachelor's degree or higher 44.9 44.8 90.5
Average age (years) 43.4 43.8 39.5
Gender (%)Male 24.1 25.0 20.0Female 76.0 75.0 80.0
Race/ethnicity (%)White 63.2 79.3 71.4Hispanic 10.5 6.9 4.8Black 14.5 3.5 14.3Native American/
Alaskan Native 1.3 3.5 0.0Asian/Pacific Islander 9.2 6.9 9.5Other 1.3 0.0 0.0
Sample size 81 29 25SOURCES: Income Maintenance, Integrated, and JOBS Staff Activities and Attitudes Surveys.
NOTES: Sample sizes for individual measures may vary because of missing values. N/a = not applicable. aIncludes only workers who reported that they had a regular caseload with at least one client. bMissing responses to these questions were recoded as negative responses (i.e., no experience). cIncludes some individuals who have earned a General Educational Development (GED) certificate.

-20-
sense of teamwork and partnership. One integrated case manager was especially positive when discussing the JOBS staff:
I’ve been tickled and dazzled by the expertise of the JOBS contractors. They are good about including me. I get the positive, too – I’m not just the “hit person.”
Another mentioned feeling philosophically “in sync” with the contractors, saying, “We all have clients’ best interests in mind.”
The relationship between IM workers and JOBS staff was a bit more strained. During field interviews, an IM supervisor said that not all IM workers were “on board” with the JOBS program and supportive of its goals. She thought many IM workers saw JOBS as a separate en-tity, unrelated to their work. However, field researchers concluded that the strain was less of a problem than it was in most other programs.
Figure 2.1 illustrates the responses of IM workers in Portland on various survey items regarding the relationship between IM and JOBS. This figure and the subsequent figures in the chapter use scales that group multiple survey items. (See Appendix B for details on how the scales were constructed.) Portland staff responses are compared with staff responses across the other 10 programs in the NEWWS Evaluation. For example, in the first measure on Figure 2.1, “LOW” indicates the program with the smallest percentage of IM staff who reported few prob-lems dealing with JOBS staff; “MED” indicates the program with the median or middle percent-age in the range; and “HIGH” indicates the program with the largest percentage of staff reporting few problems. (The values for each program on each scale are presented in Appendix Tables C.1, C.2, and C.3.)
As Figure 2.1 shows, of the IM workers in the NEWWS Evaluation programs, those in Portland were among the most knowledgeable about the JOBS program (what the program re-quirements were, what services were available, and what to say to clients about the program). A majority of IM workers in Portland reported receiving helpful training on JOBS — a far higher percentage than in most of the other programs. Portland IM workers also spent more time than those in most of the other programs discussing the JOBS program with clients. Considering that Portland IM workers dealt only with clients who were not active in JOBS, these results are quite remarkable.
V. Program Activity Components, Sequence, and Emphasis
Portland’s program emphasized employment as the primary goal of all program participa-tion, but utilized a mixed services strategy, offering job search, education and training, and work experience activities. Initial assignments were based on case managers’ evaluations of clients’ employability; the job-ready were first assigned to job search and others were assigned to a life skills training component. Over time, more individuals were initially assigned to job search, re-flecting a shift to a stronger “labor force attachment” approach and budgetary constraints limit-ing the amount of education and training the program could offer. Case managers deferred many JOBS orientation attendees from program participation because of “barriers”; many of these in-dividuals were never subsequently assigned to a program component.

-21-
Figure 2.1
National Evaluation of Welfare-to-Work Strategies
Relations Between Income Maintenance Workers and JOBS
Portland JOBS Program
Percent who report few problems dealing with JOBS staff
Percent who say they know a lot about JOBS
Percent who received helpful training on JOBS
Average number of minutes spent discussing JOBS with clientsa
Income Maintenance Workers
SOURCES: Income Maintenance and Integrated Staff Activities and Attitudes Survey.
NOTES: The low, median, and high figures above take into account all programs in the National Evaluation of Welfare-to-Work Strategies. aThis measure includes the responses of both Income Maintenance and Integrated staff.
0 5 10 15 20
LOW MEDPortland (8.8 minutes)
0% 20% 40% 60% 80% 100% 120%
LOW MEDPortland (58%)
0% 20% 40% 60% 80% 100% 120%
LOW MED HIGHPortland (73%)
0% 20% 40% 60% 80% 100%
LOW MED HIGH
Portland (68%)
LOW = lowest value; MED = median value; HIGH = highest value
HIGH
HIGH

-22-
A. Activity Sequence and Emphasis
As noted previously, JOBS-mandatory AFDC applicants were required to participate in an initial work search component (IWS), to be completed before entry into the JOBS program. Although this period prior to BASIS testing and JOBS orientation is not studied in this report (and is not reflected in any program group-control group differences), it is briefly discussed to illustrate the complete service sequence in Portland’s program. IWS typically consisted of three to four weeks of independent job search and a weekly group meeting at the welfare office with welfare department and/or contractor staff to review the clients’ efforts. IWS participants were encouraged to use the job search resource centers opened in the welfare offices between 1994 and 1996. The resource centers had job listings, phone books, phones, fax machines, and com-puters for job search activities, and contractor staff were available to assist clients. At the final IWS review meeting, applicants who had not found a job and had been approved to receive AFDC were referred to JOBS. IM workers were able to impose financial sanctions on those who did not comply with the IWS requirement.12 Between late 1995 and early 1996, the Portland wel-fare offices broadened the IWS mandate to include JOBS-mandatory recipients, who were as-signed to IWS at their AFDC redetermination meeting.13 Since the sample for this study entered the JOBS program in 1993 and 1994, only the applicants were subject to the IWS mandate prior to their entry into the evaluation.
Program group members attended a group JOBS orientation immediately following skills testing. At orientation, they received information about the JOBS program and were assigned to a meeting with program staff to be held on another day. During the one-on-one meeting, typi-cally lasting about one hour, the client and staff discussed the client’s skills, employment history, interests, and potential barriers to participation. Staff determined whether a client was enrolled in a self-initiated activity that could be approved or should be exempted or deferred from the program for any reason. Staff completed an Employment Development Plan (EDP) for each client, listing the first and sometimes subsequent activity assignments and information on any needed assistance with child care or transportation.
At the start of the study period, Portland’s program had two main service tracks — a “fast track” for those clients determined to be ready to look for work and an “enhanced track” for those not yet ready to enter the labor market, but close to it — and a “deferral track,” for those deemed not appropriate for either service track.
In the fast track, clients typically first attended job club, followed immediately by job search.14 Those without a job after job search could be assigned to further job search, work ex-perience, education, vocational training, or life skills training.
12The individual’s grant would open at a lower monthly level. 13The structure of IWS also changed in late 1995 and early 1996. A component similar to job club was added:
the first two weeks of IWS consisted of classroom activities, organized into “modules,” held at the welfare offices. Some welfare offices required clients to attend all of the modules, while other offices tailored the array of modules to the clients’ background. The second two weeks consisted of independent job search with weekly check-in ses-sions with program staff.
14In Washington County, job club was sometimes preceded by a two-week “pre-employment training and as-sessment” activity, similar in content to job club.

-23-
In the enhanced track, clients usually first attended a life skills training class, covering topics such as financial management, problem-solving, and job search strategies.15 Clients who completed the class were most commonly assigned to basic education classes. Others were as-signed to vocational training, work experience, or job club.16
Clients were not assigned to these tracks according to predetermined cutoffs of skills level or test scores. Case managers typically considered a variety of factors, including employ-ment history, educational status, and personal goals. Early in the study period, case managers were given a great deal of discretion in making assignments to tracks and activities. Over time, case managers had less discretion; more individuals were assigned to the fast track because of budgetary constraints, manifested as fewer education and training slots, as well as because of a shift in state and local philosophy toward quicker entry into the labor market. Case managers re-ported that by the summer of 1994, most individuals with any work history were first sent to job club. For those in education and training activities, shorter stays in activities were common. The welfare offices encouraged stays of six months or less; although case managers could approve training for up to 18 months, this was very unusual.17
Staff reported that early in the study period about one-quarter of those who attended a JOBS orientation were considered inappropriate for program activities — owing to barriers such as very low skills, lack of motivation, or serious family problems — and were deferred from pro-gram participation. The majority of these deferred individuals were never later referred to an ac-tivity (see Chapter 3). In many instances, case managers encouraged deferred clients to seek services outside the JOBS program. For example, most program group members with very low educational skills were given lists of remedial education providers in the community and were encouraged to enroll themselves (these activities were to be self-monitored and staff were unable to sanction individuals for noncompliance). Other clients, considered to have severe barriers to participation and employment, such as mental health or substance abuse problems, were deferred from the program and encouraged to get assistance from community agencies.18 Over time, re-flecting state and local interest in facilitating self-sufficiency for a broader part of the AFDC caseload, fewer individuals were officially deferred. (See Chapter 3 for additional discussion of program deferrals.)
15Later in the follow-up period, life skills training was used less commonly, with more individuals assigned di-
rectly to basic education or training. 16Between late 1994 and late 1995 a third service track was implemented. The “employability track,” designed
for individuals with skills too low to participate in the fast or enhanced tracks, began with a two- to three-month “skills brush-up” class, covering various life skills topics, career exploration, and remedial reading, usually fol-lowed by work experience or basic education. Portland staff reported that very few participants were placed in this track.
17Not all individuals followed one of these sequences exactly. In Portland, as in the other sites of the NEWWS Evaluation, clients were allowed to continue in approved activities they had already enrolled in on their own.
18Many nondeferred individuals were also referred by case managers to various human service activities. Case file data show that 13 percent of the program group was referred to a human service activity while mandatory for JOBS and not deferred from participation. The most common referrals were to mental health services and family counseling and to drug and alcohol treatment. In this report, attendance in human service activities is not counted as participation in the JOBS program.

-24-
B. Content of Program Activities
1. Job Club/Job Search. Classes took place at the Steps to Success offices and chambers of commerce and usually met 30 hours per week for two weeks. Class size was typi-cally about 20 students. Job club included a variety of activities, such as discussion of career goals, résumé preparation, and videotaped practice interviews, as well as discussion of and im-plementation of specific job search strategies. Portland’s job club was distinctive from other job clubs in the NEWWS Evaluation in that it heavily supported job development and placement ac-tivities, and often encouraged job club participants to look for “good” jobs.
Job development efforts in the Portland offices were more significant than those in most of the other programs observed in the NEWWS Evaluation. In Multnomah County there were a few full-time job developers, and in Washington County there was a full-time job developer in the early part of the follow-up period. Job developers used various methods to link participants to job opportunities, such as working closely with employers to discover unadvertised openings and sending them flyers “advertising” their linking service. One job developer reported routinely providing employers with five applicants within 24 hours of receiving notice of an opening. Some job developers also carried caseloads of clients they were actively working to place. Other staff worked to connect program group members with existing leads through the state Employ-ment Department.
Unlike most other welfare-to-work programs that focus on employment, Portland’s job clubs emphasized full-time jobs that paid more than minimum wage, included benefits, and of-fered room for advancement. Although some staff encouraged taking minimum wage jobs as a way to get a “foot in the door,” most did not. (See section VII of this chapter.)
In some of the contractor offices, job club participants used Contacts Influential to find jobs not publicly listed. This book contains the names and addresses, and names of the managers, of every major employer in the Portland area. Students recorded information on employers they might be interested in who were located near their home, and then contacted them.
Also, in at least some offices, job club instructors strongly emphasized women’s self-reliance and empowerment through work, as opposed to promoting a more general pro-employment philosophy or focusing on program requirements. Job clubs that MDRC researchers observed were exceptionally lively, with students remarkably engaged.
As previously mentioned, job club was almost always followed by job search, typically lasting no more than six weeks, during which clients looked for work both independently and using resource rooms at the contractor offices. MDRC staff observed that the rooms were gener-ally better equipped than similar facilities in other sites with job listings, phones, computers, fax machines, typing and word processing tutorials, and clerical staff to help with résumé changes. Job listings were in the form of classified ads and job lists created by job developers, the Oregon Employment Services, and the local Private Industry Council. Usually clients attended meetings once a week or more with contractor staff and other clients to discuss their job search efforts. During this period clients were often required to make a certain number of employer contacts (usually 20 per week). In at least one contractor office, during job search clients could attend job networking classes, organized by occupational group (for example, on one day in 1994 classes

-25-
were held for those interested in trades and industrial areas, clerical and sales positions, and pro-fessional and management positions).
2. Individual Job Search. Sometimes clients were assigned to look for a job on their own, usually after completing the job club/job search component without finding a job. Clients could use the resource rooms at the Steps to Success offices and were sometimes assigned to a staff member who met with them periodically to monitor and assist in their search. Some clients were told to make a certain number of employer contacts per week, while others were given less specific guidelines.
3. Life Skills Training. This four- to five-week class commonly involved examina-tion of clients’ work history, skills, and vocational interests and covered topics such as financial management, problem-solving, identification and resolution of personal and employment barri-ers, job search strategies, and options for education and training. Although this activity was the common precursor to basic education, the life skills training classes were framed as a way to prepare people for work and eventual self-sufficiency.
4. Basic Education. Basic education was provided primarily to those who did not have a high school diploma or GED. Almost all basic education was provided by the Steps to Success program and most JOBS clients attended JOBS-only classes (some classes in Washing-ton County also served JTPA clients).19 Portland clients reported the highest level of satisfaction with their basic education classes among all clients in the NEWWS Evaluation.20
• General Educational Development (GED): These classes prepare students who do not have a high school diploma to take the GED test in social studies, literature, science, mathematics, and writing. Individuals who pass the test re-ceive a state high school equivalency certificate. Students entering GED pro-grams usually must have language and mathematics skills at 9th grade level or above in order to use the instructional materials. Early in the study period, GED classes were typically about three months long. In 1994, partly in re-sponse to funding issues, but also reflecting a philosophy that stays in activi-ties should be rather short, a six-week GED class was introduced. Classes typically utilized a lot of individualized instruction.
• Adult Basic Education (ABE): These classes provide reading and mathematics instruction to individuals whose achievement levels are lower than is required for high school completion or GED classes, typically at 8th grade level or be-
19Portland also offered two basic education activities that were utilized by very few sample members. High
school completion classes replicate a high school curriculum in an adult school setting. English as a Second Language (ESL) classes provide individuals who are not fluent English speakers with instruction in how to speak, read, and write English.
20The Two-Year Client Survey posed a series of questions to individuals who had participated in ABE, GED. and ESL classes on their perceptions of the classes. Topics covered included whether the class was interesting and enjoyable; whether the teacher was well prepared and cared about the students; and how much students learned and whether they would recommend the class to a friend. On all measures, Portland ranked highest or among the highest of all the NEWWS Evaluation programs.

-26-
low. Portland provided ABE and GED instruction in combined classes.
5. Vocational Training. Some vocational training was provided by the Steps to Suc-cess program and some took place at the community colleges outside the Steps to Success pro-gram. Skills training was usually tied to a particular occupation and relatively short term. The Portland JOBS program also operated a program that trained women for traditionally male occu-pations such as blue-collar trades.
6. College. A small number of people were allowed to continue working toward their two- or four-year degree. In 1994, the program limited all education and training to 18 months, so only those who could complete their degree in that period would have been approved to con-tinue.
7. Work Experience. Work experience encompassed unpaid work in the nonprofit sector; unpaid work in the private, for-profit sector; on-the-job training in the private sector, usu-ally offering a wage subsidized by the client’s welfare grant; and paid work, usually in the form of college work-study positions. Some work experience positions led to unsubsidized employ-ment, although this was not required.
Portland offered unpaid work experience positions in the private, for-profit sector under the Alternative Work Experience provision of the federal JOBS legislation. Participation was purely voluntary — only those who agreed to participate were assigned and staff could not im-pose sanctions for noncompliance — and positions could not last more than three months. Staff reported custom-designing each slot to fit a client’s interests and skills level. Clients were placed in work experience positions in a wide variety of settings, including a large department store, medical offices, hospitals, construction firms, and a hotel. Staff preferred sending clients to these for-profit sites because of the likelihood of a higher wage if an individual was eventually hired in an unsubsidized position.21
VI. Child Care and Support Services
The JOBS legislation required states to guarantee child care to each participant with de-pendent children if child care was necessary for the client to attend a program activity or accept employment.22 States were also required to provide payment or reimbursement to clients for transportation and other work-related expenses or support services that may be needed for an in-dividual to participate in the JOBS program. Following federal guidelines, individuals receiving AFDC were eligible for Medicaid health coverage, and those leaving welfare for work were eligi-ble for one year of transitional Medicaid and child care support.
21Late in the follow-up period, offices began implementing another work experience component, called JOBS Plus, which placed clients in subsidized work positions with private or public organizations. Clients were paid the state minimum wage for their work and the slots were limited to six months. A very small proportion of the NEWWS Evaluation sample in Portland participated in JOBS Plus.
22In order to require attendance in JOBS activities, states had to offer day care assistance to clients who were the primary caretakers of children aged 12 or under and the primary caretakers of incapacitated children or adults.

-27-
A. Child Care
Portland staff strongly emphasized to clients the importance of arranging for child care and made clear that lacking child care was not an acceptable reason for not participating in program activities. Staff often encouraged clients to have a backup arrangement in case their primary child care provider fell through and reported that there was generally sufficient child care available in the community for those who needed it. The JOBS program paid for four major types of child care: care provided by nonimmediate relatives aged 16 or over; family day care, provided in a private residence for not more than 6 children; group home care, provided in a private residence for 7 to 12 children; or center-based care, provided in a nonresidential facility, typically for 13 children or more. In Oregon, both group home care and center-based care had to be certified by the state.
Child care needs were often discussed with JOBS case managers, but had to be authorized by the client’s integrated case manager at the welfare office. Clients were free to choose the type of provider and the specific provider. If a client required child care, but did not have a service pro-vider in mind, she was referred to the Metro Child Care Resource and Referral Agency. Agency staff further explained child care options and provided clients with a list of caregivers in the area (including certified child care centers and group homes, as well as family care). Forms indicating the care provided and the allowable reimbursement were completed by local welfare staff and sent to a central office in Salem; payments were sent retroactively from Salem directly to providers. The maximum allowable payment was based on the age of the child, the kind of care given, and the type of provider.23 Maximum allowable payments in Portland were higher than in Atlanta and Grand Rapids, but somewhat lower than in Riverside.24
Transitional child care was also strongly emphasized in Portland. Client survey data indi-cate that for those eligible for transitional child care (those leaving welfare for work), Portland’s program group was more likely to have been informed about this benefit than program group mem-bers in the other NEWWS Evaluation sites.25 In field interviews, Portland staff reported that almost everyone who was eligible for transitional support received it. Portland also offered Employment-Related Day Care (ERDC) to most of those who were not eligible for transitional care; ERDC benefits were similar to transitional benefits, but were not time-limited.
Moreover, the administrative system in Portland may have been better equipped to meet cli-ents’ needs for transitional care (and ERDC) than in most programs. An earlier report produced as part of the NEWWS Evaluation suggested that clients’ needs for transitional child care benefits may be addressed most consistently and thoroughly in programs where IM and JOBS functions are consolidated, as in Portland, because workers with a combined role are more likely to know the two facts that qualify an individual for transitional benefits: namely, that the client has received AFDC for at least three of the past six months and is leaving AFDC for employment. In addition, once
23In 1992, the maximum rate paid for care by a relative or in family day care or group home care was $2.00 an
hour or $371.00 a month per child. The maximum rate paid for a care in a child care center was $3.50 an hour or $450.00 a month per child. (These rates are for infants.)
24See Hamilton et al., 1997, for child care costs in the LFA and HCD programs in these sites. 25Forty-two percent of Portland program group members who were eligible for transitional child care were in-
formed about the benefits compared to 11 to 37 percent in the other programs.
-28-
sample members obtained a job, integrated case managers in Portland could authorize transitional (or ERDC) payments, whereas in other sites the client or another staff member would have been responsible for contacting a special child care worker or IM worker to authorize payments.26
B. Transportation Assistance and Ancillary Expenses
Portland provided transportation assistance to clients who were participating in JOBS activities primarily through daily and monthly bus passes. Individuals with cars could receive reimbursement for miles driven. Portland also paid for a variety of ancillary expenses, including school supplies, equipment and clothing needed for a specific job opportunity, and professional fees, such as union dues.27
C. Health Coverage
All AFDC recipients were eligible for Medicaid health coverage. Those who left welfare for work were eligible for one year of transitional Medicaid. In 1994, the state implemented the Medicaid Demonstration of the statewide health plan, the Oregon Health Plan (OHP). This plan offered coverage to individuals or families living below the federal poverty level, regardless of employment status, and to children under age 6 whose family income was below 133 percent of the federal poverty level.28 In Portland, those who left welfare for reasons other than work and those whose transitional Medicaid ran out were eligible for coverage under the OHP if their in-come was below the threshold. However, the shifts from regular to transitional Medicaid and from transitional Medicaid to OHP coverage were not automatic: the individual had to have knowledge of the available coverage, and both shifts entailed a registration process.
VII. Program Messages and LFA/HCD Orientation
The main purpose of welfare-to-work programs is to help move welfare recipients into the labor market and off welfare. As mentioned in Chapter 1, programs can employ two different approaches to work toward this goal: a labor force attachment (LFA) approach and a human capital development (HCD) approach. In practice, programs typically blend some aspects of each approach and fall somewhere on a continuum between the two extremes. Portland’s program can be considered to be a blend of strong LFA elements and moderate HCD elements.
As mentioned earlier in this chapter, when Portland was chosen as a site for the National Evaluation of Welfare-to-Work Strategies, its JOBS program was rather evenly balanced be-tween HCD and LFA approaches. By the start of random assignment in 1993, the program had already shifted more toward an LFA approach and continued to do so over the follow-up period. The stated purpose of participation in the program was moving clients toward self-sufficiency. The program mandated initial work search prior to JOBS orientation for applicants, and eventu-
26Hamilton and Brock, 1994. 27 Portland also offered a 90-day extension of JOBS transportation and ancillary support for those who became
employed for 30 hours or more per week. 28Food Stamp benefits are not included in the income calculation. Beginning in 1995, families with assets above
$5,000 were ineligible for coverage. The OHP also covered pregnant women whose incomes were below 133 per-cent of the federal poverty level (only the pregnant women and the unborn children were covered).
-29-
ally for recipients. By 1994 the majority of people entering the program were assigned to job search and stays in education and training were rather short. The number of individuals that the Portland area offices were supposed to place in jobs increased each year during the follow-up period: for example, they were supposed to place about 1,300 people in jobs in 1993 and 5,100 in 1996.29
However, Portland’s program never became a “pure” LFA program. While employment was the explicit goal of program participation, many integrated case managers and JOBS staff encouraged clients to wait for “good” jobs, and throughout the follow-up period many clients were assigned to education and training activities, especially those entering the program without a high school diploma or GED. (See Chapter 3 for details about program participation.)
Case managers communicated messages about employment during appraisal meetings and other periodic contacts with clients. To measure the nature and strength of these messages, MDRC surveyed the integrated case managers and JOBS staff in all the NEWWS Evaluation sites about the employment preparation strategy they preferred and the recommendations they gave to clients about JOBS activities and job opportunities. Staff responses for all the programs are illustrated in Figure 2.2.
A. Staff’s Preferences Regarding the LFA and HCD Approaches
The upper set of bar graphs in the figure shows the percentage of integrated case manag-ers and JOBS staff who leaned toward the LFA or HCD approach as the best way to move cli-ents off welfare and into employment. The responses are based on a multiple-item scale that asked staff to rate their general opinions and goals regarding employment preparation strategies – whether it was better, for example, for clients to work their way up from a low-paying job or to go to a school or a training program to prepare for a better-paying job – as well as their specific advice to clients with different types of backgrounds. Staff who said they usually recommended short-term JOBS activities and quick entry into the labor market were categorized as leaning toward LFA, whereas those who indicated that they normally recommended raising education and skills levels were grouped as leaning toward HCD. Staff who expressed no strong preference were not placed in either group.
In December 1993, when the survey was administered, twice as many staff in Portland leaned toward an HCD approach to self-sufficiency than leaned toward an LFA approach. How-ever, the percentage who leaned toward an HCD approach was lower in Portland than in most of the other NEWWS Evaluation programs (except for the two programs in Riverside, which are known for their very strong LFA focus). Also, Portland had the largest percentage of staff who did not express a preference for either approach (and thus are not included in either the LFA or HCD bar), indicating that they tended to strike a balance between the two in practice (43 percent compared to 8 to 29 percent in the other programs). By the summer of 1994, during field re-
29The program changes over time did not yield substantially different impacts: the two-year impacts on em-
ployment, earnings, and AFDC for those assigned early in the random assignment period are similar to the impacts for those assigned later in the period.

-30-
3%
0%
5%
83%
19%
5%
47%
30%
27%
0%
38%
88%
55%
43%
27%
9%
68%
66%
72%
88%
Percent who lean towardLabor Force Attachment
Percent who lean towardHuman Capital Development
ORIntegrated Case Managersand JOBS Staff
54%
100%
50%
82%
74%
96%
57%
34%
56%
45%
16%
25%
0%
4%
0%
2%
14%
32%
6%
24%
Percent who encourage clients to take any job
Percent who encourage clients to be selective in taking a jobOR
Atlanta HCD
Portland
Oklahoma
Detroit
Columbus TRD
Columbus INT
Riverside LFA
Riverside HCD
Grand Rapids
Atlanta LFA
Atlanta HCD
Portland
Oklahoma
Detroit
Columbus TRD
Columbus INT
Riverside LFA
Riverside HCD
Grand Rapids
Atlanta LFA
Figure 2.2
National Evaluation of Welfare-to-Work Strategies
Employment Preparation Strategy
Portland JOBS Program
(continued)

-31-
24%
32%
29%
43%
56%
46%
47%
39%
40%
29%
45%
Percent who feel pushed to take a job JOBS Clients
SOURCES: Integrated and JOBS Staff Activities and Attitudes Surveys; Two-Year Client Survey.
NOTE: Responses of integrated case managers and JOBS staff do not total to 100 percent because "neutral" responses are not shown.
Atlanta HCD
Portland
Oklahoma
Detroit
Columbus TRD
Columbus INT
Riverside LFA
Riverside HCD
Grand Rapids HCD
Atlanta LFA
Figure 2.2 (continued)
Grand Rapids LFA

-32-
search most staff said they agreed, in general, with the shift to quick job placement.
The JOBS staff tended to be more HCD-oriented than the welfare staff (numbers are not shown in the figure). Fifty-six percent of the JOBS staff leaned toward the HCD approach, and only 12 percent leaned toward the LFA approach. The welfare department integrated case man-agers were almost evenly split between the two approaches (25 percent leaned toward the LFA approach and 21 percent leaned toward the HCD approach), with over half (54 percent) indicat-ing a middle position. This is not surprising, given that most of the JOBS staff were employed by the community colleges. However, field research (as well as participation patterns and program impacts, discussed in Chapters 3 and 5) indicates that the JOBS staff were fully able to commu-nicate an employment message to clients.
B. Staff’s Views on Job Selectivity
Numerous observations and interviews during field research indicated that although the program emphasis was on quickly getting people into jobs, most Portland staff encouraged cli-ents to look for and accept full-time jobs paying above minimum wage, with benefits and poten-tial for advancement. A job club instructor expressed the predominant feeling:
If we were to push for “any” job, we could get them minimum wage, but that wouldn’t help them. On the other hand, we won’t get the perfect job; that’s not our purpose.
A GED instructor discussed a client who was ready to accept a job as a sales clerk:
On the one hand, I encouraged her. I said, “I’d really like to see you work. I bet you’ll be a supervisor some day!” At the same time, this client had so much more potential. I encouraged her to see her [case manager] to suggest additional [educa-tional] opportunities for the client.
A director at one of the contractor offices said that despite the push to move more clients to the labor market, the office refused to list fast food job openings and sought jobs with benefits. Some staff actually encouraged clients to turn down minimum wage or part-time job offers, while others simply emphasized that good jobs were the priority and let clients decide whether to accept specific employment offers.
During field research, some staff in Portland said they thought any job was a step in the right direction. One job club instructor said that although he did not encourage clients to aim for minimum wage jobs, they often offered a “foot in the door” toward something better and he would not discourage clients from taking such jobs. Some staff said that given the limited slots in education and training activities, they sometimes encouraged clients who needed skills to try to learn on the job rather than in school. They were not opposed to clients starting out on the bot-tom rung of a company, but only if upward mobility was possible.
The focus on “good” jobs was both reflected in and fostered by the performance stan-dards that were used to evaluate the welfare and contractor offices; the standards encouraged staff to promote higher-paying jobs, which were more likely to last. They included an average wage-of-placement, always much higher than the state minimum wage (for example, in 1994,

-33-
Oregon’s minimum wage was $4.75 and the average wage-of-placement target was $6.00), and AFDC “recidivism” (the percentage of individuals who were receiving AFDC 18 months after they left the rolls). (For more detail on the performance standards see section XI.)
As the lower set of bars in Figure 2.2 illustrates, the percentage of staff who encouraged clients to take any job was lower in Portland than in six of the other programs in the NEWWS Evaluation, and much lower than in the three LFA programs (only one value is reported for Grand Rapids because case managers served both LFA and HCD clients).30 Only three programs have higher percentages of staff who encouraged selectivity, and these three programs primarily utilized an HCD approach; that is, they emphasized skills-building with the goal of helping cli-ents to find better jobs.31 The percentage of case managers in Portland who did not report consis-tently either encouraging clients to take any job or to be selective was rather large (30 percent).
Close to half of Portland’s JOBS clients felt pushed to take a job before they were ready; this is at the high end of the range. The client survey was administered at the end of each client’s two-year follow-up period, but the staff survey was completed in December 1993; it is not sur-prising, then, given the shift to LFA over time, that client responses indicate a stronger LFA pro-gram than do the staff responses. Client responses also probably reflect the initial work search mandate and the high rate of assignment to job search.
VIII. Personalized Attention and Encouragement
The degree to which case managers provide personalized attention and encouragement to clients commonly reflects program administrators’ and staff’s philosophy and priorities. For in-stance, some administrators and staff believe that clients will participate at higher rates and achieve better outcomes if staff make a concerted effort to get to know clients in depth, work with them to remove any personal barriers to participation, and encourage them to succeed. Other administrators and staff may consider such efforts to be costly, unproductive, or a distrac-tion from the more central functions of enrolling clients in activities and monitoring participa-tion. The level of personalized attention and encouragement is also influenced by the structure of case management duties. All else being equal, for example, staff who are assigned large caseloads will have less time to spend with clients than staff who are assigned smaller caseloads. Similarly, staff who have a wide range of job responsibilities will have less time to devote to in-dividual clients than staff who have a more limited range.
Figure 2.3 depicts the responses of integrated case managers and JOBS staff to several sets of questions relating to personalized attention and encouragement. The majority of staff in
30Similar percentages of integrated case managers and JOBS staff encouraged clients to take any job (50 per-
cent and 59 percent, respectively), but more JOBS staff tended to encourage clients to be selective (7 percent of integrated case managers and 27 percent of JOBS staff).
31 The percentage of staff in the Columbus Integrated and Detroit programs who encouraged clients to take any job is similar (but slightly higher) than the percentage of staff in Portland. These two programs primarily utilized an HCD approach.
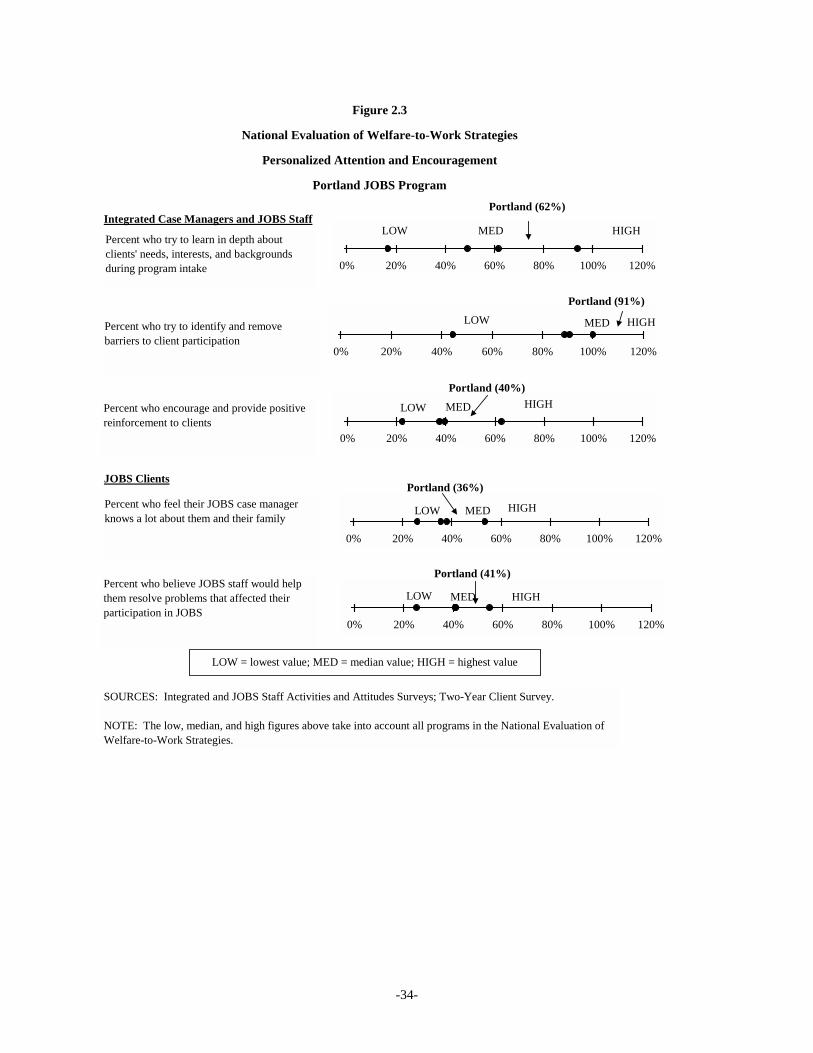
-34-
Integrated Case Managers and JOBS Staff
Percent who try to learn in depth about clients' needs, interests, and backgrounds during program intake
Percent who try to identify and remove barriers to client participation
Percent who encourage and provide positive reinforcement to clients
JOBS Clients
SOURCES: Integrated and JOBS Staff Activities and Attitudes Surveys; Two-Year Client Survey.
NOTE: The low, median, and high figures above take into account all programs in the National Evaluation of Welfare-to-Work Strategies.
Percent who feel their JOBS case manager knows a lot about them and their family
Percent who believe JOBS staff would help them resolve problems that affected their participation in JOBS
LOW = lowest value; MED = median value; HIGH = highest value
0% 20% 40% 60% 80% 100% 120%
LOW MED HIGH
Portland (62%)
0% 20% 40% 60% 80% 100% 120%
LOW MED HIGHPortland (40%)
0% 20% 40% 60% 80% 100% 120%
LOW MED HIGH
Portland (91%)
0% 20% 40% 60% 80% 100% 120%
LOW MED HIGH
Portland (36%)
0% 20% 40% 60% 80% 100% 120%
LOW MED HIGH
Portland (41%)
Figure 2.3
National Evaluation of Welfare-to-Work Strategies
Personalized Attention and Encouragement
Portland JOBS Program

-35-
Portland said they try to learn in depth about their clients during program intake (62 percent). This reflects the program’s emphasis on assessment to place all clients in appropriate activities or jobs and staff interest in “working with, not on” clients. During field interviews in 1994 staff reported, however, that over time, as placement standards increased, they had less time to learn about their clients. Some integrated case managers said the IM portion of their job sometimes detracted from their efforts to learn about their clients.
After the initial appraisal, staff monitored clients’ progress through the program. As in many of the other programs, almost all staff in Portland said they tried to identify and remove barriers to client participation in JOBS activities (91 percent). However, only 40 percent of Port-land staff said they encouraged clients to do well in their activities and provided positive rein-forcement to clients. During field research, a supervisor at one of the welfare offices said that part of Oregon’s focus on self-sufficiency was to encourage clients to be more proactive in set-ting their own goals and shaping their own experience in the JOBS program. Some case manag-ers may have avoided positive reinforcement, hoping to foster client self-reliance.
Less than half of Portland JOBS clients reported feeling that their case manager knows a lot about them and would help them resolve problems that affected their participation in JOBS (see Figure 2.3). This does not reflect the level of effort that case managers said they devoted to these activities, a pattern similar to that in many of the other programs in the evaluation. The dis-crepancy may partly reflect the fact that some clients spent very little time in the program. It may also be a reflection of the mandatory participation requirement: if a client resented being in JOBS, perhaps no level of effort on the case manager’s part to understand, assist, or encourage the client was recognized or appreciated.
IX. Participation Monitoring
An important part of case management is monitoring the attendance and progress of clients in assigned activities. Case managers may monitor participation mainly to find out how clients are doing and if they can help, or, in programs emphasizing participation mandates, primarily to learn whether clients are complying with participation rules and to initiate sanctions on those who are not compliant.
Although definitions of unacceptable attendance were not always consistent across activi-ties in Portland’s JOBS program,32 instructors seemed to be very aware of what participants were doing. Instructors discussed attendance monitoring primarily as a way to maximize clients’ benefit from the program but also as a precursor to requesting that the case manager initiate a sanction
As Figure 2.4 illustrates, over one-third of integrated case managers and JOBS staff in
32For example, one job club instructor reported sending daily lists to integrated case managers of those who
missed class. In contrast, the co-instructors of one GED class reported very loose attendance standards: they said, “students are responsible for their own attendance. We will counsel them if their attendance is dropping off. We don’t report them, but if a [case manager] asks us, we will tell the truth.” They said they would not contact the case manager unless the client had not attended for two or three weeks.

-36-
Percent who report receiving a lot of information on client progress from service providers
Average number of weeks before learning about attendance problems from service providers
Average number of weeks before contacting clients about their attendance problems
Integrated Case Managers and JOBS Staff
0 1 2 3 4 5
LOW MED HIGHPortland (1.9 weeks)
0% 20% 40% 60% 80% 100% 120%
LOW MED HIGH
Portland (35%)
0 1 2 3 4 5
LOW MED HIGHPortland (1.5 weeks)
SOURCES: Integrated and JOBS Staff Activities and Attitudes Surveys.
NOTE: The low, median, and high figures above take into account all programs in the National Evaluation of Welfare-to-Work Strategies.
LOW = lowest value; MED = median value; HIGH = highest value
Figure 2.4
National Evaluation of Welfare-to-Work Strategies
Participation Monitoring
Portland JOBS Program
-37-
Portland reported receiving “a lot” of information on their clients’ progress from service provid-ers, near the high end of the range. Staff reported an average 1.9 week time lag before they learned about their clients’ attendance problems and an average of 1.5 weeks before they con-tacted clients about these problems. These time lags are quite low compared to lags in the other programs, indicating relatively quick follow-up with clients. On all three measures, JOBS staff reported even closer monitoring than the integrated case managers (numbers are not shown in fig-ure) who reported moderately close monitoring compared to case managers in the other pro-grams.33 This is not surprising, since all JOBS staff, and only some of the integrated staff (those outstationed at the contractor offices, as discussed earlier), were located at the contractor offices where most clients attended activities.
X. Rule Enforcement and Sanctioning
The extent to which a welfare-to-work program may be considered “mandatory” depends largely on how strongly and consistently the participation requirements are communicated to cli-ents and the certainty and swiftness with which financial sanctions are imposed on clients who do not comply. In Portland, integrated case managers and JOBS staff are responsible for com-municating to clients what “mandatory” means and detecting instances of noncompliance, while integrated case managers and IM workers are responsible for imposing financial sanctions on those who do not meet program requirements. Although all JOBS programs were required to fol-low certain federal sanctioning guidelines,34 each program handled rule enforcement and sanc-tioning differently. Portland’s program was strongly mandatory through the combined use of encouragement, cajoling, and sanctioning.
Staff tended to use positive reinforcement to encourage participation. During interviews in Portland, most integrated case managers and JOBS staff said they informed clients of the ne-cessity of attending JOBS activities, but only some emphasized the penalties of noncompliance. One JOBS staff member said:
I rarely use the “m” word [mandatory]. I try to focus on their motivation, rather than my conciliation hammer or any mandatory placement numbers. I might point to their EDP [Employment Development Plan] and tell them, “You said you would . . . ,” but I wouldn’t point to the EDP and say, “You must . . . .”
33Forty-five percent of JOBS staff reported receiving a lot of information on client progress compared to 27
percent of integrated case managers; JOBS staff reported learning about attendance problems in an average of 1.7 weeks compared to 2.0 weeks for integrated case managers; and JOBS staff reported contacting clients within 1.4 weeks compared to 1.6 weeks for integrated case managers.
34Federal regulations governed the sanctioning process in JOBS programs nationwide. The penalty for noncompliance was removal of the JOBS-mandatory client from the AFDC grant. For example, if an AFDC case consisted of a JOBS-mandatory parent with two children, and the parent failed to participate in JOBS, the AFDC grant was reduced so that only the two children were covered. As specified in federal regulations, the second time a client was noncompliant, the sanction was in effect for a minimum of three months (or longer, if the client refused to comply). The third and any subsequent sanctions lasted a minimum of six months. Typically, there was no minimum length of a first sanction, but Oregon received a waiver of the FSA to allow them to impose first sanctions for a minimum of one month.
-38-
An integrated case manager agreed:
I don’t stress the mandatory rules too much. A lot of clients are just scared. A lot are mangled up by boyfriends or husbands. I have to let them know the rules —that’s my job — but I think people live up to expectations. I emphasize the posi-tive. I ask them what their dreams are for their children.
As Figure 2.5 illustrates, although the majority of integrated case managers and JOBS staff re-ported strongly emphasizing the penalties for noncompliance to new clients (59 percent), this is in the moderately low end of the range.35
Although almost all integrated and JOBS staff reported never delaying requesting finan-cial sanctions for noncompliant clients, only about half of IM workers and integrated case man-agers reported never delaying imposing sanctions (see Figure 2.5). Field interviews confirmed that many staff seemed more focused on keeping clients in the program than on sanctioning them. One integrated case manager said she gave clients “every chance under the sun” to comply with the participation requirement before she initiated a sanction. Despite staff intentions and conciliation efforts, they reported that a significant proportion of individuals remained noncom-pliant, and after much cajoling staff did impose sanctions. (Actual sanction rates are presented in Chapter 3.)
The client survey indicates that the majority of clients in Portland heard the mandatory message: almost 70 percent of clients in Portland reported being informed about noncompliance penalties, about average in the range. Close to 60 percent felt that the JOBS staff just wanted to enforce the rules, again about average.
XI. Staff Training, Evaluation, and Job Satisfaction
The day-to-day operations of a welfare-to-work program may be heavily influenced by the work environment. A productive work environment might be characterized as follows: ample train-ing is provided to equip case managers with the skills they need to help clients become self-sufficient; staff are adequately supervised to ensure that program procedures are followed properly and that staff receive the support they need to do their job well; evaluation criteria are established to recognize and reward good staff performance; and staff feel satisfied by and committed to their work.36
As evidenced in Figure 2.6, about half of Portland integrated case managers and JOBS staff reported receiving helpful training on how to be an effective case manager, including train-ing on JOBS rules and regulations, knowing how to match client needs to services, and learning how to motivate clients. Perhaps because many integrated case managers and JOBS staff in Port-land had prior experience as a caseworker in another employment-preparation program (see
35Slightly more JOBS staff than integrated case managers reported strongly emphasizing the penalties for non-
compliance (65 percent compared to 56 percent). 36See, for example, Bardach, 1993.

-39-
Percent who never delay requesting sanctions for noncompliant clients
Percent who never delay imposing sanctions on noncompliant clients
Percent who felt the JOBS staff just wanted to enforce the rules
Percent who say they were informed about penalties for noncompliance
SOURCES: Integrated, JOBS, and Income Maintenance Staff Activities and Attitudes Surveys; Two-Year Client Survey.
NOTES: The low, median, and high figures above take into account all programs in the National Evaluation of Welfare-to-Work Strategies. aThis is a single survey item, not a scale.
Income Maintenance Workers and Integrated Case Managers
JOBS Clients
0% 20% 40% 60% 80% 100% 120%
LOW MED HIGHPortland (52%)
0% 20% 40% 60% 80% 100% 120%
LOW MED
HIGH
Portland (92%)
0% 20% 40% 60% 80% 100% 120%
LOW MED HIGH
Portland (59%)
0% 20% 40% 60% 80% 100% 120%
LOW MED HIGHPortland (59%)
0% 20% 40% 60% 80% 100% 120%
LOW MED HIGHPortland (68%)
JOBS Staff
LOW = lowest value; MED = median value; HIGH = highest value
Figure 2.5
National Evaluation of Welfare-to-Work Strategies
Rule Enforcement and Sanctioning
Portland JOBS Program
Integrated Case Managers and JOBS Staff
Percent who strongly emphasize penalties for noncompliance to new clientsa

-40-
SOURCES: Integrated and JOBS Staff Activities and Attitudes Surveys.
NOTE: The low, median, and high figures above take into account all programs in the National Evaluation of Welfare-to-Work Strategies.
Percent who say that supervisors pay close attention to case manager performance
Percent who report good communication with program administrators
Percent who say that good performance is recognized
Percent who say they received helpful training on how to be an effective JOBS case manager
Percent who report high job satisfaction
0% 20% 40% 60% 80% 100% 120%
LOW MED HIGHPortland (48%)
0% 20% 40% 60% 80% 100% 120%
LOW MED HIGHPortland (41%)
0% 20% 40% 60% 80% 100% 120%
LOW MED HIGHPortland (22%)
0% 20% 40% 60% 80% 100% 120%
LOW MED HIGHPortland (35%)
0% 20% 40% 60% 80% 100% 120%
LOW MED HIGHPortland (93%)
LOW = lowest value; MED = median value; HIGH = highest value
Figure 2.6
National Evaluation of Welfare-to-Work Strategies
Staff Training, Supervision, and Evaluation
Portland JOBS Program
Integrated Case Managers and JOBS Staff
-41-
Table 2.1), training was seen as less necessary than in some other programs. During field visits, a few staff expressed a desire for more training, particularly in dealing with clients with severe barriers to participation and employment. Almost all staff reported that their supervisors paid close attention to their case manager performance.
As briefly mentioned earlier in this chapter, the state measured the performance of the local welfare departments using various standards. The District 2 welfare office translated these standards into performance standards for each contractor office; the welfare and contractor of-fices were jointly responsible for meeting the standards, which included the number served, the number placed in jobs, the average wage-of-placement, and AFDC recidivism (defined as the percentage who were receiving AFDC 18 months after they left the rolls). The measures were counted quarterly. If a contractor office did not meet at least 80 percent of the standard, staff at the district welfare office and the contractor office could be required to write a corrective plan, describing how they would meet the standards in the future. Ultimately, a service provider who did not meet the standards could lose the contract with the welfare agency. (During the follow-up period for this report, standards-related issues did not lead to written corrective plans or loss of contracts by providers.) Over time, most of the standards levels increased. For example, the Port-land offices were supposed to place about 1,300 people in jobs in 1993, 3,400 in 1995, and 5,100 in 1996. The wage-of-placement rate was set at $6.00 in 1994 and increased to $6.17 by 1996 (compared to a state minimum wage of $4.75 from 1994 through 1996).
The contractor offices did not, in turn, create performance standards for each individual worker. A supervisor at one of the contractor offices explained:
I used to look at placements of each of my staff; but I don’t like to do this anymore because we work together as a team.
A JOBS staff member echoed this philosophy:
The entire agency is accountable for placements; it’s a more cohesive approach than staff-specific standards.
Field researchers found that despite the absence of individual performance standards, most staff were aware of office- and district-wide placement tallies and recognized that there was a push to move people into the labor market. For example, researchers observed signs in some offices with the placement standards and a running tally of how the office and district were far-ing. Researchers also observed, however, that program guidelines and procedures were not al-ways clear or consistent to staff, owing in part to the dispersion of the program across various contractor offices and frequent program changes. The staff survey shows that 41 percent of Port-land integrated case managers and JOBS staff reported that good performance, in general, is rec-ognized (see Figure 2.6). This is about average compared to the other programs.
MDRC field researchers observed that staff morale was higher in the Portland JOBS pro-gram than in most other programs. Many staff reported satisfaction with their jobs, although some staff felt frustrated with the limits on providing education and training to clients. Although only 22 percent of integrated case managers and JOBS staff in Portland reported high job satis-faction, it places them in the moderately high end of the range (see Figure 2.6).

-42-
XII. Perceptions of the Effectiveness of JOBS
Some of the best critics of a welfare-to-work program are its staff and participants. Al-though they may not be able to predict what would happen in the absence of the program – only a controlled experiment can definitively answer that question – staff and clients are in a better posi-tion than most to judge whether or not the program’s mandates and services are helpful. A case can also be made that staff and client expectations can become self-fulfilling. Staff who strongly be-lieve in their program may more effectively deliver services and convey expectations of success to their clients. Similarly, clients who believe that the program will help them may get more out of the program and achieve better outcomes than clients who think the program has no value.
As Figure 2.7 illustrates, virtually all Portland integrated case managers and JOBS staff and about three-quarters of Portland IM workers believed that the JOBS program was helping clients become self-supporting, the highest percentages of all the programs. Interviews with inte-grated case managers and JOBS staff confirmed that most believed the JOBS program could make a big difference in clients’ lives and help them achieve self-sufficiency through finding jobs and leaving welfare. A few staff expressed concern about the reduction in education and training slots, and the push to place increasing numbers in jobs, but still believed that the pro-gram was effective. It is not surprising that fewer IM workers would give the program high marks, since they had more frequent exposure to AFDC recipients who were not active in JOBS (those who had been sanctioned owing to noncompliance with the program and those deemed inappropriate for JOBS participation). In fact, given that IM workers did not deal with clients active in the program, it is quite remarkable that 74 percent gave JOBS their vote of confidence.
The percentage of Portland clients who believed that the JOBS program had improved their employment prospects was among the highest of the programs studied in the NEWWS Evaluation. However, as in most of the other programs, the percentage of clients giving the pro-gram high marks was lower than the percentage of staff doing so. This may reflect the fact that many clients left AFDC before beginning a JOBS activity, participated in JOBS briefly, or found employment from a non-JOBS source. Some may have felt resentment toward the mandatory participation requirement and financial sanctions for noncompliance. Also, some clients were receiving welfare and were jobless at the time the survey was administered (see Chapter 5). Even if JOBS helped these clients in other ways, it had not led them to employment.

-43-
SOURCES: Integrated, JOBS, and Income Maintenance Staff Activities and Attitudes Surveys; Two-Year Client Survey.
NOTE: The low, median, and high figures above take into account all programs in the National Evaluation of Welfare-to-Work Strategies.
Percent who think JOBS will help clients become self-supporting
Income Maintenance Workers
Percent who think JOBS will help clients become self-supporting
JOBS ClientsPercent who think the program improved their long-run chances of getting or keeping a job
0% 20% 40% 60% 80% 100% 120%
LOW HIGHPortland (98%)
0% 20% 40% 60% 80% 100% 120%
LOW MEDPortland (74%)
0% 20% 40% 60% 80% 100% 120%
LOW
Portland (42%)
MED HIGH
LOW = lowest value; MED = median value; HIGH = highest value
Figure 2.7
National Evaluation of Welfare-to-Work Strategies
Perceptions of the Effectiveness of JOBS
Portland JOBS Program
Integrated Case Managers and JOBS StaffMED
HIGH

-44-
Chapter 3
Participation Patterns in the Portland JOBS Program
To help describe the “treatment” that individuals in Portland’s JOBS program received, as well as to help interpret the results of the impact analysis, it is essential to understand how exten-sively the program group took part in employment-related activities within the JOBS program. It is also important to compare the activity levels of the program group members with those of their control group counterparts to determine the “net” effect of the program on participation in em-ployment-related activities.
This chapter addresses four main sets of research questions: (1) To what types of employ-ment-related activities did case managers assign program group members? (2) To what extent did program group members actually participate in various types of employment-related activities over a two-year follow-up period? What were the major sequences of activities that program group members followed? (3) To what extent was an ongoing participation requirement put into effect for program group members? In what proportion of program group members’ months on AFDC were they either participating in an employment-related activity, employed, or sanctioned owing to non-participation for an unapproved reason? (4) To what extent were the incidence and number of hours of participation in employment-related activities increased among program group members com-pared with what would have happened in the absence of the JOBS program (as measured by the experiences of control group members)?
I. Participation Measures and AFDC Dynamics
Participation in welfare-to-work programs can be defined and measured many ways. This chapter examines participation longitudinally: that is, it uses measures that focus on a cohort of in-dividuals identified as mandatory for JOBS and traces their program experiences for two years. Longitudinal measures thus indicate individuals’ “chances” of ever participating in program activi-ties after having been identified as mandatory for JOBS, regardless of how long they remained on AFDC or remained mandatory. Since this approach parallels the approach used in the impact analysis, longitudinal measures are the best participation measures to use to explain impact find-ings.
The longitudinal participation measures used in this chapter differ substantially from the point-in-time participation measures contained in the federal regulations for the JOBS program and in the 1996 welfare reform law, and used in the 1995 participation report written as part of the Na-tional Evaluation of Welfare-to-Work Strategies.1 Point-in-time measures focus on individuals who are required to participate in a program during a specific time period (a given month) and count those who participate in the program within that same time period. In contrast to longitudinal
1Hamilton, 1995. Also, this report generally defines “participation” as taking part in program activities – job search, education, vocational training, work experience, on-the-job training, and life skills training – while the 1996 law counts part-time work in the participation calculation and does not count all of the activities included here.

-45-
measures, point-in-time measures give a snapshot view and show the likelihood that an individual will participate in a program activity during a month in which the individual is, in fact, still re-quired to participate.
Results from these two types of participation measures are likely to differ in magnitude. For example, in Atlanta, another site studied in the NEWWS Evaluation, longitudinally 74 percent of orientation attendees in the labor force attachment (LFA) program participated in a program activ-ity within a two-year follow-up period.2 However, in a typical month, only about 37 percent of the individuals who were mandated to participate in JOBS participated in an activity during that month.3
An awareness of AFDC caseload dynamics is essential in understanding and interpreting welfare-to-work program participation rates. A number of studies have shown that many welfare recipients cycle on and off the welfare rolls, often leaving without any special intervention. For ex-ample, some people get jobs on their own or get married. To the extent that this occurs among indi-viduals mandated for a welfare-to-work program before they enter their first program activity, a program’s overall longitudinal participation rate will be lowered. This rate will be further lowered to the extent that individuals obtain part-time employment, which, if it involves a specified number of hours per week, excuses clients from a program participation requirement.
At the same time, welfare-to-work programs may induce some of these behavioral changes. For example, a desire to avoid a program participation requirement may lead some individuals to find employment or leave welfare sooner than they otherwise would have done, again lowering a program’s participation rate if these actions are taken prior to starting an activity. Alternatively, some individuals might feel encouraged to remain longer on welfare in order to take advantage of a program’s opportunities for education and training. Thus, participation rates, whether high or low, are influenced by normal welfare caseload turnover as well as by a welfare-to-work program’s in-tervention. In any case, given welfare dynamics, participation rates should not be expected to reach 100 percent.
II. Overview of Participation Patterns
The participation data indicate that job search was the most commonly utilized activity in Portland’s JOBS program. However, program group members participated in a variety of activities, including life skills training, education and training, and work experience. Participation patterns for those who entered the program with a high school diploma or GED certificate (referred to as “graduates”) differed somewhat from patterns for those who entered the program without a high school diploma or GED (“nongraduates”): graduates were twice as likely to participate in job search as in education or training, whereas nongraduates were slightly more likely to participate in education or training than in job search. Case managers were allowed discretion in assigning indi-viduals to activities and some sample members were not immediately required to participate in the
2Hamilton et al., 1997. 3Hamilton, 1995.

-46-
program; about one-third of individuals had no activity assignment within the first three months of program entry.
Most participants did not remain in activities for long periods. The average length of stay in activities for participants was about five months over a two-year period, similar to the length of stay found for some other programs that emphasized quick entry into the labor market.
The results also indicate that Portland staff enforced a mandatory participation requirement. One-fifth of individuals were sanctioned (had their AFDC grant reduced) at some point in the two-year follow-up period for failing to participate in a program activity. However, during a substantial proportion of the months when individuals were JOBS-mandatory, they were not “covered” by the program; that is, they were not employed, participating in an activity, or sanctioned.
A comparison of the program group’s levels of participation in job search, education, train-ing, and work experience with those of control group members indicates that the Portland JOBS program increased participation in employment-related activities beyond what would have hap-pened in the absence of the program. A sizable proportion of control group members participated in activities on their own initiative (mostly vocational training or college and basic education) during the two-year follow-up period. Relative to the control group activity levels, the JOBS program most dramatically increased participation in job search, and, to a much lesser extent, it also in-creased participation in basic education, vocational training or college, and work experience.
III. Assignment Patterns
The activities to which case managers initially assign program enrollees serve as an indica-tor of a program’s employment-preparation strategy. Programs that emphasize quick entry into the labor market (a labor force attachment approach) initially assign most individuals to job search and programs that emphasize skill-building prior to entry into the labor market (a human capital devel-opment approach) first assign many individuals to education and training activities.
Figure 3.1 indicates assignment patterns at two points in the Portland program. The upper circle shows the activities to which individuals were first assigned (or allowed to continue) directly following random assignment, program orientation, and assessment. To capture case managers’ “initial” response to individuals, this circle counts assignments within three months of each indi-vidual’s random assignment date.4 If an individual was not assigned to any activity until, for exam-ple, the fourth month following random assignment, she would fall into the “no assignment” category. As shown in the figure, about one-third of program group members were initially as-signed to job search and about one-fifth were initially assigned to life skills training. (As mentioned in the previous chapter, life skills training was typically the first activity for those in the “enhanced track.”) Very small percentages of program group members were assigned to or allowed to con-tinue basic education, college, and vocational training. Four percent either continued or began part-time employment as their initial activity.
4Since random assignment can occur at any point in a month, three full months following the month of random
assignment are counted.

-47-
Figure 3.1
National Evaluation of Welfare-to-Work Strategies
Assignment Patterns Within a Two-Year Follow-Up Period
Portland JOBS Program
Activities to which individuals were initially assigned or in which they were allowed to continue:
SOURCE: MDRC calculations from MDRC-collected JOBS case file data. NOTE: Numbers may not add up to 100 percent because of rounding.
33.5%
4.9%
1.6%
3.8%
31.9%
3.2%21.1%
EmploymentVocational Training
No AssignmentWork Experience
College
Job Search
Basic Education
Life Skills Training
8.3%4.2% 12.5%
50.0%
25.0%
11.1%
77.8%
Next assignments for those who completed life skills training as an initial activity and had not found a job:
Next assignments for those who completed an education or training activity as an initial activity and had not found a job:
Next assignments for those who completed job search as an initial activity and had not found a job:
5.6%
22.2%
5.6%
11.1% 55.6%
11.1%

-48-
Case managers were allowed discretion in assigning individuals to activities, and some sample members were not immediately required to participate in the program; almost one-third of program group members were not assigned to program activity within three months of random as-signment. During this period, about one-third of these individuals became exempt from JOBS ow-ing to an exit from AFDC or other status change, about half were deferred by a case manager from participation in JOBS, and a small number were sanctioned.5 Approximately 70 percent of those not assigned to an activity in the first three-month period were never assigned to an activity within the two-year follow-up period.6 Preliminary analysis shows that those who were never assigned to a program activity were less likely than those who were assigned to have worked for pay in the year prior to program entry, less likely to have young children, and more likely to have reported health, emotional, and family problems. There appears to be no relationship, however, between as-signment and lifetime work history, welfare history, or educational status.7 (These numbers are not shown in Figure 3.1.)
The initial assignment patterns for those randomly assigned early in the period differed somewhat from the patterns for those assigned later in the period, who were more likely to be as-signed to job search and less likely to be assigned to life skills training or to receive no assign-ment.8 Initial assignment patterns also differed for those with and without a high school diploma or GED at random assignment. Among graduates, job search was the most common initial assign-ment: 43 percent of graduates were assigned to job search, only 15 percent were assigned to life skills training, and few were assigned to any other activity. In contrast, initial assignments among nongraduates were more varied: 20 percent were assigned to job search, 29 percent were assigned to life skills training, and 12 percent were assigned to basic education. (These numbers are not shown in Figure 3.1.)
The lower set of circles in Figure 3.1 shows the second activity assignments for those who completed, as an initial activity, job search, an education or training activity, or life skills training and had not found a job.9 The samples for this set of circles are a proportion of the original sample
5Some of the sanctions probably resulted from noncompliance with the initial work search requirement,
assigned at AFDC application, prior to JOBS orientation; others may have resulted from clients’ upfront refusal to comply with the program after attending orientation.
6About three-quarters of those deferred within the first three months following orientation were never assigned to a program activity during the two-year follow-up period.
7Baseline demographic data and data from the Private Opinion Survey were used to compare various characteristics of three groups of individuals: those who were never assigned to an activity following program orientation (and thus did not participate), those who were assigned to an activity but did not participate, and those who were assigned and did participate. The only statistically significant differences between the groups were on the measures mentioned above, and in each case the never-assigned group was different from both of the assigned groups. Measures for which no differences were found include: never worked full time for six months or more for one employer, no high school diploma or GED, low BASIS math and reading scores, prior AFDC receipt of two years, and prior AFDC receipt of five years.
8Initial assignments for those entering the program between March and August 1993 were compared with assignments for those entering between January and June 1994.
9This set of circles accounts for all individuals who participated in job search, education or training, or life skills training as an initial activity, not only those who were assigned within the first three months following random assignment. This captures case managers’ actions for all individuals who completed a certain activity without finding a job.

-49-
in the initial assignment circle. Some individuals who were assigned to an initial activity did not participate in that activity; others left their activity because they found jobs; and some dropped out of their activity for other reasons. The three circles together represent 28 percent of the full partici-pation sample.10
The left circle in the set shows that the majority of participants who completed job search as an initial activity without finding a job or dropping out for another reason were assigned to subse-quent job search. The middle circle shows that a large majority of those who completed an educa-tion or training activity were also assigned to job search. The third circle shows that half of those who completed life skills training were assigned to basic education, one-quarter were assigned to vocational training, and one-eighth were assigned to job search.
Second assignments for graduates and nongraduates differed somewhat. Fewer nongradu-ates were assigned to job search as a second activity, and none were assigned to vocational training (not shown in the figure).
“Longitudinal” assignment rates, the percentages ever assigned to certain activities over a certain period, also help illustrate a program’s employment-preparation strategy. Just over three-quarters (76 percent) of program group members were assigned to any activity within two years of random assignment. Over a two-year follow-up period, job search was the most common assign-ment (62 percent of program group members), followed by life skills training (28 percent), basic education (20 percent), and vocational training (17 percent). (These numbers are not shown in Fig-ure 3.1.)
IV. Participation Rates and Length of Stay in Activities
While assignment patterns indicate program staff decisions and reflect program philoso-phies, participation rates and estimates of length of stay in various types of activities indicate the extent to which AFDC recipients actually received services. As shown in Table 3.1, 61 percent of orientation attendees participated for at least one day (but usually much longer) during the two years following program orientation in at least one of the following activities: job search, educa-tion, training, life skills training, or work experience. Employment is not counted as participation in this measure.
This longitudinal participation rate falls in the middle of the range of rates found in studies of other mandatory welfare-to-work programs. For example, the two-year longitudinal rates for the other programs in the NEWWS Evaluation for which participation has been studied range from 44 to 74 percent.11 In earlier studies, between 38 and 70 percent of the orientation attendees partici-
10Ten percent of the participation sample completed (that is, did not drop out of ) job search as an initial
activity without finding a job; 5 percent completed an education or training activity as an initial activity without finding a job; and 13 percent completed life skills training as an initial activity without finding a job.
11The two-year longitudinal participation rates are as follows: Atlanta LFA program, 74 percent; Atlanta HCD program, 61 percent; Grand Rapids LFA program, 69 percent; Grand Rapids HCD program, 67 percent; Riverside LFA program, 44 percent; and Riverside HCD program, 51 percent. See Hamilton et al., 1997, for a discussion of these rates.
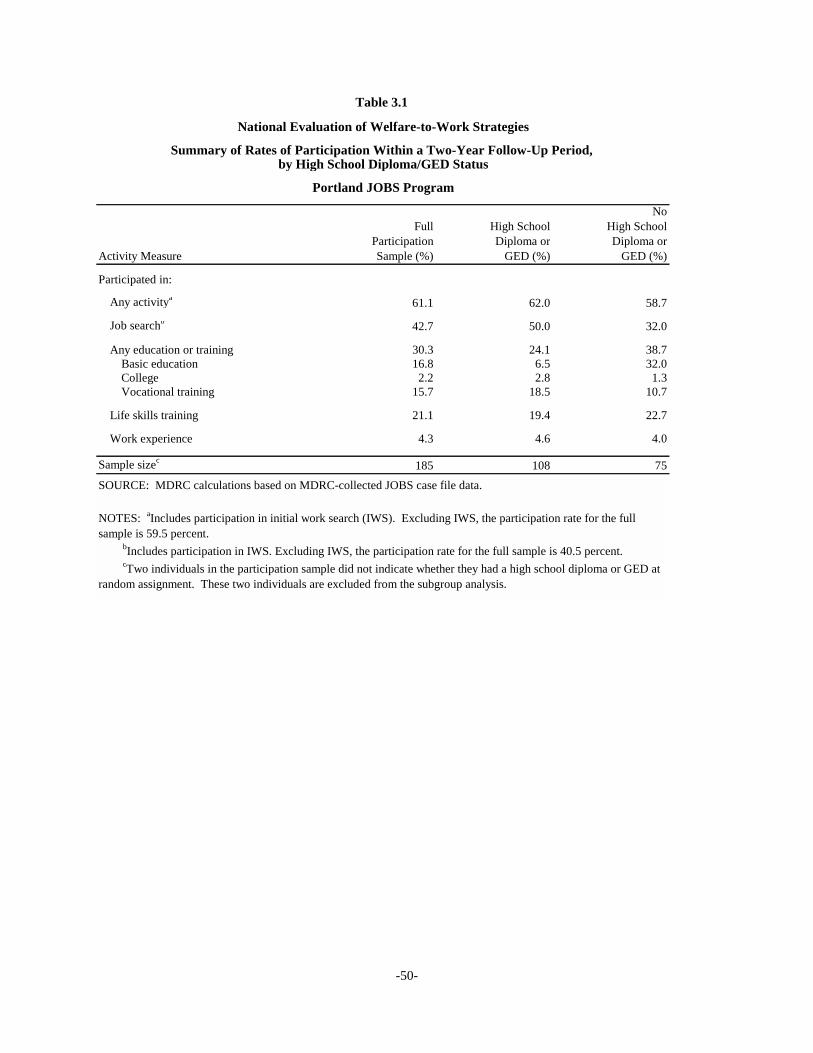
-50-
Table 3.1
National Evaluation of Welfare-to-Work Strategies
Summary of Rates of Participation Within a Two-Year Follow-Up Period, by High School Diploma/GED Status
Portland JOBS Program
NoFull High School High School
Participation Diploma or Diploma orActivity Measure Sample (%) GED (%) GED (%)
Participated in:
Any activitya 61.1 62.0 58.7
Job searchb 42.7 50.0 32.0
Any education or training 30.3 24.1 38.7Basic education 16.8 6.5 32.0College 2.2 2.8 1.3Vocational training 15.7 18.5 10.7
Life skills training 21.1 19.4 22.7
Work experience 4.3 4.6 4.0
Sample sizec 185 108 75SOURCE: MDRC calculations based on MDRC-collected JOBS case file data.
NOTES: aIncludes participation in initial work search (IWS). Excluding IWS, the participation rate for the full sample is 59.5 percent. bIncludes participation in IWS. Excluding IWS, the participation rate for the full sample is 40.5 percent. cTwo individuals in the participation sample did not indicate whether they had a high school diploma or GED at random assignment. These two individuals are excluded from the subgroup analysis.

-51-
pated in at least one activity within follow-up periods that were approximately one year. (Typically, one-year longitudinal rates are just a few percentage points lower than two-year rates for the same program.)12
During the two-year follow-up period, program group members most commonly partici-pated in job search (43 percent); 30 percent participated in at least one education or training activ-ity; 21 percent participated in life skills training, and 4 percent participated in work experience. (See Appendix Table D.1 for a breakdown of the types of activities in which program group mem-bers participated, subsumed under the broad categories of job search, education and training, and work experience.)
The overall longitudinal participation rate was similar for those who entered the program with a high school diploma or GED certificate and those who entered without a diploma or certifi-cate. However, among graduates twice as many participated in job search as participated in educa-tion or training. Among nongraduates participation was more evenly split, with participation in education or training (primarily basic education) most common.
Portland’s program mandated participation for those with children as young as age 1. Par-ents with young children are of special interest, since they may face more difficulty in finding and securing child care and thus in participating in a program. In fact, in Portland program group mem-bers with younger children participated at a somewhat higher rate than those with older children (but the difference is not statistically significant). (See Appendix Table D.1 for detailed participa-tion rates for subgroups defined using the age of sample members’ youngest child at random as-signment.)
The statistics above indicate the likelihood that a sample member would have participated at all in an activity as part of the JOBS program within two years of attending a program orienta-tion. An examination of the length of stay in program activities is also valuable. When examining length of stay, it is important to keep in mind that the goal of welfare-to-work programs is to enable individuals to get a job and/or leave welfare. As a result, one would hope that individuals had not been participating in program activities during every month in the follow-up period, since it would mean that they had never found employment and/or left AFDC during the period. As shown in Ta-ble 3.2, within the two-year follow-up period program group members received AFDC for an aver-age of 14.5 months. During some of these months program group members were receiving AFDC, but had become JOBS-exempt; that is, they were no longer required to participate in JOBS activi-ties.13 If one takes this into account, program group members were JOBS-mandatory, and thus available for JOBS activity participation, for an average of 12.4 months. Program group members participated in JOBS activities for an average of 3.2 months over the two-year follow-up period.
12See Friedlander et al., 1985a; Friedlander et al., 1985b; Friedlander et al., 1987; Goldman, Friedlander, and
Long, 1986; Riccio et al., 1986; and Hamilton and Friedlander, 1989; for summaries of participation levels in programs in Arkansas, Baltimore, Cook County (Illinois), San Diego, and Virginia in the 1980s; Riccio and Friedlander, 1992, for participation data relating to California’s GAIN program; and Kemple and Haimson, 1994, for participation rates in Florida’s JOBS program.
13Over time, as shown at the bottom of Appendix Table D.1, 85 percent of program group members became no longer mandatory for JOBS, because of an AFDC exit, full-time employment, or other reasons.

-52-
Table 3.2 National Evaluation of Welfare-to-Work Strategies
Length of Participation Within a Two-Year Follow-Up Period,by High School Diploma/GED Status
Portland JOBS Program
NoFull High School High School
Participation Diploma DiplomaActivity Measure Sample or GED or GED
For all sample members for whomcase files were reviewed
Average number of months receiving AFDC 14.5 14.2 14.9
Average number of months in whichindividuals were JOBS-mandatorya 12.4 11.8 13.0
Average number of months in whichindividuals participated in a JOBS activity 3.2 3.5 2.5
Sample sizeb 185 108 75
For participants only
Average number of months in whichindividuals participated in a JOBS activity 5.2 5.7 4.3
Number of months in which there wasparticipation (%)
1 18.0 15.4 22.72 19.8 18.5 22.73 12.6 15.4 9.14-6 21.6 18.5 25.07-12 18.0 18.5 15.913-18 8.1 12.3 2.319 or more 1.8 1.5 2.3
In any activity at the end of thefollow-up period (%) 0.1 0.1 0.0
Sample sizeb 113 67 44
SOURCES: MDRC calculations from MDRC-collected JOBS case file data and Oregon AFDC records.
NOTES: aA negligible portion of these months is accounted for by time during which clients were required to participate in initial work search before their AFDC grants were approved. bTwo individuals in the participation sample did not indicate whether they had a high school diploma or GED at random assignment. These two individuals are excluded from the subgroup analysis.

-53-
Among participants in Portland, length of stay in JOBS activities was short for the majority, reflecting the fact that many quickly found jobs and left the AFDC rolls, and probably also reflect-ing the program’s emphasis on short-term activities. Participants were active in a JOBS activity for an average of 5.2 months. (See the “participant” panel of Table 3.2.) This length of stay is similar to that for three LFA programs studied as part of the NEWWS Evaluation.14 Half of the partici-pants were active in some type of JOBS activity during three or fewer months in the two-year fol-low-up period, and roughly three-quarters were active during six or fewer months. Some individuals, however, had longer stays: about 10 percent of participants were active in an activity for 13 months or longer. Virtually no participants were still active at the end of the two-year fol-low-up period.
Of the two education-based subgroups, nongraduates received AFDC and were JOBS-mandatory for slightly more months, on average, during the two-year follow-up period than gradu-ates. In spite of this, nongraduates participated in JOBS activities for fewer months during the fol-low-up period.
V. Part-Time Employment While JOBS-Mandatory
Nationwide, some individuals in the JOBS program mixed employment with AFDC receipt and were able, according to site procedures, to have their employment count as their participation obligation. In general, states with high AFDC grant levels or generous income disregards, other things being equal, would have had higher proportions of individuals who were employed while JOBS-mandatory. In Portland, where grant levels were notably higher than the national average, 15 percent of the program group members were employed for at least 15 hours per week while manda-tory for JOBS at some point during the two-year follow-up period (see Appendix Table D.1). In Atlanta, a low-grant state, the percentage was similar, which may reflect Portland staff’s encourag-ing clients to find full-time rather than part-time jobs.
VI. Sanctioning
The frequency with which case managers imposed sanctions (AFDC grant penalties) on program group members who for no approved reason did not participate in or dropped out of em-ployment-related activities provides a good indication of the extent to which a mandatory participa-tion requirement was enforced in Portland’s JOBS program. Sanctioning rates in Portland are in the range of those calculated so far for other sites in the NEWWS Evaluation, but are higher than those calculated for earlier welfare-to-work programs.
At some point during the two-year follow-up period, Portland staff referred for sanction 32 percent of the clients who had attended program orientations (see Table 3.3).15 Typically, the num-
14Within a two-year period, the average length of stay for those who participated in the three LFA programs
was 4.6 months. 15“Referred for sanction” indicates that the integrated case manager had sent a formal notice to the sample
member indicating the impending sanction. This step occurred after the JOBS case manager recommended a sanction and often after significant staff efforts to encourage clients to comply, as discussed in Chapter 2.

-54-
Table 3.3
National Evaluation of Welfare-to-Work Strategies
Summary of Sanction Activity Within a Two-Year Follow-Up Period, by High School Diploma/GED Status
Portland JOBS Program
NoFull High School High School
Participation Diploma DiplomaActivity Measure Sample or GED or GED
For all sample members for whomcase files were reviewed
Referred for sanction (%) 31.9 31.5 32.0
Sanction imposed (%) 20.5 20.4 20.0
In sanction at the end of thefollow-up period (%) 3.2 1.9 5.3
Sample sizea 185 108 75
For sanctioned individuals onlyb
Average number of months inwhich sanction was in effect 5.4 5.6 5.3
Number of months in sanction (%)1 10.5 13.6 6.72 13.2 4.6 26.73 10.5 4.6 13.34-6 39.5 50.0 26.77-12 18.4 22.7 13.313-18 7.9 4.6 13.319 or more 0.0 0.0 0.0
In sanction at the end of thefollow-up period (%) 15.8 9.1 26.7
Sample sizea 38 22 15
SOURCE: MDRC calculations from MDRC-collected JOBS case file data.
NOTES: aSome individuals in the sample did not indicate whether they had a high school diploma or GED at random assignment. These individuals are excluded from the subgroup analysis. bThe length of sanctions may be overestimated. The data sources did not always provide accurate sanction end dates.

-55-
bers of clients on whom sanctions are actually imposed is less than the number of clients referred for sanction, since some individuals agree to participate and the sanction request is withdrawn, and others leave AFDC or are found to be no longer JOBS-mandatory before the sanction actually takes effect. In Portland, within the two-year follow-up period, 21 percent of program group members had their AFDC grants reduced as a result of noncooperation with the JOBS program.16 For a three-person family in 1993, a sanction would have resulted in a $142 decrease in a monthly grant of $460.
As discussed in Chapter 2, sanctions in Oregon were to continue until the sanctioned indi-vidual complied with the JOBS participation mandate, with a minimum sanction length of one month for the first “offense,” three months for the second offense, and six months for the third and any subsequent offenses. The actual average length of sanction in Portland, for those who were sanctioned, was 5.4 months. The majority of those sanctioned were sanctioned for six months or fewer. Only 8 percent were sanctioned for more than 12 months. The length of sanctions in Port-land is at the low end of those found so far for the other NEWWS Evaluation programs.17
Those with and without a high school diploma or GED were equally likely to be referred for sanction and to have a sanction imposed. However, nongraduates were more likely than gradu-ates to be sanctioned at the end of the follow-up period.
VII. Overview of “Paths” Through the Program
While the participation measures previously discussed are helpful in gauging the treatment received by program group members in the Portland program, they do not show the timing and fre-quency of various activity sequences in the program. Figures 3.2 and 3.3 provide some of this in-formation.
Figure 3.2 presents a monthly breakdown, at six-month intervals, of AFDC status and JOBS statuses for program group members throughout the two-year follow-up period.18 The sec-tions of each bar in the figure represent mutually exclusive categories.19 (The figure follows the same cohort of program group members throughout a two-year follow-up period; as a result, the denominator for the percentages shown in the bars is identical for each bar.)
The figure indicates that the proportion of program group members who were not subject to
16In Atlanta, Grand Rapids, and Riverside, two-year sanction rates range from 9 to 42 percent (see Hamilton et
al., 1997). Sanctioning rates found in late-1980s or early-1990s programs were typically about 10 percent or lower (see Riccio and Friedlander, 1992; Kemple and Haimson, 1994; Hamilton, 1988).
17Data sources did not always provide accurate end dates for sanctions, so the length of sanctions in Portland may actually be overestimated. The average length of sanctions in the Atlanta, Grand Rapids, and Riverside LFA and HCD programs ranged from 4.9 to 11.6 months (see Hamilton et al., 1997).
18Since month 1 represents the month of random assignment, and thus a partial JOBS month, the figure starts with month 2.
19During any month, it was possible for an individual to be in more than one status. As a result, statuses in Figure 3.2 are prioritized in the order shown in the bars, from top to bottom. For example, if an individual was in a sanction status in a month but became no longer JOBS-mandatory in the middle of that same month, the individual is shown as no longer mandatory and not as sanctioned in that particular month.
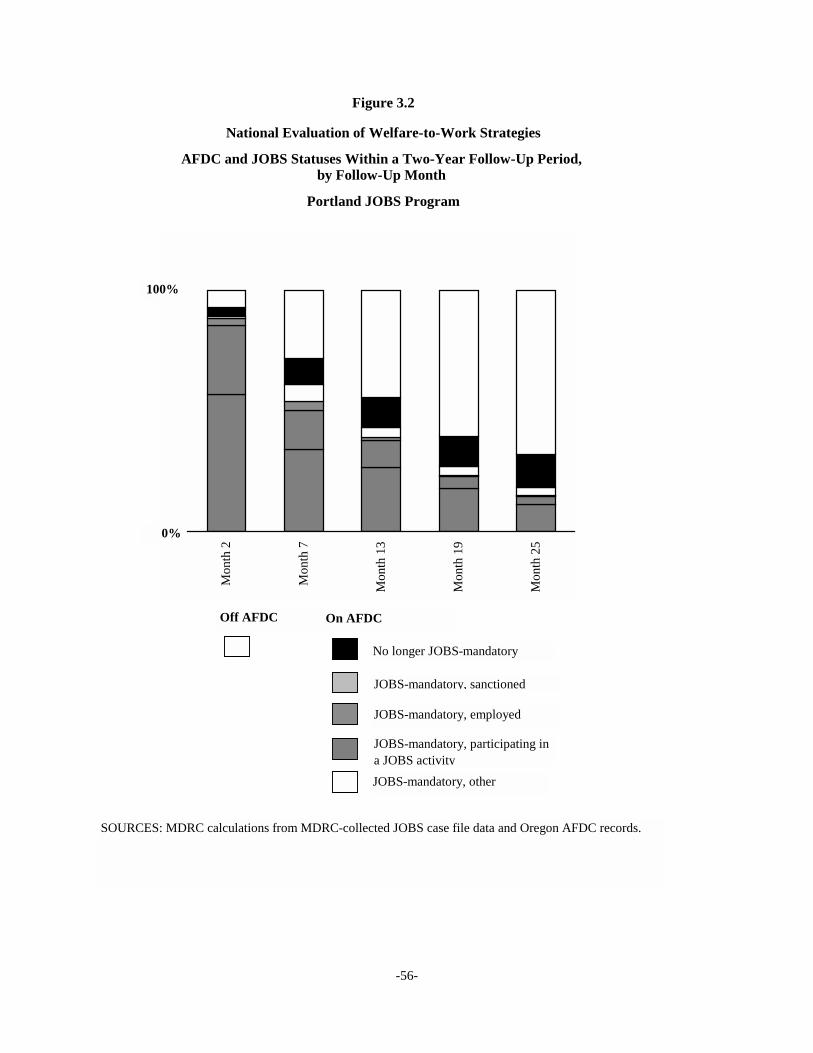
-56-
Figure 3.2
National Evaluation of Welfare-to-Work Strategies
AFDC and JOBS Statuses Within a Two-Year Follow-Up Period, by Follow-Up Month
Portland JOBS Program
Off AFDC
No longer JOBS-mandatory
JOBS-mandatory, sanctioned
On AFDC
JOBS-mandatory, other
JOBS-mandatory, participating in a JOBS activity
JOBS-mandatory, employed
Mon
th 2
Mon
th 7
Mon
th 1
3
Mon
th 1
9
Mon
th 2
5
100%
0%
SOURCES: MDRC calculations from MDRC-collected JOBS case file data and Oregon AFDC records.

-57-
Figure 3.3
National Evaluation of Welfare-to-Work Strategies
Distribution of Sample Members by Descriptive (Not Causal) Activity Sequences Within a Two-Year Follow-Up Period
Portland JOBS Program
SOURCES: MDRC calculations from MDRC-collected JOBS case file data and Oregon AFDC records.NOTE: "Exit from AFDC" is defined as having two consecutive months of zero payments recorded on the state AFDC administrative records system.
35.7%
5.9%
13.0%
16.8%
Path C: No participation, exit from AFDC
Exit fromAFDC
Sanctioned
[No events]
Deferred
Path D: No participation, no exit from AFDC
No exitfrom
AFDC
Sanctioned
[No events]
Deferred
9.2%
1.6%
6.5%
1.1%
11.9%
1.6%
0.0%
3.2%
1.1%
2.2%
0.5%
3.2%
Path B: Participation, no exit from AFDC
Life Skills TrainingJob Search
Education, Training,Work Experience
Any Activity
Job Search
Education, Training,Work Experience
Any Activity
No exitfrom
AFDC
43.2%
2.2%
1.1%
8.6%
13.5%
7.0%
3.8%
7.0%
Path A: Participation, exit from AFDC
Life Skills TrainingJob Search
Education, Training,Work Experience
Any Activity
Job Search
Education, Training,Work Experience
Any Activity
Exit fromAFDC

-58-
a JOBS participation mandate increased throughout the follow-up period: by month 13, more than half of the program group members were either not receiving AFDC or receiving AFDC but ex-empt from JOBS; and by month 25, 82 percent were either not receiving AFDC or exempt from JOBS. The percentage of program group members not receiving AFDC increased throughout the follow-up period, as individuals found jobs or left AFDC for other reasons. Similarly, the percent-age who were receiving AFDC but were exempt from JOBS increased throughout the follow-up period.
The proportion of individuals in a sanction status was rather small throughout the follow-up period, peaking in month 7. Even fewer individuals were employed part time while mandatory. The proportion of individuals participating in a JOBS activity was highest in month 2 and then de-creased throughout the follow-up period.
Finally, the figure indicates that early in the follow-up period a substantial percentage of program group members were JOBS-mandatory but were not participating in a JOBS activity, em-ployed part time, or sanctioned. The proportion in this “other” status decreased steadily throughout the follow-up period.
An examination of the monthly statuses for the education-based subgroups yields some in-teresting information. (These numbers are not illustrated in Figure 3.2.) The percentage who had left AFDC was similar among graduates and nongraduates throughout most of the follow-up pe-riod, with the only noticeable difference at the end of the follow-up period: in month 25, 72 percent of graduates were no longer receiving AFDC compared to 61 percent of nongraduates. Throughout the follow-up period, the percentage of nongraduates in the “other” status was consistently larger than the percentage of graduates in that status.
In contrast to Figure 3.2, Figure 3.3 examines the order in which individuals moved from one status to another and indicates the percentages of individuals who followed each of four “paths” during a two-year follow-up period: Path A, in which there was participation in a JOBS activity and an exit from AFDC; Path B, in which there was participation, but no exit from AFDC; Path C, in which there was no participation, but an exit from AFDC; and Path D, in which there was no participation and no exit from AFDC. These four paths account for all program group members. In addition, subpaths are shown within each of these four major paths.20
As Path A shows, 43 percent of program group members participated in a JOBS activity and exited AFDC. The most common subpath was participation in job search followed by an exit from AFDC (either directly following job search or after participation in a subsequent activity).
20Figure 3.3 focuses on exits from AFDC; part-time or full-time employment is not taken into account. Exits from
AFDC are defined as two consecutive months with no AFDC grant received. Also, the paths stop with the first exit from AFDC; JOBS activity that occurred after this first exit for individuals who returned to the AFDC rolls is not taken into account. In addition, for individuals in Paths A and B, the figure shows the first two instances of program participation during the follow-up period; other and subsequent events are not reflected in the figure. For individuals in Paths C and D, the first “event” during the follow-up period is shown. For these individuals, an event is defined as a sanction or deferral. Also, while education, training, and work experience were combined in this figure, very little participation was in work experience.

-59-
However, about half of program group members who participated and then exited AFDC partici-pated first in life skills training, education, training, or work experience.
Path B shows that few program group members participated in a JOBS activity and did not exit AFDC. This number is quite low compared to other programs for which this analysis has been done.21
As Path C shows, many program group members did not participate in a JOBS activity dur-ing the follow-up period, but did exit AFDC.22 While some were sanctioned and some were de-ferred, the most common subpath is “no events”: 17 percent of individuals who attended a JOBS orientation in Portland exited AFDC with no special program intervention. As Paths A and C to-gether show, a large majority of program group members exited AFDC during the follow-up pe-riod, showing a very dynamic caseload.
Path D indicates that only a small percentage of program group members in Portland nei-ther participated in a JOBS activity nor exited AFDC. This percentage is lower than that found in other programs in the NEWWS Evaluation.23 The majority of these individuals in Portland were deferred from JOBS participation by a case manager.
The education-based subgroups had somewhat different program paths (not shown in Fig-ure 3.3). A slightly higher percentage of graduates exited AFDC, either following participation or without participation. Under Path A, the subpath beginning with job search was the most common subpath for both subgroups, but fewer nongraduates fell into it.
VIII. Coverage with a Welfare-to-Work Obligation
The previously discussed statistics alone do not indicate the extent to which individuals were “covered” by a program obligation in every month they received AFDC. To examine this, several factors need to be taken into account simultaneously on a person-by-person basis: the length of time individuals remained on AFDC during the two-year follow-up period; the length of time they remained JOBS-mandatory; and the length of time they were either participating in a program activity, employed while JOBS-mandatory, or sanctioned for nonparticipation.
As mentioned previously and as Appendix Figure D.1 illustrates, program group members received AFDC for an average of 14.5 months during the two-year follow-up period and were JOBS-mandatory for 12.4 months. However, as also shown, program group members participated, were sanctioned, or were employed an average of only 4.8 months during the follow-up period.
Figure 3.4 illustrates coverage in another manner. It shows the number of months that indi-
21Between 12.3 and 44.8 percent participated but did not exit AFDC in the Atlanta, Grand Rapids, and
Riverside HCD programs (see Hamilton et al., 1997). 22Between 13.0 and 39.0 percent did not participate and exited AFDC in the Atlanta, Grand Rapids, and
Riverside LFA and HCD programs. 23Between 11.1 and 21.3 percent did not participate and did not exit AFDC in the Atlanta, Grand Rapids, and
Riverside LFA and HCD programs.
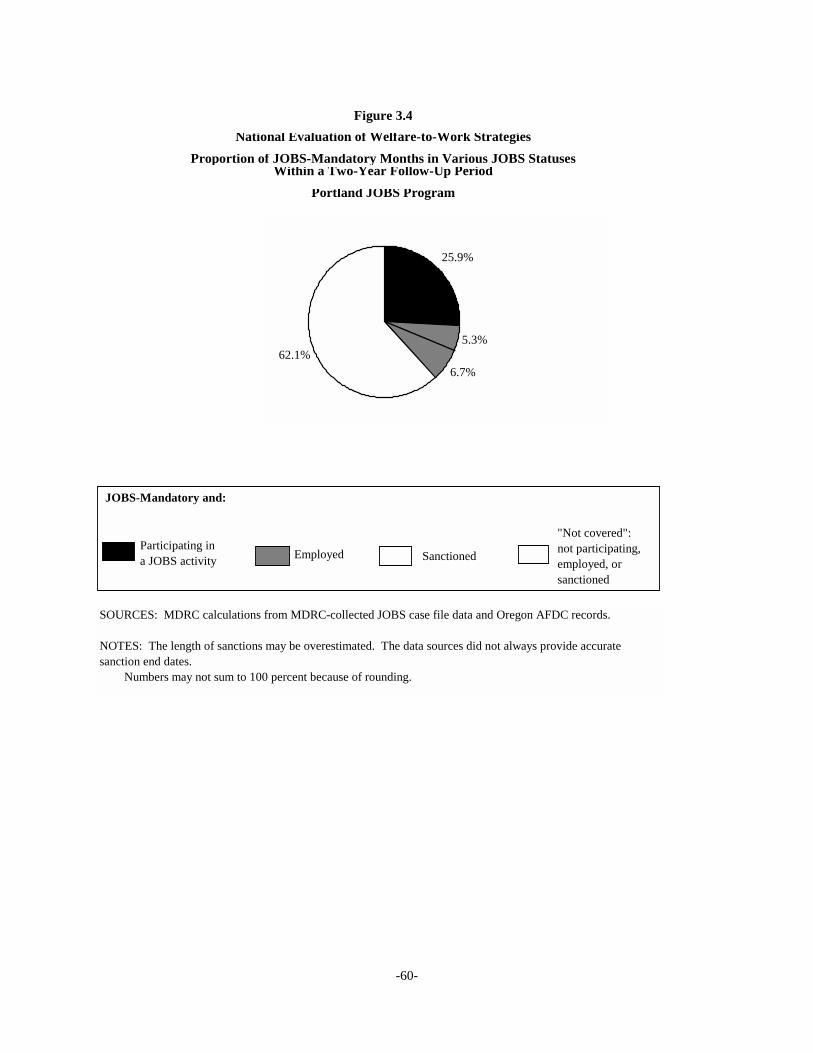
-60-
Figure 3.4National Evaluation of Welfare-to-Work Strategies
Proportion of JOBS-Mandatory Months in Various JOBS StatusesWithin a Two-Year Follow-Up Period
Portland JOBS Program
25.9%
5.3%
6.7%62.1%
JOBS-Mandatory and:
Participating in a JOBS activity Employed Sanctioned
"Not covered": not participating, employed, or sanctioned
SOURCES: MDRC calculations from MDRC-collected JOBS case file data and Oregon AFDC records. NOTES: The length of sanctions may be overestimated. The data sources did not always provide accurate sanction end dates. Numbers may not sum to 100 percent because of rounding.
-61-
viduals were either participating in a JOBS activity, employed, or sanctioned as a proportion of the months in which program group members were JOBS-mandatory. If the shaded areas of the circle are added together, program group members in Portland were meeting a program obligation an av-erage of 38 percent of the months in which they were JOBS-mandatory.
Coverage was slightly different for those with and without a high school diploma or GED. Graduates received AFDC for slightly less time, and were mandatory for less time, but were par-ticipating, sanctioned, or employed for more months than nongraduates. Similarly, graduates were covered during 41 percent of their JOBS-mandatory months, but nongraduates were covered during only 33 percent of their JOBS-mandatory months. (Numbers are not shown in Figure 3.4.)
Individuals in welfare-to-work programs can be required to participate in a month (in this case, “JOBS-mandatory”), but not participate, work, or be sanctioned during that month for a vari-ety of reasons. They may be waiting for case managers to either refer them to an activity or sanc-tion them; or they may be waiting for support services to be arranged or for activities to begin. Sometimes staff temporarily “lose track” of clients. Sometimes clients are temporarily deferred from participation for reasons such as illness or caring for an ill relative.24
Coverage in Portland is somewhat low compared to other programs for which this analysis has been done.25 This is probably primarily due to the sizable percentage of individuals who were deferred from program participation. It may also be a result of very few people combining welfare and work, relatively short stays in activities, and an occasional shortage of activity slots so that clients had to wait to participate (waits for life skills training were most common).
IX. Participation Among Program Group Members in Employment- Related Activities Outside JOBS
The findings presented so far have focused on the activities of program group members while they were in the Portland JOBS program, based on information collected from JOBS case files. Many program group members, however, also participated in education or training activities outside JOBS during the two-year follow-up period. Most commonly, this participation occurred after they left the AFDC or JOBS-mandatory rolls; less commonly, they might have participated in a self-initiated activity – while they were still JOBS-mandatory – that JOBS case managers could not approve as a JOBS activity, because the type or intensity of the activity did not meet the pro-gram’s standards.26 To obtain information on participation in education or training programs out-side JOBS, data from the Two-Year Client Survey were analyzed. Unlike the JOBS case file data, the survey captures participation in activities that might have occurred outside JOBS as well as within JOBS. These data, however, represent retrospective self-reports by survey respondents, in some cases requiring the remembrance of short-term participation that might have occurred as much as two years earlier. The survey data, though more inclusive in the spells of participation cap-
24See Hamilton, 1995, for a detailed discussion of reasons for nonparticipation. 25In the six programs in the NEWWS Evaluation in which this analysis has already been done, the proportion
of JOBS-mandatory months covered ranges from 41 to 68 percent. 26In the cost analysis in Chapter 4, activities outside JOBS are called “non-JOBS” activities.

-62-
tured, are subject to recall error, and participation rates based on survey data will not match the JOBS case file-based participation rates presented thus far in the chapter.27
Appendix Table D.2 indicates that some program group members participated, or continued to participate, in employment-related activities outside the JOBS program and/or AFDC, particu-larly in vocational training or college. However, program group members were much more likely to participate in job search, basic education, and work experience as part of JOBS than outside JOBS.
X. Comparison of Participation Levels with What Would Have Happened in the Absence of the Program The preceding participation-related findings focused exclusively on the individuals ran-domly assigned to the program group, covering their activities as part of the JOBS program as well as (briefly) their activities outside JOBS and/or the AFDC rolls during the two-year follow-up pe-riod. It is important, however, to determine the extent to which program group members partici-pated in employment-related activities incrementally more than control group members and the types of activities in which participation levels increased the most, since these differences are key to determining which aspects of the program treatment are causing the impacts on employment, earnings, and AFDC (discussed in Chapter 5). Control group members’ levels of self-initiated ac-tivity represent what would have happened if program group members had had no exposure to JOBS. To make comparisons between the activity levels of program and control group members, data from the Two-Year Client Survey, which collected participation information for both groups, are used.28 All individuals surveyed, whether or not their JOBS case files were reviewed as part of the participation analysis, are included in the samples analyzed in this section.
As Table 3.4 shows, Portland’s JOBS program considerably increased participation in em-ployment-related activities beyond what would have happened in the absence of the program. The program most dramatically increased the likelihood that individuals would participate in job search. The program also incrementally increased the likelihood that individuals would participate in basic education, vocational training or college, and work experience.
In Portland, a sizable proportion of control group members reported participating in an em-ployment-related activity at some point during the two-year follow-up period.29 Vocational training
27Some statistical adjustments were made in Appendix Table D.2, based on information found in the JOBS case
files, to take recall error into account. 28As was the case for Appendix Table D.2, some statistical adjustments were made to the client survey
participation data discussed in this section, based on information found in the JOBS case files, in order to take recall error in the client survey into account. Appendix Table D.3 presents the differences between program and control group levels of participation using the survey data alone, rather than adjusting for recall error.
29It is unclear why 4 percent of the control group members reported, on the client survey, that they had experienced a sanction. Periodic reviews of control group members’ case files indicated that controls were not exposed to JOBS’ services or its mandates. The client survey question read: “Since [the random assignment date], was your welfare check ever reduced because you did not attend an education, training or employment program?” Some controls may have experienced AFDC grant reductions as a result of failure to report income-related information to their AFDC workers and mistakenly answered “yes” to this question or some may have mistakenly reported on sanctions that took place prior to random assignment.

Table 3.4
National Evaluation of Welfare-to-Work Strategies
Two-Year Impacts on Participation in Job Search, Education,Training, and Work Experience, and Sanctioning
Portland JOBS Program
Hours of Participation Participated or Sanctioned (%) Hours of Participation Among Participants
Program Control Program Control Program ControlOutcome Group Group Difference Group Group Difference Group Group Difference
Participated in:Job searcha 58.6 8.8 49.8 69.0 5.6 63.4 117.7 63.5 54.2Basic education 25.8 13.2 12.5 110.7 29.9 80.9 430.1 226.1 203.9Vocational training or college 31.2 22.3 9.0 158.8 143.2 15.6 508.7 643.7 -134.9Work experience or on-the-job training 12.9 2.3 10.6 n/a n/a n/a n/a n/a n/a
Sanctionedb 18.4 4.4 14.0 n/a n/a n/a n/a n/a n/a
Sample sizec 297 313 297 313 (varies) (varies)
SOURCES: MDRC calculations from the Two-Year Client Survey, adjusted using MDRC-collected JOBS case file data.
NOTES: Test of statistical significance were not performed. Measures in this table represent weighted averages. Respondents were weighted to replicate the proportion of program and control group members in the larger impact sample. Estimates are regression-adjusted using ordinary least squares, controlling for pre-random assignment characteristics of sample members. Numbers may not add up to 100 percent because of rounding. Differences between program group members and control group members (shown in italics) for "Hours of Participation Among Participants" are not true experimental comparisons. N/a = not available or applicable. aFor program group members, this measure includes participation in life skills training and initial work search. bSanctioned between date of random assignment and date of survey interview. cSample sizes for individual measures vary because of missing values.

-64-
or college was the most common activity for controls (22 percent participated), followed by basic education (13 percent participated), job search (9 percent participated), and work experience (2 percent participated). Relative to the control group activity levels, the JOBS program increased par-ticipation in job search by 50 percentage points (59 percent of program group members partici-pated).30 The program also increased participation in basic education by 13 percentage points (26 percent participated), in vocational training or college by 9 percentage points (31 percent partici-pated), and in work experience by 11 percentage points (13 percent participated).
If all sample members are considered, program group members spent 81 more hours in ba-sic education than did control group members. If only those individuals who participated at all in basic education are considered (a nonexperimental comparison, since program group participants may have different characteristics than control group participants), program group participants spent 204 more hours in this activity than did control group participants. This increase in hours is quite large compared to other programs. If all sample members are considered, program group members and control group members spent about the same number of hours in vocational training or college. However, if only those who participated in vocational training or college are considered, the program group spent 135 fewer hours in this activity than did the control group. This decrease is not uncommon in welfare-to-work programs.
Incremental participation was examined for education subgroups of program and control group members. (See Appendix Table D.4.) For both graduates and nongraduates, the Portland program increased participation in job search by about 50 percentage points. The program also in-creased nongraduates’ participation in basic education (by 20 percentage points), and, to a lesser degree, work experience (by 13 percentage points) and vocational training or college (by 10 per-centage points). Among graduates, the program slightly increased participation in vocational train-ing or college (by 8 percentage points) and work experience (by 9 percentage points).
Incremental participation was also examined for a subgroup of the most disadvantaged sample members – a subgroup of those without a high school diploma or GED at program entry who had received AFDC for at least two years and had not worked in the previous year. This group is of particular concern for states under TANF, since most individuals, including the most disadvantaged, can receive federal welfare for only a limited time, and must eventually move off welfare into employment. Although the size of this subgroup is rather small, calculations indi-cate that Portland’s JOBS program did increase the participation levels of the subgroup in all ac-tivities (these numbers are not shown on a table).
30 Survey respondents were asked if they had “attended classes or gotten assistance that lasted for a few weeks
on preparing résumés and job applications, or calling employers.” For program group members, this measure includes participation in life skills training and initial work search.
-65-
Chapter 4
Cost of the Portland JOBS Program
The cost analysis presented in this chapter estimates how much the government spent on JOBS per program group member and shows how these costs varied across program activities and support services. It separates expenditures made by Portland’s welfare department from those made by other agencies. This information may be useful to administrators and planners who want to understand the nature of the government’s investment in Portland’s JOBS program. Moreover, the results of this analysis provide another perspective for interpreting the program’s impacts, which are presented in Chapter 5.
The primary goal of the cost analysis is to estimate the government’s average net cost of providing employment and education-related services to members of the program group. The net cost is the difference between the average cost per program group member and the average cost per control group member of all JOBS and non-JOBS services that were used during the period studied. These costs are presented for the two-year period following each sample member’s ran-dom assignment.
The estimates presented in this chapter represent the second installment of the National Evaluation of Welfare-to-Work Strategies’ cost analyses. Two-year cost estimates were pre-sented for Atlanta, Grand Rapids, and Riverside in a previous report.1 At times in this analysis, Portland’s program will be compared to LFA and HCD programs in these three sites. Upcoming documents will present two-year estimates for Columbus, Detroit, and Oklahoma City.2 The final report will present a benefit-cost analysis to determine whether the economic gains (the net bene-fits) to the government were greater or less than the economic losses (the net costs) after five years. It is premature to present a two-year benefit-cost analysis here because the total return on Portland’s investment may be evident only after several years.
To summarize the main findings presented in this chapter: The estimated total cost (in 1993 dollars) per program group member within two years after random assignment was $4,027 in Portland.3 About 65 percent of this was paid for directly by the welfare department (with the remainder being paid for by schools and other agencies, mostly in providing vocational training and college to program group members). The welfare department’s share of costs was higher than in the six programs previously studied in the evaluation. This is primarily because — through its contract with Mt. Hood Community College — the Portland department paid for job search, basic education, and a small percentage of vocational training and college services. In contrast, the other welfare departments relied on non-welfare agencies (such as adult schools,
1For more information on costs in these sites, see Chapters 7 and 8 of Hamilton et al., 1997. 2The cost analyses of the Columbus, Detroit, and Oklahoma City programs have not been completed at this
time. Thus, comparisons of Portland’s costs with costs in other NEWWS Evaluation programs are limited to At-lanta, Grand Rapids, and Riverside.
3Portland’s costs throughout this analysis were adjusted to 1993 dollars for comparability to previously studied programs in the National Evaluation of Welfare-to-Work Strategies.

-66-
community colleges, and vocational training institutes) to provide and finance the cost of basic education, vocational training, college, and (in Grand Rapids) job search services. Because the cost of Portland’s contracted services, combined with the related case management costs, was relatively low, the total cost of operating JOBS in Portland was also relatively low. However, the level of support services that program group members received was far higher than in the LFA and HCD programs in Atlanta, Grand Rapids, or Riverside.
On average, in those six programs, 14 percent of gross costs were attributable to support services. In Portland, 38 percent ($1,541) of total costs per program group member were attrib-utable to support services. This high cost was driven primarily by child care receipt by sample members whose youngest child was under age 3 at random assignment and by an unusually high ratio of sample members receiving transitional and other non-JOBS child care.
The net cost of Portland’s JOBS program, $2,017 per program group member, is $467 higher than the average net cost per labor force attachment (LFA) group member across the three programs previously studied as part of the NEWWS Evaluation and $1,060 lower than the aver-age net cost per human capital development (HCD) group member. Portland’s net cost is higher than the average net cost per LFA group member not because of operating net costs, which were relatively low, but because the net cost of support services in Portland was very high compared to costs in Atlanta, Grand Rapids, and Riverside.
This chapter begins with an overview of the major components of the cost analysis. It then discusses the cost estimates in detail for program and control group members. Finally, it compares cost estimates for program and control group members who had a high school diploma or GED certificate at random assignment with costs for those who did not.
I. Major Components of the Cost Analysis
Figure 4.1 illustrates the cost components for the program and control groups. Costs were calculated for two categories of activities and services: those provided to meet JOBS require-ments or to support JOBS participation and non-JOBS services and activities. In each category, costs are further broken down between those paid for by the welfare department and those paid for by non-welfare agencies. Figure 4.1 shows that the JOBS-related costs (Box 3) consisted of those expenditures incurred by Portland’s welfare department to operate the program (Box 1) plus the expenditures incurred by non-welfare agencies (for example, community colleges and proprietary schools) to provide college and training activities that met JOBS requirements (Box 2). Non-JOBS costs (Box 6) consisted of welfare department child care expenditures from programs other than JOBS (for example, transitional child care) (Box 4) and the costs of services that pro-gram group members received on their own, generally after leaving the program (Box 5). Total JOBS and non-JOBS costs per program group member make up the total gross cost per program group member (Box 7).
This chapter is organized to move through the boxes in Figure 4.l, beginning with JOBS-related expenditures and ending with the net cost per program group member, which is the sum

-67-
Figure 4.1National Evaluation of Welfare-to-Work Strategies
Major Components of Gross and Net CostsPortland JOBS Program
Non-JOBS expenditures by thewelfare department per program
group member for non-JOBSsupport services
$825
4
Non-JOBS expenditures by non-welfare agencies per program
group member for non-JOBS jobsearch, education and training, and
work experience$822
5
Total JOBS-related costper program group
member$2,380
3
Total non-JOBS cost perprogram group member
$1,647
6
Total gross cost per controlgroup member
$2,010
10
Welfare department cost per control groupmember: expenditures by the welfare
department for supportservices
$590
8
Total gross cost per programgroup member
$4,027
7
Difference =Net cost per program group
member
= −
$2,017
11
11 7 10
Non-welfare agency cost per controlgroup member: expenditures by non-
welfare agencies for non-JOBS job search,education and training, and work
experience$1,420
9
SOURCES: See Table 4.1.
NOTE: Rounding may cause slight discrepancies in calculating sums.
JOBS-related expenditures by thewelfare department per program
group member for casemanagement, support services, jobsearch, education and training, and
work experience$1,780
1
JOBS-related expenditures by non-welfare agencies per program groupmember for vocational training and
college$601
2

-68-
of all program costs less the amount that would have been spent in the program’s absence. The tables that follow show the above components broken down by activity and type of support ser-vice payment.
II. JOBS-Related Cost per Program Group Member
This section examines expenditures made by the welfare department and by non-welfare agencies for JOBS-related activities and support services.
A. JOBS-Related Expenditures by the Welfare Department (Figure 4.1, Box 1)
Welfare department costs consisted of program operating costs paid by the welfare de-partment and the costs of support services that program group members received to enable their participation in JOBS.
1. Operating Costs. Portland’s welfare department covered the expenditures for the day-to-day operation of the program, including expenditures for case management services, overhead, orientation to the program, and other activities (for example, job club, basic education classes, and vocational training). To determine welfare department operating costs, expenditure data were collected that consistently captured the costs of each JOBS-related activity, starting at the time sample members attended orientation.4 The data covered a “steady-state” period from July 1993 to June 1994. This year was chosen as a period of relatively stable program operations when many of the sample members were receiving services. Salaries and overhead costs were allocated to five JOBS activities based on an approximation of the time that case managers spent with clients assigned to each activity.5 These activities are orientation and assessment, job search, basic education, vocational training and college, and work experience.6 The costs in-
4The staff costs of referring clients to the JOBS program are not included in this analysis. In addition, this
analysis attempted to exclude the costs of initial work search (IWS) that generally occurred before orientation. However, a small number of sample members (7 percent) participated in this activity after random assignment. These costs are included in this analysis and, because of data restrictions, are assumed to have the same monthly cost as regular job search. To the extent that regular job search was more expensive than IWS, this analysis over-states the cost of IWS in these instances.
5In Oregon, welfare department workers charge their time to program and activity codes, for example, JOBS case management, Food Stamp issuance, general administrative duties. Salaries and overhead costs are allocated to programs and activities based on the number of hours reported to each time code. Because this system allocates ex-penditures based on general categories instead of by activity, JOBS costs were allocated to each of the five activities based on a proxy for the amount of time case managers were spending with clients in each activity. It was assumed that in a given month, case managers spent time with clients in each activity based on the proportion of their monthly caseload composed of clients in each activity. Therefore, if 25 percent of their caseload consisted of clients in job search, then 25 percent of their monthly expenses would have been allocated to job search. A similar method was not necessary to allocate contracted expenditures to activities because the contractors maintained records that allocated all relevant JOBS expenses to activities in their billing to the welfare department.
6Chapter 2 describes these activities in detail. Basic education includes Adult Basic Education (ABE), General Educational Development (GED), High School Completion and English as a Second Language (ESL). Job search includes both job search and life skills training classes.

-69-
curred by the welfare department to accommodate MDRC research requirements and requests were excluded from the analysis.
Payments made by the welfare department to outside organizations that were contracted to provide services are also included in total welfare department costs and allocated across ac-tivities. As discussed in Chapter 2, the welfare department contracted case management duties, job search, education, training, and work experience to Mt. Hood Community College, which operated Steps to Success. Mt. Hood Community College further subcontracted with Portland Community College, which also operated a Steps to Success office, the Private Industry Council, Portland Public Schools, and the Oregon Employment department to provide additional services.
Unit cost estimates are central to cost analysis. To determine how much the welfare de-partment spent per program group member on each JOBS activity, its unit cost was first calcu-lated from the data collected during the steady-state period. The unit cost of an activity is an estimate of the average cost of serving one person in a specified activity for a specified unit of time, one month in the case of the welfare department. For each activity, unit costs are calculated by dividing expenditures during the steady-state period by a measure of participation in the same period called “participant-months.” Participant-months are obtained by summing across all months in the steady-state period the monthly total number of participants in each activity. Once the unit cost of an activity is determined, it is multiplied by the average number of months spent in the activity to determine the average cost incurred per program or control group member dur-ing the follow-up period.7
Table 4.1 (column 1) shows the welfare department unit costs for the five activities. For all of the activities except vocational training and college, the costs include welfare department and contracted case management expenditures as well as the cost of providing the activity itself, for example, classroom instruction, job club facilitation, and classroom space rental. The welfare department paid for the costs of providing these activities through its contract with Mt. Hood Community College. A small number of vocational training and college courses were offered through Steps to Success to JOBS program group members, and thus were paid for by the wel-fare department; but an estimated 89 percent of sample members participated in vocational train-ing and college at outside agencies — that is, community colleges, proprietary schools, or a local university — and thus were not paid for by the welfare department.8 The welfare department’s arrangement with Steps to Success and other local providers has implications for many facets of this cost analysis. In terms of unit costs, the average cost per month of vocational training and college ($117) is low compared to the cost of other activities. As explained above, this is because the unit costs of the other four activities include the cost of case management and the cost of providing the service, while vocational training and college includes case management and the cost of providing only very limited services through Steps to Success.
7For a more detailed explanation of participant-months, unit costs, cost per program and control group member,
and other general methodology see Chapter 7, pp. 165-69, in Hamilton et al., 1997. 8The percentage of program group members who participated in vocational training and college at outside
agencies was calculated from Steps to Success records for members of the case file sample who participated in vo-cational training and college.

-70-
Table 4.1
National Evaluation of Welfare-to-Work Strategies
Estimated Unit Costs for Employment-Related Activities (in 1993 Dollars)
Portland JOBS Program
Program Group Control GroupWelfare Department Non-Welfare Non-Welfare
Unit Cost Agency Unit Cost Agency Unit CostAverage Average Average Average
per Month of per Hour per Month of per HourActivity Participation ($) ($) Participation ($) ($)
Orientation and assessment 124 n/a n/a n/a
Job searcha 323 n/a 252 n/aBasic education 231 10.56 n/a 10.56Vocational training and
college 117 7.03 n/a 7.20Work experienceb 360 n/a 289 n/a
SOURCES: MDRC calculations are based on fiscal and participation data from the following sources: Oregon Department of Human Resources, Adult and Family Services Division; Oregon Office of Community College Services; information collected on tuition charged at proprietary schools attended by sample members; and information from MDRC-collected case file data and the MDRC Two-Year Client Survey.
NOTES: Welfare department unit costs include the cost of providing activities, e.g., classroom instruction, job search facilitation, space rental, and case management expenditures. The average cost per hour is a cost per scheduled hour, calculated by taking a weighted average of community college and proprietary school costs per hour, based on participation by sample members. N/a = not applicable. aFor program group members, this measure includes participation in life skills training and initial work search. bWork experience unit costs for control group members receiving services from non-welfare agencies were assumed to be equal to the contracted cost portion of the welfare department JOBS unit cost.

-71-
To obtain the cost per program group member shown in Table 4.2 (column 1), the unit cost of each activity was multiplied by the average length of stay in the corresponding activity. Thus, the differences in costs across activities can be explained by these two variables. For ex-ample, compare the unit cost of work experience in Table 4.1 with the cost per program group member of work experience in Table 4.2. The unit cost of work experience ($360) was higher than the unit cost of any other activity in Portland. Despite this high unit cost, the cost per pro-gram group member for work experience ($182) is not especially high compared to the cost of the other activities because program group members, on average, spent less time in work experi-ence than they did in other activities, thus reducing the cost to the welfare department. As Table 4.2 shows, the sum of each activity’s cost per program group member yields a total JOBS wel-fare department operating cost of $1,063 per program group member.
2. Support Service Costs. The welfare department paid for child care, transporta-tion, and ancillary services (for example, uniforms, tools, equipment, books, registration, licens-ing fees) to help sample members participate in JOBS. Data on individual support service expenditures were collected from the welfare department covering the two-year period after ori-entation for all sample members.
Column 5 of Table 4.3 shows that the average JOBS child care cost in Portland was $624 per program group member. This is relatively high compared with the other programs studied in the NEWWS Evaluation thus far.9 Portland’s high JOBS child care expenditures resulted from both a high rate of receipt (50 percent) and a high average monthly payment ($252). Mitigating the effects of Portland’s average high monthly payment and rate of child care receipt on the av-erage cost per person was the fact that program group members tended to receive payments for a relatively short period of time (5 months). JOBS child care will be discussed further in a com-parison of JOBS child care costs with transitional and other non-JOBS costs in section III.
While some program group members received JOBS transportation payments to cover auto repairs and gasoline expenses, the majority of these funds were used to purchase monthly and daily bus passes, which were distributed by welfare department workers to those who needed transportation to attend a JOBS activity.10 Program group members also received an av-erage of $12 in JOBS ancillary services within two years after orientation.
3. Total JOBS-Related Costs Incurred by the Welfare Department. Table 4.2 (column 1) shows that Portland’s welfare department paid a total of $1,780 per program group member for JOBS services, including both operating expenditures and support service costs.
9Atlanta’s average JOBS child care payment per LFA and HCD was $679, slightly higher than the comparable
figure for Portland. The average cost per LFA and HCD was $327 in Grand Rapids and $115 in Riverside. 10Of the $60 transportation cost per program group member, $57 were spent on bus passes. The remaining $3
were spent on reimbursements for gasoline expenses based on mileage and auto repairs or maintenance. According to program staff, the majority of sample members who were issued bus passes received $41 unrestricted “all zone” or $31 “two zone” monthly bus passes. Furthermore, the children of recipients could receive $24 youth monthly bus passes if their parents needed to transport them to and from day care.

Table 4.2
National Evaluation of Welfare-to-Work Strategies
Estimated JOBS Cost per Program Group Member Within Two Years After Orientation, by Agency (in 1993 Dollars)
Portland JOBS Program
JOBS Cost per Program Group Member Non-JOBS Cost per Program Group Member Total GrossWelfare Non-Welfare Total JOBS Welfare Non-Welfare Total non-JOBS Cost per
Department Agency Cost Department Agency Cost Program GroupActivity Cost ($) Cost ($) ($) Cost ($) Cost ($) ($) Member ($)
Orientation and assessment 124 10 134 0 0 0 134Job searcha 403 13 416 0 5 5 421Basic education 242 11 253 0 235 235 488Vocational training and
college 112 562 674 0 547 547 1,221Work experience 182 5 187 0 35 35 222Subtotal (operating) 1,063 601 1,664 0 822 822 2,486
Child care 624 0 624 798 0 798 1,422Child care administrationb 21 0 21 27 0 27 48Other support services 71 0 71 0 0 0 71Total 1,780 601 2,380 825 822 1,647 4,027
SOURCES: See Table 4.1. MDRC child care and other support service calculations from Washington County and Multnomah County (District 2) payment data.
NOTES: Rounding may cause slight discrepancies in calculating sums. aFor program group members, this measure includes participation in life skills training and initial work search. bAdministrative costs for the determination of child care needs and payment issuance were estimated as a percentage of the value of the payments, i.e., by dividing total administrative costs by total payments. It was estimated that for each dollar of payments, there were three cents of administrative costs. In other words, child care administrative costs were 3 percent of total payments.

-73-
Table 4.3
National Evaluation of Welfare-to-Work Strategies
Estimated Support Service Cost per Program Group MemberWithin Two Years After Orientation (in 1993 Dollars)
Portland JOBS Program
Per Program Group Member Who Received Service Percent of CostAverage Average Cost Per Person Program Group per ProgramMonthly Months Who Received Members Who Group Member
Support Service Payment ($) of Payments Service ($) Received Service ($)
Child careJOBS 252 5 1,238 50 624Non-JOBS 398 8 3,046 26 798
Transitional 394 6 2,481 23 570Other non-JOBS 400 5 2,113 11 228
TransportationJOBSa n/a n/a n/a n/a 60Non-JOBS 14 1 14 0 0
Ancillary servicesJOBS 96 1 111 10 12Non-JOBS 63 1 78 0 0
Total 1,493
SOURCES: See Table 4.2.
NOTES: Rounding may cause slight discrepancies in calculating sums. N/a = not available. a Monthly JOBS transportation payment data were not available.

-74-
B. JOBS-Related Expenditures by Non-Welfare Agencies (Figure 4.1, Box 2)
As discussed above, Portland’s welfare department paid for the majority of JOBS-related activities except for vocational training and college. The small portion of vocational training and college provided by the Steps to Success (an estimated 11 percent of total participation) program is included in welfare department costs and, as such, is part of the JOBS-related welfare depart-ment vocational training and college cost per program group member ($112). This section fo-cuses on vocational training and college provided by non-welfare department agencies. 11
The cost of vocational training and college per scheduled hour was calculated from cost and participation data collected from proprietary schools and community colleges — the primary types of institutions attended by sample members. Table 4.1 (column 2) shows that the non-welfare agency unit cost of vocational training and college was $7.03 per scheduled hour. The JOBS non-welfare agency cost per program group member for vocational training and college was calculated by multiplying this unit cost estimate by the average number of JOBS hours that participants were scheduled to attend and by the percentage who participated in JOBS vocational training and college. Table 4.2 (column 2) shows that the JOBS non-welfare agency cost of vo-cational training and college was $562 per program group member.
The low non-welfare agency costs associated with the other four activities are indirect administrative services provided to Steps to Success primarily by Mt. Hood and Portland com-munity colleges for which the welfare department was not billed. Because this analysis seeks to include all costs of running JOBS, the indirect administrative costs in excess of what the welfare department was billed were included in non-welfare agency costs per person. These additional indirect administrative costs increase the total non-welfare agency cost to $601 per program group member.
C. Total JOBS-Related Cost (Figure 4.1, Box 3)
By summing welfare department and non-welfare department JOBS costs, a total JOBS-related cost per program group member of $2,380 was obtained (Table 4.2, column 3). Figure 4.2 shows the distribution of this total across activities and support services. Vocational training and college expenditures make up the largest portion of JOBS expenditures (28 percent). Taken together with basic education (11 percent), education and training activities make up 39 percent of Portland’s JOBS-related expenditures. Child care made up 27 percent of total JOBS expendi-tures and job search 17 percent. Other support services, orientation and assessment, and work experience made up the remaining portion of total JOBS expenditures.
11It is important to note that this analysis assumes that education and training services provided by non-welfare
agencies were also financed by non-welfare agencies (including the U.S. Department of Education, if program group members received Pell Grants or other federal financial aid) and not sample members themselves. To the de-gree to which sample members actually did finance their own education and training, the cost analysis overestimates the true costs to non-welfare agencies per program and control group member. While this has distributional implica-tions, it does not overstate the costs of the services. The GAIN Evaluation of seven counties in California found that fewer than 10 percent of sample members may have spent their own or their family’s resources on education and training. See Riccio, Friedlander, and Freedman, 1994, for details.
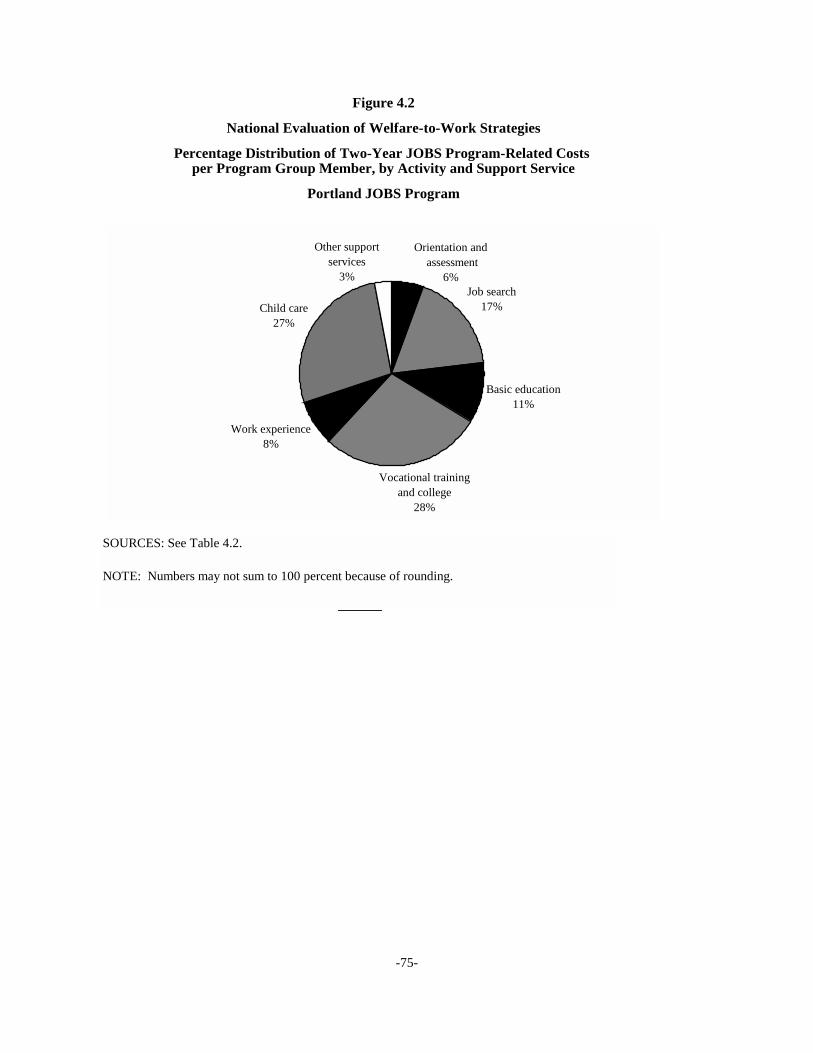
-75-
Figure 4.2
National Evaluation of Welfare-to-Work Strategies
Percentage Distribution of Two-Year JOBS Program-Related Costs per Program Group Member, by Activity and Support Service
Portland JOBS Program
Other support services
3%Job search
17%
Orientation and assessment
6%
Vocational training and college
28%
Basic education11%
Work experience8%
Child care27%
SOURCES: See Table 4.2.
NOTE: Numbers may not sum to 100 percent because of rounding.
-76-
These results appear to contradict the characterization of Portland’s program as one pri-marily focused on job search with a moderate emphasis on education and training for those deemed in need. However, differences in the average length of stay in education activities and in unit costs explain this cost distribution. Although nearly 60 percent of program group members participated in job search, the length of stay in this activity was relatively short compared to the average length of stay in education activities (see Table 3.4). This increased the cost of education and training relative to job search. In addition, Portland’s job search unit cost was fairly low compared with vocational training and college provided by non-welfare department agencies.12 This would also tend to increase vocational training and college costs relative to job search costs.
Compared to LFA programs studied previously as part of the NEWWS Evaluation, Port-land’s JOBS operating costs were nearly $300 lower than average and its support service costs were nearly $300 higher than average. The combination of these two factors made Portland’s total JOBS cost per program group member of $2,380 very close to the average of the Atlanta, Grand Rapids, and Riverside LFA programs ($2,391). The most striking difference between Portland and the other sites is that Portland spent nearly $300 less on job search than did the other programs because its job search unit cost was lower than the cost in Atlanta, Grand Rapids, and Riverside. Like job search costs, Portland’s total JOBS-related basic education cost was slightly lower than the comparable average cost in the three LFA programs, again because of unit costs.13
12It is not possible to directly compare the unit costs of non-welfare agency vocational training and college per
scheduled hour (Table 4.1, column 2) with the cost of welfare department job search per month (Table 4.1, column 1) because the time units differ and because the cost of the former includes only service provision expenditures while the cost of the latter includes both case management and service provision expenditures. However, to get a rough idea, the vocational training and college unit cost per scheduled hour can be translated into $387 per month. Recall that the unit cost of job search was $323, which includes case management and service provision. Given that this cost is lower than the vocational training and college cost per month, and that some unknown portion of this cost is case management rather than service provision expenditures, it is reasonable to assert that the unit cost of job search is fairly low compared to that of non-welfare agency vocational training and college.
13To compare the total unit cost of basic education in Portland with those in Atlanta, Grand Rapids, and River-side, both welfare agency and non-welfare department costs must be included. As previously discussed, Portland’s welfare department unit cost includes the cost of providing all JOBS-related basic education services as well as case management, while in the other three sites, the majority of education services were provided by non-welfare agen-cies. Dividing the total cost per person of JOBS-related basic education by the average number of months spent in welfare department and non-welfare agency-provided basic education reveals that the average total cost per month of basic education was much lower in Portland than in the other three sites:
Column A Total JOBS- related cost
Column B Average number of
months of participation
A Divided by B Cost per month of par-
ticipation
Atlanta LFA $360 1.10 $327 Grand Rapids LFA $401 0.63 $636 Riverside LFA $45 0.06 $732 Portland $253 1.05 $241
(continued)

-77-
The fact that Portland’s relatively low JOBS-related operating costs can be traced back to welfare department unit costs suggests that Steps to Success and the welfare department were operating an efficient program. There could be several possible explanations for these results; two are suggested here. First, Portland’s use of integrated case managers may have been more cost effective than traditional case management. This hypothesis will be tested in Columbus as a future part of this evaluation. Second, as discussed in Chapter 2, Portland’s program was imple-mented through a strong partnership between the welfare department and contractor staff, which generated a strong sense of commitment to the program and opened the lines of communication between staff members. This kind of organizational environment may have also contributed to an efficiently run program, and thus lower unit costs.
III. Non-JOBS Cost per Program Group Member
Some program group members entered education and training activities on their own af-ter leaving the JOBS program or participated in activities that were not approved by JOBS staff while enrolled in JOBS. While these services are not considered to be JOBS-related, they have the potential to increase the program group’s long-term earnings and reduce their reliance on welfare just as they have for the control group. Thus, they should be included in the gross cost estimate before comparing the cost per program group member with the cost per control group member. The following discussion of non-JOBS costs is divided into those financed by the wel-fare department and those financed by non-welfare department agencies.
A. Non-JOBS Expenditures by the Welfare Department (Figure 4.1, Box 4)
Program group members in Portland received high levels of both JOBS and non-JOBS support services. Besides JOBS child care, two other categories of child care were paid for by the welfare department: transitional child care, which was provided for up to one year to former AFDC recipients who left welfare for work,14 and other non-JOBS child care. Other non-JOBS child care includes Employment-Related Day Care (ERDC), which was available to low-income sample members who were not on AFDC but were working;15 and the Oregon Food Stamp Em-ployment Transition Project (OFSET), available to sample members who were not on AFDC but who were receiving Food Stamps.16 Overall, 92 percent of other non-JOBS child care payments were employment-related.
Column 5 of Table 4.3 shows that the non-JOBS child care cost per program group mem-
14Slightly more than 1 percent of sample members received a type of transitional child care that was available
for up to two years instead of the usual one year. 15Employment-Related Day Care was also provided to sample members who were not on welfare but who were
attending school. This program was funded through the Student Block Grant program. 16Other non-JOBS child care also included a small number of payments from JOBS Plus, an Oregon work ex-
perience program that began late in the follow-up period. Only 0.3 percent of the total number of support service payments were JOBS Plus-related.

-78-
ber was $570 for transitional child care and $228 for other non-JOBS child care.17 These transi-tional and other non-JOBS child care costs were far higher than those in the three sites previ-ously studied as part of this evaluation.
The variations in child care costs per program group member can largely be explained by three factors: the average cost of a month of service, the average number of months of support services, and the percentage of persons who ever received the support services. Transitional and other non-JOBS child care payments to program group members were both about $400 per month, well above the JOBS child care payments, which averaged $252 per month. These pay-ments may have been higher than JOBS payments for three reasons. First, program staff sug-gested that sample members with jobs may have required more hours of child care per month than did sample members who attended JOBS program activities. Second, program staff also suggested that sample members whose friends or relatives provided child care while they were in JOBS may have switched to more expensive licensed home care or established day care after ob-taining jobs, perhaps in response to a more inflexible schedule with longer hours away from home. As will be discussed in Chapter 5, Portland’s program did produce a large impact in full-time employment and average hours worked, which supports the first explanation above. Finally, as discussed in Chapter 2, the maximum allowable child care payment rates were higher in Port-land than in Atlanta and Grand Rapids, although they were somewhat lower than in Riverside.
Although transitional and other non-JOBS child care average monthly payments were higher than JOBS payments, a smaller percentage of program group members received these services, thus reducing the cost of transitional child care to $570 per person and of other non-JOBS child care to $228 compared with $624 for JOBS child care. Nonetheless, in contrast to other sites studied as part of this evaluation, sample members received transitional or other non-JOBS child care at a very high rate in Portland; one sample member in four received one of these types of payments within two years after orientation, whereas, on average, only one sample member in 20 received non-JOBS child care in Atlanta and Grand Rapids.18
An important factor behind Portland’s high support service costs was that, like Grand Rapids, Portland required AFDC recipients with children as young as age 1 to participate in JOBS, whereas the requirement extended only to recipients with children aged 3 or over in At-lanta and Riverside. Forty-one percent of sample members in Portland had a child under age 3 at random assignment. Appendix Table E.1 presents costs for program group members whose youngest child was under age 3 and for those whose youngest child was 3 or over at random as-signment. Program group members whose youngest child was under age 3 at random assignment had higher average monthly payments, received payments for a longer length of time, and had higher rates of receipt than those without such a child. Total JOBS and non-JOBS child care costs per program group member whose youngest child was under age 3 were, on average, over
17A very small portion of child care payments were made in lieu of AFDC. These payments were not included
in this analysis but are captured in the form of increased AFDC payments presented in Chapter 5. It is estimated that 1 percent of all child care payments were of this type.
18This percentage was not calculated for Riverside because of data limitations.
-79-
$1,200 higher than those whose youngest child was age 3 or over at random assignment.
Even program group members whose youngest child was age 3 or over at random as-signment had a higher average rate of child care receipt than sample members in Atlanta, Grand Rapids, or Riverside. Two main factors may have contributed to Portland’s high rate of child care receipt. The first is the philosophy of the welfare department and Steps to Success staff members on child care. As discussed in Chapter 2, staff in Portland strongly emphasized the im-portance of child care and tried to ensure that everyone eligible would receive it. Second, as was discussed in Chapter 2, Portland’s administrative system may have been better equipped to meet clients’ needs for transitional child care than programs previously studied because of its use of integrated case management. Portland’s high rate of transitional child care receipt supports this hypothesis.
B. Non-JOBS Expenditures by Non-Welfare Agencies (Figure 4.1, Box 5)
Table 4.2 (column 5) shows that the non-JOBS, non-welfare agency cost per program group member was $822 in Portland. These expenditures cover education and training activities that were unapproved by program staff and activities that occurred after sample members had left JOBS.
C. Total Non-JOBS Cost (Figure 4.1, Box 6)
Table 4.2 (column 6) shows that the total non-JOBS cost for Portland was $1,647. This is the highest non-JOBS cost of any of the JOBS sites previously studied as part of this evaluation, a result of Portland’s unusually high non-JOBS child care costs.
IV. Gross Cost per Program Group Member (Figure 4.1, Box 7)
The gross cost per program group member was determined by adding the JOBS-related cost (Box 3) to the non-JOBS related cost per program group member (Box 6). This estimate is important because it represents the costs of all services, both JOBS and non-JOBS, that have the potential to increase program group members’ long-term earnings and reduce their use of wel-fare. This total investment must be compared to the total gross cost per control in order to deter-mine the government’s net investment per program group member and, in a future benefit-cost analysis, the net payoff of that investment.
Portland’s total gross cost per program group member was $4,027 for the two years fol-lowing random assignment; 59 percent of this cost was JOBS-related. JOBS-related costs made up slightly less of the total gross cost per program group member in Portland than in other pro-grams because of the large non-JOBS support service expenditures. Of the total gross cost per program group member, 65 percent was funded by the welfare department, with the remainder being picked up by non-welfare agencies. This percentage is higher than in the six programs pre-viously studied in the NEWWS Evaluation. The share of gross costs paid by the welfare depart-ment in these programs ranged from 64 percent in the Atlanta LFA program to 24 percent in the Grand Rapids LFA program and averaged 44 percent across the LFA and HCD programs. The percentage of gross costs paid by Portland’s welfare department is high because the department

-80-
paid for job search, basic education, and a small percentage of vocational training and college services through its contract with Mt. Hood Community College, and, again, because Portland’s support service expenditures were high compared with the other six programs. The other six pro-grams generally relied on non-welfare agencies to finance education, training, and (in Grand Rapids) job search services.
V. Gross Cost per Control Group Member
Many control group members enrolled in education activities on their own initiative. In addition, control group members were eligible for non-JOBS support services from the welfare department for their self-initiated activity. Therefore, the gross cost per control includes expendi-tures by the welfare department and non-welfare agencies. This cost serves as a benchmark against which the gross cost per program group member is compared in order to determine the net cost per program group member.
A. Welfare Department Cost (Figure 4.1, Box 8)
Control group members were eligible to receive child care for education and training ac-tivities that they participated in on their own and could receive work-related transitional and other non-JOBS child care (described in section III). Table 4.4 (column 2) shows that welfare department support service costs were $590 per control group member.
B. Non-Welfare Agency Cost (Figure 4.1, Box 9)
Table 4.4 (column 2) shows that the total non-welfare agency cost for control group members in Portland was $1,420. Much of this cost was for basic education ($303) and voca-tional training and college ($1,042).
Since close to half as many control group members as program group members had ever participated in basic education, one would expect that the cost would be half as much for the control group as for the program group. Instead, the basic education cost per control group mem-ber is nearly two-thirds as high as the cost per program group member. The reason is that control group members participated in very expensive basic education through the community colleges, at $10.56 per scheduled hour, while program group members participated in less expensive basic education courses through Steps to Success.19 Basic education at Steps to Success may have been less expensive than at the community colleges for two primary reasons. First, Steps to Suc-cess
19It is not possible to directly compare the basic education unit costs of Steps to Success and regular community
college courses because the time units differ and because Steps to Success costs include the cost of case manage-ment, but to get an idea, the cost of attending basic education through the community college system in Portland can be translated into roughly $449 per month and the cost of attending basic education plus case management through Steps to Success was $231 per month (Table 4.1, column 1). Given that this cost is much lower than the cost of ba-sic education at the community colleges, and that some unknown portion of this cost is case management rather than service provision expenditures, it is reasonable to assert that the unit cost of basic education through Steps to Suc-cess is low compared to the basic education offered through community colleges.

-81-
Table 4.4
National Evaluation of Welfare-to-Work Strategies
Estimated Total Gross Costs and Net CostsWithin Two Years After Orientation (in 1993 Dollars) for the Full Sample, and by
High School Diploma/GED Status
Portland JOBS Program
Total Gross Cost Total Gross Cost Net Costper Program Group per Control Group per Program Group
Activity and Sample Member ($) Member ($) Member ($)
Full Sample
Orientation and assessment 134 0 134Job searcha 421 42 379Basic education 488 303 185Vocational training and
college 1,221 1,042 179Work experience 222 33 189Subtotal (operating) 2,486 1,420 1,066
Child care 1,422 565 856Child care administrationb 48 19 29Other support services 71 6 66Total 4,027 2,010 2,017
Respondents with a High School Diploma or GED
Orientation and assessment 134 0 134Job search 427 38 388Basic education 268 17 251Vocational training and
college 1,576 1,560 16Work experience 177 36 141Subtotal (operating) 2,581 1,652 930
Child care 1,515 710 805Child care administrationb 51 24 27Other support services 72 5 67Total 4,219 2,391 1,829
(continued)

-82-
Table 4.4 (continued)
Total Gross Cost Total Gross Cost Net Costper Program Group per Control Group per Program Group
Activity and Sample Member ($) Member ($) Member ($)
Respondents Without a High School Diploma or GED
Orientation and assessment 134 0 134Job search 387 46 341Basic education 974 882 92Vocational training and
college 599 175 424Work experience 299 22 277Subtotal (operating) 2,393 1,125 1,268
Child care 1,241 320 921Child care administrationb 42 11 31Other support services 69 7 63Total 3,745 1,463 2,283
SOURCES: See Table 4.2.
NOTES: Rounding may cause slight discrepancies in calculating sums. aFor program group members, this measure includes participation in life skills training and initial work search. bAdministrative costs for the determination of child care needs and payment issuance were estimated as a percentage of the value of the payments, i.e., by dividing total administrative costs by total payments. It was estimated that for each dollar of payments, there were three cents of administrative costs. In other words, child care administrative costs were 3 percent of total payments.

-83-
did not employ full-time instructors and thus, on average, its instructors received lower salaries and much lower benefit packages than community college instructors. Second, program group members could enroll in and exit Steps to Success basic education courses at any time. While class sizes under the traditional term system used by the community colleges were likely to di-minish as the term progressed, the Steps to Success program, because of its open enrollment and exit system, may have been better able to maintain class sizes throughout the term. In this situa-tion, fixed costs would have been spread across a greater number of students, thus reducing the average cost per person.20
Control group vocational training and college costs were high because control group members were more likely to attend proprietary schools, which were slightly more expensive than community colleges, resulting in a higher control group than program group unit cost for this activity (see Table 4.1), and because the average length of stay in vocational training and college for control group members was only slightly lower than for program group members.21
C. Total Gross Cost per Control Group Member (Figure 4.1, Box 10)
The total gross cost per control group member in Portland was $2,010 (Table 4.4, column 2). This cost is $363 higher than the average in Atlanta, Grand Rapids, and Riverside because of the high unit cost of basic education taken through community colleges, control group participa-tion in vocational training and college, and substantial JOBS and non-JOBS child care expendi-tures made by the welfare department.
VI. Net Cost per Program Group Member (Figure 4.1, Box 11)
Table 4.4 (column 3) presents the net cost per program group member, calculated by sub-tracting the gross cost per control (Box 10) from the gross cost per program group member (Box 7). The net cost per program group member in Portland was $2,017 (Box 11). While this cost is higher than the average net cost per program group member in the Atlanta, Grand Rapids, and Riverside LFA programs ($1,550), it is far lower than the average net cost in their HCD pro-grams ($3,077).
The total net cost per program group member can be divided between the net cost to the welfare department and the net cost to non-welfare agencies. The net cost to Portland’s welfare department was $2,014. The net cost to non-welfare agencies was $3. This dramatic difference can be explained by the fact that Portland’s welfare department in effect diverted program group members away from services that would have been provided by non-welfare agencies to services provided by the welfare department — namely, through Steps to Success and other contracted services. The transfer of program group members away from non-welfare agency activities to activities paid for by the welfare department meant that control group members, whose participa-tion in activities was paid for exclusively by non-welfare agencies, incurred a large part of non-
20Information on the differences between community college and Steps to Success basic education course struc-
ture and instructor benefits was provided by Mt. Hood Community College and Steps to Success staff. 21See Table 3.4 (columns 4 and 5).
-84-
welfare agency costs and a small part of welfare agency costs. This distribution of expenditures resulted in a very small net non-welfare agency cost and a relatively large welfare department cost.
VII. Education Attainment Subgroups
Table 4.4 (lower panels) presents costs for sample members who entered the program with and without a high school diploma or GED. In Portland, gross costs were higher for the subgroup with a high school diploma or GED (graduates) than for those without such a creden-tial (nongraduates) for both program and control group members. Graduates had higher gross costs than non-graduates primarily because they were more likely to participate in relatively ex-pensive vocational training and college and had higher support service costs because they re-ceived substantially more transitional and other non-JOBS child care than those without such a credential. This finding is probably a reflection of the fact that graduates were more likely than nongraduates to find a job within the two-year follow-up period, and thus would have been eligi-ble for employment-related day care (see Chapter 5).
Although gross costs for both program and control group members with a high school di-ploma or GED were higher than for nongraduates, the reverse was true for net costs; that is, the net cost for graduates ($1,829) was lower than for nongraduates ($2,283). There are two primary reasons for this: First, on average, control group graduates were more likely to participate in ac-tivities than control group nongraduates (with the exception of basic education) and, perhaps by virtue of their higher participation rates and greater employability, incurred higher child care costs. In fact, had not program group members received case management in addition to educa-tional services, the net cost of vocational training and college would have been negative because control group graduates actually spent more time in vocational training and college than program group graduates.22 Second, program group graduates were less likely than nongraduates to have participated in work experience whereas control group graduates were slightly more likely than nongraduates to have participated in this activity. These two factors tended to decrease the net cost per program group graduate relative to the net cost per program group nongraduate.
22See Appendix Table D.4 for participation by high school diploma/GED status.

-85-
Chapter 5
Impacts of the Portland JOBS Program
This chapter describes the two-year impacts of the Portland JOBS program on employ-ment, average earnings, AFDC and Food Stamp payments, and the combined income from these three sources. Data from the client survey are used to estimate program effects on additional sources of income for sample members and their households at the end of two years. As men-tioned previously, sample members were randomly assigned to either a program or control group.1 Averages for control group members represent outcomes that are expected to occur in the absence of the Portland program. Randomization ensures that program/control differences in out-comes measured during the follow-up period can be attributed with confidence to effects of the JOBS program. Unless otherwise stated, program/control differences discussed in this chapter are statistically significant.2
I. Key Findings
• Over two years, the Portland JOBS program produced unusually large earn-ings gains and substantial AFDC reductions for all segments of the caseload. The program also decreased average Food Stamp payments by a moderate amount.
• Impacts on employment, earnings, and public assistance are likely to persist in the third year of follow-up.
• Two-year earnings gains for program group members were offset by losses in AFDC and Food Stamps. At the end of the second year of follow-up, how-ever, the program increased the combined income from these three sources.
• Program group members in Portland got better jobs, on average, than control group members: the program substantially increased full-time employment and average hourly pay and increased the proportion of individuals with em-ployer-provided health insurance.
1During the early portion of the random assignment period, individuals had an equal chance of being assigned
to either the program group or the control group. On September 1, 1993, the random assignment ratio changed to restrict the size of the control group, because recipients were being randomly assigned more quickly than originally anticipated. From this date, three out of four individuals were assigned to the program group, and one was assigned to the control group. Assignment to research groups remained a random process, because only chance determined who fell into which group. The regression model used to generate program impact estimates was designed to com-pensate for the change in random assignment ratio.
2A two-tailed t-test was applied to differences between outcomes for the program and control groups. Differ-ences are considered statistically significant if there is less than a 10 percent probability that they occurred by chance.

-86-
• Program group members incurred a small, not statistically significant, reduc-tion in health insurance coverage.
II. Analysis Issues
As discussed in Chapter 3, the Portland JOBS program produced a large gain in the use of job search services across the entire sample and a smaller gain in the use of basic education services and work experience programs for sample members who lacked a high school diploma or GED at random assignment (also referred to as “nongraduates”). Results for previously evalu-ated programs that emphasized job search, such as the labor force attachment programs in Grand Rapids, Michigan, and Riverside, California, suggest that the Portland program should boost employment quickly. These employment gains may persist in the second year of follow-up if program group members either retain their current jobs or acquire new jobs, but may decline if jobs are lost or control group employment levels rise. The impacts on participation in basic edu-cation and work experience suggest that employment and earnings gains for program group members without a high school diploma or GED could be delayed as classwork or unpaid work prevents them from entering the labor market immediately. Toward the end of the first year of follow-up, however, nongraduates in the Portland JOBS program could start earning more than their control group counterparts if they obtain more jobs or better jobs as a result of their creden-tials. Impacts for nongraduates would be expected to increase in the second year, as new skills enable them to advance more rapidly in their jobs.
In this chapter, the effects of the Portland JOBS program are estimated for all sample members from quarterly unemployment insurance (UI) records and monthly AFDC and Food Stamp payments from the Oregon Department of Human Resources automated tracking system. These data are statewide and include earnings and welfare payments for sample members who moved to other parts of Oregon.3
UI earnings data are collected by calendar quarter: January through March, April through June, July through September, and October through December. For the research, the quarter dur-ing which a sample member is randomly assigned is designated quarter 1. The first follow-up year (referred to as year 1) covers quarters 2 through 5, the second year (year 2) covers quarters 6 through 9, and so forth. Monthly AFDC and Food Stamp payments were grouped into quarters and years covering the same time periods as earnings quarters and years.
Two years of administrative records data are available for all 5,547 sample members. An early cohort, randomly assigned between February and December 1993 and composing about 60 percent of the full sample, has data through the end of year 3. Under the assumption that its ex-perience will be similar to that of the rest of the sample,4 this early cohort will be used on occa-
3Portland lies across the Columbia River from Washington State. Oregon UI records do not include earnings
data for sample members who worked in Washington; however, there is no reason to believe that any systematic program-control differences in underreporting occurred, so impacts should not have been very much affected.
4This assumption is based on the fact that two-year results for the early cohort are similar to two-year results for the rest of the sample.

-87-
sion to examine probable program effects for the full sample in the third year of follow-up.
Additional estimates of program effects were obtained from client survey responses for 610 program and control group members who entered the evaluation between March 1993 and February 1994. Interviews were conducted about two years after random assignment.
III. Impacts on Attainment of Education or Training Credentials
Employment-focused programs typically do not increase receipt of education or training credentials; nor do mixed services programs that, like the Portland program, produce only small-to-moderate increases in participation in education activities. Nevertheless, the Portland program produced large impacts on both GED and trade license receipt for those without a high school diploma or GED at study entry. As shown in Table 5.1, more than 26 percent of program group members in this subgroup received an education or training credential during the follow-up pe-riod, a gain of 19 percentage points compared to control group levels. About 16 percent received a GED, and 16 percent received a trade license or certificate, an 11 percentage point and 12 per-centage point gain, respectively.5
Portland’s impacts on GED receipt are comparable to those of the Grand Rapids and Riv-erside human capital development programs studied as part of the National Evaluation of Wel-fare-to-Work Strategies.6 Moreover, the impacts on trade license receipt are among the largest found in previous studies of welfare-to-work-programs. It is also important to note that the Port-land program increased receipt of education or training credentials by only about 3 percentage points (not statistically significant) during the two-year follow-up period for sample members who already had a high school diploma or GED at the time of random assignment.
IV. Impacts on Employment and Earnings
Over two years of follow-up, 60.9 percent of control group members worked for pay compared with 72.0 percent of program group members, a difference of 11.2 percentage points. (See Table 5.2.) This impact represents the effect of JOBS in promoting employment among sample members who would not have become employed on their own. Stated another way, more than one control group member in four who did not work during the follow-up would have found work at some point with the help of JOBS.7
The Portland JOBS program boosted average two-year earnings by $1,842 above the
5Some respondents received both a GED and a trade license or certificate. No respondents received a high
school diploma. 6See Hamilton et al., 1997, Table 10.1. 7Among controls who remained jobless over the two-year follow-up period, the proportion who would have be-
come employed with the help of JOBS is estimated by first subtracting the percentage of program group members who remained without employment (100 percent - 72.0 percent = 28.0) from the percentage of jobless control group members (100 percent - 60.9 percent = 39.1): 39.1 - 28.0 = 11.1. Then this difference is divided by the percentage of jobless control group members: 11.1 ÷ 39.1 = 28.4 percent.

-88-
Table 5.1
National Evaluation of Welfare-to-Work Strategies
Impacts on Education or Training Credentials at the End of Two Yearsfor Respondents, by High School Diploma/GED Status at Study Entry
Portland JOBS Program
Outcome MeasureProgram
GroupControl Group
Difference (Impact)
Percentage Difference
(%)
Respondents Without a High School Diploma or GED
Received any education or training credentials (%) 26.5 7.9 18.7 *** 236.9
Received a high school diploma or GED (%) 15.6 4.9 10.8 ** 221.7
Received a trade license or certificate (%) 15.5 3.0 12.4 ** 409.1
Sample sizea 97 92
Respondents With a High School Diploma or GED
Received any education or training credentials (%) 14.5 11.4 3.1 0.0 26.8
Received a trade license or certificate (%) 10.4 7.0 3.5 0.0 49.7
Sample sizea 199 216
SOURCE: MDRC calculations from the Two-Year Client Survey.
NOTES: Measures in this table represent weighted averages. Respondents were weighted to replicate the proportion of program and control group members in the larger impact sample. Estimates are regression-adjusted using ordinary least squares, controlling for pre-random assignment characteristics of sample members. "Percentage difference" equals 100 times "difference" divided by "control group." Rounding may cause slight discrepancies in calculating sums and differences. A two-tailed t-test was applied to differences between outcomes for the program and control groups. Statistical significance levels are indicated as: * = 10 percent; ** = 5 percent; and *** = 1 percent. aSix individuals in the full sample did not indicate whether they had a high school diploma or GED at random assignment. These individuals are excluded from the subgroup analysis.

-89-
Table 5.2
National Evaluation of Welfare-to-Work Strategies
Two-Year Impacts on Employment, Earnings, AFDC, Food Stamps, and Combined Income
Portland JOBS Program
PercentageProgram Control Difference Difference
Outcome Group Group (Impact) (%)
Ever employed (%)Years 1-2 72.0 60.9 11.2 *** 18.3
Average quarterly employment rate (%)Years 1-2 41.7 32.6 9.2 *** 28.2Year 1 38.0 30.0 8.0 *** 26.7Year 2 45.5 35.1 10.4 *** 29.5
Average total earnings ($)Years 1-2 7,133 5,291 1,842 *** 34.8Year 1 2,758 2,108 650 *** 30.9Year 2 4,374 3,183 1,192 *** 37.4
If ever employed in years 1-2 Total number of quarters employed 4.63 4.28 0.36 a 8.3Quarter of first employment 3.64 3.81 -0.17 a -4.5
Average earnings per quarter employed ($)Years 1-2 2,136 2,032 105 a 5.2
Ever received any AFDC payments (%)Years 1-2 93.5 93.8 -0.3 -0.3Last quarter of year 1 60.3 69.7 -9.4 *** -13.5Last quarter of year 2 41.3 53.1 -11.8 *** -22.2
Average number of months receivingAFDC payments
Years 1-2 13.12 15.54 -2.42 *** -15.6First AFDC spell 11.34 14.14 -2.79 *** -19.8
Average total AFDC payments received ($)Years 1-2 5,818 7,014 -1,196 *** -17.1Year 1 3,569 4,040 -471 *** -11.6Year 2 2,249 2,974 -726 *** -24.4
Average AFDC payment per monthreceived ($)
Years 1-2 444 452 -8 a -1.8
(continued)

-90-
Table 5.2 (continued)Percentage
Program Control Difference DifferenceOutcome Group Group (Impact) (%)
Ever received any Food Stamp payments (%)Years 1-2 93.3 94.2 -0.9 -0.9Last quarter of year 1 71.3 77.6 -6.3 *** -8.1Last quarter of year 2 58.5 63.8 -5.3 *** -8.4
Average number of months receivingFood Stamp payments
Years 1-2 16.04 17.46 -1.43 *** -8.2
Average total Food Stamp payments received ($)Years 1-2 3,935 4,391 -456 *** -10.4Year 1 2,220 2,422 -202 *** -8.3Year 2 1,716 1,969 -253 *** -12.9
Average Food Stamp payment per monthreceived ($)
Years 1-2 245 251 -6 a -2.4
Employed and not on AFDC (%)Last quarter of year 2 33.3 24.0 9.2 *** 38.3
Not employed and on AFDC (%)Last quarter of year 2 28.4 41.7 -13.3 *** -31.9
Employed and on AFDC (%)Last quarter of year 2 12.9 11.3 1.6 * 13.8
Not employed and not on AFDC (%)Last quarter of year 2 25.4 22.9 2.5 ** 11.1
Average combined income ($)b
Years 1-2 16,886 16,696 191 1.1
Average combined income at or above poverty level (%)b
Year 2 20.6 16.6 4.0 *** 24.1
Sample size (total=5,547) 3,529 2,018
NOTES: Unless shown in italics, dollar averages include zero values for sample members not employed and for sample members not receiving welfare. Estimates are regression-adjusted using ordinary least squares, controlling for pre-random assignment characteristics of sample members. Rounding may cause slight discrepancies in calculating sums and differences. Italicized estimates cover only periods of employment or AFDC/Food Stamp receipt. Differences between program group members and controls for such "conditional" estimates are not true experimental comparisons. For all measures, the quarter of random assignment refers to the calendar quarter in which random assignment occurred. Because quarter 1, the quarter of random assignment, may contain some earnings and AFDC payments from the period prior to random assignment, it is excluded from follow-up measures. Thus, "year 1" is quarters 2 through 5, "year 2" is quarters 6 through 9, and so forth. "Percentage difference" equals 100 times "difference" divided by "control group." A two-tailed t-test was applied to differences between outcomes for the program and control groups. Statistical significance levels are indicated as: * = 10 percent; ** = 5 percent; and *** = 1 percent. aNot a true experimental comparison; statistical tests were not performed. b"Combined income" is income from earnings, AFDC, and Food Stamps.
SOURCES: MDRC calculations from Oregon unemployment insurance (UI) earnings records, AFDC and Food Stamp records.

-91-
control group mean of $5,291. This increase exceeds the two-year earnings impacts of the other 10 programs in the NEWWS Evaluation and approaches the magnitude attained by the most suc-cessful mandatory welfare-to-work initiatives, such as the Riverside GAIN program as imple-mented in the late 1980s.8
A. Employment and Earnings Over Time
Program group members achieved employment gains early in the follow-up, averaging 8 percentage points from quarters 2 through 5. (See Appendix Table F.1.) This rapid onset of im-pacts is consistent with an employment-focused approach. Employment-focused programs, how-ever, often achieve their largest impacts in year 1 and then become less effective over time. The Portland JOBS program did not follow this pattern. Differences in employment grew dramati-cally throughout the follow-up and remained at their peak of 11 percentage points in quarter 9, when 46.1 percent of program group members had a job as opposed to 35.4 percent of control group members. During this last quarter of follow-up, program group members earned $1,155 on average, $309 more than the control group mean. (See Figure 5.1.) These results suggest that the Portland program might serve as a good model for TANF programs that must aim to produce large employment impacts around the two-year mark.
The quarterly trends described above suggest that employment and earnings impacts for the full sample will almost certainly persist into year 3. Three-year results for the early cohort lend support to this prediction: in each of quarters 10 through 12, program group members achieved an employment gain of 12 percentage points. (See Appendix Table F.2.) Earnings gains grew larger in year 3 and peaked in quarter 11. In quarter 13, they were still statistically signifi-cant at $341. A slight dip in employment and earnings impacts for quarters 12 and 13 suggests that impacts may decline somewhat in year 4 but are likely to remain solid.
B. Job Quality
Earnings impacts can result from various program effects. Welfare-to-work programs may help some welfare recipients find employment who would have otherwise remained jobless, thereby increasing average program group earnings relative to the control group. This effect is measured by the impact on the percentage ever employed, discussed above. In addition, welfare-to-work programs may enable welfare recipients to find better jobs — longer-lasting and higher-paying — than they would have obtained on their own.
Table 5.2 presents two measures of job quality for employed sample members: “total number of quarters employed” and “average earnings per quarter employed” over two years of
8For impacts of the LFA and HCD approaches in Atlanta, Grand Rapids, and Riverside, see Hamilton et al.,
1997. Impacts of the Columbus, Detroit, and Oklahoma City programs are presented in Brock and Harknett, 1998; Knab and Freedman, 1996a; and Knab and Freedman, 1996b, respectively. Some results in these publications are for partial evaluation samples. A forthcoming report will present two-year impacts for the full samples in all 11 pro-grams in the NEWWS Evaluation.
As indicated in Riccio, Freedman, and Friedlander, 1994, Riverside GAIN boosted two-year earnings by $2,103. Because of inflation and differing costs of living, a dollar increase for Riverside GAIN has a higher value than a dollar increase for the Portland JOBS program. Consequently, their earnings gains cannot be directly com-pared with total precision.

Earnings
-500
50100150200250300350400
Q1 Q2 Q3 Q4 Q5 Q6 Q7 Q8 Q9 Q10 Q11 Q12 Q13Quarters
Impa
cts (
$)
Full SampleEarly Cohort
AFDC Payments
-400
-300
-200
-100
0
100
Q1 Q2 Q3 Q4 Q5 Q6 Q7 Q8 Q9 Q10 Q11 Q12 Q13
Quarters
Impa
cts (
$)
Full SampleEarly Cohort
NOTE: An early cohort, randomly assigned between February and December of 1993 and composing about 60 percent of the full sample, has data through the end of year 3.
SOURCES: MDRC calculations from Oregon unemployment insurance (UI) earnings and AFDC records.
Figure 5.1
National Evaluation of Welfare-to-Work Strategies
Quarterly Impacts on Earnings and AFDC Payments
Portland JOBS Program

-93-
follow-up. Differences between employed program and control group members are nonexperi-mental comparisons, because employed program group members may differ from employed con-trol group members in observed and unobservable pre-random assignment characteristics. As a consequence, any differences observed during the follow-up period may be caused by pre-existing differences rather than by the program. Nevertheless, a positive difference in number of quarters employed would suggest that the program helped employed sample members work more during the follow-up period, either because they found work sooner or because they found jobs that lasted longer. Similarly, a positive difference between the average earnings per quarter for employed program group members and employed control group members would suggest that the program helped sample members find jobs with higher hourly wages, longer weekly hours, or more weeks of employment in a quarter, all indications of better job quality.
In Portland, earnings impacts appeared to result from a combination of effects on job finding, employment duration, and earnings on the job, with job finding the most important fac-tor. As shown in Table 5.2, employed program group members worked about a month longer (0.36 quarters) on average and earned about 5 percent more per quarter than control group mem-bers who found jobs on their own. As shown in Figure 5.2, however, the main contribution ($970), a little more than half the two-year earnings impact, came from job finding.9 Greater du-ration of employment contributed about a fourth ($441), and higher earnings on the job about a seventh ($273). This figure thus illustrates that program group members earned more on average than control group members mainly because more of them were working and somewhat less be-cause those who would have been working anyway (that is, without the program) obtained better jobs. Better job quality did, however, make a major contribution, accounting for nearly 40 per-cent of the total impact on earnings. This result is relatively uncommon for welfare-to-work pro-grams prior to JOBS and is not found for all employment-oriented JOBS programs.10
1. Employment Stability. This section presents impacts on two measures of em-ployment stability: the percentage of recipients employed in all four quarters of year 2 and the percentage who earned more than $10,000 in year 2 (these impacts are not shown in tables). Like “total number of quarters employed,” discussed above, the former measure reveals how the Port-land JOBS program influenced the length of time that individuals remained employed. The latter measure reflects employment stability in that sample members who earned over $10,000 in a single year probably worked for a substantial part of that year. Also, this level of earnings, as opposed to a lesser amount, would most likely have provided greater incentive for sample mem-bers to retain their jobs.
9The decomposition discussed in the text is not exact. It is based on the approximate mathematical equivalence
of the “percentage difference” in average total earnings to the sum of the percentage differences in “ever em-ployed,” “total quarters employed if employed,” and “average earnings per quarter employed.” The contribution of each effect may be obtained by dividing its percentage difference by the percentage difference in average total earn-ings. Thus, for example, the contribution of “ever employed” is 18.3 divided by 34.8, or 52.6 percent. The sum of all three contributions does not equal 100 percent because a small portion of the earnings impact is attributable to interactions among the components. One can also express each contribution in dollars by multiplying the two-year earnings impact by each percentage.
10In Riverside, for example, the LFA program did not improve job quality for its enrollees (Hamilton et al., 1997).
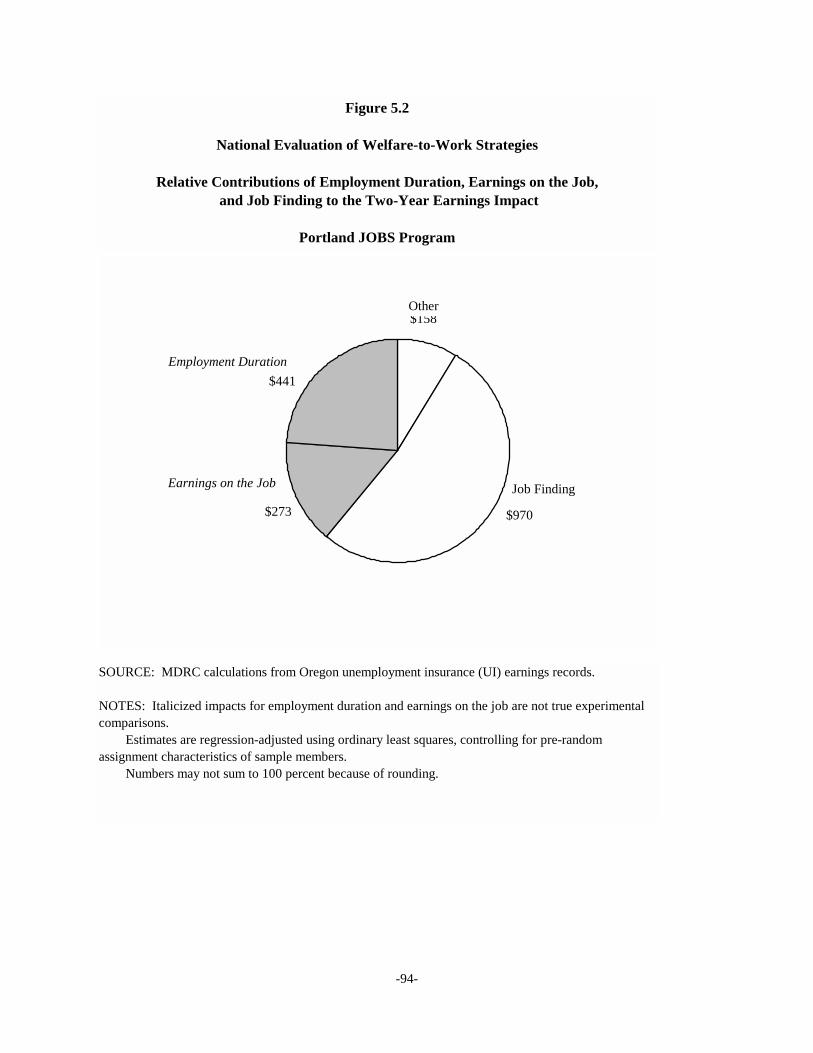
-94-
$441
$273 $970
$158
Figure 5.2
National Evaluation of Welfare-to-Work Strategies
Relative Contributions of Employment Duration, Earnings on the Job, and Job Finding to the Two-Year Earnings Impact
Portland JOBS Program
SOURCE: MDRC calculations from Oregon unemployment insurance (UI) earnings records.
NOTES: Italicized impacts for employment duration and earnings on the job are not true experimental comparisons. Estimates are regression-adjusted using ordinary least squares, controlling for pre-random assignment characteristics of sample members. Numbers may not sum to 100 percent because of rounding.
Other
Employment Duration
Earnings on the Job Job Finding

-95-
In the second year of follow-up, 20.9 percent of all control group members worked for pay in every quarter, and 12.4 percent earned more than $10,000 (regardless of the number of quarters worked). The Portland program increased these levels by 7.9 and 5.7 percentage points, respectively. These impacts make up part of the 12.5 percentage point total impact on employ-ment, and they can be compared directly to this impact. Such a comparison indicates that almost two-thirds of the total employment gain for all program group members in year 2 is attributable to a rise in stable employment (over one-third is due to a rise in employment lasting less than four quarters), and just under half of the gain resulted from program group members finding work in a higher earnings bracket.11
Recipients who have difficulty getting a job on their own often find unstable and low-paying employment, even with help from a welfare-to-work program. Consequently, programs that raise overall employment, thus enabling those who would have remained jobless without the program to find work, are expected to decrease the proportion of employed enrollees in long-lasting and high-paying jobs. The opposite result occurred in Portland, however. Among those who worked for pay in year 2, the program increased the proportion employed in all four quar-ters from 42.2 to 46.4 percent and the proportion with $10,000 or more in annual earnings from 25.0 to 29.2 percent. 12
2. Job Characteristics. Survey respondents reported specific information about the jobs that they held at the end of two years, including average hours worked per week, average hourly and weekly pay, and whether their job provided health insurance. These data provide fur-ther evidence that program group respondents were more likely to find better jobs (that is, full-time and higher-paying jobs) than control group respondents.
Consistent with the findings from the administrative records, program group respondents achieved unusually large employment gains (14.9 percentage points) at the end of two years. As shown in Table 5.3, the impact on employment occurred primarily because a larger percentage of program group members were working at full-time jobs that provided at least 30 hours per week of work. (The impact on full-time employment was almost as large as the impact on employ-ment.) Program group respondents who were employed, however, were only slightly more likely to work full time than employed control group respondents and average hours worked per week were no different. At the same time, the program increased hourly pay (by $0.86, or 13 percent) among those employed, indicating that, on average, employed program group respondents had higher-paying jobs than employed control group respondents.
Further, the program increased the proportion of recipients who found jobs with health benefits by 10.1 percentage points, an effect that was about two-thirds as large as the impact on
11The impact on employment in all four quarters of year 2 (7.9 percentage points) divided by the year 2 em-
ployment gain (12.5 percentage points) equals 63.2 percent. Applying this formula to the impact on the percentage earning more than $10,000 in year 2 yields 45.8 percent.
12Results for a subgroup of “most disadvantaged” recipients support this finding (see section VII for a defini-tion of this subgroup). The Portland program increased the percentage of most disadvantaged sample members who were employed in all four quarters of year 2 from 7.1 to 15.6 (a difference of 8.5 percentage points) and the per-centage earning over $10,000 in year 2 from 3.7 to 6.6 (a difference of 3.0 percentage points). These impacts are not shown in tables.

Table 5.3
National Evaluation of Welfare-to-Work Strategies
Impacts on Job Characteristics at the End of Two Years for All Respondents and Those Employed at Interview
Portland JOBS Program
All Respondents Among Those Employed at Interview
Outcome MeasureProgram
GroupControl Group
Difference (Impact)
Percentage Difference
(%)Program
GroupControl Group Difference
Percentage Difference
(%)
Employed at interview (%) 49.6 34.7 14.9 *** 42.8 -- -- -- --
Average hours worked 17.5 12.6 4.9 *** 38.6 35.3 36.4 -1.1 -2.9
Average weekly pay ($) 128.80 83.04 45.76 *** 55.1 259.77 239.14 20.63 8.6
Average hourly pay ($) 3.64 2.25 1.39 *** 61.7 7.34 6.48 0.86 13.2
Employed full-time (%) 39.9 26.9 13.0 *** 48.1 80.4 77.5 2.9 3.7
Have employer-provided health insurance (%) 24.4 14.3 10.1 *** 70.3 49.2 41.2 7.9 19.3
Sample size (total=610) 297 313 (varies) (varies)
0SOURCE: MDRC calculations from the Two-Year Client Survey.
NOTES: Measures in this table represent weighted averages. Respondents were weighted to replicate the proportion of program and control group members in the larger impact sample. Estimates are regression-adjusted using ordinary least squares, controlling for pre-random assignment characteristics of sample members. "Percentage difference" equals 100 times "difference" divided by "control group." Differences between program group members and control group members (shown in italics) for "Among Those Employed at Interview" are not true experimental comparisons. Rounding may cause slight discrepancies in calculating sums and differences. A two-tailed t-test was applied to differences between outcomes for the program and control groups. Statistical significance levels are indicated as: * = 10 percent; ** = 5 percent; and *** = 1 percent.

-97-
employment. The difference between the impact on employment and the impact on employer-provided health care coverage indicates that not all who became employed found a job that pro-vided health care coverage. Nevertheless, the number who found a job with health care coverage was enough to make the share of employed persons covered greater in the program group than in the control group (that is, 24.4 percent out of 49.6 percent versus 14.3 percent out of 34.7 per-cent).
V. Impacts on Public Assistance
This section summarizes the impact of the Portland JOBS program on the receipt of two forms of public assistance: AFDC and Food Stamps. It presents program/control differences in the average number of months of receipt, in the percentage of sample members still receiving each type of assistance at the end of year 2, and in average total payments.
A. AFDC Receipt
Portland’s employment and earnings gains were accompanied, not surprisingly, by large decreases in cash assistance receipt. Over a two-year period, control group members received AFDC for an average of 15 1/2 months. (See Table 5.2.) The Portland program reduced this level for program group members by almost 2 1/2 months, a decrease of 16 percent relative to the con-trol mean. This impact acquires particular importance in light of the time limits on federal cash assistance. Programs that shorten the amount of time that their registrants receive assistance de-crease the chances of the limits being reached.
In quarter 9, 41.3 percent of sample members in the Portland JOBS program received a welfare check compared with 53.1 percent of control group members, a statistically significant difference of 11.8 percentage points. The strength of this impact suggests that the program will reduce AFDC receipt during the third year of follow-up. For the early cohort, percentage reduc-tions grew larger in each quarter of year 3 as both program and control group members contin-ued to leave assistance. (See Appendix Table F.2.) Less than a third of program group members were on the rolls in the final quarter of year 3, 12.5 percentage points (or nearly 30 percent) be-low control group levels.
The Portland JOBS program generated substantial AFDC savings over two years: $1,196 (or 17 percent) per enrollee, the difference between the program group mean of $5,818 and the control group mean of $7,014. Impacts on AFDC payments may come from a reduction in the number of months on AFDC or from a reduction in the monthly AFDC grant amounts for pro-gram group members who remain on assistance. In Portland, approximately 91 percent of the AFDC savings is attributable to reductions in average months of receipt, and only about 9 per-cent is due to lower monthly grants for sample members still on assistance.13 This ratio is high
13The percentage of AFDC savings attributable to reductions in AFDC grant amounts can be calculated using the following formula. The average monthly payment amount for controls multiplied by the reduction in number of months of AFDC indicates what the AFDC savings would have been if average monthly payment amounts were the same for program and control group members who remained on welfare. In Portland, this calculation ($452 times 2.42 months) yields $1,094, which represents 91 percent of the $1,196 two-year AFDC savings. The remainder of the impact on two-year AFDC payments may have come from reductions in grants imposed by sanctions or from
(continued)

-98-
compared to ratios in other job search-oriented programs evaluated in the 1980s and 1990s.14
The first decrease in average AFDC payments occurred in quarter 2. (See Figure 5.1.) Average savings reached their greatest magnitude in quarter 8 and remained large and statisti-cally significant at the end of year 2 when program group members received $176 less, on aver-age, than control group members (a 26 percent decrease). Consequently, the Portland program will probably continue to generate welfare savings in year 3 and possibly beyond. Findings for the early cohort are consistent with this expectation: during the third year of follow-up, quarterly impacts on AFDC payments grew slightly and were largest ($191, or 35 percent) in quarter 13, a trend that bodes well for year 4.
B. Food Stamp Receipt
Earnings gains affect Food Stamp receipt less predictably than they affect AFDC receipt. Food Stamp grant calculations count a dollar of earnings less than a dollar of AFDC, so that a person who replaces welfare dollars with earnings may experience a net increase in Food Stamps.15 On the other hand, a former welfare recipient may experience a decrease in (or com-plete loss of) Food Stamps if earnings gains are relatively large.
For the typical program group member, the Portland JOBS program lowered Food Stamp receipt and monthly payments; however, Food Stamp impacts were smaller than AFDC impacts. In quarter 9, 58.5 percent of program group members received Food Stamps as opposed to 63.8 percent of control group members. These levels exceeded the program and control levels of AFDC receipt — not surprising in light of the fact that it is easier to remain eligible for Food Stamps than cash assistance. The 5.3 percentage point decrease in Food Stamp receipt was sub-stantially smaller than the corresponding AFDC reduction.
Control group members averaged $4,391 worth of Food Stamps over two years, $456 (10 percent) more than the program group. Fewer months of Food Stamp receipt contributed about three-quarters of this impact; the rest resulted from a decrease in the average amount of Food Stamps spent on sample members each month.16 Although the percentage reduction in Food Stamp dollars is considerable, it does not approach the percentage reduction in two-year AFDC payments.
Quarterly trends indicate that impacts on Food Stamp payments will extend into year 3. Although program-control differences peaked at $72 (14 percent) in the first quarter of year 2, they remained statistically significant through quarter 9. (See Appendix Table F.1.) Percentage
employment while still on welfare. Alternatively, the overall reduction in months of receipt may have fallen primar-ily on cases with above-average monthly grant amounts. Decompositions of this sort are only approximations, since they ignore interactions between grant level and case closure.
14In studying effects of the labor force attachment approaches in Atlanta, Grand Rapids, and Riverside, re-searchers found that between 60 percent (in Grand Rapids and Riverside) and 75 percent of AFDC savings were associated with program group members spending fewer months on AFDC (Hamilton et al., 1997).
15The Food Stamp benefit level equals the maximum benefit level minus one-third of a household’s countable income. Countable income includes 100 percent of AFDC payments but only 80 percent of earnings, so a sample member who replaces AFDC with earnings could lower her countable income and thus increase her Food Stamp payments (Ohls and Beebout, 1993).
16See footnote 13 for an explanation of how this breakdown was determined.

-99-
reductions declined slightly at the end of follow-up to 12 percent. For the early cohort, Food Stamp savings grew a little larger over the third year of follow-up. (See Appendix Table F.2.) In quarter 13, they were still large ($71, or 18 percent) and statistically significant.
VI. Impacts on Employment and Welfare Status After Two Years
This section discusses the extent to which the Portland JOBS program increased the self-sufficiency of its enrollees by the end of two years — that is, the percentage who were working and off AFDC. A program’s impact on self-sufficiency is not necessarily equivalent to its em-ployment gains or AFDC reductions. Some recipients who obtain employment may remain on cash assistance, particularly if their program provides generous earnings disregards. Others may leave AFDC without finding a job.
The two-year mark is an important point in time for measuring the impact of the Portland JOBS program on self-sufficiency. Federal TANF legislation directs states to engage most re-cipients in work-related activities after two years of assistance. Moreover, some state TANF pro-grams impose two-year time limits on welfare receipt. Although the Portland program did not set time limits during the follow-up period, the degree of self-sufficiency achieved by its sample members after two years can shed light on how Portland’s approach might fare in the new wel-fare environment.
As shown in Figure 5.3, 33.3 percent of program group members worked for pay and were off the AFDC rolls in quarter 9 compared with 24.0 percent of control group members, a statistically significant difference of 9.3 percentage points. During the same period, the program reduced the proportion of jobless AFDC recipients by 13.3 percentage points (28.4 percent of program group members minus 41.7 percent of control group members). Impacts on these two measures represent the primary effects of the Portland JOBS program: the proportion of sample members combining work and welfare grew by only 1.6 percentage points as a result of the pro-gram (12.9 percent of program group members minus 11.3 percent of control group members).17
The Portland JOBS program also slightly increased the proportion of sample members who lacked both a job and an AFDC check during this period, boosting the control group level of 22.9 by 2.5 percentage points. This increase may reflect the program’s capacity, through partici-pation mandates and threats of grant sanctions, to deter people from the rolls even before they have found employment.18
17These findings are consistent with the fact that a large majority of the program’s AFDC savings resulted from
fewer months of receipt, as opposed to lower average monthly payments. (Sample members who work while still receiving cash assistance can bring down average monthly payments, because they are subject to grant reductions.)
18Other reasons for exiting AFDC without employment include the following: moving out of state, receiving in-come from another source such as Supplemental Security Income, living with someone who has income, or obtain-ing an “off-the-books” job (UI records include only earnings reported to the government).
About a fourth of both program and control group members who were jobless and off AFDC in quarter 9 re-ceived Food Stamps (not shown).

-100-
28.4
41.7
12.9
11.3
33.3
24.0
25.4 22.9
0%
25%
50%
75%
100%
Program Group Control Group
Not employed and off AFDCEmployed and off AFDCEmployed and on AFDCNot employed and on AFDC
Figure 5.3
National Evaluation of Welfare-to-Work Strategies
Employment and AFDC Status at the End of Year 2
Portland JOBS Program
SOURCES: MDRC calculations from Oregon unemployment insurance (UI) earnings records, and AFDC records.
NOTES: The bracketed area represents the proportion of sample members on AFDC at the end of year 2. Rounding may cause slight discrepancies in calculating sums and differences.
-101-
VII. Impacts on Total Measured Income
This section describes the Portland program’s impact on two-year combined income from earnings, AFDC, and Food Stamps.19 Data from the Two-Year Client Survey are used to expand upon the analysis of program effects by including additional sources of income and by consider-ing income from other members in the respondent’s household.20 The survey-based measures focus on the last month of follow-up and are referred to as total measured income.
Over the two-year follow-up period, the average earnings gains of Portland program group members were offset by losses in AFDC and Food Stamps, so the program did not in-crease combined income from these three sources. Program-control differences in combined in-come grew more positive over time, however, and first achieved statistical significance in quarter 9. Impacts on poverty in year 2 indicate that the financial situation of some program group members improved, whereas for others it worsened.
A. Income from Earnings, AFDC, and Food Stamps
Over two years, program group members gained $1,842 in average earnings, yet they lost $1,652 in average AFDC and Food Stamp payments. Therefore, their net increase in combined income relative to control group members totaled just $191 (1 percent, not statistically signifi-cant) above the control group mean of $16,696. (See Table 5.2.) Quarterly trends, however, show that program group members may improve their financial situation in the future. Pro-gram/control differences in combined income grew larger with each quarter of year 2 and totaled $80 in quarter 9 (not shown). This pattern suggests that impacts will continue into year 3 and perhaps even increase in size as, theoretically, program group members advance more rapidly in their jobs than control group members and can command higher wages. For the early cohort, the year 3 gain in total measured income ($369 and statistically significant) surpassed that of year 2 ($215 and not statistically significant).
Another way of determining the Portland program’s effects on financial well-being is to examine the combined income (from earnings, AFDC, and Food Stamps) of program and control group members with respect to the poverty level.21 In year 2, the program brought a small por-tion of its enrollees out of poverty, but it also slightly increased the percentage of recipients with combined income under half the poverty level.22 (See Appendix Figure F.1.) Whereas only 16.6
19A future NEWWS Evaluation report will present a more precise income measure as part of the five-year bene-
fit-cost analyses of the Portland program. Most likely, this measure will take into account the following types of income and expenses: AFDC, Food Stamps, earnings, fringe benefits estimated from earnings, UI benefits, Earned Income Tax Credit, estimated Medicaid payments, Social Security and Medicare taxes, and federal, state, and county income taxes.
20Survey data may differ from the UI data for several reasons. Survey data are self-reported. They include jobs that are not covered by or reported to the state UI system such as federal employment or informal jobs but do not include jobs that respondents fail to recall or are reluctant to report (see Appendix G in Hamilton et al., 1997). (Also see Technical Appendix in a forthcoming report that will include two-year impacts for all 11 programs in the NEWWS Evaluation.)
21The measure discussed here is not the true estimate of poverty, because it includes Food Stamps, which are left out of official poverty estimates, and excludes other sources of income that are typically counted.
22In Oregon, families with income under half the poverty level would meet the income eligibility criteria for AFDC. Portland program group members whose income was lowered into this range could have forgone cash assis-
(continued)

-102-
percent of control group members had combined income in year 2 that exceeded the poverty level, 20.6 percent of program group members fell into this category, an impact of 4.0 percentage points. Impacts on poverty of even this magnitude are relatively uncommon in evaluations of welfare-to-work programs. About one-third of program group members (33.4 percent) had com-bined income representing less than 50 percent of the poverty level, 2.4 percentage points more than the control group.
B. Survey-Based Measures of Respondent and Household Income
The survey directly asked about additional sources of income for respondents and other household members in the last month of follow-up.23 According to these data, program group respondents received an average of $891 from these sources of income in the last month of fol-low-up compared to $834 for control group respondents. (See Table 5.4.) The program raised total measured respondent income by $57 in the last follow-up month, which is equivalent to $684 annually.24 This estimate was not statistically significant, however.
The Portland program also increased total measured household income, although this es-timate was also not statistically significant. In the last month of follow-up, total household in-come for program group respondents was $1,519 compared to $1,442 for control group respondents, an increase of $77, which amounts to more than $924 annually. Similar impacts were found when average EITC receipts and out-of pocket child care payments were included to estimate total household net income.25
VIII. Impacts on Health Care Coverage
At random assignment, all survey respondents and their children had health care cover-age because they were receiving AFDC and were automatically covered under Medicaid. Al-though the program increased the proportion of individuals with employer-provided health insurance, overall coverage rates decreased two years after program entry as some respondents left welfare
tance despite being eligible for it. Some may have left AFDC for a low-wage job to avoid the stigma of welfare. Others may have obtained a job that caused them to lose benefits entirely and then chose not to return to welfare once their employment was terminated. It is also possible that the program prompted enrollees to exit AFDC before finding employment.
23The survey asked about income in the month before interview from regular or odd jobs; Food Stamps; AFDC; child support; alimony; Women, Infant, and Children Nutrition Program; Supplemental Security Income (SSI); So-cial Security; unemployment insurance; worker’s compensation; general assistance; refugee assistance; foster child payments; any money from family or friends outside the household to help pay living expenses; and other sources of income. This measure does not include average Earned Income Tax Credit (EITC) receipts and other tax credits available to low-income families in Oregon.
24Estimates include imputed values for sources of income that were missing. 25Out-of-pocket child care payments are self-reported and are included to estimate total net income. EITC pay-
ments are imputed based on reported earnings in the last month of follow-up and an 80 percent take-up rate (see Scholz, 1996).

-103-
Table 5.4
National Evaluation of Welfare-to-Work Strategies
Impact on Total Respondent and Household Income in the Last Month of Follow-Up
Portland JOBS Program
Outcome MeasureProgram
GroupControl Group
Difference (Impact)
Percentage Difference
(%)
Respondent Income
Total measured income from earnings, AFDC, Food Stamps, child support, and SSI ($) 846 804 42 5.2
Total measured income from all sources ($)a 891 834 57 6.8
Total net income including EITC receipts and out-of-pocket child care payments ($)b 902 843 59 7.0
Household Income
Total measured income from earnings, AFDC, Food Stamps, child support, and SSI ($) 1,434 1,375 59 4.3
Total measured income from all sources ($)a 1,519 1,442 77 5.3
Total net income including EITC receipts and out-of-pocket child care payments ($)b 1,532 1,453 79 5.4
Sample size 297 313 SOURCE: MDRC calculations from the Two-Year Client Survey.
NOTES: Measures in this table represent weighted averages. Respondents were weighted to replicate the proportion of program and control group members in the larger impact sample. Estimates are regression-adjusted using ordinary least squares, controlling for pre-random assignment characteristics of sample members. "Percentage difference" equals 100 times "difference" divided by "control group." Rounding may cause slight discrepancies in calculating sums and differences. A two-tailed t-test was applied to differences between outcomes for the program and control groups. Statistical significance levels are indicated as: * = 10 percent; ** = 5 percent; and *** = 1 percent. aThe survey asked about income in the month before interview from regular or odd jobs; Food Stamps; AFDC; child support; alimony; Women, Infant, and Children Nutrition Program (WIC); Supplemental Security Income; Social Security; Unemployment Insurance; Worker's Compensation; General Assistance; Refugee Assistance; foster child payments; any money from family or friends outisde the household to help pay living expenses; and other sources of income. This measure does not include average EITC receipts and other tax credits available to low inome families in Oregon. bOut-of-pocket child care payments are self-reported and are included to estimate total net income. EITC payments are imputed based on reported earnings in the last month of follow-up and an 80 percent take-up rate (see Scholz, 1996).

-104-
for work and did not replace the coverage they had under Medicaid with coverage from employ-ers or other sources.
As shown in Appendix Table F.3, about 89 percent of control group respondents reported having some type of health care coverage (employer-provided, Medicaid, or other) for all chil-dren in their household, and 86 percent had coverage for themselves and their children as of the end of two years. In comparison, coverage rates for program group members were 4.8 percentage points lower for children and 5.1 percentage points lower for children and respondents com-bined. (Differences in coverage rates between program group respondents and control group re-spondents are just above the 10 percent level of statistical significance.)
These small losses in coverage for program group respondents and children resulted from the program’s large increases in employment and welfare exits. (The program did not decrease coverage among those who left AFDC and were not working.) As shown below, if a program decreases AFDC receipt (and automatic eligibility for Medicaid) to a larger degree than it in-creases health care coverage from employers or other sources, the net effect is a decrease in health care coverage for all sample members.
In Portland, at the end of two years 56.3 percent of program group respondents had left welfare and lost automatic coverage under Medicaid — a potential 14.0 percentage point de-crease in coverage, compared to control group levels (statistically significant, not shown). For no loss of coverage to occur, the program would need to offset this reduction with a similar increase in the proportion of respondents who obtained coverage from a different source. These sources include employer-provided insurance; transitional Medicaid, which is available for up to one year to those who leave AFDC for employment; the Oregon Health Plan (OHP), a statewide ini-tiative that provides health coverage for low-income families; or others.
Portland’s program did increase the percentage of respondents who left welfare and ob-tained coverage from a different source by 8.9 percentage points. Nearly all of this replacement of coverage occurred because the program increased the proportion of respondents who were employed, off welfare, and had coverage from employers or other sources (a gain of 8.4 percent-age points, statistically significant). The gap between the 14.0 percentage point drop in coverage from leaving welfare and the 8.9 percentage point increase in those who replaced coverage from employers or other sources represents the overall 5.1 percentage point loss of health coverage for respondents and children at the end of the two-year follow-up period.
Most likely, the population who lost coverage would have remained jobless and on wel-fare without the program, which suggests that the decrease in coverage may be due to the pro-gram increasing employment for a more disadvantaged portion of the welfare population who are less likely to obtain jobs with health insurance.26 This population may have never received tran-sitional Medicaid or may have exhausted or not restarted their benefits as of the end of two
26The evidence for this assertion is that although increases in employment were similar for respondents who had been on welfare for more than two years prior to random assignment and respondents who had not been on welfare for as long, only the longer-term welfare recipients incurred a statistically significant net loss in overall health care coverage as of the end of two years.

-105-
years. Additionally, they may not have obtained coverage under the OHP because shifting from transitional Medicaid to the OHP is not automatic and requires the respondent to apply for cov-erage.
IX. Impacts for Key Subgroups
This section presents impacts on administrative records measures of employment, earn-ings, AFDC payments and receipt, and combined income for three key subgroups: (1) sample members with a high school diploma or GED at random assignment (“graduates”), (2) sample members without a high school diploma or GED at random assignment (“nongraduates”), and (3) “most disadvantaged” sample members. The third subgroup includes the least job-ready and the most welfare-dependent sample members. Anyone without a high school diploma or GED who did not work for pay in the year before random assignment and who had received AFDC for more than two years prior to random assignment was classified for this analysis as most disad-vantaged.27 These subgroups were chosen for analysis partly because of their relevance to the new welfare law. If states are to succeed in meeting federal work participation requirements (and thus avoid reductions in their TANF grants), their programs must help all segments of the caseload — from the more advantaged recipients to those with the greatest barriers to self-sufficiency.
An examination of control group levels reveals how each subgroup would fare in the ab-sence of the program intervention. Over two years, control group members with a high school diploma or GED earned $6,257 on average and received $6,656 in AFDC payments. Nongradu-ate control group members averaged about half as much in earnings ($3,315) and over $1,000 more in AFDC payments ($7,745). The most disadvantaged control group fared worst (as ex-pected) with $1,796 in earnings and $9,022 in AFDC.
The Portland JOBS program produced substantial two-year earnings gains and AFDC reductions for all three subgroups.28 (See Table 5.5.) The dollar value of these impacts was larger for graduates than nongraduates and was smallest for the most disadvantaged. A more meaning-ful comparison of the program’s effectiveness for these subgroups involves the ratio of earnings gains to welfare reductions. This ratio indicates either that earnings gains were offset by welfare reductions (with a value of 1 or lower) or that program group members earned more on average than they lost in AFDC payments (with a value greater than 1). In general, the higher the ratio, the more effective the program. For all three subgroups, earnings gains surpassed AFDC reduc-tions. Graduates boasted the highest ratio (1.57), and the most disadvantaged had the lowest (1.33).
Additional reductions in Food Stamp payments, however, lowered these ratios to 1 or be-low. In other words, the program did not raise combined income from earnings, AFDC, and Food Stamps for any of these three subgroups within two years. Only one subgroup in the early
27The most disadvantaged sample is a subset of sample members without a high school diploma or GED. 28Analyses not presented in this report show that substantial impacts were also found for each of three child-age
subgroups (2 or under, 3 to 5, and 6 or over).

Table 5.5
National Evaluation of Welfare-to-Work Strategies
Impacts on Employment, Earnings, and AFDC for Selected Subgroups
Portland JOBS Program
High School Diploma or GED No High School Diploma or GED Most Disadvantageda
Program Control Difference Program Control Difference Program Control DifferenceOutcome Group Group (Impact) Group Group (Impact) Group Group (Impact)
Years 1-2
Ever employed (%) 75.5 65.5 10.0 *** 65.3 52.1 13.2 *** 52.9 38.6 14.3 ***
Average total earnings ($) 8,403 6,257 2,146 *** 4,591 3,315 1,277 *** 2,912 1,796 1,116 ***
Average total AFDC payments ($) 5,286 6,656 -1,370 *** 6,844 7,745 -900 *** 8,181 9,022 -842 *** Percentage change (%) -20.6 -11.6 -9.3
Average combined incomeb 17,349 17,148 201 15,913 15,810 103 16,288 16,314 -25
Quarter 9
Ever received AFDC (%) 36.6 49.8 -13.2 *** 50.3 59.7 -9.4 *** 59.9 68.1 -8.2 **
Sample sizec 2,344 1,278 1,154 718 546 351SOURCES: MDRC calculations from Oregon unemployment insurance (UI) earnings records and AFDC records.
NOTES: Dollar averages include zero values for sample members not employed and for sample members not receiving welfare. Estimates are regression-adjusted using ordinary least squares, controlling for pre-random assignment characteristics of sample members. Rounding may cause slight discrepancies in calculating sums and differences. A two-tailed t-test was applied to differences between outcomes for the program and control groups. Statistical significance levels are indicated as: * = 10 percent; ** = 5 percent; and *** = 1 percent. aThe "most disadvantaged" subgroup contains sample members who did not have a high school diploma or GED at random assignment, who did not work for pay in the year prior to random assignment, and who had received AFDC for more than two years prior to random assignment. b"Combined income" is income from earnings, AFDC, and Food Stamps. cSome individuals did not indicate whether they had a high school diploma or GED at random assignment. These individuals are excluded from the subgroup analysis.

-107-
cohort, nongraduates, achieved a statistically significant increase in this measure ($608, not shown) during the third year of follow-up.
A. High School Diploma/GED Subgroups
Program group members with a high school diploma or GED at random assignment earned $2,146 more than their control group counterparts over two years and received $1,370 fewer AFDC dollars, a 21 percent decrease relative to the control mean. Nongraduates’ earnings gains and AFDC savings totaled $1,277 and $900 (12 percent), respectively. Contrary to expec-tation, the program produced employment and earnings impacts for nongraduates immediately: in year 1, the employment gain was 9 percentage points, and the earnings increase totaled $395. (See Appendix Table F.5.) In light of this finding, participation in basic education does not ap-pear to have delayed this subgroup’s entry into the labor market. Impacts on employment and earnings for nongraduates grew larger in year 2, a finding consistent with an education-focused approach.
B. Most Disadvantaged Subgroup
JOBS raised two-year earnings for the most disadvantaged sample members by $1,116. The program also produced an impact of $842 (9 percent) on average AFDC payments. In quar-ter 9, 59.9 percent of the most disadvantaged program group members received AFDC compared to 68.1 percent of their control group counterparts, a decrease of 8.2 percentage points.
C. Subgroup Impacts Over Time
In the last quarter of year 2, all three subgroups experienced statistically significant earn-ings gains and AFDC reductions. (See Appendix Tables F.4, F.5, and F.6.) Consequently, im-pacts on these two measures should continue into the following year. For the early cohort in each subgroup, earnings and AFDC impacts persisted in year 3 and remained statistically significant in quarter 13. (See Appendix Tables F.7, F.8, and F.9.)


Appendix A
Supplementary Tables to Chapter 1

-110-
Appendix Table A.1
National Evaluation of Welfare-to-Work Strategies
Additional Selected Characteristics of Sample Members
Portland JOBS Program
No HighHigh School SchoolDiploma or Diploma or
Characteristic Full Sample GED GED
Demographic characteristics
Age (%)20-24 22.7 21.6 24.625-34 52.1 49.8 56.735-44 21.6 24.2 16.845 and over 3.5 4.4 2.0
Family status
Marital status (%)Never married 47.9 45.7 52.1Married, living with spouse 1.6 1.7 1.6Separated 21.2 20.6 22.2Divorced 28.6 31.3 23.5Widowed 0.7 0.7 0.7
Labor force status
Currently employed (%) 9.4 10.5 7.3
Education and training
Highest degree/diploma earned (%)GED 21.6 32.6 0.0High school diploma 33.7 50.9 0.0Technical/AA/2-year college degree 9.3 14.0 0.04-year (or more) college degree 1.7 2.5 0.0None of the above 33.7 0.0 100.0
Enrolled in education or training in past12 months (%) 20.7 23.8 15.2
Currently enrolled in education or training (%) 13.1 15.7 8.4
Public assistance status
Total prior AFDC receipt (%)a
None 1.2 1.2 1.1Less than 1 year 20.2 21.8 16.91 year or more but less than 2 years 16.3 17.5 14.02 years or more but less than 5 years 32.7 32.8 32.55 years or more but less than 10 years 21.2 19.6 24.410 years or more 8.5 7.1 11.2
(continued)

-111-
Appendix Table A.1 (continued)
No High High School SchoolDiploma or Diploma or
Characteristic Full Sample GED GED
Housing status
Current housing status (%)Public housing 7.5 6.8 8.8Subsidized housing 19.1 21.1 15.2Emergency or temporary housing 3.4 3.5 3.1None of the above 70.1 68.7 72.8
Sample sizeb 5,547 3,622 1,872 SOURCES: MDRC calculations from information routinely collected by welfare staff and from BASIS skills test data.NOTES: aThis refers to the total number of months accumulated from one or more spells on an individual's own or spouse's AFDC case. It does not include AFDC receipt under a parent's name. bFifty-three individuals in the full sample did not indicate whether they had a high school diploma or GED at random assignment. These individuals are excluded from the subgroup analysis.

-112-
Appendix Table A.2
National Evaluation of Welfare-to-Work StrategiesAttitudes and Opinions of Sample Members
Portland JOBS Program
Attitude or Opinion Full Sample
Client-reported barriers to JOBS participation
Percent who agreed or agreed a lot that they could notgo to a school or job training program right now forthe following reasons:
No way to get there every day 29.3Cannot afford child care 69.6
A health or emotional problem 20.4A child or family member with a health or emotional problem 16.3
Too many family problems 25.4Fear of leaving children in day care or with a baby-sitter 30.0Already has too much to do during the day 20.7
Client-reported preferred JOBS components and expectations regarding the effectiveness of JOBS components
Given the choices of going to school to study basicreading and math, going to a program to get help looking for a job, or going to school to learn a jobskill, percent who would prefer to:a
Go to school to learn a job skill 61.8Go to a program to get help looking for a job 19.3Go to school to study basic reading and math 6.2
Percent who agreed or agreed a lot that the followingwould help them get a good job:
Going to a job training program 86.4Going to a program to get help looking for a job 65.5Going to a school that teaches basic reading and math 53.7
Client-reported barriers to employment
Percent who agreed or agreed a lot that they could notget a job right now for the following reasons:
Too many family problems for full- or part-time work 18.3Prefers to take care of family full-time at this time 30.8No available trusted person to take care of children 23.5Would miss children too much 16.0
Client-reported expectations regarding employment
Percent who agreed or agreed a lot that: It will probably take them more than a year to get a full-time job and get off welfare 49.8If they got a job, they could find someone they trusted to take care of their children 73.0
Percent who would probably take a full-time job today if:The job paid a little less than welfare 11.4The job paid a little less than welfare but client would like the work 35.1
(continued)

-113-
Appendix Table A.2 (continued)
Attitude or Opinion Full Sample
The job paid the same as welfare 28.2The job paid a little more than welfare 75.1The job paid a little more than welfare but client would not like the work 43.2
Percent who, if they had a choice, would prefer to work at a:Part-time job 28.0Full-time job 72.0
If someone offered client a full-time job with full medicalbenefits, minimum amount per hour at which the clientwould take the job:
$4 1.1$5 14.7$6 27.0$7 20.4$8 19.5$10 10.6$12 3.8$15 1.7$20 or more 1.3Median ($) 7.00Mode ($) 6.00Mean ($) 7.41
If someone offered client a full-time job with no medicalbenefits, minimum amount per hour at which the clientwould take the job:
$4 0.8$5 6.1$6 10.1$7 13.0$8 18.3$10 19.8$12 12.7$15 10.2$20 or more 9.1Median ($) 10.00Mode ($) 10.00Mean ($) 10.16
Approximate average worth of employer-provided medical benefits per hour ($) 2.77
Client-reported attitudes toward welfare
Percent who agreed or agreed a lot with the following statements:It is unfair to make people on welfare get a job if they don't want to. 11.2It is wrong to stay on welfare if you can get a job, even a job you don't like. 60.3Right now, being on welfare provides for my family better than I could by working. 38.7I am ashamed to admit to people that I am on welfare. 56.5
Client-reported expectations regarding family situation
Percent who agreed or agreed a lot with the following statements:A year from now I expect to be married. 15.2I would like to have a baby next year. 8.5
(continued)
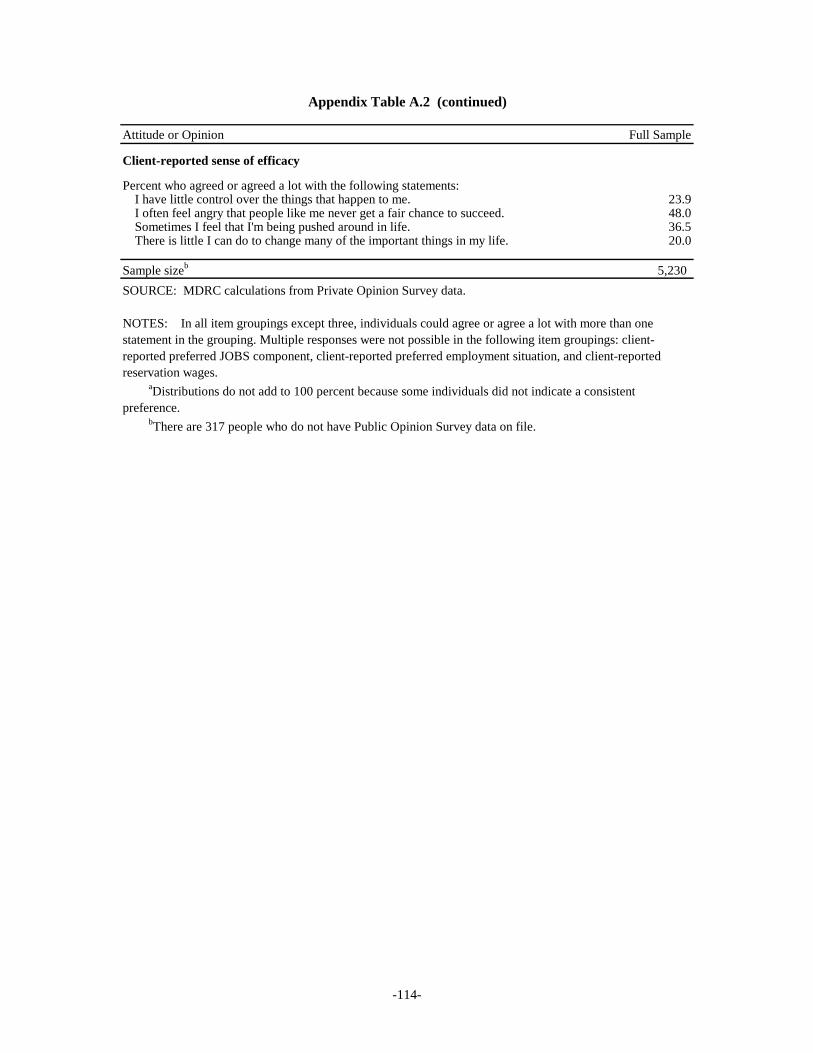
-114-
Appendix Table A.2 (continued)
Attitude or Opinion Full Sample
Client-reported sense of efficacy
Percent who agreed or agreed a lot with the following statements:I have little control over the things that happen to me. 23.9I often feel angry that people like me never get a fair chance to succeed. 48.0Sometimes I feel that I'm being pushed around in life. 36.5There is little I can do to change many of the important things in my life. 20.0
Sample sizeb 5,230
SOURCE: MDRC calculations from Private Opinion Survey data.
NOTES: In all item groupings except three, individuals could agree or agree a lot with more than one statement in the grouping. Multiple responses were not possible in the following item groupings: client-reported preferred JOBS component, client-reported preferred employment situation, and client-reported reservation wages. aDistributions do not add to 100 percent because some individuals did not indicate a consistent preference. bThere are 317 people who do not have Public Opinion Survey data on file.

Appendix B
Items Used to Create Scales for the Income Maintenance, Integrated, and JOBS Staff Surveys

-116-
Below is an enumeration of items used in the creation of scales presented in Chapter 2. All of the items were taken from surveys conducted by MDRC as part of the National Evaluation of Welfare-to-Work Strategies. Scales relating to staff attitudes and program practices were created from items on the income maintenance, integrated, and JOBS staff surveys, which are available from MDRC. On the surveys given to supervisors, the wording on some items was changed to make the questions appropriate for their role.
Most item responses were based on a 7-point metric ranging from low (1) to high (7) unless otherwise noted. The response categories are in parentheses following each item unless otherwise noted.
Factor analysis was conducted to determine meaningful scale components. Only items that loaded .50 and above on a factor were utilized in the scales.
Cronbach's Alpha calculation, a statistical measure of a scale's reliability, was conducted on each factor-based scale. Coefficient alphas of .70 or above are generally considered acceptable.1 One alpha had a value of .65; the remainder of the alphas ranged from .72 to .93 for the scales created from the survey data.
Items for which respondents indicated "don't know" or "refused" were recoded to a missing value. Missing values were replaced with the mean of the nonmissing values for a scale. Cases missing more than three responses on a nine-item scale, or two responses on a six-to-eight-item scale, or one response on a three-to-five-item scale were assigned a missing value for their score on that scale.
Scale scores were created by summing the values of the number of items in each scale. To facilitate report readability, each mean scale score was divided by the number of items summed to approximate the original metric of the items used to construct the scale. Next, variables with scores that indicated high, medium, and low on the scale were also created from the scale variables. Zero-one variables were then created from the three category scale variables to indicate the proportion of staff who had high and low scores on the scales.
I. Items Used in Figure 2.1: Relations Between Income Maintenance Workers and JOBS
INCOME MAINTENANCE WORKERS
A. Percent who report few problems dealing with JOBS staff
Cronbach's Alpha = .78
This scale measures perceived problems between IM workers and JOBS staff. The scale was created from the following items:
Experiences Working with JOBS Staff
1See Hatcher, 1994, p. 137.

-117-
JOBS workers pester you for information. (Have Not Experienced This Problem to Have Often Experienced This Problem)
JOBS workers do not understand how IM works. (Have Not Experienced This Problem to Have Often Experienced This Problem)
Paperwork between JOBS and IM workers gets lost. (Have Not Experienced This Problem to Have Often Experienced This Problem)
IM workers get wrongly blamed when clients don't show up for orientations. (Have Not Experienced This Problem to Have Often Experienced This Problem)
The JOBS staff don't understand the length of time it takes to impose or lift a sanction. (Have Not Experienced This Problem to Have Often Experienced This Problem)
B. Percent who say they know a lot about JOBS
Cronbach's Alpha = .93
This scale measures how much IM workers reported knowing about the JOBS program requirements, services, and goals. The scale was created from the following items:
How much do you know about the JOBS program? (Nothing to A Lot)
How much training or information have you received on the following topics? (None to A Lot)
What clients are required to do under the JOBS program. (None to A Lot)
The kinds of job search, education, training, work experience placement, and support services available under JOBS. (None to A Lot)
The goals and objectives of JOBS. (None to A Lot)
What to tell mandatory clients about JOBS. (None to A Lot)
What to tell exempt clients about JOBS. (None to A Lot)
How to make clients enthusiastic about JOBS. (None to A Lot)
C. Percent who received helpful training on JOBS
Cronbach's Alpha = .83
This scale measures the amount of information and training regarding JOBS regulations that IM workers reported having on the rules and procedures of the JOBS program.
The scale was created from the following items:
How much training or information have you received on the following topics?
The rules that determine whether clients are required to participate in JOBS.

-118-
(None to A Lot)
Reasons clients may be deferred or exempted from JOBS. (None to A Lot)
How to impose and lift financial sanctions on JOBS clients who do not comply with program requirements. (None to A Lot)
D. Percent who have supervisors who pay close attention to JOBS-related functions2
Cronbach's Alpha = .72
This scale measures how closely supervisors monitor IM workers’ job performance. The scale was created from the following items:
How closely does your supervisor monitor each of the following?
Whether you are referring all mandatory clients to JOBS. (Not at All to Very Closely)
Whether you are properly exempting clients from JOBS. (Not at All to Very Closely)
Whether you are imposing sanctions on clients when they are requested by JOBS. (Not at All to Very Closely)
Whether you are giving a proper explanation of the JOBS program to clients. (Not at All to Very Closely)
E. Average number of minutes spent discussing JOBS with clients3
Cronbach's Alpha = .81
This scale measures the average number of minutes IM staff spend discussing the JOBS program with their clients. The scale was created from the following items:
On average, how much time do you or others in your unit spend in discussing the JOBS program with the following types of clients?
A new applicant who is mandatory or "nonexempt" for JOBS. (0 to 35 minutes)
A new applicant who is exempt from JOBS requirements. (0 to 35 minutes)
An ongoing recipient during a redetermination interview who is exempt from JOBS. (0 to 35 minutes)
II. Items Used in Figure 2.2: Employment Preparation Strategy
INTEGRATED CASE MANAGERS AND JOBS STAFF
2This scale is not shown in the figure. 3This scale includes responses from integrated case managers.

-119-
A. Percent who lean toward Labor Force Attachment or toward Human Capital Development
Cronbach's Alpha = .88
This scale measures whether staff were more apt to support a labor force attachment or human capital development strategy and recommend it to their clients. The scale was created from the following items:
In your opinion, which offers the best chance for average clients to get off of welfare? (working their way up from a low-paying job or going to school or training in order to get a better job)
What would you say is the more important goal of your JOBS program? (to help clients get a job as quickly as possible or to raise the education and skills levels of clients so that they can get jobs in the future)
Which do you think should be the more important goal of your program? (to get jobs quickly or to raise skills levels)
Now we would like to know about your goals for different types of clients. Suppose that the following clients have just entered the JOBS program. What would be your main goal with these clients? (to help them to get jobs quickly as possible or to help and encourage them to raise their education and skills levels so that they can get better jobs in the future)
An AFDC client who is a high school graduate, has a good work record, and recently has been approved for welfare for the first time. What would your main goal be? (to help and encourage him/her to get a job quickly, both equally, or to raise education and skills levels)
An AFDC client who has dropped out of 12th grade, has a little work experience, and has been on welfare for about one year. What would your main goal be? ( to get him/her a job quickly, both equally, or to raise education and skills levels)
An AFDC client who has dropped out of 10th grade, has no work experience, and has been on welfare for more than two years. What would your main goal be? ( to get him/her a job quickly, both equally, or to raise education and skills levels)
Suppose these same clients completed their first JOBS component but did not find a job. Now you are meeting with them to discuss their next JOBS activity. What would you be more likely to recommend? (a short-term program activity that would lead to fast entry into the job market or a long-term program activity that would raise skills and lead to a better job in the future)
An AFDC client who is a high school graduate, has a good work record, and recently has been approved for welfare for the first time. (I would recommend short-term program and quick entry to job market, both equally, long-term program and better job in future)
An AFDC client who has dropped out of 12th grade, has a little work experience, and has been on welfare for about one year. (I would recommend short-term

-120-
program and quick entry to job market, both equally, long-term program and better job in future)
An AFDC client who has dropped out of 10th grade, has no work experience, and has been on welfare for more than two years. (I would recommend short-term program and quick entry to job market, both equally, long term-program and better job in future)
B. Percent who encourage clients to take any job or encourage clients to be selective in taking a job
Cronbach's Alpha = .79
This scale measures whether staff are more apt to convey to their clients that they should "take any job" or should "be selective." The scale was created from the following items:
After a short time in JOBS, an average welfare mother is offered a low-skill, low-paying job that would make her slightly better off financially. Assume she has two choices: either to take the job and leave welfare or to stay on welfare and wait for a better opportunity.
What would your personal advice to a client be? (to take any job and leave welfare, no recommendation either way, stay on welfare to wait for a better opportunity)
What advice would your supervisor want you to give to a client of this type? (to take any job and leave welfare, no recommendation either way, stay on welfare to wait for a better opportunity)
What message do you think job club staff give to clients? (to take any job they can, be selective, no message either way)
In general, what message do you give to clients? (to take any job they can, be selective, no message either way)
I encourage clients to take a job only if it has the potential to get them off welfare. (Strongly Disagree to Strongly Agree)
III. Items Used In Figure 2.3: Personalized Attention and Encouragement
INTEGRATED CASE MANAGERS AND JOBS STAFF
A. Percent who try to learn in depth about clients' needs, interests, and backgrounds during program intake
Cronbach's Alpha = .88
This scale measures how much knowledge staff attempt to learn about their clients in depth during the intake phase. The scale was created from the following items:
During intake, how much effort do you (or other staff who do intake) make:

-121-
To learn about the client's educational and work history in depth? (Very Little Effort to A Great Deal of Effort)
To learn about the problems that led the client to be on welfare in depth? (Very Little Effort to A Great Deal of Effort)
To learn about the client's goals and motivation to work in depth? (Very Little Effort to A Great Deal of Effort).
To learn about the client's family problems in depth? (Very Little Effort to A Great Deal of Effort)
B. Percent who try to identify and remove barriers to client participation
Cronbach's Alpha = .87
This scale measures the amount of emphasis staff place on removing barriers to client activity participation. The scale was created from the following items:
Suppose a new client has been attending a JOBS component but has stopped attending.
How much would JOBS staff emphasize identifying and helping to remove barriers to the client's participation? (Would Not Emphasize to Would Emphasize Strongly)
How much would you emphasize "selling" the client on the importance and benefits of the JOBS component? (Would Not Emphasize to Would Emphasize Strongly)
Suppose that this same client re-enters her program but soon has another period of unacceptable attendance.
How much would JOBS staff emphasize identifying and helping to remove barriers to the client's participation? (Would Not Emphasize to Would Emphasize Strongly)
How much would you emphasize “selling” the client on the importance and benefits of the JOBS component? (Would Not Emphasize to Would Emphasize Strongly)
C. Percent who encourage and provide positive reinforcement to clients
Cronbach's Alpha = .81
This scale measures the amount of effort staff make to provide support and encouragement to clients who are enrolled in JOBS activities. The scale was created from the following items:
Suppose you have a client in an education or occupational skills training program who is about to go on a job interview. How likely is it that you would contact the client before the interview to provide encouragement? (Very Unlikely to Very

-122-
Likely)
Suppose you have a client in a GED class who is about to take a GED exam. How likely is it that you would contact the client before the exam to provide encouragement? (Very Unlikely to Very Likely)
I spend a lot of time trying to increase clients' motivation to do well in their JOBS activities. (Strongly Disagree to Strongly Agree)
IV. Items Used In Figure 2.4: Participation Monitoring
INTEGRATED CASE MANAGERS AND JOBS STAFF
A. Percent who report receiving a lot of information on client progress from service providers
Cronbach's Alpha = .75
This scale measures the amount of information the staff members get from providers regarding their clients’ progress in their program. The scale was created from the following items:
Aside from attendance information, how much information do you get from the following service providers about how well clients are progressing in their programs?
Adult Basic Education (ABE, GED, ESL) (No Information to A Great Deal of Information)
Occupational Skills Training (No Information to A Great Deal of Information)
CWEP (No Information to A Great Deal of Information)
B. Average number of weeks before learning about attendance problems from service providers
Cronbach’s Alpha = .82
This scale measures the length of time it takes staff to learn from service providers that a client is not participating in an activity. The scale was created from the following items:
For each of the following activities suppose a client has been assigned to the activity but has not attended. How long would it take for the JOBS staff to learn about the situation from the service provider?
Adult Basic Education program (number of weeks before staff contacted)
Job search/job club (number of weeks before staff contacted)
Occupational skills training placement (number of weeks before staff contacted)

-123-
CWEP placement (number of weeks before staff contacted)
C. Average number of weeks before contacting clients about their attendance problems
Cronbach's Alpha = .89
This scale measures the length of time it takes staff to contact a client after learning the client is not participating in an activity. A value of 1 equals one week or less and a value of 8 equals eight weeks or more. A 5 indicates that it would take five weeks to contact the client. Responses of 9, indicating no contact at all, were assigned a missing value. (It is possible that staff who did not have caseloads, or were not responsible for contacting clients regarding activity nonparticipation, may have indicated that there was no contact, even though other staff may have fulfilled this role.) The scale was created from the following items:
Suppose you received information from a service provider or another JOBS staff member about the following problems. From the time you learned about these problems, how long would it take before you or someone in your agency contacted the client?
A client misses an orientation. (number of weeks before client contacted)
A client stops attending an Adult Basic Education program. (number of weeks before client contacted)
A client stops attending job club. (number of weeks before client contacted)
A client stops attending an occupational skills training placement. (number of weeks before client contacted)
A client stops attending CWEP placement. (number of weeks before client contacted)
V. Items Used in Figure 2.5: Rule Enforcement and Sanctioning
JOBS STAFF
A. Percent who never delay requesting sanctions for noncompliant clients
Cronbach’s Alpha = .65
Sometimes case managers have not yet requested sanctions for clients who are not complying and could be sanctioned. How often do you delay requesting sanctions? (Never to Frequently) The values of this item were reversed so that high scores reflect mandatoriness.
Would you delay imposing a sanction for either of the following reasons?
Because I do not have time to complete the paperwork. (Never a Reason to Frequently a Reason) The values of this item were reversed so that high scores reflect mandatoriness.

-124-
Because I do not feel that sanctioning clients is a priority when other clients need to be helped. (Never a Reason to Frequently a Reason) The values of this item were reversed so that high scores reflect mandatoriness.
INCOME MAINTENANCE WORKERS AND INTEGRATED CASE MANAGERS
B. Percent who never delay imposing sanctions on noncompliant clients
Cronbach's Alpha = .84
If IM staff are diligent about imposing sanctions the program is likely to be more mandatory than if they make exceptions to policies about who should be sanctioned because of noncompliance. Thus, the "delay sanctioning" scale indicates the extent to which IM staff delay imposing sanctions requested by JOBS staff. The scale was coded so that a score of 1 indicates that delays were frequent and a score of 7 means that there were never delays. The scale was created from the following items:
Would you delay imposing a sanction for any of the following reasons?
Because you feel you can persuade the client to comply with requirements of JOBS. (Never to Frequently)
Because you do not have time to complete the paperwork. (Never to Frequently)
Because the client explains the situation to the worker who realizes that the sanction would not be appropriate. (Never to Frequently) The values of this item were reversed so that high scores reflect mandatoriness.
Because you feel it is important to give the client more chances to comply. (Never to Frequently) The values of this item were reversed so that high scores reflect mandatoriness.
VI. Items Used in Figure 2.6: Staff Training, Supervision, and Evaluation
INTEGRATED CASE MANAGERS AND JOBS STAFF
A. Percent who say they received helpful training on how to be an effective JOBS case manager
Cronbach's Alpha = .87
This scale measures how helpful staff training is to specific areas of their jobs. The scale was created from the following items:
Staff Training
Looking back at all of the training you have received in this job, how helpful has it been in the following areas?
Understanding the rules and regulations of JOBS. (Not at All to A Great Deal)

-125-
Knowing how to match client needs to JOBS services. (Not at All to A Great Deal)
Knowing how to work with JOBS services providers. (Not at All to A Great Deal)
Learning how to motivate clients. (Not at All to A Great Deal)
B. Percent who say that supervisors pay close attention to case manager performance
Cronbach's Alpha = .77
This scale measures the degree to which staff perceive that they are evaluated on the basis of their casework with clients. The scale was created from the following items:
In your opinion, how important is each of the following factors in how your supervisor evaluates you? (If you do not have formal evaluations, what factors do you think are most important to your supervisor in how you do your work?)
Being an effective counselor to your clients. (Very Unimportant to Very Important)
Keeping in close contact with clients. (Very Unimportant to Very Important)
Being firm with clients who don't comply with the program requirements. (Very Unimportant to Very Important)
Making sure that all clients are in JOBS activities or other acceptable statuses. (Very Unimportant to Very Important)
C. Percent who report good communication with program administrators
Cronbach's Alpha = .76
This scale measures the extent to which staff feel that they have clear program guidelines and that their directors understand their unit and listen to what the staff have to say. The scale was created from the following items:
The objectives of this JOBS program seem to change from week to week. (Strongly Agree to Strongly Disagree)
I don't understand the reasoning behind some of the decisions that affect my job. (Strongly Agree to Strongly Disagree)
The directors of the JOBS program really understand the things that are happening in my unit. (Strongly Agree to Strongly Disagree)4
When there is a problem, the directors of the JOBS program listen to what staff have to say about it. (Strongly Agree to Strongly Disagree)
D. Percent who say that good performance is recognized
4This item was not included in the integrated staff survey.

-126-
Cronbach's Alpha = .74
This scale measures whether staff feel their work is recognized. The scale was created from the following items:
If I do my job well, this will be noticed by my supervisor. (Very Unlikely to Very Likely)
If I do my job well, this will improve my standing among the staff I work with. (Very Unlikely to Very Likely)
In the part of the agency in which I work, merit is recognized. (Strongly Disagree to Strongly Agree)
E. Percent who report high job satisfaction
Cronbach's Alpha = .74
This scale measures levels of job satisfaction and staff morale. The scale was created from the following items:
All things considered, how satisfied are you with your current job? (Very Dissatisfied to Very Satisfied)
How would you describe worker morale among the staff who work in your unit of the JOBS program? (Very Low to Very High)
If I were offered a job with equal pay and security, I would leave this line of work. (Strongly Disagree to Strongly Agree)
VII. Items Used in Figure 2.7: Perceptions of the Effectiveness of JOBS
INTEGRATED CASE MANAGERS AND JOBS STAFF
A. Percent who think JOBS will help clients become self-supporting
Cronbach's Alpha = .85
This scale measures whether staff believe that the services they provide are helpful to clients. The scale was created from the following items:
Program Effectiveness
In your opinion, if clients get the typical JOBS services provided by your unit how helpful will these services be to them in getting a job? (Little Help in Getting a Job to Considerable Help in Getting a Job)
In your opinion, if clients get the typical JOBS services provided by your unit how helpful will the services be in getting them off welfare? (Little Help in Getting Off Welfare to Considerable Help in Getting Off Welfare)
-127-
In your opinion, if clients get the typical JOBS services provided by your unit how helpful will the services be to them in feeling better about themselves? (Little Help in Feeling Better About Themselves to Considerable Help in Feeling Better About Themselves)5
If people in my job do good work, we can really improve the lives of welfare recipients. (Strongly Disagree to Strongly Agree)
If someone really wants to get off welfare, they can get off with help from my unit. (Strongly Disagree to Strongly Agree)
A JOBS case manager can have a lot of influence on a client’s motivation to work. (Strongly Disagree to Strongly Agree)
INCOME MAINTENANCE WORKERS
B. Percent who think JOBS will help clients become self-supporting
Cronbach's Alpha = .86
This scale measures the extent to which IM staff think the JOBS program will provide helpful services to clients. The scale was created from the following items:
Attitude Toward JOBS
In your opinion, if clients get the typical JOBS services provided by your unit how helpful will these services be to them in getting a job? (Little Help in Getting a Job to Considerable Help in Getting a Job)
In your opinion, if clients get the typical JOBS services provided by your unit how helpful will the services be in getting them off welfare? (Little Help in Getting Off Welfare to Considerable Help in Getting Off Welfare)
If people in my job do good work, we can really improve the lives of welfare recipients. (Strongly Disagree to Strongly Agree)
If someone really wants to get off welfare, they can get off with help from my unit. (Strongly Disagree to Strongly Agree)
Is your job less satisfying or more satisfying because of JOBS? (Less Satisfying to More Satisfying)
Because of JOBS, I feel I have something positive to offer clients. (Strongly Disagree to Strongly Agree)
5This item was not included in the integrated staff survey.

Appendix C
Supplementary Tables to Chapter 2

Appendix Table C.1
National Evaluation of Welfare-to-Work StrategiesSelected Income Maintenance and Integrated Staff Survey Measures
Portland JOBS Program
Measure Atlanta Grand Rapids Riverside Columbus Detroit Oklahoma Citya Portland
Relations between Income Maintenance Workersand JOBS
Percent who report few problems dealing with JOBS staff 81.7 63.2 71.8 68.0 69.3 n/a 68.3
Percent who say they know a lot about JOBS 74.1 50.0 77.1 59.7 36.4 n/a 72.5
Percent who received helpfultraining on JOBS 17.0 13.3 22.6 48.3 13.6 n/a 57.7
Percent who have supervisors who pay close attention to JOBS-related functions 43.4 33.6 32.0 53.1 33.0 n/a 22.5
Average number of minutes discussing JOBS withclientsb 2.0 3.1 4.1 5.6c 2.9 7.9 8.8
Rule Enforcement and Sanctioning
Percent who never delayimposing sanctions on noncompliant clientsb 84.8 98.0 87.2 70.9 87.0 28.5 51.6
(continued)

Appendix Table C.1 (continued)
Measures Atlanta Grand Rapids Riverside Columbus Detroit Oklahoma Citya Portland
Perceptions of Effectiveness of JOBS
Percent who think JOBS will help clients become self-supporting 33.9 33.3 59.1 67.3 43.1 n/a 74.0
Sample sized 113 120 105 136 114 180 110SOURCES: Income Maintenance and Integrated Staff Activities and Attitudes Surveys.
NOTES: N/a = not applicable. aAll staff in Oklahoma City are integrated. The Income Maintenance Staff survey was not administered. bOnly these two measures include the responses of both Income Maintenance and Integrated Staff. cThis table presents the number for income maintenance staff. The average number of minutes for integrated staff is 11.7. dSample sizes may vary because not all survey items were applicable to some staff.

Appendix Table C.2
National Evaluation of Welfare-to-Work Strategies
Selected Integrated and JOBS Staff Survey Measures
Portland JOBS Program
Atlanta Atlanta Grand Riverside Riverside Columbus Columbus OklahomaMeasure HCD LFA Rapids a HCD LFA Integrated Traditional Detroit City Portland
Employment Preparation Strategy
Percent who leantoward Labor Force Attachment 0.0 27.3 30.4 46.7 83.0 4.6 5.3 0.0 3.0 18.9
Percent who leantoward Human CapitalDevelopment 87.5 54.6 43.5 26.7 8.5 68.2 65.8 72.2 87.9 37.7
Percent who encourage clients to take any job 50.0 81.8 73.9 100.0 95.8 57.1 34.2 55.6 44.9 54.0
Percent who encourage clients to be selective in taking a job 25.0 0.0 4.4 0.0 2.1 14.3 31.6 5.6 23.7 16.0
Personalized Attention and Encouragement
Percent who try to learn in depth about clients' needs, interests, and backgroundsduring program intake 93.8 50.0 21.7 75.0 47.8 63.6 46.0 16.7 39.3 61.5
Percent who try to identify and remove barriers to client participation 100.0 90.9 87.0 100.0 100.0 81.8 82.1 44.4 80.0 90.7
Percent who encourage and provide positivereinforcement to clients 31.3 36.4 27.3 62.5 50.0 52.4 38.5 22.2 23.0 39.6
(continued)
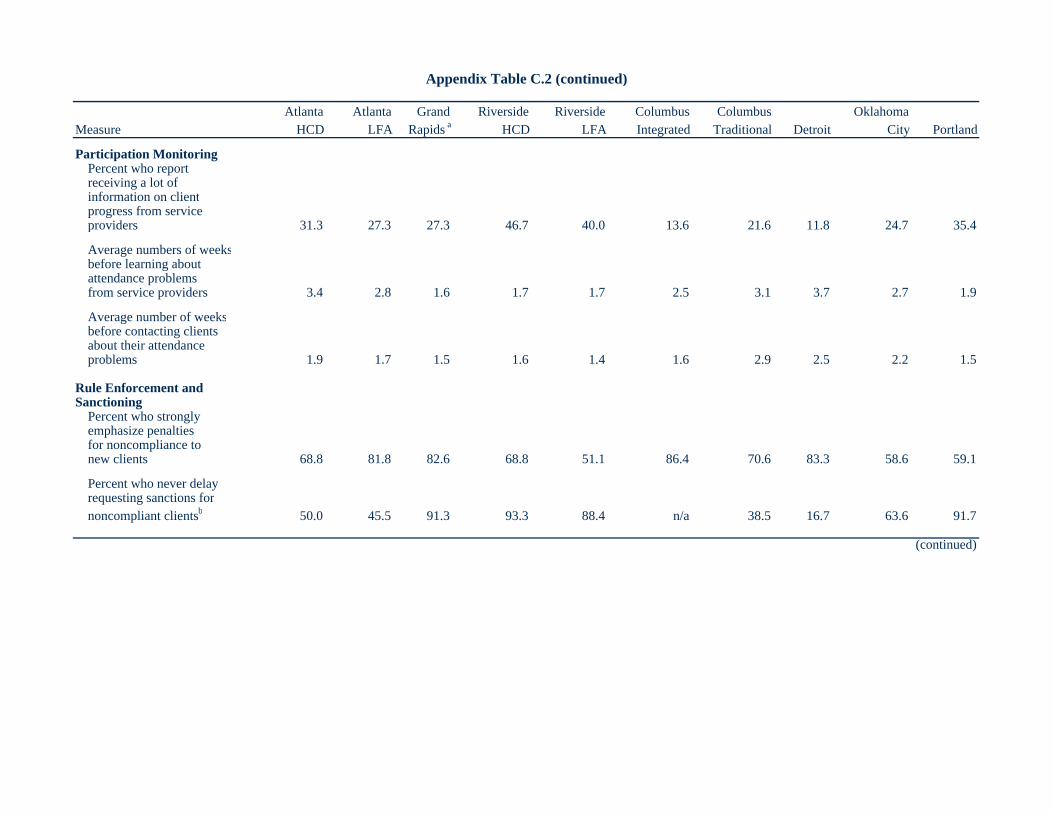
Appendix Table C.2 (continued)
Atlanta Atlanta Grand Riverside Riverside Columbus Columbus OklahomaMeasure HCD LFA Rapids a HCD LFA Integrated Traditional Detroit City Portland
Participation MonitoringPercent who report receiving a lot of information on clientprogress from serviceproviders 31.3 27.3 27.3 46.7 40.0 13.6 21.6 11.8 24.7 35.4
Average numbers of weeksbefore learning about attendance problems from service providers 3.4 2.8 1.6 1.7 1.7 2.5 3.1 3.7 2.7 1.9
Average number of weeksbefore contacting clients about their attendance problems 1.9 1.7 1.5 1.6 1.4 1.6 2.9 2.5 2.2 1.5
Rule Enforcement and Sanctioning
Percent who strongly emphasize penalties for noncompliance to new clients 68.8 81.8 82.6 68.8 51.1 86.4 70.6 83.3 58.6 59.1
Percent who never delayrequesting sanctions fornoncompliant clientsb 50.0 45.5 91.3 93.3 88.4 n/a 38.5 16.7 63.6 91.7
(continued)

Appendix Table C.2 (continued)
MeasureAtlanta
HCDAtlanta
LFAGrand
Rapids aRiverside
HCDRiverside
LFAColumbus Integrated
Columbus Traditional Detroit
Oklahoma City Portland
Staff Supervision,Evaluation, and Training
Percent who say theyreceived helpful training on how to be an effective case manager 81.3 45.5 21.7 60.0 51.1 31.8 38.5 38.9 34.3 48.1
Percent who say that supervisors pay close attention to casemanager performance 93.8 90.9 78.3 87.5 93.0 95.5 82.1 72.2 53.0 92.6
Percent who report goodcommunication with program administrators 43.8 18.2 13.0 31.3 43.8 36.4 53.9 76.5 34.5 35.3
Percent who say that good performance is recognized 37.5 36.4 47.8 56.3 53.2 50.0 30.8 22.2 26.9 40.7
Percent who report high job satisfaction 12.5 9.1 26.1 25.0 27.7 4.6 28.2 5.6 9.5 22.2
Perceptions of the Effectiveness of JOBS
Percent who think JOBS will help clients becomeself-supporting 81.3 90.9 82.6 93.8 89.6 81.8 74.4 38.9 62.0 98.2
Sample sizec 16 11 23 16 48 22 39 18 202 54
SOURCES: Integrated and JOBS Staff Activities and Attitudes Surveys.
NOTES: aThe same Grand Rapids staff worked with both LFA and HCD sample members. bThis scale indicates responses of JOBS staff only. cSample sizes may vary because not all survey items were applicable to some staff.

Appendix Table C.3
National Evaluation of Welfare-to-Work Strategies
Selected Client Survey Measures
Portland JOBS Program
Grand GrandAtlanta Atlanta Rapids Rapids Riverside Riverside Columbus Columbus Oklahoma
Measure HCD LFA HCD LFA HCD LFA Integrated Traditional Detroit City Portland
Employment Preparation Strategy
Percent who feelpushed to take a job 29.1 39.7 38.7 47.4 46.2 56.2 43.2 28.8 32.2 24.3 44.6
Personalized Attentionand Encouragement
Percent who feel theirJOBS case managerknows a lot about them and their family 42.5 44.1 27.7 25.9 39.6 35.7 53.5 38.0 32.1 43.0 35.5
Percent who believe JOBS staff would help them resolve problems that affected their participation in JOBS 43.8 46.5 26.3 25.0 44.0 45.5 54.8 38.6 32.2 35.3 40.9
Rule Enforcement and Sanctioning
Percent who say they wereinformed about penaltiesfor noncompliance 68.8 67.9 82.4 80.9 71.9 69.5 68.2 69.1 58.1 44.8 67.6
Percent who felt the JOBS staff just wanted to enforce the rules 52.0 57.4 63.8 71.8 64.9 61.8 64.0 59.6 58.7 49.8 58.8
(continued)

Appendix Table C.3 (continued)
Grand GrandAtlanta Atlanta Rapids Rapids Riverside Riverside Columbus Columbus Oklahoma
Measure HCD LFA HCD LFA HCD LFA Integrated Traditional Detroit City Portland
Perceptions of Effectiveness of JOBS
Percent who think the program improved their long-run chances of getting or keeping a job 39.3 39.4 28.0 30.5 34.9 32.1 42.3 37.5 43.3 32.0 42.2
Sample size 1,113 804 574 574 621 564 371 366 210 259 297
SOURCE: MDRC calculations from the Two-Year Client survey.
NOTES: Eligible sample members in Columbus, Detroit, and Oklahoma City had an equal chance of being chosen to be interviewed. In contrast, sample members in Atlanta, Grand Rapids, Portland, and Riverside had a greater or lesser chance depending one their background characteristics or month of random assignment. To compensate for these differences, survey respondents in these four sites were weighted by the inverse of their probabilty of selection.

Appendix D
Supplementary Tables and Figure to Chapter 3

Appendix Table D.1
National Evaluation of Welfare-to-Work Strategie
Rates of Participation Within a Two-Year Follow-Up Periodby High School Diploma/GED Status and Youngest Child's Ag
Portland JOBS Program
Full High School No High School Youngest Youngest Child YoungestParticipation Diploma or Diploma or Child 2 Years Between 3 and Child 6 Years
Activity Measure Sample (%) GED (%) GED (%) Old or Younger (%) 5 Years (%) Old or Older (%)
Participated in any activity (jobsearch, education, training, workexperience, or life skills training) a 61.1 62.0 58.7 68.5 63.4 52.2
Participated in any activity, excluding any client-initiated activities 57.8 59.3 54.7 65.8 58.5 49.3
Participated in job searchb 42.7 50.0 32.0 46.6 41.5 40.3Job club 37.8 44.4 28.0 41.1 41.5 32.8Individual job search 11.9 13.9 8.0 12.3 9.8 11.9Initial work search 7.0 9.3 4.0 5.5 9.8 7.5
Participated in any education ortraining 30.3 24.1 38.7 39.7 39.0 14.9
Participated in education 18.4 8.3 33.3 27.4 22.0 7.5Basic education 16.8 6.5 32.0 26.0 17.1 7.5
ESLc 0.5 0.0 1.3 1.4 0.0 0.0ABE 2.7 1.9 4.0 2.7 4.9 1.5GED preparation 11.4 0.9 26.7 16.4 12.2 6.0High school 0.0 0.0 0.0 0.0 0.0 0.0Basic skills upgraded 2.2 3.7 0.0 5.5 0.0 0.0
College 2.2 2.8 1.3 2.7 4.9 0.0
Participated in education, excluding client-initiatededucation 16.8 6.5 32.0 26.0 17.1 7.5
(continued)
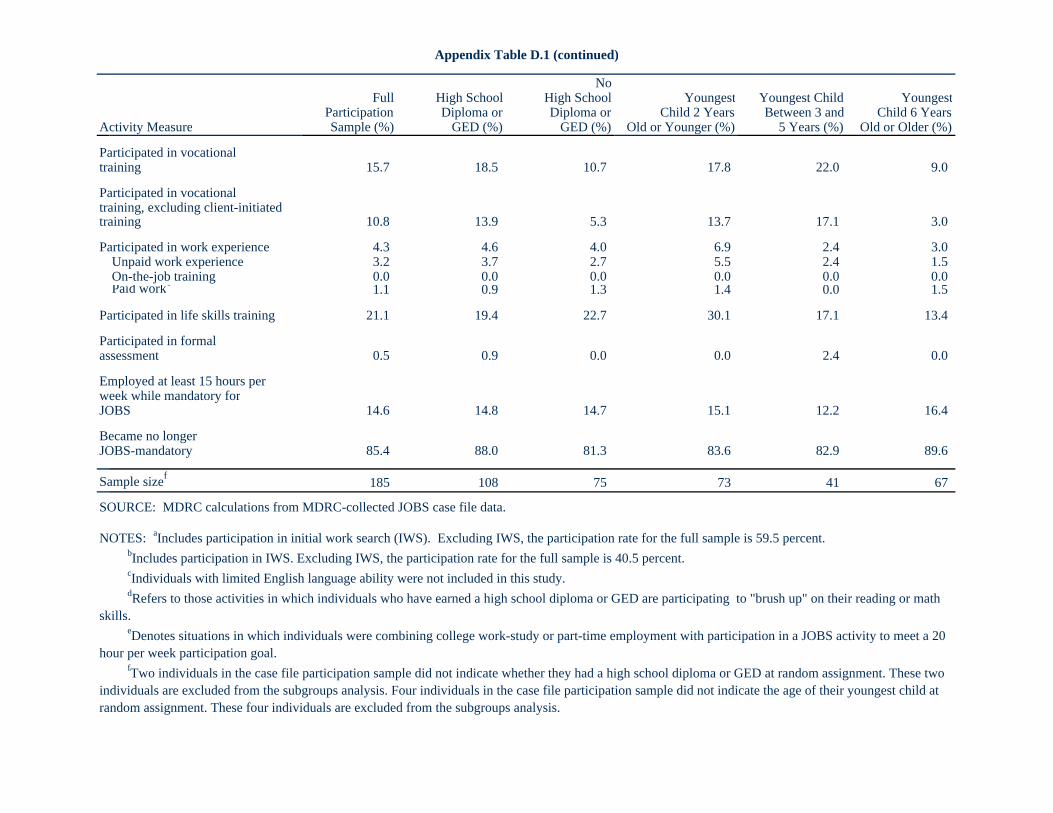
Appendix Table D.1 (continued)
NoFull High School High School Youngest Youngest Child Youngest
Participation Diploma or Diploma or Child 2 Years Between 3 and Child 6 YearsActivity Measure Sample (%) GED (%) GED (%) Old or Younger (%) 5 Years (%) Old or Older (%)
Participated in vocational training 15.7 18.5 10.7 17.8 22.0 9.0
Participated in vocational training, excluding client-initiatedtraining 10.8 13.9 5.3 13.7 17.1 3.0
Participated in work experience 4.3 4.6 4.0 6.9 2.4 3.0Unpaid work experience 3.2 3.7 2.7 5.5 2.4 1.5On-the-job training 0.0 0.0 0.0 0.0 0.0 0.0Paid worke 1.1 0.9 1.3 1.4 0.0 1.5
Participated in life skills training 21.1 19.4 22.7 30.1 17.1 13.4
Participated in formalassessment 0.5 0.9 0.0 0.0 2.4 0.0
Employed at least 15 hours per week while mandatory forJOBS 14.6 14.8 14.7 15.1 12.2 16.4
Became no longer JOBS-mandatory 85.4 88.0 81.3 83.6 82.9 89.6
Sample sizef 185 108 75 73 41 67
SOURCE: MDRC calculations from MDRC-collected JOBS case file data.
NOTES: aIncludes participation in initial work search (IWS). Excluding IWS, the participation rate for the full sample is 59.5 percent. bIncludes participation in IWS. Excluding IWS, the participation rate for the full sample is 40.5 percent. cIndividuals with limited English language ability were not included in this study. dRefers to those activities in which individuals who have earned a high school diploma or GED are participating to "brush up" on their reading or math skills. eDenotes situations in which individuals were combining college work-study or part-time employment with participation in a JOBS activity to meet a 20 hour per week participation goal. fTwo individuals in the case file participation sample did not indicate whether they had a high school diploma or GED at random assignment. These two individuals are excluded from the subgroups analysis. Four individuals in the case file participation sample did not indicate the age of their youngest child at random assignment. These four individuals are excluded from the subgroups analysis.
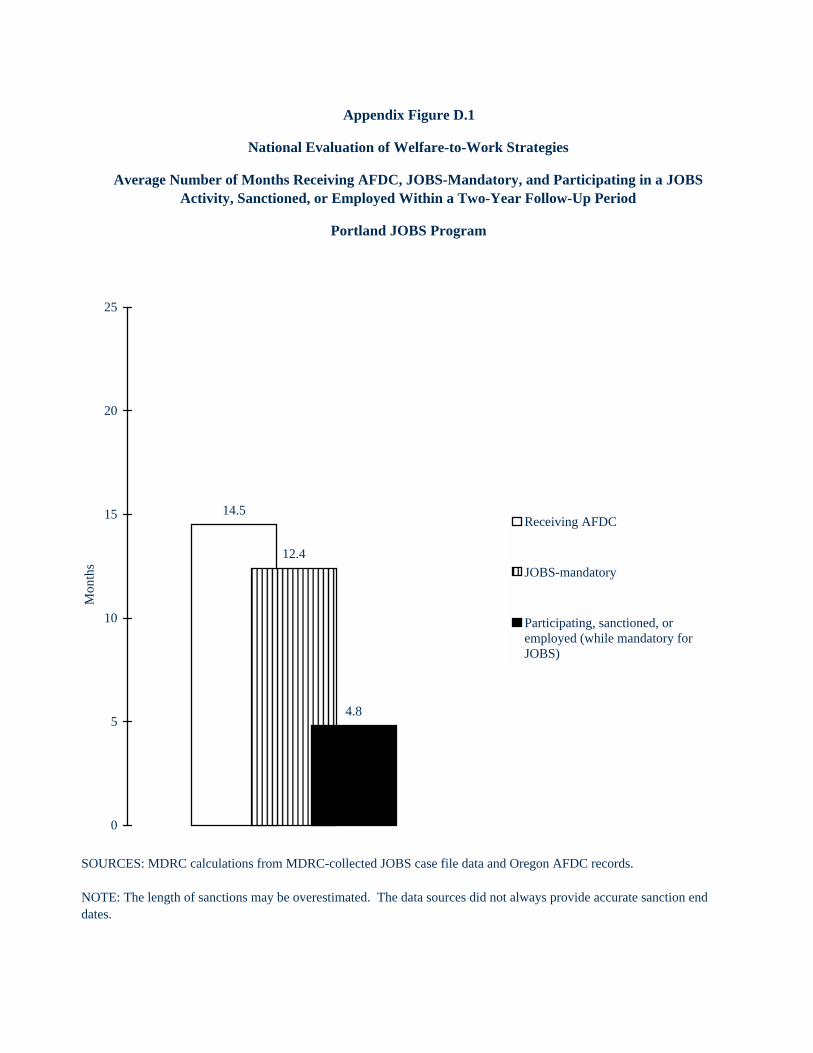
14.5
12.4
4.8
0
5
10
15
20
25
Receiving AFDC
JOBS-mandatory
Participating, sanctioned, oremployed (while mandatory forJOBS)
Appendix Figure D.1
National Evaluation of Welfare-to-Work Strategies
Average Number of Months Receiving AFDC, JOBS-Mandatory, and Participating in a JOBS Activity, Sanctioned, or Employed Within a Two-Year Follow-Up Period
Portland JOBS Program
SOURCES: MDRC calculations from MDRC-collected JOBS case file data and Oregon AFDC records.
NOTE: The length of sanctions may be overestimated. The data sources did not always provide accurate sanction end dates.
Mon
ths

Appendix Table D.2
National Evaluation of Welfare-to-Work Strategies
Participation of Program Group Members in Job Search, Education, Training, and Work Experience,
Within a Two-Year Follow-Up Period,by Whether Participation was Part of JOBS or Outside JOBS
Portland JOBS Program
Participation ParticipationOutcome As Part of JOBS Outside of JOBS Total
Percent participated in:Job searcha 56.7 2.0 58.6Basic education 18.2 7.6 25.8Vocational training or collegeb 16.5 15.6 31.2Work experience or on-the-job training 9.1 3.8 12.9
Sample size 297 297 297
SOURCES: MDRC calculations from the Two-Year Client Survey, adjusted using MDRC-collected JOBS case file data.
NOTES: aFor program group members, this measure includes participation in life skills training and initial work search. bParticipation as part of JOBS and participation outside of JOBS in vocational training or college do not sum to total participation because some sample members participated in these activities both as part of JOBS and outside of JOBS.

Appendix Table D.3
National Evaluation of Welfare-to-Work Strategies
Two-Year Impacts on Participation in Job Search, Education, Training, and Work Experience, and Sanctioning
Based on Client Survey Data Only
Portland JOBS Program
Hours of PartParticipated or Sanctioned (%) Hours of Participation Among Parti
Program Control Difference Program Control Difference Program ContOutcome Group Group (Impact) Group Group (Impact) Group Gro
Participated in:Any activity 63.9 37.1 26.7 *** 260.0 160.7 99.3 ** 407.1 432Job searcha 40.4 8.2 32.2 *** 46.3 6.9 39.4 *** 114.5 83Education or training activity 39.1 29.2 10.0 ** 213.7 153.9 59.8 546.2 52
Basic education 15.3 10.0 5.3 ** 63.6 22.7 40.9 ** 415.5 22ABE or GED 15.3 8.9 6.4 ** 58.3 17.8 40.4 *** 382.2 200ESL 0.0 0.0 0.0 0.0 0.0 0.0 0.0 0High school 0.3 1.2 -0.8 5.3 4.8 0.4 1544.8 419
Vocational training or college 28.7 21.0 7.6 ** 150.2 131.2 19.0 523.8 624Work experience or on-the-job
training 9.4 2.3 7.1 *** n/a n/a n/a n/a n
Sanctionedb (%) 18.4 4.4 14.0 *** n/a n/a n/a n/a n
Sample sizec 297 313 297 313 (varies) (vari
SOURCES: MDRC calculations from the Two-Year Client Survey.NOTES: Measures in this table represent weighted averages. Respondents were weighted to replicate the proportion of program and control group members in the larger impact sample. Estimates are regression-adjusted using ordinary least squares, controlling for pre-random assignment characteristics of sample members. Numbers may not add up to 100 percent because of rounding. Differences between program group members and control group members (shown in italics) for "Hours of Participation Among Participants" are not true experimental comparisons; statistical tests were not performed. A two-tailed t-test was applied to differences between outcomes for the program and control groups. Statistical significance levels are indicated as: * = 10 percent; ** = 5 percent; and *** = 1 percent. N/a = not available or applicable. a For program group members, this measure includes participation in life skills training and initial work search. bSanctioned between date of random assignment and date of survey interview. cSample sizes for individual measures vary because of missing values.

Appendix Table D.4
National Evaluation of Welfare-to-Work Strategies
Two-Year Impacts on Participation in Job Search, Education,Training and Work Experience, and Sanctioning,
by High School Diploma/GED Status
Portland JOBS Program
Hours of ParticipatiParticipated or Sanctioned (%) Hours of Participation Among ParticipanProgram Control Program Control Program Control
Outcome Group Group Difference Group Group Difference Group Group
For those with a high schooldiploma or GED:
Participated in :Job searcha 58.8 8.5 50.3 70.8 5.6 65.2 120.5 65.8Basic education 5.3 0.7 4.7 24.9 1.6 23.3 468.1 246.4Vocational training or college 37.3 28.9 8.4 203.0 209.0 -6.0 543.9 722.5Work experience oron-the-job training 10.5 1.9 8.6 n/a n/a n/a n/a n/a
Sanctionedb 16.1 4.9 11.2 n/a n/a n/a n/a n/a
Sample sizec 199 216 199 216 (varies) (varies)
For those without a high schooldiploma or GED:
Participated in :Job searcha 56.4 8.0 48.4 59.9 6.0 53.9 106.2 74.7Basic education 50.5 30.9 19.5 201.9 63.7 138.1 400.0 206.0Vocational training or college 21.9 12.2 9.7 85.0 30.0 55.0 388.4 246.5Work experience or on-the-job training 16.9 3.7 13.2 n/a n/a n/a n/a n/a
Sanctionedb 22.9 4.6 18.3 n/a n/a n/a n/a n/a
Sample sizec 97 92 97 92 (varies) (varies)(continued)

Appendix Table D.4 (continued)
SOURCES: MDRC calculations from the Two-Year Client Survey, adjusted using MDRC-collected JOBS case file data.
NOTES: Test of statistical significance were not performed. Measures in this table represent weighted averages. Respondents were weighted to replicate the proportion of program and control group members in the larger impact sample. Estimates are regression-adjusted using ordinary least squares, controlling for pre-random assignment characteristics of sample members. Numbers may not add up to 100 percent because of rounding. Differences between program group members and control group members (shown in italics) for "Hours of Participation Among Participants" are not true experimental comparisons. N/a = not available or applicable. aFor program group members, this measure includes participation in life skills training and initial work search. bSanctioned between date of random assignment and date of survey interview. cTwo individuals in the case file participation sample did not indicate whether they had a high school diploma or GED at random assignment. These two individuals are excluded from the subgroup analysis. Sample sizes for individual measures vary because of missing values.

Appendix E
Supplementary Table to Chapter 4
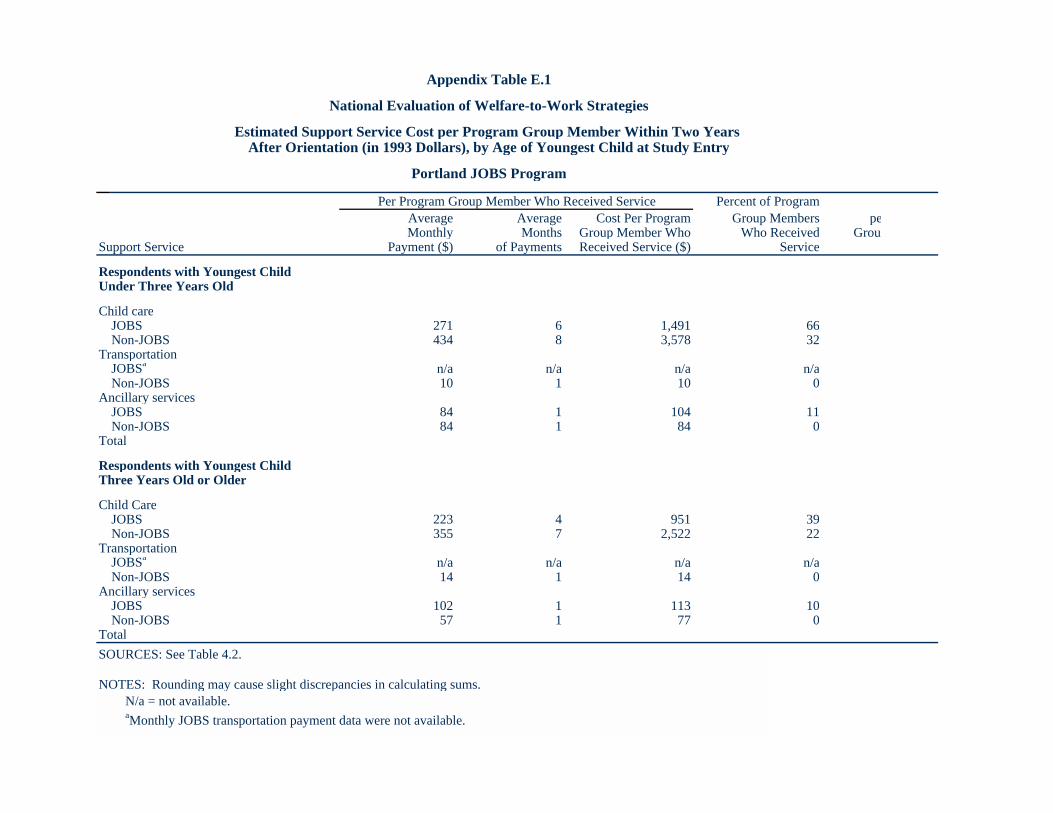
Appendix Table E.1
National Evaluation of Welfare-to-Work Strategies
Estimated Support Service Cost per Program Group Member Within Two Years After Orientation (in 1993 Dollars), by Age of Youngest Child at Study Entry
Portland JOBS Program
Per Program Group Member Who Received Service Percent of ProgramAverage Average Cost Per Program Group Members peMonthly Months Group Member Who Who Received Group
Support Service Payment ($) of Payments Received Service ($) Service
Respondents with Youngest Child Under Three Years Old
Child careJOBS 271 6 1,491 66Non-JOBS 434 8 3,578 32
TransportationJOBSa n/a n/a n/a n/aNon-JOBS 10 1 10 0
Ancillary servicesJOBS 84 1 104 11Non-JOBS 84 1 84 0
Total
Respondents with Youngest Child Three Years Old or Older
Child CareJOBS 223 4 951 39Non-JOBS 355 7 2,522 22
TransportationJOBSa n/a n/a n/a n/aNon-JOBS 14 1 14 0
Ancillary servicesJOBS 102 1 113 10Non-JOBS 57 1 77 0
TotalSOURCES: See Table 4.2.
NOTES: Rounding may cause slight discrepancies in calculating sums. N/a = not available. aMonthly JOBS transportation payment data were not available.

Appendix F
Supplementary Tables and Figure to Chapter 5
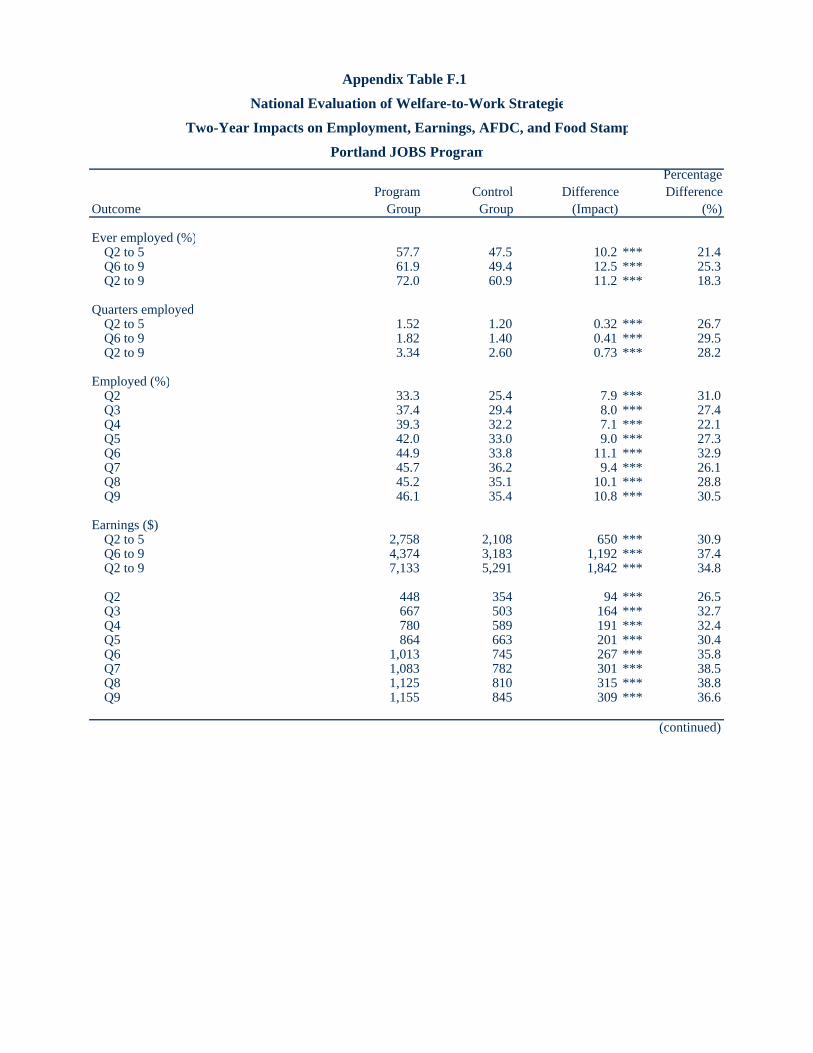
Appendix Table F.1
National Evaluation of Welfare-to-Work Strategie
Two-Year Impacts on Employment, Earnings, AFDC, and Food Stamp
Portland JOBS Program
OutcomeProgram
GroupControl
GroupDifference
(Impact)
Percentage Difference
(%)
Ever employed (%)Q2 to 5 57.7 47.5 10.2 *** 21.4Q6 to 9 61.9 49.4 12.5 *** 25.3Q2 to 9 72.0 60.9 11.2 *** 18.3
Quarters employedQ2 to 5 1.52 1.20 0.32 *** 26.7Q6 to 9 1.82 1.40 0.41 *** 29.5Q2 to 9 3.34 2.60 0.73 *** 28.2
Employed (%)Q2 33.3 25.4 7.9 *** 31.0Q3 37.4 29.4 8.0 *** 27.4Q4 39.3 32.2 7.1 *** 22.1Q5 42.0 33.0 9.0 *** 27.3Q6 44.9 33.8 11.1 *** 32.9Q7 45.7 36.2 9.4 *** 26.1Q8 45.2 35.1 10.1 *** 28.8Q9 46.1 35.4 10.8 *** 30.5
Earnings ($) Q2 to 5 2,758 2,108 650 *** 30.9Q6 to 9 4,374 3,183 1,192 *** 37.4Q2 to 9 7,133 5,291 1,842 *** 34.8
Q2 448 354 94 *** 26.5Q3 667 503 164 *** 32.7Q4 780 589 191 *** 32.4Q5 864 663 201 *** 30.4Q6 1,013 745 267 *** 35.8Q7 1,083 782 301 *** 38.5Q8 1,125 810 315 *** 38.8Q9 1,155 845 309 *** 36.6
(continued)

Appendix Table F.1 (continued
Program Control DifferencePercentage Difference
Outcome Group Group (Impact) (%)
Ever received AFDC (%)Q2 to 5 93.0 93.3 -0.3 -0.3Q6 to 9 60.4 68.7 -8.4 *** -12.2Q2 to 9 93.5 93.8 -0.3 -0.3
Months received AFDC Q2 to 5 8.01 8.97 -0.96 *** -10.7Q6 to 9 5.10 6.56 -1.46 *** -22.2Q2 to 9 13.12 15.54 -2.42 *** -15.6
Received AFDC (%)Q2 91.0 92.4 -1.4 * -1.5Q3 75.9 82.7 -6.8 *** -8.3Q4 67.5 75.2 -7.7 *** -10.3Q5 60.3 69.7 -9.4 *** -13.5Q6 53.9 64.7 -10.8 *** -16.8Q7 49.2 60.8 -11.6 *** -19.0Q8 45.4 57.1 -11.7 *** -20.4Q9 41.3 53.1 -11.8 *** -22.2
AFDC amount ($)Q2 to 5 3,569 4,040 -471 *** -11.6Q6 to 9 2,249 2,974 -726 *** -24.4Q2 to 9 5,818 7,014 -1,196 *** -17.1
Q2 1,126 1,168 -42 *** -3.6Q3 915 1,036 -121 *** -11.7Q4 805 955 -149 *** -15.6Q5 722 881 -158 *** -18.0Q6 639 822 -183 *** -22.3Q7 580 759 -179 *** -23.6Q8 534 722 -187 *** -26.0Q9 496 672 -176 *** -26.2
(continued)

Appendix Table F.1 (continued)
Program Control DifferencePercentage Difference
Outcome Group Group (Impact) (%)
Ever received Food Stamps (%)Q2 to 5 92.6 93.4 -0.9 -0.9Q6 to 9 73.2 78.0 -4.7 *** -6.0Q2 to 9 93.3 94.2 -0.9 -0.9
Months received Food StampsQ2 to 5 9.05 9.66 -0.61 *** -6.3Q6 to 9 6.98 7.80 -0.82 *** -10.5Q2 to 9 16.04 17.46 -1.43 *** -8.2
Received Food Stamps (%)Q2 91.2 92.1 -0.9 -1.0Q3 82.0 86.3 -4.3 *** -5.0Q4 76.3 80.8 -4.5 *** -5.6Q5 71.3 77.6 -6.3 *** -8.1Q6 66.7 73.8 -7.1 *** -9.6Q7 63.8 71.0 -7.2 *** -10.1Q8 61.3 66.7 -5.4 *** -8.1Q9 58.5 63.8 -5.3 *** -8.4
Food Stamps amount ($)Q2 to 5 2,220 2,422 -202 *** -8.3Q6 to 9 1,716 1,969 -253 *** -12.9Q2 to 9 3,935 4,391 -456 *** -10.4
Q2 641 670 -29 *** -4.4Q3 564 620 -56 *** -9.1Q4 528 581 -53 *** -9.2Q5 487 550 -63 *** -11.5Q6 455 527 -72 *** -13.7Q7 440 505 -65 *** -13.0Q8 421 484 -63 *** -13.0Q9 400 453 -53 *** -11.7
Sample size (total = 5,547) 3,529 2,018 SOURCES: MDRC calculations from Oregon unemployment insurance (UI) earnings records, AFDC and Food Stamps records.
NOTES: Estimates are regression-adjusted using ordinary least squares, controlling for pre-random assignment characteristics of sample members. For all measures, the quarter of random assignment refers to the calendar quarter in which random assignment occurred. Because quarter 1, the quarter of random assignment, may contain some earnings and AFDC payments from the period prior to random assignment, it is excluded from follow-up measures. "Percentage difference" equals 100 times "difference" divided by "control group." Rounding may cause slight discrepancies in calculating sums and differences. A two-tailed t-test was applied to differences between outcomes for the program and control groups. Statistical significance levels are indicated as: * = 10 percent; ** = 5 percent; and *** = 1 percent.
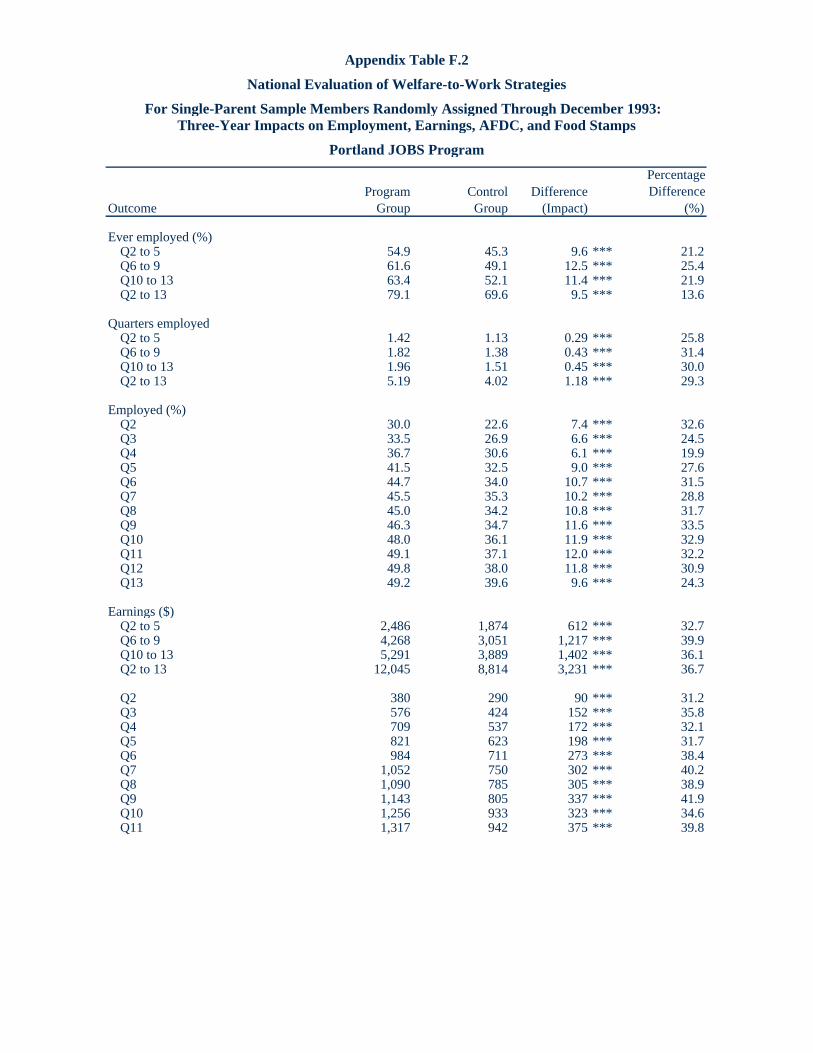
Appendix Table F.2
National Evaluation of Welfare-to-Work Strategies
For Single-Parent Sample Members Randomly Assigned Through December 1993: Three-Year Impacts on Employment, Earnings, AFDC, and Food Stamps
Portland JOBS Program
Program Control DifferencePercentage Difference
Outcome Group Group (Impact) (%)
Ever employed (%)Q2 to 5 54.9 45.3 9.6 *** 21.2Q6 to 9 61.6 49.1 12.5 *** 25.4Q10 to 13 63.4 52.1 11.4 *** 21.9Q2 to 13 79.1 69.6 9.5 *** 13.6
Quarters employedQ2 to 5 1.42 1.13 0.29 *** 25.8Q6 to 9 1.82 1.38 0.43 *** 31.4Q10 to 13 1.96 1.51 0.45 *** 30.0Q2 to 13 5.19 4.02 1.18 *** 29.3
Employed (%)Q2 30.0 22.6 7.4 *** 32.6Q3 33.5 26.9 6.6 *** 24.5Q4 36.7 30.6 6.1 *** 19.9Q5 41.5 32.5 9.0 *** 27.6Q6 44.7 34.0 10.7 *** 31.5Q7 45.5 35.3 10.2 *** 28.8Q8 45.0 34.2 10.8 *** 31.7Q9 46.3 34.7 11.6 *** 33.5Q10 48.0 36.1 11.9 *** 32.9Q11 49.1 37.1 12.0 *** 32.2Q12 49.8 38.0 11.8 *** 30.9Q13 49.2 39.6 9.6 *** 24.3
Earnings ($)Q2 to 5 2,486 1,874 612 *** 32.7Q6 to 9 4,268 3,051 1,217 *** 39.9Q10 to 13 5,291 3,889 1,402 *** 36.1Q2 to 13 12,045 8,814 3,231 *** 36.7
Q2 380 290 90 *** 31.2Q3 576 424 152 *** 35.8Q4 709 537 172 *** 32.1Q5 821 623 198 *** 31.7Q6 984 711 273 *** 38.4Q7 1,052 750 302 *** 40.2Q8 1,090 785 305 *** 38.9Q9 1,143 805 337 *** 41.9Q10 1,256 933 323 *** 34.6Q11 1,317 942 375 *** 39.8Q12 1 349 987 363 *** 36 8

Appendix Table F.2 (continued)
Program Control DifferencePercentage Difference
Outcome Group Group (Impact) (%)
Ever received AFDC, Q2 to 5 (%)Q2 to 5 94.2 94.3 -0.1 -0.1Q6 to 9 63.0 72.2 -9.1 *** -12.7Q10 to 13 46.1 56.2 -10.1 *** -18.0Q2 to 13 94.9 94.8 0.1 0.1
Months received AFDCQ2 to 5 8.38 9.29 -0.90 *** -9.7Q6 to 9 5.40 6.88 -1.48 *** -21.5Q10 to 13 3.73 5.25 -1.52 *** -28.9Q2 to 13 17.52 21.42 -3.90 *** -18.2
Received AFDC (%)Q2 92.5 93.6 -1.0 -1.1Q3 78.9 85.0 -6.1 *** -7.2Q4 70.9 78.5 -7.6 *** -9.7Q5 63.0 72.3 -9.4 *** -13.0Q6 55.9 68.0 -12.1 *** -17.8Q7 52.1 63.7 -11.5 *** -18.1Q8 48.6 59.6 -11.0 *** -18.5Q9 44.4 55.8 -11.5 *** -20.5Q10 40.9 51.8 -11.0 *** -21.2Q11 36.9 48.6 -11.7 *** -24.1Q12 33.4 45.5 -12.1 *** -26.6Q13 29.9 42.4 -12.5 *** -29.5
AFDC amount ($)Q2 to 5 3,757 4,192 -435 *** -10.4Q6 to 9 2,379 3,116 -737 *** -23.7Q10 to 13 1,652 2,408 -756 *** -31.4Q2 to 13 7,788 9,715 -1,927 *** -19.8
Q2 1,170 1,193 -23 -1.9Q3 969 1,075 -106 *** -9.9Q4 860 1,006 -146 *** -14.5Q5 759 918 -159 *** -17.4Q6 663 853 -189 *** -22.2Q7 619 800 -181 *** -22.6Q8 567 754 -187 *** -24.8Q9 529 709 -180 *** -25.4Q10 476 665 -189 *** -28.4Q11 427 613 -186 *** -30.3Q12 392 582 -190 *** -32.7Q13 357 548 -191 *** -34.8
(continued)

Appendix Table F.2 (continued)
Program Control DifferencePercentage Difference
Outcome Group Group (Impact) (%)
Ever received Food Stamps (%)Q2 to 5 94.5 95.9 -1.5 * -1.5Q6 to 9 75.5 81.7 -6.2 *** -7.6Q10 to 13 63.8 68.9 -5.1 *** -7.4Q2 to 13 95.5 96.8 -1.3 * -1.3
Months received Food StampsQ2 to 5 9.44 10.14 -0.70 *** -6.9Q6 to 9 7.28 8.23 -0.95 *** -11.6Q10 to 13 6.00 6.92 -0.92 *** -13.3Q2 to 13 22.72 25.29 -2.58 *** -10.2
Received Food Stamps (%)Q2 93.3 94.7 -1.5 * -1.6Q3 85.1 90.2 -5.1 *** -5.6Q4 79.6 85.0 -5.4 *** -6.3Q5 74.6 81.8 -7.2 *** -8.8Q6 68.8 78.1 -9.2 *** -11.8Q7 66.4 75.4 -9.0 *** -12.0Q8 63.9 70.1 -6.1 *** -8.7Q9 60.9 66.5 -5.6 *** -8.4Q10 57.8 64.2 -6.4 *** -9.9Q11 55.9 61.7 -5.8 *** -9.4Q12 52.7 59.8 -7.2 *** -12.0Q13 51.0 58.1 -7.1 *** -12.2
Food Stamps amount ($)Q2 to 5 2,313 2,530 -217 *** -8.6Q6 to 9 1,791 2,057 -265 *** -12.9Q10 to 13 1,457 1,734 -277 *** -16.0Q2 to 13 5,561 6,320 -760 *** -12.0
Q2 663 693 -30 *** -4.3Q3 591 653 -62 *** -9.5Q4 551 608 -56 *** -9.3Q5 507 576 -69 *** -11.9Q6 471 555 -83 *** -15.0Q7 463 531 -69 *** -12.9Q8 438 501 -63 *** -12.6Q9 419 470 -50 *** -10.7Q10 394 458 -64 *** -14.1Q11 375 446 -71 *** -16.0Q12 357 427 -71 *** -16.6Q13 331 402 -71 *** -17.6
Sample size (total=3,375 ) 1,904 1,471

Appendix Figure F.1
National Evaluation of Welfare-to-Work Strategies
Distribution of Sample Members According to Year 2 Income and the Poverty Threshold
Portland JOBS Program
33.4 31.0
45.9 52.4
20.616.6
0%
25%
50%
75%
100%
Program Group Control Group
100% of the poverty level or more50% to less than 100% of the poverty levelLess than 50% of the poverty level
SOURCES: MDRC calculations from Oregon unemployment insurance (UI) earnings records, 1996 edition of Statistical Abstract of the United States for 1992-1994 poverty levels and the U.S. Census Bureau home page, http://www.census.gov/hhes/poverty/threshld/thresh95.html and thresh96.html, for 1995 and 1996 poverty levels respectively.

Appendix Table F.3
National Evaluation of Welfare-to-Work Strategies
Impact on Health Care Coverage for Respondents and Respondents' Children as of the End of Two Years
Portland JOBS Program
Outcome MeasureProgram
GroupControl Group
Difference (Impact)
Percentage Difference
(%)
All Respondents (%)
Respondent has health care coverage 87.1 90.4 -3.3 0.0 -3.7
Dependent children have health care coverage 83.7 88.6 -4.8 0.0 -5.5
Respondent and children have health care coverage 80.5 85.6 -5.1 0.0 -5.9
Respondents Employed in Month Before Interview (%)
Respondent has health care coverage 82.2 87.0 -4.8 -5.6
Dependent children have health care coverage 75.0 80.5 -5.5 -6.8
Respondent and children have health care coverage 70.7 77.9 -7.2 -9.2
SOURCE: MDRC calculations from the Two-Year Client Survey.
NOTES: Health care coverage is the percentage covered by Medicaid, Medicare, or private medical insurance. Measures in this table represent weighted averages. Respondents were weighted to replicate the proportion of program and control group members in the larger impact sample. Estimates are regression-adjusted using ordinary least squares, controlling for pre-random assignment characteristics of sample members. "Percentage difference" equals 100 times "difference" divided by "control group." Differences between program group members and control group members (shown in italics) for "Respondents Employed in Month Before Interview" are not true experimental comparisons. Rounding may cause slight discrepancies in calculating sums and differences. A two-tailed t-test was applied to differences between outcomes for the program and control groups. Statistical significance levels are indicated as: * = 10 percent; ** = 5 percent; and *** = 1 percent.

Appendix Table F.4
National Evaluation of Welfare-to-Work Strategie
For Sample Members with a High School Diploma or GEDTwo-Year Impacts on Employment, Earnings, AFDC, and Food Stamp
Portland JOBS Program
Program Control DifferencePercentage Difference
Outcome Group Group (Impact) (%)
Ever employed (%)Q2 to 5 62.3 51.7 10.6 *** 20.5Q6 to 9 66.0 54.2 11.8 *** 21.8Q2 to 9 75.5 65.5 10.0 *** 15.3
Quarters employedQ2 to 5 1.71 1.34 0.37 *** 27.6Q6 to 9 1.98 1.58 0.40 *** 25.6Q2 to 9 3.69 2.91 0.77 *** 26.5
Employed (%)Q2 37.7 28.5 9.2 *** 32.2Q3 42.1 31.8 10.2 *** 32.1Q4 44.3 36.0 8.4 *** 23.2Q5 46.4 37.4 9.1 *** 24.3Q6 49.1 37.7 11.4 *** 30.3Q7 49.4 40.6 8.7 *** 21.5Q8 49.1 39.6 9.5 *** 24.0Q9 50.5 39.8 10.8 *** 27.0
Earnings ($) Q2 to 5 3,292 2,514 778 *** 31.0Q6 to 9 5,111 3,743 1,368 *** 36.6Q2 to 9 8,403 6,257 2,146 *** 34.3
Q2 531 414 117 *** 28.3Q3 805 592 214 *** 36.1Q4 930 702 228 *** 32.5Q5 1,026 807 219 *** 27.1Q6 1,194 889 306 *** 34.4Q7 1,240 910 330 *** 36.2Q8 1,324 938 386 *** 41.1Q9 1,353 1,006 347 *** 34.5
(continued)

Appendix Table F.4 (continued)
Program Control DifferencePercentage Difference
Outcome Group Group (Impact) (%)
Ever received AFDC (%)Q2 to 5 92.4 92.7 -0.3 -0.3Q6 to 9 56.5 65.8 -9.3 *** -14.1Q2 to 9 92.9 93.0 -0.1 -0.1
Months received AFDC Q2 to 5 7.61 8.83 -1.22 *** -13.8Q6 to 9 4.56 6.17 -1.60 *** -26.0Q2 to 9 12.17 14.99 -2.83 *** -18.8
Received AFDC (%)Q2 90.0 91.7 -1.7 * -1.8Q3 73.3 82.0 -8.8 *** -10.7Q4 63.9 74.2 -10.4 *** -14.0Q5 56.3 68.2 -12.0 *** -17.5Q6 49.9 61.6 -11.6 *** -18.9Q7 44.8 57.9 -13.1 *** -22.7Q8 40.6 54.0 -13.5 *** -24.9Q9 36.6 49.8 -13.2 *** -26.5
AFDC amount ($)Q2 to 5 3,330 3,906 -576 *** -14.7Q6 to 9 1,956 2,751 -794 *** -28.9Q2 to 9 5,286 6,656 -1,370 *** -20.6
Q2 1,090 1,138 -48 *** -4.2Q3 854 1,008 -154 *** -15.3Q4 735 924 -189 *** -20.5Q5 651 835 -184 *** -22.1Q6 567 766 -199 *** -26.0Q7 506 702 -196 *** -28.0Q8 460 668 -208 *** -31.2Q9 424 615 -191 *** -31.0
(continued)
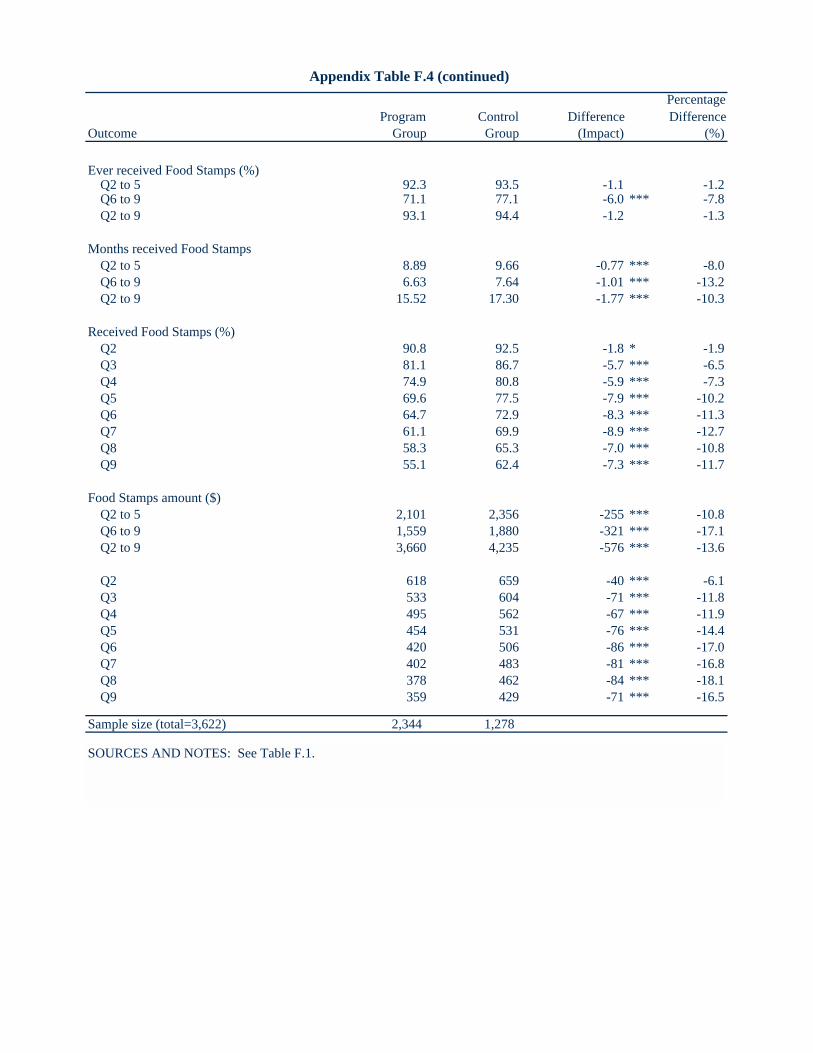
Appendix Table F.4 (continued)
Program Control DifferencePercentage Difference
Outcome Group Group (Impact) (%)
Ever received Food Stamps (%)Q2 to 5 92.3 93.5 -1.1 -1.2Q6 to 9 71.1 77.1 -6.0 *** -7.8Q2 to 9 93.1 94.4 -1.2 -1.3
Months received Food StampsQ2 to 5 8.89 9.66 -0.77 *** -8.0Q6 to 9 6.63 7.64 -1.01 *** -13.2Q2 to 9 15.52 17.30 -1.77 *** -10.3
Received Food Stamps (%)Q2 90.8 92.5 -1.8 * -1.9Q3 81.1 86.7 -5.7 *** -6.5Q4 74.9 80.8 -5.9 *** -7.3Q5 69.6 77.5 -7.9 *** -10.2Q6 64.7 72.9 -8.3 *** -11.3Q7 61.1 69.9 -8.9 *** -12.7Q8 58.3 65.3 -7.0 *** -10.8Q9 55.1 62.4 -7.3 *** -11.7
Food Stamps amount ($)Q2 to 5 2,101 2,356 -255 *** -10.8Q6 to 9 1,559 1,880 -321 *** -17.1Q2 to 9 3,660 4,235 -576 *** -13.6
Q2 618 659 -40 *** -6.1Q3 533 604 -71 *** -11.8Q4 495 562 -67 *** -11.9Q5 454 531 -76 *** -14.4Q6 420 506 -86 *** -17.0Q7 402 483 -81 *** -16.8Q8 378 462 -84 *** -18.1Q9 359 429 -71 *** -16.5
Sample size (total=3,622) 2,344 1,278
SOURCES AND NOTES: See Table F.1.

Appendix Table F.5
National Evaluation of Welfare-to-Work Strategie
For Sample Members Without a High School Diploma or GEDTwo-Year Impacts on Employment, Earnings, AFDC, and Food Stamp
Portland JOBS Program
Program Control DifferencePercentage Difference
Outcome Group Group (Impact) (%)
Ever employed (%)Q2 to 5 48.5 39.3 9.2 *** 23.4Q6 to 9 53.9 40.5 13.5 *** 33.2Q2 to 9 65.3 52.1 13.2 *** 25.2
Quarters employedQ2 to 5 1.15 0.93 0.22 *** 23.8Q6 to 9 1.50 1.07 0.43 *** 40.6Q2 to 9 2.65 1.99 0.65 *** 32.8
Employed (%)Q2 24.1 18.9 5.2 *** 27.6Q3 28.2 24.4 3.8 * 15.6Q4 29.4 24.7 4.7 ** 19.1Q5 32.9 24.6 8.3 *** 33.7Q6 36.4 26.2 10.2 *** 39.0Q7 38.4 27.7 10.8 *** 38.9Q8 37.9 26.2 11.7 *** 44.5Q9 37.4 26.7 10.8 *** 40.3
Earnings ($) Q2 to 5 1,689 1,294 395 *** 30.5Q6 to 9 2,903 2,021 882 *** 43.6Q2 to 9 4,591 3,315 1,277 *** 38.5
Q2 281 228 52 22.9Q3 392 322 70 * 21.6Q4 480 361 119 ** 33.0Q5 536 382 154 *** 40.3Q6 647 454 193 *** 42.6Q7 764 516 248 *** 48.0Q8 731 537 194 *** 36.1Q9 760 514 247 *** 48.0
(continued)
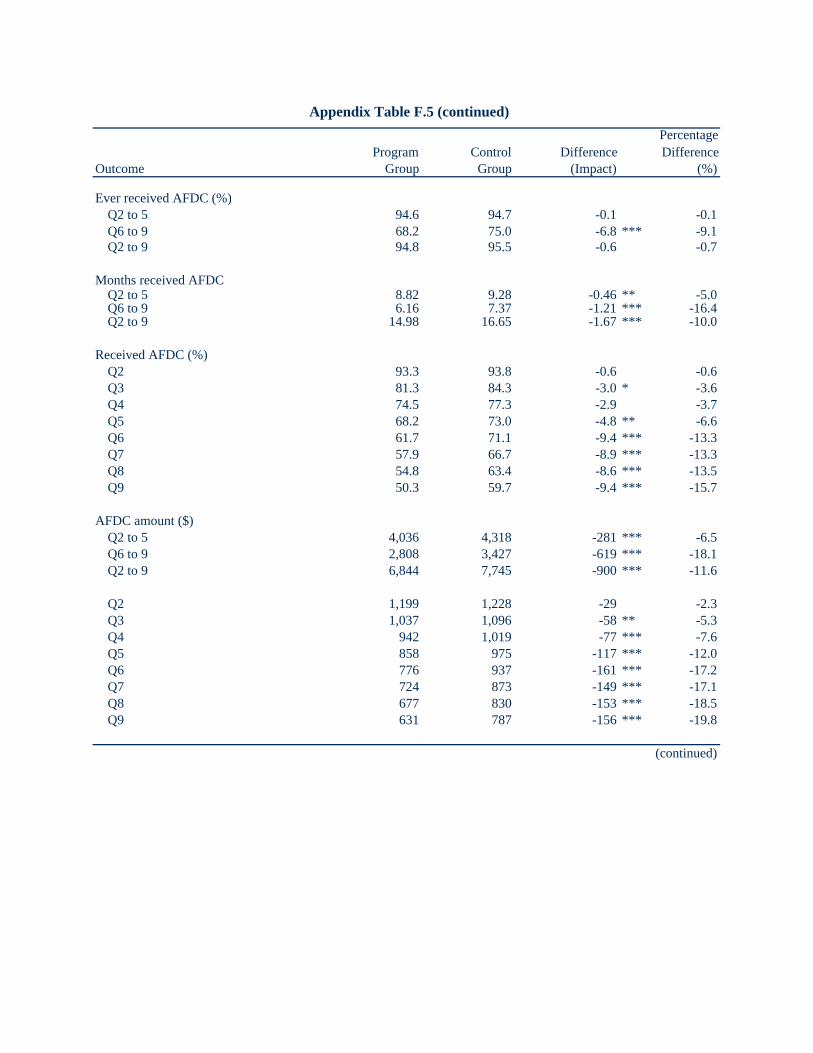
Appendix Table F.5 (continued)
Program Control DifferencePercentage Difference
Outcome Group Group (Impact) (%)
Ever received AFDC (%)Q2 to 5 94.6 94.7 -0.1 -0.1Q6 to 9 68.2 75.0 -6.8 *** -9.1Q2 to 9 94.8 95.5 -0.6 -0.7
Months received AFDC Q2 to 5 8.82 9.28 -0.46 ** -5.0Q6 to 9 6.16 7.37 -1.21 *** -16.4Q2 to 9 14.98 16.65 -1.67 *** -10.0
Received AFDC (%)Q2 93.3 93.8 -0.6 -0.6Q3 81.3 84.3 -3.0 * -3.6Q4 74.5 77.3 -2.9 -3.7Q5 68.2 73.0 -4.8 ** -6.6Q6 61.7 71.1 -9.4 *** -13.3Q7 57.9 66.7 -8.9 *** -13.3Q8 54.8 63.4 -8.6 *** -13.5Q9 50.3 59.7 -9.4 *** -15.7
AFDC amount ($)Q2 to 5 4,036 4,318 -281 *** -6.5Q6 to 9 2,808 3,427 -619 *** -18.1Q2 to 9 6,844 7,745 -900 *** -11.6
Q2 1,199 1,228 -29 -2.3Q3 1,037 1,096 -58 ** -5.3Q4 942 1,019 -77 *** -7.6Q5 858 975 -117 *** -12.0Q6 776 937 -161 *** -17.2Q7 724 873 -149 *** -17.1Q8 677 830 -153 *** -18.5Q9 631 787 -156 *** -19.8
(continued)

Appendix Table F.5 (continued)
Program Control DifferencePercentage Difference
Outcome Group Group (Impact) (%)
Ever received Food Stamps (%)Q2 to 5 93.0 93.9 -0.9 -1.0Q6 to 9 77.6 80.1 -2.4 -3.0Q2 to 9 93.7 94.4 -0.6 -0.7
Months received Food StampsQ2 to 5 9.38 9.75 -0.37 * -3.8Q6 to 9 7.69 8.18 -0.49 ** -6.0Q2 to 9 17.07 17.93 -0.86 ** -4.8
Received Food Stamps (%)Q2 92.1 91.8 0.3 0.3Q3 83.9 86.2 -2.3 -2.7Q4 79.0 81.6 -2.5 -3.1Q5 74.7 78.6 -3.9 * -5.0Q6 70.8 76.0 -5.2 ** -6.8Q7 69.3 73.6 -4.2 * -5.8Q8 67.2 69.8 -2.6 -3.7Q9 65.4 66.9 -1.5 -2.3
Food Stamps amount ($)Q2 to 5 2,452 2,583 -130 ** -5.1Q6 to 9 2,025 2,168 -143 ** -6.6Q2 to 9 4,477 4,751 -273 ** -5.8
Q2 685 698 -13 -1.9Q3 624 659 -35 ** -5.3Q4 591 627 -36 ** -5.8Q5 552 598 -46 ** -7.6Q6 522 575 -53 *** -9.2Q7 514 555 -40 ** -7.3Q8 505 532 -27 -5.1Q9 483 506 -22 -4.4
Sample size (total=1,872) 1,154 718
SOURCES and NOTES: See Table F.1.
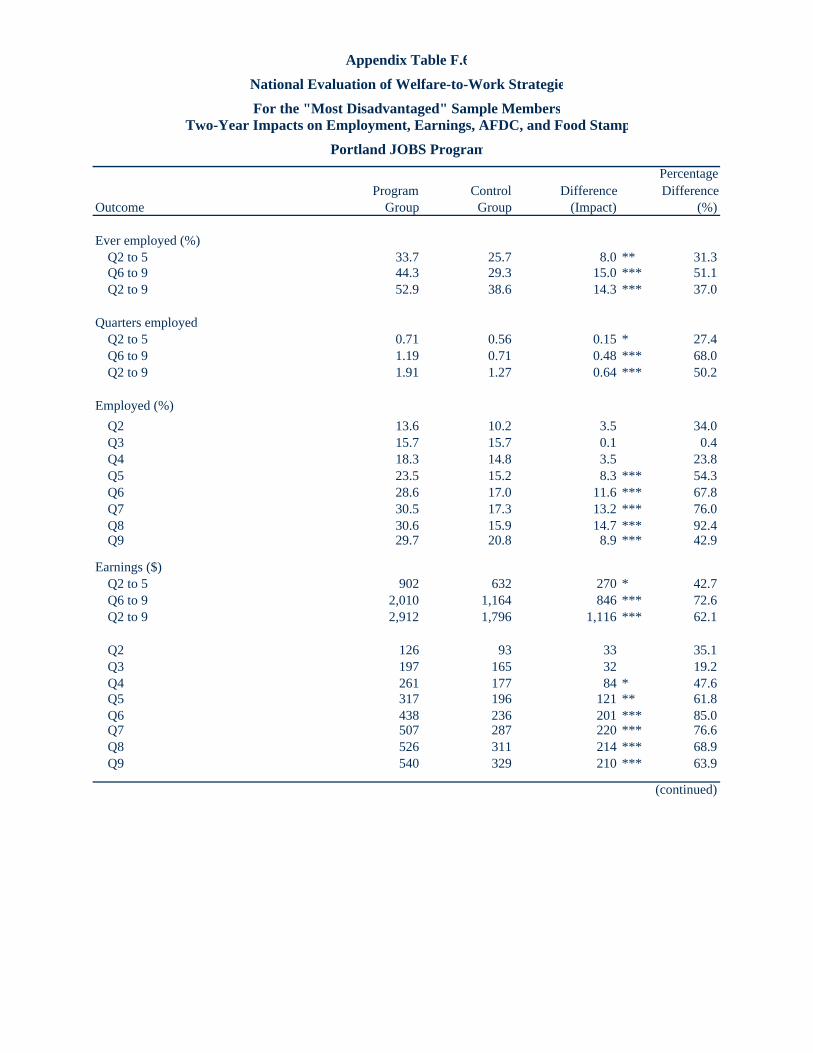
Appendix Table F.6
National Evaluation of Welfare-to-Work Strategie
For the "Most Disadvantaged" Sample MembersTwo-Year Impacts on Employment, Earnings, AFDC, and Food Stamp
Portland JOBS Program
Program Control DifferencePercentage Difference
Outcome Group Group (Impact) (%)
Ever employed (%)Q2 to 5 33.7 25.7 8.0 ** 31.3Q6 to 9 44.3 29.3 15.0 *** 51.1Q2 to 9 52.9 38.6 14.3 *** 37.0
Quarters employedQ2 to 5 0.71 0.56 0.15 * 27.4Q6 to 9 1.19 0.71 0.48 *** 68.0Q2 to 9 1.91 1.27 0.64 *** 50.2
Employed (%)Q2 13.6 10.2 3.5 34.0Q3 15.7 15.7 0.1 0.4Q4 18.3 14.8 3.5 23.8Q5 23.5 15.2 8.3 *** 54.3Q6 28.6 17.0 11.6 *** 67.8Q7 30.5 17.3 13.2 *** 76.0Q8 30.6 15.9 14.7 *** 92.4Q9 29.7 20.8 8.9 *** 42.9
Earnings ($) Q2 to 5 902 632 270 * 42.7Q6 to 9 2,010 1,164 846 *** 72.6Q2 to 9 2,912 1,796 1,116 *** 62.1
Q2 126 93 33 35.1Q3 197 165 32 19.2Q4 261 177 84 * 47.6Q5 317 196 121 ** 61.8Q6 438 236 201 *** 85.0Q7 507 287 220 *** 76.6Q8 526 311 214 *** 68.9Q9 540 329 210 *** 63.9
(continued)
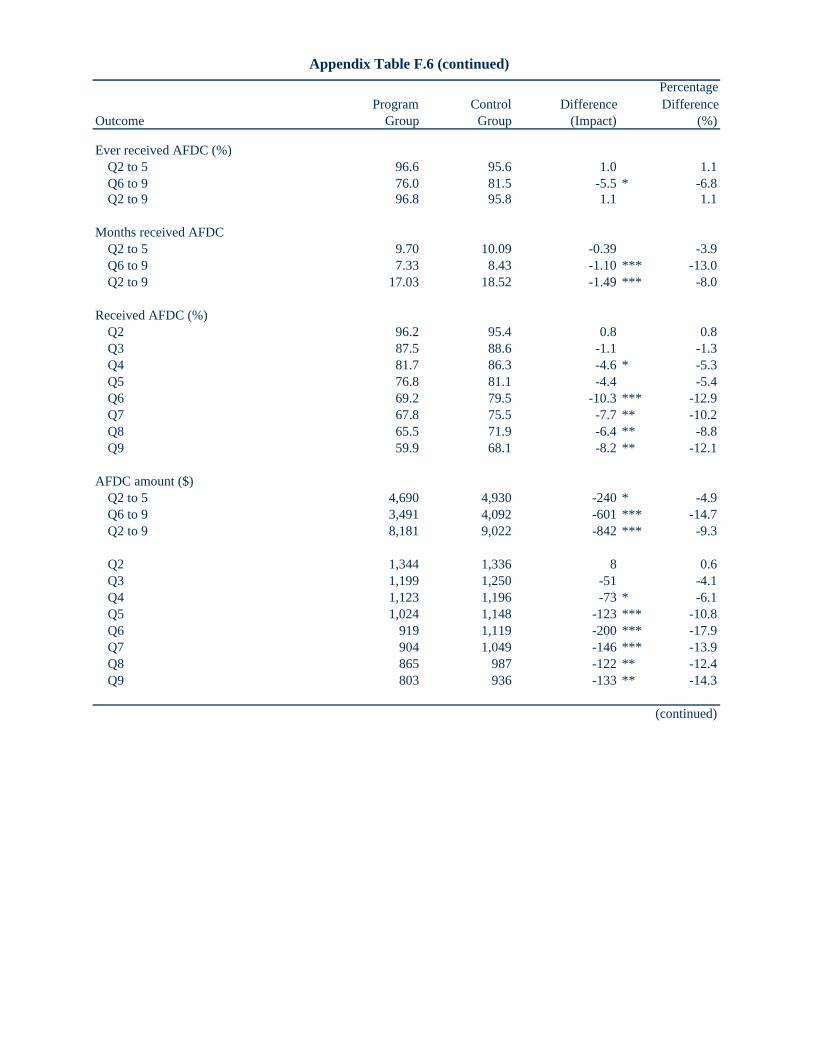
Appendix Table F.6 (continued)
Program Control DifferencePercentage Difference
Outcome Group Group (Impact) (%)
Ever received AFDC (%)Q2 to 5 96.6 95.6 1.0 1.1Q6 to 9 76.0 81.5 -5.5 * -6.8Q2 to 9 96.8 95.8 1.1 1.1
Months received AFDC Q2 to 5 9.70 10.09 -0.39 -3.9Q6 to 9 7.33 8.43 -1.10 *** -13.0Q2 to 9 17.03 18.52 -1.49 *** -8.0
Received AFDC (%)Q2 96.2 95.4 0.8 0.8Q3 87.5 88.6 -1.1 -1.3Q4 81.7 86.3 -4.6 * -5.3Q5 76.8 81.1 -4.4 -5.4Q6 69.2 79.5 -10.3 *** -12.9Q7 67.8 75.5 -7.7 ** -10.2Q8 65.5 71.9 -6.4 ** -8.8Q9 59.9 68.1 -8.2 ** -12.1
AFDC amount ($)Q2 to 5 4,690 4,930 -240 * -4.9Q6 to 9 3,491 4,092 -601 *** -14.7Q2 to 9 8,181 9,022 -842 *** -9.3
Q2 1,344 1,336 8 0.6Q3 1,199 1,250 -51 -4.1Q4 1,123 1,196 -73 * -6.1Q5 1,024 1,148 -123 *** -10.8Q6 919 1,119 -200 *** -17.9Q7 904 1,049 -146 *** -13.9Q8 865 987 -122 ** -12.4Q9 803 936 -133 ** -14.3
(continued)

Appendix Table F.6 (continued)
Program Control DifferencePercentage Difference
Outcome Group Group (Impact) (%)
Ever received Food Stamps (%)Q2 to 5 94.2 95.1 -1.0 -1.0Q6 to 9 82.7 87.0 -4.2 * -4.9Q2 to 9 94.9 95.4 -0.5 -0.6
Months received Food StampsQ2 to 5 9.93 10.42 -0.49 * -4.7Q6 to 9 8.61 9.19 -0.58 * -6.3Q2 to 9 18.54 19.61 -1.07 ** -5.5
Received Food Stamps (%)Q2 93.4 93.8 -0.4 -0.5Q3 87.2 90.1 -2.9 -3.2Q4 82.7 87.8 -5.1 ** -5.8Q5 80.3 85.3 -5.0 * -5.9Q6 76.8 83.9 -7.1 ** -8.5Q7 76.2 80.7 -4.5 -5.6Q8 74.5 77.8 -3.3 -4.2Q9 72.5 75.0 -2.5 -3.4
Food Stamps amount ($)Q2 to 5 2,774 2,914 -140 * -4.8Q6 to 9 2,422 2,582 -160 -6.2Q2 to 9 5,196 5,495 -299 * -5.4
Q2 749 762 -12 -1.6Q3 703 735 -31 -4.3Q4 681 720 -38 -5.3Q5 640 698 -58 ** -8.3Q6 611 678 -67 ** -9.9Q7 615 664 -49 * -7.4Q8 613 638 -25 -3.9Q9 583 602 -19 -3.2
Sample size (total=897) 546 351
SOURCES: See Table F.1.NOTES: See Table F.1. "Most disadvantaged" sample members are those who did not have a high school diploma or GED at random assignment, had no earnings in the year prior to random assignment, and had received AFDC for two years at any time prior to random assignment
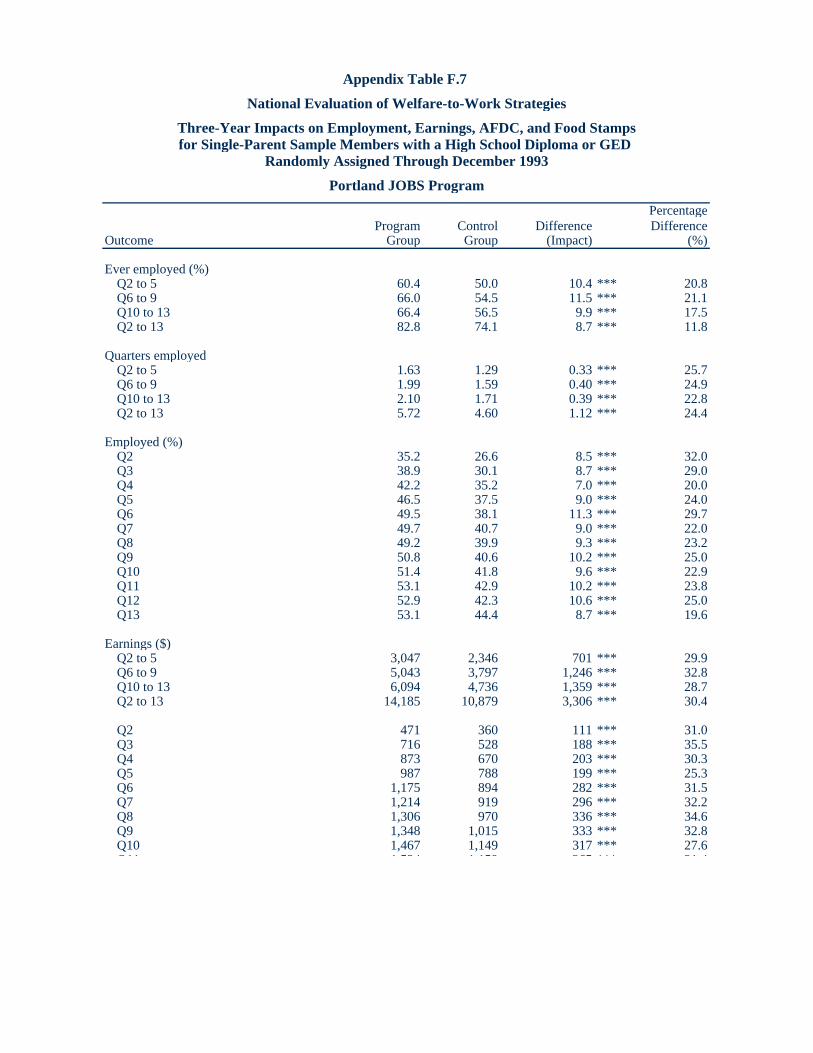
Appendix Table F.7
National Evaluation of Welfare-to-Work Strategies
Three-Year Impacts on Employment, Earnings, AFDC, and Food Stampsfor Single-Parent Sample Members with a High School Diploma or GED
Randomly Assigned Through December 1993
Portland JOBS Program
PercentageProgram Control Difference Difference
Outcome Group Group (Impact) (%)
Ever employed (%)Q2 to 5 60.4 50.0 10.4 *** 20.8Q6 to 9 66.0 54.5 11.5 *** 21.1Q10 to 13 66.4 56.5 9.9 *** 17.5Q2 to 13 82.8 74.1 8.7 *** 11.8
Quarters employedQ2 to 5 1.63 1.29 0.33 *** 25.7Q6 to 9 1.99 1.59 0.40 *** 24.9Q10 to 13 2.10 1.71 0.39 *** 22.8Q2 to 13 5.72 4.60 1.12 *** 24.4
Employed (%)Q2 35.2 26.6 8.5 *** 32.0Q3 38.9 30.1 8.7 *** 29.0Q4 42.2 35.2 7.0 *** 20.0Q5 46.5 37.5 9.0 *** 24.0Q6 49.5 38.1 11.3 *** 29.7Q7 49.7 40.7 9.0 *** 22.0Q8 49.2 39.9 9.3 *** 23.2Q9 50.8 40.6 10.2 *** 25.0Q10 51.4 41.8 9.6 *** 22.9Q11 53.1 42.9 10.2 *** 23.8Q12 52.9 42.3 10.6 *** 25.0Q13 53.1 44.4 8.7 *** 19.6
Earnings ($)Q2 to 5 3,047 2,346 701 *** 29.9Q6 to 9 5,043 3,797 1,246 *** 32.8Q10 to 13 6,094 4,736 1,359 *** 28.7Q2 to 13 14,185 10,879 3,306 *** 30.4
Q2 471 360 111 *** 31.0Q3 716 528 188 *** 35.5Q4 873 670 203 *** 30.3Q5 987 788 199 *** 25.3Q6 1,175 894 282 *** 31.5Q7 1,214 919 296 *** 32.2Q8 1,306 970 336 *** 34.6Q9 1,348 1,015 333 *** 32.8Q10 1,467 1,149 317 *** 27.6Q11 1 524 1 159 365 *** 31 4

Appendix Table F.7 (continued)
PercentageProgram Control Difference Difference
Outcome Group Group (Impact) (%)
Ever received AFDC (%)Q2 to 5 93.5 93.8 -0.3 -0.3Q6 to 9 58.4 68.8 -10.4 *** -15.1Q10 to 13 40.8 52.3 -11.5 *** -22.0Q2 to 13 94.1 94.3 -0.2 -0.2
Months received AFDCQ2 to 5 7.92 9.11 -1.19 *** -13.1Q6 to 9 4.79 6.35 -1.56 *** -24.5Q10 to 13 3.18 4.74 -1.56 *** -32.9Q2 to 13 15.89 20.20 -4.31 *** -21.3
Received AFDC (%)Q2 91.5 92.8 -1.3 -1.4Q3 76.0 84.2 -8.1 *** -9.7Q4 66.4 77.5 -11.1 *** -14.3Q5 58.3 70.5 -12.1 *** -17.2Q6 51.2 64.2 -13.0 *** -20.3Q7 47.4 60.0 -12.6 *** -21.0Q8 43.2 55.6 -12.4 *** -22.3Q9 39.1 51.4 -12.3 *** -24.0Q10 35.1 47.4 -12.2 *** -25.8Q11 31.8 44.8 -13.0 *** -29.1Q12 29.0 41.1 -12.1 *** -29.4Q13 26.2 37.9 -11.7 *** -30.9
AFDC amount ($)Q2 to 5 3,462 4,039 -577 *** -14.3Q6 to 9 2,050 2,831 -781 *** -27.6Q10 to 13 1,354 2,166 -812 *** -37.5Q2 to 13 6,866 9,036 -2,170 *** -24.0
Q2 1,124 1,161 -37 * -3.2Q3 897 1,045 -147 *** -14.1Q4 770 972 -202 *** -20.8Q5 671 862 -191 *** -22.1Q6 582 784 -203 *** -25.9Q7 535 727 -193 *** -26.5Q8 483 681 -198 *** -29.1Q9 451 638 -187 *** -29.3Q10 384 598 -214 *** -35.8Q11 348 554 -206 *** -37.2Q12 328 522 -194 *** -37.2Q13 294 492 -198 *** -40.2
(continued)

Appendix Table F.7 (continued)
PercentageProgram Control Difference Difference
Outcome Group Group (Impact) (%)
Ever received Food Stamps (%)Q2 to 5 94.2 95.8 -1.6 * -1.7Q6 to 9 72.4 80.5 -8.2 *** -10.2Q10 to 13 58.9 65.8 -6.9 *** -10.5Q2 to 13 95.1 96.9 -1.8 ** -1.8
Months received Food StampsQ2 to 5 9.24 10.11 -0.87 *** -8.6Q6 to 9 6.79 7.95 -1.15 *** -14.5Q10 to 13 5.44 6.52 -1.08 *** -16.6Q2 to 13 21.48 24.58 -3.10 *** -12.6
Received Food Stamps (%)Q2 92.9 95.1 -2.2 ** -2.3Q3 84.2 90.4 -6.2 *** -6.8Q4 77.7 84.9 -7.3 *** -8.6Q5 72.3 81.4 -9.2 *** -11.3Q6 65.8 76.7 -11.0 *** -14.3Q7 62.5 73.6 -11.0 *** -15.0Q8 60.1 67.6 -7.5 *** -11.1Q9 56.5 63.7 -7.2 *** -11.4Q10 52.1 60.8 -8.7 *** -14.3Q11 50.8 58.6 -7.8 *** -13.3Q12 48.1 56.1 -8.0 *** -14.2Q13 46.9 54.1 -7.2 *** -13.4
Food Stamps amount ($)Q2 to 5 2,168 2,443 -275 *** -11.3Q6 to 9 1,596 1,921 -325 *** -16.9Q10 to 13 1,273 1,594 -322 *** -20.2Q2 to 13 5,037 5,959 -922 *** -15.5
Q2 637 676 -39 *** -5.8Q3 557 634 -77 *** -12.1Q4 510 584 -74 *** -12.6Q5 463 548 -85 *** -15.6Q6 426 524 -98 *** -18.7Q7 415 496 -81 *** -16.4Q8 387 467 -80 *** -17.1Q9 368 434 -66 *** -15.1Q10 340 426 -86 *** -20.1Q11 328 412 -85 *** -20.5Q12 314 389 -76 *** -19.4Q13 291 367 -76 *** -20.6
Sample size (total=2,158 ) 1,236 922

Appendix Table F.8
National Evaluation of Welfare-to-Work Strategies
Three-Year Impacts on Employment, Earnings, AFDC, and Food Stampsfor Single-Parent Sample Members Without a High School Diploma or GED
Randomly Assigned Through December 1993
Portland JOBS Program
PercentageProgram Control Difference Difference
Outcome Group Group (Impact) (%)
Ever employed (%)Q2 to 5 44.6 36.8 7.8 *** 21.2Q6 to 9 53.4 39.9 13.6 *** 34.1Q10 to 13 58.0 44.5 13.6 *** 30.5Q2 to 13 72.4 62.1 10.3 *** 16.7
Quarters employedQ2 to 5 1.03 0.83 0.20 *** 24.4Q6 to 9 1.50 1.01 0.49 *** 48.0Q10 to 13 1.71 1.15 0.56 *** 48.4Q2 to 13 4.23 2.99 1.24 *** 41.6
Employed (%)Q2 20.3 15.3 5.0 ** 32.6Q3 23.8 21.2 2.6 12.1Q4 26.8 22.5 4.3 * 19.0Q5 32.3 23.9 8.4 *** 35.2Q6 35.7 26.7 9.1 *** 33.9Q7 38.0 26.0 12.1 *** 46.4Q8 37.7 23.9 13.9 *** 58.2Q9 38.0 24.5 13.5 *** 55.2Q10 41.8 26.0 15.8 *** 60.8Q11 42.1 27.1 15.1 *** 55.7Q12 44.4 30.6 13.8 *** 45.0Q13 42.4 31.4 11.0 *** 35.0
Earnings ($)Q2 to 5 1,452 1,049 403 *** 38.4Q6 to 9 2,814 1,737 1,077 *** 62.0Q10 to 13 3,848 2,397 1,451 *** 60.5Q2 to 13 8,114 5,183 2,931 *** 56.5
Q2 211 172 39 22.4Q3 318 241 77 * 32.0Q4 409 300 110 ** 36.7Q5 514 336 177 *** 52.8Q6 624 389 235 *** 60.4Q7 744 456 288 *** 63.1Q8 693 458 235 *** 51.3Q9 754 434 320 *** 73.6Q10 868 551 317 *** 57.6Q11 949 560 389 *** 69 4

Appendix Table F.8 (continued)
PercentageProgram Control Difference Difference
Outcome Group Group (Impact) (%)
Ever received AFDC (%)Q2 to 5 95.4 95.5 -0.1 -0.1Q6 to 9 71.7 78.6 -6.9 *** -8.8Q10 to 13 55.6 63.4 -7.7 *** -12.2Q2 to 13 96.3 96.0 0.3 0.3
Months received AFDCQ2 to 5 9.21 9.64 -0.43 ** -4.5Q6 to 9 6.51 7.85 -1.33 *** -17.0Q10 to 13 4.73 6.18 -1.44 *** -23.3Q2 to 13 20.46 23.66 -3.21 *** -13.5
Received AFDC (%)Q2 94.4 95.1 -0.7 -0.7Q3 84.1 86.7 -2.6 -3.0Q4 78.8 80.6 -1.8 -2.2Q5 71.1 76.0 -4.9 * -6.5Q6 64.6 75.0 -10.4 *** -13.9Q7 61.0 70.3 -9.3 *** -13.2Q8 58.6 67.3 -8.7 *** -12.9Q9 54.0 64.0 -10.0 *** -15.6Q10 51.3 60.0 -8.7 *** -14.5Q11 46.4 55.5 -9.1 *** -16.5Q12 41.3 53.6 -12.4 *** -23.0Q13 36.6 50.4 -13.8 *** -27.4
AFDC amount ($)Q2 to 5 4,278 4,484 -206 * -4.6Q6 to 9 2,975 3,636 -661 *** -18.2Q10 to 13 2,196 2,848 -652 *** -22.9Q2 to 13 9,449 10,968 -1,519 *** -13.8
Q2 1,253 1,253 0 0.0Q3 1,095 1,134 -39 -3.4Q4 1,018 1,072 -54 -5.1Q5 912 1,025 -113 *** -11.0Q6 810 978 -168 *** -17.1Q7 774 931 -157 *** -16.9Q8 722 887 -165 *** -18.6Q9 669 840 -171 *** -20.3Q10 645 788 -142 *** -18.1Q11 571 721 -150 *** -20.8Q12 507 690 -183 *** -26.5Q13 472 649 -177 *** -27.3
(continued)

Appendix Table F.8 (continued)
PercentageProgram Control Difference Difference
Outcome Group Group (Impact) (%)
Ever received Food Stamps (%)Q2 to 5 94.9 96.4 -1.6 -1.6Q6 to 9 81.5 83.8 -2.3 -2.7Q10 to 13 73.1 74.6 -1.5 -2.0Q2 to 13 96.1 96.9 -0.7 -0.8
Months received Food StampsQ2 to 5 9.80 10.25 -0.45 ** -4.4Q6 to 9 8.18 8.73 -0.54 * -6.2Q10 to 13 7.05 7.65 -0.60 ** -7.8Q2 to 13 25.03 26.63 -1.59 ** -6.0
Received Food Stamps (%)Q2 93.8 94.4 -0.6 -0.6Q3 86.8 90.1 -3.3 * -3.7Q4 83.2 85.5 -2.3 -2.7Q5 79.0 82.7 -3.7 -4.5Q6 74.7 80.5 -5.8 ** -7.2Q7 73.7 78.7 -4.9 * -6.3Q8 71.2 74.3 -3.1 -4.2Q9 69.4 71.6 -2.2 -3.1Q10 68.9 70.3 -1.5 -2.1Q11 65.7 67.3 -1.6 -2.4Q12 61.0 66.6 -5.6 ** -8.4Q13 58.5 65.3 -6.9 ** -10.5
Food Stamps amount ($)Q2 to 5 2,571 2,703 -132 ** -4.9Q6 to 9 2,157 2,303 -146 * -6.3Q10 to 13 1,800 1,990 -190 ** -9.6Q2 to 13 6,528 6,996 -468 ** -6.7
Q2 710 726 -16 -2.3Q3 652 692 -40 ** -5.8Q4 623 655 -32 -4.9Q5 586 629 -43 ** -6.9Q6 555 612 -57 ** -9.2Q7 552 592 -40 * -6.8Q8 534 563 -28 -5.1Q9 516 537 -21 -3.9Q10 496 518 -22 -4.3Q11 464 507 -43 * -8.5Q12 435 497 -62 ** -12.5Q13 405 467 -63 ** -13.4
Sample size (total=1,194) 656 538
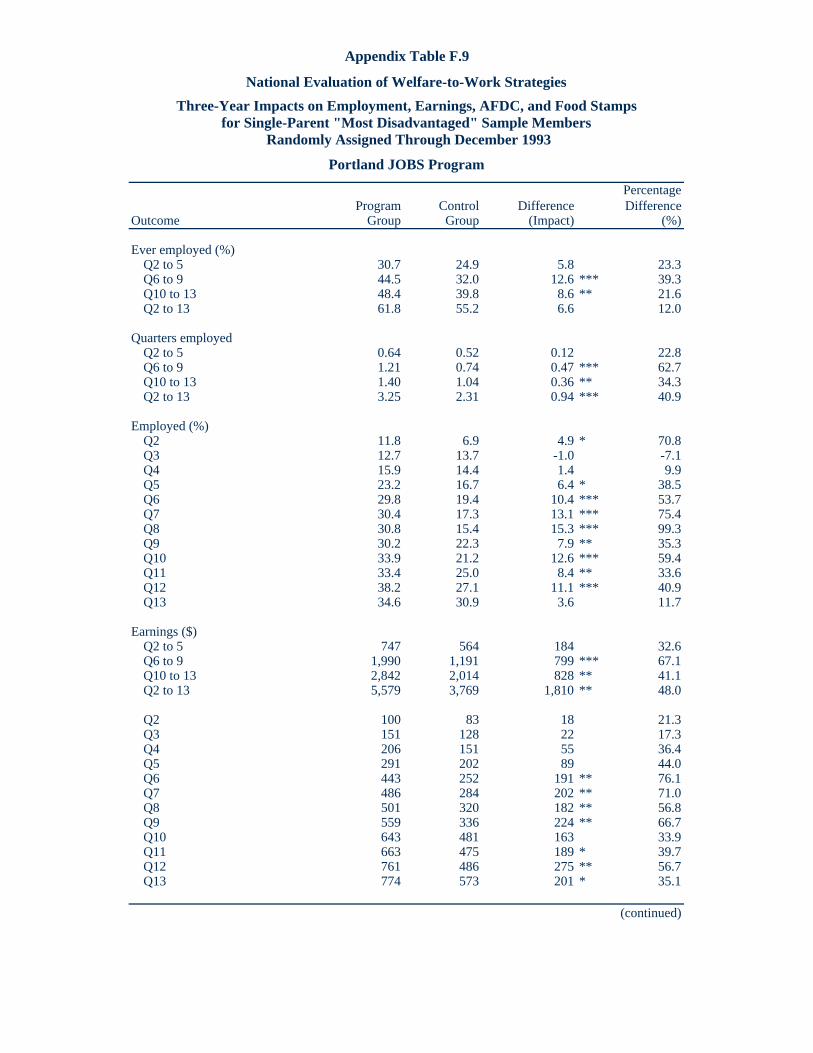
Appendix Table F.9
National Evaluation of Welfare-to-Work StrategiesThree-Year Impacts on Employment, Earnings, AFDC, and Food Stamps
for Single-Parent "Most Disadvantaged" Sample Members Randomly Assigned Through December 1993
Portland JOBS Program
PercentageProgram Control Difference Difference
Outcome Group Group (Impact) (%)
Ever employed (%)Q2 to 5 30.7 24.9 5.8 23.3Q6 to 9 44.5 32.0 12.6 *** 39.3Q10 to 13 48.4 39.8 8.6 ** 21.6Q2 to 13 61.8 55.2 6.6 12.0
Quarters employedQ2 to 5 0.64 0.52 0.12 22.8Q6 to 9 1.21 0.74 0.47 *** 62.7Q10 to 13 1.40 1.04 0.36 ** 34.3Q2 to 13 3.25 2.31 0.94 *** 40.9
Employed (%)Q2 11.8 6.9 4.9 * 70.8Q3 12.7 13.7 -1.0 -7.1Q4 15.9 14.4 1.4 9.9Q5 23.2 16.7 6.4 * 38.5Q6 29.8 19.4 10.4 *** 53.7Q7 30.4 17.3 13.1 *** 75.4Q8 30.8 15.4 15.3 *** 99.3Q9 30.2 22.3 7.9 ** 35.3Q10 33.9 21.2 12.6 *** 59.4Q11 33.4 25.0 8.4 ** 33.6Q12 38.2 27.1 11.1 *** 40.9Q13 34.6 30.9 3.6 11.7
Earnings ($)Q2 to 5 747 564 184 32.6Q6 to 9 1,990 1,191 799 *** 67.1Q10 to 13 2,842 2,014 828 ** 41.1Q2 to 13 5,579 3,769 1,810 ** 48.0
Q2 100 83 18 21.3Q3 151 128 22 17.3Q4 206 151 55 36.4Q5 291 202 89 44.0Q6 443 252 191 ** 76.1Q7 486 284 202 ** 71.0Q8 501 320 182 ** 56.8Q9 559 336 224 ** 66.7Q10 643 481 163 33.9Q11 663 475 189 * 39.7Q12 761 486 275 ** 56.7Q13 774 573 201 * 35.1
(continued)
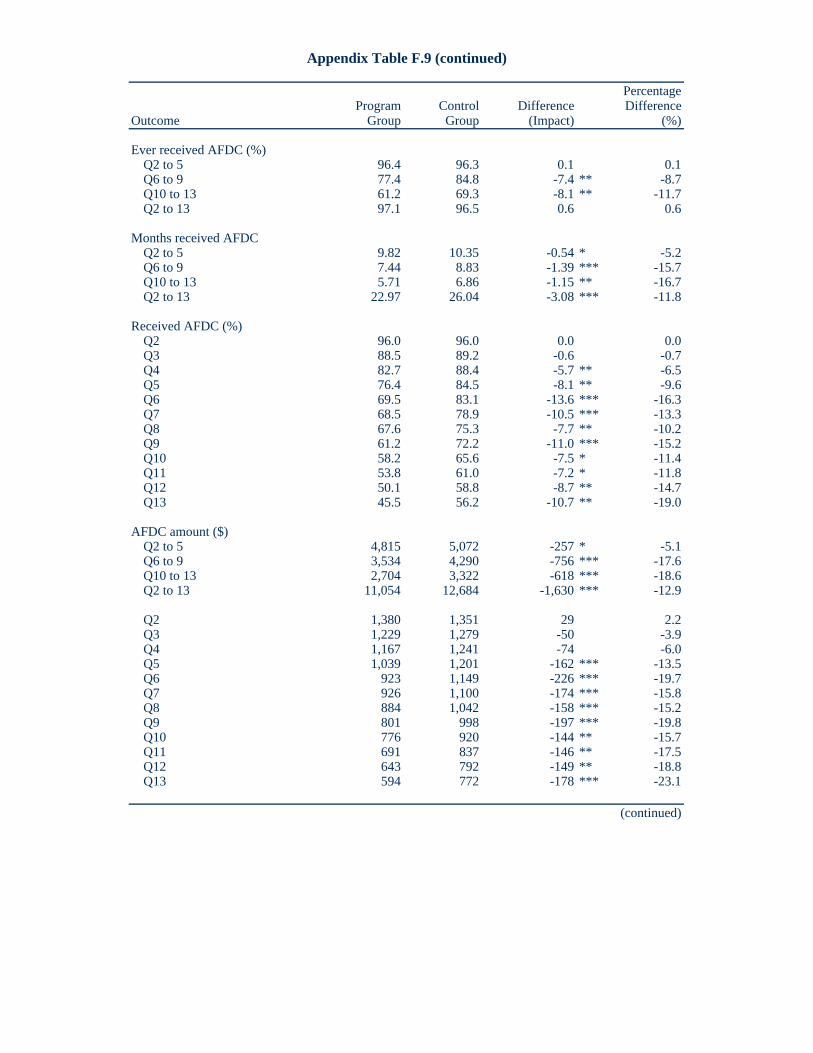
Appendix Table F.9 (continued)
PercentageProgram Control Difference Difference
Outcome Group Group (Impact) (%)
Ever received AFDC (%)Q2 to 5 96.4 96.3 0.1 0.1Q6 to 9 77.4 84.8 -7.4 ** -8.7Q10 to 13 61.2 69.3 -8.1 ** -11.7Q2 to 13 97.1 96.5 0.6 0.6
Months received AFDCQ2 to 5 9.82 10.35 -0.54 * -5.2Q6 to 9 7.44 8.83 -1.39 *** -15.7Q10 to 13 5.71 6.86 -1.15 ** -16.7Q2 to 13 22.97 26.04 -3.08 *** -11.8
Received AFDC (%)Q2 96.0 96.0 0.0 0.0Q3 88.5 89.2 -0.6 -0.7Q4 82.7 88.4 -5.7 ** -6.5Q5 76.4 84.5 -8.1 ** -9.6Q6 69.5 83.1 -13.6 *** -16.3Q7 68.5 78.9 -10.5 *** -13.3Q8 67.6 75.3 -7.7 ** -10.2Q9 61.2 72.2 -11.0 *** -15.2Q10 58.2 65.6 -7.5 * -11.4Q11 53.8 61.0 -7.2 * -11.8Q12 50.1 58.8 -8.7 ** -14.7Q13 45.5 56.2 -10.7 ** -19.0
AFDC amount ($)Q2 to 5 4,815 5,072 -257 * -5.1Q6 to 9 3,534 4,290 -756 *** -17.6Q10 to 13 2,704 3,322 -618 *** -18.6Q2 to 13 11,054 12,684 -1,630 *** -12.9
Q2 1,380 1,351 29 2.2Q3 1,229 1,279 -50 -3.9Q4 1,167 1,241 -74 -6.0Q5 1,039 1,201 -162 *** -13.5Q6 923 1,149 -226 *** -19.7Q7 926 1,100 -174 *** -15.8Q8 884 1,042 -158 *** -15.2Q9 801 998 -197 *** -19.8Q10 776 920 -144 ** -15.7Q11 691 837 -146 ** -17.5Q12 643 792 -149 ** -18.8Q13 594 772 -178 *** -23.1
(continued)

Appendix Table F.9 (continued)
PercentageProgram Control Difference Difference
Outcome Group Group (Impact) (%)
Ever received Food Stamps (%)Q2 to 5 94.8 97.4 -2.6 -2.7Q6 to 9 84.8 89.9 -5.2 * -5.8Q10 to 13 77.5 81.5 -4.0 -4.9Q2 to 13 95.9 97.9 -2.0 -2.0
Months received Food StampsQ2 to 5 10.09 10.81 -0.72 ** -6.7Q6 to 9 8.92 9.67 -0.75 ** -7.7Q10 to 13 7.96 8.51 -0.55 -6.5Q2 to 13 26.96 28.98 -2.02 ** -7.0
Received Food Stamps (%)Q2 93.6 95.6 -2.0 -2.1Q3 88.6 93.0 -4.4 * -4.8Q4 84.3 90.9 -6.6 ** -7.3Q5 82.1 89.1 -7.0 ** -7.8Q6 78.6 87.7 -9.1 *** -10.4Q7 78.6 85.5 -6.9 ** -8.1Q8 77.5 82.2 -4.7 -5.7Q9 75.4 78.8 -3.3 -4.2Q10 74.7 77.4 -2.7 -3.5Q11 72.7 73.3 -0.6 -0.9Q12 68.8 72.4 -3.7 -5.1Q13 65.2 72.6 -7.4 * -10.2
Food Stamps amount ($)Q2 to 5 2,828 3,040 -212 ** -7.0Q6 to 9 2,493 2,733 -240 * -8.8Q10 to 13 2,121 2,326 -205 -8.8Q2 to 13 7,442 8,099 -657 ** -8.1
Q2 760 786 -26 -3.3Q3 720 769 -50 ** -6.5Q4 694 751 -56 ** -7.5Q5 654 735 -81 *** -11.0Q6 630 715 -85 *** -11.9Q7 635 703 -68 ** -9.7Q8 629 675 -46 -6.8Q9 600 641 -41 -6.4Q10 581 607 -26 -4.2Q11 544 591 -48 -8.1Q12 520 580 -60 -10.3Q13 477 548 -71 * -13.0
Sample size (total=599) 323 276
SOURCES and NOTES: See Table F.6.
-174-
References
Bane, Mary Jo; and Ellwood, David T. 1994. Welfare Realities: From Rhetoric to Reform. Cambridge: Harvard University Press.
Bardach, Eugene. 1993. Improving the Productivity of JOBS Programs. New York: Manpower Demonstration Research Corporation.
Brock, Thomas; and Harknett, Kristen. 1998. Welfare-to-Work Case Management: A Comparison of Two Models. New York: Manpower Demonstration Research Corporation.
Freedman, Stephen; Friedlander, Daniel; Lin, Winston; and Schweder, Amanda. 1996. Five-Year Impacts on Employment, Earnings, and AFDC Receipt. GAIN Evaluation, Working Paper 96.1. Prepared by the Manpower Demonstration Research Corporation for the U.S. Department of Health and Human Services.
Friedlander, Daniel; Freedman, Stephen; Hamilton, Gayle; and Quint, Janet. 1987. Final Report on Job Search and Work Experience in Cook County. New York: Manpower Demonstration Research Corporation.
Friedlander, Daniel; Hoerz, Gregory; Long, David; and Quint, Janet. 1985a. Maryland: Final Report on the Employment Initiatives Evaluation. New York: Manpower Demonstration Research Corporation.
Friedlander, Daniel; Hoerz, Gregory; Quint, Janet; and Riccio, James. 1985b. Arkansas: Final Report on the WORK Program in Two Counties. New York: Manpower Demonstration Research Corporation.
Goldman, Barbara; Friedlander, Daniel; and Long, David. 1986. California: Final Report on the San Diego Job Search and Work Experience Demonstration. New York: Manpower Demonstration Research Corporation.
Haimson, Joshua; and Hershey, Alan. 1997. Getting Help to Stay Employed: The Use of Postemployment Services. Princeton, NJ: Mathematica Policy Research.
Haimson, Joshua; Hershey, Alan; and Rangarajan, Anu. 1995. Providing Services to Promote Job Retention. Princeton, NJ: Mathematica Policy Research.
Hamilton, Gayle. 1988. Interim Report on the Saturation Work Initiative Model in San Diego. New York: Manpower Demonstration Research Corporation.
Hamilton, Gayle. 1995. The JOBS Evaluation: Monthly Participation Rates in Three Sites and Factors Affecting Participation Levels in Welfare-to-Work Programs. Washington, DC: U.S. Department of Health and Human Services, Office of the Assistant Secretary for Planning and Evaluation.
Hamilton, Gayle; and Brock, Thomas. 1994. The JOBS Evaluation: Early Lessons from Seven Sites. Washington, DC: U.S. Department of Health and Human Services and U.S. Department of Education.
Hamilton, Gayle; Brock, Thomas; Farrell, Mary; Friedlander, Daniel; and Harknett, Kristen. 1997. Evaluating Two Welfare-to-Work Program Approaches: Two-Year Findings on the Labor Force Attachment and Human Capital Development Programs in Three Sites. Washington, DC: U.S. Department of Health and Human Services, Administration for Children and Families and Office of the Assistant Secretary for Planning and Evaluation.

-175-
Hamilton, Gayle; and Friedlander, Daniel. 1989. Final Report on the Saturation Work Initiative Model in San Diego. New York: Manpower Demonstration Research Corporation.
Hatcher, Larry. 1994. Step-by-Step Approach to Using the SAS System for Factor Analysis and Structural Equation Modeling. Cary, NC: SAS Institute.
Kemple, James J.; and Haimson, Joshua. 1994. Florida's Project Independence: Program Implementation, Participation Patterns, and First-Year Impacts. New York: Manpower Demonstration Research Corporation.
Knab, Jean Tansey; and Freedman, Stephen. 1996a. Preliminary Impacts on Employment, Earnings, and AFDC Receipt for the Detroit JOBS Program. JOBS Evaluation, Working Paper 96.1 Prepared by the Manpower Demonstration Research Corporation for the U.S. Department of Health and Human Services.
Knab, Jean Tansey; and Freedman, Stephen. 1996b. Preliminary Impacts on Employment, Earnings, and AFDC Receipt for the Oklahoma City JOBS Program. JOBS Evaluation, Working Paper 96.3. Prepared by the Manpower Demonstration Research Corporation for the U.S. Department of Health and Human Services.
Ohls, James C.; and Beebout, Harold. 1993. The Food Stamp Program: Design Tradeoffs, Policy, and Impacts: A Mathematica Policy Research Study. Washington, DC: Urban Institute Press.
Personal Responsibility and Work Opportunity Reconciliation Act of 1996. 1996. Pub. L. No. 104-193.
Riccio, James; Cave, George; Freedman, Stephen; and Price, Marilyn. 1986. Virginia: Final Report on the Employment Services Program. New York: Manpower Demonstration Research Corporation.
Riccio, James; and Friedlander, Daniel. 1992. GAIN: Program Strategies, Participation Patterns, and First-Year Impacts in Six Counties. New York: Manpower Demonstration Research Corporation.
Riccio, James; Friedlander, Daniel; and Freedman, Stephen. 1994. GAIN: Benefits, Costs, and Three-Year Impacts of a Welfare-to-Work Program. New York: Manpower Demonstration Research Corporation.
Riccio, James; Goldman, Barbara; Hamilton, Gayle; Martinson, Karin; and Orenstein, Alan. 1989. GAIN: Early Implementation Experiences and Lessons. New York: Manpower Demonstration Research Corporation.
Scholz, John Karl. 1996. “In-Work Benefits in the United States: The Earned Income Tax Credit.” Economic Journal 106 (January): 156-169.