Embed Size (px)
Citation preview

1
National First Nations Infrastructure Investment Plan
2015-2016
As of May 7, 2015
2
For information regarding reproduction rights, please contact Public Works and Government Services Canada at: 613-996-6886 or at: [email protected] www.aandc.gc.ca English version (Format: PDF) 1-800-567-9604 QS- 6374-000-EE-A1 TTY only 1-866-553-0554 Catalogue: R1-36E-PDF ISSN: 1927-2200 © Her Majesty the Queen in right of Canada, Represented by the Minister of Aboriginal Affairs and Northern Development, 2015 Cette publication est également disponible en français sous le titre: Plan national d'investissement en infrastructure des Premières Nations 2015-2016.

3
Table of Contents INTRODUCTION ........................................................................................................................4
PROGRAM OVERVIEW .............................................................................................................5
PRIORITY ACTION AREAS ........................................................................................................6
LIFE CYCLE APPROACH – AANDC-Funded Community Infrastructure.....................................6
CAPITAL FACILITIES AND MAINTENANCE PROGRAM RESOURCE ALLOCATION
PROCESS ..................................................................................................................................7
FIRST NATION INFRASTRUCTURE INVESTMENT PLANNING PROCESS .............................8
NATIONAL BALANCE SHEET (2015-2016) ...............................................................................9
APPENDIX A – REGIONAL SUMMARIES ................................................................................19
Atlantic Region ..........................................................................................................................19
Quebec Region .........................................................................................................................21
Ontario Region ..........................................................................................................................23
Manitoba Region .......................................................................................................................25
Saskatchewan Region ..............................................................................................................27
Alberta Region ..........................................................................................................................29
British Columbia Region ............................................................................................................31
Yukon Region ...........................................................................................................................33
APPENDIX B - NATIONAL PRIORITY RANKING FRAMEWORK .............................................35
GLOSSARY OF ACRONYMS AND TERMS .............................................................................45

4
INTRODUCTION The First Nations Infrastructure Investment Plan is developed annually by Aboriginal Affairs and Northern Development Canada (AANDC) in partnership with First Nations, to strategically plan investments, in the short and medium term, while supporting a base of infrastructure that protects the health and safety and enables engagement in the economy. This report explains how the First Nations Infrastructure Investment Plan is developed and provides an overview for investment and priority investment areas in accordance with the National Priority Ranking Framework (Appendix B). The current First Nations Infrastructure Investment Plan report provides an overview of investments planned through the Capital Facilities and Maintenance Program for the period 2015-2016 to 2019-2020 and captures planned projects as of May 7, 2015. The First Nations Infrastructure Investment Plan is a process that is based on known factors at the time when each of the three linked plans1 (community, regional and national) are prepared. The plan takes into account A-Base plus targeted funding2. However, it cannot anticipate unforeseen emergencies, new investment opportunities, or announcements that may arise in the course of the fiscal year. Adjustments to the plan may occur throughout the fiscal year as community, project and financial circumstances change. Therefore not all projects or reference levels identified in the national plan will receive the level of funding identified in a particular year.
1 For more information on the three plans, see the First Nation Infrastructure Investment Planning Process section of this report. 2 A glossary of Acronyms and Terms is presented at the end of this report to assist readers as required.

5
PROGRAM OVERVIEW The provision of community infrastructure funding to First Nations is based on the Government of Canada's spending power as a matter of social policy. The Capital Facilities and Maintenance Program is part of the Infrastructure and Capacity Strategic Outcome that falls under the broader Strategic Outcome “The Land and Economy”, which promotes full participation of First Nations, Métis, Non-Status Indians and Inuit individuals and communities in the economy. The mandate of the Capital Facilities and Maintenance Program is to provide financial and advisory assistance to First Nations in the development of basic public infrastructure which is essential for healthy, safe and sustainable communities. This assistance is provided to First Nations on reserves, as well as First Nations and other eligible recipients3 on Crown land or recognized Indian land. The objective of the Capital Facilities and Maintenance Program is to provide financial support to First Nations and other eligible recipients to: invest in physical assets (or services) that mitigate health and safety risks in their
communities; ensure that assets meet established codes and standards; ensure that assets are managed in a cost-effective and efficient manner that protects,
maintains and maximizes asset life cycle; and ensure that the above activities are undertaken in an environmentally sound and sustainable
manner. The Capital Facilities and Maintenance Program is intended to assist First Nations in the planning, construction and/or acquisition, as well as operation and maintenance of community infrastructure and facilities including the following asset categories: Water supply, treatment and distribution systems; Wastewater collection, treatment and disposal systems; Solid Waste collection and disposal; Elementary and secondary educational facilities; Housing; Roads and bridges; Fire protection including fire halls, fire vehicles and firefighting equipment; Electrical power generation and distribution; Community buildings such as community/recreation halls and band offices; Bulk fuel storage and distribution (non-commercial use); Structural Mitigation; Waste Management; Energy Systems; Remediation of contaminated sites; Land acquisition for approved community expansion; and Connectivity.
3Information on eligible recipients is available in CFMP’s Terms and Conditions.
6
PRIORITY ACTION AREAS Capital projects are subject to the Department's National Priority Ranking Framework, attached as Appendix B. Regional offices use the National Priority Ranking Framework to inform the development of their Regional First Nation Infrastructure Investments Plans. The Ranking Framework provides the foundation for consistent and transparent ranking of infrastructure investments. The Framework’s priorities are defined by the following Program Activity Categories:
1. Protection of health and safety as well as assets (assets require upgrading or replacement to meet appropriate standards);
2. Health and safety improvements (upgrades of existing assets, new construction/acquisition projects to mitigate an identified significant risk to health and safety);
3. Recapitalization/major maintenance (extend the useful operating life of a facility or asset, or maintain the original service level of the asset); and
4. Growth (anticipated community growth requiring new construction, expansion or procurement of assets to maintain the level of service standards).
In addition to the National Priority Ranking Framework, additional internal ranking tools have been developed by the Department to further prioritize project proposals that fall within the same capital asset categories and priority level established by the National Priority Ranking Framework. The Priority Ranking Framework for Drinking Water and Wastewater Projects, the School Priority Ranking Framework and the Fuel Tank System Priority Ranking Framework are all points-based ranking tools that take into consideration multiple criteria. Weighted factors are then automatically applied to each criterion, to ensure that factors of highest priority (such as health and safety) maximally influence on the overall ranking score.
These ranking tools complement the existing National Priority Ranking Framework by helping regional decision makers refine their ranking of proposed projects in a fair and consistent manner to ensure that projects are funded on the basis of highest priority.
LIFE CYCLE APPROACH – AANDC-Funded Community Infrastructure AANDC promotes a life-cycle approach for infrastructure assets starting with the use of full life-cycle costing when approving capital construction projects. This type of analysis allows for the consideration of all the associated costs (e.g. for design, construction, operation and maintenance, insurance, and major renovations) of the proposed infrastructure throughout its entire life cycle. This information is used to make comparisons between proposed options (e.g. building an expensive installation with low operating and maintenance costs versus a less-expensive facility with higher operating and maintenance costs) to determine the most cost-effective option in the short, medium, and long term. This exercise is also useful in determining the funding levels required from the First Nation in future years for the operation and maintenance of the proposed infrastructure.

7
During an asset’s service life, AANDC provides funding support to First Nations to help pay for the operation and maintenance costs of funded infrastructure assets. AANDC also encourages good asset management practices by recommending that First Nations implement Maintenance Management Plans for major capital assets. To help First Nations achieve longer-term use of existing assets, AANDC funds inspections of some community assets such as schools, water and wastewater systems. Currently water and wastewater systems are inspected annually4 while schools and other asset classes are inspected on a three-year cycle as a minimum. As part of its efforts to encourage good asset management, AANDC provides approximately $10 million a year for hands-on training on how to operate, service and maintain First Nations water and wastewater systems, so that Aboriginal communities have safe access to drinking water. The Circuit Rider Training Program is a long-term capacity building program that provides training and mentoring services to operators of First Nations drinking water systems and wastewater systems. The Program helps to increase reliability of systems and ensures their efficient operation.
CAPITAL FACILITIES AND MAINTENANCE PROGRAM RESOURCE ALLOCATION PROCESS AANDC allocates funding for the construction and the maintenance of community infrastructure to First Nations at regional level through formula, proposal based project funding or as a combination of both. The Capital Facilities and Maintenance Program budget is divided into: Formula-based funding, which includes:
Operations and Maintenance5: for the operation and maintenance of existing community infrastructure assets. The level of funding provided to the First Nation varies from 20 percent to 100 percent depending on the type of asset.
Minor Capital6: for housing and for acquisition, construction, renovation, or repair projects valued below $1.5 million.
Proposal-based funding, which includes: Minor Capital: for housing and for acquisition, construction, renovation, or repair projects
valued below $1.5 million. Major Capital: for specific construction, acquisition, renovation, or significant repair
projects valued above $1.5 million. Major capital projects are funded primarily by targeted initiatives such as: funding announced by the Government of Canada for education facilities as part of the Economic Action Plan 2012, the First Nation Infrastructure Fund announced in Economic Action Plan 2013, and the extension of the First Nations Water and Wastewater Action Plan and the Education Infrastructure Fund announced in Economic Action Plan 2014 .
4 Results of Annual Performance Inspections of First Nation water and wastewater systems are available in the Water and Wastewater Infrastructure Investment Reports. 5 Allocated at regional level based on formula that estimate the cost of operating and maintaining assets. 6 Established by using a formula that considers multiple variables such as: population, geographic remoteness, and actual costs of operating and maintenance of assets. The formula and allocation methodology varies among regions. In all cases, these funds are allocated directly to the First Nations giving them discretion on how they apply the funds to meet their infrastructure and housing needs.

8
FIRST NATION INFRASTRUCTURE INVESTMENT PLANNING PROCESS Under the Management Control Framework for the Capital Facilities and Maintenance Program, AANDC uses First Nation Infrastructure Investment Plans for capital planning. This process aims to improve resource management and increase accountability through better capital planning. An effective process depends on: nationally consistent planning practices, using a standardized Regional Investment Plan
template; using the best-available information to create plans and then to update them to reflect the
current situation; submission of community plans to their respective regions, followed by submission of
regional plans to headquarters, as per established timelines; and plans that are balanced to community and regional allocations. The First Nation Infrastructure Investment Plan planning process reflects the existing approval authorities and roles and responsibilities set out in the Management Control Framework and is designed around three linked plans that feed into one another: a community level plan, detailing infrastructure needs; a regional plan, planning out program expenditures; and a national plan, that provides a strategic overview of First Nations infrastructure needs and
Capital Facilities and Maintenance Program investments. First Nations Infrastructure Investment Plans – Community Level First Nation Infrastructure Investment Plans are five-year capital investment plans created by each First Nation community which detail infrastructure needs and plans. As set out in the Reporting Guide, an updated Investment Plan must be prepared each year before capital funds are released to First Nations. It is developed by communities with the support of the AANDC regional offices and then submitted for validation and incorporation into the Regional Investment Plan. It is AANDC’s goal to ensure that every community develops their own five-year infrastructure plan based on an asset life-cycle approach. Where First Nations do not have the expertise or the capacity to develop their own community level five-year plan, AANDC officials at the regional level will assist communities with the identification of their infrastructure priorities and the development of infrastructure plans. AANDC is continuously working with First Nations to increase their capacity in this area. First Nation Infrastructure Investment Plans – Regional Level Regional Investment Plans are the key planning and reporting tools used by both regions and headquarters throughout the year. They are developed after validating proposed expenditures in First Nations Infrastructure Investment Plans against program criteria, and then planning the allocation of available resources to the highest priorities. The plans present regional data and analysis of investments per community per asset category over a five-year period. Regional offices also provide mid-year updates of their plan for use at the regional and national level. Regional projects are prioritized using the National Priority Ranking Framework and other complementary asset-specific ranking tools (e.g. education facilities, water and wastewater, etc.). Higher priority projects are placed in the earlier years of the plan, while lower priority projects are placed in the later years, or beyond the current five-year plan. This, as well as the uncertainty with regard to the renewal of targeted funds, explains why some regions do not have

9
planned investments for all categories, especially major capital projects, beyond the current fiscal year (see Appendix A). First Nation Infrastructure Investment Plan – National Level The National First Nation Infrastructure Investment Plan is a compilation of all eight Regional plans. It identifies investments per region per asset category, and presents national data and analysis of Capital Facilities and Maintenance Program capital planning. The National First Nation Infrastructure Investment Plan is reviewed annually by the departmental Operations Committee made up of AANDC senior management and is published on the departmental website.
NATIONAL BALANCE SHEET (2015-2016) A. 2015-2016 Main Estimates - Infrastructure and Capacity (All Votes) $ 1,252,453,270 B. Supplementary Estimates A (All Votes) Budget 2014 (Schools) 50,000,000 Operation Return Home (Re-profile) 40,574,999
Sub-total B $ 90,574,999 C. Other Internal Reallocations into CFMP (as of May 7, 2015) $ 59,591,376 D. Non-CFMP Activity Incl. in Main Estimates (All Votes) Emergency Management Assistance Program 70,252,180 Renewable Energy and Energy Efficiency 3,794,367
Sub-total D $ 74,046,547 E. Revised Overall CFMP Budget All Votes (A+B+C-D) $ 1,328,573,098
F. 2015-2016 CFMP Planned Investments Total FNIIP (Vote 10, planned) 1,131,274,528 Building Canada Fund 15,000,000 Special Initiative Fund 1,117,192 Unallocated Centrally Managed Funds (FMC + RO Reserve)* 17,789,945 CFMP Salaries and O&M (Vote 1 and Vote 5) 29,274,347
Statutory (Employee Benefit Plan & Other Operating/Capital Costs 4,204,676 Sub-total F $ 1,198,660,688 Variance (E-F) $ 129,912,410 *Please note that these Unallocated Centrally Managed Funds may not be available for the Infrastructure and Capacity/Capital Facilities Management program as they may be utilized for other programs.

10
The purpose of the 2015-2016 National Balance Sheet is to provide a detailed comparison between funds that are earmarked within the Main and Supplementary Estimates for the Capital Facilities and Maintenance Program and what is being planned for in the First Nation Infrastructure Investment Plan. The Capital Facilities and Maintenance Program falls under the Infrastructure and Capacity Program, within the Lands and Economy Strategic Outcome, which include resources being targeted for programs that are outside of the delivery of the Program: Emergency Management, Forest Fire Suppression and Climate Change and Energy Efficiency. Once the non-Capital Facilities and Maintenance Program items are removed, Main Estimates combine with the Supplementary Estimates, plus internal budget transfers into the Capital Facilities and Maintenance Program to provide the overall available Program budget for a given fiscal year. As a result of the 2015-2016 First Nation Infrastructure Investment Plan being developed in advance of the current fiscal year, there are typically a number of items that AANDC regions have difficulty planning for due to uncertainty surrounding approval of new initiatives and/or unknown regional budgets. Therefore, the total National First Nation Infrastructure Investment Plan (planned Vote 10) includes planned funding for key targeted initiatives such as the First Nations Water and Wastewater Action Plan, and the Education Infrastructure Fund both announced as part of Budget 2014, but it does not include the Building Canada Fund portion of the First Nation Infrastructure Fund that was announced as part of Budget 2013. The Building Canada Fund is being centrally managed and had not been allocated to AANDC regions at the time the plan was created. The variance represents the difference between the overall Capital Facilities & Maintenance Program budget and the planned investments for the Program. This difference typically represents the reallocation of funding out of the Program to primarily cover potential shortfalls in core program areas such as Education and Social Development. This reallocation occurs at the regional level once budgets are transferred from headquarters to regions. The actual reallocation amount could be higher than the approximate $130 million identified in the National Balance Sheet as the Total Investment Plan (planned Vote 10) includes approximately an additional 10% of over-programming of major capital projects (based on total project costs) to account for both delays to projects outside of AANDC’s control and/or additional funds becoming available later in the fiscal year. The actual reallocation amount can be verified when Public Accounts are finalized for the 2015-2016 fiscal year.

11
National Breakdown of Planned Spending 2015-2016: (Vote 10 Only)
A. Major Capital (Proposal)
% of Total Proposed Funding Education Facilities $92,484,408
46%
Water and Wastewater $189,386,485 Contaminated Sites $10,246,210 Community Infrastructure $95,536,607
Sub-total A $387,653,710 B. Minor Capital (Proposal) $133,484,283 Total Proposal Funding (A+B) $521,137,993 C. Minor Capital (Formula) $204,142,674
54% D. Operation & Maintenance (Formula) $405,993,861
Total Formula Funding (C+D) $610,136,535 Grand Total $1,131,274,528
Proposal-Driven Projects7 (Excluding Formula-Driven Funding) First Nation Infrastructure Capital Projects proposed in 2015-2016 (includes major and minor projects) 666 First Nation Infrastructure Capital Projects proposed in the five year plan (includes major and minor projects) 1,062 Planned spending (current year) $521,137,993 Planned spending (five year aggregate) $1,302,802,384 Total Infrastructure Investment 2015-2016 $1,131,274,528 First Nation Population 475,673 Infrastructure Investment per Capita $2,378
7 Please refer to page 6 of the report for a more detailed explanation of major and minor proposal-driven projects.

12
2015-2016 Distribution of Proposal-Driven Projects by AANDC Region (Excluding Formula-Driven Funding)
YK $8,027,161
(19 projects)
BC $99,546,778
(254 projects)
SK $62,551,681
(87 projects)
MB $154,511,938 (86 projects)
ON $110,586,598 (66 projects)
QC $24,777,748
(39 projects) AT
$13,287,221 (20 projects)
Legend: Total Planned Spending (# Proposal-Based Projects)
AB $47,848,868
(95 projects)
National Total: $521,137,993 (666 projects)

13
Graph 1
Trends by Funding Type Graph 1 illustrates the breakdown of planned spending (vote 10) by funding stream for the current fiscal year as well as a four-year projection. In 2015-2016, Operation and Maintenance funding represents the largest area of investment with approximately 36% of the total planned funding. Close behind is the planned funding for Major Capital at 34% and finally Minor Capital Formula at 18% and Minor Capital Proposal at 12% of the total planned funding amount for 2015-2016. Overall, formula-based funding represents the largest proportion of planned spending in 2015-2016. For a comparison of overall planned funding with last year’s plan, please refer to the 2014-2015 First Nation Infrastructure Investment Plan. Despite Major Capital funding being one of the largest areas of investment for the 2015-2016 fiscal year, a significant decline is planned over the five years outlined in the current plan, from 34% of the overall planned budget to 7% in the final year of the plan. A similar trend, though with a less severe drop, can be observed within the Minor Capital Proposal-Driven funding stream, which sees 12% of the overall planned budget in the initial year drop to 9% in the final year of the plan. This decline is partly attributed to the continued investment in the construction of new facilities, and in the major renovation and/or additions of existing facilities which increases the need for funding to operate and maintain these assets. This is slowly reducing the amount of capital funding that is available for major and minor capital proposal-based projects. Also, the expiration of certain targeted funding initiatives detailed in the next section is further enhancing this downward trend. Operation and Maintenance and Minor Capital Formula funding levels remain fairly constant over the course of the five-year plan. This is a result of both Minor Capital Formula and Operation and Maintenance reference levels being established by way of formula and provided directly to First Nations. The large drop in Operation and Maintenance funding from $406 million
$388$230
$125 $72 $50
$133
$122
$82$43 $57
$204
$204
$204$205 $205
$406
$357
$358$359 $353
$-
$200
$400
$600
$800
$1,000
$1,200
2015-2016 2016-2017 2017-2018 2018-2019 2019-2020
Mill
ions
2015-2016 to 2019-20 Planned Funding by Funding Stream(All Regions)
O&M (Formula)
Minor Capital (Formula)
Minor Capital (Proposal)
Major Capital (Proposal)

14
in 2015-2016 to $357 million in 2016-2017 can be attributed to the expiration of First Nations Water and Wastewater Action Plan at the end of the 2015-2016 fiscal year as well as a few single-year Operation and Maintenance projects. Graph 2
Note: This table does not include the $155 million over 10 years announced from Budget 2013 from the new Building Canada Fund, to be delivered through AANDC’s First Nation Infrastructure Fund. These funds are centrally managed and have not been allocated to regions when this plan was prepared on April 1, 2015. Trends by Funding Source The decrease in planned capital funding levels in 2015-2016 and onwards, as illustrated by Graph 2, can be attributed to the expiration of certain targeted funding over the five years of the current First Nation Infrastructure Investment Plan, with no confirmed renewal at this point in time. There is also a slight decline in total planned funding levels when comparing 2015-2016 A-Base (see glossary for definition of A-base funding) funding levels to future years. This is due to a number of factors including over programming of current year capital projects and a practice of developing infrastructure investment plans that focus on the current year and lack detail on future year plans. Through the Economic Action Plan 2014, The Government of Canada has committed $500 million over seven years for an Education Infrastructure Fund, starting in 2015-2016. AANDC is also allocating an additional $175 million in departmental A-Base for a total investment of $675 million over seven years for new education facilities projects, remediation of existing education facilities, and in support of innovative and cost-efficient education facilities projects. These funds represent a continuation of the $175 million over three years announced in Economic Action Plan 2012 and will help sustain progress made to date in providing First Nation children and youth with better learning environments. Access to safe drinking water, the effective treatment of wastewater and the protection of sources of drinking water on First Nation lands is a priority for the AANDC. The First Nations
$0
$200
$400
$600
$800
$1,000
2015-2016 2016-2017 2017-2018 2018-2019 2019-2020
Mill
ions
2015-2016 to 2019-2020 Planned Funding by Funding Source(All Regions)
Budget 2014 - EIF
Structural Mitigation - Budget2014
Schools Budget 2012
FNWWAP
Gas Tax Fund
FCSAP
Total A-Base

15
Water and Wastewater Action Plan was introduced in 2008, and extended in 2010 and 2012. Economic Action Plan 2014 provided an additional $323.4 million over two years, beginning 2014-2015, to continue to implement the First Nations Water and Wastewater Action plan, including $276 million for AANDC ($274.6 million for operating expenditures and grants and contributions, and $1.4 million for accommodation) and $47.4 million for Health Canada ($46.3 million for operating expenditures and grants and contributions, and $1.1 million for accommodation). These investments support First Nations communities in managing their water and wastewater infrastructure. Beginning with $3 million in 2015-2016, AANDC has begun to receive $40 million over five years from Economic Action Plan 2014 for disaster mitigation programming in First Nation communities. These funds will support structural mitigation measures that will reduce the possible impacts of hazards, and include the application of engineering techniques to achieve hazard-resistance and resilience in structures or systems. In Economic Action Plan 2013, the Government of Canada announced $155 million over 10 years from the new Building Canada Fund in addition to $139 million over five years from the Gas Tax Fund to be delivered to First Nations through AANDC’s First Nation Infrastructure Fund starting in 2014-2015. The Gas Tax Fund is a permanent funding which is re-calculated every five years based upon First Nation population. The First Nation Infrastructure Fund focuses on six priority areas: improving First Nations energy systems (linking to power grids, sustainable energy systems), broadband connectivity, solid waste management (including landfills and recycling), road and bridge projects, disaster mitigation, and community planning and/or skills development projects that will support long-term sustainable community development of First Nation communities. To help First Nations ensure that the fuel tanks that power their essential community services, such as water and wastewater treatment systems, schools and community buildings, meet Environment Canada’s regulations, $45 million over four years (2011-2016) was approved in the 2011 Federal Budget. In addition, AANDC committed $34.5 million over 5 years (2011-2016) from the Capital Facilities and Maintenance Program for a total investment of $79.5 million. The Federal Contaminated Sites Action Plan, a cost-shared program that supports federal departments, agencies and consolidated Crown corporations in addressing contaminated sites for which they are responsible, is now in its second phase (2011-2016). The focus of Phase II is on remediating the highest-priority sites, to reduce their environmental and human health risks, and their associated financial liabilities. While contaminated sites on reserve lands are managed under AANDC’s Contaminated Sites Management Program, the Capital Facilities and Maintenance Program can be used to fund contaminated site projects.

16
Planned Funding in 2015-2016 Proposal-Driven Capital Projects 8 Only Graph 3: National Funding by Asset Class
Graph 3 demonstrates the spread of proposal funding by asset category. Proportionately, the percentage share of proposal projects is very similar to the 2014-2015 Plan. As was the case in 2014-2015, Water and Wastewater is the largest asset category at 45%, followed by Community Infrastructure (including projects such as roads & bridges, fuel tanks and fire protection) at 21%, and then Education with 22% of total proposal funding. These categories form the major portion of proposal projects because of targeted funding initiatives and the way projects are prioritized. Housing and Contaminated Sites represent a smaller portion of proposal projects, at 9% and 3% respectively.
8 Please refer to page 6 of the report for a more detailed explanation of Major & Minor proposal driven-projects.
Graph 4: National Funding by
Priority Ranking
Graph 4 illustrates that Priority 1 represents 34% of all planned projects being funded this year. This priority, as per the National Priority Ranking Framework9, only includes water and wastewater projects. Projects can either be upgrades to existing systems or new construction, to deal with imminent health and safety risks, water or wastewater quality, legislative or regulatory requirements. Priority 2 represents the largest portion of all planned projects at 42%. Unlike Priority 1, Priority 2 projects include all asset classes and cover all program activity categories. This category includes targeted initiatives, such as the Education Infrastructure Fund announced in Budget 2014 to assist First Nations in the construction or renovation of education facilities. The First Nation Infrastructure Fund, which supports improvement to the environment and quality of life in First Nation communities is also included. Priority 3 projects represent a total of 20% and Priority 4 represents 4%. These priorities focus on anticipated population growth. The investments required to effectively address Priority 1 and 2 projects limit the number of Priority 3 and 4 projects that can be funded within the existing Capital Facilities and Maintenance Program envelope. 9 For more details, see Annex B
Community Infrastructur
e
21%Contaminat
ed Sites3%
Education22%
Housing9%
Water & Wastewate
r45%
Priority 1
34%
Priority 2
42%
Priority 3
20%
Priority 4
4%

17
Infrastructure Capital – Investment Opportunities
For the purpose of the First Nation Infrastructure Investment Plan, an investment opportunity is defined as a project that meets program criteria but is not funded under the current plan (2015-2016 to 2019-2020). These projects may or may not have previously received funding. Capital projects planned within the five years which do not have an identified source of funds are also considered to be investment opportunities. The 2015-2016 First Nation Infrastructure Investment Plan includes 1,818 capital projects valued at approximately $5.3 billion that regions identified in their First Nation Infrastructure Investment Plans as investment opportunities. These investment opportunities can be further broken down by asset class and national priority ranking.
Graph 5: Capital Funding Requests by Asset Class
Graph 5 demonstrates the need by major asset category as identified in the five-year plan. The highest demand for infrastructure projects is in the asset category of Water and Wastewater at 34%, Community Infrastructure projects are the next highest in demand at 33%, followed by Education and Housing projects at 15% each, and Contaminated Sites at 3%.
Graph 6: Capital Funding Requests by Priority Ranking
Graph 6 illustrates that Priority 1 projects represent 11% of the total future investment opportunities as identified by regions. Priority 1 projects can either be repairs/upgrades or new construction of water or wastewater facilities, to deal with imminent health and safety risks, water quality and legislative/regulatory requirements. Priority 2 projects represent 40% of all unfunded projects. For Priority 2, projects include all asset categories and cover almost all program activity categories, except for Growth/Need beyond 2 years, which explains its large percentage. Priority 3 and 4 projects represent a combined total of 49% of investment opportunities. These priorities focus on anticipated population growth. As Priorities 1 and 2 represents a total of 51%, the likelihood of Priority 3 and 4 projects receiving funding is limited.

2015-2016 Planned Acquisition and Construction of Facilities (Proposal & Formula-Based Capital Projects and Operations & Maintenance)
The dashes above indicate that planned funding in this category has yet to be determined. Funding levels may only be known just prior to the commencement of the fiscal year in question. *Community Infrastructure category includes various asset classes such as Roads & Bridges, Electrification, Connectivity, Solid Waste, Fuel Tanks, and others.
18
National Summary
Project Category
Previous Year (Planned Amount in 2014-
2015)
Planned Spending
2015-2016 2016-2017 2017-2018 2018-2019 2019-2020
Proposal Based Capital Projects
Community Infrastructure 140,249,015 111,857,078 60,966,094 25,360,860 35,889,590 21,958,872
Contaminated Sites 9,664,723 13,995,410 9,584,719 14,739,737 8,707,628 5,650,344
Education 123,224,131 112,971,876 163,972,462 92,900,376 11,300,000 10,500,000
Housing 39,028,966 46,272,853 35,045,333 30,330,333 12,020,333 10,720,333
Water and Wastewater 189,736,952 236,040,776 82,610,865 43,582,661 47,700,961 58,122,891
Sub-Total (Proposal) $ 501,903,787 $ 521,137,993 $ 352,179,473 $ 206,913,967 $ 115,618,512 $ 106,952,440
Formula Driven Capital
Community Infrastructure 118,537,290 104,939,578 105,608,081 106,612,501 106,078,424 105,894,037
Contaminated Sites - - - - - -
Education 14,562,429 4,843,796 4,763,696 4,774,696 5,108,896 5,068,896
Housing 88,093,460 86,234,810 88,900,757 88,039,205 88,694,635 89,135,670
Water and Wastewater 13,408,544 8,124,490 4,756,761 5,012,884 4,806,434 4,911,969
Sub-Total (Formula) $ 234,601,723 $ 204,142,674 $ 204,029,295 $ 204,439,286 $ 204,688,389 $ 205,010,572
Operations & Maintenance
Community Infrastructure 157,043,540 160,828,633 152,832,504 153,312,569 153,822,351 149,240,767
Contaminated Sites 400,000 3,654 - - - -
Education 102,578,951 112,248,732 111,962,582 112,035,667 112,110,213 112,186,252
Housing 8,898,906 2,525,767 1,945,547 1,945,547 1,945,547 1,890,324
Water and Wastewater 130,827,951 130,387,075 90,337,321 90,625,692 90,919,831 89,509,036
Sub-Total (O&M) $ 399,749,348 $ 405,993,861 $ 357,077,954 $ 357,919,475 $ 358,797,942 $ 352,826,379
Grand Total
Community Infrastructure 415,829,846 377,625,289 319,406,679 285,285,930 295,790,364 277,093,677
Contaminated Sites 10,064,723 13,999,064 9,584,719 14,739,737 8,707,628 5,650,344
Education 240,365,511 230,064,404 280,698,740 209,710,739 128,519,109 127,755,148
Housing 136,021,332 135,033,430 125,891,637 120,315,085 102,660,515 101,746,327
Water and Wastewater 333,973,447 374,552,341 177,704,947 139,221,237 143,427,226 152,543,896
Grand Total $ 1,136,254,858 $ 1,131,274,528 $ 913,286,722 $ 769,272,728 $ 679,104,842 $ 664,789,392

19
APPENDIX A – REGIONAL SUMMARIES
Atlantic Region Breakdown of planned spending 2015-2016: (Vote 10 Only)
Regional Snapshot:
First Nation Infrastructure Capital Projects proposed in 2015-2016 (includes proposal-based projects only)
20
First Nation Infrastructure Capital projects proposed in the five year plan (includes proposal-based projects only)
25
Total Infrastructure Investment 2015-2016 $41,558,189 First Nation Population 23,460 Infrastructure Investment Per Capita $1,771
A. Major Capital (Proposal) % of Total Proposed Funding Education Facilities $5,000,000
32%
Water and Wastewater $4,410,000 Contaminated Sites $0 Community Infrastructure $1,000,000
Subtotal A $10,410,000
B. Minor Capital (Proposal) $2,877,221 Total Proposal Funding (A+B) $13,287,221
D. Minor Capital (Formula) $9,076,301 68% E. Operations and Maintenance (Formula) $19,194,667
Total Formula Funding (C+D) $28,270,968 Grand Total $41,558,189

The dashes above indicate that planned funding in this category has yet to be determined. Funding levels may only be known just prior to the commencement of the fiscal year in question. *Community Infrastructure category includes various asset classes such as Roads & Bridges, Electrification, Connectivity, Solid Waste, Fuel Tanks and others.
20
Atlantic Summary
Project Category Previous Year
(Planned Amount in 2014-2015)
Planned Spending
2015-2016 2016-2017 2017-2018 2018-2019 2019-2020 Proposal Based Capital Projects Community Infrastructure 10,890,100 1,144,958 - - - -
Contaminated Sites - - - - - -
Education 5,164,400 5,406,400 10,000,000 - - -
Housing - - - - - -
Water and Wastewater 7,351,095 6,735,863 - - - -
Sub-Total (Proposal) $ 23,405,595 $ 13,287,221 $ 10,000,000 $ - $ - $ - Formula Driven Capital Community Infrastructure 906,018 2,804,813 2,305,166 2,319,566 2,284,966 2,284,966
Contaminated Sites - - - - - -
Education - 8,264 8,264 8,264 8,264 8,264
Housing 8,154,164 5,746,411 5,763,969 5,863,969 5,863,969 5,819,322
Water and Wastewater - 516,813 300,770 296,670 294,170 294,170
Sub-Total (Formula) $ 9,060,182 $ 9,076,301 $ 8,378,169 $ 8,488,469 $ 8,451,369 $ 8,406,722 Operations & Maintenance Community Infrastructure 9,675,705 12,725,194 11,741,414 11,750,260 11,759,213 6,676,980
Contaminated Sites - - - - - -
Education 2,819,473 1,826,570 1,567,630 1,567,630 1,567,630 1,567,630
Housing - 166,799 166,799 166,799 166,799 111,576
Water and Wastewater 5,838,260 4,476,104 2,496,615 2,496,615 2,496,615 785,793
Sub-Total (O&M) $ 18,333,438 $ 19,194,667 $ 15,972,458 $ 15,981,304 $ 15,990,257 $ 9,141,979 Grand Total Community Infrastructure 21,471,824 16,674,965 14,046,580 14,069,826 14,044,179 8,961,946
Contaminated Sites - - - - - -
Education 7,983,873 7,241,234 11,575,894 1,575,894 1,575,894 1,575,894
Housing 8,154,164 5,913,210 5,930,768 6,030,768 6,030,768 5,930,898
Water and Wastewater 13,189,355 11,728,780 2,797,385 2,793,285 2,790,785 1,079,963
Grand Total $ 50,799,215 $ 41,558,189 $ 34,350,627 $ 24,469,773 $ 24,441,626 $ 17,548,701

21
Quebec Region Breakdown of planned spending 2015-2016: (Vote 10 Only)
A. Major Capital (Proposal) % of Total Proposed Funding
Education Facilities $5,000,000
31%
Water and Wastewater $10,485,357 Contaminated Sites $0 Community Infrastructure $0
Subtotal A $15,485,357
B. Minor Capital (Proposal) $9,292,391
Total Proposal Funding (A+B) $24,777,748 D. Minor Capital (Formula) $22,440,917
69% E. Operations and Maintenance (Formula) $31,928,987
Total Formula Funding (C+D) $54,369,904 Grand Total $79,147,652
Regional Snapshot: First Nation Infrastructure Capital Projects proposed in 2015-2016 (includes proposal-based projects only)
39
First Nation Infrastructure Capital Projects proposed in the five year plan (includes proposal-based projects only)
60
Total Infrastructure Investment 2015-2016 $79,147,652 First Nation Population 55,847 Infrastructure Investment Per Capita $1,417

The dashes above indicate that planned funding in this category has yet to be determined. Funding levels may only be known just prior to the commencement of the fiscal year in question. *Community Infrastructure category includes various asset classes such as Roads & Bridges, Electrification, Connectivity, Solid Waste, Fuel Tanks and others.
22
Quebec Summary
Project Category Previous Year
(Planned Amount in 2014-2015)
Planned Spending
2015-2016 2016-2017 2017-2018 2018-2019 2019-2020 Proposal Based Capital Projects
Community Infrastructure 3,610,406 3,546,677 4,155,772 3,816,255 4,410,864 1,200,000
Contaminated Sites - - - - - -
Education 3,431,372 5,240,000 4,113,000 200,000 - -
Housing - 750,000 750,000 750,000 - -
Water and Wastewater 11,808,740 15,241,071 209,312 219,778 230,765 233,842
Sub-Total (Proposal) $ 18,850,518 $ 24,777,748 $ 9,228,084 $ 4,986,033 $ 4,641,629 $ 1,433,842
Formula Driven Capital
Community Infrastructure 11,932,328 22,440,917 22,681,389 22,681,389 22,681,389 22,681,389
Contaminated Sites - - - - - -
Education 450,257 - - - - -
Housing 7,251,361 - - - - -
Water and Wastewater 2,834,636 - - - - -
Sub-Total (Formula) $ 22,468,583 $ 22,440,917 $ 22,681,389 $ 22,681,389 $ 22,681,389 $ 22,681,389
Operations & Maintenance
Community Infrastructure 12,023,321 11,928,993 11,782,277 11,782,277 11,782,277 11,782,277
Contaminated Sites 400,000 3,654 - - - -
Education 10,531,010 10,662,220 10,662,220 10,662,220 10,662,220 10,662,220
Housing 645,911 743,307 683,087 683,087 683,087 683,087
Water and Wastewater 7,226,006 8,590,813 6,065,813 6,065,813 6,065,813 6,065,813
Sub-Total (O&M) $ 30,826,248 $ 31,928,987 $ 29,193,397 $ 29,193,397 $ 29,193,397 $ 29,193,397
Grand Total
Community Infrastructure 27,566,055 37,916,587 38,619,438 38,279,921 38,874,530 35,663,666
Contaminated Sites 400,000 3,654 - - - -
Education 14,412,639 15,902,220 14,775,220 10,862,220 10,662,220 10,662,220
Housing 7,897,272 1,493,307 1,433,087 1,433,087 683,087 683,087
Water and Wastewater 21,869,382 23,831,884 6,275,125 6,285,591 6,296,578 6,299,655
Grand Total $ 72,145,349 $ 79,147,652 $ 61,102,870 $ 56,860,819 $ 56,516,415 $ 53,308,628

23
Ontario Region Breakdown of planned spending 2015-2016: (Vote 10 Only)
A. Major Capital (Proposal) % of Total Proposed Funding Education Facilities $41,262,486
42%
Water and Wastewater $44,207,611 Contaminated Sites $943,710 Community Infrastructure $13,834,911
Subtotal A $100,248,718
B. Minor Capital (Proposal) $10,337,880
Total Proposal Funding (A+B) $110,586,598 D. Minor Capital (Formula) $47,418,056
58% E. Operations and Maintenance (Formula) $104,644,486
Total Formula Funding (C+D) $152,062,542 Grand Total $262,649,140
Regional Snapshot:
Total Infrastructure Investment 2015-2016 $262,649,140 First Nation Population 94,312 Infrastructure Investment Per Capita $2,785
First Nation Infrastructure Capital Projects proposed in 2015-2016 (includes proposal-based projects only)
66
First Nation Infrastructure Capital Projects proposed in the five year plan (includes proposal-based projects only)
67

The dashes above indicate that planned funding in this category has yet to be determined. Funding levels may only be known just prior to the commencement of the fiscal year in question. *Community Infrastructure category includes various asset classes such as Roads & Bridges, Electrification, Connectivity, Solid Waste, Fuel Tanks and others.
24
Ontario Summary
Project Category Previous Year
(Planned Amount in 2014-2015)
Planned Spending
2015-2016 2016-2017 2017-2018 2018-2019 2019-2020
Proposal Based Capital Projects
Community Infrastructure 40,550,797 20,525,582 12,789,257 193,570 279,656 359,429
Contaminated Sites 1,943,023 1,841,710 656,659 - - -
Education 49,712,674 41,612,486 17,281,113 946,311 - -
Housing 5,075,000 1,340,727 - - - -
Water and Wastewater 34,950,501 45,266,093 23,927,436 7,039,318 - -
Sub-Total (Proposal) $ 132,231,995 $ 110,586,598 $ 54,654,465 $ 8,179,199 $ 279,656 $ 359,429
Formula Driven Capital
Community Infrastructure 23,496,174 23,183,305 23,183,305 23,183,305 23,183,305 23,183,305
Contaminated Sites - - - - - -
Education 1,991,954 1,916,517 1,916,517 1,916,517 1,916,517 1,916,517
Housing 22,531,915 22,318,234 22,318,234 22,318,234 22,318,234 22,318,234
Water and Wastewater - - - - - -
Sub-Total (Formula) $ 48,020,043 $ 47,418,056 $ 47,418,056 $ 47,418,056 $ 47,418,056 $ 47,418,056
Operations & Maintenance
Community Infrastructure 39,568,318 37,290,688 37,220,688 37,220,688 37,220,688 37,220,688
Contaminated Sites - - - - - -
Education 35,736,940 35,669,354 35,669,354 35,669,354 35,669,354 35,669,354
Housing 6,951,334 - - - - -
Water and Wastewater 41,251,600 31,684,444 22,058,034 22,058,034 22,058,034 22,058,034
Sub-Total (O&M) $ 123,508,192 $ 104,644,486 $ 94,948,076 $ 94,948,076 $ 94,948,076 $ 94,948,076
Grand Total
Community Infrastructure 103,615,289 80,999,575 73,193,250 60,597,563 60,683,649 60,763,422
Contaminated Sites 1,943,023 1,841,710 656,659 - - -
Education 87,441,568 79,198,357 54,866,984 38,532,182 37,585,871 37,585,871
Housing 34,558,249 23,658,961 22,318,234 22,318,234 22,318,234 22,318,234
Water and Wastewater 76,202,101 76,950,537 45,985,470 29,097,352 22,058,034 22,058,034
Grand Total $ 303,760,230 $ 262,649,140 $ 197,020,597 $ 150,545,331 $ 142,645,788 $ 142,725,561

25
Manitoba Region Breakdown of planned spending 2015-2016: (Vote 10 Only)
A. Major Capital (Proposal) % of Total Proposed Funding Education Facilities $6,798,200
57%
Water and Wastewater $58,247,761 Contaminated Sites $7,535,000 Community Infrastructure $65,967,651
Subtotal A $138,548,612
B. Minor Capital (Proposal) $15,963,326
Total Proposal Funding (A+B) $154,511,938 D. Minor Capital (Formula) $52,235,062
43% E. Operations and Maintenance (Formula) $66,534,184
Total Formula Funding (C+D) $118,769,246 Grand Total $273,281,184
Regional Snapshot:
First Nation Infrastructure Capital Projects proposed in 2015-2016 (includes proposal-based projects only)
86
First Nation Infrastructure Capital Projects proposed in the five year plan (includes proposal-based projects only)
107
Total Infrastructure Investment 2015-2016 $273,281,184 First Nation Population 89,705 Infrastructure Investment Per Capita $3,046
The dashes above indicate that planned funding in this category has yet to be determined. Funding levels may only be known just prior to the commencement of the fiscal year in question. *Community Infrastructure category includes various asset classes such as Roads & Bridges, Electrification, Connectivity, Solid Waste, Fuel Tanks and others.
26
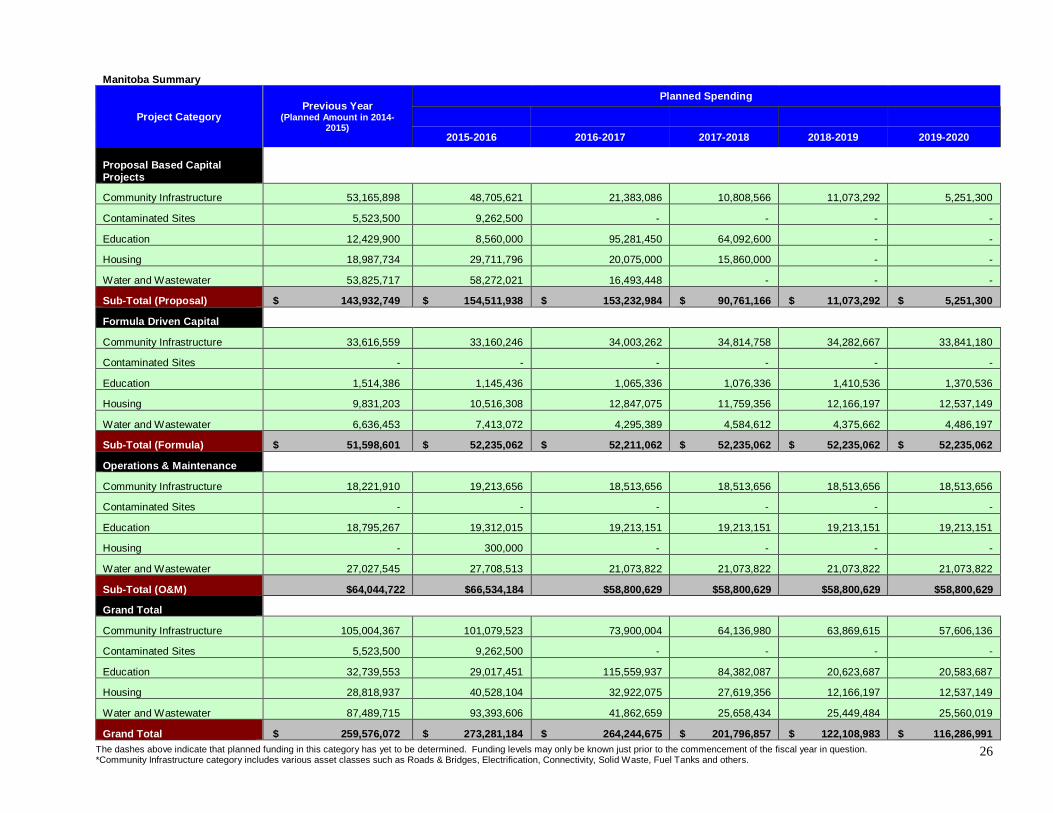
Manitoba Summary
Project Category Previous Year
(Planned Amount in 2014-2015)
Planned Spending
2015-2016 2016-2017 2017-2018 2018-2019 2019-2020
Proposal Based Capital Projects
Community Infrastructure 53,165,898 48,705,621 21,383,086 10,808,566 11,073,292 5,251,300
Contaminated Sites 5,523,500 9,262,500 - - - -
Education 12,429,900 8,560,000 95,281,450 64,092,600 - -
Housing 18,987,734 29,711,796 20,075,000 15,860,000 - -
Water and Wastewater 53,825,717 58,272,021 16,493,448 - - -
Sub-Total (Proposal) $ 143,932,749 $ 154,511,938 $ 153,232,984 $ 90,761,166 $ 11,073,292 $ 5,251,300
Formula Driven Capital
Community Infrastructure 33,616,559 33,160,246 34,003,262 34,814,758 34,282,667 33,841,180
Contaminated Sites - - - - - -
Education 1,514,386 1,145,436 1,065,336 1,076,336 1,410,536 1,370,536
Housing 9,831,203 10,516,308 12,847,075 11,759,356 12,166,197 12,537,149
Water and Wastewater 6,636,453 7,413,072 4,295,389 4,584,612 4,375,662 4,486,197
Sub-Total (Formula) $ 51,598,601 $ 52,235,062 $ 52,211,062 $ 52,235,062 $ 52,235,062 $ 52,235,062
Operations & Maintenance
Community Infrastructure 18,221,910 19,213,656 18,513,656 18,513,656 18,513,656 18,513,656
Contaminated Sites - - - - - -
Education 18,795,267 19,312,015 19,213,151 19,213,151 19,213,151 19,213,151
Housing - 300,000 - - - -
Water and Wastewater 27,027,545 27,708,513 21,073,822 21,073,822 21,073,822 21,073,822
Sub-Total (O&M) $64,044,722 $66,534,184 $58,800,629 $58,800,629 $58,800,629 $58,800,629
Grand Total
Community Infrastructure 105,004,367 101,079,523 73,900,004 64,136,980 63,869,615 57,606,136
Contaminated Sites 5,523,500 9,262,500 - - - -
Education 32,739,553 29,017,451 115,559,937 84,382,087 20,623,687 20,583,687
Housing 28,818,937 40,528,104 32,922,075 27,619,356 12,166,197 12,537,149
Water and Wastewater 87,489,715 93,393,606 41,862,659 25,658,434 25,449,484 25,560,019
Grand Total $ 259,576,072 $ 273,281,184 $ 264,244,675 $ 201,796,857 $ 122,108,983 $ 116,286,991

27
Saskatchewan Region Breakdown of planned spending 2015-2016: (Vote 10 Only)
A. Major Capital (Proposal) % of Total Proposed Funding Education Facilities $7,923,865
42%
Water and Wastewater $32,336,889 Contaminated Sites $0
Community Infrastructure $5,237,700 Subtotal A $45,498,454
B. Minor Capital (Proposal) $17,053,227 Total Proposal Funding (A+B) $62,551,681 D. Minor Capital (Formula) $29,047,955
58% E. Operations and Maintenance (Formula) $57,443,722
Total Formula Funding (C+D) $86,491,677 Grand Total $149,043,358
Regional Snapshot: First Nation Infrastructure Capital Projects proposed in 2015-2016 (includes proposal-based projects only)
87
First Nation Infrastructure Capital Projects proposed in the five year plan (includes proposal-based projects only)
127
Total Infrastructure Investment 2015-2016 $149,043,358 First Nation Population 72,199 Infrastructure Investment Per Capita $2,064
The dashes above indicate that planned funding in this category has yet to be determined. Funding levels may only be known just prior to the commencement of the fiscal year in question. *Community Infrastructure category includes various asset classes such as Roads & Bridges, Electrification, Connectivity, Solid Waste, Fuel Tanks and others.
28
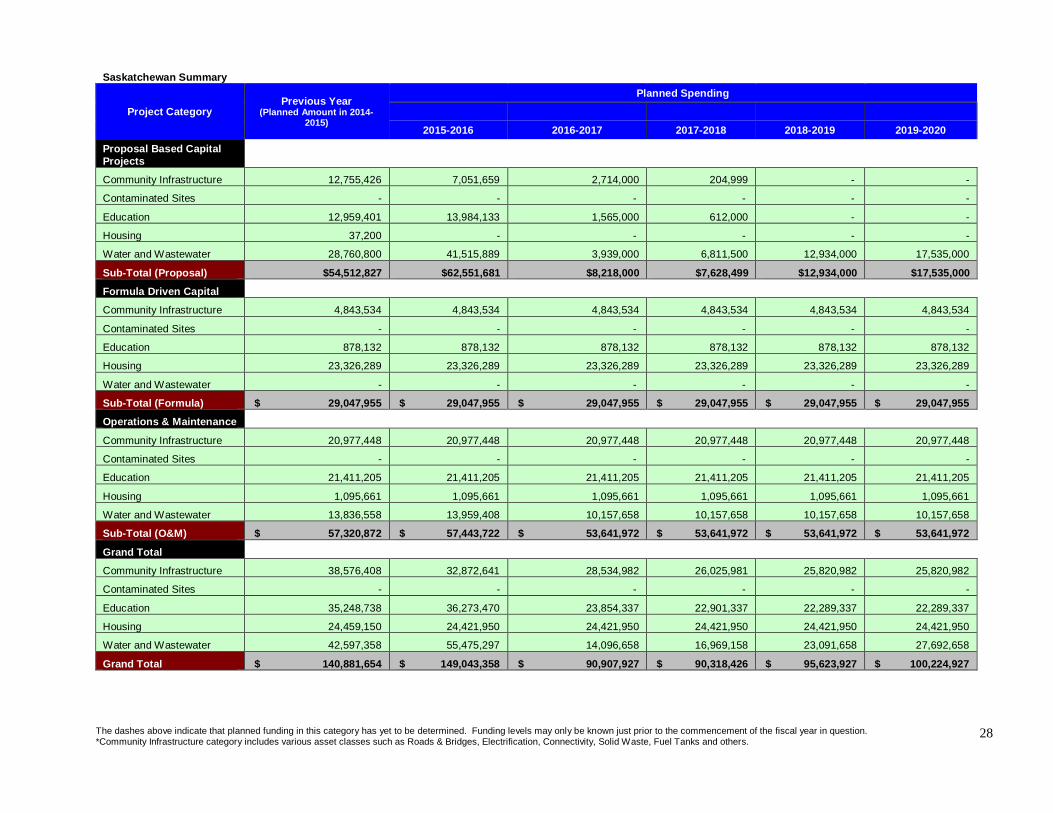
Saskatchewan Summary
Project Category Previous Year
(Planned Amount in 2014-2015)
Planned Spending
2015-2016 2016-2017 2017-2018 2018-2019 2019-2020
Proposal Based Capital Projects
Community Infrastructure 12,755,426 7,051,659 2,714,000 204,999 - -
Contaminated Sites - - - - - -
Education 12,959,401 13,984,133 1,565,000 612,000 - -
Housing 37,200 - - - - -
Water and Wastewater 28,760,800 41,515,889 3,939,000 6,811,500 12,934,000 17,535,000
Sub-Total (Proposal) $54,512,827 $62,551,681 $8,218,000 $7,628,499 $12,934,000 $17,535,000
Formula Driven Capital
Community Infrastructure 4,843,534 4,843,534 4,843,534 4,843,534 4,843,534 4,843,534
Contaminated Sites - - - - - -
Education 878,132 878,132 878,132 878,132 878,132 878,132
Housing 23,326,289 23,326,289 23,326,289 23,326,289 23,326,289 23,326,289
Water and Wastewater - - - - - -
Sub-Total (Formula) $ 29,047,955 $ 29,047,955 $ 29,047,955 $ 29,047,955 $ 29,047,955 $ 29,047,955
Operations & Maintenance
Community Infrastructure 20,977,448 20,977,448 20,977,448 20,977,448 20,977,448 20,977,448
Contaminated Sites - - - - - -
Education 21,411,205 21,411,205 21,411,205 21,411,205 21,411,205 21,411,205
Housing 1,095,661 1,095,661 1,095,661 1,095,661 1,095,661 1,095,661
Water and Wastewater 13,836,558 13,959,408 10,157,658 10,157,658 10,157,658 10,157,658
Sub-Total (O&M) $ 57,320,872 $ 57,443,722 $ 53,641,972 $ 53,641,972 $ 53,641,972 $ 53,641,972
Grand Total
Community Infrastructure 38,576,408 32,872,641 28,534,982 26,025,981 25,820,982 25,820,982
Contaminated Sites - - - - - -
Education 35,248,738 36,273,470 23,854,337 22,901,337 22,289,337 22,289,337
Housing 24,459,150 24,421,950 24,421,950 24,421,950 24,421,950 24,421,950
Water and Wastewater 42,597,358 55,475,297 14,096,658 16,969,158 23,091,658 27,692,658
Grand Total $ 140,881,654 $ 149,043,358 $ 90,907,927 $ 90,318,426 $ 95,623,927 $ 100,224,927

29
Alberta Region Breakdown of planned spending 2015-2016: (Vote 10 Only)
A. Major Capital (Proposal) % of Total Proposed Funding Education Facilities $8,400,000
34%
Water and Wastewater $7,747,992 Contaminated Sites $0 Community Infrastructure $4,215,356
Subtotal A $20,363,348
B. Minor Capital (Proposal) $27,485,520
Total Proposal Funding (A+B) $47,848,868 D. Minor Capital (Formula) $27,628,948
66% E. Operations and Maintenance (Formula) $65,505,095
Total Formula Funding (C+D) $93,134,043 Grand Total $140,982,911
Regional Snapshot: First Nation Infrastructure Capital Projects proposed in 2015-2016 (includes proposal-based projects only)
95
First Nation Infrastructure Capital Projects proposed in the five year plan (includes proposal-based projects only)
99
Total Infrastructure Investment 2015-2016 $140,982,911 First Nation Population 73,684 Infrastructure Investment Per Capita $1,913

The dashes above indicate that planned funding in this category has yet to be determined. Funding levels may only be known just prior to the commencement of the fiscal year in question. *Community Infrastructure category includes various asset classes such as Roads & Bridges, Electrification, Connectivity, Solid Waste, Fuel Tanks and others.
30
Alberta Summary
Project Category Previous Year
(Planned Amount in 2014-2015)
Planned Spending
2015-2016 2016-2017 2017-2018 2018-2019 2019-2020 Proposal Based Capital Projects
Community Infrastructure 7,351,875 6,991,356 1,400,000 - - -
Contaminated Sites - - - - - -
Education 11,233,125 17,999,000 17,202,000 9,289,465 - -
Housing 250,000 - - - - -
Water and Wastewater 12,966,358 22,858,512 - - - -
Sub-Total (Proposal) $ 31,801,358 $ 47,848,868 $ 18,602,000 $ 9,289,465 $ - $ -
Formula Driven Capital
Community Infrastructure 20,392,108 9,505,943 9,505,943 9,505,943 9,505,943 9,505,943
Contaminated Sites - - - - - -
Education 7,145,358 895,447 895,447 895,447 895,447 895,447
Housing 17,180,567 17,227,558 17,227,558 17,227,558 17,227,558 17,227,558
Water and Wastewater 6,581,039 - - - - -
Sub-Total (Formula) $ 51,299,072 $ 27,628,948 $ 27,628,948 $ 27,628,948 $ 27,628,948 $ 27,628,948
Operations & Maintenance
Community Infrastructure 33,150,904 28,408,552 28,408,552 28,408,552 28,408,552 28,408,552
Contaminated Sites - - - - - -
Education 12,788,267 19,753,906 19,753,906 19,753,906 19,753,906 19,753,906
Housing - - - - - -
Water and Wastewater 5,621,744 17,342,637 14,047,504 14,047,504 14,047,504 14,047,504
Sub-Total (O&M) $ 51,560,915 $ 65,505,095 $ 62,209,962 $ 62,209,962 $ 62,209,962 $ 62,209,962
Grand Total
Community Infrastructure 60,894,887 44,905,851 39,314,495 37,914,495 37,914,495 37,914,495
Contaminated Sites - - - - - -
Education 31,166,750 38,648,353 37,851,353 29,938,818 20,649,353 20,649,353
Housing 17,430,567 17,227,558 17,227,558 17,227,558 17,227,558 17,227,558
Water and Wastewater 25,169,141 40,201,149 14,047,504 14,047,504 14,047,504 14,047,504
Grand Total $ 134,661,345 $ 140,982,911 $ 108,440,910 $ 99,128,375 $ 89,838,910 $ 89,838,910

31
British Columbia Region Breakdown of planned spending 2015-2016: (Vote 10 Only)
A. Major Capital (Proposal) % of Total Proposed Funding Education Facilities $18,099,857
58%
Water and Wastewater $28,450,875 Contaminated Sites $1,767,500 Community Infrastructure $2,889,989
Subtotal A $51,208,221
B. Minor Capital (Proposal) $48,338,557
Total Proposal Funding (A+B) $99,546,778 D. Minor Capital (Formula) $13,515,257
42% E. Operations and Maintenance (Formula) $58,057,473
Total Formula Funding (C+D) $71,572,730 Grand Total $171,119,508
Regional Snapshot: First Nation Infrastructure Capital Projects proposed in 2015-2016 (includes proposal-based projects only)
254
First Nation Infrastructure Capital Projects proposed in the five year plan (includes proposal-based projects only)
544
Total Infrastructure Investment 2015-2016 $171,119,508 First Nation Population 62,481 Infrastructure Investment Per Capita $2,739

The dashes above indicate that planned funding in this category has yet to be determined. Funding levels may only be known just prior to the commencement of the fiscal year in question. *Community Infrastructure category includes various asset classes such as Roads & Bridges, Electrification, Connectivity, Solid Waste, Fuel Tanks and others.
32
British Columbia Summary
Project Category Previous Year
(Planned Amount in 2014-2015)
Planned Spending
2015-2016 2016-2017 2017-2018 2018-2019 2019-2020 Proposal Based Capital Projects
Community Infrastructure 11,417,073 21,046,751 18,230,000 10,038,515 19,826,647 14,845,000
Contaminated Sites 2,198,200 2,891,200 8,928,060 14,739,737 8,707,628 5,650,344
Education 28,293,259 20,169,857 18,529,899 17,760,000 11,300,000 10,500,000
Housing 14,479,032 14,250,000 14,000,000 13,500,000 11,800,000 10,500,000
Water and Wastewater 37,282,216 41,188,970 37,093,129 28,563,525 33,587,656 39,485,509
Sub-Total (Proposal) $ 93,669,780 $ 99,546,778 $ 96,781,088 $ 84,601,777 $ 85,221,931 $ 80,980,853
Formula Driven Capital
Community Infrastructure 11,885,456 8,109,155 8,271,327 8,436,743 8,605,465 8,777,565
Contaminated Sites - - - - - -
Education 3,032,599 - - - - -
Housing 5,317,014 5,406,102 5,514,214 5,624,489 5,736,970 5,851,700
Water and Wastewater - - - - -
Sub-Total (Formula) $ 20,235,069 $ 13,515,257 $ 13,785,541 $ 14,061,232 $ 14,342,435 $ 14,629,265
Operations & Maintenance
Community Infrastructure 22,028,926 28,677,342 22,449,774 22,898,419 23,356,022 23,822,781
Contaminated Sites - - - - - -
Education 492,014 3,583,462 3,655,116 3,728,201 3,802,747 3,878,786
Housing 206,000 220,000 - - - -
Water and Wastewater 28,559,945 25,576,669 13,440,118 13,708,834 13,982,925 14,262,503
Sub-Total (O&M) $ 51,286,885 $ 58,057,473 $ 39,545,008 $ 40,335,454 $ 41,141,694 $ 41,964,070
Grand Total
Community Infrastructure 45,331,455 57,833,248 48,951,101 41,373,677 51,788,134 47,445,346
Contaminated Sites 2,198,200 2,891,200 8,928,060 14,739,737 8,707,628 5,650,344
Education 31,817,872 23,753,319 22,185,015 21,488,201 15,102,747 14,378,786
Housing 20,002,046 19,876,102 19,514,214 19,124,489 17,536,970 16,351,700
Water and Wastewater 65,842,161 66,765,639 50,533,247 42,272,359 47,570,581 53,748,012
Grand Total $ 165,191,734 $ 171,119,508 $ 150,111,637 $ 138,998,463 $ 140,706,060 $ 137,574,188

33
Yukon Region Breakdown of planned spending 2015-2016: (Vote 10 Only)
A. Major Capital (Proposal) % of Total 2015-2016 Proposed Funding
Education Facilities $0
59%
Water and Wastewater $3,500,000 Contaminated Sites $0 Community Infrastructure $2,391,000
Subtotal A $5,891,000
B. Minor Capital (Proposal) $2,136,161 Total Proposal Funding (A+B) $8,027,161 D. Minor Capital (Formula) $2,780,178
41% E. Operations and Maintenance (Formula) $2,685,247
Total Formula Funding (C+D) $5,465,425 Grand Total $13,492,586
Regional Snapshot: First Nation Infrastructure Capital Projects proposed in 2015-2016 (includes proposal-based projects only)
19
First Nation Infrastructure Capital Projects proposed in the five year plan (includes proposal-based projects only)
33
Total Infrastructure Investment 2015-2016 $13,492,586 First Nation Population 3,985 Infrastructure Investment Per Capita $3,386
The dashes above indicate that planned funding in this category has yet to be determined. Funding levels may only be known just prior to the commencement of the fiscal year in question. *Community Infrastructure category includes various asset classes such as Roads & Bridges, Electrification, Connectivity, Solid Waste, Fuel Tanks and others.
34
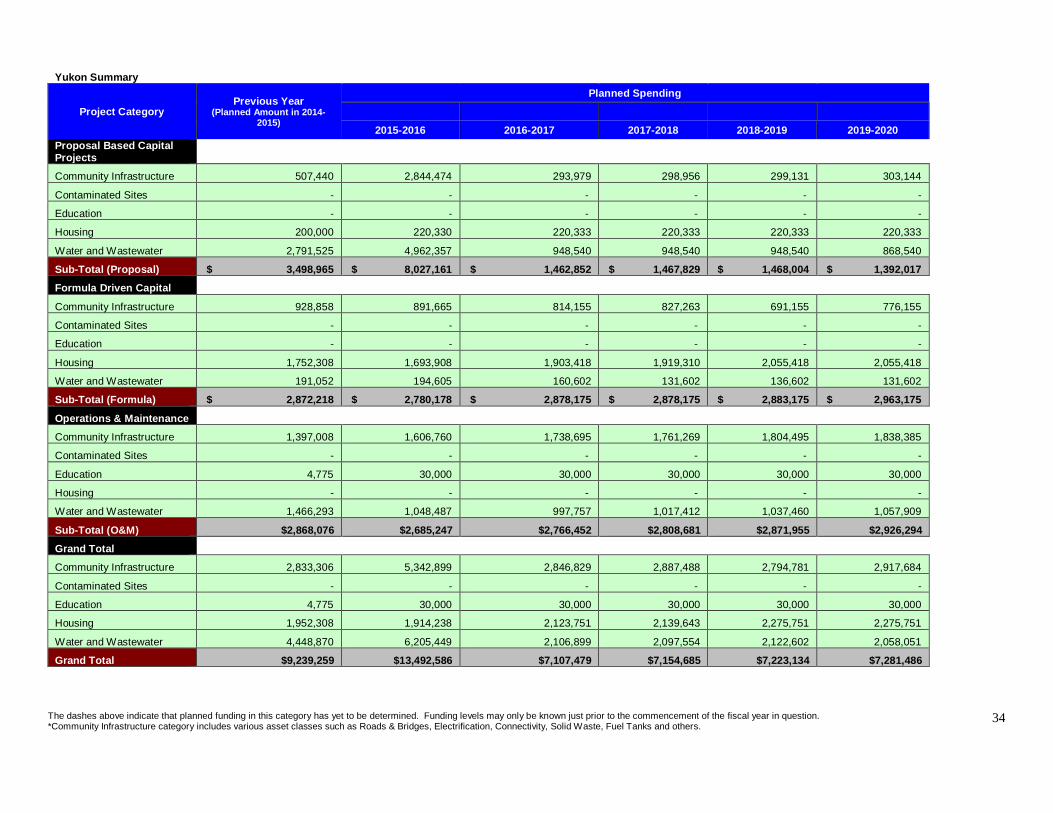
Yukon Summary
Project Category Previous Year
(Planned Amount in 2014-2015)
Planned Spending
2015-2016 2016-2017 2017-2018 2018-2019 2019-2020 Proposal Based Capital Projects
Community Infrastructure 507,440 2,844,474 293,979 298,956 299,131 303,144
Contaminated Sites - - - - - -
Education - - - - - -
Housing 200,000 220,330 220,333 220,333 220,333 220,333
Water and Wastewater 2,791,525 4,962,357 948,540 948,540 948,540 868,540
Sub-Total (Proposal) $ 3,498,965 $ 8,027,161 $ 1,462,852 $ 1,467,829 $ 1,468,004 $ 1,392,017
Formula Driven Capital
Community Infrastructure 928,858 891,665 814,155 827,263 691,155 776,155
Contaminated Sites - - - - - -
Education - - - - - -
Housing 1,752,308 1,693,908 1,903,418 1,919,310 2,055,418 2,055,418
Water and Wastewater 191,052 194,605 160,602 131,602 136,602 131,602
Sub-Total (Formula) $ 2,872,218 $ 2,780,178 $ 2,878,175 $ 2,878,175 $ 2,883,175 $ 2,963,175
Operations & Maintenance
Community Infrastructure 1,397,008 1,606,760 1,738,695 1,761,269 1,804,495 1,838,385
Contaminated Sites - - - - - -
Education 4,775 30,000 30,000 30,000 30,000 30,000
Housing - - - - - -
Water and Wastewater 1,466,293 1,048,487 997,757 1,017,412 1,037,460 1,057,909
Sub-Total (O&M) $2,868,076 $2,685,247 $2,766,452 $2,808,681 $2,871,955 $2,926,294
Grand Total
Community Infrastructure 2,833,306 5,342,899 2,846,829 2,887,488 2,794,781 2,917,684
Contaminated Sites - - - - - -
Education 4,775 30,000 30,000 30,000 30,000 30,000
Housing 1,952,308 1,914,238 2,123,751 2,139,643 2,275,751 2,275,751
Water and Wastewater 4,448,870 6,205,449 2,106,899 2,097,554 2,122,602 2,058,051
Grand Total $9,239,259 $13,492,586 $7,107,479 $7,154,685 $7,223,134 $7,281,486
35
APPENDIX B - NATIONAL PRIORITY RANKING FRAMEWORK
Background The Department has a consistent and transparent ranking system to address the most pressing needs in First Nation communities.
The department is committed to the following priorities, listed in order of importance, over the next five years:
1. Protecting and maintaining the life cycle of existing assets, with an emphasis on health and safety;
2. Mitigating health and safety risks through existing and new assets; 3. Addressing the backlog regarding water and sewage systems under
Capital and Facilities Maintenance activities; and 4. Investing in other priorities, including investments in sustainable
communities (e.g., housing, electrification, roads, educational facilities and community buildings) and investments in community assets to resolve claims or self-government agreements.
Development of the Priority Framework AANDC regional offices employ a ranking system as a normal course of business in developing capital plans, as demand historically exceeds available funding resources. The National Priority Framework was designed to align existing regional processes (at the highest level) with departmental priorities, to enable reporting and to demonstrate progress in a consistent manner.
Use of the Priority Matrix Regions are requested to:
1. Classify all major and minor capital projects to a “best fit” within the matrix areas using definitions in the Project Grid, and
2. Enter the priority code (i.e. A-2) in the companion reporting spreadsheets. In this way the Department rolls-up funding allocations to the national priorities by asset category. The objective is to demonstrate allocation to the highest priorities, however, pending direction from the allocation methodologies study it may be necessary to set funding levels or targets for the priority areas. The Department may also wish to roll-up unfunded projects in each priority area as a way to demonstrate where the needs reside and how they may shift over time.

36
Notes: 1) Priority ranking excludes emergency projects that may occur from time to time
2) Contaminated Sites refer to holdings south of 60. Refer to Northern Contaminated Sites Work plan for contaminated sites north of 60.
Reno- vation (F-1)
NCSCS Type 1 (E-1) (D-1) (C-1) (B-1) (A-1)
Protection of health and safety
and assets
New Const (F-2)
NCSCS Type 2 (E-2) (D-2) (C-2) (B-2) (A-2)
Health and safety
improvements
O & M (F-3)
NCSCS Type 3 (E-3) (D-3) (C-3) (B-3) (A-3)
Recap. / Major Maint.
New Const Grwth<2y (F-4) N/A (D-4) (C-4) (B-4) (A-4)
Growth / Need Less than 2 yrs
New Const Grwth>2y (F-5) N/A (D-5) (C-5) (B-5) (A-5)
Growth / Need After 2 yrs
HousingContam. Sites 2
Comm'ty Infra.
Education Facilities
Water / Sewer
Custodial Assets
Priority Three
Priority Four Two
Prog
ram
Act
iviti
es -
Cat
egor
ies
"A"
to "
D"
Funding Priority Legend
INAC Capital Asset Funding Categories
Figure 1: National Priority1 Funding Evaluation
Priority
Priority
Prog
ram
Act
iviti
es
and Measurement Matrix
One

37
Definitions Program Activity – Categories “A” to “D” PROTECTION OF HEALTH & SAFETY AND ASSETS North/South Custodial Assets (A): Maintenance projects required to protect the asset and would mitigate the identified high-risk health and safety issues. Water/Sewer (B), Education (C), Community Infrastructure (D): Assets require upgrading or replacement to meet appropriate standards. Maintenance projects to address significant risk to health and safety: 1) classified as Group 2 Projects resulting from Asset Condition Reporting System inspections; and/or 2) to address high and medium risks as identified in the AANDC May 2003 National Assessment of Water and Wastewater Systems in First Nations Communities. These projects are to be recorded and tracked for completion in the departmental Capital Asset Management System. HEALTH AND SAFETY IMPROVEMENTS North/South Custodial Assets (A), Water/Sewer (B), Education (C), Community Infrastructure (D): Upgrades of existing assets, new construction / acquisition projects to mitigate an identified significant risk to health and safety. RECAPITALIZATION / MAJOR MAINTENANCE North/South Custodial Assets (A), Water/Sewer (B), Education (C), Community Infrastructure (D): Projects required to extend the useful operating life of a facility or asset, or to maintain the original service level of the asset. GROWTH – NEED LESS THAN TWO YEARS North/South Custodial Assets (A), Water/Sewer (B), Education (C), Community Infrastructure (D): Anticipated community growth requires new construction / expansion / procurement of assets to maintain the level of service standards within a timeframe of less than two years. GROWTH – NEED AFTER TWO YEARS North/South Custodial Assets (A) Water/Sewer (B), Education (C), Community Infrastructure (D): Anticipated community growth requires new construction / expansion / procurement of assets to maintain the level of service standards within a timeframe of greater than two years.

38
Program Activity – Category “E” (Contaminated Sites) Note: Remediation/risk management includes monitoring National Contaminated Sites Classification System (NCSCS) Class 1 Assessment, remediation/risk management of all NCSCS Class 1 contaminated sites on a priority basis to avert risk to community health and safety and water sources in accordance with the departmental Contaminated Sites Management policy. NCSCS Class 2 Assessment, remediation/risk management of all NCSCS Class 2 contaminated sites on a priority basis to avert risk to community health and safety in accordance with the departmental Contaminated Sites Management policy.
NCSCS Class 3 Assessment, remediation/risk management of all NCSCS Class 3 contaminated sites on a cost efficiency basis. Program Activity – Category “F” (Housing) Renovation Projects required to correct what could be an unsafe condition to the occupants or projects beyond routine maintenance to extend the useful lifespan of the house New Construction Construction of dwelling units to address the community’s housing need. Operation and Maintenance: Routine maintenance and activities to preserve the housing portfolio.
AANDC Capital Asset Funding Categories Custodial Assets: Administration buildings, vehicles, machinery and equipment required to deliver programs to First Nations, Inuit, and Northern communities. Water / Sewer: Assets that comprise the distribution / collection system and assets required in the treatment and disposal process including major equipment, vehicles, machinery and buildings. Education Facilities: Schools, staff residences (teacherages), student residences, temporary facilities associated with delivering the educational program in the community.

39
Community Infrastructure: Assets and systems not already specified above – including operative, administrative, utility and recreational buildings; solid waste vehicles, dumps and transfer stations; community roads and bridges; electrical power supply and distribution; fire-fighting vehicles and supporting buildings; and fuel tanks and distribution systems. Contaminated Sites: Sites requiring assessment, remediation / risk management to protect the health and safety as well as the environment of communities. Housing: Funding to assist in community housing services i.e., the construction, maintenance and management of the community housing portfolio.

40
Project Grid Note: The following is not an exhaustive list of project activities, but are examples provided to assist in categorizing potential projects.
Custodial Assets (A-1) Major Maintenance of assets to avoid immediate risk to health and safety of staff or public
Major Maintenance of assets to avoid immediate risk of contamination of environment
(A-2) Action required to meet health and safety legislative requirements (Canadian Environmental
Protection Act, Canadian Labour Code) Imminent risk to health and safety of staff or public
Imminent risk of contamination of environment (A-3) Major repair to improve / protect integrity of asset or replacement of asset Significantly improve asset integrity / utility through repair or replacement Improve condition / operating cost of asset through repair or replacement (A-4) (A-5) Maintain program operations which could be seriously hindered due to serious asset defects
or unserviceable assets
Maintain operational efficiency of program operations
Enhance operations to meet future demands
Water and Wastewater Assets (B-1) Repairs/upgrades/replacements to deal with imminent health and safety risks arising from
the community systems as identified in Asset Condition Ranking System inspections and others means (e.g. the National Assessment noted above), including legislative / regulatory requirements and potential violations (i.e. Fisheries Act). Water source protection is included.
Water unsatisfactory with respect to microbiological or physical/chemical quality based on health considerations noted in “Guidelines for Canadian Drinking Water Quality”.
Wastewater systems posing potential medium to high risks that could negatively impact wastewater effluent quality, including legislative / regulatory requirements and potential violations (i.e. Fishery Act).

41
(B-2) Water system does not provide fire protection capacity (flow & pressure) and there is
multiple life loss risk and/or high property value risks Water quantity is insufficient to meet residential demand (B-3) Reconstruction / Major repairs required to restore asset (B-4) Water / sewage systems (residential sub-division development including supporting
infrastructure)
Water quality is unsatisfactory based on “aesthetic objectives” as defined in “Guidelines for Canadian Drinking Water Quality”
(B-5) Improvements to groundwater system are required to provide a back-up supply for existing
houses
Improvements to existing system are recommended but not mandatory
Growth needed for water / sewer systems greater than two years Educational Facilities (C-1) Renovations or improvements to existing facilities are needed to deal with serious
operational problems with immediate health and safety risks (i.e. identified in Asset Condition Ranking System inspections)
Health and safety code violations (C-2) Severe overcrowding requires an expansion to facility
(C-3) Reconstruction / replacement of On-Reserve facilities.
Minor code conformance (infractions)
(C-4) (C-5) New facilities on-reserve

42
Community Infrastructure (D-1) Fuel Tank Systems Improvements to existing system to meet legislative/regulatory compliance. Fire safety systems Imminent health and safety risks as identified in Asset Condition Ranking System
inspections. Provision of file protection capabilities critical to safety of the community, either through the
use of purchased fire protection services or by acquiring apparatus and fire protection equipment.
Solid waste Improvements to existing system are needed to deal with serious operational problems,
safety problems and/or system reliability Solid waste facility presents an imminent threat to public health or safety, or to the
environment Electrification Required to assure integrity of water supply and/or sewage collection and treatment Transportation Bridge/high boardwalk where it is the sole access to reserve - imminent failure if not
repaired/replaced Serious community access hazards which impair accessibility of community for emergencies (D-2) Fire Safety Systems Improvements to equipment needed to deal with serious operational problems, safety
problems and/or system reliability Solid waste Solid waste facility presents a significant threat to public health or safety, or to the
environment Electrification Unsafe facilities causing a threat to the public Transportation Road-hazardous geometric problems Bridge/high boardwalk - structural problems Bridge/high boardwalk - capacity [size] problems (D-3) Fire safety systems Reconstruction/replacement Major repairs to assets/equipment

43
Solid waste Reconstruction/replacement Major repairs to assets/equipment Electrification Reconstruction/replacement Major repairs to assets/equipment Transportation Bridge/high boardwalk - reconstruction - reached end of service life Road reconstruction - serious structural problems Major road repairs to restore asset - significant structure problems (D-4) (D-5) Administrative Buildings Renovations or improvements to existing facilities / assets are needed to deal with serious
operational problems. Fire safety systems Improvements to existing system are recommended but not mandatory Solid waste Improvements to existing system are recommended but not mandatory Electrification Improvements to existing system are recommended but not mandatory Transportation Improvements to existing system are recommended but not mandatory
Contaminated Sites (E-1) National Contaminated Sites Classification System Class 1
Sites with an NCSCS score equal or greater than 70 (i.e.: NCSCS Class 1) where remediation/ risk-management is currently underway and further remediation/risk management is required.
Sites identified where a Phase I or Phase II environmental site assessments (ESA) is required or where existing sites (Class I – Insufficient evidence) require a follow up to confirm site classification.
Sites with an NCSCS score equal or greater than 70 (i.e.: NCSCS Class 1) where the Phase II ESA has been completed and remediation/risk management is required but has yet to be initiated.
(E-2) National Contaminated Sites Classification System Class 2
Sites with an NCSCS score equal to 50 but less than 70 (i.e.: NCSCS Class 2 sites) where remediation/risk-management is currently underway and further remediation/risk management is required.
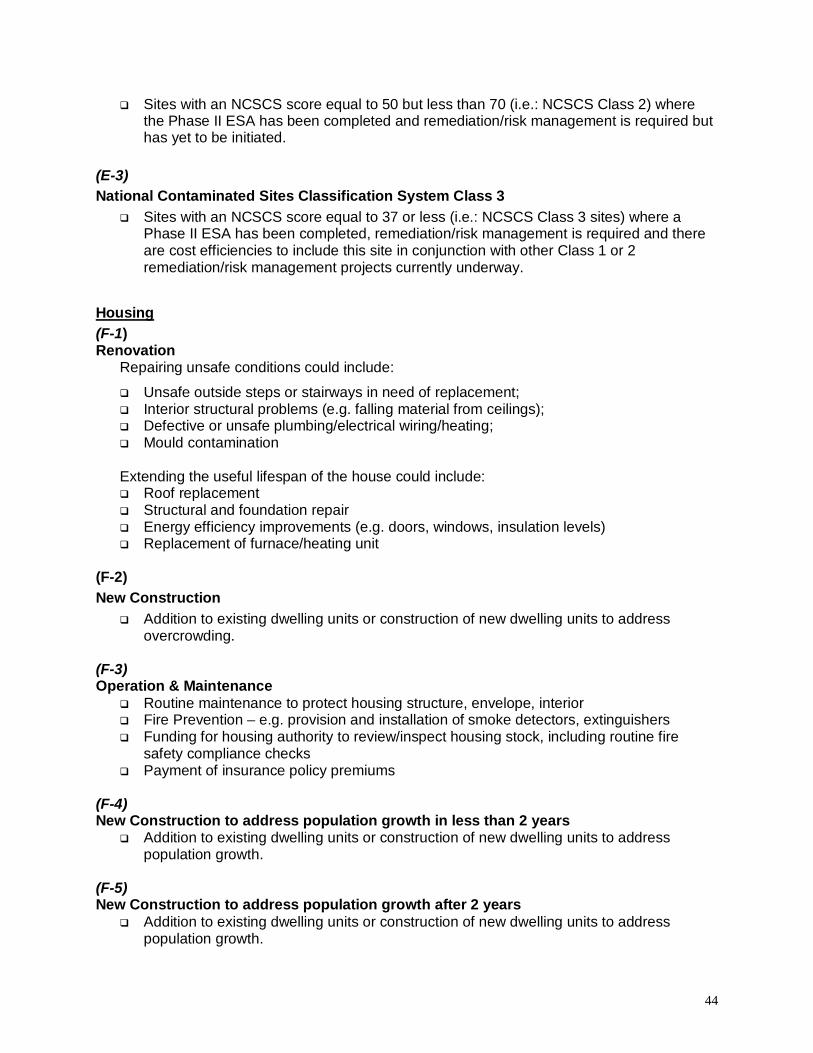
44
Sites with an NCSCS score equal to 50 but less than 70 (i.e.: NCSCS Class 2) where the Phase II ESA has been completed and remediation/risk management is required but has yet to be initiated.
(E-3) National Contaminated Sites Classification System Class 3
Sites with an NCSCS score equal to 37 or less (i.e.: NCSCS Class 3 sites) where a Phase II ESA has been completed, remediation/risk management is required and there are cost efficiencies to include this site in conjunction with other Class 1 or 2 remediation/risk management projects currently underway.
Housing (F-1) Renovation
Repairing unsafe conditions could include:
Unsafe outside steps or stairways in need of replacement; Interior structural problems (e.g. falling material from ceilings); Defective or unsafe plumbing/electrical wiring/heating; Mould contamination Extending the useful lifespan of the house could include: Roof replacement Structural and foundation repair Energy efficiency improvements (e.g. doors, windows, insulation levels) Replacement of furnace/heating unit
(F-2) New Construction
Addition to existing dwelling units or construction of new dwelling units to address overcrowding.
(F-3) Operation & Maintenance
Routine maintenance to protect housing structure, envelope, interior Fire Prevention – e.g. provision and installation of smoke detectors, extinguishers Funding for housing authority to review/inspect housing stock, including routine fire
safety compliance checks Payment of insurance policy premiums
(F-4) New Construction to address population growth in less than 2 years
Addition to existing dwelling units or construction of new dwelling units to address population growth.
(F-5) New Construction to address population growth after 2 years
Addition to existing dwelling units or construction of new dwelling units to address population growth.
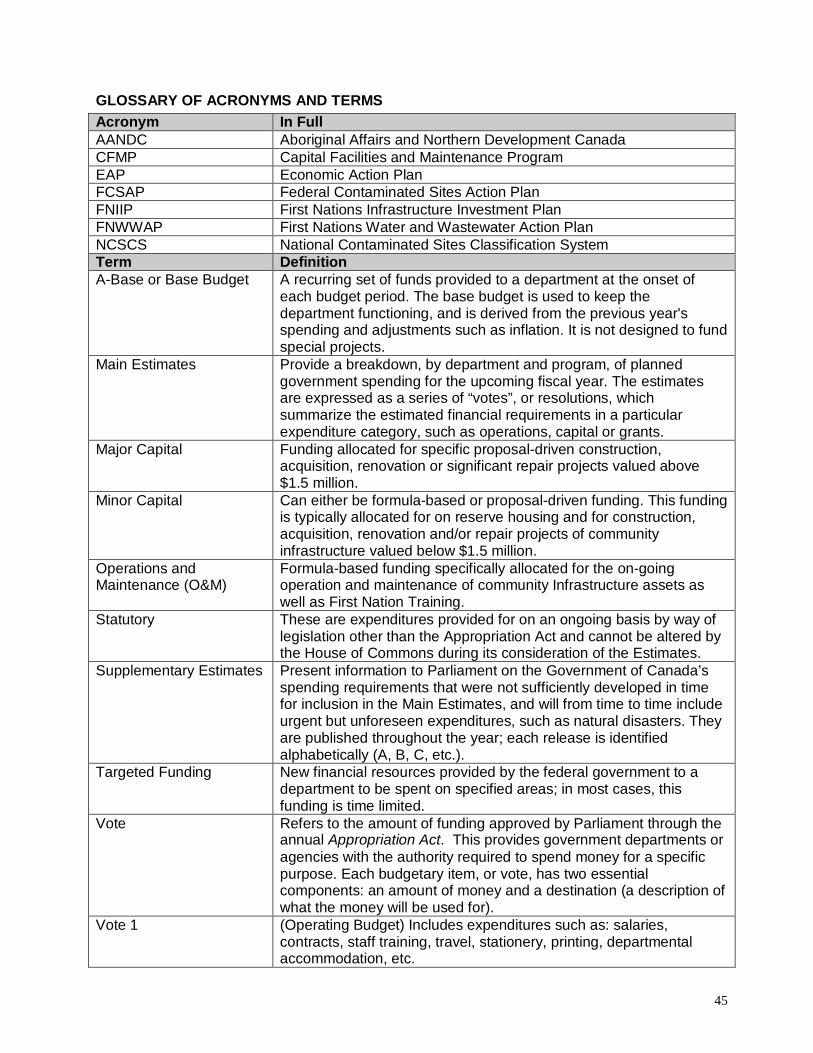
45
GLOSSARY OF ACRONYMS AND TERMS Acronym In Full AANDC Aboriginal Affairs and Northern Development Canada CFMP Capital Facilities and Maintenance Program EAP Economic Action Plan FCSAP Federal Contaminated Sites Action Plan FNIIP First Nations Infrastructure Investment Plan FNWWAP First Nations Water and Wastewater Action Plan NCSCS National Contaminated Sites Classification System Term Definition A-Base or Base Budget A recurring set of funds provided to a department at the onset of
each budget period. The base budget is used to keep the department functioning, and is derived from the previous year's spending and adjustments such as inflation. It is not designed to fund special projects.
Main Estimates Provide a breakdown, by department and program, of planned government spending for the upcoming fiscal year. The estimates are expressed as a series of “votes”, or resolutions, which summarize the estimated financial requirements in a particular expenditure category, such as operations, capital or grants.
Major Capital Funding allocated for specific proposal-driven construction, acquisition, renovation or significant repair projects valued above $1.5 million.
Minor Capital Can either be formula-based or proposal-driven funding. This funding is typically allocated for on reserve housing and for construction, acquisition, renovation and/or repair projects of community infrastructure valued below $1.5 million.
Operations and Maintenance (O&M)
Formula-based funding specifically allocated for the on-going operation and maintenance of community Infrastructure assets as well as First Nation Training.
Statutory These are expenditures provided for on an ongoing basis by way of legislation other than the Appropriation Act and cannot be altered by the House of Commons during its consideration of the Estimates.
Supplementary Estimates Present information to Parliament on the Government of Canada’s spending requirements that were not sufficiently developed in time for inclusion in the Main Estimates, and will from time to time include urgent but unforeseen expenditures, such as natural disasters. They are published throughout the year; each release is identified alphabetically (A, B, C, etc.).
Targeted Funding New financial resources provided by the federal government to a department to be spent on specified areas; in most cases, this funding is time limited.
Vote Refers to the amount of funding approved by Parliament through the annual Appropriation Act. This provides government departments or agencies with the authority required to spend money for a specific purpose. Each budgetary item, or vote, has two essential components: an amount of money and a destination (a description of what the money will be used for).
Vote 1 (Operating Budget) Includes expenditures such as: salaries, contracts, staff training, travel, stationery, printing, departmental accommodation, etc.

46
Vote 10 (Grants and Contributions) also called Transfer Payments, the means by which AANDC funds the operations of First Nations and other recipients.