Embed Size (px)
Citation preview

GEO-HEAT CENTER QUARTERLY BULLETIN
VOL. 31 NO. 2 AUGUST 2012
ISSN 0276-1084
NATIONAL GEOTHERMAL ACADEMY
OREGON INSTITUTE OF TECHNOLOGY • KLAMATH FALLS, OREGON 97601-8801 • (541) 885-1750
CONTENTS
National Geothermal Academy 2012.................. 1 Phillip Maddi
Potential Development Zones for Geothermal .... 5 Direct Uses in Mexico with a Specific Site RecommendationManuel Arruberrena and Leslie Pelayo
Development Overview of Geothermal .............. 9 Resources in the Kilauea East Rift ZoneRob Kinslow, Bridget Hass, Piyush Bakane and Phillip Maddi
Geothermal Energy Prospecting for the ............ 23 Caribbean Islands of Nevis and MontserratRandy R. Koon Koon
Geothermal Development Roadmap ................ 28 for the Kingdom of Saudi ArabiaBasheer Hashem
Envisioning a Model for Innovative EGS .......... 31 Development in the San Francisco Bay areaRachel Silverman
ReactWell - Underground Geothermal ............ 35 Biomass-to-Oil and Bioproduct Production PlatformBrandon Iglesias
VOL. 31 NO. 2 AUGUST 2012
GEO-HEAT CENTER QUARTERLY BULLETINISSN 0276-1084
A Quarterly Progress and Development Report on the Direct Utilization of Geothermal Resources
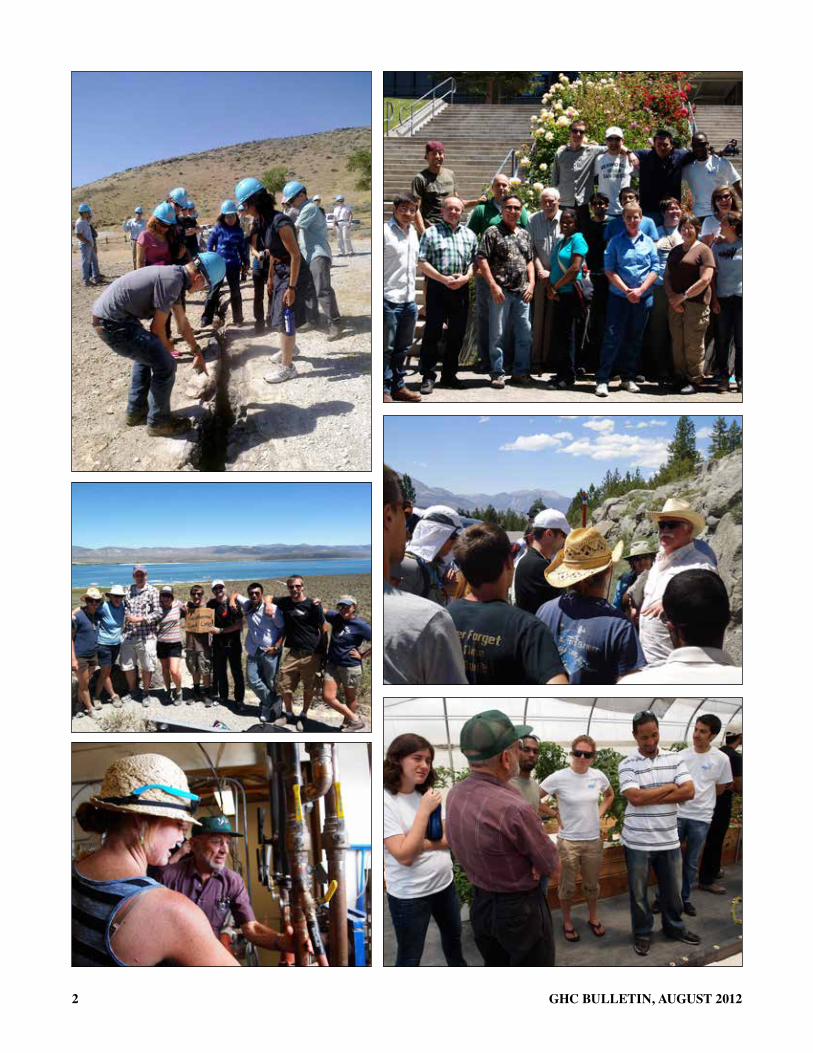
Cover: Participants in the National Geothermal Academy
PUBLISHED BYGEO-HEAT CENTER Oregon Institute of Technology3201 Campus DriveKlamath Falls, OR 97601Phone: (541) 885-1750E-mail: [email protected]
All articles for the Bulletin are solicited. If you wish to contribute a paper, please contact the editor at the above address.
EDITORTonya “Toni” Boyd Phillip Maddi, Guest Editor Cover Design – SmithBates Printing & Design
WEBSITE: http://geoheat.oit.edu
ACKNOWLEDGEMENTThis material is based upon work supported by the Department of Energy (National Nuclear Security Administration) under Award Number DE-EE0002741.
DISCLAIMERThis Bulletin was prepared as an account of work sponsored by an agency of the United States government. Neither the United States Government nor any agency thereof, nor any of their employees, makes any warranty, express or implied or assumes any legal liability or responsibility for the accuracy, completeness, or usefulness of any information, apparatus, product or process disclosed, or represents that its use would not infringe privately owned rights. Reference herein any specific commercial product, process, or service by trade name, trademark, manufacturer, or otherwise does not necessarily constitute or imply endorsement recommendation, or favoring by the United States Government or any agency thereof.
SUBSCRIPTIONSThe Bulletin is mailed free of charge. Please send your name and address to the Geo-Heat Center for addition to the mailing list.
If you wish to change your Bulletin subscription, please complete the form below and return it to the Geo-Heat Center.
Name _____________________________________________
Address ____________________________________________
City, State, Zip ______________________________________
Country ____________________________________________
1GHC BULLETIN, AUGUST 2012
NatioNal Geothermal academy 2012Phillip Maddi, Geo-Heat Center, Oregon institute of Technology, Klamath Falls, Oregon
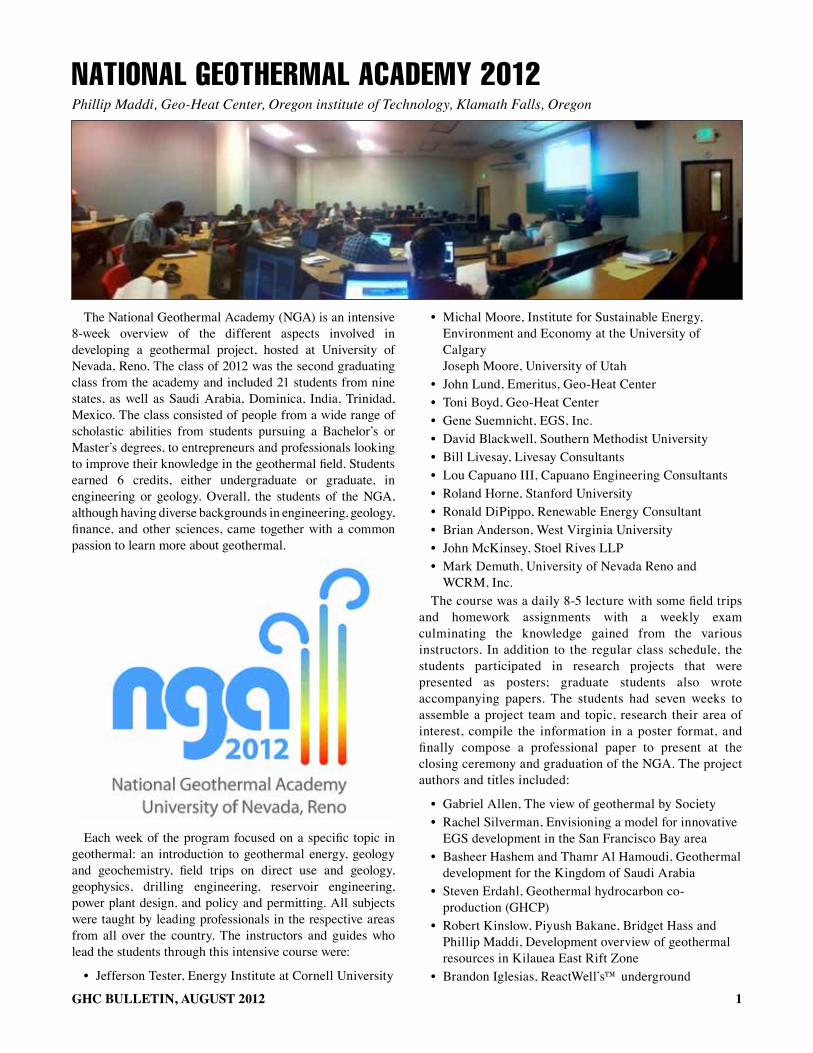
The National Geothermal Academy (NGA) is an intensive 8-week overview of the different aspects involved in developing a geothermal project, hosted at University of Nevada, Reno. The class of 2012 was the second graduating class from the academy and included 21 students from nine states, as well as Saudi Arabia, Dominica, India, Trinidad, Mexico. The class consisted of people from a wide range of scholastic abilities from students pursuing a Bachelor’s or Master’s degrees, to entrepreneurs and professionals looking to improve their knowledge in the geothermal field. Students earned 6 credits, either undergraduate or graduate, in engineering or geology. Overall, the students of the NGA, although having diverse backgrounds in engineering, geology, finance, and other sciences, came together with a common passion to learn more about geothermal.
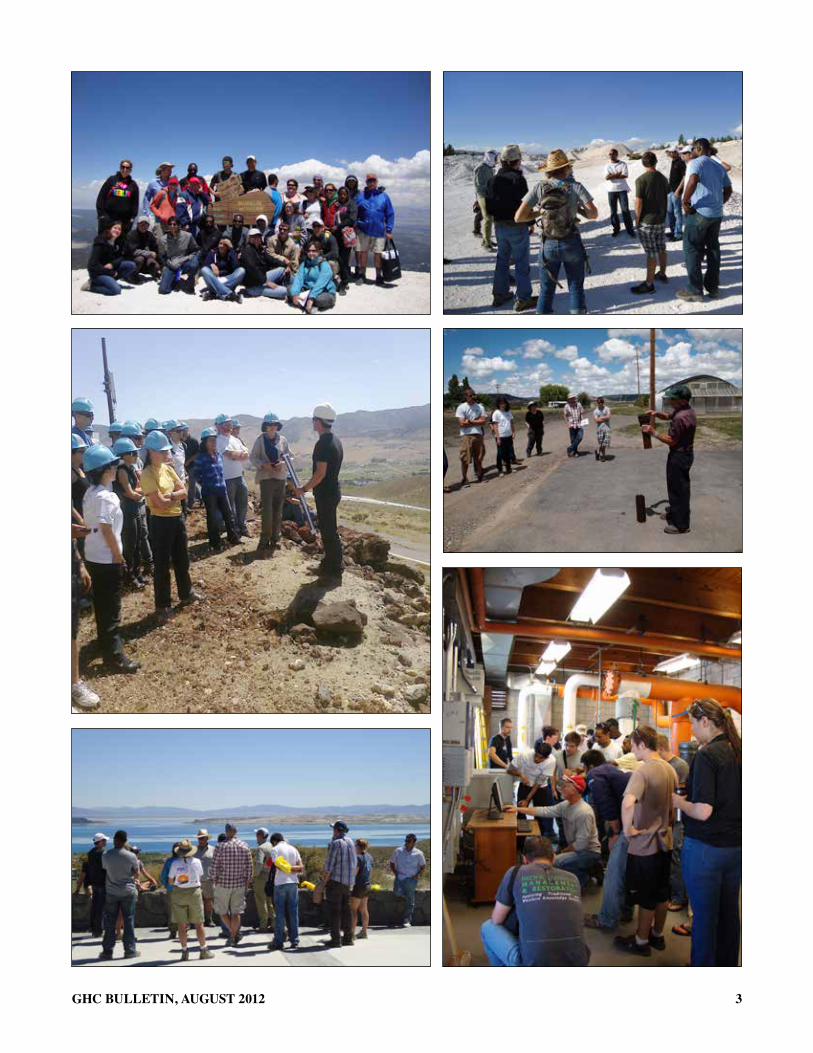
Each week of the program focused on a specific topic in geothermal: an introduction to geothermal energy, geology and geochemistry, field trips on direct use and geology, geophysics, drilling engineering, reservoir engineering, power plant design, and policy and permitting. All subjects were taught by leading professionals in the respective areas from all over the country. The instructors and guides who lead the students through this intensive course were:
• Jefferson Tester, Energy Institute at Cornell University
• Michal Moore, Institute for Sustainable Energy, Environment and Economy at the University of Calgary Joseph Moore, University of Utah
• John Lund, Emeritus, Geo-Heat Center• Toni Boyd, Geo-Heat Center• Gene Suemnicht, EGS, Inc.• David Blackwell, Southern Methodist University• Bill Livesay, Livesay Consultants• Lou Capuano III, Capuano Engineering Consultants• Roland Horne, Stanford University• Ronald DiPippo, Renewable Energy Consultant• Brian Anderson, West Virginia University• John McKinsey, Stoel Rives LLP• Mark Demuth, University of Nevada Reno and
WCRM, Inc.The course was a daily 8-5 lecture with some field trips
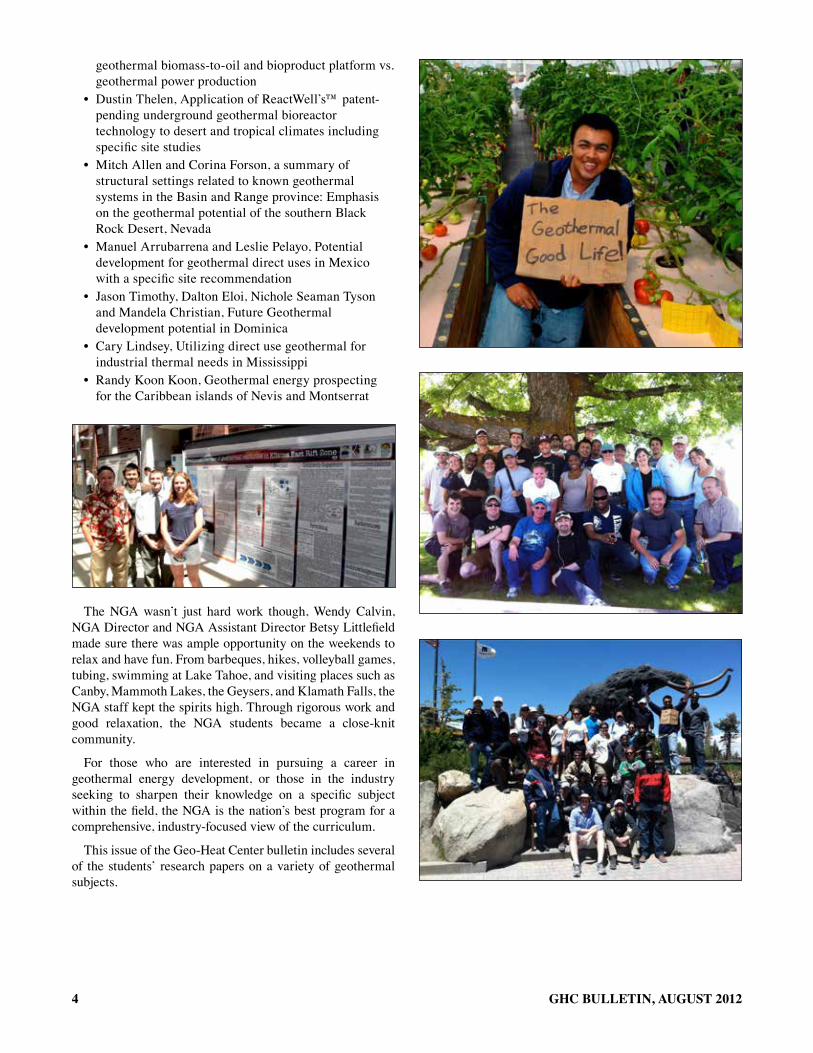
and homework assignments with a weekly exam culminating the knowledge gained from the various instructors. In addition to the regular class schedule, the students participated in research projects that were presented as posters; graduate students also wrote accompanying papers. The students had seven weeks to assemble a project team and topic, research their area of interest, compile the information in a poster format, and finally compose a professional paper to present at the closing ceremony and graduation of the NGA. The project authors and titles included:
• Gabriel Allen, The view of geothermal by Society• Rachel Silverman, Envisioning a model for innovative
EGS development in the San Francisco Bay area• Basheer Hashem and Thamr Al Hamoudi, Geothermal
development for the Kingdom of Saudi Arabia• Steven Erdahl, Geothermal hydrocarbon co-
production (GHCP)• Robert Kinslow, Piyush Bakane, Bridget Hass and
Phillip Maddi, Development overview of geothermal resources in Kilauea East Rift Zone
• Brandon Iglesias, ReactWell’s™ underground
2 GHC BULLETIN, AUGUST 2012
3GHC BULLETIN, AUGUST 2012
4 GHC BULLETIN, AUGUST 2012
geothermal biomass-to-oil and bioproduct platform vs. geothermal power production
• Dustin Thelen, Application of ReactWell’s™ patent-pending underground geothermal bioreactor technology to desert and tropical climates including specific site studies
• Mitch Allen and Corina Forson, a summary of structural settings related to known geothermal systems in the Basin and Range province: Emphasis on the geothermal potential of the southern Black Rock Desert, Nevada
• Manuel Arrubarrena and Leslie Pelayo, Potential development for geothermal direct uses in Mexico with a specific site recommendation
• Jason Timothy, Dalton Eloi, Nichole Seaman Tyson and Mandela Christian, Future Geothermal development potential in Dominica
• Cary Lindsey, Utilizing direct use geothermal for industrial thermal needs in Mississippi
• Randy Koon Koon, Geothermal energy prospecting for the Caribbean islands of Nevis and Montserrat
The NGA wasn’t just hard work though, Wendy Calvin, NGA Director and NGA Assistant Director Betsy Littlefield made sure there was ample opportunity on the weekends to relax and have fun. From barbeques, hikes, volleyball games, tubing, swimming at Lake Tahoe, and visiting places such as Canby, Mammoth Lakes, the Geysers, and Klamath Falls, the NGA staff kept the spirits high. Through rigorous work and good relaxation, the NGA students became a close-knit community.
For those who are interested in pursuing a career in geothermal energy development, or those in the industry seeking to sharpen their knowledge on a specific subject within the field, the NGA is the nation’s best program for a comprehensive, industry-focused view of the curriculum.
This issue of the Geo-Heat Center bulletin includes several of the students’ research papers on a variety of geothermal subjects.
5GHC BULLETIN, AUGUST 2012
PoteNtial develoPmeNt zoNes for Geothermal direct uses iN mexico with a sPecific site recommeNdatioNManuel Arrubarrena, EnergНas Alternas, Estudios y Proyectos, México Leslie Pelayo, EnergНas Alternas, Estudios y Proyectos, Mexico
AbstrActFor many years, the direct use of geothermal resources in
Mexico has been underestimated; although there are few places exploiting it, it is only used for recreational purposes such as baths or spas. Over the past 30 years, the electricity supplier in Mexico (Comisión Federal de Electricidad, CFE) has explored, drilled and developed geothermal projects all over the country, having only the aim of large scale electricity generation. Sometimes, wells in zones with appropriate conditions for a direct use benefit, are abandoned. Most of these wells and studies are located in areas where the economic development is poor and the implementation of direct use geothermal projects such as greenhouses, fish farms, drying processes, heating processes, evaporation and distillation processes, washing, desalination and chemical extraction, may improve this situation with the increase of jobs and opportunities to these communities. The objective of this study is to make an overview of the potential zones in Mexico suitable for the development of geothermal direct uses, and to choose a specific location to apply it.
IntroductIonGeothermal direct uses
A geothermal direct use project uses a natural resource, a flow of geothermal fluid at elevated temperatures (15-150°C), which is capable of providing heat and cooling to buildings, and many other infrastructures or processes. The geothermal potential can be used in cascade arrangements, where applications with the highest temperatures will be installed first (i.e. process heat applications or district heating), while applications with the lowest temperature (such as fish farming) follows at the end of such cascade.
direct use ApplicationsThe different direct use applications are:
1. Bathing and balneology (hot spring, medical and spa bathing)
2. Agriculture (greenhouses, soil sterilization, drying processes, warming processes).
3. Farming (fish, prawn, breeding, mushroom cultivation farms)
4. Industrial use (product drying or warming, linen and clothes bleaching, steam application processes, metallurgic smelter processes like aluminum and zinc industries).
5. Residential – and district heating or cooling (including hotels, schools, hospitals, factories, office buildings).
6. Shallow geothermal use applications (residential heating, heat pumps, etc.)
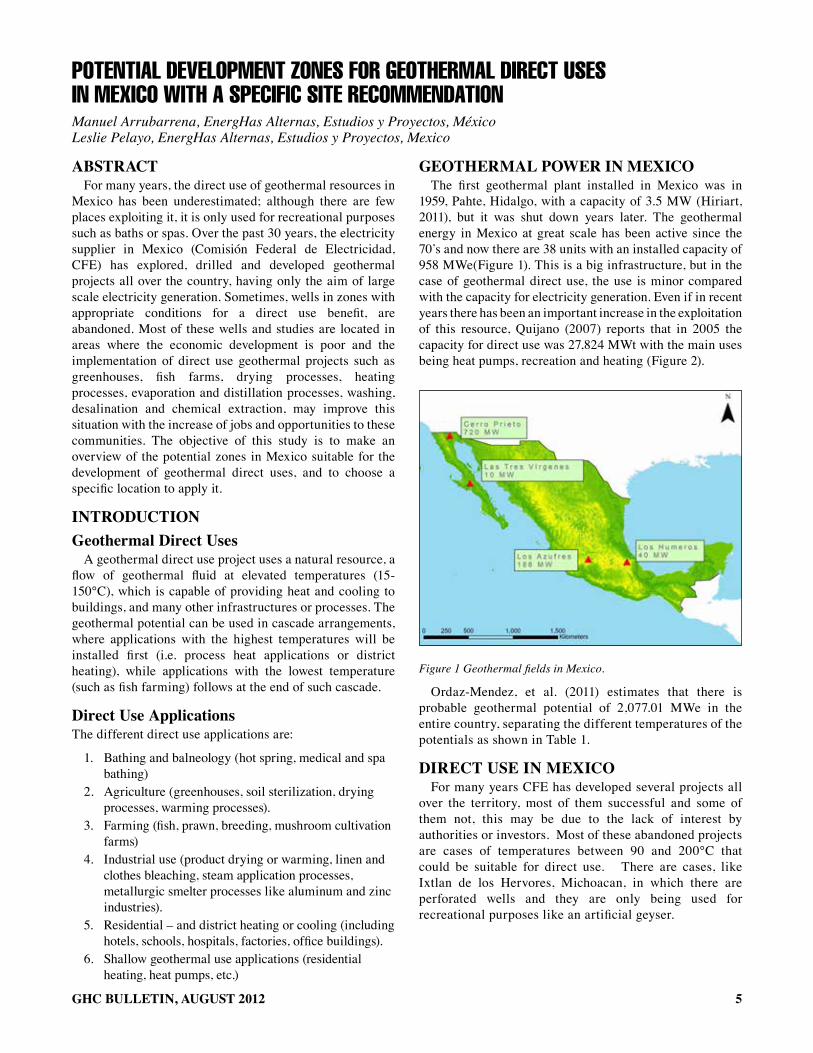
GeothermAl power In mexIcoThe first geothermal plant installed in Mexico was in
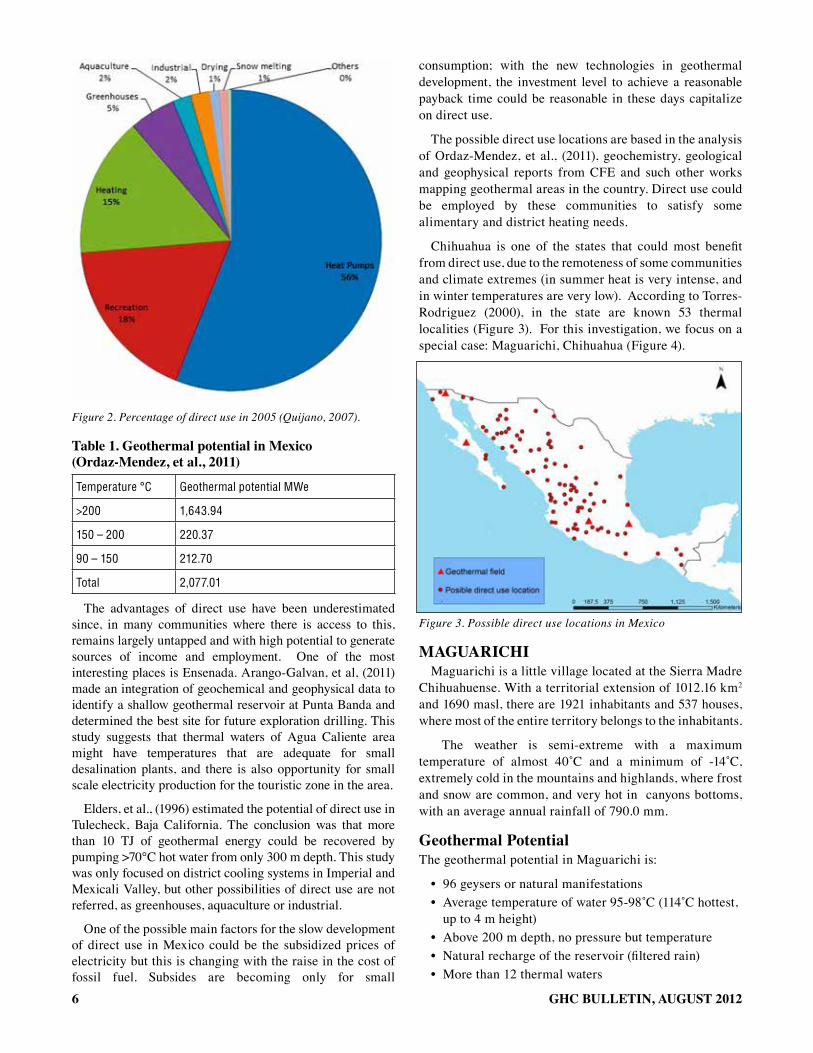
1959, Pahte, Hidalgo, with a capacity of 3.5 MW (Hiriart, 2011), but it was shut down years later. The geothermal energy in Mexico at great scale has been active since the 70’s and now there are 38 units with an installed capacity of 958 MWe(Figure 1). This is a big infrastructure, but in the case of geothermal direct use, the use is minor compared with the capacity for electricity generation. Even if in recent years there has been an important increase in the exploitation of this resource, Quijano (2007) reports that in 2005 the capacity for direct use was 27,824 MWt with the main uses being heat pumps, recreation and heating (Figure 2).
Figure 1 Geothermal fields in Mexico.
Ordaz-Mendez, et al. (2011) estimates that there is probable geothermal potential of 2,077.01 MWe in the entire country, separating the different temperatures of the potentials as shown in Table 1.
dIrect use In mexIcoFor many years CFE has developed several projects all
over the territory, most of them successful and some of them not, this may be due to the lack of interest by authorities or investors. Most of these abandoned projects are cases of temperatures between 90 and 200°C that could be suitable for direct use. There are cases, like Ixtlan de los Hervores, Michoacan, in which there are perforated wells and they are only being used for recreational purposes like an artificial geyser.
6 GHC BULLETIN, AUGUST 2012
Figure 2. Percentage of direct use in 2005 (Quijano, 2007).
table 1. Geothermal potential in mexico (ordaz-mendez, et al., 2011)
Temperature °C Geothermal potential MWe
>200 1,643.94
150 – 200 220.37
90 – 150 212.70
Total 2,077.01
The advantages of direct use have been underestimated since, in many communities where there is access to this, remains largely untapped and with high potential to generate sources of income and employment. One of the most interesting places is Ensenada. Arango-Galvan, et al, (2011) made an integration of geochemical and geophysical data to identify a shallow geothermal reservoir at Punta Banda and determined the best site for future exploration drilling. This study suggests that thermal waters of Agua Caliente area might have temperatures that are adequate for small desalination plants, and there is also opportunity for small scale electricity production for the touristic zone in the area.
Elders, et al., (1996) estimated the potential of direct use in Tulecheck, Baja California. The conclusion was that more than 10 TJ of geothermal energy could be recovered by pumping >70°C hot water from only 300 m depth. This study was only focused on district cooling systems in Imperial and Mexicali Valley, but other possibilities of direct use are not referred, as greenhouses, aquaculture or industrial.
One of the possible main factors for the slow development of direct use in Mexico could be the subsidized prices of electricity but this is changing with the raise in the cost of fossil fuel. Subsides are becoming only for small
consumption; with the new technologies in geothermal development, the investment level to achieve a reasonable payback time could be reasonable in these days capitalize on direct use.
The possible direct use locations are based in the analysis of Ordaz-Mendez, et al., (2011), geochemistry, geological and geophysical reports from CFE and such other works mapping geothermal areas in the country. Direct use could be employed by these communities to satisfy some alimentary and district heating needs.
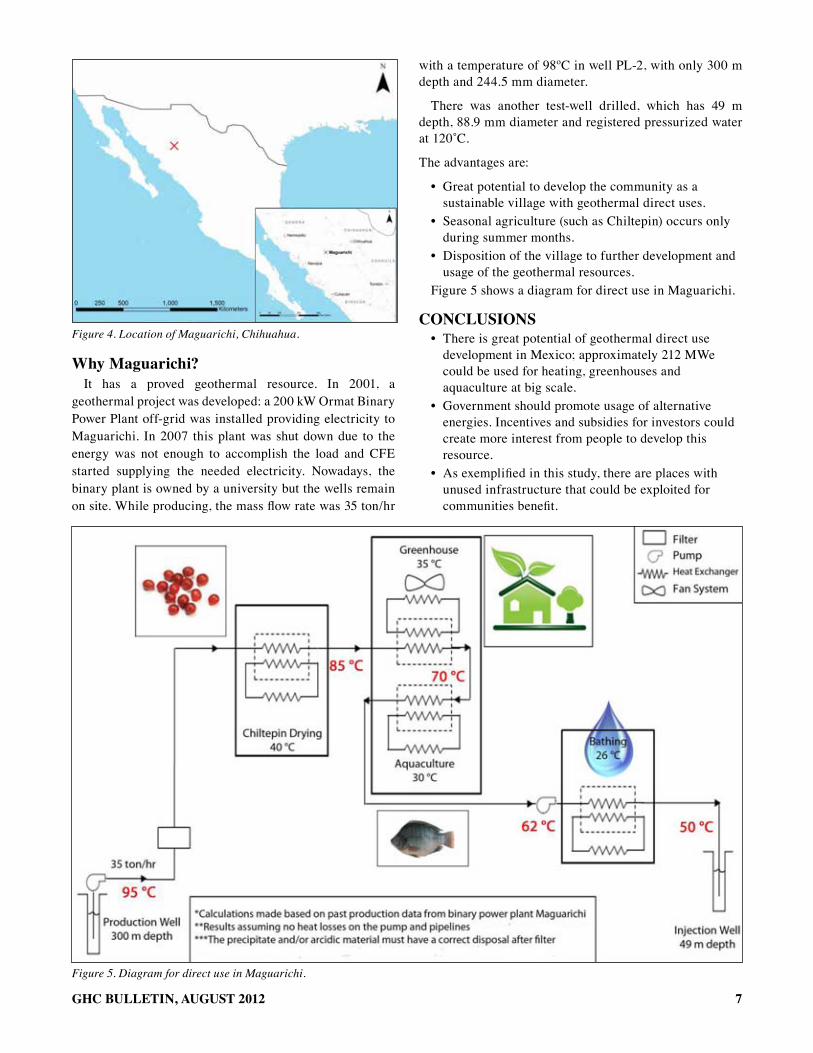
Chihuahua is one of the states that could most benefit from direct use, due to the remoteness of some communities and climate extremes (in summer heat is very intense, and in winter temperatures are very low). According to Torres-Rodriguez (2000), in the state are known 53 thermal localities (Figure 3). For this investigation, we focus on a special case: Maguarichi, Chihuahua (Figure 4).
Figure 3. Possible direct use locations in Mexico
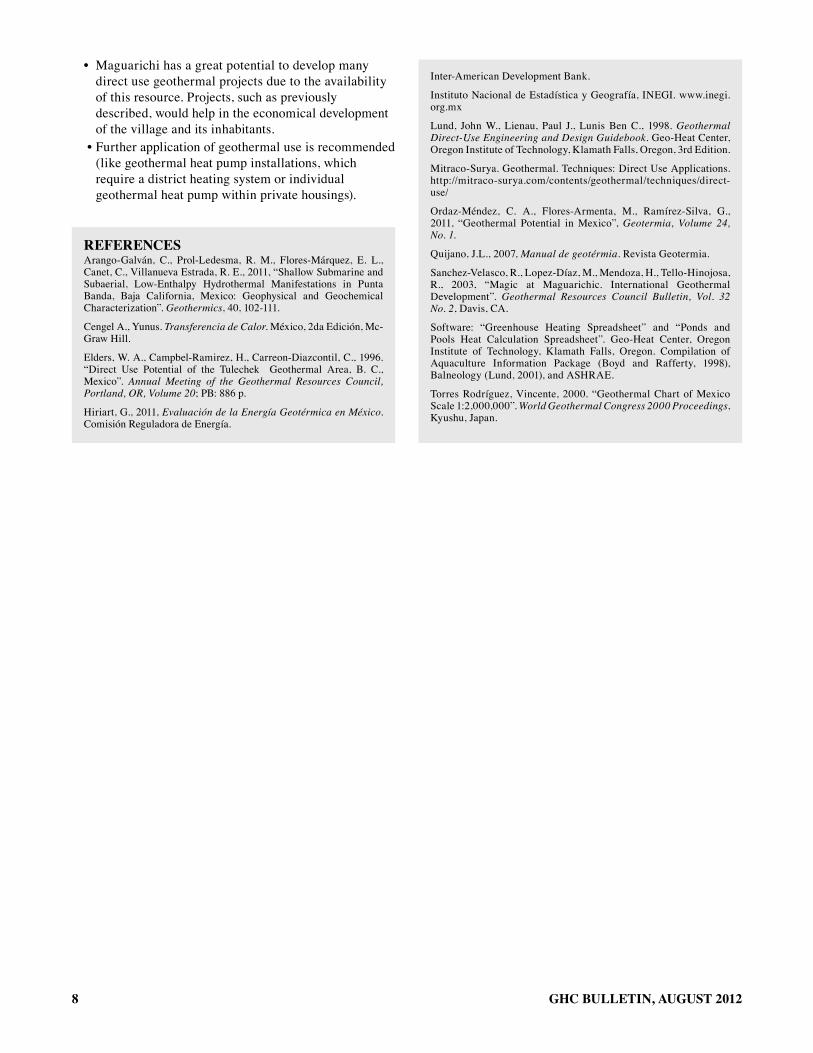
mAGuArIchIMaguarichi is a little village located at the Sierra Madre
Chihuahuense. With a territorial extension of 1012.16 km2
and 1690 masl, there are 1921 inhabitants and 537 houses, where most of the entire territory belongs to the inhabitants.
The weather is semi-extreme with a maximum temperature of almost 40˚C and a minimum of -14˚C, extremely cold in the mountains and highlands, where frost and snow are common, and very hot in canyons bottoms, with an average annual rainfall of 790.0 mm.
Geothermal potentialThe geothermal potential in Maguarichi is:
• 96 geysers or natural manifestations• Average temperature of water 95-98˚C (114˚C hottest,
up to 4 m height)• Above 200 m depth, no pressure but temperature• Natural recharge of the reservoir (filtered rain)• More than 12 thermal waters
7GHC BULLETIN, AUGUST 2012
Figure 4. Location of Maguarichi, Chihuahua.
why maguarichi?It has a proved geothermal resource. In 2001, a
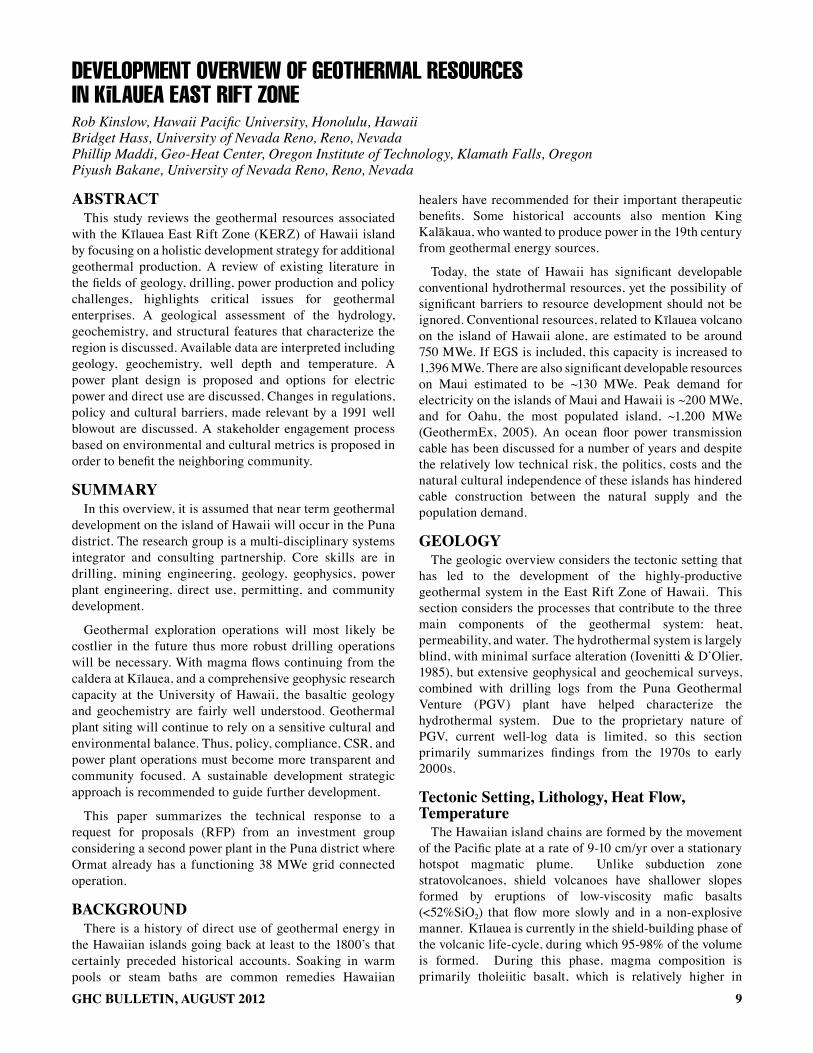
geothermal project was developed: a 200 kW Ormat Binary Power Plant off-grid was installed providing electricity to Maguarichi. In 2007 this plant was shut down due to the energy was not enough to accomplish the load and CFE started supplying the needed electricity. Nowadays, the binary plant is owned by a university but the wells remain on site. While producing, the mass flow rate was 35 ton/hr
with a temperature of 98ºC in well PL-2, with only 300 m depth and 244.5 mm diameter.
There was another test-well drilled, which has 49 m depth, 88.9 mm diameter and registered pressurized water at 120˚C.
The advantages are:
• Great potential to develop the community as a sustainable village with geothermal direct uses.
• Seasonal agriculture (such as Chiltepin) occurs only during summer months.
• Disposition of the village to further development and usage of the geothermal resources.
Figure 5 shows a diagram for direct use in Maguarichi.
conclusIons• There is great potential of geothermal direct use
development in Mexico; approximately 212 MWe could be used for heating, greenhouses and aquaculture at big scale.
• Government should promote usage of alternative energies. Incentives and subsidies for investors could create more interest from people to develop this resource.
• As exemplified in this study, there are places with unused infrastructure that could be exploited for communities benefit.
Figure 5. Diagram for direct use in Maguarichi.
8 GHC BULLETIN, AUGUST 2012
• Maguarichi has a great potential to develop many direct use geothermal projects due to the availability of this resource. Projects, such as previously described, would help in the economical development of the village and its inhabitants.
• Further application of geothermal use is recommended (like geothermal heat pump installations, which require a district heating system or individual geothermal heat pump within private housings).
referencesArango-Galván, C., Prol-Ledesma, R. M., Flores-Márquez, E. L., Canet, C., Villanueva Estrada, R. E., 2011, “Shallow Submarine and Subaerial, Low-Enthalpy Hydrothermal Manifestations in Punta Banda, Baja California, Mexico: Geophysical and Geochemical Characterization”. Geothermics, 40, 102-111.
Cengel A., Yunus. Transferencia de Calor. México, 2da Edición, Mc-Graw Hill.
Elders, W. A., Campbel-Ramirez, H., Carreon-Diazcontil, C., 1996. “Direct Use Potential of the Tulechek Geothermal Area, B. C., Mexico”. Annual Meeting of the Geothermal Resources Council, Portland, OR, Volume 20; PB: 886 p.
Hiriart, G., 2011, Evaluación de la Energía Geotérmica en México. Comisión Reguladora de Energía.
Inter-American Development Bank.
Instituto Nacional de Estadística y Geografía, INEGI. www.inegi.org.mx
Lund, John W., Lienau, Paul J., Lunis Ben C., 1998. Geothermal Direct-Use Engineering and Design Guidebook. Geo-Heat Center, Oregon Institute of Technology, Klamath Falls, Oregon, 3rd Edition.
Mitraco-Surya. Geothermal. Techniques: Direct Use Applications. http://mitraco-surya.com/contents/geothermal/techniques/direct-use/
Ordaz-Méndez, C. A., Flores-Armenta, M., Ramírez-Silva, G., 2011, “Geothermal Potential in Mexico”, Geotermia, Volume 24, No. 1.
Quijano, J.L., 2007, Manual de geotérmia. Revista Geotermia.
Sanchez-Velasco, R., Lopez-Díaz, M., Mendoza, H., Tello-Hinojosa, R., 2003, “Magic at Maguarichic. International Geothermal Development”. Geothermal Resources Council Bulletin, Vol. 32 No. 2, Davis, CA.
Software: “Greenhouse Heating Spreadsheet” and “Ponds and Pools Heat Calculation Spreadsheet”. Geo-Heat Center, Oregon Institute of Technology, Klamath Falls, Oregon. Compilation of Aquaculture Information Package (Boyd and Rafferty, 1998), Balneology (Lund, 2001), and ASHRAE.
Torres Rodríguez, Vincente, 2000. “Geothermal Chart of Mexico Scale 1:2,000,000”. World Geothermal Congress 2000 Proceedings, Kyushu, Japan.
9GHC BULLETIN, AUGUST 2012
develoPmeNt overview of Geothermal resources iN Kilauea east rift zoNeRob Kinslow, Hawaii Pacific University, Honolulu, Hawaii Bridget Hass, University of Nevada Reno, Reno, Nevada Phillip Maddi, Geo-Heat Center, Oregon Institute of Technology, Klamath Falls, Oregon Piyush Bakane, University of Nevada Reno, Reno, Nevada
AbstrActThis study reviews the geothermal resources associated
with the Kīlauea East Rift Zone (KERZ) of Hawaii island by focusing on a holistic development strategy for additional geothermal production. A review of existing literature in the fields of geology, drilling, power production and policy challenges, highlights critical issues for geothermal enterprises. A geological assessment of the hydrology, geochemistry, and structural features that characterize the region is discussed. Available data are interpreted including geology, geochemistry, well depth and temperature. A power plant design is proposed and options for electric power and direct use are discussed. Changes in regulations, policy and cultural barriers, made relevant by a 1991 well blowout are discussed. A stakeholder engagement process based on environmental and cultural metrics is proposed in order to benefit the neighboring community.
summAryIn this overview, it is assumed that near term geothermal
development on the island of Hawaii will occur in the Puna district. The research group is a multi-disciplinary systems integrator and consulting partnership. Core skills are in drilling, mining engineering, geology, geophysics, power plant engineering, direct use, permitting, and community development.
Geothermal exploration operations will most likely be costlier in the future thus more robust drilling operations will be necessary. With magma flows continuing from the caldera at Kīlauea, and a comprehensive geophysic research capacity at the University of Hawaii, the basaltic geology and geochemistry are fairly well understood. Geothermal plant siting will continue to rely on a sensitive cultural and environmental balance. Thus, policy, compliance, CSR, and power plant operations must become more transparent and community focused. A sustainable development strategic approach is recommended to guide further development.
This paper summarizes the technical response to a request for proposals (RFP) from an investment group considering a second power plant in the Puna district where Ormat already has a functioning 38 MWe grid connected operation.
bAckGroundThere is a history of direct use of geothermal energy in
the Hawaiian islands going back at least to the 1800’s that certainly preceded historical accounts. Soaking in warm pools or steam baths are common remedies Hawaiian
healers have recommended for their important therapeutic benefits. Some historical accounts also mention King Kalākaua, who wanted to produce power in the 19th century from geothermal energy sources.
Today, the state of Hawaii has significant developable conventional hydrothermal resources, yet the possibility of significant barriers to resource development should not be ignored. Conventional resources, related to Kīlauea volcano on the island of Hawaii alone, are estimated to be around 750 MWe. If EGS is included, this capacity is increased to 1,396 MWe. There are also significant developable resources on Maui estimated to be ~130 MWe. Peak demand for electricity on the islands of Maui and Hawaii is ~200 MWe, and for Oahu, the most populated island, ~1,200 MWe (GeothermEx, 2005). An ocean floor power transmission cable has been discussed for a number of years and despite the relatively low technical risk, the politics, costs and the natural cultural independence of these islands has hindered cable construction between the natural supply and the population demand.
GeoloGyThe geologic overview considers the tectonic setting that
has led to the development of the highly-productive geothermal system in the East Rift Zone of Hawaii. This section considers the processes that contribute to the three main components of the geothermal system: heat, permeability, and water. The hydrothermal system is largely blind, with minimal surface alteration (Iovenitti & D’Olier, 1985), but extensive geophysical and geochemical surveys, combined with drilling logs from the Puna Geothermal Venture (PGV) plant have helped characterize the hydrothermal system. Due to the proprietary nature of PGV, current well-log data is limited, so this section primarily summarizes findings from the 1970s to early 2000s.
tectonic setting, lithology, heat flow, temperature
The Hawaiian island chains are formed by the movement of the Pacific plate at a rate of 9-10 cm/yr over a stationary hotspot magmatic plume. Unlike subduction zone stratovolcanoes, shield volcanoes have shallower slopes formed by eruptions of low-viscosity mafic basalts (<52%SiO2) that flow more slowly and in a non-explosive manner. Kīlauea is currently in the shield-building phase of the volcanic life-cycle, during which 95-98% of the volume is formed. During this phase, magma composition is primarily tholeiitic basalt, which is relatively higher in
-
10 GHC BULLETIN, AUGUST 2012
silica than ordinary alakali basalt. In 2005, the Puna Geothermal Venture well KS-13 drilled into dacitic magma at a depth of ~2400 m, with a considerably enriched SiO2
content of 67wt% (Teplow et al., 2008).
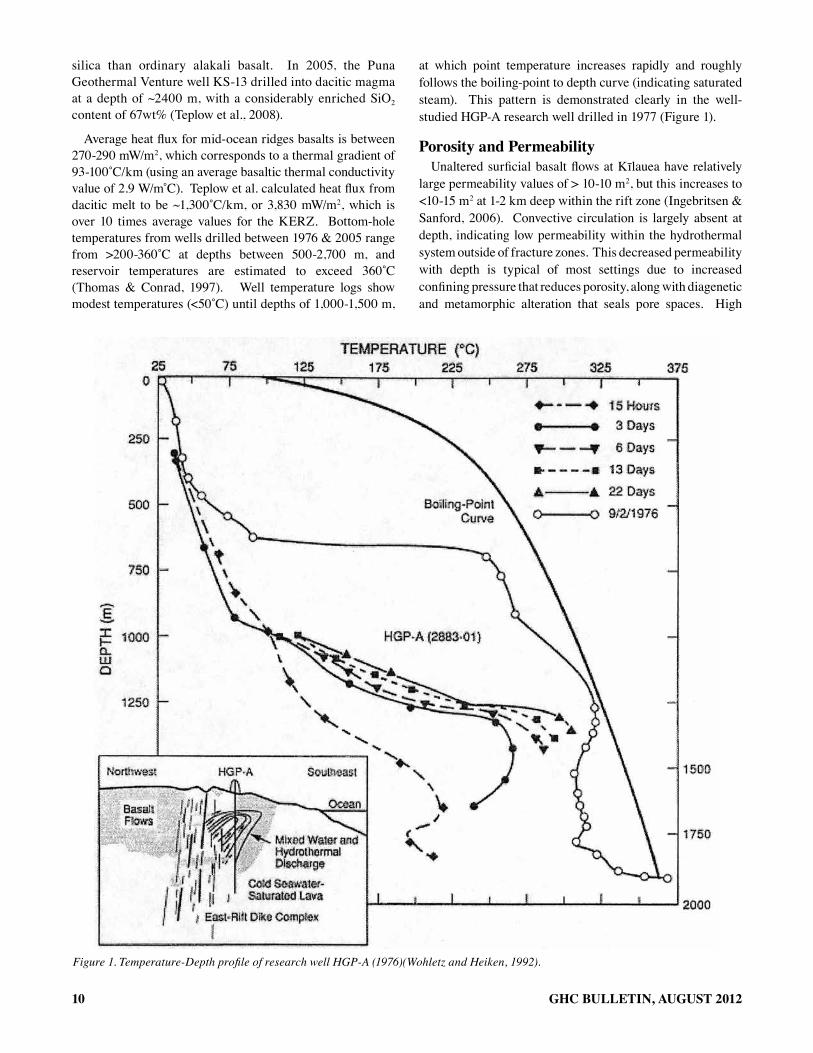
Average heat flux for mid-ocean ridges basalts is between 270-290 mW/m2, which corresponds to a thermal gradient of 93-100˚C/km (using an average basaltic thermal conductivity value of 2.9 W/m˚C). Teplow et al. calculated heat flux from dacitic melt to be ~1,300˚C/km, or 3,830 mW/m2, which is over 10 times average values for the KERZ. Bottom-hole temperatures from wells drilled between 1976 & 2005 range from >200-360˚C at depths between 500-2,700 m, and reservoir temperatures are estimated to exceed 360˚C (Thomas & Conrad, 1997). Well temperature logs show modest temperatures (<50˚C) until depths of 1,000-1,500 m,
at which point temperature increases rapidly and roughly follows the boiling-point to depth curve (indicating saturated steam). This pattern is demonstrated clearly in the well-studied HGP-A research well drilled in 1977 (Figure 1).
porosity and permeabilityUnaltered surficial basalt flows at Kīlauea have relatively
large permeability values of > 10-10 m2, but this increases to <10-15 m2 at 1-2 km deep within the rift zone (Ingebritsen & Sanford, 2006). Convective circulation is largely absent at depth, indicating low permeability within the hydrothermal system outside of fracture zones. This decreased permeability with depth is typical of most settings due to increased confining pressure that reduces porosity, along with diagenetic and metamorphic alteration that seals pore spaces. High
Figure 1. Temperature-Depth profile of research well HGP-A (1976)(Wohletz and Heiken, 1992).
11GHC BULLETIN, AUGUST 2012
density, low-porosity dike intrusions also compartmentalize permeability. Faults and fractures are the dominant mechanism for hydrothermal circulation.
rift Zone fractures and fissuresThe Kīlauea East Rift Zone is characterized by a series of
linear fissures that result from spreading during shield volcano formation. As the volcano accumulates material, it starts to subside under the influence of gravity, and the surface ruptures forming step-over “en-echelon” fissures. Magma flows laterally from the summit through these fractures under the influence of gravity, forming steeply dipping dike complexes. These are fairly wide (1.5-4.6 m) and range from 1,067-2,286 m deep (Spielman et al., 2006). The faults and fractures of the KERZ are rift-parallel, NE-striking and SE-dipping, as a result of seaward slumping of Kīlauea’s flank as increased mass accumulation subsides under the effect of gravity. The Puna Hydrothermal System is located in a step between two large normal faults, in a “relay ramp” setting, with a fracture system at depth that enables fluid flow (Kenedi et al., 2010). Geothermal reservoir temperatures are highest in the middle of the dike complex and drop off moving north or south away from the rift zone.
hydrogeologyGroundwater hydrology in islands is commonly described
by the Ghyben-Herzberg model, which predicts that basal waters will consist of a fresh-water lens floating above sea water due to the difference in density between the two fluids (Gingerich and Oki, 2000). The thickness of the lens is determined by the amount of rainfall that recharges the system and the rock permeability, and is predicted to be ~70 m in the KERZ (Thomas, 1987). In rift-zone settings, dike-impounded water systems form as low-permeability dikes intrude into the parent rock, compartmentalizing the water (Figure 2).
Well data, particularly HGP-A, show low salinities at depth (~5% that of seawater), contrary to what would be expected with the Ghyben-Herzberg lens. This anomalous finding indicates a meteoric source for the hydrothermal fluids, which has been explained by several theories. Firstly, the presence of a heat source in the Puna geothermal system could invert this typical density-layered lens since heated seawater becomes buoyant and rises above the cold freshwater. Second, the structure of the east-west trending fractures in the KERZ increases vertical and lateral permeability for fresh-water recharge. Freshwater recharge is predicted to come predominately from subsurface inflow off the flanks of Mauna Loa. Finally, the presence of dikes, along with hydrothermal alteration of seaward facing rock, inhibit seawater intrusion from the south rift flanks (Thomas, 1987).
GeochemistryRecharge to basal ground water comes from four main
sources: 1. cold meteoric fresh water (rainfall), 2. cold sea water, 3. hydrothermally altered meteoric water, and 4. hydrothermally altered sea water (Thomas, 1987). Seawater
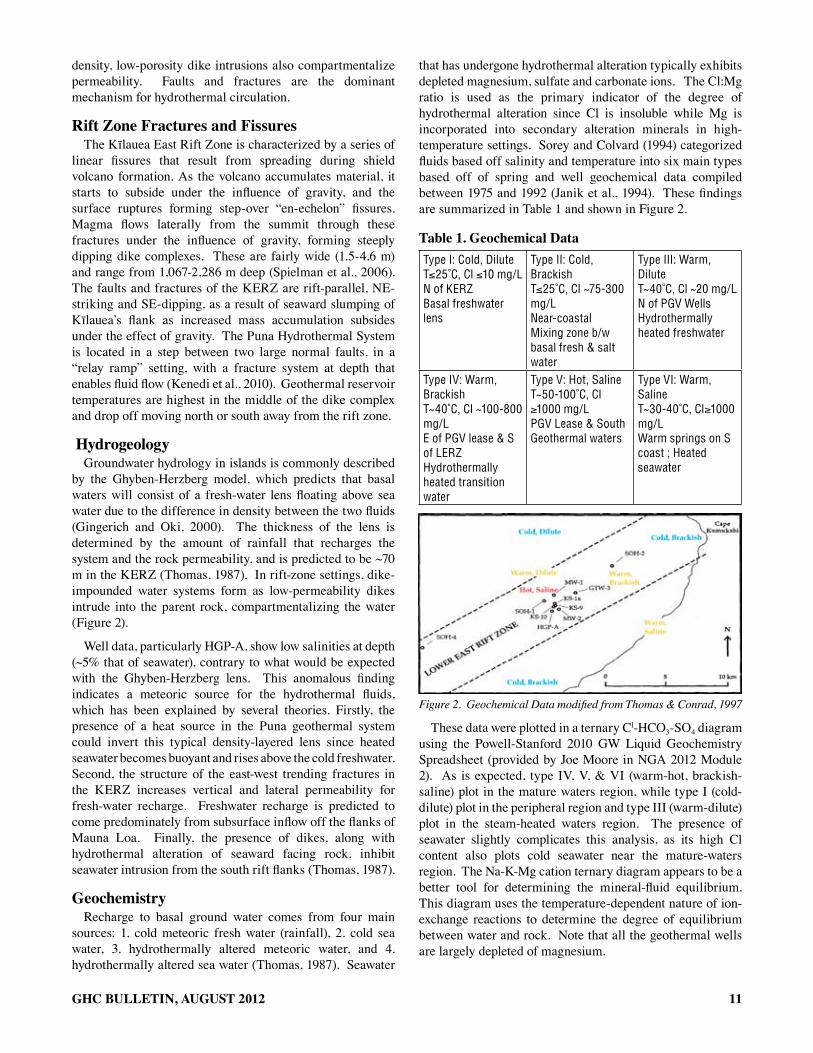
that has undergone hydrothermal alteration typically exhibits depleted magnesium, sulfate and carbonate ions. The Cl:Mg ratio is used as the primary indicator of the degree of hydrothermal alteration since Cl is insoluble while Mg is incorporated into secondary alteration minerals in high-temperature settings. Sorey and Colvard (1994) categorized fluids based off salinity and temperature into six main types based off of spring and well geochemical data compiled between 1975 and 1992 (Janik et al., 1994). These findings are summarized in Table 1 and shown in Figure 2.
table 1. Geochemical dataType I: Cold, DiluteT≤25˚C, Cl ≤10 mg/LN of KERZBasal freshwater lens
Type II: Cold, BrackishT≤25˚C, Cl ~75-300 mg/LNear-coastalMixing zone b/w basal fresh & salt water
Type III: Warm, DiluteT~40˚C, Cl ~20 mg/L N of PGV WellsHydrothermally heated freshwater
Type IV: Warm, BrackishT~40˚C, Cl ~100-800 mg/L E of PGV lease & S of LERZHydrothermally heated transition water
Type V: Hot, SalineT~50-100˚C, Cl ≥1000 mg/LPGV Lease & SouthGeothermal waters
Type VI: Warm, SalineT~30-40˚C, Cl≥1000 mg/L Warm springs on S coast ; Heated seawater
Figure 2. Geochemical Data modified from Thomas & Conrad, 1997
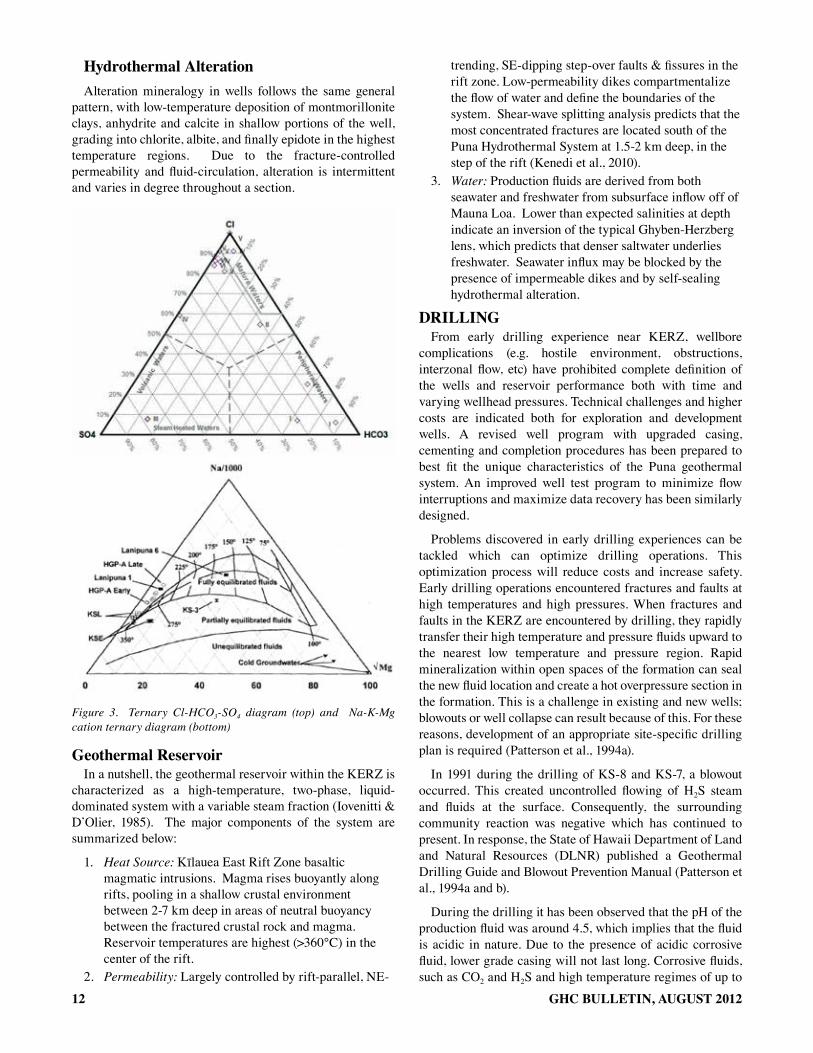
These data were plotted in a ternary Cl-HCO3-SO4 diagram using the Powell-Stanford 2010 GW Liquid Geochemistry Spreadsheet (provided by Joe Moore in NGA 2012 Module 2). As is expected, type IV, V, & VI (warm-hot, brackish-saline) plot in the mature waters region, while type I (cold-dilute) plot in the peripheral region and type III (warm-dilute) plot in the steam-heated waters region. The presence of seawater slightly complicates this analysis, as its high Cl content also plots cold seawater near the mature-waters region. The Na-K-Mg cation ternary diagram appears to be a better tool for determining the mineral-fluid equilibrium. This diagram uses the temperature-dependent nature of ion-exchange reactions to determine the degree of equilibrium between water and rock. Note that all the geothermal wells are largely depleted of magnesium.
12 GHC BULLETIN, AUGUST 2012
hydrothermal AlterationAlteration mineralogy in wells follows the same general
pattern, with low-temperature deposition of montmorillonite clays, anhydrite and calcite in shallow portions of the well, grading into chlorite, albite, and finally epidote in the highest temperature regions. Due to the fracture-controlled permeability and fluid-circulation, alteration is intermittent and varies in degree throughout a section.
Figure 3. Ternary Cl-HCO3-SO4 diagram (top) and Na-K-Mg cation ternary diagram (bottom)
Geothermal reservoir In a nutshell, the geothermal reservoir within the KERZ is
characterized as a high-temperature, two-phase, liquid-dominated system with a variable steam fraction (Iovenitti & D’Olier, 1985). The major components of the system are summarized below:
1. Heat Source: Kīlauea East Rift Zone basaltic magmatic intrusions. Magma rises buoyantly along rifts, pooling in a shallow crustal environment between 2-7 km deep in areas of neutral buoyancy between the fractured crustal rock and magma. Reservoir temperatures are highest (>360°C) in the center of the rift.
2. Permeability: Largely controlled by rift-parallel, NE-
trending, SE-dipping step-over faults & fissures in the rift zone. Low-permeability dikes compartmentalize the flow of water and define the boundaries of the system. Shear-wave splitting analysis predicts that the most concentrated fractures are located south of the Puna Hydrothermal System at 1.5-2 km deep, in the step of the rift (Kenedi et al., 2010).
3. Water: Production fluids are derived from both seawater and freshwater from subsurface inflow off of Mauna Loa. Lower than expected salinities at depth indicate an inversion of the typical Ghyben-Herzberg lens, which predicts that denser saltwater underlies freshwater. Seawater influx may be blocked by the presence of impermeable dikes and by self-sealing hydrothermal alteration.
drIllInGFrom early drilling experience near KERZ, wellbore
complications (e.g. hostile environment, obstructions, interzonal flow, etc) have prohibited complete definition of the wells and reservoir performance both with time and varying wellhead pressures. Technical challenges and higher costs are indicated both for exploration and development wells. A revised well program with upgraded casing, cementing and completion procedures has been prepared to best fit the unique characteristics of the Puna geothermal system. An improved well test program to minimize flow interruptions and maximize data recovery has been similarly designed.
Problems discovered in early drilling experiences can be tackled which can optimize drilling operations. This optimization process will reduce costs and increase safety. Early drilling operations encountered fractures and faults at high temperatures and high pressures. When fractures and faults in the KERZ are encountered by drilling, they rapidly transfer their high temperature and pressure fluids upward to the nearest low temperature and pressure region. Rapid mineralization within open spaces of the formation can seal the new fluid location and create a hot overpressure section in the formation. This is a challenge in existing and new wells; blowouts or well collapse can result because of this. For these reasons, development of an appropriate site-specific drilling plan is required (Patterson et al., 1994a).
In 1991 during the drilling of KS-8 and KS-7, a blowout occurred. This created uncontrolled flowing of H2S steam and fluids at the surface. Consequently, the surrounding community reaction was negative which has continued to present. In response, the State of Hawaii Department of Land and Natural Resources (DLNR) published a Geothermal Drilling Guide and Blowout Prevention Manual (Patterson et al., 1994a and b).
During the drilling it has been observed that the pH of the production fluid was around 4.5, which implies that the fluid is acidic in nature. Due to the presence of acidic corrosive fluid, lower grade casing will not last long. Corrosive fluids, such as CO2 and H2S and high temperature regimes of up to
13GHC BULLETIN, AUGUST 2012
350°C can result in burst or collapse of well-bore casings. Presence of dissolved solids can cause scaling in the pipe and which may reduce the power production. For example, KS-10 production was dropped significantly due to scaling. To overcome this scaling problem, the well was re-drilled. After the re-drilling of KS-10 it started producing 7.5 MWe of steam. KS-6 produced 8.3 MWe worth of steam when drilled (Spielman, et. al., 2006). Thus, all casings and well structures should be able to withstand corrosion and be thermally stress resistant. For example, steel with ~1% chrome can provide enhanced corrosion resistance and adding ~0.5% molybdenum increases steel resistance degradation at high temperatures (Spielman, et. al., 2006). Casing weight, grade and joint threads should be sized on tension, burst and collapse pressures. According to the DLNR drilling guide, common safety factors in use are 1.125 for collapse, 1.50 for burst and 1.75 for tension (Patterson, 1994b).
In wells KS-6, KS-10, and KS-13 innovative procedures were used to overcome the difficulties which were previously encountered while drilling. Parted casing was repaired using a casing patch. Foam cement is used for intermediate casing as well as for reverse circulation for production casing (Spielman, et. al., 2006). Hydrostatic pressure can increase due to the conventionally circulated cement, but intense planning is required due to the complexities involved in reverse circulation cementing jobs (Spielman, et. al., 2006). Occurrence of dog legs and saving of time can be achieved by MWD (measurement while drilling). Bit RPM (revolutions per minute) is important while drilling in the formation. A 100% increase in rate of penetration can be achieved by rotation while drilling. As discussed before, shallow formations in KERZ are unstable and permeability is very high. Because of this, loss circulation can be encountered at shallow zones. To avoid this issue micronized cellulose (Spielman, et. al., 2006) was used. Partial to full circulation, without mud system clogging can be maintained, which was not possible with conventional LCM (loss circulation material) [Rickard, et al., 2011].
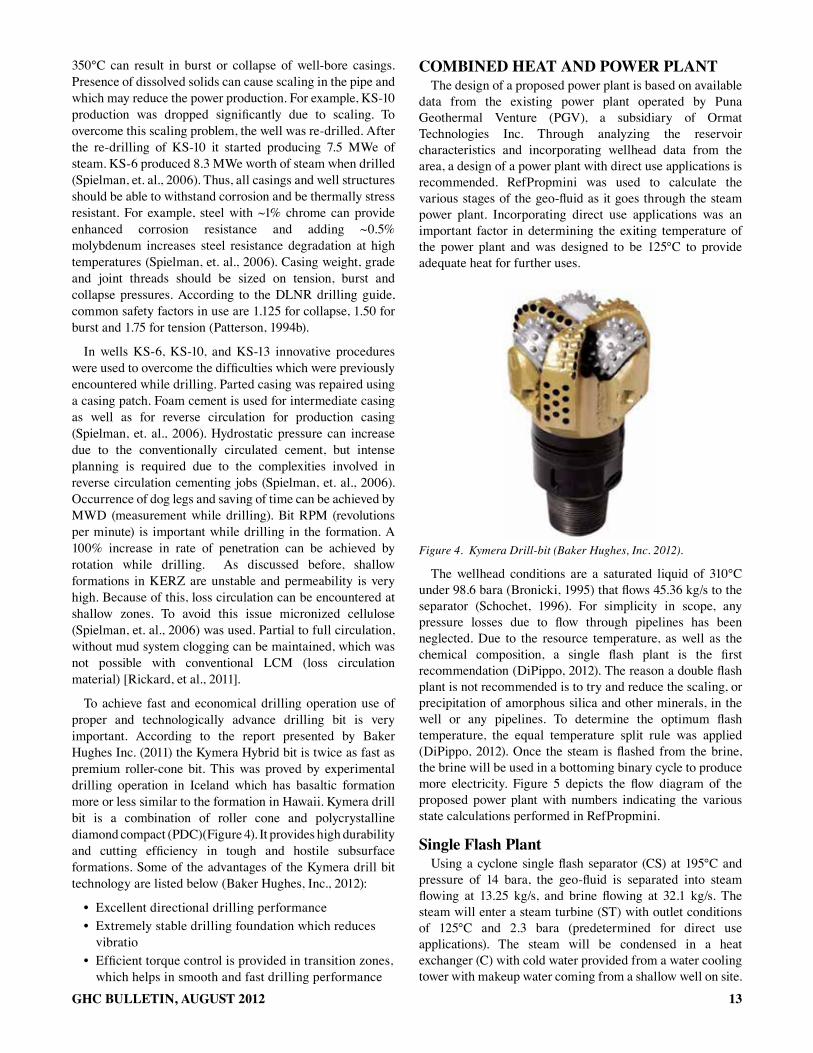
To achieve fast and economical drilling operation use of proper and technologically advance drilling bit is very important. According to the report presented by Baker Hughes Inc. (2011) the Kymera Hybrid bit is twice as fast as premium roller-cone bit. This was proved by experimental drilling operation in Iceland which has basaltic formation more or less similar to the formation in Hawaii. Kymera drill bit is a combination of roller cone and polycrystalline diamond compact (PDC)(Figure 4). It provides high durability and cutting efficiency in tough and hostile subsurface formations. Some of the advantages of the Kymera drill bit technology are listed below (Baker Hughes, Inc., 2012):
• Excellent directional drilling performance• Extremely stable drilling foundation which reduces
vibratio• Efficient torque control is provided in transition zones,
which helps in smooth and fast drilling performance
combIned heAt And power plAntThe design of a proposed power plant is based on available
data from the existing power plant operated by Puna Geothermal Venture (PGV), a subsidiary of Ormat Technologies Inc. Through analyzing the reservoir characteristics and incorporating wellhead data from the area, a design of a power plant with direct use applications is recommended. RefPropmini was used to calculate the various stages of the geo-fluid as it goes through the steam power plant. Incorporating direct use applications was an important factor in determining the exiting temperature of the power plant and was designed to be 125°C to provide adequate heat for further uses.
Figure 4. Kymera Drill-bit (Baker Hughes, Inc. 2012).
The wellhead conditions are a saturated liquid of 310°C under 98.6 bara (Bronicki, 1995) that flows 45.36 kg/s to the separator (Schochet, 1996). For simplicity in scope, any pressure losses due to flow through pipelines has been neglected. Due to the resource temperature, as well as the chemical composition, a single flash plant is the first recommendation (DiPippo, 2012). The reason a double flash plant is not recommended is to try and reduce the scaling, or precipitation of amorphous silica and other minerals, in the well or any pipelines. To determine the optimum flash temperature, the equal temperature split rule was applied (DiPippo, 2012). Once the steam is flashed from the brine, the brine will be used in a bottoming binary cycle to produce more electricity. Figure 5 depicts the flow diagram of the proposed power plant with numbers indicating the various state calculations performed in RefPropmini.
single flash plant Using a cyclone single flash separator (CS) at 195°C and
pressure of 14 bara, the geo-fluid is separated into steam flowing at 13.25 kg/s, and brine flowing at 32.1 kg/s. The steam will enter a steam turbine (ST) with outlet conditions of 125°C and 2.3 bara (predetermined for direct use applications). The steam will be condensed in a heat exchanger (C) with cold water provided from a water cooling tower with makeup water coming from a shallow well on site.

14 GHC BULLETIN, AUGUST 2012
The steam will then be recombined with the exiting brine from the binary plant, and they will both feed the direct use heat exchanger. Overall, the steam plant will produce roughly 3.4 MWe. Table 2 includes the RefPropmini state data, and the relevant calculations are included below.
table 2: refpropmini results
Corresponding Temp Pressure Density Enthalpy Entropy Quality
State # (°C) (MPa) (kg/m³) (kJ/kg) (kJ/kg-K) (kg/kg)
1 310.00 9.8651 690.67 1402.2 3.3510 0.00000
2 195.00 1.3988 23.821 1402.2 3.5059 0.29219
3 195.00 1.3988 7.0976 2788.8 6.4678 1.0000
6 195.00 1.3988 870.43 829.79 2.2832 0.00000
4s 125.00 0.23224 1.4603 2470.5 6.4678 0.88914
4 125.0 0.232 1.41 2529 6.61 0.916
calculationsUsing the Baumann rule, assuming a dry turbine efficiency
of 85%, the enthalpy of the steam exiting the turbine can be determined as follows:
This equation results in an enthalpy of 2,529.6 kJ/kg and quality (found using RefPropmini) of 91.6%. To determine
the electrical output of the turbine, the equation below was applied:
This results in 3.4 MWe of output from the steam turbine.
equipmentSeparator (CS) - A cyclone vertical separator allows for the
pressurized geo-fluid to drop pressure, thus expanding and producing separate brine and steam flows. At this pressure about 30% of the mass of the reservoir fluid is converted to steam that goes to the steam turbine: the brine will be used to transfer heat to the binary power plant.
Turbine and Generator (ST and G) - The selection of the turbine will be done through a request for proposal (RFP) process where various turbine designing companies will submit price and size estimates for the given entering and exiting parameters.
Condenser and Cooling (C and CW) - With the availability of water rights in Hawaii, a water-cooled condenser provides a more efficient cooling of steam from the geo-fluid, and working fluid from the binary plant. A water well on-site will provide sufficient makeup water at a dead-state temperature of 25°C. Using a water cooling tower allows for 100% reinjection of the geo-fluid (not including NCGs).
Chemical abatement and treatment - The high concentration of H2S relative to other geothermal reservoirs requires an abatement plant to be included in the power plant design. Venting the CO2 at these concentrations to the air will have very little environmental impact; however, venting H2S to the atmosphere at these concentrations could have detrimental impacts to the local community. There is also a requirement to chemically treat the fluid to prevent scaling from silica precipitation in the injection well.
Figure 5. Single Flash plant bottoming Binary cycle. Modified from DiPippo, 2012.
15GHC BULLETIN, AUGUST 2012
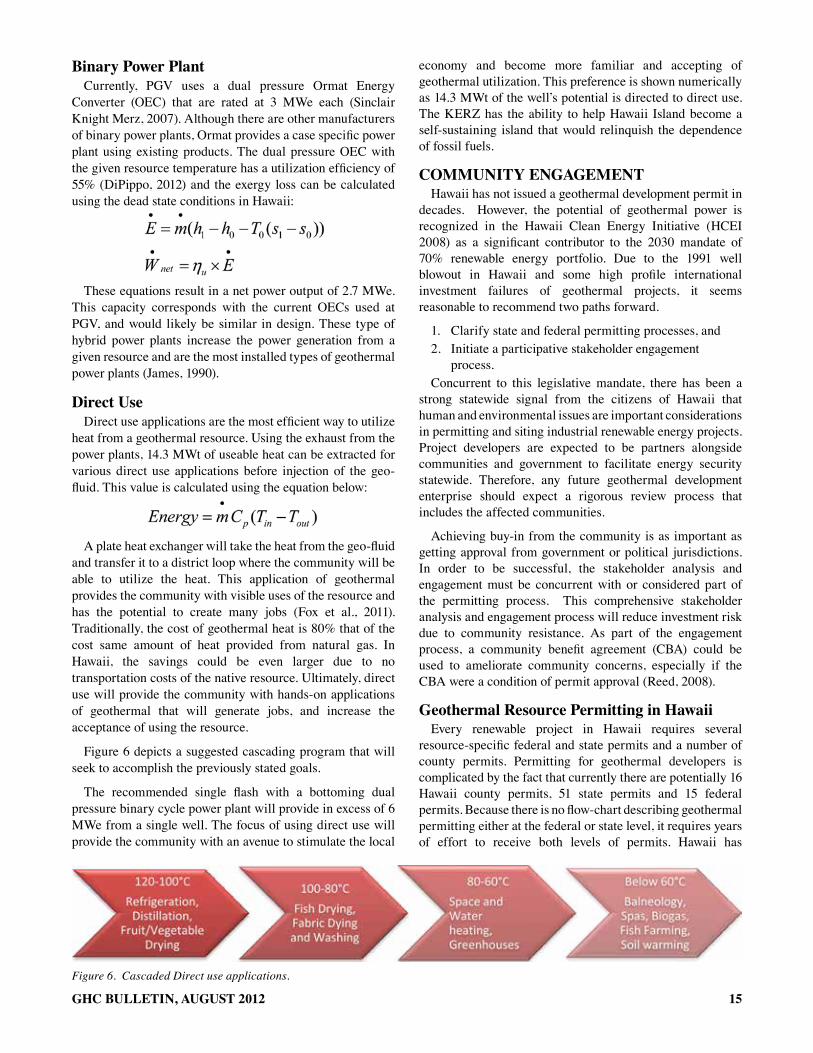
binary power plantCurrently, PGV uses a dual pressure Ormat Energy
Converter (OEC) that are rated at 3 MWe each (Sinclair Knight Merz, 2007). Although there are other manufacturers of binary power plants, Ormat provides a case specific power plant using existing products. The dual pressure OEC with the given resource temperature has a utilization efficiency of 55% (DiPippo, 2012) and the exergy loss can be calculated using the dead state conditions in Hawaii:
These equations result in a net power output of 2.7 MWe. This capacity corresponds with the current OECs used at PGV, and would likely be similar in design. These type of hybrid power plants increase the power generation from a given resource and are the most installed types of geothermal power plants (James, 1990).
direct useDirect use applications are the most efficient way to utilize
heat from a geothermal resource. Using the exhaust from the power plants, 14.3 MWt of useable heat can be extracted for various direct use applications before injection of the geo-fluid. This value is calculated using the equation below:
A plate heat exchanger will take the heat from the geo-fluid and transfer it to a district loop where the community will be able to utilize the heat. This application of geothermal provides the community with visible uses of the resource and has the potential to create many jobs (Fox et al., 2011). Traditionally, the cost of geothermal heat is 80% that of the cost same amount of heat provided from natural gas. In Hawaii, the savings could be even larger due to no transportation costs of the native resource. Ultimately, direct use will provide the community with hands-on applications of geothermal that will generate jobs, and increase the acceptance of using the resource.
Figure 6 depicts a suggested cascading program that will seek to accomplish the previously stated goals.
The recommended single flash with a bottoming dual pressure binary cycle power plant will provide in excess of 6 MWe from a single well. The focus of using direct use will provide the community with an avenue to stimulate the local
economy and become more familiar and accepting of geothermal utilization. This preference is shown numerically as 14.3 MWt of the well’s potential is directed to direct use. The KERZ has the ability to help Hawaii Island become a self-sustaining island that would relinquish the dependence of fossil fuels.
communIty enGAGementHawaii has not issued a geothermal development permit in
decades. However, the potential of geothermal power is recognized in the Hawaii Clean Energy Initiative (HCEI 2008) as a significant contributor to the 2030 mandate of 70% renewable energy portfolio. Due to the 1991 well blowout in Hawaii and some high profile international investment failures of geothermal projects, it seems reasonable to recommend two paths forward.
1. Clarify state and federal permitting processes, and 2. Initiate a participative stakeholder engagement
process.Concurrent to this legislative mandate, there has been a
strong statewide signal from the citizens of Hawaii that human and environmental issues are important considerations in permitting and siting industrial renewable energy projects. Project developers are expected to be partners alongside communities and government to facilitate energy security statewide. Therefore, any future geothermal development enterprise should expect a rigorous review process that includes the affected communities.
Achieving buy-in from the community is as important as getting approval from government or political jurisdictions. In order to be successful, the stakeholder analysis and engagement must be concurrent with or considered part of the permitting process. This comprehensive stakeholder analysis and engagement process will reduce investment risk due to community resistance. As part of the engagement process, a community benefit agreement (CBA) could be used to ameliorate community concerns, especially if the CBA were a condition of permit approval (Reed, 2008).
Geothermal resource permitting in hawaiiEvery renewable project in Hawaii requires several
resource-specific federal and state permits and a number of county permits. Permitting for geothermal developers is complicated by the fact that currently there are potentially 16 Hawaii county permits, 51 state permits and 15 federal permits. Because there is no flow-chart describing geothermal permitting either at the federal or state level, it requires years of effort to receive both levels of permits. Hawaii has
Figure 6. Cascaded Direct use applications.
16 GHC BULLETIN, AUGUST 2012
attempted to clarify the permitting process by publishing online guidebooks to the renewable energy approval process (DBEDT, 2012). However, the process is still cumbersome.
In 2012, there has been a coordinated effort to streamline geothermal permitting processes at federal and state levels. In an attempt to simplify the state process, the Hawaii state legislature through Act 97 (2012) eliminated the county geothermal sub-zones permits (GRPs). Because of this both Maui and Hawaii counties permitting processes are temporarily on hold. However, the GRPs should be reinstated in the 2013 legislative session.
At the federal level, the goal of the USDOE’s NREL’s Geothermal Regulatory Roadmap program is to create and publish a flowchart and document the regulatory processes for geothermal development in Alaska, California, Hawaii, Idaho, Montana, Nevada, Oregon, Utah and at three levels (federal, state, county). The Hawaii working group has met to clarify the flow of permits in the state Department of Land and Natural Resources (DLNR) and Department of Health (DOH), as well as the process of permit facilitation for which Department of Business and Economic Development and Tourism (DBEDT) is authorized. These efforts are ongoing (USDOE, 2012).
In summary, geothermal power is an enormously promising source of base load energy and if incentivized through CBAs and transparent permitting processes, could rapidly become a significant contributor to Hawaii’s clean energy future.
conclusIon It would seem that geothermal power production would
have a bright future out in the middle of the blue continent. On the island of Hawaii, the potential of industrial base-load geothermal development is increased by the near magmatic zone which produces high borehole temperatures and convective heat flows conducive to geothermal power production in the Kīlauea East Rift Zone (KERZ). However, the islands with the highest potential for geothermal heat are separated by miles of oceans from the demand of the populated older islands. Due to missteps by both governments and developers in past geothermal endeavors, affected communities have a negative perception of the geothermal enterprise.
Further, the regulatory and permitting regimes, while well intentioned, are difficult to interpret without the organizational memory of first generation geothermal regulators. The current developer, by some accounts, has responded in a protective manner thus alienating the community in which it is embedded. There is a need for a comprehensive stakeholder analysis and engagement process if further geothermal development is to occur.
recommendationsWhile the Puna Geothermal System has been well-studied
since the first research well was sunk in 1976, new well drilling locations are highly dependent on sub-surface fracture networks. Further geophysical exploration and drill tests of a potentially high-density fracture network south of the PGV plant at a depth of 1.5-2km should be conducted.
• Further investigation of the extent of the dacitic intrusion (discovered during drilling of KS-13 in 2005) may provide useful information about higher heat-flow (possibly steam-dominated) areas. It would be useful to map this in order to avoid future problems of drilling into magma.
• Previous drilling experiences provided important lessons about high temperature, pressure and corrosive environments in KERZ. Incorporating lessons learned into regulations can make future geothermal drilling operations safer and efficient.
• A single flash power plant with a bottoming binary cycle could generate about 6 MWe per well. There could be 14.3 MWt provided from the same fluid for community direct use.
• Use of direct use should be integrated with geothermal electrical power production. Doing this will create green jobs and directly benefit stakeholder communities. Thus reducing risk for investors in geothermal development in Hawaii.
• A state roadmap for geothermal projects permitting should be developed. Federal and state regulatory processes should be transparent for both project developers and affected communities.
• A robust stakeholder engagement process should be implemented immediately in affected communities in order to reduce risk to investors, developers and the state.
17GHC BULLETIN, AUGUST 2012
referencesBaker Hughes, Inc. 2011. “Kymera Hybrid Bit Drilled Twice as Fast as Premium Roller-Cone Bits in Iceland”. Available from: http://www.bakerhughes.com/news-and-media/resources/case-histories/kymera-hybrid-bit-ch
Baker Hughes, Inc. 2012. “Kymera Hybrid Drill Bit Technology”. Available from: http://www.bakerhughes.com/products-and-services/drilling/drill-bit-systems/kymera-hybrid-drill-bit-technology
Bronicki L. 1995. “Innovative geothermal power plants fifteen years of experience”. [Internet]. Report. Sparks (NV): Ormat Geothermal Division. Available from: http://www.geothermal-energy.org/pdf/IGAstandard/WGC/1995/3-bronicki.pdf.
Department of Business, Economic Development & Tourism (DBEDT). 2012. “Renewable Energy Project Permitting in the State of Hawaii”. Hawaii State Energy Office: Dept. of Business, Economic Development & Tourism. http://energy.hawaii.gov/developer-investor/renewable-energy-project-permitting-in-the-state-of-hawaii
DiPippo R. 2012. Geothermal power plants. 3rd ed. Waltham (MA): Elsevier.
Fox D, Sutter D, Tester J. 2011. “The thermal spectrum of low-temperature energy use in the United States” [Internet]. Report. DOI: 10.1039/c1ee01722e. Available from: http://www.geothermal-energy.org/pdf/IGAstandard/SGW/2011/fox.pdf.
GeothermEx, Inc. 2005. Assessment of Energy Reserve and Costs Of Geothermal Resources in Hawaii. GeothermEx, Richmond, CA. 89 pp.
Gingerich, S.B. and D.S. Oki. 2000, “Ground Water in Hawaii: U.S. Geological Survey”, Fact Sheet 126-00.
Ingebritsen, S., Sanford, W., and C. Nauzil. 2006. Groundwater in Geologic Process, Cambridge University Press.
Iovenitti, J. K. and W. L. D’Olier. 1985. “Preliminary results of drilling and testing in the Puna geothermal system, Hawaii”. Tenth Workshop on Geothermal Reservoir Engineering, Stanford University, pp. 65-71. Stanford Geothermal Program.
James R. 1990. “Geothermal reservoir optimization: Kiluea east rift zone”. [Internet]. Geothermal Resource Council Transactions. 14(1): 769-774.
Janik, C. J., M. Nathenson, and M. A. Scholl. 1994. “Chemistry of spring and well waters on Kīlauea Volcano, Hawaii, and vicinity”, U.S. Geol. Surv. Open File Rep., 94-0586, 166 pp.
Kenedi, C. L., Shalev, L. A., and P. Malin. 2010. “Microseismicity and 3-D Mapping of an Active Geothermal Field, Kīlauea Lower East Rift Zone, Puna, Hawaii”. Proceedings World Geothermal Congress.
Patterson, R. A., D’Olier, W. L., and H. E. Wheeler. 1994a. Hawaii Geothermal Blowout Prevention Manual: Circular C 125. R. A. Patterson and Associates, 66 pp.
Patterson, R. A., D’Olier, W. L., and H. E. Wheeler. 1994b. Hawaii Geothermal Drilling Guide: Circular C 126. R. A. Patterson and Associates, 71 pp.
Reed, M., 2008. Stakeholder participation for environmental management:, Biol. Conserv., doi:10.1016/j.biocon.2008.07.014
Rickard B., Samuel A., Lee C., Spielman P., Cuadros I., Long J., and E. Robert. 2011. “KS 14 Puna Geothermal Venture: Flawless Execution of Aerated Mud Drilling with Mud Motor in Hostile Environment” Geothermal Resource Council Transactions, Vol. 35, pg 229 to 232.
Schochet D. 1996. “Performance of Ormat geothermal binary and combined steam and or binary cycle power plants with moderate and high temperature resources” [Internet]. Report. Sparks (NV): Elsevier. Available from: http://dx.doi.org/10.1016/0960-1481 (96)00095-X.
Sinclair Knight Merz. 2007. Assessment of current costs of geothermal power generation in New Zealand (2007 Basis). New Zealand Geothermal Association (NZ). 86 pp.
Sorey, Michael L. and E. M. Colvard. 1994. “Potential Effects of the Hawaii Geothermal Project on the Island of Hawaii”. USGS Water Resources Investigations Report 94-4028, Menlo Park, CA.
Spielman P., Rickard W., and W. Teplow. 2006. Puna Geothermal Venture, Hawaii—2005 Drilling Program. Geothermal Resource Council Transactions, Vol. 30.pg 309 to 314.
Teplow, W. et al., 2008. “Dacite melt at the Puna Geothermal Venture Wellfield, Big Island of Hawaii”. EOS Transactions AGU Fall Meeting Supplement, 89(53).
Thomas, D. M. 1987. “A geochemical model of the Kīlauea east rift zone”, U.S. Geological Survey Prof. Paper, 1350, 1507–1525.
Thomas, D.M. and M.E. Conrad. 1997. “The hydrothermal system associated with the Kīlauea East Rift Zone, Hawaii”. Energy Conversion Engineering Conference, 1997. IECEC-97., Proceedings of the 32nd Intersociety, vol. 3, no., pp.1840-1845 vol.3, 27 Jul-1 Aug 1997 doi: 10.1109/IECEC.1997.656703
US Department of Energy (USDOE), 2012. “Geothermal Regulatory Roadmap. Energy Efficiency and Renewable Energy”, US Department of Energy, Washington, DC. Factsheet. http://prod-http-80-800498448.us-east-1.elb.amazonaws.com/w/images/a/a1/GRR_Flyer.pdf
Wohletz, Kenneth and G. Heiken. 1992. Volcanology and Geothermal Energy. Berkeley: University of California Press. http://ark.cdlib.org/ark:/13030/ft6v19p151/.

Article was removed from the Bulletin
23GHC BULLETIN, AUGUST 2012
Geothermal eNerGy ProPectiNG for the cariBBeaN islaNds of Nevis aNd moNtserratRandy R. Koon Koon, Department of Physics, the University of the West Indies, St Augustine, Trinidad
AbstrActGeothermal energy exploration is vastly dependent on the
findings of geophysical surveys and other exploratory methods that may yield sub-surface characteristics of potential reservoirs, such as rock morphology, fault lining, and fluid dynamics. The main focus of this paper is to capture and explore the geological and geophysical methods required to generate an enhanced understanding of southern Montserrat and western Nevis. In addition, the location of deep fracture networks that are necessary for fluid circulation in hydrothermal systems will be identified through seismic analysis.
IntroductIonPhysical manifestation of stresses within the Earth is
represented by fractures, as well as faults. Once rock is compelled beyond its elastic limit (its ability to deform) fractures are generated. It should be noted that all stresses, be it localized or regional stress systems, can be assessed based on fault orientation. There exists a major fault system on the island of Montserrat known as the Belham Valley Fault (BVF). The BVF not only dominates southern Montserrat but also influences the pattern of volcanism and alignment of vents within the Soufriere Island morphology (Kenedi 2010).
The Caribbean islands are situated on a crustal plate that moves eastward along the North and South American Plates, and subducting eastward beneath the Atlantic Plate, hence the reason for active volcanism (Huttrer, 1999). High temperature sources that are concentrated in regions of active or volcanic islands of the Eastern Caribbean chain are the most desirable area (Haraksingh & Koon Koon, 2011).
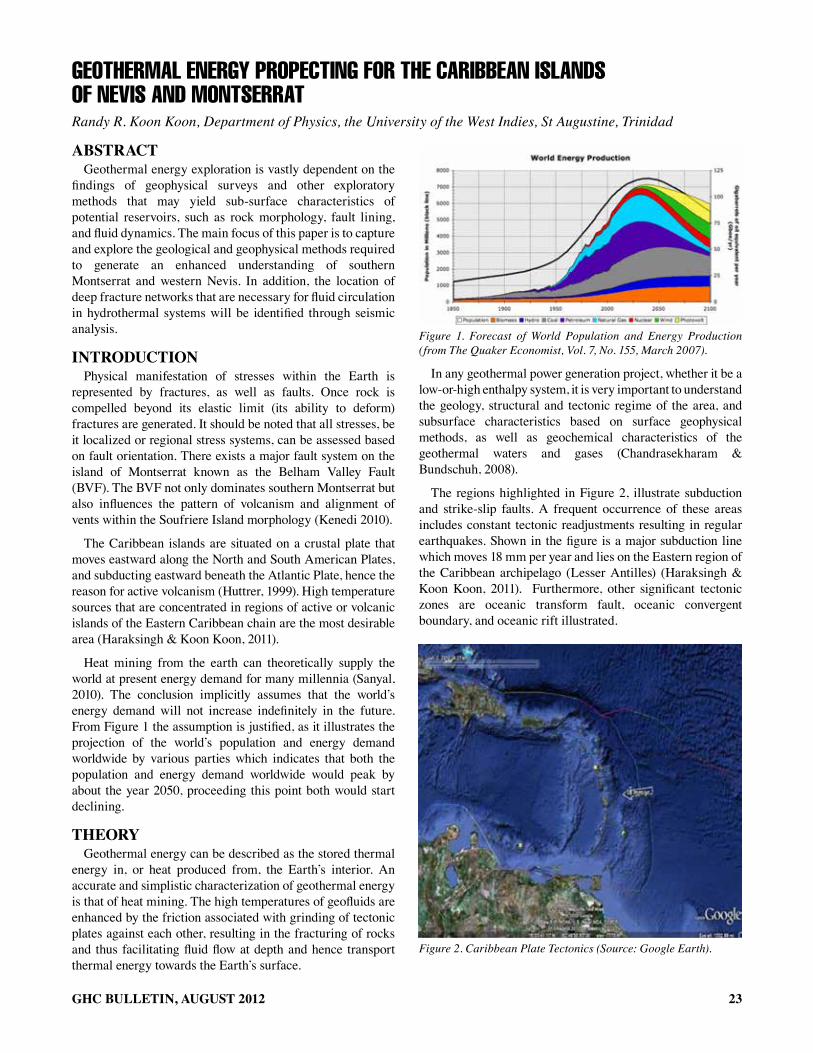
Heat mining from the earth can theoretically supply the world at present energy demand for many millennia (Sanyal, 2010). The conclusion implicitly assumes that the world’s energy demand will not increase indefinitely in the future. From Figure 1 the assumption is justified, as it illustrates the projection of the world’s population and energy demand worldwide by various parties which indicates that both the population and energy demand worldwide would peak by about the year 2050, proceeding this point both would start declining.
theoryGeothermal energy can be described as the stored thermal
energy in, or heat produced from, the Earth’s interior. An accurate and simplistic characterization of geothermal energy is that of heat mining. The high temperatures of geofluids are enhanced by the friction associated with grinding of tectonic plates against each other, resulting in the fracturing of rocks and thus facilitating fluid flow at depth and hence transport thermal energy towards the Earth’s surface.
Figure 1. Forecast of World Population and Energy Production (from The Quaker Economist, Vol. 7, No. 155, March 2007).
In any geothermal power generation project, whether it be a low-or-high enthalpy system, it is very important to understand the geology, structural and tectonic regime of the area, and subsurface characteristics based on surface geophysical methods, as well as geochemical characteristics of the geothermal waters and gases (Chandrasekharam & Bundschuh, 2008).
The regions highlighted in Figure 2, illustrate subduction and strike-slip faults. A frequent occurrence of these areas includes constant tectonic readjustments resulting in regular earthquakes. Shown in the figure is a major subduction line which moves 18 mm per year and lies on the Eastern region of the Caribbean archipelago (Lesser Antilles) (Haraksingh & Koon Koon, 2011). Furthermore, other significant tectonic zones are oceanic transform fault, oceanic convergent boundary, and oceanic rift illustrated.
Figure 2. Caribbean Plate Tectonics (Source: Google Earth).
24 GHC BULLETIN, AUGUST 2012
mInerAloGy of the GeothermAlsystem In neVIs
Faults and fractures are the primary source of permeability in crystalline rocks, however, many active hydrothermal systems exhibit active precipitation of minerals and chemical alteration, which then dictates that fracturing of conducting fluids in the subsurface will often seal and permeability will be lost. In contrast, recurrent brittle fractures and frictional failure in low porosity crystalline rocks produce dilation owing to surface roughness along the fracture wall (Brown, 1987) and the formation of breccias and micro-cracks during fault slip (Lockner and Beeler, 2002).
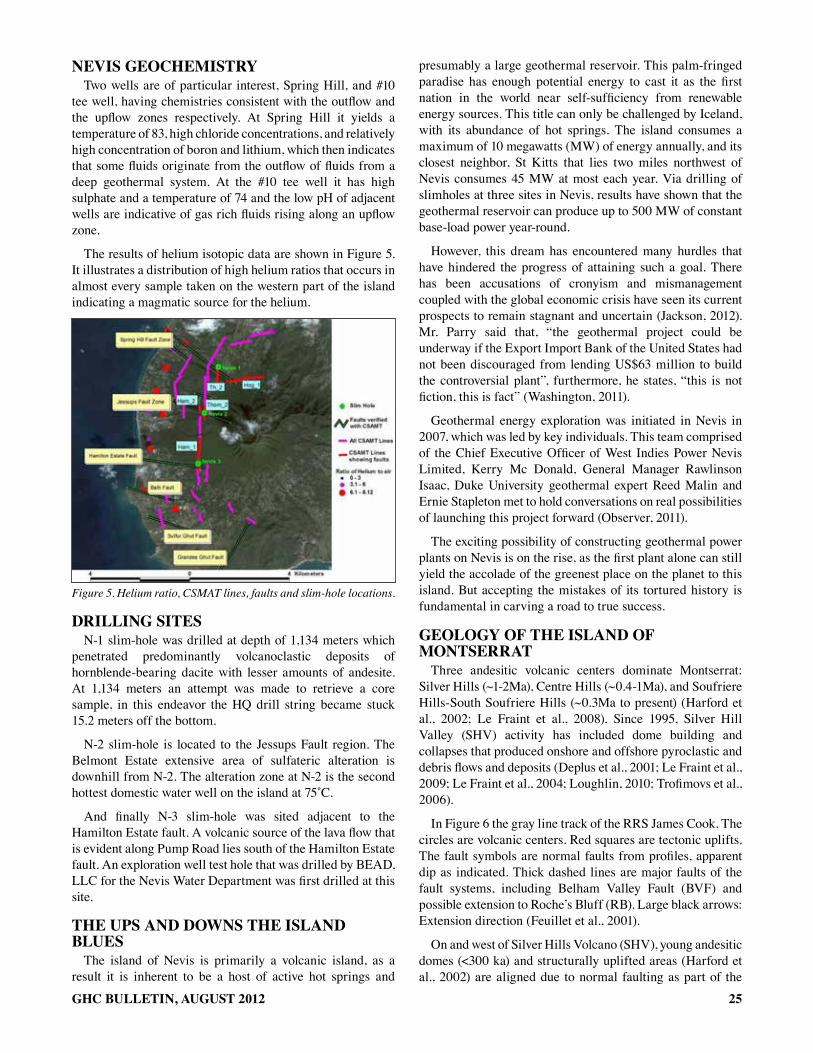
Figure 3 illustrates the ages of eruptions and the mineralogy of Nevis which is rather diverse. At Round Hill which is located in the northwest region of the island is concentrated with hornblende-pyroxene and phyric dacite. At Hurricane Hill, Cades Bay, Saddle Hill Red Cliff, Butler’s Mountain, and Nevis Peak there are pyroxene-phyric dacite, porphyritic dacite, volcanic breccias, porphyritic and orthopyroxene-phyric dacite respectively (Hutton and Nockolds, 1978).
GeoloGy of neVIsRadiometric age dating of the almost exclusively volcanic
rock of the island of Nevis shows a history of island-forming eruptions that initiated 3.4 million years ago, whilst the
youngest only 0.1 million years before present. Pyroclastic rocks with a dacite composition is the dominant rock type hence hinting the presence of a high-level, evolved magmatic center of the type that maintains high heat flux in the near-surface.
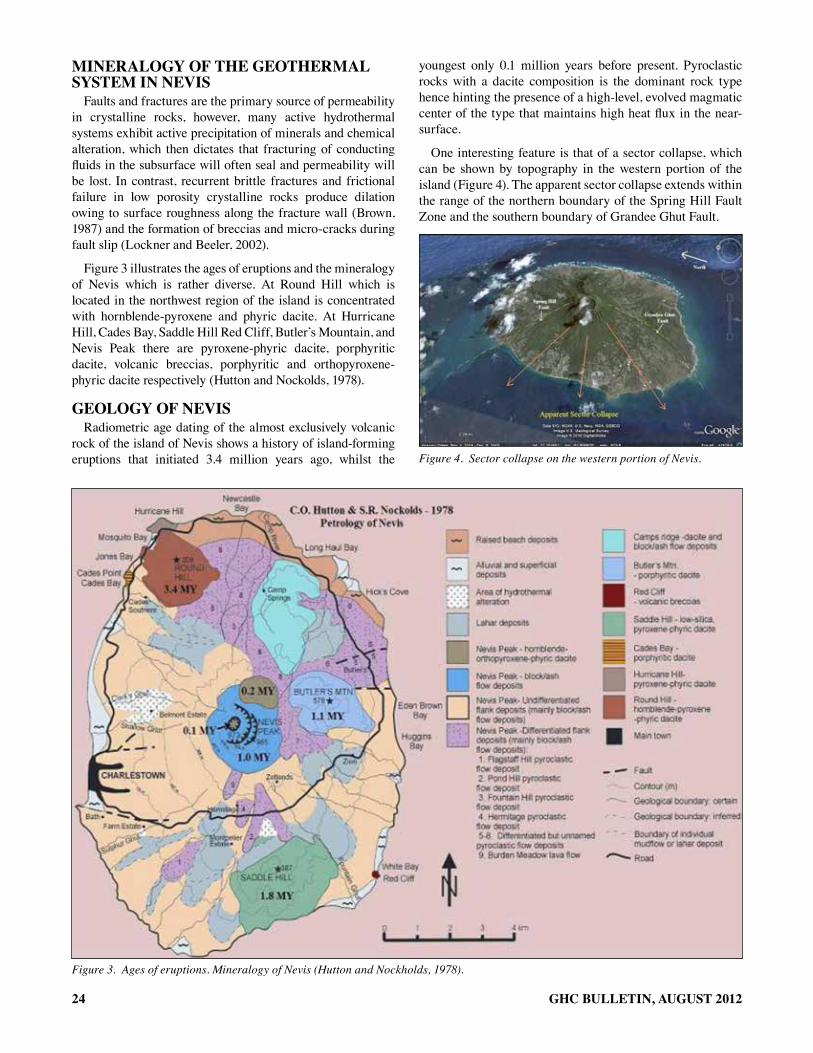
One interesting feature is that of a sector collapse, which can be shown by topography in the western portion of the island (Figure 4). The apparent sector collapse extends within the range of the northern boundary of the Spring Hill Fault Zone and the southern boundary of Grandee Ghut Fault.
Figure 4. Sector collapse on the western portion of Nevis.
Figure 3. Ages of eruptions. Mineralogy of Nevis (Hutton and Nockholds, 1978).
25GHC BULLETIN, AUGUST 2012
neVIs GeochemIstryTwo wells are of particular interest, Spring Hill, and #10
tee well, having chemistries consistent with the outflow and the upflow zones respectively. At Spring Hill it yields a temperature of 83, high chloride concentrations, and relatively high concentration of boron and lithium, which then indicates that some fluids originate from the outflow of fluids from a deep geothermal system. At the #10 tee well it has high sulphate and a temperature of 74 and the low pH of adjacent wells are indicative of gas rich fluids rising along an upflow zone.
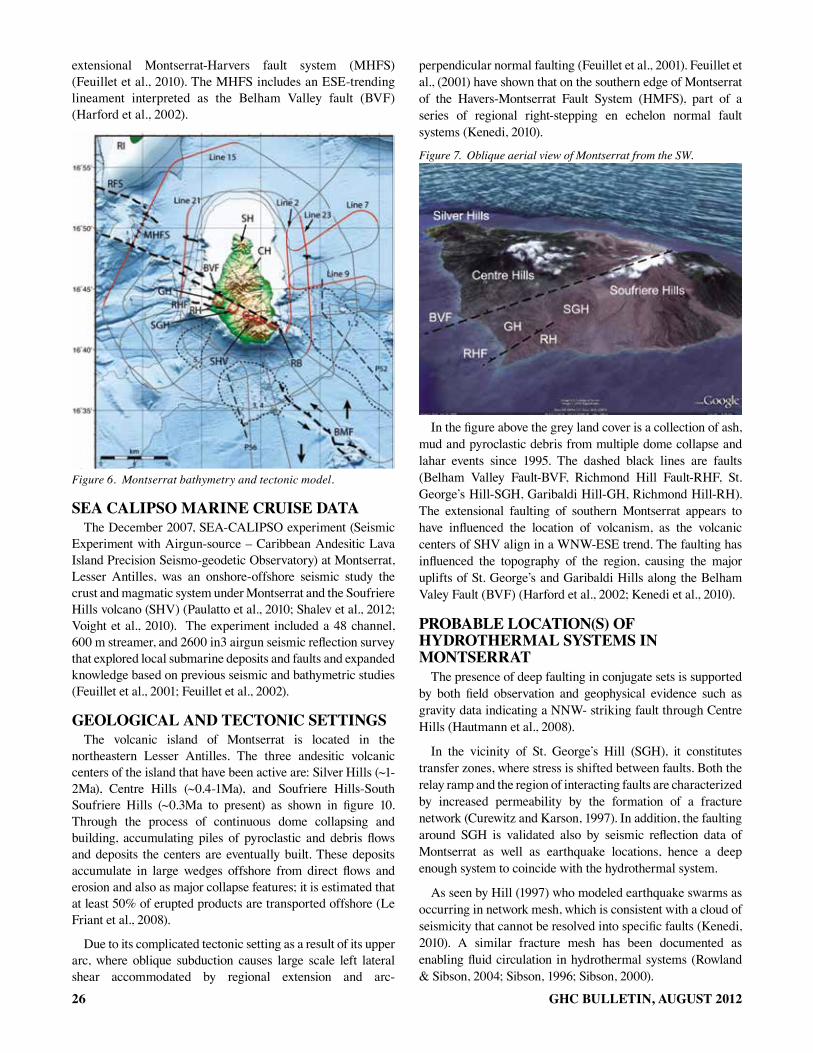
The results of helium isotopic data are shown in Figure 5. It illustrates a distribution of high helium ratios that occurs in almost every sample taken on the western part of the island indicating a magmatic source for the helium.
Figure 5. Helium ratio, CSMAT lines, faults and slim-hole locations.
drIllInG sItesN-1 slim-hole was drilled at depth of 1,134 meters which
penetrated predominantly volcanoclastic deposits of hornblende-bearing dacite with lesser amounts of andesite. At 1,134 meters an attempt was made to retrieve a core sample, in this endeavor the HQ drill string became stuck 15.2 meters off the bottom.
N-2 slim-hole is located to the Jessups Fault region. The Belmont Estate extensive area of sulfateric alteration is downhill from N-2. The alteration zone at N-2 is the second hottest domestic water well on the island at 75˚C.
And finally N-3 slim-hole was sited adjacent to the Hamilton Estate fault. A volcanic source of the lava flow that is evident along Pump Road lies south of the Hamilton Estate fault. An exploration well test hole that was drilled by BEAD, LLC for the Nevis Water Department was first drilled at this site.
the ups And downs the IslAnd blues
The island of Nevis is primarily a volcanic island, as a result it is inherent to be a host of active hot springs and
presumably a large geothermal reservoir. This palm-fringed paradise has enough potential energy to cast it as the first nation in the world near self-sufficiency from renewable energy sources. This title can only be challenged by Iceland, with its abundance of hot springs. The island consumes a maximum of 10 megawatts (MW) of energy annually, and its closest neighbor, St Kitts that lies two miles northwest of Nevis consumes 45 MW at most each year. Via drilling of slimholes at three sites in Nevis, results have shown that the geothermal reservoir can produce up to 500 MW of constant base-load power year-round.
However, this dream has encountered many hurdles that have hindered the progress of attaining such a goal. There has been accusations of cronyism and mismanagement coupled with the global economic crisis have seen its current prospects to remain stagnant and uncertain (Jackson, 2012). Mr. Parry said that, “the geothermal project could be underway if the Export Import Bank of the United States had not been discouraged from lending US$63 million to build the controversial plant”, furthermore, he states, “this is not fiction, this is fact” (Washington, 2011).
Geothermal energy exploration was initiated in Nevis in 2007, which was led by key individuals. This team comprised of the Chief Executive Officer of West Indies Power Nevis Limited, Kerry Mc Donald, General Manager Rawlinson Isaac, Duke University geothermal expert Reed Malin and Ernie Stapleton met to hold conversations on real possibilities of launching this project forward (Observer, 2011).
The exciting possibility of constructing geothermal power plants on Nevis is on the rise, as the first plant alone can still yield the accolade of the greenest place on the planet to this island. But accepting the mistakes of its tortured history is fundamental in carving a road to true success.
GeoloGy of the IslAnd of montserrAt
Three andesitic volcanic centers dominate Montserrat: Silver Hills (~1-2Ma), Centre Hills (~0.4-1Ma), and Soufriere Hills-South Soufriere Hills (~0.3Ma to present) (Harford et al., 2002; Le Fraint et al., 2008). Since 1995, Silver Hill Valley (SHV) activity has included dome building and collapses that produced onshore and offshore pyroclastic and debris flows and deposits (Deplus et al., 2001; Le Fraint et al., 2009; Le Fraint et al., 2004; Loughlin, 2010; Trofimovs et al., 2006).
In Figure 6 the gray line track of the RRS James Cook. The circles are volcanic centers. Red squares are tectonic uplifts. The fault symbols are normal faults from profiles, apparent dip as indicated. Thick dashed lines are major faults of the fault systems, including Belham Valley Fault (BVF) and possible extension to Roche’s Bluff (RB). Large black arrows: Extension direction (Feuillet et al., 2001).
On and west of Silver Hills Volcano (SHV), young andesitic domes (<300 ka) and structurally uplifted areas (Harford et al., 2002) are aligned due to normal faulting as part of the
26 GHC BULLETIN, AUGUST 2012
extensional Montserrat-Harvers fault system (MHFS) (Feuillet et al., 2010). The MHFS includes an ESE-trending lineament interpreted as the Belham Valley fault (BVF) (Harford et al., 2002).
Figure 6. Montserrat bathymetry and tectonic model.
seA cAlIpso mArIne cruIse dAtAThe December 2007, SEA-CALIPSO experiment (Seismic
Experiment with Airgun-source – Caribbean Andesitic Lava Island Precision Seismo-geodetic Observatory) at Montserrat, Lesser Antilles, was an onshore-offshore seismic study the crust and magmatic system under Montserrat and the Soufriere Hills volcano (SHV) (Paulatto et al., 2010; Shalev et al., 2012; Voight et al., 2010). The experiment included a 48 channel, 600 m streamer, and 2600 in3 airgun seismic reflection survey that explored local submarine deposits and faults and expanded knowledge based on previous seismic and bathymetric studies (Feuillet et al., 2001; Feuillet et al., 2002).
GeoloGIcAl And tectonIc settInGsThe volcanic island of Montserrat is located in the
northeastern Lesser Antilles. The three andesitic volcanic centers of the island that have been active are: Silver Hills (~1-2Ma), Centre Hills (~0.4-1Ma), and Soufriere Hills-South Soufriere Hills (~0.3Ma to present) as shown in figure 10. Through the process of continuous dome collapsing and building, accumulating piles of pyroclastic and debris flows and deposits the centers are eventually built. These deposits accumulate in large wedges offshore from direct flows and erosion and also as major collapse features; it is estimated that at least 50% of erupted products are transported offshore (Le Friant et al., 2008).
Due to its complicated tectonic setting as a result of its upper arc, where oblique subduction causes large scale left lateral shear accommodated by regional extension and arc-
perpendicular normal faulting (Feuillet et al., 2001). Feuillet et al., (2001) have shown that on the southern edge of Montserrat of the Havers-Montserrat Fault System (HMFS), part of a series of regional right-stepping en echelon normal fault systems (Kenedi, 2010).
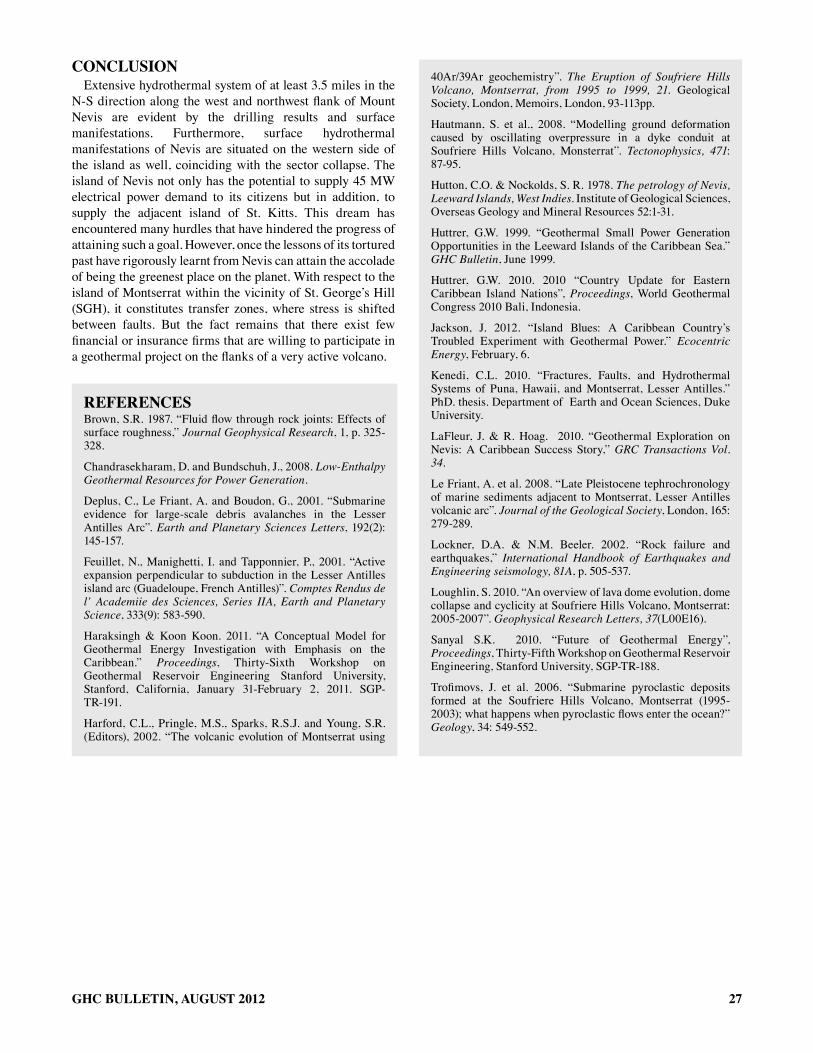
Figure 7. Oblique aerial view of Montserrat from the SW.
In the figure above the grey land cover is a collection of ash, mud and pyroclastic debris from multiple dome collapse and lahar events since 1995. The dashed black lines are faults (Belham Valley Fault-BVF, Richmond Hill Fault-RHF, St. George’s Hill-SGH, Garibaldi Hill-GH, Richmond Hill-RH). The extensional faulting of southern Montserrat appears to have influenced the location of volcanism, as the volcanic centers of SHV align in a WNW-ESE trend. The faulting has influenced the topography of the region, causing the major uplifts of St. George’s and Garibaldi Hills along the Belham Valey Fault (BVF) (Harford et al., 2002; Kenedi et al., 2010).
probAble locAtIon(s) of hydrothermAl systems In montserrAt
The presence of deep faulting in conjugate sets is supported by both field observation and geophysical evidence such as gravity data indicating a NNW- striking fault through Centre Hills (Hautmann et al., 2008).
In the vicinity of St. George’s Hill (SGH), it constitutes transfer zones, where stress is shifted between faults. Both the relay ramp and the region of interacting faults are characterized by increased permeability by the formation of a fracture network (Curewitz and Karson, 1997). In addition, the faulting around SGH is validated also by seismic reflection data of Montserrat as well as earthquake locations, hence a deep enough system to coincide with the hydrothermal system.
As seen by Hill (1997) who modeled earthquake swarms as occurring in network mesh, which is consistent with a cloud of seismicity that cannot be resolved into specific faults (Kenedi, 2010). A similar fracture mesh has been documented as enabling fluid circulation in hydrothermal systems (Rowland & Sibson, 2004; Sibson, 1996; Sibson, 2000).
27GHC BULLETIN, AUGUST 2012
conclusIonExtensive hydrothermal system of at least 3.5 miles in the
N-S direction along the west and northwest flank of Mount Nevis are evident by the drilling results and surface manifestations. Furthermore, surface hydrothermal manifestations of Nevis are situated on the western side of the island as well, coinciding with the sector collapse. The island of Nevis not only has the potential to supply 45 MW electrical power demand to its citizens but in addition, to supply the adjacent island of St. Kitts. This dream has encountered many hurdles that have hindered the progress of attaining such a goal. However, once the lessons of its tortured past have rigorously learnt from Nevis can attain the accolade of being the greenest place on the planet. With respect to the island of Montserrat within the vicinity of St. George’s Hill (SGH), it constitutes transfer zones, where stress is shifted between faults. But the fact remains that there exist few financial or insurance firms that are willing to participate in a geothermal project on the flanks of a very active volcano.
referencesBrown, S.R. 1987. “Fluid flow through rock joints: Effects of surface roughness,” Journal Geophysical Research, 1, p. 325-328.
Chandrasekharam, D. and Bundschuh, J., 2008. Low-Enthalpy Geothermal Resources for Power Generation.
Deplus, C., Le Friant, A. and Boudon, G., 2001. “Submarine evidence for large-scale debris avalanches in the Lesser Antilles Arc”. Earth and Planetary Sciences Letters, 192(2): 145-157.
Feuillet, N., Manighetti, I. and Tapponnier, P., 2001. “Active expansion perpendicular to subduction in the Lesser Antilles island arc (Guadeloupe, French Antilles)”. Comptes Rendus de l’ Academiie des Sciences, Series IIA, Earth and Planetary Science, 333(9): 583-590.
Haraksingh & Koon Koon. 2011. “A Conceptual Model for Geothermal Energy Investigation with Emphasis on the Caribbean.” Proceedings, Thirty-Sixth Workshop on Geothermal Reservoir Engineering Stanford University, Stanford, California, January 31-February 2, 2011. SGP-TR-191.
Harford, C.L., Pringle, M.S., Sparks, R.S.J. and Young, S.R. (Editors), 2002. “The volcanic evolution of Montserrat using
40Ar/39Ar geochemistry”. The Eruption of Soufriere Hills Volcano, Montserrat, from 1995 to 1999, 21. Geological Society, London, Memoirs, London, 93-113pp.
Hautmann, S. et al., 2008. “Modelling ground deformation caused by oscillating overpressure in a dyke conduit at Soufriere Hills Volcano, Monsterrat”. Tectonophysics, 471: 87-95.
Hutton, C.O. & Nockolds, S. R. 1978. The petrology of Nevis, Leeward Islands, West Indies. Institute of Geological Sciences, Overseas Geology and Mineral Resources 52:1-31.
Huttrer, G.W. 1999. “Geothermal Small Power Generation Opportunities in the Leeward Islands of the Caribbean Sea.” GHC Bulletin, June 1999.
Huttrer, G.W. 2010. 2010 “Country Update for Eastern Caribbean Island Nations”, Proceedings, World Geothermal Congress 2010 Bali, Indonesia.
Jackson, J. 2012. “Island Blues: A Caribbean Country’s Troubled Experiment with Geothermal Power.” Ecocentric Energy, February, 6.
Kenedi, C.L. 2010. “Fractures, Faults, and Hydrothermal Systems of Puna, Hawaii, and Montserrat, Lesser Antilles.” PhD. thesis. Department of Earth and Ocean Sciences, Duke University.
LaFleur, J. & R. Hoag. 2010. “Geothermal Exploration on Nevis: A Caribbean Success Story,” GRC Transactions Vol. 34.
Le Friant, A. et al. 2008. “Late Pleistocene tephrochronology of marine sediments adjacent to Montserrat, Lesser Antilles volcanic arc”. Journal of the Geological Society, London, 165: 279-289.
Lockner, D.A. & N.M. Beeler. 2002. “Rock failure and earthquakes,” International Handbook of Earthquakes and Engineering seismology, 81A, p. 505-537.
Loughlin, S. 2010. “An overview of lava dome evolution, dome collapse and cyclicity at Soufriere Hills Volcano, Montserrat: 2005-2007”. Geophysical Research Letters, 37(L00E16).
Sanyal S.K. 2010. “Future of Geothermal Energy”, Proceedings, Thirty-Fifth Workshop on Geothermal Reservoir Engineering, Stanford University, SGP-TR-188.
Trofimovs, J. et al. 2006. “Submarine pyroclastic deposits formed at the Soufriere Hills Volcano, Montserrat (1995-2003); what happens when pyroclastic flows enter the ocean?” Geology, 34: 549-552.
28 GHC BULLETIN, AUGUST 2012
Geothermal develoPmeNt roadmaP for the KiNGdom of saudi araBiaBasheer Hashem, King Abdullah City for Atomic and Renewable Energy, Saudi Arabia
Sustainable development is defined as development that meets the needs of the present without compromising the ability of future generations to meet their own needs. Despite the availability of some potentially resources-rich geothermal locations, the Kingdom of Saudi Arabia has not undertaken any serious geothermal projects. With the growing demand on power, the kingdom has initiated a renewable energy program aimed towards reducing dependency on fossil fuel to build the country’s future. Providing a holistic roadmap that identifies critical elements for the effective utilization of geothermal potential in the Kingdom of Saudi Arabia is an essential step towards a healthy and sustained energy development program.
IntroductIonMuch of today’s energy in the Kingdom of Saudi Arabia
is derived from finite fossil fuel sources. Dependency on fossil fuel for future economic growth is not a sustainable option.
Economic growth in the Kingdom will lead to a rapid increase in energy demand over the coming decades. Sustainable development must at minimum meet the needs of the present without compromising the ability of future generations to meet their own needs.
Current oil prices allow the Kingdom of Saudi Arabia to actively develop resource rich geothermal locations to offer substantial advantages as they are a clean, stable and indigenous supply of energy.
To achieve this, the Kingdom of Saudi Arabia has created King Abdullah City for Atomic and Renewable Energy (K.A.CARE) tasked with the development of renewable resources and enabling renewable development.
GeothermAl resourceSaudi Arabia is among the most geothermally active
countries in the Middle East as preliminary estimates indicate potential for several thousand MW, electric and thermal, of clean, sustainable and affordable energy Still, the geothermal resources remain untapped . A recent report on geothermal energy shows that Saudi Arabia is rich in terms of various geological features, with hot springs discovered in the southern part of the country as well as geological reconnaissance of a large volcanic are in the Western Region (Figure 2). These areas show geothermal activity which takes the form of shallow water wells with elevated temperatures, fumaroles and hot springs with visible steam columns.
Due to the fact that the Kingdom of Saudi Arabia is a major oil producing nation, renewable energy potentials have not yet received adequate attention. Like all types of
energy options, the use of geothermal power is influenced by a set of factors that could affect its potential or exploitation. Political, financial, social, and educational aspects of geothermal project development must be established to allow the effective deployment of these projects.
Figure 1. Map of Kingdom of Saudi Arabia.
Figure 2. Properties of known thermal springs in KSA.
table 1. Geothermal properties of ksA.Sedimentary Infill
Rift Escarpment Location (Harrat)
Heat Source Regional heat gradient
Rift gradient with heat upflow
Basaltic volcanic magma chambers
Temperature Low enthalpy (<140˚C)
Medium enthalpy (<180˚C)
High enthalpy (>180˚C)
Water Availability
High (sedimentary reservoirs)
Medium (high vertical permeability)
Low (fissure-dependent)
Locations Eastern Region, Red Sea Coast
Jizan (Ain Al Wagrah), AL-Lith)
Harrats east of the escarpment
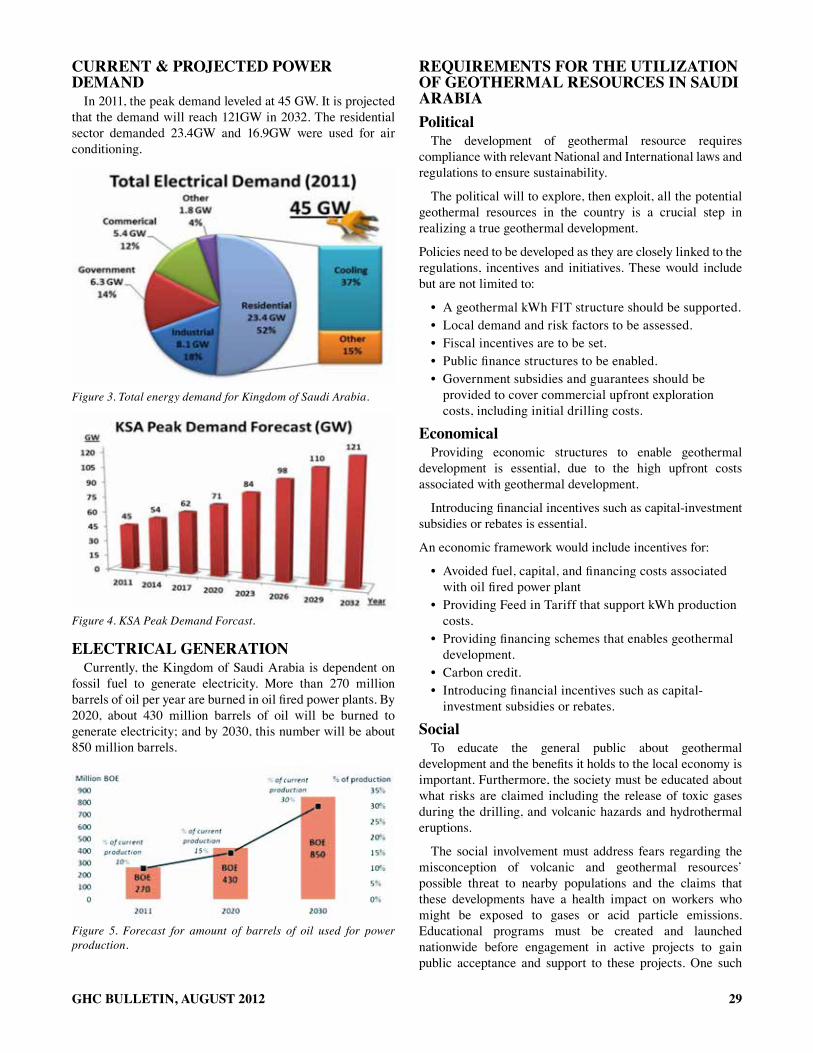
29GHC BULLETIN, AUGUST 2012
current & projected power demAnd
In 2011, the peak demand leveled at 45 GW. It is projected that the demand will reach 121GW in 2032. The residential sector demanded 23.4GW and 16.9GW were used for air conditioning.
Figure 3. Total energy demand for Kingdom of Saudi Arabia.
Figure 4. KSA Peak Demand Forcast.
electrIcAl GenerAtIonCurrently, the Kingdom of Saudi Arabia is dependent on
fossil fuel to generate electricity. More than 270 million barrels of oil per year are burned in oil fired power plants. By 2020, about 430 million barrels of oil will be burned to generate electricity; and by 2030, this number will be about 850 million barrels.
Figure 5. Forecast for amount of barrels of oil used for power production.
requIrements for the utIlIZAtIon of GeothermAl resources In sAudIArAbIApolitical
The development of geothermal resource requires compliance with relevant National and International laws and regulations to ensure sustainability.
The political will to explore, then exploit, all the potential geothermal resources in the country is a crucial step in realizing a true geothermal development.
Policies need to be developed as they are closely linked to the regulations, incentives and initiatives. These would include but are not limited to:
• A geothermal kWh FIT structure should be supported.• Local demand and risk factors to be assessed.• Fiscal incentives are to be set.• Public finance structures to be enabled.• Government subsidies and guarantees should be
provided to cover commercial upfront exploration costs, including initial drilling costs.
economicalProviding economic structures to enable geothermal
development is essential, due to the high upfront costs associated with geothermal development.
Introducing financial incentives such as capital-investment subsidies or rebates is essential.
An economic framework would include incentives for:
• Avoided fuel, capital, and financing costs associated with oil fired power plant
• Providing Feed in Tariff that support kWh production costs.
• Providing financing schemes that enables geothermal development.
• Carbon credit.• Introducing financial incentives such as capital-
investment subsidies or rebates.
socialTo educate the general public about geothermal
development and the benefits it holds to the local economy is important. Furthermore, the society must be educated about what risks are claimed including the release of toxic gases during the drilling, and volcanic hazards and hydrothermal eruptions.
The social involvement must address fears regarding the misconception of volcanic and geothermal resources’ possible threat to nearby populations and the claims that these developments have a health impact on workers who might be exposed to gases or acid particle emissions. Educational programs must be created and launched nationwide before engagement in active projects to gain public acceptance and support to these projects. One such
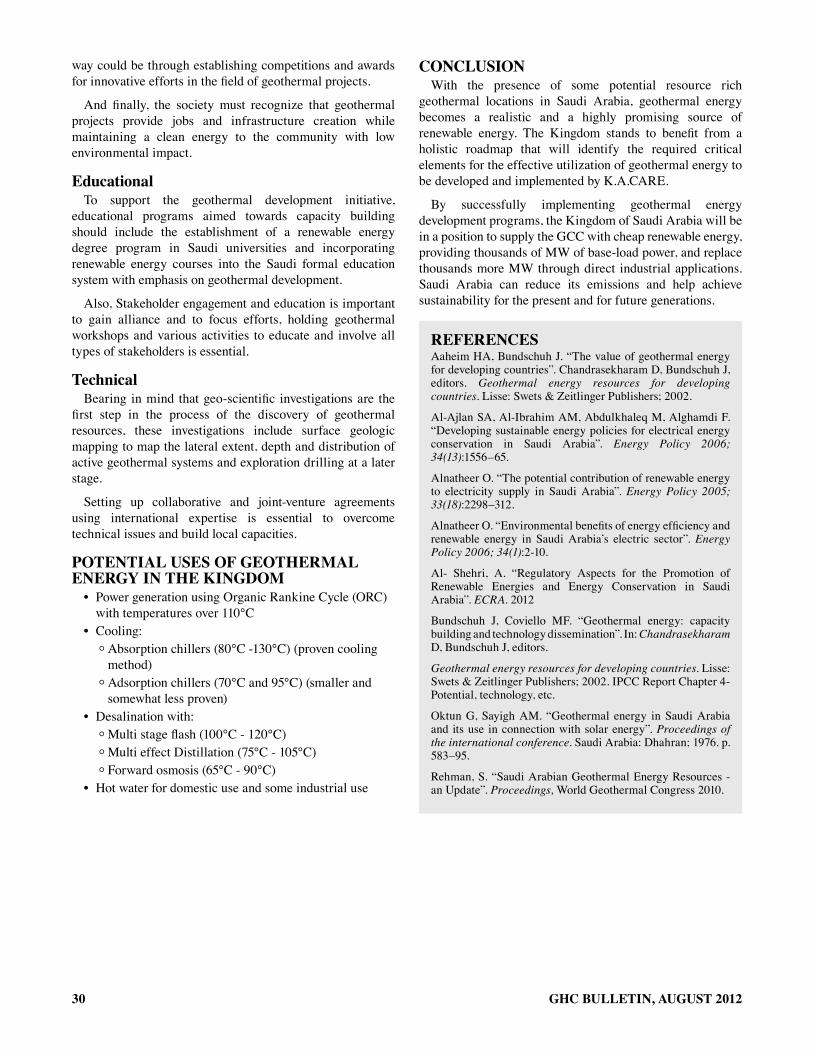
30 GHC BULLETIN, AUGUST 2012
way could be through establishing competitions and awards for innovative efforts in the field of geothermal projects.
And finally, the society must recognize that geothermal projects provide jobs and infrastructure creation while maintaining a clean energy to the community with low environmental impact.
educationalTo support the geothermal development initiative,
educational programs aimed towards capacity building should include the establishment of a renewable energy degree program in Saudi universities and incorporating renewable energy courses into the Saudi formal education system with emphasis on geothermal development.
Also, Stakeholder engagement and education is important to gain alliance and to focus efforts, holding geothermal workshops and various activities to educate and involve all types of stakeholders is essential.
technicalBearing in mind that geo-scientific investigations are the
first step in the process of the discovery of geothermal resources, these investigations include surface geologic mapping to map the lateral extent, depth and distribution of active geothermal systems and exploration drilling at a later stage.
Setting up collaborative and joint-venture agreements using international expertise is essential to overcome technical issues and build local capacities.
potentIAl uses of GeothermAl enerGy In the kInGdom
• Power generation using Organic Rankine Cycle (ORC) with temperatures over 110°C
• Cooling:g Absorption chillers (80°C -130°C) (proven cooling
method)g Adsorption chillers (70°C and 95°C) (smaller and
somewhat less proven)• Desalination with:g Multi stage flash (100°C - 120°C)g Multi effect Distillation (75°C - 105°C)g Forward osmosis (65°C - 90°C)
• Hot water for domestic use and some industrial use
conclusIonWith the presence of some potential resource rich
geothermal locations in Saudi Arabia, geothermal energy becomes a realistic and a highly promising source of renewable energy. The Kingdom stands to benefit from a holistic roadmap that will identify the required critical elements for the effective utilization of geothermal energy to be developed and implemented by K.A.CARE.
By successfully implementing geothermal energy development programs, the Kingdom of Saudi Arabia will be in a position to supply the GCC with cheap renewable energy, providing thousands of MW of base-load power, and replace thousands more MW through direct industrial applications. Saudi Arabia can reduce its emissions and help achieve sustainability for the present and for future generations.
referencesAaheim HA, Bundschuh J. “The value of geothermal energy for developing countries”. Chandrasekharam D, Bundschuh J, editors. Geothermal energy resources for developing countries. Lisse: Swets & Zeitlinger Publishers; 2002.
Al-Ajlan SA, Al-Ibrahim AM, Abdulkhaleq M, Alghamdi F. “Developing sustainable energy policies for electrical energy conservation in Saudi Arabia”. Energy Policy 2006; 34(13):1556–65.
Alnatheer O. “The potential contribution of renewable energy to electricity supply in Saudi Arabia”. Energy Policy 2005; 33(18):2298–312.
Alnatheer O. “Environmental benefits of energy efficiency and renewable energy in Saudi Arabia’s electric sector”. Energy Policy 2006; 34(1):2-10.
Al- Shehri, A. “Regulatory Aspects for the Promotion of Renewable Energies and Energy Conservation in Saudi Arabia”. ECRA. 2012
Bundschuh J, Coviello MF. “Geothermal energy: capacity building and technology dissemination”. In: Chandrasekharam D, Bundschuh J, editors.
Geothermal energy resources for developing countries. Lisse: Swets & Zeitlinger Publishers; 2002. IPCC Report Chapter 4- Potential, technology, etc.
Oktun G, Sayigh AM. “Geothermal energy in Saudi Arabia and its use in connection with solar energy”. Proceedings of the international conference. Saudi Arabia: Dhahran; 1976. p. 583–95.
Rehman, S. “Saudi Arabian Geothermal Energy Resources - an Update”. Proceedings, World Geothermal Congress 2010.
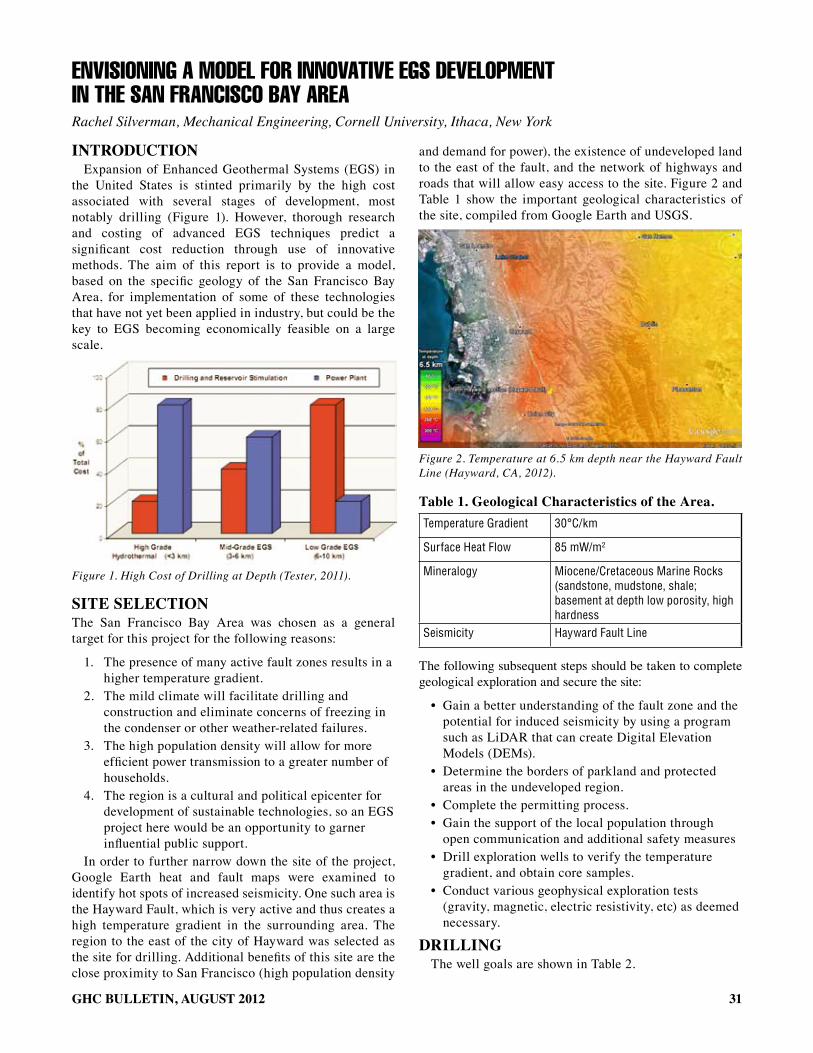
31GHC BULLETIN, AUGUST 2012
eNvisioNiNG a model for iNNovative eGs develoPmeNt iN the saN fraNcisco Bay area Rachel Silverman, Mechanical Engineering, Cornell University, Ithaca, New York
IntroductIonExpansion of Enhanced Geothermal Systems (EGS) in
the United States is stinted primarily by the high cost associated with several stages of development, most notably drilling (Figure 1). However, thorough research and costing of advanced EGS techniques predict a significant cost reduction through use of innovative methods. The aim of this report is to provide a model, based on the specific geology of the San Francisco Bay Area, for implementation of some of these technologies that have not yet been applied in industry, but could be the key to EGS becoming economically feasible on a large scale.
Figure 1. High Cost of Drilling at Depth (Tester, 2011).
sIte selectIonThe San Francisco Bay Area was chosen as a general target for this project for the following reasons:
1. The presence of many active fault zones results in a higher temperature gradient.
2. The mild climate will facilitate drilling and construction and eliminate concerns of freezing in the condenser or other weather-related failures.
3. The high population density will allow for more efficient power transmission to a greater number of households.
4. The region is a cultural and political epicenter for development of sustainable technologies, so an EGS project here would be an opportunity to garner influential public support.
In order to further narrow down the site of the project, Google Earth heat and fault maps were examined to identify hot spots of increased seismicity. One such area is the Hayward Fault, which is very active and thus creates a high temperature gradient in the surrounding area. The region to the east of the city of Hayward was selected as the site for drilling. Additional benefits of this site are the close proximity to San Francisco (high population density
and demand for power), the existence of undeveloped land to the east of the fault, and the network of highways and roads that will allow easy access to the site. Figure 2 and Table 1 show the important geological characteristics of the site, compiled from Google Earth and USGS.
Figure 2. Temperature at 6.5 km depth near the Hayward Fault Line (Hayward, CA, 2012).
table 1. Geological characteristics of the Area.Temperature Gradient 30°C/km
Surface Heat Flow 85 mW/m2
Mineralogy Miocene/Cretaceous Marine Rocks (sandstone, mudstone, shale; basement at depth low porosity, high hardness
Seismicity Hayward Fault Line
The following subsequent steps should be taken to complete geological exploration and secure the site:
• Gain a better understanding of the fault zone and the potential for induced seismicity by using a program such as LiDAR that can create Digital Elevation Models (DEMs).
• Determine the borders of parkland and protected areas in the undeveloped region.
• Complete the permitting process.• Gain the support of the local population through
open communication and additional safety measures• Drill exploration wells to verify the temperature
gradient, and obtain core samples.• Conduct various geophysical exploration tests
(gravity, magnetic, electric resistivity, etc) as deemed necessary.
drIllInGThe well goals are shown in Table 2.
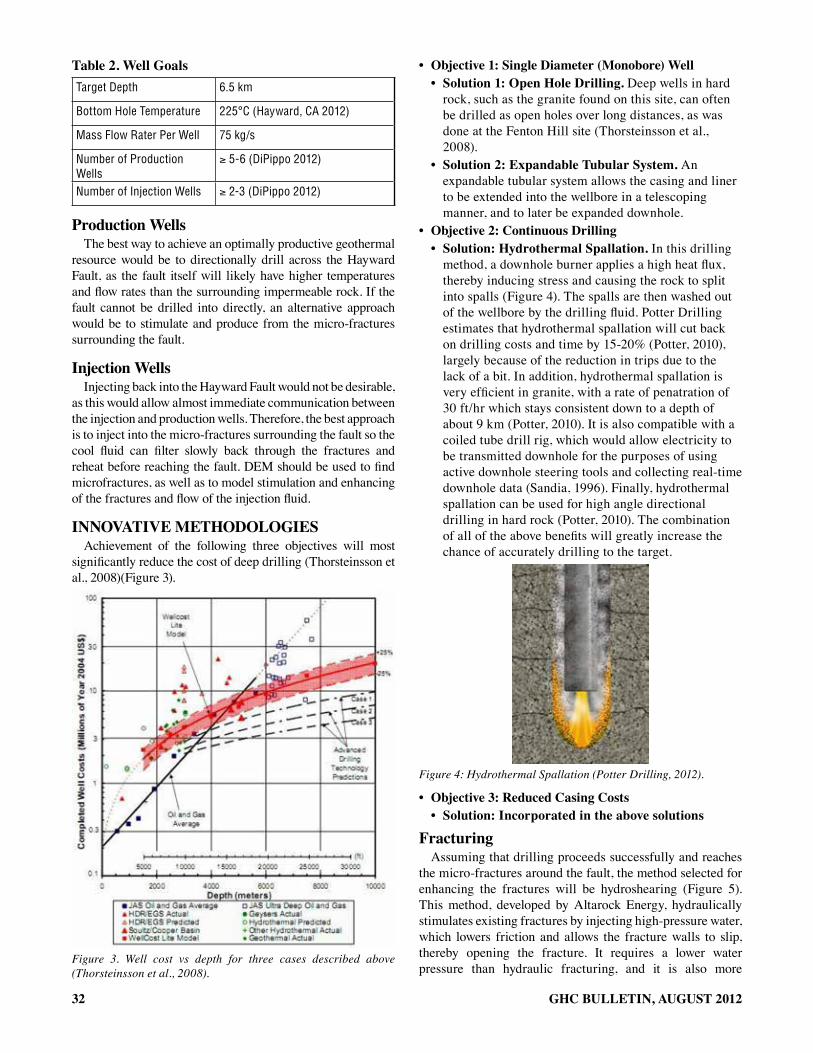
32 GHC BULLETIN, AUGUST 2012
table 2. well GoalsTarget Depth 6.5 km
Bottom Hole Temperature 225°C (Hayward, CA 2012)
Mass Flow Rater Per Well 75 kg/s
Number of Production Wells
≥ 5-6 (DiPippo 2012)
Number of Injection Wells ≥ 2-3 (DiPippo 2012)
production wellsThe best way to achieve an optimally productive geothermal
resource would be to directionally drill across the Hayward Fault, as the fault itself will likely have higher temperatures and flow rates than the surrounding impermeable rock. If the fault cannot be drilled into directly, an alternative approach would be to stimulate and produce from the micro-fractures surrounding the fault.
Injection wellsInjecting back into the Hayward Fault would not be desirable,
as this would allow almost immediate communication between the injection and production wells. Therefore, the best approach is to inject into the micro-fractures surrounding the fault so the cool fluid can filter slowly back through the fractures and reheat before reaching the fault. DEM should be used to find microfractures, as well as to model stimulation and enhancing of the fractures and flow of the injection fluid.
InnoVAtIVe methodoloGIesAchievement of the following three objectives will most
significantly reduce the cost of deep drilling (Thorsteinsson et al., 2008)(Figure 3).
Figure 3. Well cost vs depth for three cases described above (Thorsteinsson et al., 2008).
• Objective1:SingleDiameter(Monobore)Well• Solution1:OpenHoleDrilling. Deep wells in hard
rock, such as the granite found on this site, can often be drilled as open holes over long distances, as was done at the Fenton Hill site (Thorsteinsson et al., 2008).
• Solution2:ExpandableTubularSystem. An expandable tubular system allows the casing and liner to be extended into the wellbore in a telescoping manner, and to later be expanded downhole.
• Objective2:ContinuousDrilling• Solution:HydrothermalSpallation. In this drilling
method, a downhole burner applies a high heat flux, thereby inducing stress and causing the rock to split into spalls (Figure 4). The spalls are then washed out of the wellbore by the drilling fluid. Potter Drilling estimates that hydrothermal spallation will cut back on drilling costs and time by 15-20% (Potter, 2010), largely because of the reduction in trips due to the lack of a bit. In addition, hydrothermal spallation is very efficient in granite, with a rate of penatration of 30 ft/hr which stays consistent down to a depth of about 9 km (Potter, 2010). It is also compatible with a coiled tube drill rig, which would allow electricity to be transmitted downhole for the purposes of using active downhole steering tools and collecting real-time downhole data (Sandia, 1996). Finally, hydrothermal spallation can be used for high angle directional drilling in hard rock (Potter, 2010). The combination of all of the above benefits will greatly increase the chance of accurately drilling to the target.
Figure 4: Hydrothermal Spallation (Potter Drilling, 2012).
• Objective3:ReducedCasingCosts• Solution:Incorporatedintheabovesolutions
fracturingAssuming that drilling proceeds successfully and reaches
the micro-fractures around the fault, the method selected for enhancing the fractures will be hydroshearing (Figure 5). This method, developed by Altarock Energy, hydraulically stimulates existing fractures by injecting high-pressure water, which lowers friction and allows the fracture walls to slip, thereby opening the fracture. It requires a lower water pressure than hydraulic fracturing, and it is also more
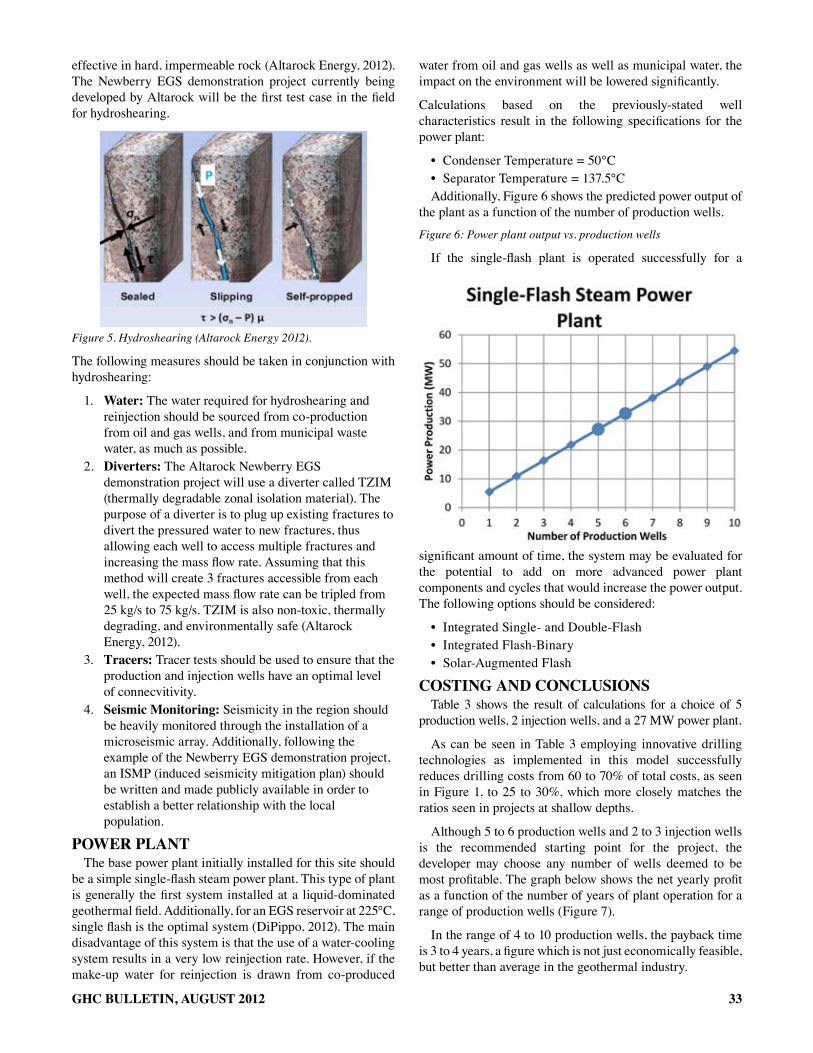
33GHC BULLETIN, AUGUST 2012
effective in hard, impermeable rock (Altarock Energy, 2012). The Newberry EGS demonstration project currently being developed by Altarock will be the first test case in the field for hydroshearing.
Figure 5. Hydroshearing (Altarock Energy 2012).
The following measures should be taken in conjunction with hydroshearing:
1. water: The water required for hydroshearing and reinjection should be sourced from co-production from oil and gas wells, and from municipal waste water, as much as possible.
2. diverters: The Altarock Newberry EGS demonstration project will use a diverter called TZIM (thermally degradable zonal isolation material). The purpose of a diverter is to plug up existing fractures to divert the pressured water to new fractures, thus allowing each well to access multiple fractures and increasing the mass flow rate. Assuming that this method will create 3 fractures accessible from each well, the expected mass flow rate can be tripled from 25 kg/s to 75 kg/s. TZIM is also non-toxic, thermally degrading, and environmentally safe (Altarock Energy, 2012).
3. tracers: Tracer tests should be used to ensure that the production and injection wells have an optimal level of connecvitivity.
4. seismic monitoring: Seismicity in the region should be heavily monitored through the installation of a microseismic array. Additionally, following the example of the Newberry EGS demonstration project, an ISMP (induced seismicity mitigation plan) should be written and made publicly available in order to establish a better relationship with the local population.
power plAntThe base power plant initially installed for this site should
be a simple single-flash steam power plant. This type of plant is generally the first system installed at a liquid-dominated geothermal field. Additionally, for an EGS reservoir at 225°C, single flash is the optimal system (DiPippo, 2012). The main disadvantage of this system is that the use of a water-cooling system results in a very low reinjection rate. However, if the make-up water for reinjection is drawn from co-produced
water from oil and gas wells as well as municipal water, the impact on the environment will be lowered significantly.
Calculations based on the previously-stated well characteristics result in the following specifications for the power plant:
• Condenser Temperature = 50°C• Separator Temperature = 137.5°CAdditionally, Figure 6 shows the predicted power output of
the plant as a function of the number of production wells.
Figure 6: Power plant output vs. production wells
If the single-flash plant is operated successfully for a
significant amount of time, the system may be evaluated for the potential to add on more advanced power plant components and cycles that would increase the power output. The following options should be considered:
• Integrated Single- and Double-Flash• Integrated Flash-Binary• Solar-Augmented Flash
costInG And conclusIonsTable 3 shows the result of calculations for a choice of 5
production wells, 2 injection wells, and a 27 MW power plant.
As can be seen in Table 3 employing innovative drilling technologies as implemented in this model successfully reduces drilling costs from 60 to 70% of total costs, as seen in Figure 1, to 25 to 30%, which more closely matches the ratios seen in projects at shallow depths.
Although 5 to 6 production wells and 2 to 3 injection wells is the recommended starting point for the project, the developer may choose any number of wells deemed to be most profitable. The graph below shows the net yearly profit as a function of the number of years of plant operation for a range of production wells (Figure 7).
In the range of 4 to 10 production wells, the payback time is 3 to 4 years, a figure which is not just economically feasible, but better than average in the geothermal industry.
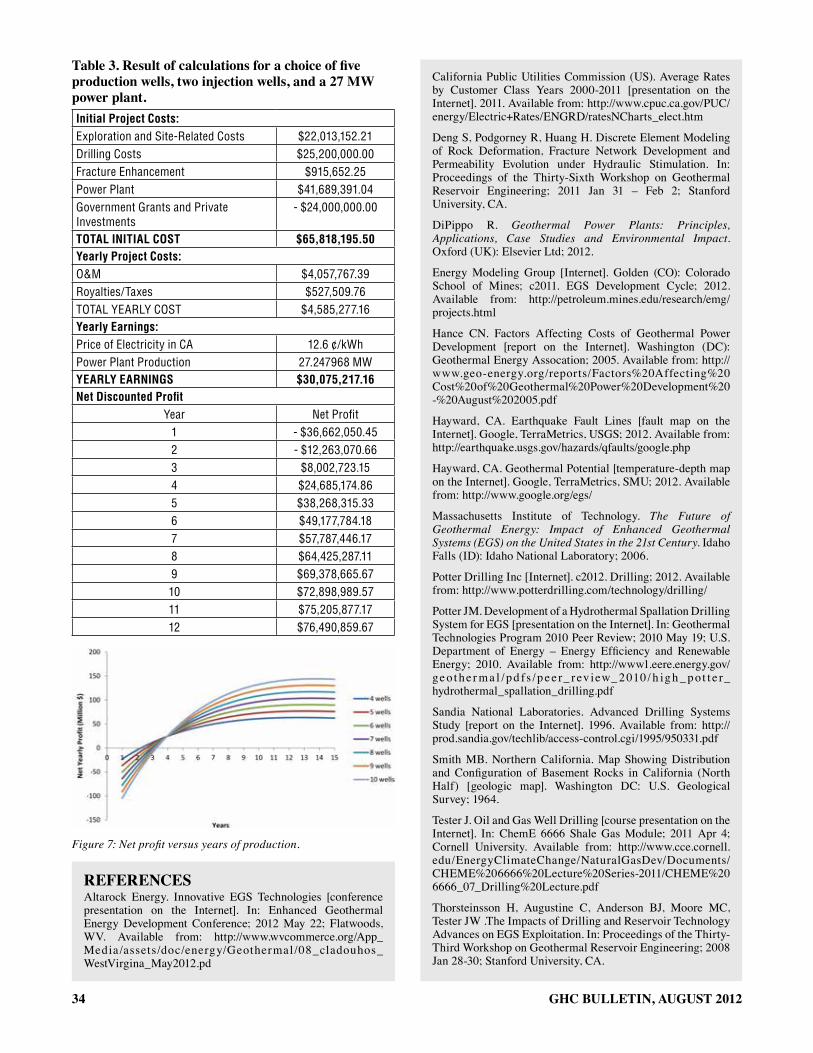
34 GHC BULLETIN, AUGUST 2012
Table3.Resultofcalculationsforachoiceoffiveproduction wells, two injection wells, and a 27 mw power plant.Initial Project Costs:Exploration and Site-Related Costs $22,013,152.21Drilling Costs $25,200,000.00Fracture Enhancement $915,652.25Power Plant $41,689,391.04Government Grants and Private Investments
- $24,000,000.00
TOTAL INITIAL COST $65,818,195.50Yearly Project Costs:O&M $4,057,767.39Royalties/Taxes $527,509.76TOTAL YEARLY COST $4,585,277.16Yearly Earnings:Price of Electricity in CA 12.6 ¢/kWhPower Plant Production 27.247968 MWYEARLY EARNINGS $30,075,217.16Net Discounted Profit
Year Net Profit1 - $36,662,050.452 - $12,263,070.663 $8,002,723.154 $24,685,174.865 $38,268,315.336 $49,177,784.187 $57,787,446.178 $64,425,287.119 $69,378,665.6710 $72,898,989.5711 $75,205,877.1712 $76,490,859.67
Figure 7: Net profit versus years of production.
referencesAltarock Energy. Innovative EGS Technologies [conference presentation on the Internet]. In: Enhanced Geothermal Energy Development Conference; 2012 May 22; Flatwoods, WV. Available from: http://www.wvcommerce.org/App_Media /assets/doc/energy/Geothermal /08_cladouhos_WestVirgina_May2012.pd
California Public Utilities Commission (US). Average Rates by Customer Class Years 2000-2011 [presentation on the Internet]. 2011. Available from: http://www.cpuc.ca.gov/PUC/energy/Electric+Rates/ENGRD/ratesNCharts_elect.htm
Deng S, Podgorney R, Huang H. Discrete Element Modeling of Rock Deformation, Fracture Network Development and Permeability Evolution under Hydraulic Stimulation. In: Proceedings of the Thirty-Sixth Workshop on Geothermal Reservoir Engineering; 2011 Jan 31 – Feb 2; Stanford University, CA.
DiPippo R. Geothermal Power Plants: Principles, Applications, Case Studies and Environmental Impact. Oxford (UK): Elsevier Ltd; 2012.
Energy Modeling Group [Internet]. Golden (CO): Colorado School of Mines; c2011. EGS Development Cycle; 2012. Available from: http://petroleum.mines.edu/research/emg/projects.html
Hance CN. Factors Affecting Costs of Geothermal Power Development [report on the Internet]. Washington (DC): Geothermal Energy Assocation; 2005. Available from: http://www.geo-energy.org/reports/Factors%20Affecting%20Cost%20of%20Geothermal%20Power%20Development%20-%20August%202005.pdf
Hayward, CA. Earthquake Fault Lines [fault map on the Internet]. Google, TerraMetrics, USGS; 2012. Available from: http://earthquake.usgs.gov/hazards/qfaults/google.php
Hayward, CA. Geothermal Potential [temperature-depth map on the Internet]. Google, TerraMetrics, SMU; 2012. Available from: http://www.google.org/egs/
Massachusetts Institute of Technology. The Future of Geothermal Energy: Impact of Enhanced Geothermal Systems (EGS) on the United States in the 21st Century. Idaho Falls (ID): Idaho National Laboratory; 2006.
Potter Drilling Inc [Internet]. c2012. Drilling; 2012. Available from: http://www.potterdrilling.com/technology/drilling/
Potter JM. Development of a Hydrothermal Spallation Drilling System for EGS [presentation on the Internet]. In: Geothermal Technologies Program 2010 Peer Review; 2010 May 19; U.S. Department of Energy – Energy Efficiency and Renewable Energy; 2010. Available from: http://www1.eere.energy.gov/ge o t he r ma l /p d fs /p e e r_ rev iew_ 2 010/ h ig h _ p ot t e r_hydrothermal_spallation_drilling.pdf
Sandia National Laboratories. Advanced Drilling Systems Study [report on the Internet]. 1996. Available from: http://prod.sandia.gov/techlib/access-control.cgi/1995/950331.pdf
Smith MB. Northern California. Map Showing Distribution and Configuration of Basement Rocks in California (North Half) [geologic map]. Washington DC: U.S. Geological Survey; 1964.
Tester J. Oil and Gas Well Drilling [course presentation on the Internet]. In: ChemE 6666 Shale Gas Module; 2011 Apr 4; Cornell University. Available from: http://www.cce.cornell.edu/EnergyClimateChange/NaturalGasDev/Documents/CHEME%206666%20Lecture%20Series-2011/CHEME%206666_07_Drilling%20Lecture.pdf
Thorsteinsson H, Augustine C, Anderson BJ, Moore MC, Tester JW .The Impacts of Drilling and Reservoir Technology Advances on EGS Exploitation. In: Proceedings of the Thirty-Third Workshop on Geothermal Reservoir Engineering; 2008 Jan 28-30; Stanford University, CA.
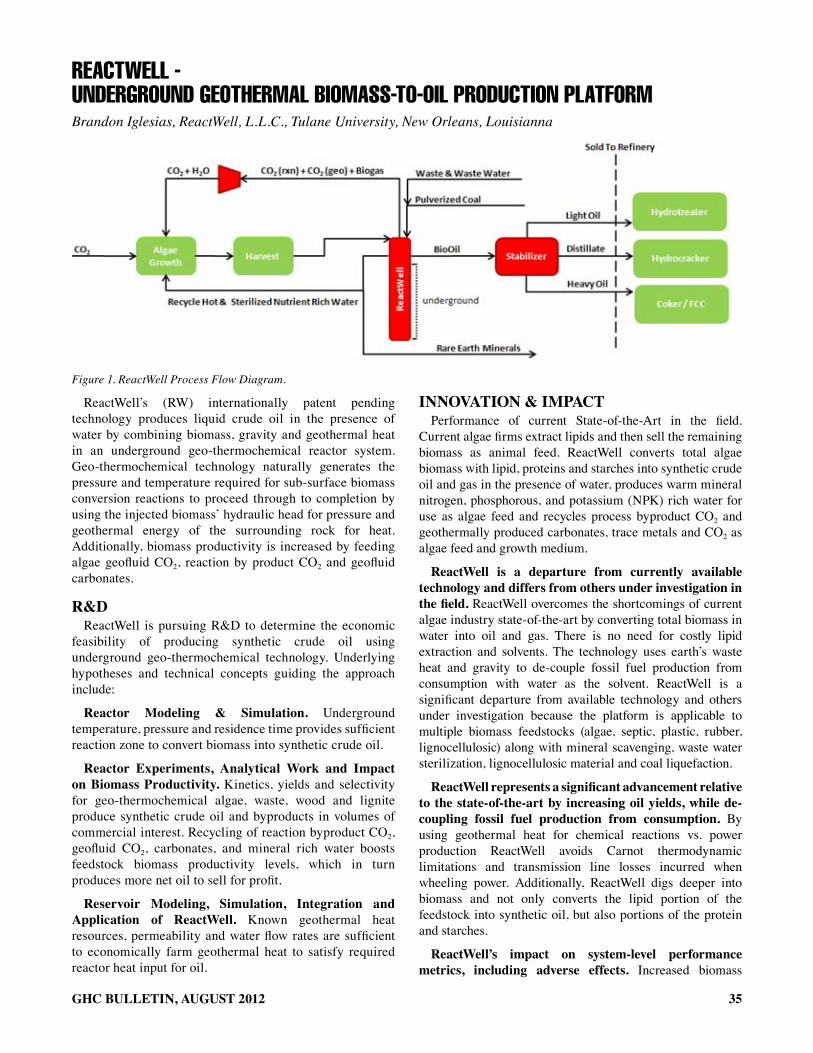
35GHC BULLETIN, AUGUST 2012
reactwell - uNderGrouNd Geothermal Biomass-to-oil ProductioN PlatformBrandon Iglesias, ReactWell, L.L.C., Tulane University, New Orleans, Louisianna
Figure 1. ReactWell Process Flow Diagram.
ReactWell’s (RW) internationally patent pending technology produces liquid crude oil in the presence of water by combining biomass, gravity and geothermal heat in an underground geo-thermochemical reactor system. Geo-thermochemical technology naturally generates the pressure and temperature required for sub-surface biomass conversion reactions to proceed through to completion by using the injected biomass’ hydraulic head for pressure and geothermal energy of the surrounding rock for heat. Additionally, biomass productivity is increased by feeding algae geofluid CO2, reaction by product CO2 and geofluid carbonates.
r&dReactWell is pursuing R&D to determine the economic
feasibility of producing synthetic crude oil using underground geo-thermochemical technology. Underlying hypotheses and technical concepts guiding the approach include:
reactor modeling & simulation. Underground temperature, pressure and residence time provides sufficient reaction zone to convert biomass into synthetic crude oil.
reactor experiments, Analytical work and Impact on biomass productivity. Kinetics, yields and selectivity for geo-thermochemical algae, waste, wood and lignite produce synthetic crude oil and byproducts in volumes of commercial interest. Recycling of reaction byproduct CO2, geofluid CO2, carbonates, and mineral rich water boosts feedstock biomass productivity levels, which in turn produces more net oil to sell for profit.
reservoir modeling, simulation, Integration and Application of reactwell. Known geothermal heat resources, permeability and water flow rates are sufficient to economically farm geothermal heat to satisfy required reactor heat input for oil.
InnoVAtIon & ImpActPerformance of current State-of-the-Art in the field.
Current algae firms extract lipids and then sell the remaining biomass as animal feed. ReactWell converts total algae biomass with lipid, proteins and starches into synthetic crude oil and gas in the presence of water, produces warm mineral nitrogen, phosphorous, and potassium (NPK) rich water for use as algae feed and recycles process byproduct CO2 and geothermally produced carbonates, trace metals and CO2 as algae feed and growth medium.
reactwell is a departure from currently available technology and differs from others under investigation in thefield. ReactWell overcomes the shortcomings of current algae industry state-of-the-art by converting total biomass in water into oil and gas. There is no need for costly lipid extraction and solvents. The technology uses earth’s waste heat and gravity to de-couple fossil fuel production from consumption with water as the solvent. ReactWell is a significant departure from available technology and others under investigation because the platform is applicable to multiple biomass feedstocks (algae, septic, plastic, rubber, lignocellulosic) along with mineral scavenging, waste water sterilization, lignocellulosic material and coal liquefaction.
ReactWellrepresentsasignificantadvancementrelativeto the state-of-the-art by increasing oil yields, while de-coupling fossil fuel production from consumption. By using geothermal heat for chemical reactions vs. power production ReactWell avoids Carnot thermodynamic limitations and transmission line losses incurred when wheeling power. Additionally, ReactWell digs deeper into biomass and not only converts the lipid portion of the feedstock into synthetic oil, but also portions of the protein and starches.
reactwell’s impact on system-level performance metrics, including adverse effects. Increased biomass
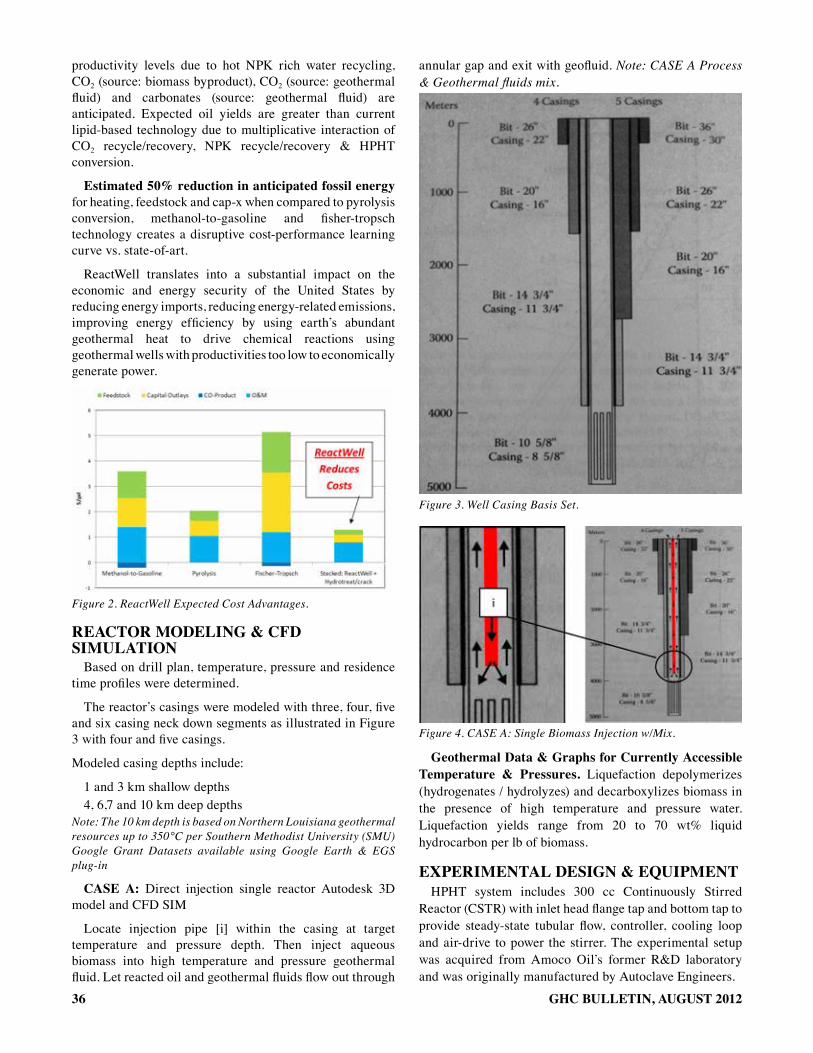
36 GHC BULLETIN, AUGUST 2012
productivity levels due to hot NPK rich water recycling, CO2 (source: biomass byproduct), CO2 (source: geothermal fluid) and carbonates (source: geothermal fluid) are anticipated. Expected oil yields are greater than current lipid-based technology due to multiplicative interaction of CO2 recycle/recovery, NPK recycle/recovery & HPHT conversion.
estimated 50% reduction in anticipated fossil energy for heating, feedstock and cap-x when compared to pyrolysis conversion, methanol-to-gasoline and fisher-tropsch technology creates a disruptive cost-performance learning curve vs. state-of-art.
ReactWell translates into a substantial impact on the economic and energy security of the United States by reducing energy imports, reducing energy-related emissions, improving energy efficiency by using earth’s abundant geothermal heat to drive chemical reactions using geothermal wells with productivities too low to economically generate power.
Figure 2. ReactWell Expected Cost Advantages.
reActor modelInG & cfd sImulAtIon
Based on drill plan, temperature, pressure and residence time profiles were determined.
The reactor’s casings were modeled with three, four, five and six casing neck down segments as illustrated in Figure 3 with four and five casings.
Modeled casing depths include:
1 and 3 km shallow depths4, 6,7 and 10 km deep depths
Note: The 10 km depth is based on Northern Louisiana geothermal resources up to 350°C per Southern Methodist University (SMU) Google Grant Datasets available using Google Earth & EGS plug-in
cAse A: Direct injection single reactor Autodesk 3D model and CFD SIM
Locate injection pipe [i] within the casing at target temperature and pressure depth. Then inject aqueous biomass into high temperature and pressure geothermal fluid. Let reacted oil and geothermal fluids flow out through
annular gap and exit with geofluid. Note: CASE A Process & Geothermal fluids mix.
Figure 3. Well Casing Basis Set.
Figure 4. CASE A: Single Biomass Injection w/Mix.
Geothermal data & Graphs for currently Accessible temperature & pressures. Liquefaction depolymerizes (hydrogenates / hydrolyzes) and decarboxylizes biomass in the presence of high temperature and pressure water. Liquefaction yields range from 20 to 70 wt% liquid hydrocarbon per lb of biomass.
experImentAl desIGn & equIpmentHPHT system includes 300 cc Continuously Stirred
Reactor (CSTR) with inlet head flange tap and bottom tap to provide steady-state tubular flow, controller, cooling loop and air-drive to power the stirrer. The experimental setup was acquired from Amoco Oil’s former R&D laboratory and was originally manufactured by Autoclave Engineers.
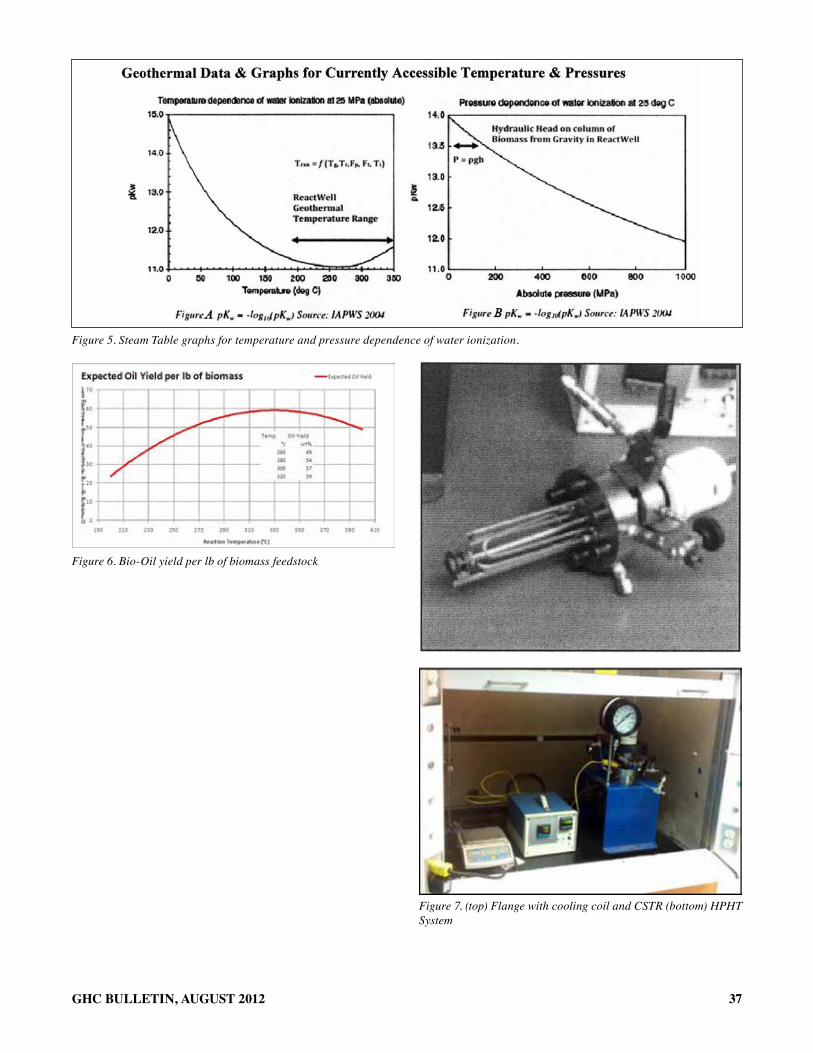
37GHC BULLETIN, AUGUST 2012
Figure 5. Steam Table graphs for temperature and pressure dependence of water ionization.
Figure 7. (top) Flange with cooling coil and CSTR (bottom) HPHT System
Figure 6. Bio-Oil yield per lb of biomass feedstock

Non-Profit OrganizationU.S. Postage
PAIDKlamath Falls, OR
Permit No. 45
GEO-HEAT CENTEROregon Institute of TechnologyKlamath Falls, OR 97601-8801
WorkS CITEdOil production of algal cells of Dunaliella tertiolecta by direct thermochemical liquefaction, Tomoaki Minowa, Shin-ya Yokoyama, Michimasa Kishimoto and Toru Okakura, NIRE, Onogawa 16-3 Japan
Resource demand implications for US algae biofuels production scale-up, Ron Pate, Geoff Klise, Ben Wu, SNL
Systems and economica analysis of microalgae ponds for conversion of CO2 to biomass, Benneman J. Oswald W
Hydrothermal Liquefaction to Convert Biomass into Crude Oil, Yuanhui Zhang, Biofuels from Agricultural Waste and Byproducts
Hydrothermal Conversion of Biomass. II. Conversion of Wood, Pyrolysis Oil, and Glucose in Hot Compressed Water, Dragan Knezevic, Wim van Swaaij and Sascha Kersten, University of Twente, The Netherlands
Large Scale Open Algae Ponds, Ami Ben-Amotz, National Institute of Oceanography Israel
Future of Geothermal Energy Impact of Enhanced Geothermal Systems (EGS) on the United States in the 21st Century, MIT, Jefferson Tester, Brian Anderson, Anthony Batchelor, David Blackwell, Ronald DiPippo, Elisabeth Drake, John Garnish,Bill Livesay, Michal Moore, Kenneth Nichols, Susan Petty, M. Toksoz, Ralph Veatch
Interaction of Light, Geothermal Water and Nutrients on Production of Chlorella sorokiniana Microalgae (CS-101), J. Rastegary, New Mexico State University, US
“Use of Geothermal Energy for Aquaculture Purposes, Phase III, No. 10990128”, Final Report, Johnson, William and Kenan Smith, Geo-Heat Center, OIT
Industrial Applications of Geothermal Direct-Use Engineering and Design Guidebook, Chapter 16, 3rd Edition, Lienau, Paul, Geo-Heat Center OIT
DOE:EERE Biofuels Design Case, Zia Haq, April 24, 2012
ReactWell Asia Pacific Clean Energy (APCE) Summit Project Finance Connect Presentation, Honolulu, HI August 14, ‘12