Embed Size (px)
Citation preview
National Grid Electricity Transmission September 2012
1
National Grid Transmission
RIIO-T1: Initial Proposals consultation response
Supplementary information – Asset painting
Table of contents
Executive summary .................................................................................. 2
Introduction ............................................................................................... 3
Painting requirement ................................................................................ 5
Technical requirements ............................................................................................... 5
Impacting factors ......................................................................................................... 7
Condition assessment ................................................................................................. 9
Conclusions ................................................................................................................. 9
Our painting policies .............................................................................. 11
Tower painting policy ................................................................................................. 11
Plant painting policy .................................................................................................. 12
Cost projections ...................................................................................... 14
Cost of painting to policy - towers .............................................................................. 14
Cost of painting to policy - plant ................................................................................ 14
RIIO-T1 submission ................................................................................................... 14
Innovations and efficiencies ...................................................................................... 15
Initial proposals ......................................................................................................... 15
Cost drivers and constraints .................................................................. 17
Unit costs................................................................................................................... 17
Constraints ................................................................................................................ 18
Conclusions ............................................................................................................... 19
Cost efficiency ........................................................................................ 21
ITOMS results ........................................................................................................... 21
Non-normalised factors ............................................................................................. 21
Market testing ............................................................................................................ 23
Conclusions ............................................................................................................... 23
Appendix ................................................................................................. 24
Referred documents .................................................................................................. 24
National Grid Electricity Transmission September 2012
2
Executive summary
1 Initial Proposals reductions for asset painting have no discernible basis giving rise to undeliverable targets and representing an abandonment of the RIIO principles of totex and consideration of the longer term. Our submission was based on rigorous assessment and incorporated significant challenge over the RIIO-T1 period, so imposing extra reductions on this level of cost gives rise to allowances which are ill founded and inadequate.
2 Our painting policies are created in line with whole-life cost modelling and experience. We need to paint our metal work in towers and plant assets on an average 18 year cycle (within a 15 to 20 year window). This strikes a balance between the costs of ongoing maintenance to prolong the asset life and capital expenditure to replace them. Without painting, the technical lives of the assets will not be achieved, giving rise to higher whole-life costs.
3 To meet this policy for our 22,000 towers and over 2,700 switchgear bays under present procurement arrangements and applied paint systems we would have to spend nearly £19m per annum. Our work with research institutes, painting manufacturers and suppliers has led to several innovations and improvements which are projected to reduce this cost in the RIIO-T1 period to ~£14m per annum, with further continuous improvement expected over the period to offset asset growth drivers.
4 Our current unit costs benchmark well versus worldwide comparators and are in line with other European TOs with similar-aged assets subject to similar environmental factors. We are introducing longer-term views of workload to our suppliers to supplement nationally negotiated contracts which allow contractor benchmarking and drive savings.
5 Despite this, the Initial Proposals reduce our painting expenditure by £45m over the RIIO-T1 period, with annual tower painting allowances £2m less than we spent in 2011/12. Our unit costs are proven to be efficient and this reduction is too high to relate solely to the costs of delivery so this must suggest Ofgem want us to deliver lower volumes.
6 The Initial Proposals therefore only consider the opex costs, rather than the far larger capex costs which would result from not undertaking painting. The allowances in this area should be increased to enable the totex savings to be delivered. Without this, costs for our customers and consumers alike will be higher in the long term.
National Grid Electricity Transmission September 2012
3
Introduction
7 Our overhead transmission line network in England and Wales utilises more than 22,000 steel lattice towers. These towers have anticipated technical asset lives that range between 30 and 120 years, depending on their operating environment (e.g. coastal proximity) and maintenance history (painting frequency). In addition, our transmission network includes over 2,700 switchgear assets and cooler equipment which form part of our substation plant assets. The anticipated technical lives of these assets is like towers, are dependent on both environmental factors and painting frequency.
8 We have utilised a national strategy for the last 15 years to paint towers on an 18 year average cycle (within a 15 to 20 year window) based on whole-life cost modelling, however due to supplier and financial constraints during the TPCR4 period we have not been able to achieve full policy requirements. In contrast, we stopped our national plant painting strategy in 2003 on the back of issues with both the paint and system access required, instead reverting to more local strategies.
9 Neither of these positions is optimal. Not being able to achieve full policy on tower painting puts the condition of our steel towers at risk, giving rise to potentially higher and earlier capex replacement costs. We have been able to manage within the tower painting window during the TPCR4 period to minimise this impact but without returning to the 18 year average interval from 2012/13 we will have to undertake more replacement work in the future. Whilst the impacts of this may not be seen for several years, they will increase overall whole-life costs, a position which we do not want to reach.
10 From a plant painting perspective, there is now a solution to the paint issues encountered previously and we are proposing to return to a national painting strategy. System access is still at a premium, and some plant is beyond the stage of possible recovery through painting, so we will not be able to achieve optimal levels but we can deliver totex savings over the long term by increasing our work in this area and ensuring current assets achieve their technical lives.
11 Within our RIIO-T1 submission we forecast that ~£11m per annum of tower painting and £2.5m per annum of plant painting is required to be undertaken. We acknowledged that this was an increase on the levels spent in the TPCR4 period but justified this based on the totex benefits and explained how we were overcoming the constraints which existed in the TPCR4 period. In addition, we discussed how our tower condition assessment techniques were advancing based on learning from other European TSOs and how this and other innovations such as one coat painting would mean that we could reduce expenditure in tower painting through the period despite a 5% growth in the number of towers over the period.
12 Poyry performed a review of our proposals in this area and others within direct opex. In the Initial Proposals, their case 1 (lowest case) for funding was used to set proposed allowances which represented:
(a) £35m reduction for tower painting based on only allowing 50% of the annual increase proposed by ourselves
(b) £10m reduction for plant painting based on only allowing 60% of the annual increase proposed by ourselves
National Grid Electricity Transmission September 2012
4
13 In their report, Poyry stated that we gave limited evidence for the required increases in expenditure in these areas. We disagree with this but we have produced this paper to give a more comprehensive case for the required increases and why they are efficient, both in terms of totex costs and the costs of the activity itself. Within this document we give new evidence which covers:
(a) The background to the requirement to paint towers and plant assets, including the consequences of not undertaking this activity
(b) Our painting policies and the justification for the asset painting cycles
(c) The projection of costs including the basis for the levels of expenditure we are proposing and efficiencies and innovations we are expecting to deliver over the RIIO-T1 period
(d) Cost drivers and constraints which we experienced during the TPCR4 period and how we are managing them in the future
(e) Justification for the efficiency of the costs including evidence from benchmarking reports
National Grid Electricity Transmission September 2012
5
Painting requirement
Technical requirements
14 The technical asset life of a steel tower is assumed to be, on average, 85 years. The major factor determining technical asset life is the corrosion of the tower caused by exposure to the environment, therefore if this corrosion can be minimised (recognising that it is not practical nor cost-effective to paint so frequently that corrosion is stopped completely), the tower is more likely to achieve its technical asset life.
15 This same deterioration mechanism applies for plant assets, specifically switchgear assets, transformer cooling equipment and the steel elements of civil works. Whilst the same principles apply, there are differences. One of the main variations is the thickness of the steel utilised in construction. Although some of the steelwork utilised within substations can be of a thickness comparable with tower steelwork many items and components are manufactured from steel only a few millimetres thick. This means that the impact of corrosion can be more detrimental to the life of the asset.
16 The impact of steel work deterioration in towers is that they become too dangerous to climb for assessment and overhead line repair, leading ultimately to instability of the structure (especially in storm conditions, when circuit reliability is potentially important to network resilience) and a requirement to replace either part or all of the tower. For plant assets, there are several consequences of deterioration of steel and zinc work, for example:
(a) Perforation: Perforated steelwork can lead to moisture ingress, which may lead to short circuit, battery earth fault and deterioration of the internal components of the housing / enclosure
(b) Defective hinges and locking devices: reducing the activity possible from the asset (such as a disconnector), leading to insecure operation and potential requirement to replace
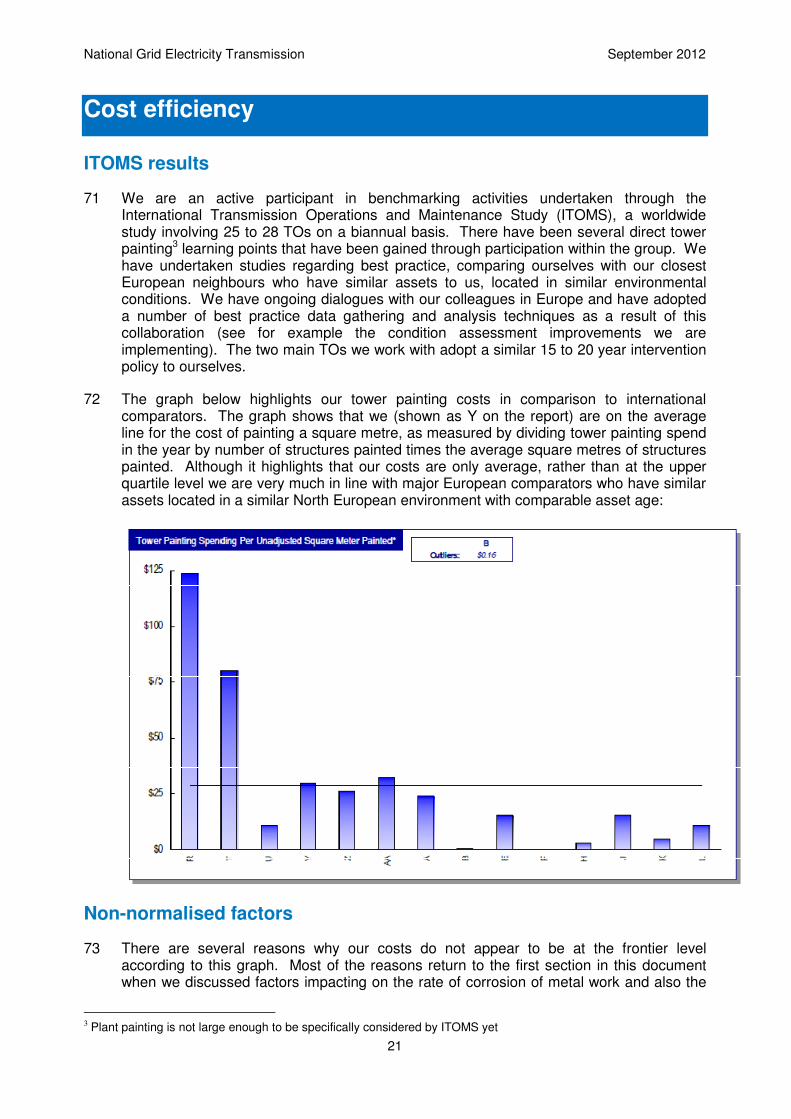
(c) Loss of structural strength: In some instances, if the bases of marshalling kiosks are not treated, they will eventually lose structural strength. Loss of structural strength will require remedial action to install additional supporting structures or involve the fitting of a replacement kiosk leading to lengthy and expensive re-commissioning.
(d) Loss of insulating medium: Should equipment be left untreated to the point where insulating medium is lost, it would result in a significant leakage of SF6 which is 23,900 times as intensive a greenhouse gas as carbon dioxide.
17 Exposure to the environment, and thus deterioration, of the metal can be minimised. At the construction stage, much of our metal work is galvanised using zinc or covered in a layer of paint. This inhibits corrosion but only lasts for a relatively short time in the asset’s technical life as the protective barrier wears. Painting the assets can then be performed on a periodic basis to give a barrier between the metalwork and the environment, inhibiting corrosion once more.
18 Currently there are three main viable options for the paint used:
(a) Alkyd three coat process: This uses two coats of Micatious Iron Oxide (MIO) paint with a spirit base. These two coats were historically used for tower painting
National Grid Electricity Transmission September 2012
6
but have been largely replaced by vinyl options. The method is still used for some plant painting with a top coat of grey gloss added
(b) Gloss three coat process: Also spirit-based but not MIO. There are two specifications for gloss systems approved for use in National Grid o substation assets.
(c) Vinyl two coat process: This is a MIO paint using a cellulose base. Vinyl paint is predicted to wear away in approximately 20 years, whereas alkyd systems will last five to seven years less. This is used for virtually all instances of tower painting, and increasingly so in plant painting.
19 The section on ‘Cost projections’ discusses how we are looking to introduce one-coat vinyl paints which we have recently developed alongside paint manufacturers and the ‘Cost drivers and constraints’ section discusses how water-based paints are often required for environmental reasons at certain sites.
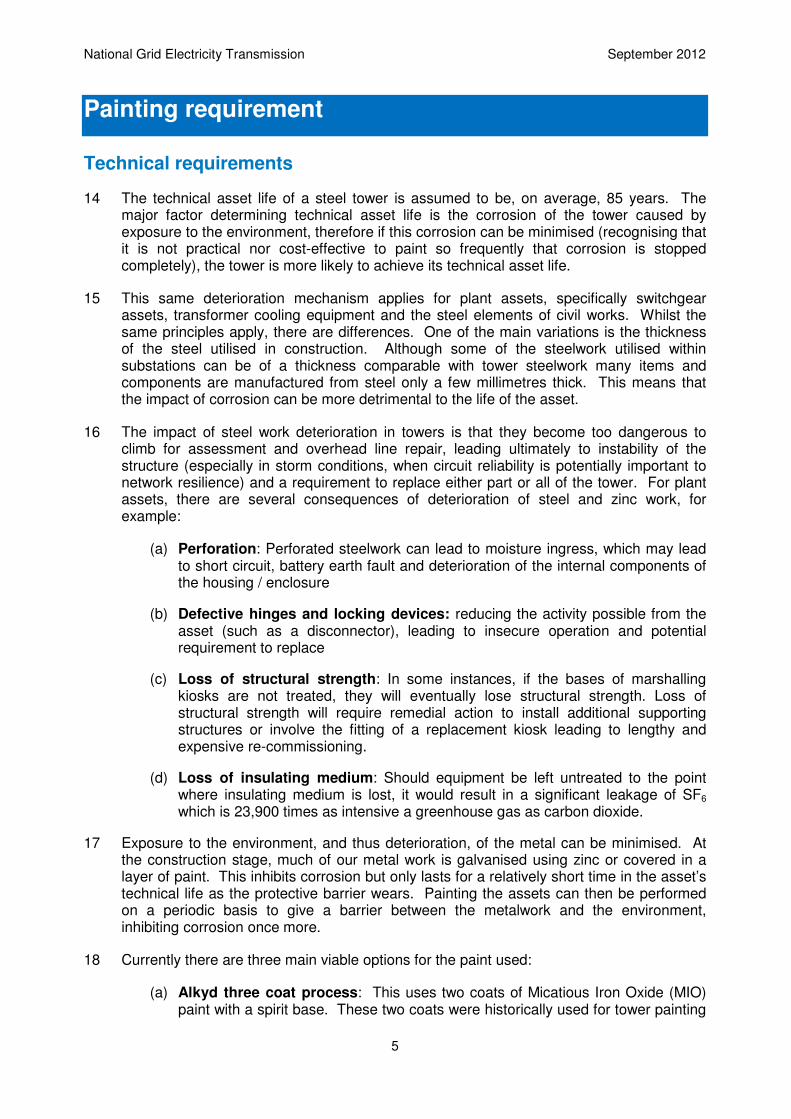
20 The diagram below from a CIGRE report on the strength of lattice towers (included within the appendix) shows the degradation of towers in maintenance modelling and how painting can halt the deterioration. In this plot the engineering units are microns of corrosion:
21 As explained in the CIGRE paper this shows:
(a) The degradation of the galvanised layer between construction in 1970 to circa 1978
(b) An acceleration in the steel work degradation once the galvanised layer deteriorates to such a level as to expose the steel to the elements
(c) Similar deterioration in each tower until 4ZP037 and 4ZP020 are painted in 1982 at which point the steel work of these towers has a halt in deterioration and afterwards is slower than on tower 4ZP080 which has not been painted
National Grid Electricity Transmission September 2012
7
(d) Similar impact on 4ZP080 when it is painted in 1989
(e) An overall drop off in deterioration after 1989 as reductions in polluting industry reduce the exposure of the towers to sulphur dioxide
22 It is this halting of corrosion through painting visits, and overall lower corrosion rates, which painting is trying to achieve.
Impacting factors
23 Corrosive action across assets varies due to a number of factors. This will mean that the expected technical life of the two identical assets varies dependent on which factors it is exposed to over its life. According to the Woodhouse Partnership who performed an assessment on our maintenance policy in this area (see appendix for report) “Steelwork corrodes at different rates dependent on factors which include environmental conditions, the quality of the original metalwork and the quality of the paint system.” The largest of these factors is the environmental conditions that the steelwork has been exposed to. This is especially prevalent in the UK which we will return to later in the ‘Cost efficiency’ section when we discuss benchmarking results.
24 ISO 92233 and ISO 92244 standards on metal corrosion explain that the annual rate of deterioration of a metal is related to the:
(a) Material of construction
(b) Time of wetness
(c) Sulphur dioxide pollution level
(d) Chloride deposition.
25 Factors within this include the proximity of the asset to coastlines and roads (due to the salt content of the air) and to industrial centres (with their heavy pollution) as well as the climate that the assets are exposed to. For example, towers or substations in areas of more wind and/or rain would deteriorate quicker than those in more benign conditions. It is of note that time of wetness does not just mean rainfall, it relates also to the relative humidity and temperature (due to morning dew and fog, for example).
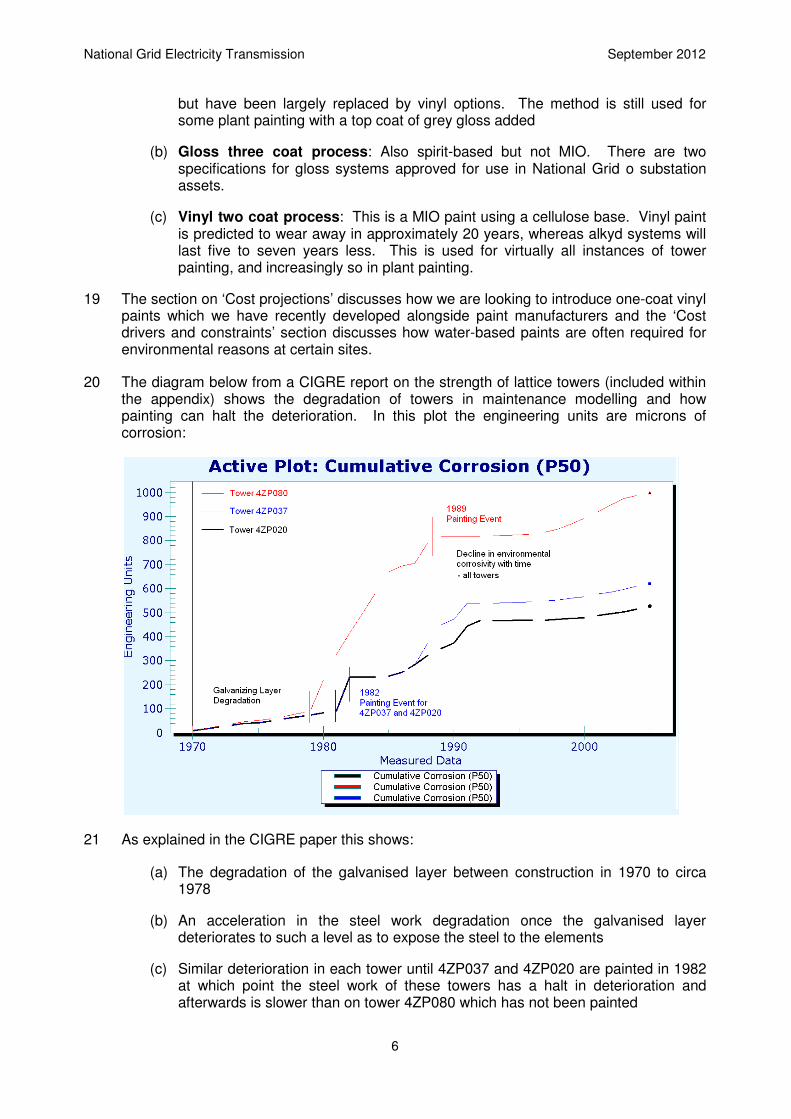
26 Gas Insulated Switchgear (GIS) assets at the Sizewell substation give a good example of the different degradation of assets exposed to differing conditions. Sizewell 400kV substation is located at Leiston, Suffolk, and it connects of nuclear-powered generation to the transmission network. Concerns have been raised with regard to the outdoor equipment condition, due to corrosion issues, exacerbated by the site’s coastal location.
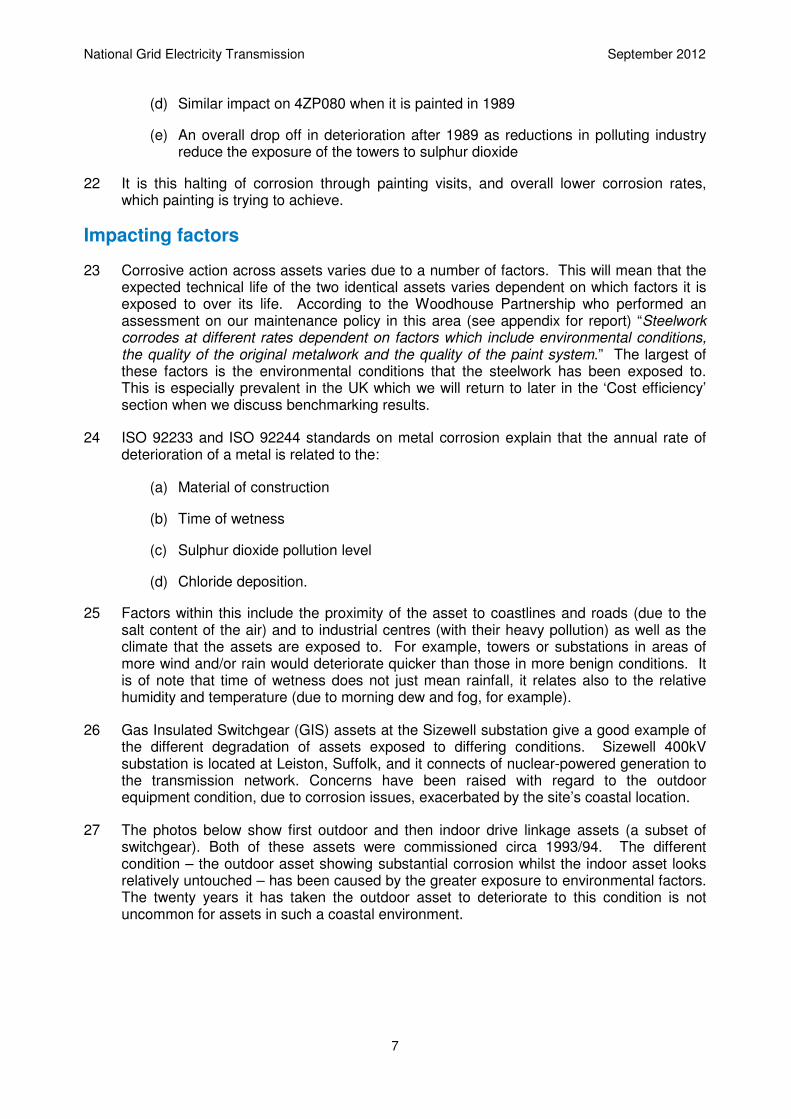
27 The photos below show first outdoor and then indoor drive linkage assets (a subset of switchgear). Both of these assets were commissioned circa 1993/94. The different condition – the outdoor asset showing substantial corrosion whilst the indoor asset looks relatively untouched – has been caused by the greater exposure to environmental factors. The twenty years it has taken the outdoor asset to deteriorate to this condition is not uncommon for assets in such a coastal environment.
National Grid Electricity Transmission September 2012
8
Outdoor drive linkage at Sizewell substation
Indoor drive linkage at Sizewell substation
National Grid Electricity Transmission September 2012
9
Condition assessment
28 We grade the condition of our metal work through a standardised visual assessment process. This is an important step to prioritise workload and minimise costs which would otherwise occur if only an interval-based policy was applied. This assessment process occurs both for painting and asset replacement requirements.
29 For towers, the condition assessment can be performed superficially via foot patrols and then by climbing the towers which gives a better view of the condition. Both of these methods are time consuming and resource intensive. With 22,000 towers in our asset base, this is a process which needs to be undertaken over several years.
30 We discussed this condition assessment activity as part of our submission within the ‘Non-load related activities detailed plan’ annex, under overhead lines. The section is not repeated here in its entirety but within the section we explained that we have taken best practices from another European TSOs and technology improvements developed with EA technology to implement an improved, cheaper method of condition assessment. This uses a new specification of camera to take high resolution photos of the towers from helicopters, which enable specific issue areas to be identified and assessed. This eliminates any subjectivity in assessment caused by different assessors. This approach is being implemented now and is helping us to identify the condition of our steel work more exactly, enabling more focused tower painting to take place. This is driving efficiencies in our forecast costs through the RIIO-T1 period as discussed in the ‘Cost projections’ section.
31 For substation assets, the assessment of painting requirement is performed via maintenance results scripts and plant status reports. This assessment is based on a maintenance script following training but remains subjective and is not as embedded into our processes as it could be. We are therefore improving this through our adoption of a national strategy in this area and also learning from our tower painting assessment work to ensure it is more objective in the future.
32 In addition to the general assessment of substation assets, a survey was carried out during 2008 to quantify equipment in need of painting (i.e. to identify assets where the paint system is visibly broken down). This has helped us determine the size of the asset base which is in need of painting and we have begun to paint this population, but we need to develop a more structured national strategy as discussed further in the ‘Our painting policies’ section due to supplier constraints and system access requirements.
33 Following assessment, metal work is assessed as being between grades 1 to 6, with 6 being the worst condition. These grades determine whether or not painting or other asset interventions (such as specific replacement of parts of a tower) will be economic to undertake, or if the only option to maintain performance is to asset replace. This is referenced by the Woodhouse Partnership in their report from 2009: “In practice, once paint is ineffective and corrosion of the underlying steelwork has set in, it will deteriorate at an accelerating rate. In terms of condition assessment grades, this will occur at around Grade 5/6, but steelwork at Grade 4 will already be expensive to repair and cannot be returned to the condition required of the painting policy by manual preparation.”
Conclusions
34 It is a widely accepted view across many industries that painting steelwork on a periodic basis will ensure that the technical asset life of steelwork assets can be achieved. This principle is equally applicable to tower and substation plant assets. The benefits of
National Grid Electricity Transmission September 2012
10
painting are that totex will be minimised over the medium to long term and system access requirements can be reduced as a result.
35 According to the 2009 Woodhouse Partnership report (included within the appendix) for tower painting:
“Modelling in this study predicts that deferral of 10 years beyond the optimum painting interval leads to an approximate doubling of costs to recover the tower condition. Allowing the tower to degrade further leads to the need to rebuild the tower, and further degradation leads to costs to reinforce the tower for safety purposes prior to dismantling.
Painting to policy can extend the anticipated technical asset life of a tower to approximately 85 years in benign operating environments (i.e. away from the coast and other corrosive pollution). If towers are not painted, the technical life is predicted to reduce to 50 years.”
National Grid Electricity Transmission September 2012
11
Our painting policies
Tower painting policy
36 As outlined in our maintenance policy (TS.2.4.24), the ~22,000 transmission towers in England and Wales have to be painted, on average, once every 18 years (falling within a range of 15-20 years). Undertaking tower painting helps optimise the asset life, striking a balance between the costs of ongoing maintenance to prolong the asset life and capital expenditure to replace them.
37 The existing tower painting policy was borne from work undertaken in 1995, in conjunction with the Woodhouse Partnership, which set out the original technical requirements for the policy. In 2003 we commissioned a major review of the tower painting requirements. This report (also by the Woodhouse Partnership) built upon the previous policy by incorporating greater asset information and the experience of using vinyl paint. The major impact of the review was to recommend an increase in the interval between painting activities and it identifies a strategic approach to recovering the condition of steel lattice towers that had begun deteriorating. This 2003 report is included within the appendix.
38 We continue to work with the Woodhouse Partnership offering, as they do, expert asset management whole-life cost modelling advice, and in 2009, we commissioned a review of the policy so as to incorporate better cost and asset information. As noted previously this report is included within the appendix too.
39 The Woodhouse Partnership use maintenance modelling to calculate both the optimum window for painting of towers and the impacts of missing these windows (as referred to in the last section). The summary findings of the 2009 report were:
(a) Existing towers should be painted when the paint has degraded to Grade 2/3 using a two-coat vinyl paint system. Ongoing condition assessment should be used as the basis for targeting tower painting candidates. Deferral of tower painting beyond Grade 3 is not cost effective.
(b) Use of single coat vinyl paint on towers in an appropriate condition offers a potential saving of circa 30% per route and should be progressed subject to technical verification of performance.
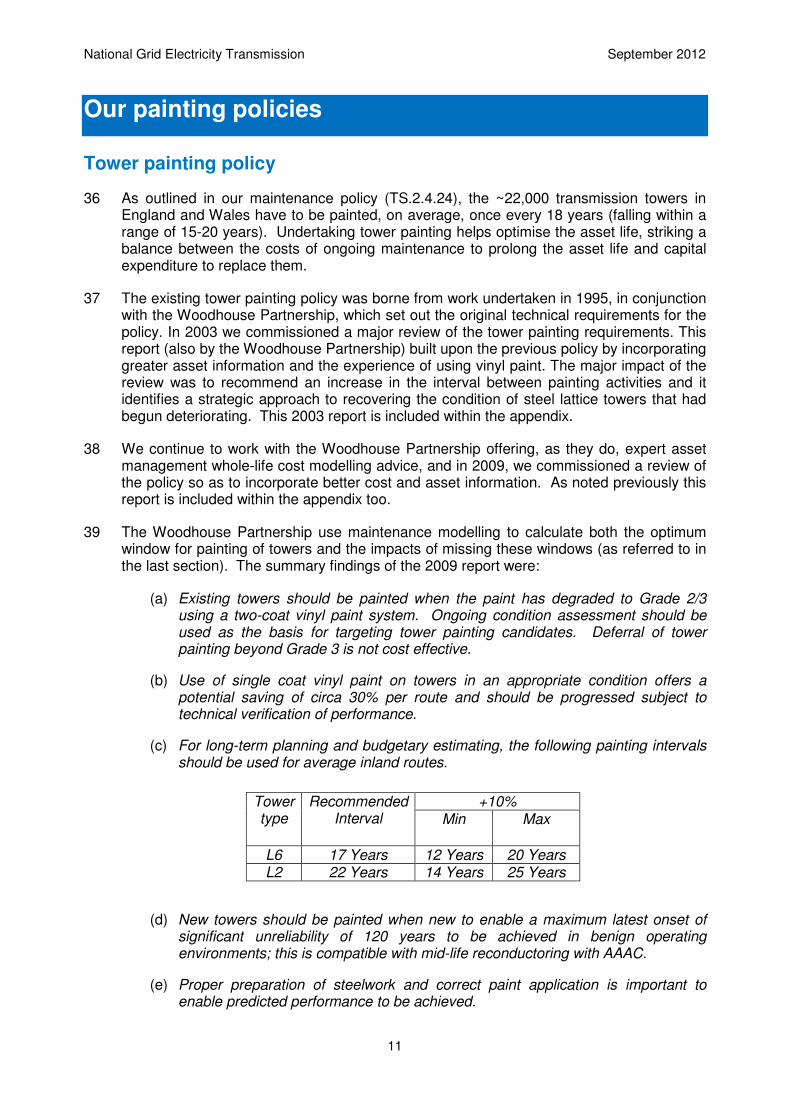
(c) For long-term planning and budgetary estimating, the following painting intervals should be used for average inland routes.
(d) New towers should be painted when new to enable a maximum latest onset of significant unreliability of 120 years to be achieved in benign operating environments; this is compatible with mid-life reconductoring with AAAC.
(e) Proper preparation of steelwork and correct paint application is important to enable predicted performance to be achieved.
Tower type
Recommended Interval
+10% Min
Max
L6 17 Years 12 Years 20 Years L2 22 Years 14 Years 25 Years
National Grid Electricity Transmission September 2012
12
(f) Further research is recommended regarding the use and performance of water-based paint, including proper evaluation of the environmental case. Purely on economic grounds, it should not be applied unless there are special local circumstances.
(g) Further research is recommended to evaluate the causes and prevention options for managing lichen growth on steel lattice towers.
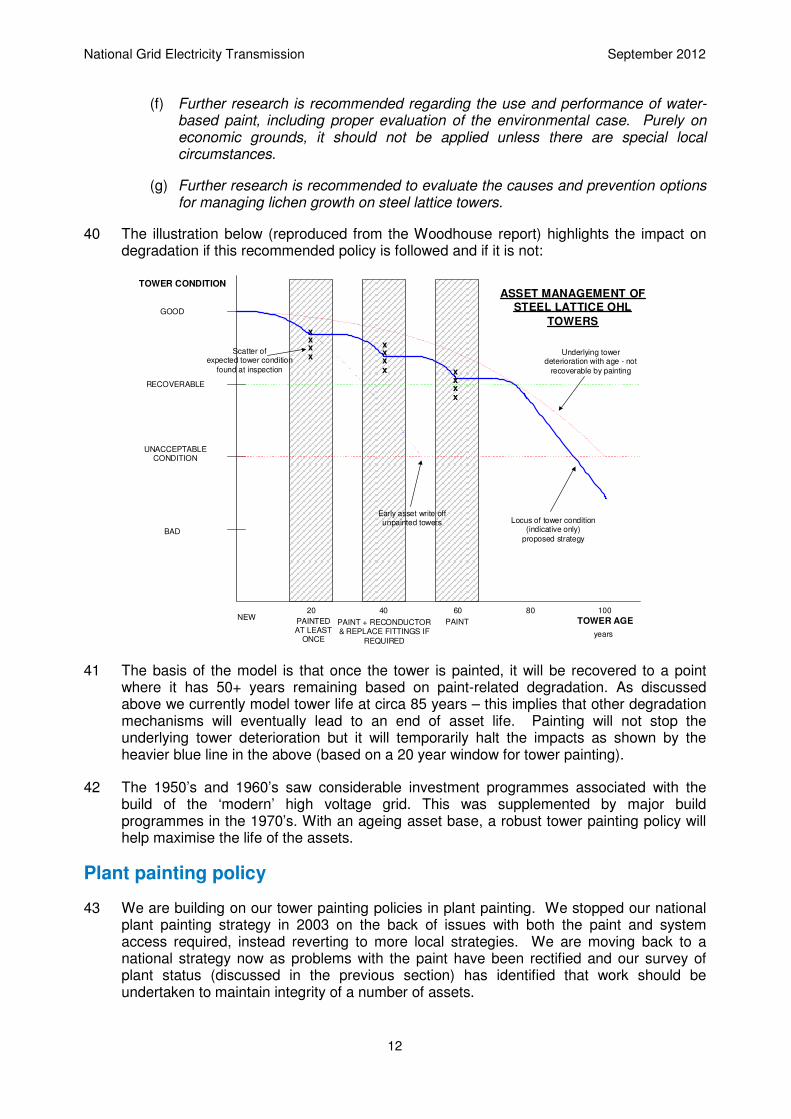
40 The illustration below (reproduced from the Woodhouse report) highlights the impact on degradation if this recommended policy is followed and if it is not:
41 The basis of the model is that once the tower is painted, it will be recovered to a point where it has 50+ years remaining based on paint-related degradation. As discussed above we currently model tower life at circa 85 years – this implies that other degradation mechanisms will eventually lead to an end of asset life. Painting will not stop the underlying tower deterioration but it will temporarily halt the impacts as shown by the heavier blue line in the above (based on a 20 year window for tower painting).
42 The 1950’s and 1960’s saw considerable investment programmes associated with the build of the ‘modern’ high voltage grid. This was supplemented by major build programmes in the 1970’s. With an ageing asset base, a robust tower painting policy will help maximise the life of the assets.
Plant painting policy
43 We are building on our tower painting policies in plant painting. We stopped our national plant painting strategy in 2003 on the back of issues with both the paint and system access required, instead reverting to more local strategies. We are moving back to a national strategy now as problems with the paint have been rectified and our survey of plant status (discussed in the previous section) has identified that work should be undertaken to maintain integrity of a number of assets.
TOWER CONDITION
RECOVERABLE
UNACCEPTABLECONDITION
GOOD
BAD
TOWER AGENEWPAINTEDAT LEAST
ONCE
PAINT + RECONDUCTOR& REPLACE FITTINGS IF
REQUIRED
Underlying towerdeterioration with age - not
recoverable by painting
xx
x
x
xx
x
x
xx
x
x
20 40 60 80 100
years
PAINT
Locus of tower condition(indicative only)
proposed strategy
Scatter ofexpected tower condition
found at inspection
Early asset write offunpainted towers
ASSET MANAGEMENT OF
STEEL LATTICE OHL
TOWERS
National Grid Electricity Transmission September 2012
13
44 Within their 2003 report on tower painting, the Woodhouse Partnership identify that: ‘National co-ordination of tower painting is essential to ensure management of criticality.’ This same recommendation is equally applicable to plant painting to ensure that resources can be co-ordinated, suppliers can be given a national programme of work which can drive commercial efficiencies in the supply base (and ourselves a stronger negotiating position) and system access considerations can be optimised (see ‘Cost drivers and constraints’ section).
45 Our maintenance policy in plant painting reflects the same painting windows as tower painting (18 years, within a window of 15 to 20 years) based on similar modelling of the economic implications of different windows. It is not suprising that the whole-life economic decisions are the same because the paint system used is the same (and will therefore have the same life on a steel substrate), the environmental factors (pollution, time of wetness, etc) will be similar as substations have the same geographic coverage as overhead lines, and the relative cost of painting versus asset replacement is similar (i.e. replacement is >10 times more expensive).
National Grid Electricity Transmission September 2012
14
Cost projections
Cost of painting to policy - towers
46 Within the 2003 review of tower painting policy it was established that a standard L6 tower had an area of 1,000 square metres (m2) to be painted. At the same time, the report identified that the cost for painting steelwork, rated at a grade 2 to 3, was £8 per m2. For steelwork grade 4, the cost increased to £9 per m2. Since 2003, the cost of painting a square metre has risen considerably and now stands at £17.75 for grade 2 to 3 steelwork.
47 Over the last few years we have been able to more accurately determine the total area of steel on the system through the enhanced use of network mapping. Combined, the total tower steelwork that needs to be maintained is approximately 15 million m2, which when averaged over circa 22,000 towers equates to an average of 700 square metres per tower. With greater network mapping accuracy, the total has increased from the 13 million m2 which was estimated during TPCR4 submissions. This equates to an 8% increase in the size of our network (and hence an 8% increase in our forecast of tower painting) solely due to better asset information.
48 To comply with the policy, we should be painting each tower every 18 years which equates to painting 1,222 average tower equivalents each year. Using the average size of the towers this equates to 855,400 m2 per annum. At an average price of £17.75, the expected annual cost for tower painting totals £15.2m.
Cost of painting to policy - plant
49 The policy for plant painting is also an 18 year cycle. Based on circa 2,700 substation switchgear bays, this means that we would have to paint 150 bays per year. The approximate cost per bay (based on a 400kV bay price quote from Bagnalls) is £18,000 which includes painting one circuit breaker, three current transformers, three voltage transformers and three isolators. Some bays will have more equipment than this, others less, but it is a representative standard set of equipment to use. This gives an annual cost of £2.7m for switchgear.
50 We are also proposing to include A frames, transformers and quad boosters in our plant painting programme. There are circa 900 transformers on the network, equating to 50 each year on an 18 year cycle. This is quoted as adding another £600k for transformers (based on painting coolers, conservators and tank) and £200k for A frames based on the population. This gives a total annual expenditure of £3.5m for plant painting, necessary to paint to policy.
RIIO-T1 submission
51 Our RIIO-T1 submission levels recognise that there remain some constraints to delivering asset painting to policy – such as system access for plant painting and suppliers for tower painting – and that efficiencies are expected to be delivered (see section on innovations and efficiencies below) which should reduce the unit cost of delivery. In addition, we acknowledge that some assets may be beyond repair if their grade has gone past grade 4. For this reason, our RIIO-T1 submission values do not equal the costs of painting to policy. Instead they represent a level of expenditure which gets our expenditure much closer to policy than is the case today incorporating expected efficiencies and the impact of constraints.
National Grid Electricity Transmission September 2012
15
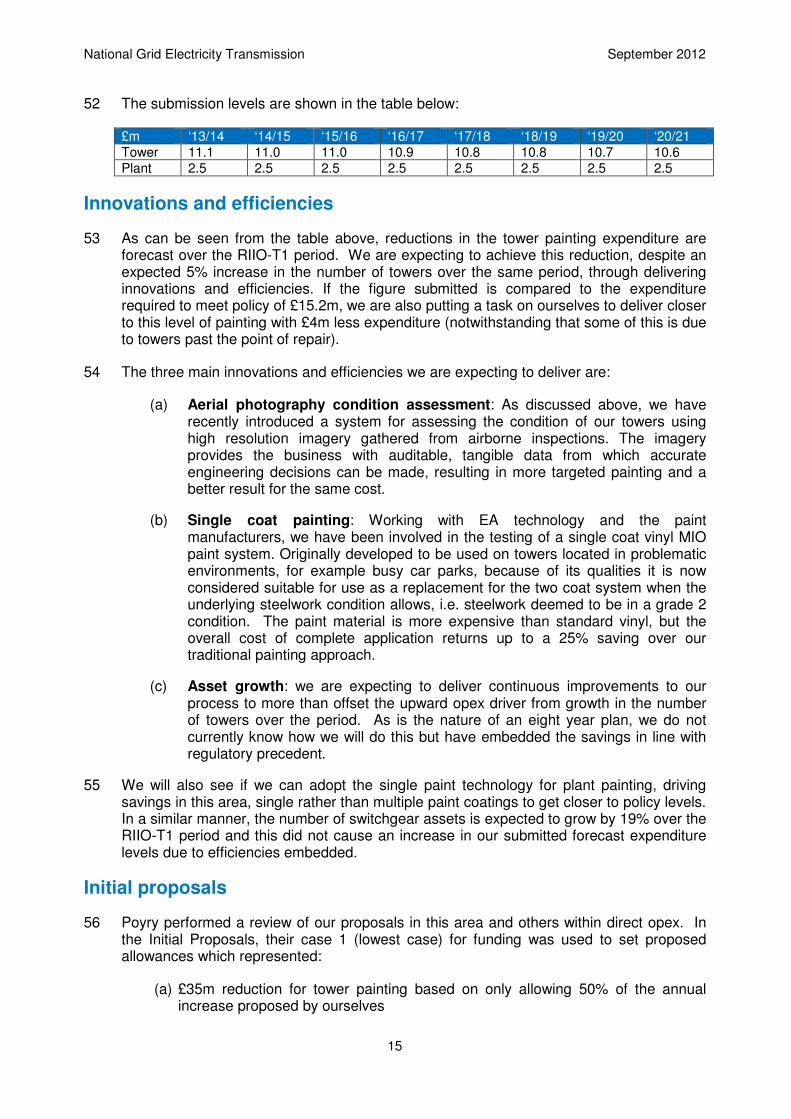
52 The submission levels are shown in the table below:
£m ‘13/14 ‘14/15 ‘15/16 ‘16/17 ‘17/18 ‘18/19 ‘19/20 ‘20/21
Tower 11.1 11.0 11.0 10.9 10.8 10.8 10.7 10.6
Plant 2.5 2.5 2.5 2.5 2.5 2.5 2.5 2.5
Innovations and efficiencies
53 As can be seen from the table above, reductions in the tower painting expenditure are forecast over the RIIO-T1 period. We are expecting to achieve this reduction, despite an expected 5% increase in the number of towers over the same period, through delivering innovations and efficiencies. If the figure submitted is compared to the expenditure required to meet policy of £15.2m, we are also putting a task on ourselves to deliver closer to this level of painting with £4m less expenditure (notwithstanding that some of this is due to towers past the point of repair).
54 The three main innovations and efficiencies we are expecting to deliver are:
(a) Aerial photography condition assessment: As discussed above, we have recently introduced a system for assessing the condition of our towers using high resolution imagery gathered from airborne inspections. The imagery provides the business with auditable, tangible data from which accurate engineering decisions can be made, resulting in more targeted painting and a better result for the same cost.
(b) Single coat painting: Working with EA technology and the paint manufacturers, we have been involved in the testing of a single coat vinyl MIO paint system. Originally developed to be used on towers located in problematic environments, for example busy car parks, because of its qualities it is now considered suitable for use as a replacement for the two coat system when the underlying steelwork condition allows, i.e. steelwork deemed to be in a grade 2 condition. The paint material is more expensive than standard vinyl, but the overall cost of complete application returns up to a 25% saving over our traditional painting approach.
(c) Asset growth: we are expecting to deliver continuous improvements to our process to more than offset the upward opex driver from growth in the number of towers over the period. As is the nature of an eight year plan, we do not currently know how we will do this but have embedded the savings in line with regulatory precedent.
55 We will also see if we can adopt the single paint technology for plant painting, driving savings in this area, single rather than multiple paint coatings to get closer to policy levels. In a similar manner, the number of switchgear assets is expected to grow by 19% over the RIIO-T1 period and this did not cause an increase in our submitted forecast expenditure levels due to efficiencies embedded.
Initial proposals
56 Poyry performed a review of our proposals in this area and others within direct opex. In the Initial Proposals, their case 1 (lowest case) for funding was used to set proposed allowances which represented:
(a) £35m reduction for tower painting based on only allowing 50% of the annual increase proposed by ourselves
National Grid Electricity Transmission September 2012
16
(b) £10m reduction for plant painting based on only allowing 60% of the annual increase proposed by ourselves
57 This gives rise to inappropriately low allowances in the area given the totex efficiencies produced by our painting policies. In addition to only funding part of the increases proposed, the allowances start from an unusually low position in 2010/11 for tower painting. The 2011/12 figure of £9.4m should be used instead.
National Grid Electricity Transmission September 2012
17
Cost drivers and constraints
Unit costs
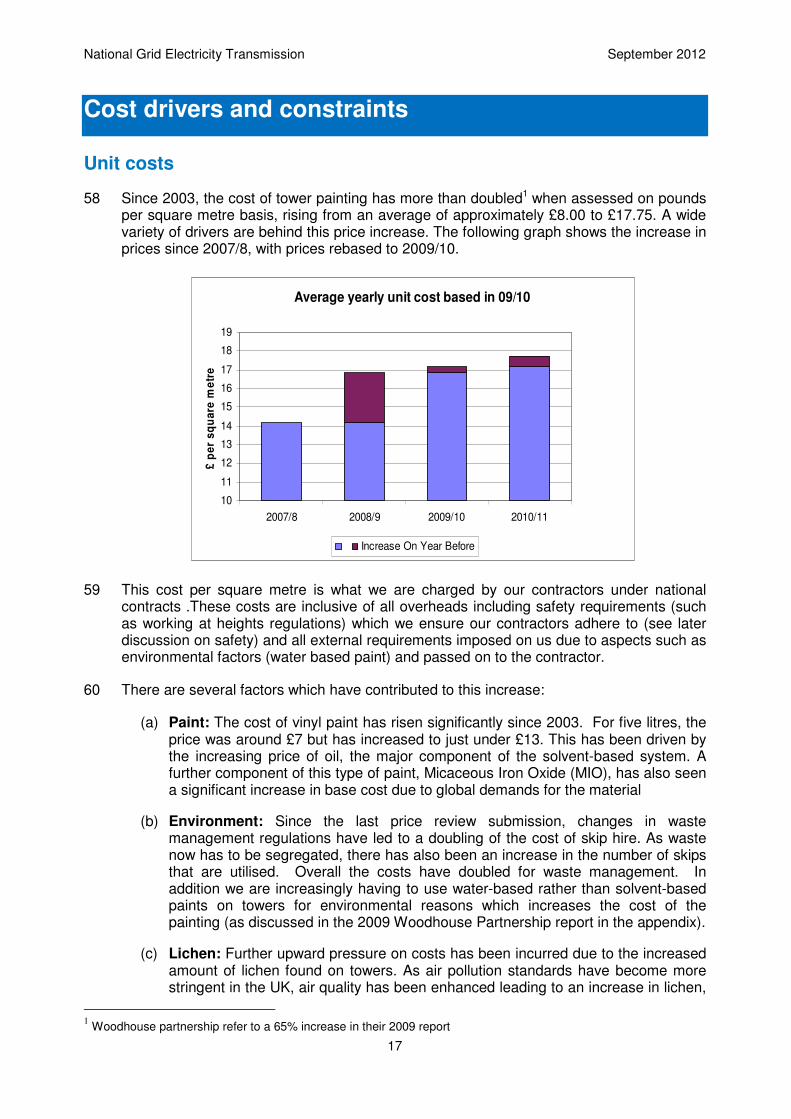
58 Since 2003, the cost of tower painting has more than doubled1 when assessed on pounds per square metre basis, rising from an average of approximately £8.00 to £17.75. A wide variety of drivers are behind this price increase. The following graph shows the increase in prices since 2007/8, with prices rebased to 2009/10.
59 This cost per square metre is what we are charged by our contractors under national contracts .These costs are inclusive of all overheads including safety requirements (such as working at heights regulations) which we ensure our contractors adhere to (see later discussion on safety) and all external requirements imposed on us due to aspects such as environmental factors (water based paint) and passed on to the contractor.
60 There are several factors which have contributed to this increase:
(a) Paint: The cost of vinyl paint has risen significantly since 2003. For five litres, the price was around £7 but has increased to just under £13. This has been driven by the increasing price of oil, the major component of the solvent-based system. A further component of this type of paint, Micaceous Iron Oxide (MIO), has also seen a significant increase in base cost due to global demands for the material
(b) Environment: Since the last price review submission, changes in waste management regulations have led to a doubling of the cost of skip hire. As waste now has to be segregated, there has also been an increase in the number of skips that are utilised. Overall the costs have doubled for waste management. In addition we are increasingly having to use water-based rather than solvent-based paints on towers for environmental reasons which increases the cost of the painting (as discussed in the 2009 Woodhouse Partnership report in the appendix).
(c) Lichen: Further upward pressure on costs has been incurred due to the increased amount of lichen found on towers. As air pollution standards have become more stringent in the UK, air quality has been enhanced leading to an increase in lichen,
1 Woodhouse partnership refer to a 65% increase in their 2009 report
Average yearly unit cost based in 09/10
10
11
12
13
14
15
16
17
18
19
2007/8 2008/9 2009/10 2010/11
£ p
er
sq
ua
re m
etr
e
Increase On Year Before
National Grid Electricity Transmission September 2012
18
which grows best where the air is purest. To paint towers where lichen has built up is introducing a further process to remove it. This is referred to in the 2009 Woodhouse report. The extra work associated with lichen increases the cost of painting a tower by over 15%. With the increasing closure of heavy industry, air quality is likely to continue to improve and subsequently continue to increase the costs associated with dealing with lichen growth. The cost of removing lichen currently takes up 7% of the tower painting budget.
(d) Safety: The cost of complying with CDM (Construction, Design & Maintenance) regulations has increased from a minimal £50 per week to a range between £300 and £400 when on site. Increased standards surrounding personal protective equipment (PPE) obligations have also increased costs. As we take the safety of all employees and contractors seriously, costs have increased from more rigorous training requirements. For example, now all tower painters have to perform the Basic Electrical Safety Competence scheme (BESC), which trains them on the requirements to work safely in the vicinity of High Voltage electricity assets.
Constraints
61 During the TPCR4 period, we had several issues with one of the contractors who deliver our tower painting. We have three such companies working for us as part of a national contract, all of which must adhere to our safety requirements (see previous section). Unfortunately during there were several instances of breaches of these requirements by one particular supplier in the period which meant that, after warnings, we had to suspend the supplier from working on our assets.
62 Only having three suppliers is not enough to cover all requirements for policy so reducing this down to two was a difficult decision to make but we were not prepared to let our safety standards slip. This caused issues with delivering workloads during the period and has contributed to us not being able to reach that policy requirement in the period.
63 We have worked hard to rectify this supplier constraint issue by giving a longer term view of the workload we have. Tower painting is a niche industry, and it is hard to attract and retain the quality of people we need. By sharing our longer-term plans, it is our hope that this important task will attract more trained resource. This has worked to some effect for 2011/12 with reductions in unit costs from the national contract renegotiation and the availability of a third supplier to contract with, but there is still more work to do. Work has traditionally been awarded on an annual competitive tender basis. To provide the suppliers with future work certainty, we will need to enter into long term framework agreements with suppliers, something we are doing now. Commitments to long term work plans would potentially provide us with the opportunity to seek cost efficiencies from our contractors and improve the quality of tower painting. These efficiencies are already included in our plan.
64 From a plant painting perspective there have been two main constraints recently:
(a) Paint adhesion: we were experiencing issues with paint sticking correctly to the steel surface, resulting in an unsuccessful bond and lack of barrier against corrosion. This issue was one reason why we abandoned a national paint strategy. We have now overcome this problem by working with suppliers and have recently trialled painting again which has proven successful over the last couple of years.
(b) System access: Plant painting is similar to tower painting in that there are elements of outage and non-outage painting. The non-outage painting will provide a more predictable to the suppliers and should help to secure better rates.
National Grid Electricity Transmission September 2012
19
However, due to system access being at a premium, the outage requirements for painting will have to be met by either extension of planned outages or the provision of dedicated outages to facilitate painting. Similar applies for tower painting. As the provision of dedicated outages is unlikely and the option of extending outages may be difficult, new ways of working will be investigated. Weekend and 24hr working may have to be considered; this may alleviate the issue but will come at a greater cost.
65 Overall, however, the largest constraint we experienced during the TPCR4 period was of a financial nature. As has been noted elsewhere in the Initial Proposals’ response, we have been overspending TPCR4 ETO opex allowances by £30m to £40m per annum. This was as a result of allowances which did not take into account all of the drivers of cost for our business and the impacts of activities such as renewing and growing our workforce in advance of the RIIO-T1 period.
66 This overspend and the financial constraints that come with it have meant that we have had to flex tower painting cycles to the latter end of the 15 to 20 year window in our policy and have not been able to accelerate our plant painting programme as quickly as we would have liked. Despite this, we are still spending substantial amounts on asset painting each year, but it is not at the level that it needs to be going forward to ensure that totex costs are minimised.
67 In order to focus our limited expenditure on the right areas in the TPCR4 period we have followed the recommendations from the Woodhouse Partnership reports in 2003 and 2009:
‘With limited funds, the painting of towers should be prioritised as below:
(a) Towers that cannot be rebuilt due to physical, environmental, safety or operational constraints should be recovered and maintained to policy. To minimise costs, this should be planned on a route basis rather than painting individual towers.
(b) Towers that were not painted as part of re-conductoring schemes should be painted to prevent the early asset write-off of conductors and fittings.
(c) L6 routes that have not yet degraded beyond Grade 3 should be painted within the next 5 years to enable an 85-year technical life to be achieved in benign operating environments (prioritised based on condition).
(d) Other towers at condition grade 2 and 3 would then be prioritised, based on percentage of towers at these grades, to maximise their asset life.
(e) Wherever possible, tower painting should be scheduled to coincide with route refurbishment or uprating.’
Conclusions
68 An increase in unit costs was identified as a risk at the time we were discussing the TPCR4 allowances with Ofgem. We had not included this risk in our TPCR4 submission, but discussed it as one of the items that made our embedded opex task significantly harder to deliver. This has proven to be the case with an 11% per annum increase during the period. This increase in costs, coupled with inadequate opex allowances and supplier constraints experienced, meant that we were not able to deliver asset painting to the level required by our policies.
National Grid Electricity Transmission September 2012
20
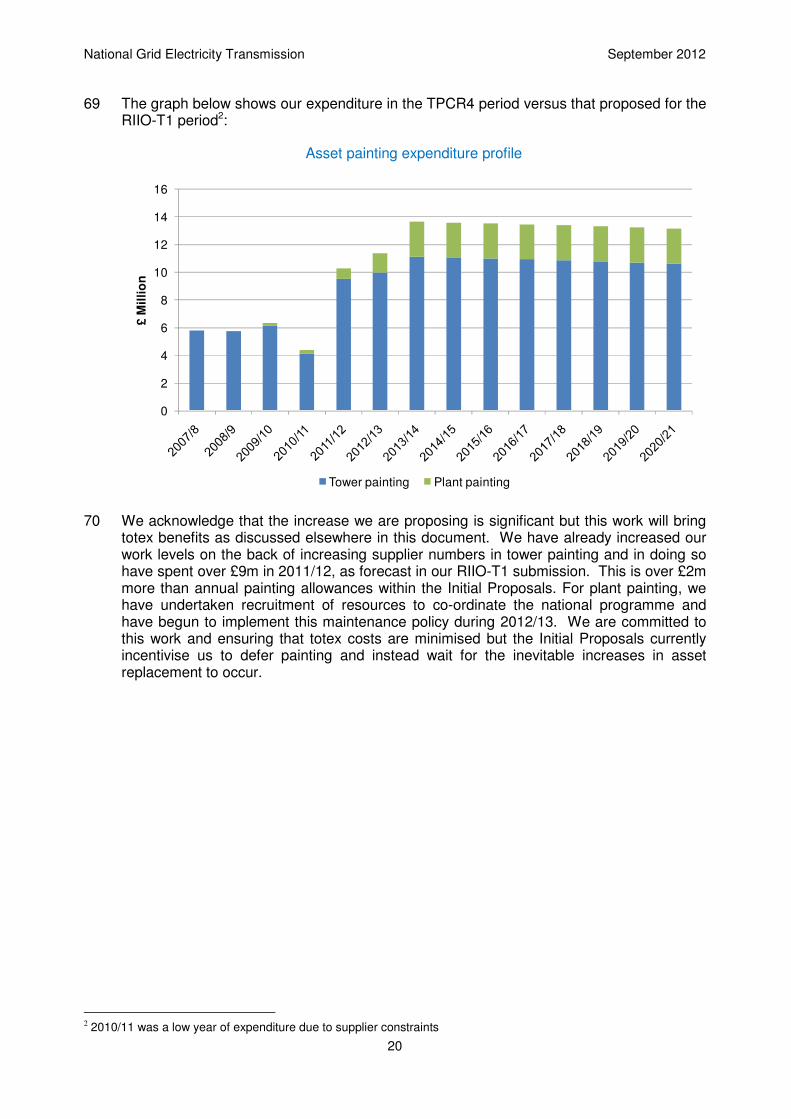
69 The graph below shows our expenditure in the TPCR4 period versus that proposed for the RIIO-T1 period2:
Asset painting expenditure profile
70 We acknowledge that the increase we are proposing is significant but this work will bring totex benefits as discussed elsewhere in this document. We have already increased our work levels on the back of increasing supplier numbers in tower painting and in doing so have spent over £9m in 2011/12, as forecast in our RIIO-T1 submission. This is over £2m more than annual painting allowances within the Initial Proposals. For plant painting, we have undertaken recruitment of resources to co-ordinate the national programme and have begun to implement this maintenance policy during 2012/13. We are committed to this work and ensuring that totex costs are minimised but the Initial Proposals currently incentivise us to defer painting and instead wait for the inevitable increases in asset replacement to occur.
2 2010/11 was a low year of expenditure due to supplier constraints
0
2
4
6
8
10
12
14
16
£ M
illi
on
Tower painting Plant painting
National Grid Electricity Transmission September 2012
21
Cost efficiency
ITOMS results
71 We are an active participant in benchmarking activities undertaken through the International Transmission Operations and Maintenance Study (ITOMS), a worldwide study involving 25 to 28 TOs on a biannual basis. There have been several direct tower painting3 learning points that have been gained through participation within the group. We have undertaken studies regarding best practice, comparing ourselves with our closest European neighbours who have similar assets to us, located in similar environmental conditions. We have ongoing dialogues with our colleagues in Europe and have adopted a number of best practice data gathering and analysis techniques as a result of this collaboration (see for example the condition assessment improvements we are implementing). The two main TOs we work with adopt a similar 15 to 20 year intervention policy to ourselves.
72 The graph below highlights our tower painting costs in comparison to international comparators. The graph shows that we (shown as Y on the report) are on the average line for the cost of painting a square metre, as measured by dividing tower painting spend in the year by number of structures painted times the average square metres of structures painted. Although it highlights that our costs are only average, rather than at the upper quartile level we are very much in line with major European comparators who have similar assets located in a similar North European environment with comparable asset age:
Non-normalised factors
73 There are several reasons why our costs do not appear to be at the frontier level according to this graph. Most of the reasons return to the first section in this document when we discussed factors impacting on the rate of corrosion of metal work and also the
3 Plant painting is not large enough to be specifically considered by ITOMS yet
National Grid Electricity Transmission September 2012
22
section on cost drivers. These factors have not been normalised across the study – and nor could they be in a manner which took into account all elements – so remain as differences in unit costs (and volumes painted) between the relevant TOs. The main differences between the various TOs in the study which impact on the results in tower painting are:
(a) Environmental factors:
(i) Coastal: the UK has more coastline than many of the comparators within the study which increases both the wind speed (see below) and the salt content of the air which will cause more damage to the paint or galvanised layer on metalwork. The impacts of this factor can be seen in the Sizewell substation examples previously related in this document.
(ii) Wind: the UK has higher wind speeds than most comparator countries meaning that the towers are subjected to higher levels of impact from the environment. The wind speed graph on the attached link shows the UK has higher wind speeds than most of the rest of Europe and similar comparisons would apply worldwide: http://www.coriolis-energy.com/wind_energy/wind.html
(iii) Rainfall / time of wetness: the UK also has higher rainfall than most other countries and is of a higher humidity which drives a longer time of wetness for the towers. The European rainfall map on this link shows the comparison: http://www.eldoradocountyweather.com/forecast/climate/climate-maps/europe-annual-precip-map.html
With humidity shown on this link: http://www.sage.wisc.edu/atlas/maps.php?datasetid=53&includerelatedlinks=1&dataset=53
(iv) Lichen impacts: As noted above, due to lowering pollution levels, significant time and cost is spent on removing lichen from our towers to ensure that the paint adheres to the structure. This has increased our unit costs and will not be comparable across all members within ITOMS.
(b) Safety: As we are one of the more experienced companies at tower painting, history within the study shows that our methods and safety techniques are more advanced. We expect a high standard of safety from our contractors (as discussed within the ‘Cost drivers and constraints’ section of this document) and this increases unit costs.
(c) Age of assets: ITOMS does not normalise for the age or condition of the network which is being maintained. As discussed elsewhere in our response to the Initial Proposals, the older assets are, the more likely they are to be of a poorer condition, which drives the requirement for more costs. From a tower painting perspective, this is clear by looking at the deterioration curves provided in this document. Several of the ITOMS members have large proportions of their networks that have been built (or replaced) relatively recently in comparison to the UK, which will mean less costs for tower painting and hence a better ITOMS result because the study only focuses on opex, not totex.
74 Many of the ITOMS group of TOs do not undertake much or any tower painting. In some instances this is due to their assets being new so not requiring this work, for others it is because they use wooden poles rather than steel towers and for some because the more
National Grid Electricity Transmission September 2012
23
benign environment their towers are exposed to means that there is limited, if any, corrosion which occurs. In addition, we know of one TO within the study which does not paint towers because they cannot climb their towers due to safety reasons, except those that are over rivers where dedicated access ladders have been built into the design of towers, at an incremental capex cost.
Market testing
75 As discussed previously, tower painting work is currently subject to a nationally-negotiated tender each year. We are looking to extend these contracts in duration in order to give the contractors more visibility of workload and hence drive the further efficiencies which are embedded into our submission. These tenders are subject to European law and follow the procedures set out in tender guidance. We use contractor benchmarking to drive out the best price for the work and are trying to open up the market as much as possible to increase competition. The rates used are therefore what the market can deliver for and represent an efficient cost.
76 We are moving to this nationalised model for plant painting as well. Currently work is tendered to similar contractors used for the tower painting work and negotiated on a local basis. This drives value for the specific work undertaken but we cannot yet take advantage of stable, higher workloads which will drive value through national negotiation and coordination. This improvement is built into our plan.
Conclusions
77 ITOMS results show our costs for tower painting to be average compared to worldwide comparators but this is masking the impact of costs of differing environmental, safety and asset age factors between countries. These factors are not normalised for in the study but comparing our costs against European TOs with similar factors to ourselves show us to be at the same cost level.
78 Market testing is undertaken for all the painting work with tenders adhering to European law and procurement guidance. Nationalised contracts in tower painting drive value for a larger workload with the benefits from giving contractors a longer term view of workload and nationalising plant painting contracts embedded into our plan.
79 In addition, overall across all categories within ITOMS, we are a first quartile performing company on cost and close to the frontier on service. As discussed within the efficiency response to the Initial Proposals, this would suggest that limited, if any, catch up efficiency should be applied to our maintenance costs. Using the ITOMS data in tower painting (unadjusted for any environmental or other factors) to justify reductions, as Poyry have proposed, is not taking a balanced view of cost efficiency. If more efficiency were to be applied to tower painting costs then a lower factor should be applied to the other categories of expenditure for which we are considered frontier in ITOMS.
National Grid Electricity Transmission September 2012
24
Appendix
Referred documents
80 CIGRE report on “Quantifying the Strength of 40-year Old Lattice Towers And Pyramid Foundations”:
CIGRE 2008 B2-203.doc
81 Woodhouse Partnership reports on “Steel lattice tower painting policy” from 2009:
Woodhouse report 2009.doc
82 Woodhouse Partnership reports on “Steel lattice tower painting policy” from 2003:
Woodhouse report 2003.doc
83 British Standard BS EN ISO 9223:2012 - Corrosion of metals and alloys — Corrosivity of atmospheres — Classification, determination and estimation 2012
BS EN ISO 9223_2012