Embed Size (px)
Citation preview

March 2011
Results of the Minnesota Pilot Study for the National Groundwater Monitoring Network Prepared for the Advisory Committee on Water Information Subcommittee on Groundwater

Minnesota Department of Natural Resources 500 Lafayette Road North | Saint Paul, MN 55155 | www.dnr.state.mn.us | 651-296-6157 Toll free 888-646-6367 | TTY 651-296-5484
Minnesota Pollution Control Agency 520 Lafayette Road North | Saint Paul, MN 55155-4194 | www.pca.state.mn.us | 651-296-6300 Toll free 800-657-3864 | TTY 651-282-5332 This report is available in alternative formats upon request, and online at www.pca.state.mn.us
Document number: wq-gw1-03
Authors Michael MacDonald Minnesota Department of Natural Resources
Sharon Kroening Minnesota Pollution Control Agency
The MPCA is reducing printing and mailing costs by using the Internet to distribute reports and information to wider audience. Visit our web site for more information.
MPCA reports are printed on 100% post-consumer recycled content paper manufactured without chlorine or chlorine derivatives.

Contents Executive Summary ................................................................................................................. 1 Introduction ............................................................................................................................ 2
Purpose of study ..................................................................................................................................... 3 Description of study area ........................................................................................................................ 4 Aquifer in the pilot study ........................................................................................................................ 5
Collaboration and Cooperation ............................................................................................... 7 Water Level Trend Network Well Selection ............................................................................. 8
Unstressed Subnetwork .......................................................................................................................... 8 Targeted Subnetwork ........................................................................................................................... 14 Gap analysis ......................................................................................................................................... 14
Water Quality Network Well Selection .................................................................................. 15 Proposed network ................................................................................................................................. 15 Unstressed Subnetwork ........................................................................................................................ 16 Targeted Subnetwork ........................................................................................................................... 18 Gap analysis ......................................................................................................................................... 21
Field Practices........................................................................................................................ 24 Groundwater level monitoring field practices ........................................................................................ 24 Gap analysis ......................................................................................................................................... 24 Groundwater quality monitoring field practices .................................................................................... 24 Gap analysis ......................................................................................................................................... 24
Data Management System .................................................................................................... 25 Groundwater level monitoring data management practices .................................................................. 25 Gap analysis ......................................................................................................................................... 25 Groundwater quality monitoring data management practices .............................................................. 25 Comparison of MPCA water quality data management and the Framework Document ......................... 26 Gap Analysis ........................................................................................................................................ 26
Proposed Changes to the Framework Document ................................................................... 34 Benefits of the Network ........................................................................................................ 34 Cost Estimates ....................................................................................................................... 35
Cost to Participate in the pilot study ..................................................................................................... 35 Cost to operate and manage NGWMN wells ......................................................................................... 35 Cost to implement the changes identified in the gap analysis ................................................................ 36
References............................................................................................................................. 47 Appendix A ............................................................................................................................ 48
Summary of the optimal groundwater level monitoring network analysis ............................................. 48 Appendix B ............................................................................................................................ 49

Tables Table 1: Table of aquifers and relation to USGS principal aquifer codes ......................................................... 6
Table 2: Wells in the Unstressed Water-Quality Subnetwork ......................................................................... 18
Table 3: Wells in the Targeted Water-Quality Subnetwork ............................................................................ 20
Table 4: Comparison of NGWMN field standards to Minnesota DNR water level practices ............................. 27
Table 5: Comparison of NGWMN data elements to Minnesota DNR water level data elements ..................... 30
Table 6: Comparison of MPCA data elements to the proposed minimum criteria for the National Groundwater Monitoring Network (MPCA, Minnesota Pollution Control Agency; CWI, County Well Index; EQuIS, Environmental Quality Information System) ....................................................................................... 37
Table 7: Estimated costs for Minnesota for the NGWMN Pilot Project ........................................................... 45
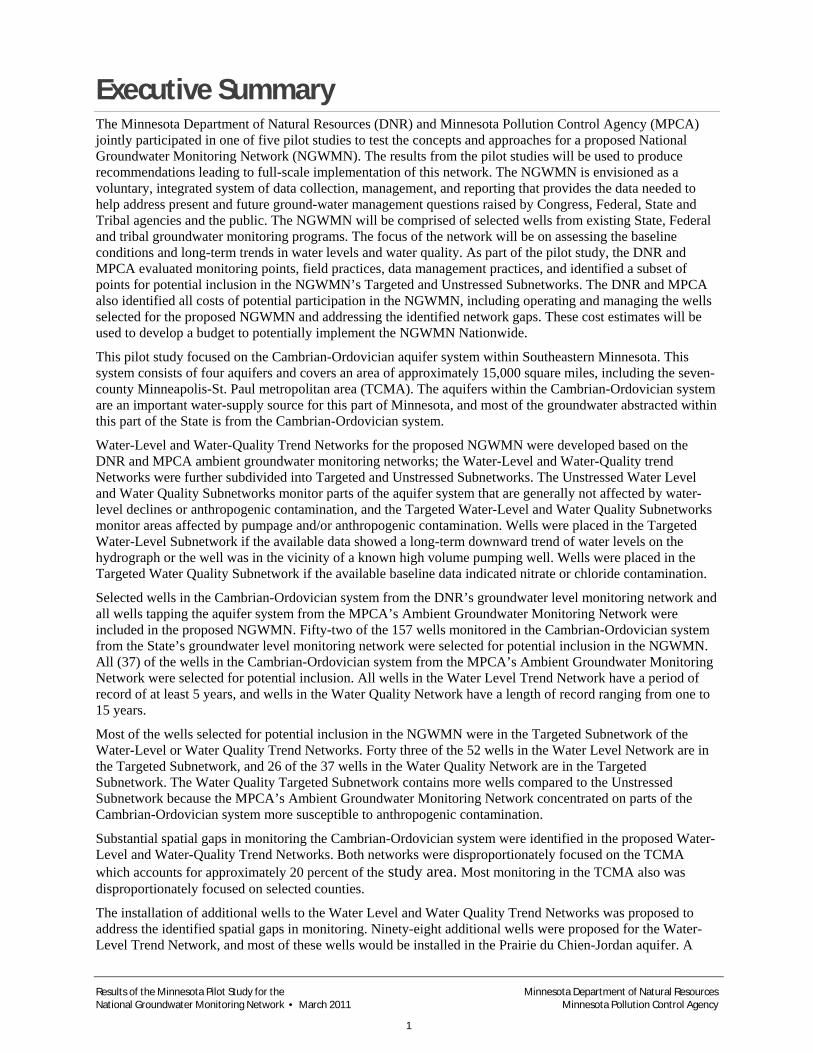
Figures Figure 1: Cambrian-Ordovician Aquifer System in Minnesota ........................................................................ 5
Figure 2: Proposed National Groundwater Monitoring Network Water-Level Sites in the Upper Ordovician Aquifers ........................................................................................................................................................ 10
Figure 3: Proposed National Groundwater Monitoring Network Water-Level Sites in the Prairie du Chien-Jordan Aquifer .............................................................................................................................................. 11
Figure 4: Proposed National Groundwater Monitoring Network Water-Level Sites in the Tunnel City/Wonewoc Aquifer .................................................................................................................................. 12
Figure 5: Proposed National Groundwater Monitoring Network Water-Level Sites in the Mt. Simon Aquifer . 13
Figure 6: Proposed National Groundwater Monitoring Network Water-Quality Sites for the Unstressed Water-Quality Subnetwork ........................................................................................................................... 17
Figure 7: Proposed National Groundwater Monitoring Network Water-Quality Sites for the Targeted Water-Quality Subnetwork ........................................................................................................................... 19
Figure 8: Proposed Water-Quality Surveillence Monitoring Network grid for the Prairie du Chien-Jordan Aquifer .......................................................................................................................................................... 23
Executive Summary The Minnesota Department of Natural Resources (DNR) and Minnesota Pollution Control Agency (MPCA) jointly participated in one of five pilot studies to test the concepts and approaches for a proposed National Groundwater Monitoring Network (NGWMN). The results from the pilot studies will be used to produce recommendations leading to full-scale implementation of this network. The NGWMN is envisioned as a voluntary, integrated system of data collection, management, and reporting that provides the data needed to help address present and future ground-water management questions raised by Congress, Federal, State and Tribal agencies and the public. The NGWMN will be comprised of selected wells from existing State, Federal and tribal groundwater monitoring programs. The focus of the network will be on assessing the baseline conditions and long-term trends in water levels and water quality. As part of the pilot study, the DNR and MPCA evaluated monitoring points, field practices, data management practices, and identified a subset of points for potential inclusion in the NGWMN’s Targeted and Unstressed Subnetworks. The DNR and MPCA also identified all costs of potential participation in the NGWMN, including operating and managing the wells selected for the proposed NGWMN and addressing the identified network gaps. These cost estimates will be used to develop a budget to potentially implement the NGWMN Nationwide.
This pilot study focused on the Cambrian-Ordovician aquifer system within Southeastern Minnesota. This system consists of four aquifers and covers an area of approximately 15,000 square miles, including the seven-county Minneapolis-St. Paul metropolitan area (TCMA). The aquifers within the Cambrian-Ordovician system are an important water-supply source for this part of Minnesota, and most of the groundwater abstracted within this part of the State is from the Cambrian-Ordovician system.
Water-Level and Water-Quality Trend Networks for the proposed NGWMN were developed based on the DNR and MPCA ambient groundwater monitoring networks; the Water-Level and Water-Quality trend Networks were further subdivided into Targeted and Unstressed Subnetworks. The Unstressed Water Level and Water Quality Subnetworks monitor parts of the aquifer system that are generally not affected by water-level declines or anthropogenic contamination, and the Targeted Water-Level and Water Quality Subnetworks monitor areas affected by pumpage and/or anthropogenic contamination. Wells were placed in the Targeted Water-Level Subnetwork if the available data showed a long-term downward trend of water levels on the hydrograph or the well was in the vicinity of a known high volume pumping well. Wells were placed in the Targeted Water Quality Subnetwork if the available baseline data indicated nitrate or chloride contamination.
Selected wells in the Cambrian-Ordovician system from the DNR’s groundwater level monitoring network and all wells tapping the aquifer system from the MPCA’s Ambient Groundwater Monitoring Network were included in the proposed NGWMN. Fifty-two of the 157 wells monitored in the Cambrian-Ordovician system from the State’s groundwater level monitoring network were selected for potential inclusion in the NGWMN. All (37) of the wells in the Cambrian-Ordovician system from the MPCA’s Ambient Groundwater Monitoring Network were selected for potential inclusion. All wells in the Water Level Trend Network have a period of record of at least 5 years, and wells in the Water Quality Network have a length of record ranging from one to 15 years.
Most of the wells selected for potential inclusion in the NGWMN were in the Targeted Subnetwork of the Water-Level or Water Quality Trend Networks. Forty three of the 52 wells in the Water Level Network are in the Targeted Subnetwork, and 26 of the 37 wells in the Water Quality Network are in the Targeted Subnetwork. The Water Quality Targeted Subnetwork contains more wells compared to the Unstressed Subnetwork because the MPCA’s Ambient Groundwater Monitoring Network concentrated on parts of the Cambrian-Ordovician system more susceptible to anthropogenic contamination.
Substantial spatial gaps in monitoring the Cambrian-Ordovician system were identified in the proposed Water-Level and Water-Quality Trend Networks. Both networks were disproportionately focused on the TCMA which accounts for approximately 20 percent of the study area. Most monitoring in the TCMA also was disproportionately focused on selected counties.
The installation of additional wells to the Water Level and Water Quality Trend Networks was proposed to address the identified spatial gaps in monitoring. Ninety-eight additional wells were proposed for the Water-Level Trend Network, and most of these wells would be installed in the Prairie du Chien-Jordan aquifer. A
Results of the Minnesota Pilot Study for the Minnesota Department of Natural Resources National Groundwater Monitoring Network • March 2011 Minnesota Pollution Control Agency
1

Surveillance Monitoring Network, focusing on the Prairie du Chien-Jordan aquifer, was recommended to enhance the Water-Quality Trend Network. The Surveillance Monitoring Network primarily would utilize existing wells, but included installing approximately 20 additional wells in areas with no existing wells.
Few modifications were needed to the DNR’s and MPCA’s field practices to meet the requirements of the NGWMN. The agencies’ current practices generally are similar to those described in the current guidance for the NGWMN.
The DNR and MPCA’s data management systems would require modifications to meet the requirements for the NGWMN. Less than 25 percent of the proposed data elements for the NGWMN currently are available in the DNR’s data management system, and over 50 percent of the proposed data elements are available in data management systems maintained by the MPCA and Minnesota Department of Health. Some of the proposed minimum data elements are considered private information by the State of Minnesota, and the data management systems cannot be modified to include these data elements for the NGWMN.
As a result of this pilot study, several changes are recommended to the guidance developed for the NGWMN prior to final implementation. Additional guidance is needed to assist the states in determining the number of wells required for a National assessment of groundwater conditions. The states require finer-scale information to meet their needs compared to those of the NGWMN, and it is likely that not all of the state-level information is necessary to meet the goals of the NGWMN.
Because of the relative ease with which water levels can be obtained, it is suggested that the NGWMN increase the recommended frequency of water level measurements. The guidance also should be revised to lengthen the water quality sampling frequency in aquifers with longer residence times, such as many of those in the Cambrian-Ordovician aquifer system. Many wells in this system within Minnesota can be sampled at a longer frequency than those suggested in the guidance and still adequately characterize seasonal and temporal trends.
Additional guidance also is needed in defining the definition of Unstressed or Targeted wells. There is minimal guidance in the Framework document detailing the definition of these categories. To insure consistency across the NGWMN, a better definition of Unstressed and Targeted is needed.
Introduction Groundwater is the source of drinking water for more than 130 million Americans each day. Of the 83,300 million gallons per day (Mgal/d) of groundwater used in 2000, 68 percent was used for irrigation, about 23 percent was used for public supply and domestic use, four percent for industrial use, and the remainder for livestock, aquaculture, mining, and power generation (Hutson and others, 2004). About 35 percent of the Nation’s irrigation water supply is obtained from groundwater. Although overall water use in the USA has been relatively steady for more than 20 years, groundwater use has continued to increase, primarily as a percentage of public supply and irrigation. In addition to human uses, many ecosystems are dependent on groundwater discharge to streams, lakes, and wetlands.
The Nation’s groundwater resources are under stress and require increased interstate and national attention to assure sustainable use of the resource. State, Federal and local agencies have documented significant impacts to major and minor aquifers throughout the USA. Impacts include declining water levels and groundwater contamination from chemical use and waste disposal. In addition, climate change may result in increased flooding which could significantly affect groundwater quality and increased drought periods can significantly affect groundwater levels. Increased groundwater demand is expected in all sectors of the economy, including the heavy use sectors of agriculture, drinking water, and energy production. Increased biomass production will increase demand on groundwater for water supply to produce fuels and further degrade water quality as a result of increased agrichemical application and residuals disposal. These activities threaten the aquifers directly as well as groundwater dependent ecosystems and the baseflow of streams supported by groundwater discharge. Proposals for geologic sequestration of carbon dioxide present the potential to acidify groundwaters if migration of the carbon dioxide to adjacent aquifers occurs. Additionally, brackish and saline groundwaters are likely to be increasingly developed and treated in water deficient areas and may compete as locations for carbon sequestration. As groundwater use increases, it is imperative to improve the overall management of the
Results of the Minnesota Pilot Study for the Minnesota Department of Natural Resources National Groundwater Monitoring Network • March 2011 Minnesota Pollution Control Agency
2
resource. An integrated local, State, Tribal, and Federal partnership approach is needed to accommodate multi-jurisdictional issues, effective management of trans-boundary aquifers and promote stakeholder involvement.
Sustainable groundwater management is currently constrained by the lack of a nationally integrated groundwater monitoring network focused on providing water level and water quality data for regionally and locally important aquifers. The need for a national groundwater monitoring network has been recognized by numerous water resource agencies. To address this concern the Subcommittee on Groundwater (SOGW) was established in 2007 as an ad-hoc committee under the Federal Advisory Committee on Water Information (ACWI). The SOGW, which includes more than 70 people representing 55 different organizations, was charged with developing a framework that establishes and encourages implementation of a long-term groundwater quantity and quality monitoring network. This network is intended to provide data and information necessary for planning, management, and development of groundwater supplies to meet current and future water needs, including ecosystem requirements. The SOGW issued a June 2009 report entitled A National Framework for Ground-Water Monitoring in the United States, hereinafter referred to as the Framework Document, (http://acwi.gov/sogw/pubs/tr/sogw_tr1_framework_june_2009_Final.pdf). This report describes a framework for the establishment and long-term operation and use of a National Ground-Water Monitoring Network (NGWMN).
The NGWMN is envisioned as a voluntary, integrated system of data collection, management, and reporting that provides the data needed to help address present and future groundwater management questions raised by Congress, Federal, State, and Tribal agencies and the public. The NGWMN will be comprised of a compilation of selected wells from existing State, Federal, and tribal groundwater monitoring programs. The focus of the network will be on assessing the baseline conditions and long-term trends in water levels and water quality. As proposed, the NGWMN will include two monitoring sub-networks: a sub-network that focuses on monitoring unstressed parts of principle aquifers and aquifer systems and a sub-network that targets areas of concern within aquifers and aquifer systems (typically contaminated areas and areas where water-level declines are of concern). Monitoring within the NGWMN will include four different categories: baseline monitoring, trend monitoring, surveillance monitoring, and special studies monitoring.
Groundwater level monitoring has been conducted for many decades in many states. Data from these networks have been used to help identify, develop, and manage groundwater supplies at the local and State level. Groundwater quality monitoring programs have been developed more recently in response to the focus on water quality that resulted from passage of the Safe Drinking Water Act, the Clean Water Act, the Comprehensive Environmental Response, Compensation, and Liability Act (CERCLA) and other environmental laws. As of 2007, 37 states operated statewide or regional groundwater monitoring networks and 33 states have at least one active groundwater quality monitoring program. The state monitoring networks are funded using a combination of State and Federal funds. The networks are operated by a variety of State agencies, many of them in cooperation with the United States Geological Survey (USGS). The networks operate under a variety of specific State / Tribal / local goals and objectives and are not necessarily focused on all of the important aquifers within a State or Reservation. As a result, it is very difficult to use these groundwater monitoring programs to evaluate groundwater availability and rates of use on a regional or national basis. Because many aquifers support multiple jurisdictions, a focus on monitoring at the aquifer level rather than at a political subdivision is critical to facilitate sustainable groundwater use.
Purpose of study One of the three key recommendations included in the Framework Document is to develop and conduct a limited number of pilot studies to: (a) test the NGWMN concepts and approaches detailed in the Framework document, (b) evaluate the feasibility and resources necessary to implement a national network, and (c) produce recommendations leading to full scale implementation. The pilot projects were initiated in early 2010 and are expected to be completed by March 2011. Each of the pilot projects has addressed the following objectives:
1) Evaluate the feasibility of designing network segments within one or more principal, major or other important aquifers, using conceptual groundwater flow models as the primary network design element.
2) Determine methods to establish unstressed and targeted sub-networks within the target aquifer(s)
Results of the Minnesota Pilot Study for the Minnesota Department of Natural Resources National Groundwater Monitoring Network • March 2011 Minnesota Pollution Control Agency
3
Results of the Minnesota Pilot Study for the Minnesota Department of Natural Resources National Groundwater Monitoring Network • March 2011 Minnesota Pollution Control Agency
4
3) Test the design of the NGWMN and its ability to provide water level and quality data to large scale assessments of the groundwater resource.
4) Determine the feasibility and design parameters of a central, web-based data portal that will allow NGWMN to gather and disseminate data, as well as promote data sharing among data providers and the public.
5) Test and assess the effectiveness of coordination, cooperation, and collaboration mechanisms among federal, state, regional, local, and tribal data collectors, providers, and managers.
6) Investigate methods to ensure that data collected by the data providers and, therefore, the NGWMN as a whole are comparable. Data elements, including site characteristics, well construction and details, the frequency of water-level-measurements, water quality analytes, water-level-measurement procedures, water quality sampling procedures, and written standard operating procedures will all be evaluated.
7) Determine the timeframe and costs associated with adding, upgrading, or developing a state, tribal, or local well network and data management system that meets the criteria and needs of the NGWMN and identify a subset of proposed monitoring points as meeting NGWMN’s “targeted” or “unstressed” sub-network design criteria.
Each pilot will need to evaluate potential monitoring points within each principal, major, or other important aquifer for potential inclusion in the NGWMN and identify a subset of proposed monitoring points as meeting NGWMN’s “targeted” or “un-stressed” sub-network design criteria. In addition, each pilot will identify all costs of potential participation in a NGWMN that are specific to the particular Pilot State on a total and per well basis, as appropriate, including historical costs for the development and maintenance of their existing network; one-time start-up costs; and capital, operational, and maintenance costs associated with filling data gaps. Each pilot will also interface with the NGWMN data portal that is under development by the USGS.
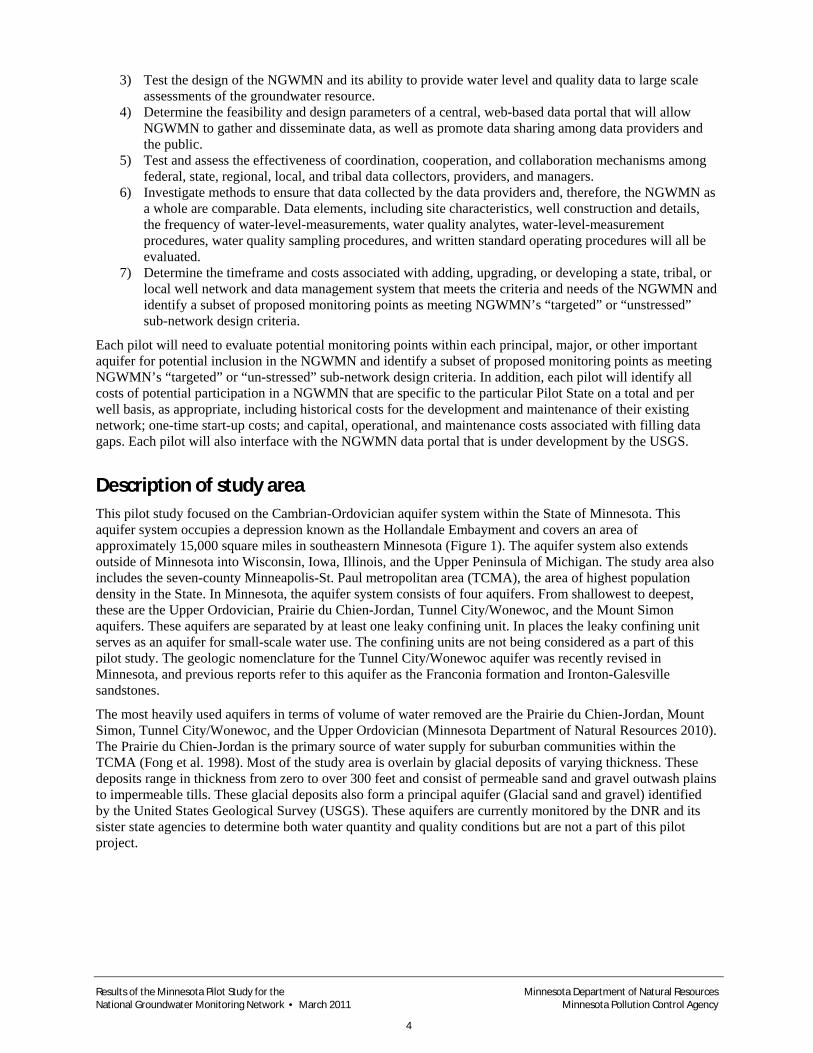
Description of study area This pilot study focused on the Cambrian-Ordovician aquifer system within the State of Minnesota. This aquifer system occupies a depression known as the Hollandale Embayment and covers an area of approximately 15,000 square miles in southeastern Minnesota (Figure 1). The aquifer system also extends outside of Minnesota into Wisconsin, Iowa, Illinois, and the Upper Peninsula of Michigan. The study area also includes the seven-county Minneapolis-St. Paul metropolitan area (TCMA), the area of highest population density in the State. In Minnesota, the aquifer system consists of four aquifers. From shallowest to deepest, these are the Upper Ordovician, Prairie du Chien-Jordan, Tunnel City/Wonewoc, and the Mount Simon aquifers. These aquifers are separated by at least one leaky confining unit. In places the leaky confining unit serves as an aquifer for small-scale water use. The confining units are not being considered as a part of this pilot study. The geologic nomenclature for the Tunnel City/Wonewoc aquifer was recently revised in Minnesota, and previous reports refer to this aquifer as the Franconia formation and Ironton-Galesville sandstones.
The most heavily used aquifers in terms of volume of water removed are the Prairie du Chien-Jordan, Mount Simon, Tunnel City/Wonewoc, and the Upper Ordovician (Minnesota Department of Natural Resources 2010). The Prairie du Chien-Jordan is the primary source of water supply for suburban communities within the TCMA (Fong et al. 1998). Most of the study area is overlain by glacial deposits of varying thickness. These deposits range in thickness from zero to over 300 feet and consist of permeable sand and gravel outwash plains to impermeable tills. These glacial deposits also form a principal aquifer (Glacial sand and gravel) identified by the United States Geological Survey (USGS). These aquifers are currently monitored by the DNR and its sister state agencies to determine both water quantity and quality conditions but are not a part of this pilot project.
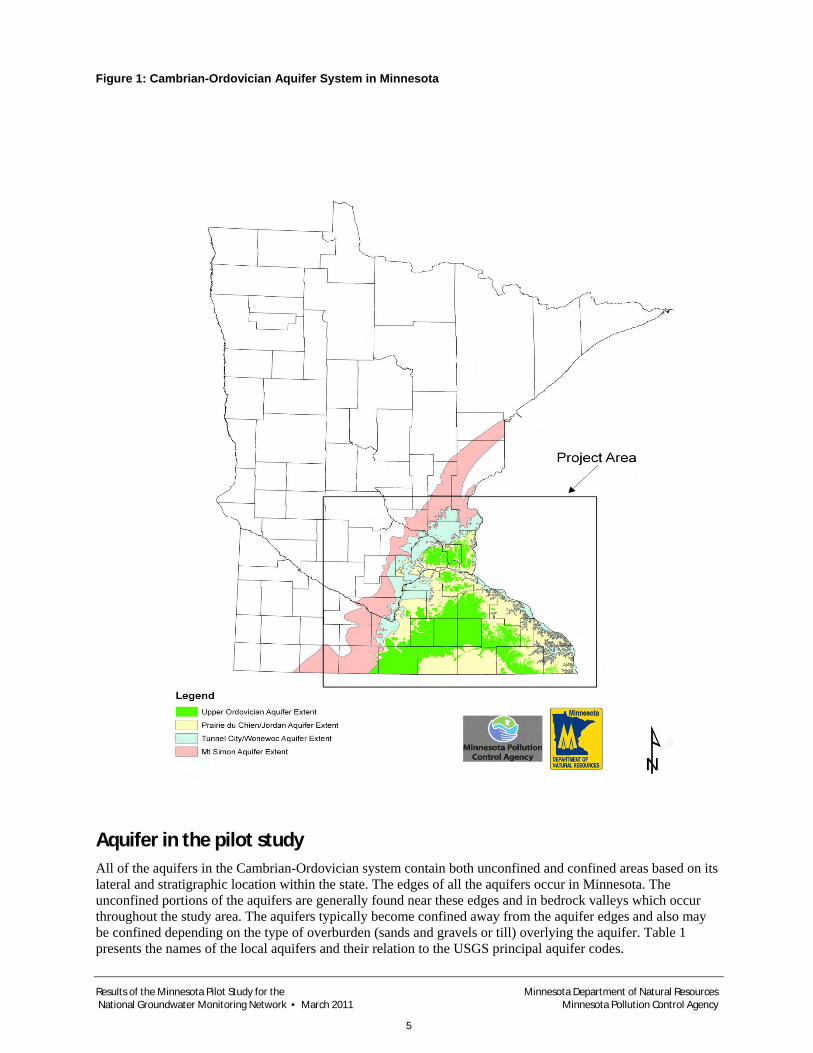
Figure 1: Cambrian-Ordovician Aquifer System in Minnesota
Aquifer in the pilot study All of the aquifers in the Cambrian-Ordovician system contain both unconfined and confined areas based on its lateral and stratigraphic location within the state. The edges of all the aquifers occur in Minnesota. The unconfined portions of the aquifers are generally found near these edges and in bedrock valleys which occur throughout the study area. The aquifers typically become confined away from the aquifer edges and also may be confined depending on the type of overburden (sands and gravels or till) overlying the aquifer. Table 1 presents the names of the local aquifers and their relation to the USGS principal aquifer codes.
Results of the Minnesota Pilot Study for the Minnesota Department of Natural Resources National Groundwater Monitoring Network • March 2011 Minnesota Pollution Control Agency
5

Table 1: Table of aquifers and relation to USGS principal aquifer codes
Local aquifer group Local name System name Aquifer code
Upper Ordovician
Galena Group Ordovician S300CAMORD
St. Peter Sandstone Ordovician S300CAMORD
Prairie du Chien/Jordan
Prairie du Chien Group Ordovician S300CAMORD
Jordan Sandstone Cambrian S300CAMORD
Tunnel City Group/Wonewoc
St. Lawrence Formation Cambrian S300CAMORD
Tunnel City Group Cambrian S300CAMORD
Wonewoc Sandstone Cambrian S300CAMORD
Eau Claire Formation Cambrian S300CAMORD
Mt. Simon
Mt. Simon Sandstone Cambrian S300CAMORD
Upper Ordovician aquifer The Upper Ordovician aquifer is composed four formations. The Galena Group, a shaley limestone and limestone/dolostone; the Platteville formation, a dolomitic limestone; the Glenwood Formation, a shale and argillaceous quartz sandstone; and the St. Peter sandstone, a fine grained orthoquartize.
Prairie du Chien Jordan aquifer The Prairie du Chien-Jordan aquifer consists of the Prairie du Chien Group and the Jordan Sandstone. The Prairie du Chien Group consists of two dolomites, the Oneota Dolomite and the Shakopee Formation. The Jordan is a fine to medium quartzose sandstone. The Prairie du Chien and Jordan often are considered as one aquifer. In many locations both aquifers react similarly to pumpage, and many wells are installed through both units. For the Pilot Project these aquifers are considered one unit. The Jordan Sandstone has a greater porosity, but the Prairie du Chien Group has a greater yield, particularly at shallower depths.
Tunnel City/Wonewoc aquifer The Tunnel City/Wonewoc aquifer consists of the Tunnel City Group and the Wonewoc Sandstone. The Tunnel City Group is a very fine grained sandstone to siltstone. The Wonewoc Sandstone is comprised of medium grained quartzose sand. The two formations are considered one aquifer in the southern portion of the study area.
Mount Simon aquifer/Eau Claire Formation The deepest aquifer unit in the study area is the Mount Simon Sandstone. This unit is comprised of medium grained quartzose sand and a few thin shale beds.
Two of the wells in the Water-Level Network are installed in the Eau Claire Formation, a silty/shaly fine-grained sandstone. The Eau Claire is considered a confining layer between the Wonewoc and Mt. Simon aquifers. While the study does not include confining units, the location and depth of these two wells and their length of record makes them valuable data points. In this report, they are presented and described with the Mt. Simon aquifer wells.
Results of the Minnesota Pilot Study for the Minnesota Department of Natural Resources National Groundwater Monitoring Network • March 2011 Minnesota Pollution Control Agency
6

Collaboration and Cooperation The Minnesota Department of Natural Resources (DNR) and the Minnesota Pollution Control Agency (MPCA) collaborated in this pilot study for the NGWMN. The DNR and MPCA tested the NGWMN concepts and approaches in the Framework Document with respect to water-level and water-quality monitoring, respectively. This collaborative approach was necessary since Minnesota employs a multi-agency approach to groundwater monitoring and protection. As part of this multi-agency approach, the DNR is responsible for assessing and managing the State’s groundwater supply and availability. Three state agencies, including the MPCA, are charged with assessing and managing the quality of the State’s groundwater. Only the MPCA collaborated with the water-quality aspects of the pilot study because this agency maintains the largest network of wells within the study area.
Full implementation of the NGWMN in Minnesota likely will include the collaboration and cooperation from several other State and Federal agencies. These agencies include the Minnesota Department of Agriculture (MDA), Minnesota Department of Health (MDH), Metropolitan Council, and US Geological Survey (USGS). State legislation established the agency responsibilities for groundwater monitoring and assessment. The DNR is charged with managing the availability of the state’s groundwater resource. It does this through groundwater monitoring and permitting groundwater removal. The DNR also conducts mapping to indicate where groundwater is susceptible to anthropogenic contamination due to natural features. The Metropolitan Council is the lead agency for water-supply planning in the TCMA. The MDA, MDH, and MPCA share groundwater-quality monitoring and protection responsibilities. The MDA monitors agricultural chemicals in the groundwater, and the MPCA monitors all other contaminants. The MDH is responsible for the public-health-related aspects of groundwater and is charged with monitoring public drinking water supply systems, well management, and developing state health-risk limits for chemicals present in the groundwater.
The MDA has conducted groundwater monitoring since 1985 and maintains an ambient monitoring network in the agricultural parts of the State. This network is designed to provide information necessary to manage pesticide use for water-quality protection. The network currently focuses on the upper part of the surficial sand and gravel aquifers and regular sampling for agricultural chemicals, especially pesticides, from these wells is conducted.
The MDH monitors to safeguard human health, especially with regard to drinking water supplies. Specific monitoring conducted by the MDH includes characterizing the general water-quality in the State’s public water-supply systems, characterizing the occurrence and distribution of naturally-occurring contaminants, and investigating specific problems. The MDH also maintains a database which contains well construction information for all wells in the state. This database is known as the County Well Index (CWI) and was developed jointly by the Minnesota Geological Survey and MDH (Wahl and Tipping 1991). The CWI stores information on well construction, aquifer lithology, and the well location. Data describing the aquifer lithology and the aquifer the well intersects only is listed in the CWI if a geologist from the Minnesota Geological Survey has reviewed the well log.
The Metropolitan Council developed a groundwater-flow model of the major aquifers in the TCMA for water-supply planning efforts (Metropolitan Council 2009). This model may be used in future efforts to define the scope of new monitoring conducted as part of the NGWMN.
The USGS also collects groundwater data in the State as part of the National Water-Quality Assessment (NAWQA) and studies conducted as part of its Federal-State Cooperative Program. NAWQA monitoring includes the Prairie du Chien-Jordan and surficial sand and gravel aquifers. Many USGS investigations have quantified groundwater-flow and quality conditions in the study area; these results likely will be used to define the scope of future monitoring.
Results of the Minnesota Pilot Study for the Minnesota Department of Natural Resources National Groundwater Monitoring Network • March 2011 Minnesota Pollution Control Agency
7
Water Level Trend Network Well Selection The proposed Water-Level Trend Network contains wells measured as part of the DNR’s groundwater-level monitoring network. The DNR has maintained this network since 1944. The network currently contains about 750 wells, and 157 of these wells are in the Cambrian-Ordovician system. Data from this network are used to assess groundwater resources, determine long-term trends, interpret impacts of pumping and climate, plan for water conservation, or evaluate water conflicts. Wells monitored by the MPCA were not included in the Water-Level Trend Network since most of these wells are actively used to supply water to individual residences.
Water levels are measured from the DNR groundwater level monitoring network wells by Soil and Water Conservation District personnel, under contract to the DNR. Most wells are measured once a month from June through November and twice during the months of March through May for a total of eight measurements annually. This measurement record documents the water levels during spring recharge, the period of summer appropriation, and expected reduction in use in the fall. Water levels are not collected in the winter when there is little recharge and water use is typically at its lowest levels. All water levels are reported as depth below ground surface.
All wells proposed for the Water-Level Trend Network are identified by the Minnesota Unique Well Number. This is a unique number assigned to each well in the State (regardless of type) by the MDH. These wells also have an associated DNR-specific identification number that identifies the county where the well is located and sequence of adoption into the network. Wells were selected for the proposed Water-Level Trend Network based on the amount of available historical data and were further subdivided into the Unstressed and Targeted Subnetworks.
Wells selected for the proposed NGWMN were required to have at least five years of existing data, which is the baseline monitoring period defined in the Framework Document for the NGWMN. Wells were placed in the Targeted Water-Level Subnetwork if the available data showed a long-term downward trend in water levels or the well was in the vicinity (within five miles) of a known high-volume pumping well (a well that pumps over 10,000 gallons a day or over 1,000,000 gallons a year); all other wells were placed in the Unstressed Subnetwork. While this method for placing wells into the Targeted Subnetwork can be subjective, based on the nature of the aquifer system in the study area, this method allows consideration of influences on an aquifer system that is used to produce water.
Fifty-two wells were selected for inclusion into the Water-Level Trend Network. All of these wells have a length of record of at least five years, and twenty-two wells have over 20 years of record. The wells are generally monitoring wells or former water-supply wells. Well construction information is available for all of the wells. Three of the wells are actively pumped. These wells supply a small amount of water to facilities such as a township hall or fish hatchery office. There is limited pumping associated with these wells because of the transient nature of the population using the facilities.
Unstressed Subnetwork The Unstressed Subnetwork provides information on the groundwater levels in parts of the aquifer system that are currently assumed to be unaffected by anthropogenic influences. This subnetwork provides a comparison to measurements from the Targeted Subnetwork. It also provides information about changes to the aquifers related to climatic changes or other natural changes in groundwater flow.
The Unstressed Subnetwork contains nine wells tapping the Upper Ordovician, the Prairie du Chien-Jordan, Tunnel City/Wonewoc, and the Mt. Simon aquifers.
Results of the Minnesota Pilot Study for the Minnesota Department of Natural Resources National Groundwater Monitoring Network • March 2011 Minnesota Pollution Control Agency
8
The Upper Ordovician aquifer Two wells from the Upper Ordovician aquifer are included in the Unstressed Subnetwork (Figure 2). One well is in the confined part of the Galena aquifer in southeastern Minnesota and has 33 years of record. In the vicinity of this well, the aquifer is overlain by glacial deposits. The second well is a former apartment building supply well in the St. Peter aquifer in the TCMA and has 39 years of record. Although this well was a supply well, it has not been used in a long time, and the building and surrounding area have been on municipal water supply for approximately 50 years.
Prairie du Chien-Jordan Four wells tapping the Prairie du Chien-Jordan aquifer were included in the Unstressed Subnetwork (Figure 3). The wells in the Unstressed Subnetwork are concentrated in the northern portion of the aquifer in the TCMA and along the eastern edge of the state with no wells in the south central portion of the study area. Two wells are located within the confined parts of the Prairie du Chien-Jordan where the aquifer is overlain by glacial deposits or an overlying bedrock aquifer. Of these, one well is located within the TCMA, and the second is in the central part of the aquifer. The other two wells are in the unconfined part of the aquifer, on the eastern edge of the study area, along the Mississippi and St. Croix Rivers. One of these wells is in the TCMA and the second is located on the southeastern corner of the state. The well in the southeast corner of the state is in a well nest with other wells in the Unstressed Subnetwork which tap the Tunnel City/Wonewoc and Mt. Simon aquifers.
Results of the Minnesota Pilot Study for the Minnesota Department of Natural Resources National Groundwater Monitoring Network • March 2011 Minnesota Pollution Control Agency
9
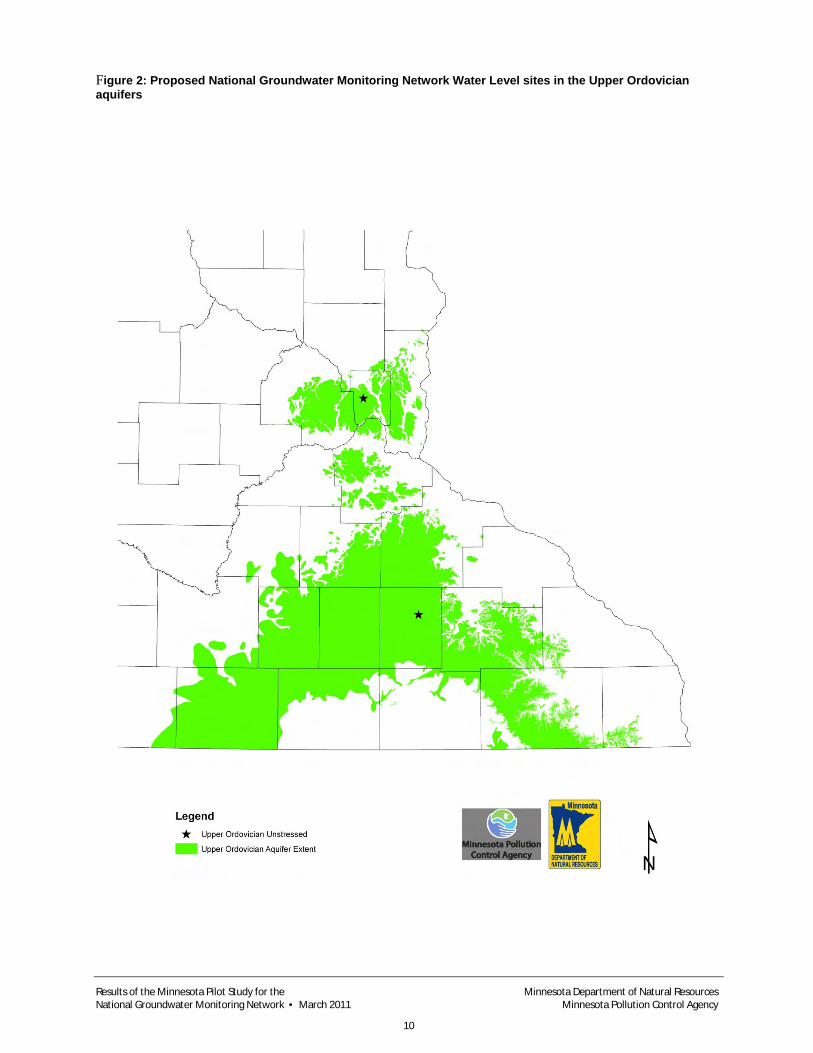
Figure 2: Proposed National Groundwater Monitoring Network Water Level sites in the Upper Ordovician aquifers
Results of the Minnesota Pilot Study for the Minnesota Department of Natural Resources National Groundwater Monitoring Network • March 2011 Minnesota Pollution Control Agency
10

Figure 3: Proposed National Groundwater Monitoring Network Water Level sites in the Prairie du Chien-Jordan aquifer
Results of the Minnesota Pilot Study for the Minnesota Department of Natural Resources National Groundwater Monitoring Network • March 2011 Minnesota Pollution Control Agency
11

Tunnel City/Wonewoc aquifer Two wells from the Tunnel City/Wonewoc aquifer are included in the Unstressed Subnetwork (Figure 4). One is located in the confined part of the aquifer where the aquifer is overlain by glacial deposits. This well is along the northern edge of the aquifer in the TCMA. The second well is in an unconfined part of the aquifer in the southeast corner of the study area and is located on the bluffs of the Mississippi River.
Figure 4: Proposed National Groundwater Monitoring Network Water Level Sites in the Tunnel City/Wonewoc aquifer
Results of the Minnesota Pilot Study for the Minnesota Department of Natural Resources National Groundwater Monitoring Network • March 2011 Minnesota Pollution Control Agency
12

Mt. Simon aquifer One well from the Mt. Simon aquifer is included in the Unstressed Subnetwork (Figure 5). The well is in an unconfined part of the aquifer in the southeast corner of the study area and is located on the bluffs along the Mississippi River.
Figure 5: Proposed National Groundwater Monitoring Network Water Level sites in the Mt. Simon aquifer
Results of the Minnesota Pilot Study for the Minnesota Department of Natural Resources National Groundwater Monitoring Network • March 2011 Minnesota Pollution Control Agency
13

Targeted Subnetwork The majority of the wells in the Water-Level Trend Network were placed in the Targeted Subnetwork. The available baseline data from these wells showed a long-term downward trend in groundwater levels or are near (within five miles) of a high-volume pumping wells.
Prairie du Chien-Jordan aquifer Twenty-five wells tapping the Prairie du Chien-Jordan aquifer are included in the Targeted Subnetwork (Figure 3). Most of the wells are located in the TCMA (20) and likely represent confined conditions since most of the aquifer is overlain by glacial deposits or an overlying bedrock aquifer. The wells are distributed throughout the aquifer.
Tunnel City/Wonewoc aquifer Nine wells tapping the Tunnel City/Wonewoc aquifer are included in the Targeted Subnetwork (Figure 4). All of these wells are located in the TCMA and likely represent confined conditions. The wells generally are installed in both the Tunnel City Sandstone and the Wonewoc Formation.
Mount Simon aquifer Nine wells tapping the Mt. Simon aquifer are included in the Targeted Subnetwork (Figure 5). Most of these wells (six) are located in the TCMA. There are no wells in the southern and central potions of the aquifer. The wells located along the eastern edge of the study area generally represent unconfined conditions since the wells near the Mississippi and St. Croix Rivers where the overlying confining layers were eroded away. The remaining wells are located in confined parts of the aquifer.
Gap analysis The current Water-Level Trend Monitoring Network is disproportionately focused on the TCMA and does not describe water levels throughout the entire Cambrian-Ordovician system in Minnesota. Sixty-nine percent of the monitored wells are located within the TCMA, even though this area accounts for approximately 20 percent of the area underlain by the Cambrian-Ordovician system. Within the TCMA, 50 percent of the wells are located in three of the eleven counties. Most monitoring has focused on the Prairie du Chien-Jordan aquifer since most of the groundwater appropriated in the study area is from this aquifer.
Additional water-level measurements are needed from wells in the Targeted Subnetwork to meet the guidance specified in the Framework Document. The current monitoring schedule provides a snapshot of the water levels in the wells but does not allow for detailed study of the aquifer response to climate or withdrawals. This is especially true in portions of the Study Area where there is high recharge or there are many withdrawals. The current schedule also does not provide sufficient data for the State’s needs. A recent study in Minnesota (Delin and Faltiesek, 2007) indicated that water-level measurement frequency is important in evaluating groundwater recharge. Measurements made less frequently than about once per week resulted in as much as a 48 percent underestimation of recharge based on an hourly measurement. Frequent measurements of groundwater levels are also appropriate where climatic conditions are variable, where the aquifers supply large quantities of water, where shallow aquifers are part of the monitoring program, and where recharge rates are high. Because Minnesota has all of these conditions, frequent water level measurements are needed. Hydrographs made from continuous data allow the best estimates of maximum and minimum water levels in the aquifers and can reveal the immediate impact of groundwater withdrawals (Minnesota DNR, 2009).
The spatial gaps in the Water-Level Trend Monitoring Network are proposed to be addressed by installing additional wells to the network based on existing plans to enhance the State’s groundwater level monitoring network. An additional 98 wells are required to meet the NGWMN needs. These wells will be a small subset of the number required to meet State monitoring needs which has been documented in a report recently completed by the Minnesota DNR (2010) a summary of which is included in Appendix A. The new wells would be distributed across the four aquifers as detailed below:
Results of the Minnesota Pilot Study for the Minnesota Department of Natural Resources National Groundwater Monitoring Network • March 2011 Minnesota Pollution Control Agency
14

• Upper Ordovician aquifer – 28 new wells, 30 total wells • Prairie du Chien/Jordan aquifer – 31 new wells, 60 total wells • Tunnel City/Wonewoc aquifer – 19 new wells, 30 total wells • Mt. Simon aquifer – 20 new wells, 30 total wells
Water Quality Network Well Selection The Water-Quality Trend Network includes wells sampled as part of the MPCA’s Ambient Groundwater Monitoring Network. The MPCA has monitored ambient groundwater-quality conditions since 1978, and the Ambient Groundwater Monitoring Network has been maintained since 2004. The MPCA’s Ambient Groundwater Monitoring Network builds upon the information learned from previous assessments, most notably a study conducted during the 1990’s that assessed all the state’s principal aquifers, which is commonly referred to as the “Baseline Study” (Jakes et al. 1998).
The “Baseline Study” was a short-term effort to characterize the quality of the state’s 14 principal aquifers and included an assessment of the Cambrian-Ordovician aquifer system. The study employed a systematic grid sampling design which best characterizes water-quality conditions over large areas. A total of 954 existing wells, located approximately 11 miles apart, were chosen for this study. They were primarily domestic water supplies to individual homes. The wells were sampled once. Chemical analyses focused on inorganic compounds but also included volatile organic compounds and a limited number of pesticide analyses. The Ambient Groundwater Monitoring Network builds upon the Baseline Study and is consistent with the agency’s statutory authority. The network does not focus on all the state’s principal aquifers but only on those most vulnerable to pollution from human activities. Many of the state’s aquifers are naturally protected from anthropogenic contamination by confining units composed of relatively impermeable materials such as clay or shale. These confining units retard downward movement of water and its associated contaminants. Data collected by the DNR to identify groundwater susceptible to anthropogenic contamination indicate the water in some aquifers that are naturally-protected by clay or shale units is thousands of years old. As a result, contamination from human activities will not reach these aquifers for many years, and the Baseline Study data confirms the current water-quality conditions in these aquifers.
Some gaps identified in the Baseline Study are filled by the Ambient Groundwater Monitoring Network. The network monitors conditions in the shallowest parts of the aquifers, which are very vulnerable to contamination, and were not assessed by the Baseline Study. Monitoring the shallowest parts of the aquifers, which typically contain relatively “young” water, also provides information needed to quickly identify problems and prevent future impacts. The Baseline Study was not designed to evaluate water-quality trends. The Ambient Groundwater Monitoring Network wells are sampled annually to quantify any trends.
Proposed network The Water-Quality Trend Network proposed for the NGWMN includes all wells (37) currently sampled by the MPCA’s Ambient Groundwater Monitoring Network that are installed in the Upper Ordovician, Prairie du Chien-Jordan, and Tunnel City/Wonewoc aquifers. The MPCA’s network does not include any wells in the Mount Simon aquifer. Most of these wells tap the Prairie du Chien-Jordan aquifer; monitoring is limited in the other aquifers. Well-water samples currently are collected annually by MPCA staff and have been analyzed for approximately 100 constituents since 2010. The constituents analyzed include major ions, nutrients, organic carbon, trace elements, and volatile organic compounds (VOCs) (Appendix B). A smaller number of chemicals were analyzed from 2004-2009. Only nitrate, chloride, and VOC concentrations were analyzed from 2004 - 2007. Samples were analyzed in 2010 to define the distribution of mercury in the groundwater, and it is anticipated these analyses will not continue in subsequent assessments. Approximately 40 network wells also were sampled in 2010 to determine concentrations of a suite of over 100 emerging contaminants.
Results of the Minnesota Pilot Study for the Minnesota Department of Natural Resources National Groundwater Monitoring Network • March 2011 Minnesota Pollution Control Agency
15
Wells in the Water-Quality Trend Network were placed in an Unstressed or Targeted Subnetwork generally using the available baseline water-quality data. The Unstressed Subnetwork describes water-quality conditions in parts of the aquifers minimally affected by anthropogenic contamination, and the Targeted Subnetwork describes conditions in the parts known to be degraded by human activities. The available nitrate and chloride concentration data generally were used to place the wells in either subnetwork. Previous investigations have shown these two constituents are good indicators of anthropogenic contamination in Minnesota groundwater. Several investigators (Campion 1997, Berg 2003, and Peterson 2005) determined nitrate and chloride generally are not present in Minnesota groundwater unaffected by anthropogenic contamination, and nitrate and chloride concentrations greater than one and five mg/L, respectively, were associated with groundwater containing a young (post-1950s) fraction of water. For the NGWMN, wells with nitrate concentrations less than one mg/L or chloride concentrations less than 35 milligrams per liter were placed in the Unstressed Subnetwork, and wells containing concentrations greater than these were placed in the Targeted Subnetwork.
Overlying land use alone was not sufficient to designate the appropriate subnetwork for each well. As previously discussed, the Cambrian-Ordovician system is overlain by impermeable glacial deposits or the individual aquifers comprising the aquifer system are overlain by younger aquifers or confining units in many parts of the study area. These overlying geologic deposits, aquifers, or confining units retard the transport of water, resulting in the young fraction of the groundwater having an apparent age of 10-25 years old in the vicinity of the TCMA. The current groundwater quality in this part of the Cambrian-Ordovician System may have resulted from former land uses, especially in recently-urbanized areas.
Unstressed Subnetwork The Unstressed Subnetwork provides information on the groundwater quality in aquifers unaffected by anthropogenic contamination. These wells may contain “old” groundwater and/or are minimally affected by anthropogenic contamination. Information from this subnetwork serves two purposes. The information provides a baseline to compare results from the Targeted Subnetwork. This subnetwork also provides information on the distribution of naturally-occurring groundwater contaminants which may affect the potability of the groundwater in the State.
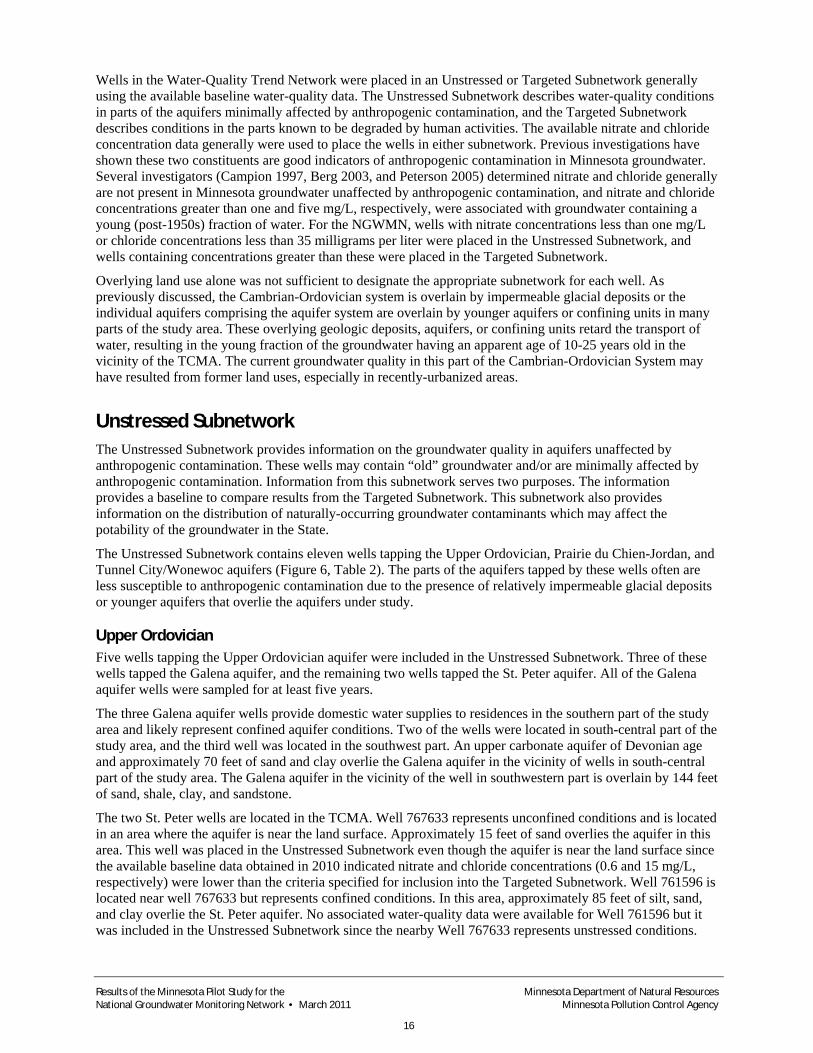
The Unstressed Subnetwork contains eleven wells tapping the Upper Ordovician, Prairie du Chien-Jordan, and Tunnel City/Wonewoc aquifers (Figure 6, Table 2). The parts of the aquifers tapped by these wells often are less susceptible to anthropogenic contamination due to the presence of relatively impermeable glacial deposits or younger aquifers that overlie the aquifers under study.
Upper Ordovician Five wells tapping the Upper Ordovician aquifer were included in the Unstressed Subnetwork. Three of these wells tapped the Galena aquifer, and the remaining two wells tapped the St. Peter aquifer. All of the Galena aquifer wells were sampled for at least five years.
The three Galena aquifer wells provide domestic water supplies to residences in the southern part of the study area and likely represent confined aquifer conditions. Two of the wells were located in south-central part of the study area, and the third well was located in the southwest part. An upper carbonate aquifer of Devonian age and approximately 70 feet of sand and clay overlie the Galena aquifer in the vicinity of wells in south-central part of the study area. The Galena aquifer in the vicinity of the well in southwestern part is overlain by 144 feet of sand, shale, clay, and sandstone.
The two St. Peter wells are located in the TCMA. Well 767633 represents unconfined conditions and is located in an area where the aquifer is near the land surface. Approximately 15 feet of sand overlies the aquifer in this area. This well was placed in the Unstressed Subnetwork even though the aquifer is near the land surface since the available baseline data obtained in 2010 indicated nitrate and chloride concentrations (0.6 and 15 mg/L, respectively) were lower than the criteria specified for inclusion into the Targeted Subnetwork. Well 761596 is located near well 767633 but represents confined conditions. In this area, approximately 85 feet of silt, sand, and clay overlie the St. Peter aquifer. No associated water-quality data were available for Well 761596 but it was included in the Unstressed Subnetwork since the nearby Well 767633 represents unstressed conditions.
Results of the Minnesota Pilot Study for the Minnesota Department of Natural Resources National Groundwater Monitoring Network • March 2011 Minnesota Pollution Control Agency
16
Prairie du Chien-Jordan Five wells from the Prairie du Chien-Jordan aquifer were included in the Unstressed Subnetwork. These wells likely tap confined parts of the Prairie du Chien-Jordan aquifer and are located in areas where the aquifer is overlain by glacial deposits, an overlying bedrock aquifer, or tap deeper parts of the aquifer. Four of the five wells are located within the TCMA. The remaining well is located south of the TCMA. Most of these wells tap parts of the aquifer that are overlain by the St. Peter aquifer or approximately 80-190 feet of clay, sand, and gravel. One of the wells tap deeper parts of the aquifer. Well 151590 taps the Jordan aquifer and are overlain by 80 feet of the Prairie du Chien Group, respectively.
Sufficient data were available to establish baseline conditions from one-half of the wells in the Prairie du Chien-Jordan aquifer in the Unstressed Subnetwork. Three of the wells were sampled for at least five years, and sampling was initiated at the remaining three wells in 2009 or 2010 (Table 2). The latter three wells were included in the Unstressed Subnetwork since the available baseline data suggested they represent unstressed conditions.
Figure 6: Proposed National Groundwater Monitoring Network Water-Quality sites for the Unstressed Water Quality Subnetwork
Results of the Minnesota Pilot Study for the Minnesota Department of Natural Resources National Groundwater Monitoring Network • March 2011 Minnesota Pollution Control Agency
17

Table 2: Wells in the Unstressed Water Quality Subnetwork
Minnesota Unique Well Identifier
Surveillance or Trend Site
Frequency of Measurement
Period of Water Quality Record
Screened/Open-hole Interval
Galena aquifer wells
217029 Trend Annually 2005-2010 25
562727 Trend Annually 2005-2010 130
651822 Trend Annually 2005-2010 77
St. Peter aquifer wells
761596 Trend Annually None 10
767633 Trend` Annually 2010 5
Prairie du Chien-Jordan aquifer wells
105193 Trend Annually 2005-2010 5
405726 Trend Annually 2005-2010 6
444696 Trend Annually 2005-2010 2
151590 Trend Annually 2009-2010 72
551564 Trend Annually 2009-2010 16
Tunnel City/Wonewoc aquifer wells
695359 Trend Annually 2010 44
Tunnel City Wonewoc aquifer One well from the Tunnel City/Wonewoc aquifer was included in the Unstressed Subnetwork. The well likely represents unconfined conditions based on work by Delin and Woodward (1984) which generally places the water table in the bedrock in this area.
Targeted Subnetwork The Targeted Subnetwork provides information on the groundwater quality in areas affected by anthropogenic contamination. Wells in this subnetwork likely contain “younger” groundwater and associated anthropogenic contamination. This subnetwork provides information on the occurrence and distribution of non-agricultural contaminants in the groundwater and eventually will collect sufficient data to quantify any changes in groundwater quality.
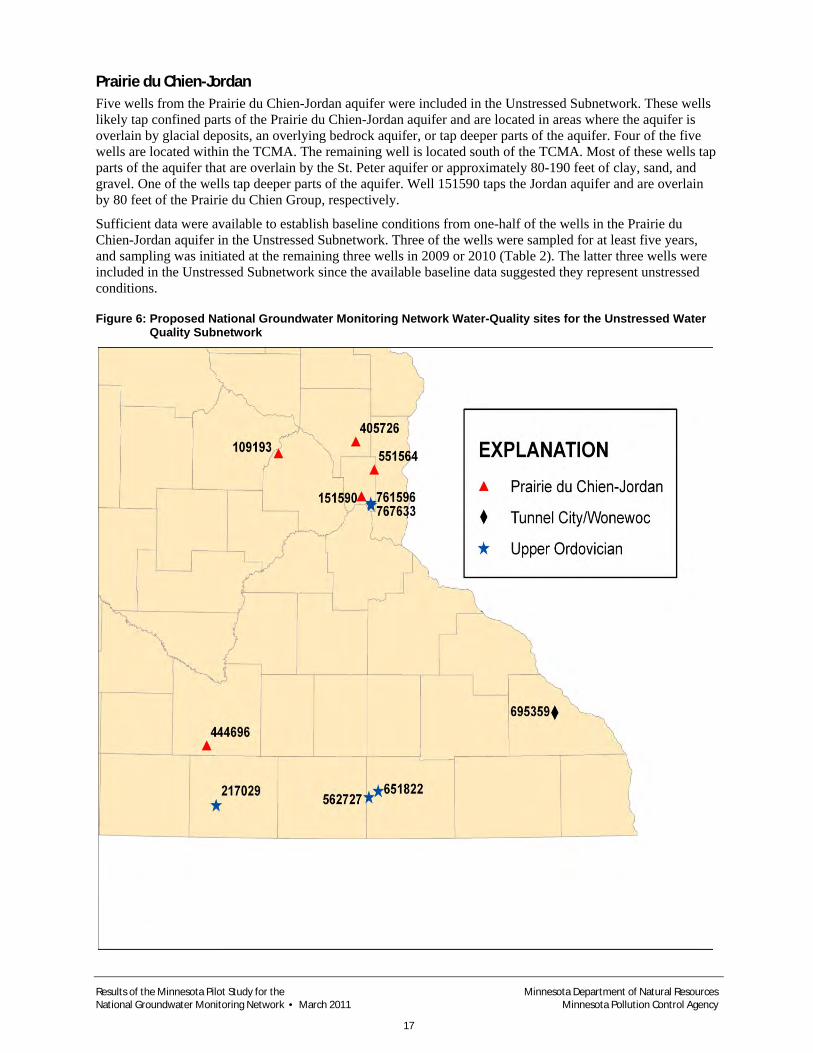
The Targeted Subnetwork contains 26 wells tapping the Upper Ordovician, Prairie du Chien-Jordan, and Tunnel City/Wonewoc aquifers (Figure 7, Table 3). Sufficient data exist from most of these wells to define baseline conditions. There are substantially more wells in the Targeted Subnetwork compared to the Unstressed Subnetwork since the MPCA’s Ambient Groundwater Monitoring Network concentrates on sampling parts of aquifers that are unconfined and more vulnerable to anthropogenic contamination.
Results of the Minnesota Pilot Study for the Minnesota Department of Natural Resources National Groundwater Monitoring Network • March 2011 Minnesota Pollution Control Agency
18
Figure 7: Proposed National Groundwater Monitoring Network Water Quality sites for the Targeted Water-Quality Subnetwork
Results of the Minnesota Pilot Study for the Minnesota Department of Natural Resources National Groundwater Monitoring Network • March 2011 Minnesota Pollution Control Agency
19
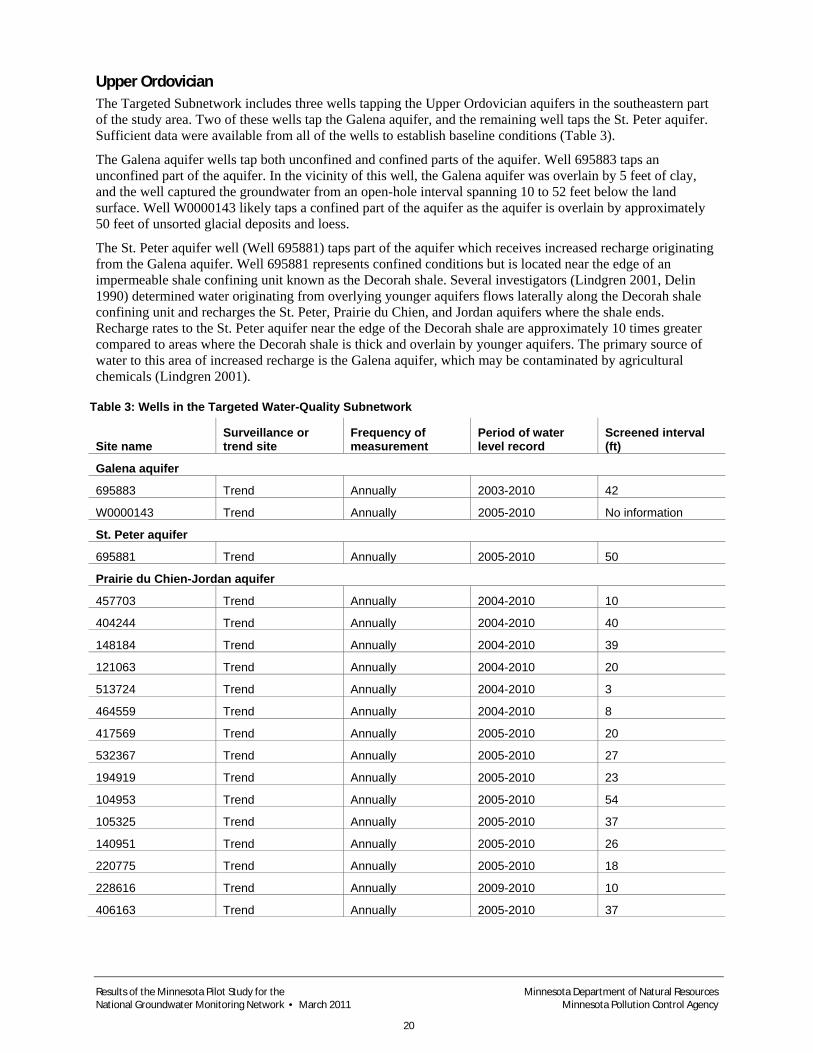
Upper Ordovician The Targeted Subnetwork includes three wells tapping the Upper Ordovician aquifers in the southeastern part of the study area. Two of these wells tap the Galena aquifer, and the remaining well taps the St. Peter aquifer. Sufficient data were available from all of the wells to establish baseline conditions (Table 3).
The Galena aquifer wells tap both unconfined and confined parts of the aquifer. Well 695883 taps an unconfined part of the aquifer. In the vicinity of this well, the Galena aquifer was overlain by 5 feet of clay, and the well captured the groundwater from an open-hole interval spanning 10 to 52 feet below the land surface. Well W0000143 likely taps a confined part of the aquifer as the aquifer is overlain by approximately 50 feet of unsorted glacial deposits and loess.
The St. Peter aquifer well (Well 695881) taps part of the aquifer which receives increased recharge originating from the Galena aquifer. Well 695881 represents confined conditions but is located near the edge of an impermeable shale confining unit known as the Decorah shale. Several investigators (Lindgren 2001, Delin 1990) determined water originating from overlying younger aquifers flows laterally along the Decorah shale confining unit and recharges the St. Peter, Prairie du Chien, and Jordan aquifers where the shale ends. Recharge rates to the St. Peter aquifer near the edge of the Decorah shale are approximately 10 times greater compared to areas where the Decorah shale is thick and overlain by younger aquifers. The primary source of water to this area of increased recharge is the Galena aquifer, which may be contaminated by agricultural chemicals (Lindgren 2001).
Table 3: Wells in the Targeted Water-Quality Subnetwork
Site name Surveillance or trend site
Frequency of measurement
Period of water level record
Screened interval (ft)
Galena aquifer
695883 Trend Annually 2003-2010 42
W0000143 Trend Annually 2005-2010 No information
St. Peter aquifer
695881 Trend Annually 2005-2010 50
Prairie du Chien-Jordan aquifer
457703 Trend Annually 2004-2010 10
404244 Trend Annually 2004-2010 40
148184 Trend Annually 2004-2010 39
121063 Trend Annually 2004-2010 20
513724 Trend Annually 2004-2010 3
464559 Trend Annually 2004-2010 8
417569 Trend Annually 2005-2010 20
532367 Trend Annually 2005-2010 27
194919 Trend Annually 2005-2010 23
104953 Trend Annually 2005-2010 54
105325 Trend Annually 2005-2010 37
140951 Trend Annually 2005-2010 26
220775 Trend Annually 2005-2010 18
228616 Trend Annually 2009-2010 10
406163 Trend Annually 2005-2010 37
Results of the Minnesota Pilot Study for the Minnesota Department of Natural Resources National Groundwater Monitoring Network • March 2011 Minnesota Pollution Control Agency
20
Site name Surveillance or trend site
Frequency of measurement
Period of water level record
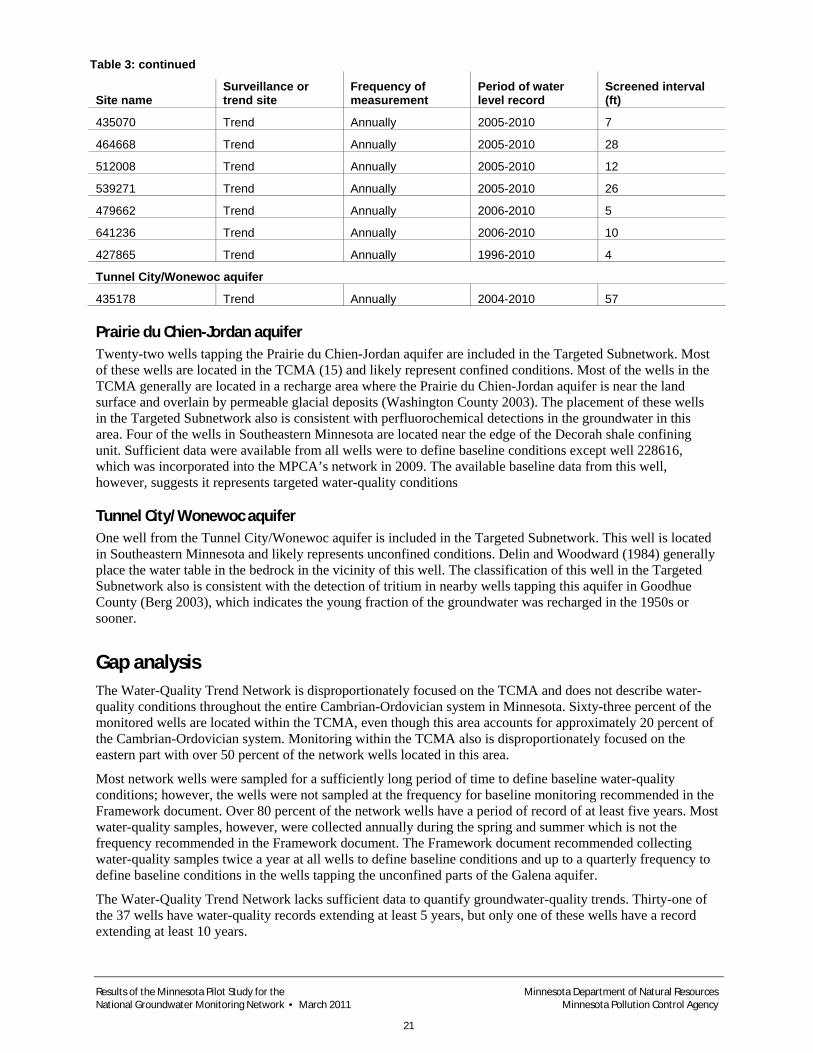
Table 3: continued
Screened interval (ft)
435070 Trend Annually 2005-2010 7
464668 Trend Annually 2005-2010 28
512008 Trend Annually 2005-2010 12
539271 Trend Annually 2005-2010 26
479662 Trend Annually 2006-2010 5
641236 Trend Annually 2006-2010 10
427865 Trend Annually 1996-2010 4
Tunnel City/Wonewoc aquifer
435178 Trend Annually 2004-2010 57
Prairie du Chien-Jordan aquifer Twenty-two wells tapping the Prairie du Chien-Jordan aquifer are included in the Targeted Subnetwork. Most of these wells are located in the TCMA (15) and likely represent confined conditions. Most of the wells in the TCMA generally are located in a recharge area where the Prairie du Chien-Jordan aquifer is near the land surface and overlain by permeable glacial deposits (Washington County 2003). The placement of these wells in the Targeted Subnetwork also is consistent with perfluorochemical detections in the groundwater in this area. Four of the wells in Southeastern Minnesota are located near the edge of the Decorah shale confining unit. Sufficient data were available from all wells were to define baseline conditions except well 228616, which was incorporated into the MPCA’s network in 2009. The available baseline data from this well, however, suggests it represents targeted water-quality conditions
Tunnel City/Wonewoc aquifer One well from the Tunnel City/Wonewoc aquifer is included in the Targeted Subnetwork. This well is located in Southeastern Minnesota and likely represents unconfined conditions. Delin and Woodward (1984) generally place the water table in the bedrock in the vicinity of this well. The classification of this well in the Targeted Subnetwork also is consistent with the detection of tritium in nearby wells tapping this aquifer in Goodhue County (Berg 2003), which indicates the young fraction of the groundwater was recharged in the 1950s or sooner.
Gap analysis The Water-Quality Trend Network is disproportionately focused on the TCMA and does not describe water-quality conditions throughout the entire Cambrian-Ordovician system in Minnesota. Sixty-three percent of the monitored wells are located within the TCMA, even though this area accounts for approximately 20 percent of the Cambrian-Ordovician system. Monitoring within the TCMA also is disproportionately focused on the eastern part with over 50 percent of the network wells located in this area.
Most network wells were sampled for a sufficiently long period of time to define baseline water-quality conditions; however, the wells were not sampled at the frequency for baseline monitoring recommended in the Framework document. Over 80 percent of the network wells have a period of record of at least five years. Most water-quality samples, however, were collected annually during the spring and summer which is not the frequency recommended in the Framework document. The Framework document recommended collecting water-quality samples twice a year at all wells to define baseline conditions and up to a quarterly frequency to define baseline conditions in the wells tapping the unconfined parts of the Galena aquifer.
The Water-Quality Trend Network lacks sufficient data to quantify groundwater-quality trends. Thirty-one of the 37 wells have water-quality records extending at least 5 years, but only one of these wells have a record extending at least 10 years.
Results of the Minnesota Pilot Study for the Minnesota Department of Natural Resources National Groundwater Monitoring Network • March 2011 Minnesota Pollution Control Agency
21

A Surveillance Monitoring Network is proposed to fill the identified spatial gaps in the Water-Quality Trend Network. Results from the Surveillance Monitoring Network will enhance the Water-Quality Trend Network by periodically providing a finer-scale snapshot of water-quality conditions, and the additional wells monitored as part of the Surveillance Monitoring Network will allow future refinement of the Water-Quality Trend Monitoring Network.
The proposed Surveillance Monitoring Network uses a systematic grid sampling design similar to the MPCA’s Baseline Study and focuses on the Prairie du Chien-Jordan aquifer. The Prairie du Chien-Jordan aquifer was selected for surveillance monitoring since most groundwater withdrawals from the Cambrian-Ordovician system in Minnesota are from this aquifer. All sampling sites will be selected using a random sampling within blocks statistical design (Gilbert 1987) to obtain an unbiased assessment of water-quality conditions across the aquifer. The sampling goal for the Surveillance Monitoring Network is to obtain one well-water sample for approximately every 100 square miles of aquifer, which is similar to the sampling distribution used in the Baseline Study.
The sampling goal for the proposed Surveillance Monitoring Network will be met by monitoring approximately 130 wells in the aquifer. These wells will be selected by dividing the aquifer into about 130 cells (Figure 8), and one well will be monitored within each cell. Each cell is 100 square miles in area, except near the edges of the aquifer. Existing wells within each cell from the MPCA’s Ambient Groundwater Monitoring Network, MPCA’s Baseline Study, or the DNR’s Observation Well Network will be given first priority for sampling. The remaining wells in the Surveillance Monitoring Network will be randomly selected; these wells will be an existing or newly-installed well. All existing wells which were not previously monitored will be selected using the CWI. The following requirements must be met to accept any well into the Surveillance Monitoring Network: 1) the well must be a low-producing domestic or monitoring well located in the Prairie du Chien-Jordan aquifer, 2) the well must have associated construction information, including well depth, screened or open-hole interval, and casing information, 3) it must be possible to collect a water sample prior to any water treatment device, and 4) the well must have been constructed after State water well regulations were enacted in 1974.
The Surveillance Monitoring Network is envisioned to be comprised mostly of existing wells. The well owner’s cooperation will be necessary to fully implement this monitoring. Thirty-eight percent of the cells contain an existing well sampled by the MPCA’s Ambient Groundwater Monitoring Network or Baseline Study. These wells would be included in the Surveillance Monitoring Network to address the identified data gaps associated with quantifying groundwater quality trends. Another forty-seven percent of the cells contain an existing well monitored by the DNR or another existing well that will be targeted for monitoring.
There were no existing wells tapping the Prairie du Chien-Jordan aquifer in the remaining 15 percent of cells, which represent the southwestern and south-central parts of the aquifer. In these areas, the overlying Upper Ordovician and/or Devonian-age aquifers are used for potable water supplies instead of the Prairie du Chien-Jordan. New wells will need to be installed to monitor the Prairie du Chien-Jordan aquifer in these areas.
Results of the Minnesota Pilot Study for the Minnesota Department of Natural Resources National Groundwater Monitoring Network • March 2011 Minnesota Pollution Control Agency
22
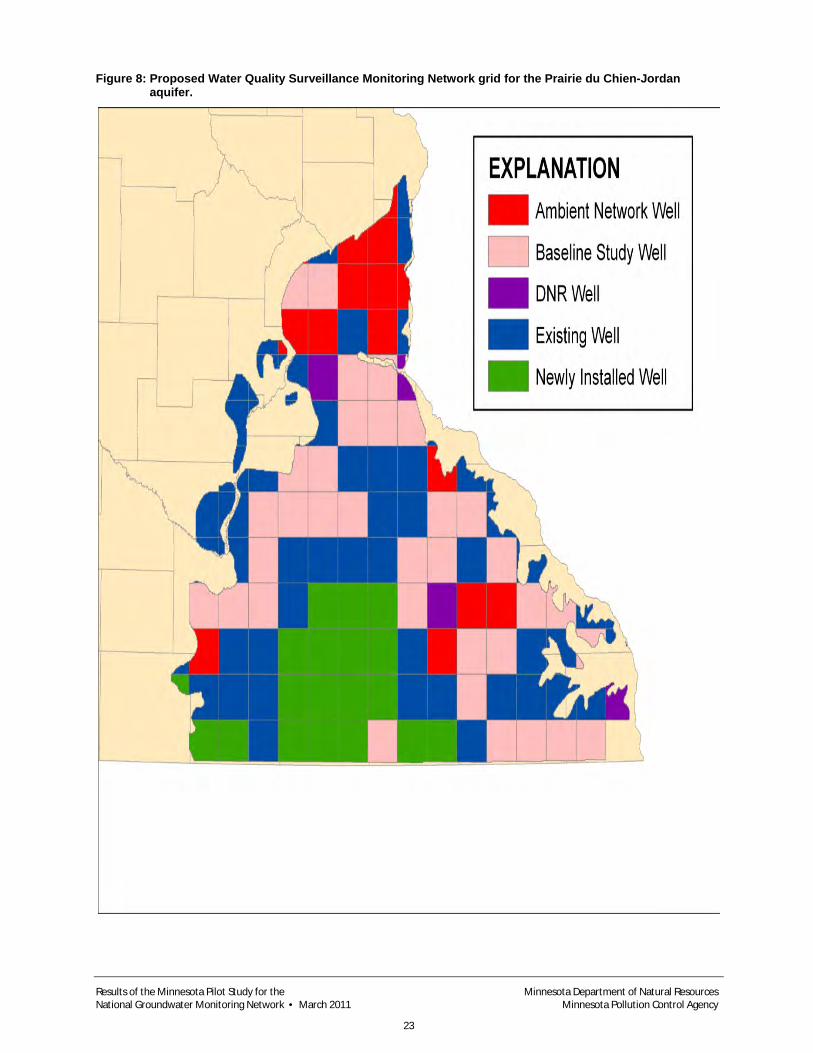
Figure 8: Proposed Water Quality Surveillance Monitoring Network grid for the Prairie du Chien-Jordan aquifer.
Results of the Minnesota Pilot Study for the Minnesota Department of Natural Resources National Groundwater Monitoring Network • March 2011 Minnesota Pollution Control Agency
23

Field Practices
Groundwater level monitoring field practices The DNR’s field practices generally were similar to those recommended in the Framework Document (Table 4). The DNR generally follows generally established industry standards and updates and revises its practices to match those of the industry. During this evaluation, it was noted that the DNR does not have Standard Operating Procedures (SOPs) for collecting groundwater level data. Although not required in the Framework Document, SOPs reduce possible errors in data collection.
Gap analysis Eight specific DNR field practices do not match those in the Framework Document. Most of the differences in field practices were minor, such as not collecting weather conditions at every site visit or needing to modify the field forms to collect all of the recommended data. A few of the recommendations in the Framework Document will require more time and effort to implement, such as developing a data management system to collect and verify the accuracy of the automatic water-level measurements. The DNR’s current approach is to manually review these data, and this will not be feasible with the increased use of automated water-level measurement devices.
Groundwater quality monitoring field practices The MPCA has field practices in place to ensure the appropriate wells are sampled and high-quality field and laboratory data are collected. These practices generally are similar to those described in the Framework Document.
Practices are in place to ensure the correct wells are sampled each year. The MPCA’s field staff verifies the correct location is sampled using documentation prepared for each well in the network. This documentation exists in the form of a field folder that contains the well’s address, current owner, current owner’s contact information, a map and driving directions to the site, a copy of the well log, and a photographic log of the site. Practices also are in place to ensure high-quality water quality samples representative of the aquifer are collected. Field instruments are calibrated weekly using fresh standard solutions. Instrument calibrations are recorded in a paper log for each meter. Monitoring wells typically are sampled using a portable pump, and domestic wells typically are sampled from an outside spigot, prior to any treatment devices. New polyethylene pump tubing typically is used to collect most groundwater quality samples from monitoring wells. Teflon tubing is used to collect samples for mercury and contaminants of emerging concern; this tubing is decontaminated according to USGS protocol between wells. At least three casing volumes of water are purged from all network wells prior to sample collection to ensure water representative of the aquifer is sampled. Physical parameters (water temperature, specific conductance, and pH) are measured during the purge, and water samples only are drawn after these readings have stabilized. All water samples are collected under laminar flow conditions. New, clean bottles obtained by the analyzing laboratory or agency are used for sample collection. Equipment blank samples are collected and analyzed to ensure sampling and laboratory analytical methods do not introduce contamination into the samples. Replicate samples also are routinely collected to document the precision associated with the sampling and laboratory analytical methods.
Gap analysis There are slight differences between the MPCA’s field methods and those listed in the Framework Document. The purge efficacy checks using field parameter measurements currently used by the MPCA and those in the Framework Document are slightly different. The MPCA uses a stabilization criterion of +/- five percent for specific conductance compared to +/- three percent in the Framework Document. Water levels currently are measured only in the monitoring wells sampled by the network prior to purging; water levels are not currently
Results of the Minnesota Pilot Study for the Minnesota Department of Natural Resources National Groundwater Monitoring Network • March 2011 Minnesota Pollution Control Agency
24
measured in any domestic wells sampled. The Framework Document also suggests measuring the water level during the purge; this is not done by MPCA field staff.
Data Management System Well construction, groundwater-level, and groundwater-quality data are managed by separate state agencies in Minnesota. Groundwater-level data are managed by the DNR and is stored in an electronic database developed by the agency. Groundwater-quality data collected by the MPCA, MDA, and MDH are managed by the collecting agency. Data collected by the MPCA and MDA are stored in the same data management system. Information collected by the MDH is stored in a separate system. Well construction information is maintained by the MDH in the CWI.
Groundwater level monitoring data management practices The current DNR water level data management system is a POSTGRES database with associated data access software. POSTGRES is an open-source relational database similar to Oracle. The database is stored on a server in the DNR’s Central office in St. Paul. The system has a web-based data entry system that allows outstate field personnel to enter measurements. The data are reviewed by the groundwater monitoring coordinator prior to approval for entry into the database. The data are currently available through the DNR’s website. For each well, a hydrograph of all the water-level measurements is presented, along with the water level measurements. Most of the well information is also presented, although the UTM coordinates of the well are not provided.
The DNR and MPCA are in the process of acquiring a new time-series data management system which will store groundwater-level data. The new system will allow storage and analysis of large volumes of water data and will perform some basic data verification, such as flagging outlying data points and showing data gaps. The new data system is expected to be operational within the next two years and its installation is not dependent on the outcome of the Pilot Project.
The DNR does not maintain a separate identifier or flag to designate a well into an Unstressed or Targeted Subnetwork.
Gap analysis The DNR’s data management system does not capture 48 of the 63 elements recommended in the Framework Document (Table 5). The data are available for many of these data elements but they are not stored in the database. These missing data elements include detailed information about the well property owner, the horizontal and vertical reference datum and accuracy, and latitude and longitude of the well. New fields would need to be created in the database to accommodate this information. The cost to implement this would relatively high, mostly personnel costs to compile and enter the information into the database.
Groundwater quality monitoring data management practices Water-quality data collected by MPCA staff generally are recorded electronically and reviewed prior to final approval. Information collected in the field, including physical parameter measurements of the final sample and during well purging are recorded on a set of electronic forms developed by the MPCA. These electronic forms populate a series of Microsoft Access databases, hereinafter referred to as the “Field-Database”. One “Field Database” typically contains information collected during a given year. Information these databases are unable to capture, such as meter calibration data or water-level measurements, are stored on paper records. Water-quality data received from a laboratory are delivered to the MPCA in both paper and electronic formats. The paper reports are reviewed by MPCA staff, and the electronically-formatted data are subsequently input into a Microsoft Access database referred to as the “Laboratory Database” by the network’s database administrator. The “Field Database” and “Laboratory Database” are completely separate.
Results of the Minnesota Pilot Study for the Minnesota Department of Natural Resources National Groundwater Monitoring Network • March 2011 Minnesota Pollution Control Agency
25
The “Laboratory Database” stores data collected during each year in separate tables. Any corrections found during the review process are made by a database administrator. The “Laboratory Database” is reviewed by MPCA Ambient Groundwater Network staff prior to finalization. After finalization, the information in the “Laboratory Databases” may be transferred to the agency’s local STORET database.
The MPCA’s data management practices currently (2010) are changing as a result of the agency acquiring a new data management system. The MPCA recently acquired a commercial database management system, EQuIS, to replace its local STORET database. Ambient Groundwater Monitoring Network and Baseline Study data will be migrated to EQuIS. The MPCA’s current groundwater data management practices also will be changing substantially due to this change in data management systems. EQuIS contains a module which allows information collected in the field to be captured electronically and uploaded to the EQuIS database. The MPCA’s Ambient Groundwater Monitoring Network staff plan to use this tool instead of the current Microsoft Access “Field Database”. Data generated from a laboratory also will be received by the MPCA in an EQuIS-compatible format, eliminating the need for the separate Microsoft Access “Laboratory Database.”
Comparison of MPCA water quality data management and the Framework Document The current data management systems maintained by the MPCA and MDH store over one-half of the proposed minimum data elements for the NGWMN (Table 6). The MPCA’s data management system only stores the data elements associated with well location and water-quality.
The MPCA’s new data management system, EQuIS, will address some of the identified gaps in the data management for the NGWMN, and modifications to EQuIS will be required to address the remaining proposed data elements. EQuIS is designed to store many of the data elements not currently being stored by the MPCA.
These additional data elements in EQuIS include: 1) The well location method and accuracy, 2) water-level measuring point height, and 3) water-level measurement method (Table 6). EQuIS will need to be modified to store other data elements listed in the Framework document. These elements include several that are specific to the NGWMN including the: 1) NGWMN site identifier which is based on the well’s latitude/longitude, 2) USGS principal aquifer, 3) NGWMN well type (background, targeted), 4) well purpose, and 5) NGWMN monitoring purpose (baseline, surveillance, trend, special studies).
Some of the proposed minimum data elements in the NGWMN Framework Document cannot be stored in the MPCA’s data management system because these are classified as private information. These elements include point of contact information and well address. These data elements are stored separately by the MPCA in a Microsoft Access database and are not publicly available.
Gap analysis Approximately 40 data elements listed in the Framework Document for the NGWMN are not currently stored in the MPCA’s data management system or the CWI (Table 6); these will need to be added to EQuIS to fully implement the NGWMN. These data elements include:
1) The NGWMN site identifier based on the well’s latitude and longitude. 2) The principal aquifer designated by the USGS that the well taps. 3) The details regarding well location, such as the location method and associated accuracy. 4) The well characteristics. 5) The monitoring purpose. 6) The water-level measurement accuracy. 7) Any biological information associated with groundwater-quality data
Results of the Minnesota Pilot Study for the Minnesota Department of Natural Resources National Groundwater Monitoring Network • March 2011 Minnesota Pollution Control Agency
26

Table 4Comparison of NGWMN field standards to Minnesota DNR water level field practices
Item NGWMN MN DNR Compliant Item(s) different Compliance - changes
Field practices for groundwater levelsSection 5.2.1.1 Training
Training Operator training is necessary Operator training is necessary YesSite verification Numerous methods, mostly through previous
site visitsNumerous methods including site note containing directions to the site, maps and sketches of site, photographs of the site, wells tagged with unique identification number, previous site visits.
Yes
Equipment decontamination Equipment must be decontaminated between site visits
Yes
Site condition notations Date and time, weather, measuring point condition, damage, other factors
Date and time recorded. Damage and other factors recorded if necessary
Partial Weather conditions not monitored.
No plans to modify
Site Access Gates, enclosures, etc Not typically recorded unless there are issues related to site access
Yes
Established measurement point NGWMN requires a designated measuring point. Designated measuring point including height above ground surface. If necessary, description of measuring point.
Yes
Section 5.2.1.2 Pre-collection site review and preparation
All equipment necessary for a successful trip gathered and packed Prior knowledge of
Equipment gathered, supplies collected, tools on hand maps site forms steel tape electric water
Equipment gathered. Water level measuring devise Typically field forms with previous
Yesgathered and packed. Prior knowledge of distance to water.
hand, maps, site forms, steel tape, electric water-level measurement tapes, disinfectant, protective gloves
devise. Typically field forms with previous distance to water measurements.
Field form showing information to be gathered
Figure 5.2.1.2 - basic information to be collected with a water-level measurement
Field sheets contain name of site, TRS, DNR well number and measuring point height above ground surface. Contains hold, cut and DTW and comments. Each month values stored on page.
Partial Field form does not have route nor location for recording duplicate measurements.
Should modify field form to include all fields currently in GWIC data entry screens; Non static, Dry
Section 5.2.1.3 Minimum data elements
Minimum data elements Minimum elements are required. Field personnel should note which minimum elements might have changed and gather information as necessary to insure that all attribute fields are current.
Missing minimum elements and elements needing modification are noted on field measurement form. Most wells in Minnesota Network have been visited numerous times and elements are generally known.
Yes

Item NGWMN MN DNR Compliant Item(s) different Compliance - changes
Section 5.2.1.4 Onsite preparation Verification, equipment decontamination, site condition notations, site access, establish measuring point.
Field staff verify the site by knowledge from previous visits. Otherwise maps, photographs, gps coordinates, and notes of previous visits are used to verify location. Currently visiting all DNR obwells in the state to locate and identify. Equipment is not typically decontaminated between measurements. Date-time, measuring point condition/change, other factors are noted at time measurements gathered.
Partial Weather conditions not explicitly noted. Decontamination of equipment not conducted on a regular basis.
No plans to modify
Section 5.2.1.5 Water Level Measurements
All measurements recorded Measurements recorded on paper or electronically at time of collection. Measurements recorded on paper entered to databases. Paper records filed - not returned to field. Electronic records stored in way that preserves original measurements. Paper records entered
Measurements recorded on paper at time of collection. Measurements recorded on paper entered to databases either by office staff directly into a database or remotely though a dedicated website. Paper records typically filed - some are returned to field during field season. Some of the paper copies are stored but not all. Paper files not currently scanned and are stored in files.
Partial Storage of paper files Save and scan paper field sheets. Amount of work to conduct medium, no plans to change.
Sub-section 5.2.1.5.1 Manual measurements Measurements should be gathered by repeatable and accurate methods.
Measurements are gathered using repeatable and accurate methods. measurements collected
d h f
No No DNR specific SOPs deveDeveloping SOPs would be a relatively low effort as work is
l b d bl h daccording to USGS techniques. No specific DNR SOPs exist to guide field staff in gathering water-level measurements. Repeated measurements are to be used to determine if measured value represents a static water level. Method of measurement is recorded with each data value.
currently being done to established methods. No plans to develop such SOPs.
Sub-section 5.2.1.5.2 Automated measurements
Instrumental gathered near-continuous measurements with little human intervention. Correct selection of instruments to cover the entire range of expected water-level movement at the required accuracy. Instruments must be calibrated to discrete hand measurements.
Instruments are calibrated to hand measurements each time downloaded or serviced. Final measurement of period becomes initial measurement for next period. Instrumental values are reconciled to hand measurements. Developing field documents for the measuring and servicing of automated data systems.
Partial Developing field documents for the measuring and servicing of automated data systems. These include datalogger type, serial number and download instructions. Field forms with instrumental calibration notes are not posted in field.
Expected effort to match NGWMN standards - medium. Currently developing data system to maintain both water levels and information about automated water level equipment.

Item NGWMN MN DNR Compliant Item(s) different Compliance - changes
Section 5.2.2 Minimum data standards
Sub-section 5.2.2.1 Manual water-level measurements
Measurements made repeatedly to ensure +/- 0.02 ft between measurements. At least three repeated measurements for electric tapes.
Steel tape and chalk and electronic measuring device: +/- 0.02 for SWL.
Partial Two measurements are required with electronic water level devices. Field personnel do not always collect two measurements.
Develop training to insure field personnel collect water levels at appropriate accuracy. Effort to match NGWMN standards - medium.
Sub-section 5.2.2.2 Automated water-level measurements
Automated measurements to within 0.02 ft. Site visits often enough to insure that instruments are working properly and results not compromised by excessive drift or water-level change.
Developing standards. Reconcile record to beginning and ending hand measurements. Instruments visited approximately every 90 days. Currently deploying up to 50 new loggers and will be developing methods and techniques for data collection and maintenance of these loggers.
Partial Developing systems to deal with large amounts of data collected from proposed installation of data loggers and one telemetry site. Effort will be large and there is questions on feasibility based on current staffing levels.
Section 5.2.3 Data handling and management
Sub-section 5.2.3.1 Electronic entry of data Field data including date, time, distance to water, measuring point elevation entered into an electronic database.
Field data including date, time, distance to water, comments about site or water levels entered into an electronic database.
Yes
Sub-section 5.2.3.2 Verification and editing of i l
Unit values should be checked against field b f b i d i f h
Manual review of data is currently done i i l E fi d h f d
Yes Effort to match NGWMN standards ld b hi h H lunit values measurements before being used in further
analysisintermittently. Errors are fixed when found through review of the data or when a user identifies a possible problem. We have no written procedure about how and when data can be changed or how to conduct the modifications.
would be high. However, we plan to implement a new water level data system which will assist in maintaining unit values.
Sub-section 5.2.3.3 Verification and analysis of field-measurement data
Field measurement data: discrete water-level measurements, well construction data, miscellaneous field notes. Check for arithmetic and logical errors. Calculated values management. Measuring point elevation management. Retain original paper records
Review of date and raw water levels is conducted reviewed before final input into database. Date, water level errors or other questions are resolved before final entry into the database. Database converts depth to water (from top of casing) to depth of water level below ground surface. No analysis is conducted of water levels at time of entry into the database. Paper records are generally retained.
Yes
Section 5.2.4 Measurement frequency
The contents of this section have been incorporated into the main body of the report.
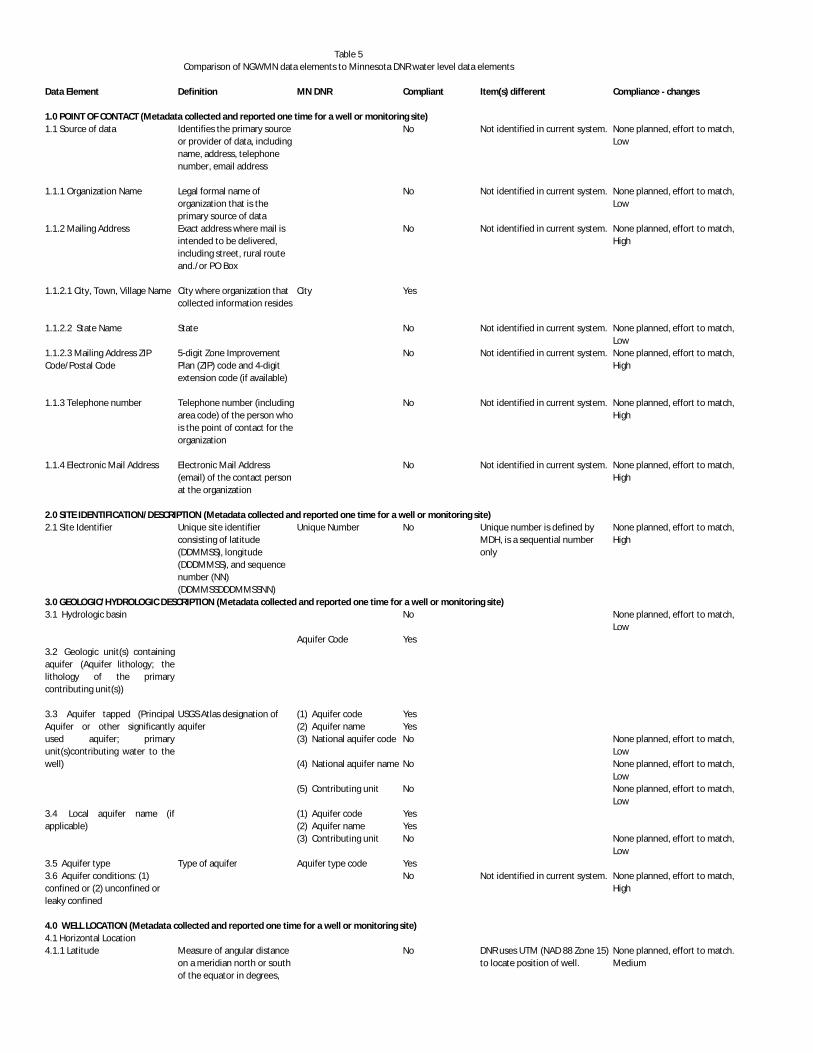
Table 5Comparison of NGWMN data elements to Minnesota DNR water level data elements
Data Element Definition MN DNR Compliant Item(s) different Compliance - changes
1.1 Source of data Identifies the primary source or provider of data, including name, address, telephone number, email address
No Not identified in current system. None planned, effort to match, Low
1.1.1 Organization Name Legal formal name of organization that is the primary source of data
No Not identified in current system. None planned, effort to match, Low
1.1.2 Mailing Address Exact address where mail is intended to be delivered, including street, rural route and./or PO Box
No Not identified in current system. None planned, effort to match, High
1.1.2.1 City, Town, Village Name City where organization that collected information resides
City Yes
1.1.2.2 State Name State No Not identified in current system. None planned, effort to match, Low
1.1.2.3 Mailing Address ZIP Code/Postal Code
5-digit Zone Improvement Plan (ZIP) code and 4-digit extension code (if available)
No Not identified in current system. None planned, effort to match, High
1.1.3 Telephone number Telephone number (including area code) of the person who is the point of contact for the organization
No Not identified in current system. None planned, effort to match, High
1.1.4 Electronic Mail Address Electronic Mail Address (email) of the contact person at the organization
No Not identified in current system. None planned, effort to match, High
2.1 Site Identifier Unique site identifier consisting of latitude (DDMMSS), longitude (DDDMMSS), and sequence number (NN) (DDMMSSDDDMMSSNN)
Unique Number No Unique number is defined by MDH, is a sequential number only
None planned, effort to match, High
3.1 Hydrologic basin No None planned, effort to match, Low
3.2 Geologic unit(s) containingaquifer (Aquifer lithology; thelithology of the primarycontributing unit(s))
(1) Aquifer code Yes(2) Aquifer name Yes(3) National aquifer code No None planned, effort to match,
Low(4) National aquifer name No None planned, effort to match,
Low(5) Contributing unit No None planned, effort to match,
Low(1) Aquifer code Yes(2) Aquifer name Yes(3) Contributing unit No None planned, effort to match,
Low3.5 Aquifer type Type of aquifer Aquifer type code Yes3.6 Aquifer conditions: (1) confined or (2) unconfined or leaky confined
No Not identified in current system. None planned, effort to match, High
4.1 Horizontal LocationNone planned, effort to match. Medium
2.0 SITE IDENTIFICATION/DESCRIPTION (Metadata collected and reported one time for a well or monitoring site)
1.0 POINT OF CONTACT (Metadata collected and reported one time for a well or monitoring site)
3.0 GEOLOGIC/HYDROLOGIC DESCRIPTION (Metadata collected and reported one time for a well or monitoring site)
Aquifer Code Yes
4.0 WELL LOCATION (Metadata collected and reported one time for a well or monitoring site)
4.1.1 Latitude Measure of angular distance on a meridian north or south of the equator in degrees,
No DNR uses UTM (NAD 88 Zone 15) to locate position of well.
3.3 Aquifer tapped (PrincipalAquifer or other significantlyused aquifer; primaryunit(s)contributing water to thewell)
USGS Atlas designation of aquifer
3.4 Local aquifer name (ifapplicable)
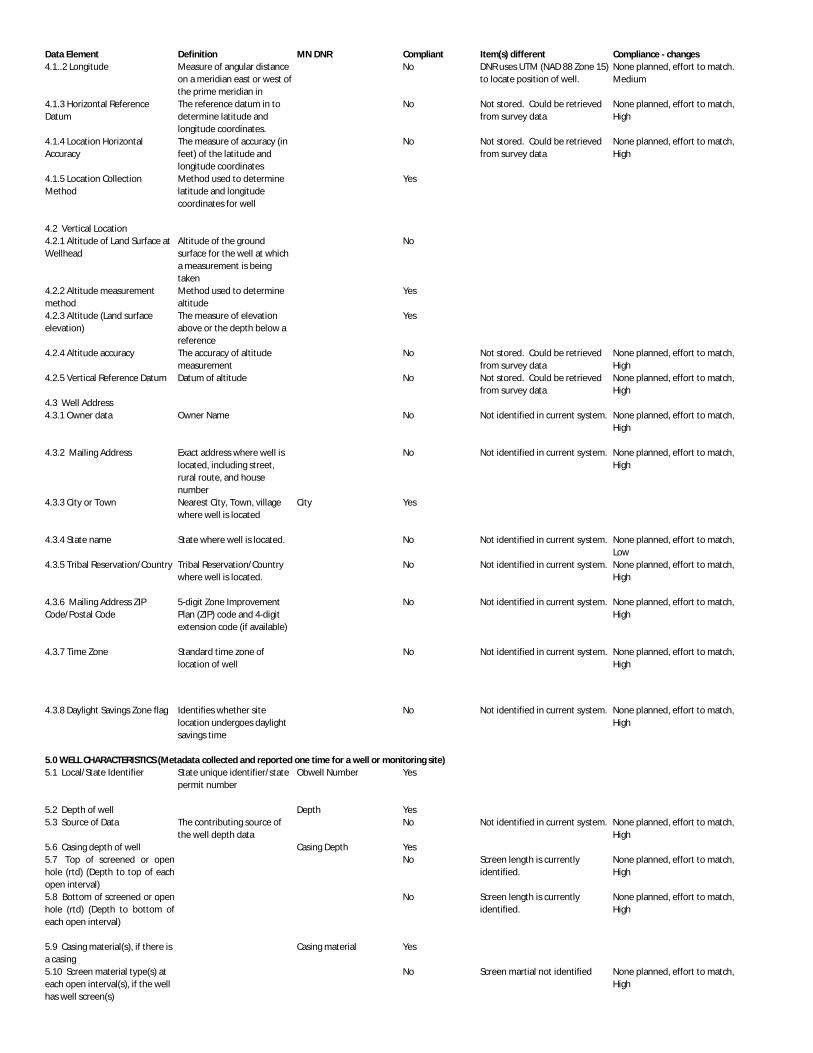
Data Element Definition MN DNR Compliant Item(s) different Compliance - changesNone planned, effort to match. Medium
4.1.3 Horizontal Reference Datum
The reference datum in to determine latitude and longitude coordinates.
No Not stored. Could be retrieved from survey data
None planned, effort to match, High
4.1.4 Location Horizontal Accuracy
The measure of accuracy (in feet) of the latitude and longitude coordinates
No Not stored. Could be retrieved from survey data
None planned, effort to match, High
4.1.5 Location Collection Method
Method used to determine latitude and longitude coordinates for well
Yes
4.2 Vertical Location4.2.1 Altitude of Land Surface at Wellhead
Altitude of the ground surface for the well at which a measurement is being taken
No
4.2.2 Altitude measurement method
Method used to determine altitude
Yes
4.2.3 Altitude (Land surface elevation)
The measure of elevation above or the depth below a reference
Yes
4.2.4 Altitude accuracy The accuracy of altitude measurement
No Not stored. Could be retrieved from survey data
None planned, effort to match, High
4.2.5 Vertical Reference Datum Datum of altitude No Not stored. Could be retrieved from survey data
None planned, effort to match, High
4.3 Well Address
4.3.2 Mailing Address Exact address where well is located, including street, rural route, and house number
No Not identified in current system. None planned, effort to match, High
4.3.3 City or Town Nearest City, Town, village where well is located
City Yes
4.3.5 Tribal Reservation/Country Tribal Reservation/Country where well is located.
No Not identified in current system. None planned, effort to match, High
4.3.6 Mailing Address ZIP Code/Postal Code
5-digit Zone Improvement Plan (ZIP) code and 4-digit extension code (if available)
No Not identified in current system. None planned, effort to match, High
4.3.8 Daylight Savings Zone flag Identifies whether site location undergoes daylight savings time
No Not identified in current system. None planned, effort to match, High
5.1 Local/State Identifier State unique identifier/state permit number
Obwell Number Yes
5.2 Depth of well Depth Yes5.3 Source of Data The contributing source of
the well depth dataNo Not identified in current system. None planned, effort to match,
High5.6 Casing depth of well Casing Depth Yes5.7 Top of screened or openhole (rtd) (Depth to top of eachopen interval)
No Screen length is currently identified.
None planned, effort to match, High
5.8 Bottom of screened or openhole (rtd) (Depth to bottom ofeach open interval)
No Screen length is currently identified.
None planned, effort to match, High
5.9 Casing material(s), if there is a casing
Casing material Yes
5.10 Screen material type(s) at each open interval(s), if the well has well screen(s)
No Screen martial not identified None planned, effort to match, High
4.1..2 Longitude Measure of angular distance on a meridian east or west of the prime meridian in
No DNR uses UTM (NAD 88 Zone 15) to locate position of well.
4.3.1 Owner data Owner Name No Not identified in current system.
No Not identified in current system.
4.3.7 Time Zone Standard time zone of location of well
No Not identified in current system. None planned, effort to match, High
None planned, effort to match, High
None planned, effort to match, Low
5.0 WELL CHARACTERISTICS (Metadata collected and reported one time for a well or monitoring site)
4.3.4 State name State where well is located.

Data Element Definition MN DNR Compliant Item(s) different Compliance - changesSpecified well type: Not identified in current system. None planned, effort to match,
High(1) Background (2) TargetedIndication of well purpose:
(a) Quantity/Level
(b) Quality(c) Both
5.13 Well Log or CompletionReport Available
Indication of well log or Completion Report availability: Yes/No
Yes Stored in an other State Agency database
None planned, effort to match, High
Location at which the measurement/sampling was done:(a) top of well above land surface(b) top of well at land surface
(c) top of well below land surface
5.2.2 Measurement/Samplingpoint height (Measuring pointelevationrelative to datum (rtd)5.2.3 Measuring/Sampling PointAccuracy of Measurement
Indication of accuracy of measuring the point of measurement or sampling in feet
No Not identified in current system. None planned, effort to match, High
6.1 PurposeSpecified monitoring purpose:
None planned, effort to match, High
(a) baseline(b) surveillance(c) trend(d) special studies
(1) Time zone code. None planned, effort to match, High
(2) Time zone number. (3) Time zone name. (4) Time zone description
6.2.2 Measurement/Sampling date/time
Yes
6.2.2.2 Water-level measurement date
The calendar date when water level was measured, reported as 4-digit year, 2-digit month, and 2-digit day in YYYYMMDD format.
Date Yes Recorded as MMDDYYYY None planned, effort to match, Medium
6.2.2.3 Water-level measurement time
The measure of clock time and time zone when water level was measured, reported as a 24-hour day with 2-digit hour, 2-digit minute, and 2-digit second.
Time No Available on some records None planned, effort to match, Medium
Use of area immediately around well:
None planned, effort to match, High
Yes
5.11 Well type No
5.12 Well Purpose No Not identified in current system.
6.0 MEASUREMENT/SAMPLING EVENT (Metadata collected and reported for each measurement and sampling event and data for water level
6.1.1 Monitoring Purpose No Not identified in current system.
5.2 Measurement Location (Metadata collected and reported one time for each well)5.2.1 Description of Measurement/Sampling/Reference Point
No Not identified in current system.
Height of measurement/sampling point from land surface elevation (altitude) in feet
No Not identified in current system.
6.2 Date and Time (Metadata collected and reported for each measurement and sampling event)6.2.1 Time zone code Code for which time zone
datum is used for measurement
No Not identified in current system.
None planned, effort to match, High
None planned, effort to match, High
Stickup
6.2.2.1 Level Measurement date and time (Data for water level measurement collected and reported for each measurement event)
6.2.3 Quality Sampling date and time (Metadata for water quality sampling collected and reported for each sampling event)
6.3 Measurement /Sampling Site Use (Metadata collected and reported each time for water level or water quality sampling event)6.3.1 Site use at time of measurement/sampling event

Data Element Definition MN DNR Compliant Item(s) different Compliance - changesCommercial, industrial, agricultural cropping, undeveloped pasture/range, forest, or residential at time of measurement or sampling event
(2) Water level measurement referenced to land surface datum
(2) Water level measurement referenced to measuring point
(3) Water level measurement referenced to mean sea level
6.4.2 Measurement method Method of water-level measurement
Water-Level Method of Measurement
No Not identified in current system. None planned, effort to match, High
6.4..3 Water level accuracy Accuracy of water-level measurement in feet
[Water level] Accuracy code
No Not identified in current system. None planned, effort to match, High
Status of water-level:
(a) static(b) pumping
6.4.4 Water-level status NI No Not identified in current system.
6.4 Level Elevation Measurement (Data collected and reported each time for a water level measurement)6.4.1 Water Level Water level, in feet, reported
to accuracy of measurement to the nearest ones, tenths, or hundredths of a foot
Yes
None planned, effort to match, High
Proposed Changes to the Framework Document Additional guidance is needed to assist the states in determining the number of wells required for a National assessment of groundwater conditions. The states likely require finer-scale information to meet their needs, and not all of this information is likely necessary to describe regional aquifer conditions. Regional assessments of aquifers by the USGS National Water-Quality Assessment Program (Lapham et al. 2005) may be a good source of this additional information.
Additional guidance is also needed for the states to classify wells into the Targeted and Unstressed Subnetworks to facilitate data interpretations at the National level. The current guidance describes the Targeted Subnetwork as assessing areas of concern, usually contaminated areas and areas where water-level declines are of concern, and the Unstressed Subnetwork assesses minimally-affected areas. These definitions, especially defining “areas of concern”, likely will be applied differently among the states and will complicate data interpretations at the National scale. A refined definition of Unstressed or Targeted Subnetworks will assist states in classifying their network wells into these categories. The State of Minnesota does not currently differentiate its water level network wells in this way.
The Framework Document should be revised to better define how to classify new monitoring points in the network. The text in the section on Baseline Monitoring (Section 1.4.4.1) states new sites should be monitored for five years and then the data providers should determine whether these wells are placed in the Unstressed or Targeted Subnetworks. However, Figure 1.4.4.1 and the tables provided in the template for this report suggested the wells initially be included in either the Unstressed or Targeted Subnetwork, prior to any data collection.
It is recommended to increase the water-level measurement frequency in the Framework Document. Water level data are important in evaluating groundwater recharge, climatic conditions, and the maximum and minimum water levels within an aquifer system (especially one with many withdrawals). With the relatively low cost of continuous water level measuring instruments, the cost of the additional data is small and the value of the data is great comparatively.
It is recommended to decrease the water quality sampling frequency in some settings. Most wells in the Cambrian-Ordovician system can be sampled for water quality at a longer frequency than those suggested in the Framework Document and still adequately characterize seasonal and temporal trends. Most wells in the Water-Quality Trend Network represent confined or unconfined aquifers with “low” or “high” hydraulic conductivity, and the suggested sampling in the Framework Documents ranges from twice per year to every two years. The available information on the apparent age of the young fraction of the groundwater in unconfined parts of the Prairie du Chien-Jordan aquifer, however, suggests a sampling frequency of every five years would adequately characterize any changes in water-quality conditions. Sulfur hexafluoride samples were collected from approximately 30 wells in the unconfined part of the Prairie du Chien-Jordan aquifer as part of the USGS NAWQA in 2007 and is used determine the apparent age of the young fraction of the groundwater. These data indicates the young fraction of the groundwater ranges from 12 to 30 years old and suggests a five-year sampling frequency would be adequate to characterize the water quality. Furthermore, most of these wells have been sampled on an annual basis by the MPCA for at least five years, and these data also suggest there has been no appreciable change in nitrate or chloride concentrations over this period.
Benefits of the Network The benefit of Minnesota’s current groundwater monitoring networks provide information to better understanding of the state’s water resources. The benefits of participating in this pilot effort for both understanding our current networks and the expected benefits of participating in the NGWMN are listed below.
• Provide an overview of the State’s groundwater networks. • Opportunity to work more closely with state agencies with groundwater responsibilities within
Minnesota. • More opportunities for collaboration between the DNR and MPCA groundwater programs.
Results of the Minnesota Pilot Study for the Minnesota Department of Natural Resources National Groundwater Monitoring Network • March 2011 Minnesota Pollution Control Agency
34
• Opportunity to work with other states and learn how other states manage their groundwater monitoring networks.
• Opportunity for a peer review of the DNR’s and MPCA’s field practices and data management. • Possibility to use the proposed data portal to allow presentation of water data from the different state
agencies. • Opportunity to see a prototype portal system. • If the national portal cannot be used on an intrastate basis, the national portal could be used to as a
template to develop Minnesota’s own portal system. • Opportunity to evaluate our groundwater networks in light of current scientific understanding of
optimal well density and sampling frequency. • This report and the process leading up to it has given a larger audience the chance to learn about
Minnesota’s groundwater monitoring networks. • Minnesota can be at the forefront of developing a national groundwater network.
Cost Estimates The costs to participate in this pilot study and funding estimates required to fully implement the current guidance in the Framework Document, including the identified network gaps, are presented in this section. Costs to participate in this pilot study were directly borne by the DNR and MPCA during 2010. Cost estimates associated with operating and managing wells for the NGWMN and implementing the changes identified in the Gap Analysis are presented to assist the SOGW in developing funding estimates to implement the NGWMN Nationwide. No funds have been procured at the writing of this report (2010) to fully implement the NGWMN. It is anticipated these costs would be borne by the Federal government and would not be sole responsibility of the states.
The current cost to operate the DNR’s groundwater level monitoring network is approximately $200 per well or $150,000/year. These are the personnel costs for cooperating agencies to collect monthly water level measurements and for DNR staff to coordinate and administer the program. The cost does not include network maintenance. The current cost to operate the MPCA’s Ambient Groundwater Monitoring Network is approximately $1.4 million dollars each year. This includes personnel costs for MPCA staff to administer the network and collect the well water samples plus indirect costs incurred by the agency. The MPCA’s current network costs also include funding to install approximately 30 new shallow wells in the glacial sand and gravel aquifers and collect samples for analysis of emerging contaminants at 40 selected wells. The well installation is a short-term activity and is expected to be completed by 2014.
Cost to participate in the pilot study The cost for DNR and MPCA staff to participate in this pilot study was $27,000. The cost for the DNR to participate in the pilot study was $15,000, and the MPCA’s cost was $12,000. These primarily were labor costs for agency staff to evaluate the networks, attend monthly conference calls and meetings, and prepare this report. The MPCA’s cost was for approximately 10 percent of one professional staff person’s time and included the salary and benefits.
Cost to operate and manage NGWMN wells The DNR’s and MPCA’s costs to operate and manage the wells suggested for the NGWMN are expected to be minimal. Most wells monitored by the MPCA’s network already are sampled on an annual basis, which meets or exceeds the recommended frequency in the Framework Document. The sampling frequency will need to be increased at a small number of the wells in the MPCA’s network to meet the recommendation in the Framework Document. These additional costs were estimated to total $13,500.
Results of the Minnesota Pilot Study for the Minnesota Department of Natural Resources National Groundwater Monitoring Network • March 2011 Minnesota Pollution Control Agency
35

Cost to implement the changes identified in the gap analysis The capital costs to fill the identified gaps in the Water-Level Trend Network and meet the guidance in the Framework Document were estimated to be $2,525,000 (Table 7). The installation of additional wells to address the identified spatial gaps in monitoring was the largest of these costs. The cost to update the DNRs field practices and data management system was estimated to be $35,000. The additional annual operation and maintenance costs required to meet the recommendations in the Framework Document totaled $87,500.
The largest cost identified in the gap analysis of the Water-Quality Trend Network was to install additional wells for the Prairie du Chien-Jordan Surveillance Monitoring Network (Table 7). The initial implementation of the Surveillance Monitoring Network, including capital and operation and maintenance costs, was estimated to cost $1,170,000. The largest of these were the cost to install an additional 40 wells, estimated to be $1,000,000. The new wells are expected to have a life of 25 years. It was assumed estimating the well installation costs that access to suitable wells for water quality sampling would not be available in 20 of the cells with an existing well, resulting in the need to install a total of 40 monitoring wells. The labor, analytical laboratory, and data management costs associated with the monitoring the Surveillance Monitoring Network every five years were estimated to be $168,000. The additional equipment required to sample the surveillance network was estimated to cost $15,000. The annual cost to maintain this network was $2,000, which is the yearly well maintenance fees paid to the MDH and mandated by the State of Minnesota.
Results of the Minnesota Pilot Study for the Minnesota Department of Natural Resources National Groundwater Monitoring Network • March 2011 Minnesota Pollution Control Agency
36

Table 6 Comparison of MPCA data elements to the proposed minimum criteria for the National Groundwater Monitoring Network [MPCA, Minnesota Pollution Control Agency; CWI, County Well Index; EQuIS, Environmental Quality Information System].
Data Element Definition Comparable USGS Data Element
MPCA/CWICurrently-stored elements (Similar elements)
Data elementsAvailable in MPCA EQuIS database (Similar elements)
1.0 POINT OF CONTACT (Metadata collected and reported one time for a well or monitoring site) 1.1 Source of data Identifies the primary source or
provider of data, including name, address, telephone number, email address
(1) Agency code (2) Water level reporting
agency
1.1.1 Organization name Legal formal name of organization that is the primary source of data
Water level reporting agency
1.1.2 Mailing Address Exact address where mail is intended to be delivered, including street, rural route, and/or PO Box
1) Address line 1 2) Address line 2
1.1.2.1 City, Town, Village Name City where organization that collected information resides
City name
1.1.2.2 State Name State USPS postal abbreviation code 1.1.2.3 Mailing Address ZIP Code/Postal Code
5-digit Zone Improvement Plan (ZIP) code and 4-digit extension code (if available)
1.1.3 Telephone number Telephone number (including area code) of the person who is the point of contact for the organization
Address phone number
1.1.4 Electronic Mail Address Electronic Mail Address (email) of the contact person at the organization
NI
2.0 SITE IDENTIFICATION/DESCRIPTION (Metadata collected and reported one time for a well or monitoring site)2.1 Site Identifier Unique site identifier consisting
of a latitude (DDMMSS), longitude (DDDMMSS), and sequence number (NN) (DDMMSSDDDMMSSNN)
Site identification number
3.0 GEOLOGIC/HYDROLOGIC DESCRIPTION (Metadata collected and reported one time for a well or monitoring site)3.1 Hydrologic basin Hydrologic unit code X

3.2 Geologic unit(s) containing aquifer (Aquifer lithology; the lithology of the primary contributing unit(s))
[Geohydrologic units] Lithology code
X X
3.3 Aquifer tapped (Principal Aquifer or other significantly used aquifer; primary units(s) contributing water to the well)
USGS Atlas designation of aquifer
1) Aquifer code 2) Aquifer name 3) National aquifer code 4) National aquifer name 5) Contributing unit
3.4 Local aquifer name (if applicable) 1) Aquifer code 2) Aquifer name 3) Contributing unit
X X
3.5 Aquifer type Type of aquifer Aquifer type code 3.6 Aquifer conditions: (1) confined or (2) unconfined or leaky confined
NI
4.0 WELL LOCATION (Metadata collected and reported one time for a well or monitoring site) 4.1 Horizontal Location 4.1.1 Latitude Measure of angular distance on
a meridian north or south of the equator in degrees, minutes, seconds, or decimal degrees
(1) Sexagesimal latitude (2) Decimal latitude
X X
4.1.2 Longitude Measure of angular distance on a meridian east or west of the prime meridian in degrees, minutes, seconds, or decimal degrees
(1) Sexagesimal longitude (2) Decimal longitude
X X
4.1.3 Horizontal Reference Datum The reference datum to determine latitude and longitude coordinates
Latitude/longitude (horizontal) coordinate datum
X
4.1.4 Location Horizontal Accuracy The measure of accuracy (in feet) of the latitude and longitude coordinates
Latitude/longitude coordinate accuracy
X
4.1.5 Location Collection Method Method used to determine latitude and longitude coordinates for a well
Method determining horizontal datum
X
4.2 Vertical Location 4.2.1 Altitude of Land Surface at Wellhead
Altitude of the ground surface for the well at which a measurement is being taken
X X
4.2.2 Altitude measurement method Method used to determine altitude
X
4.2.3 Altitude (Land Surface Elevation) The measure of elevation above or the depth below a reference
Gage or land surface datum X

4.2.4 Altitude accuracy The accuracy of altitude measurement
Altitude accuracy code X
4.2.5 Vertical Reference Datum Datum of altitude Altitude datum code X 4.3 Well Address 4.3.1 Owner data Owner Name 1) Site owner number
2) Party identification number 3) Site owner type code
XA XA
4.3.2 Mailing Address Exact address where well is located, including street, rural route, and house number
NI XA XA
4.3.3 City or Town Nearest City, Town, village where well is located
NI XA,B XA,B
4.3 Well Address 4.3.4 State name State where well is located 1) State name
2) State FIPS code XB XB
4.3.5 Tribal Reservation/Country Tribal reservation/Country where well is located
FIPS country code as defined by FIPS PUB 10-4
XB XB
4.3.6 Mailing Address ZIP code/Postal code
5-digit Zone Improvement Plan (ZIP) code and 4-digit extension code (if available)
XA,B XA,B
4.3.7 Time Zone Standard time zone of location of well
(1) Time zone code (2) Time zone number (3) Time zone name (4) Time zone description
X X
4.3.8 Daylight Savings Zone flag Identifies whether site location undergoes daylight savings time
(1) Time zone Daylight Saving Time code
(2) Time zone Daylight Saving Time name
5.0 WELL CHARACTERISTICS (Metadata collected and reported one time for a well or monitoring site)5.1 Local/State Identifier State unique identifier/state
permit number Site identification number X X
5.2 Depth of well Well depth X X5.3 Source of Data The contributing source of well
depth data (1) Reporting agency or entity (2) User name of person who
created site record
5.6 Casing depth of well 1) Depth to casing string bottom
2) Well thickness of this casing
3) Well depth NOT CORRECT
X X
A Data are not available publicly B Contained in the County Well Index

5.7 Top of screened or open hole (rtd) (Depth to top of each open interval)
Depth to top of open interval X X
5.8 Bottom of screened or open hold (rtd) (Depth of bottom of each open interval)
Depth to open interval bottom X X
5.9 Casing material(s), if there is a casing
Casing material X X
5.10 Screen material type(s) at each open interval(s), if the well has well screen(s)
Casing material X X
5.11 Well type Specified well type: 1) Background 2) Targeted
Type of network
5.12 Well purpose Indication of well purpose: a) Quantity/Level b) Quality c) Both
5.13 Well Log or Completion Report Available
Indication of well log or Completion Report availability: Yes/No
5.2 Measurement Location (Metadata collected and reported one time for a well or monitoring site) 5.2.1 Description of Measurement/Sampling/Reference Point
Location at which the measurement/sampling was done: a) Top of well above land
surface b) Top of well at land surface c) Top of well below land
surface
1) Measurement point sequence number
2) Description of measurement point
5.2.2 Measurement/Sampling point height (Measuring opint elevation relative to datum (rtd)
Height of measurement/sampling point from land surface elevation (altitude) in feet
1) Height of measuring point 2) Measuring point altitude
X
5.2.3 Measuring/Sampling Point Accuracy of Measurement
Indication of accuracy of measuring the point of measurement or sampling in feet
6.0 MEASUREMENT/SAMPLING EVENT (Metadata collected and reported for each measurement and sampling event and data for water chemistry measurement) 6.1 Purpose
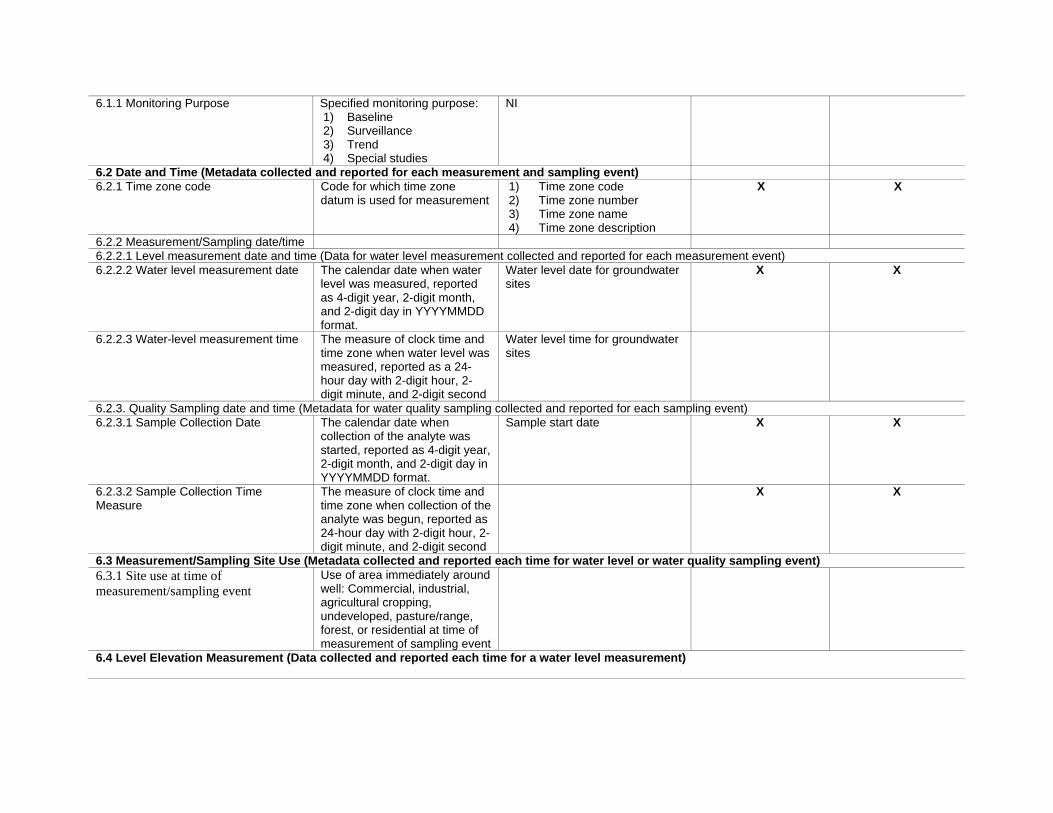
6.1.1 Monitoring Purpose Specified monitoring purpose: 1) Baseline 2) Surveillance 3) Trend 4) Special studies
NI
6.2 Date and Time (Metadata collected and reported for each measurement and sampling event) 6.2.1 Time zone code Code for which time zone
datum is used for measurement 1) Time zone code 2) Time zone number 3) Time zone name 4) Time zone description
X X
6.2.2 Measurement/Sampling date/time 6.2.2.1 Level measurement date and time (Data for water level measurement collected and reported for each measurement event) 6.2.2.2 Water level measurement date The calendar date when water
level was measured, reported as 4-digit year, 2-digit month, and 2-digit day in YYYYMMDD format.
Water level date for groundwater sites
X X
6.2.2.3 Water-level measurement time The measure of clock time and time zone when water level was measured, reported as a 24-hour day with 2-digit hour, 2-digit minute, and 2-digit second
Water level time for groundwater sites
6.2.3. Quality Sampling date and time (Metadata for water quality sampling collected and reported for each sampling event)6.2.3.1 Sample Collection Date The calendar date when
collection of the analyte was started, reported as 4-digit year, 2-digit month, and 2-digit day in YYYYMMDD format.
Sample start date X X
6.2.3.2 Sample Collection Time Measure
The measure of clock time and time zone when collection of the analyte was begun, reported as 24-hour day with 2-digit hour, 2-digit minute, and 2-digit second
X X
6.3 Measurement/Sampling Site Use (Metadata collected and reported each time for water level or water quality sampling event)6.3.1 Site use at time of measurement/sampling event
Use of area immediately around well: Commercial, industrial, agricultural cropping, undeveloped, pasture/range, forest, or residential at time of measurement of sampling event
6.4 Level Elevation Measurement (Data collected and reported each time for a water level measurement)

6.4.1 Water Level Water level, in feet, reported to accuracy of measurement of nearest ones, tenths, or hundredths of a foot
1) Water level measurement referenced to land surface datum
2) Water level measurement referenced to measuring point
3) Water level measurement referenced to mean sea level
XC X
6.4.2 Measurement method Method of water-level measurement
Water-level Method of Measurement
X
6.4.3 Water level accuracy Accuracy of water-level measurement in feet
Water-level Accuracy code
6.4.4 Water-level status Status of water level: a) Static b) Pumping
NI
6.5 Sampling Point Elevation Measurement (Metadata collected and reported each time for a water quality sampling event)6.5.1 Sampling Point Elevation Elevation in the well water
column at which the sample was drawn, in feet, reported to accuracy of measurement to the nearest ones, tenths, or hundredths of a foot
1) Water level measurement referenced to land surface datum
2) Water level measurement referenced to reference point
3) Water level measurement referenced to mean sea level
6.5.2 Sampling Point Elevation Measurement method
Method of sampling point elevation measurement
Water level Method code
6.5.3 Sampling Point Elevation accuracy
Accuracy of sampling point elevation in feet
Water level Accuracy code
6.6 Sample Collection (Metadata collected and reported for each water quality sample)6.6.1 Sample Type The type of sample being
described. Permitted values include:
1) Sample 2) Duplicate sample 3) Other entries as
applicable
X X
6.6.2 Sample Identification The unique name, number, or code assigned to identify the sample.
Record number is the 8-digit number that identifies the water-quality sample
X X
C Data only available after 2008.

6.6.3 Sample Collection Method Code An alphanumeric label to identify the sample collection method
NI X X
7.0 WATER QUALITY RESULTS (data from Laboratory reported for each samplg and analyte tested)7.1 Result Value Reportable numbericdal
measure of the result for the chemical or microbiological analyte, or other characteristic, being analyzed
Value of result parameter X X
7.1.1 Result Value Unit of Measure The name of the determinate quantity for a standard of measurement used for measuring dimension, capacity, or amount of something (e.g., mg/L, pCi/L, CFU/mL, etc.)
1) Parameter code 2) Parameter short name 3) Fixed-value domain
element value 4) Fixed-value element
short name
X X
7.1.3 Analyte name The name assigned to a substance or feature that describes it in terms of its molecular composition, taxonomic nomenclature or other characteristic. This field is optional if the analyte is adequately described in one of the following subelements
X X
7.1.4 Chemical Identifier/Number (chemicals only)
Chemical Identifier/Number is the unique number assigned to all chemical substances in the Chemical Abstract Services’s (CAS) Registry or in the EPA Chemical Registry System to chemical groupings for which CAS Registry numbers do not exist and cannot be assigned.
X X
7.1.5 Biological Identification Number The unique identification number assigned by either the Integrated Taxonomic Information System (IT IS), the International Committee on Taxonomy of Viruses, or the EPA Biological Registry System.
7.1.6 Biological Systematic Context Name
The name of the classification system used to assigned a systematic name to a biological entity.
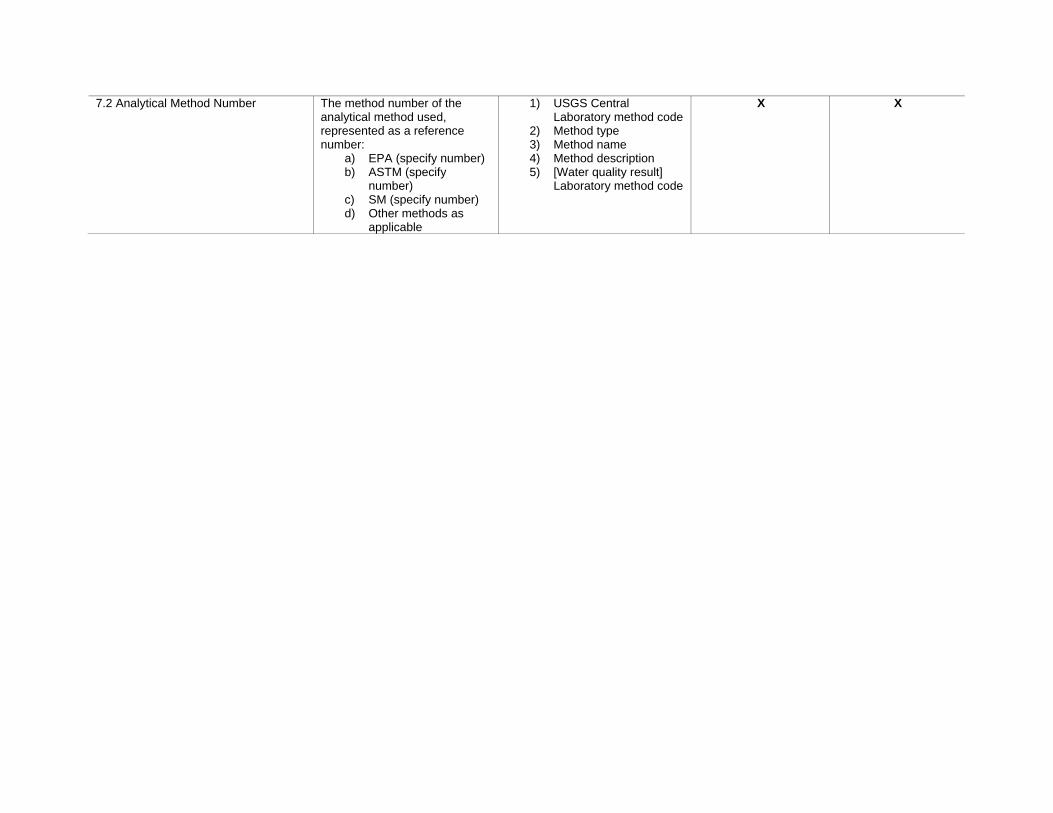
7.2 Analytical Method Number The method number of the analytical method used, represented as a reference number:
a) EPA (specify number) b) ASTM (specify
number) c) SM (specify number) d) Other methods as
applicable
1) USGS Central Laboratory method code
2) Method type 3) Method name 4) Method description 5) [Water quality result]
Laboratory method code
X X

Table 7 Estimated Costs for Minnesota for the NGWMN
Pilot Project
NGWMN Pilot Program Element Agency
Incremental changes needed to meet network guidelines
Capital Cost Rationale
Estimated Capital Costs
O&M Cost Rationale
Estimated yearly O&M costs
Spatial Gaps: Identify 3-D spatial “gaps” in network(s) DNR Install 96 wells across the project aquifers. $25,000 x 96 $2,400,000.00
State fees ($50/year/well) + personnel cost (1 person x $60,000) $67,500.00
MPCA Install 40 wells for the Surveillence Monitoring Network $25,000 x 40 $1,000,000.00
State fees ($50/year) x 40 wells $2,000.00
MPCA Sample Surveillence Monitoring Network wells Additional equipment $15,000.00
Laboratory costs (130 wells x $600) $78,000*
MPCA Sample Surveillence Monitoring Network wells
Personnel costs (1 person x $60,000) $60,000*
MPCA Data management associated with Surveillence Monitoring Network Wells $0.00
Personnel cost (0.25 person x $60,000) $15,000*
Field Practice Gaps: Determine whether field practices meet NGWMN criteria and what changes may be required DNR Modifying Field Practices $15,000.00 $5,000.00
MPCA $0.00 $0.00
Data Management Gaps: Determine whether data management standards meet the NGWMN criteria DNR
Modification of data fields in database to match Framework Document and working with SOGW to implement portal
Personnel cost (0.3 person x $60,000 ) $20,000.00
Personnel cost (0.25 person x $60,000 ) $15,000.00
MPCA
Modification of data fields in database to match Framework Document and working with SOGW to implement portal $5,000.00
Personnel cost (0.05 person x $60,000 ) $3,000.00
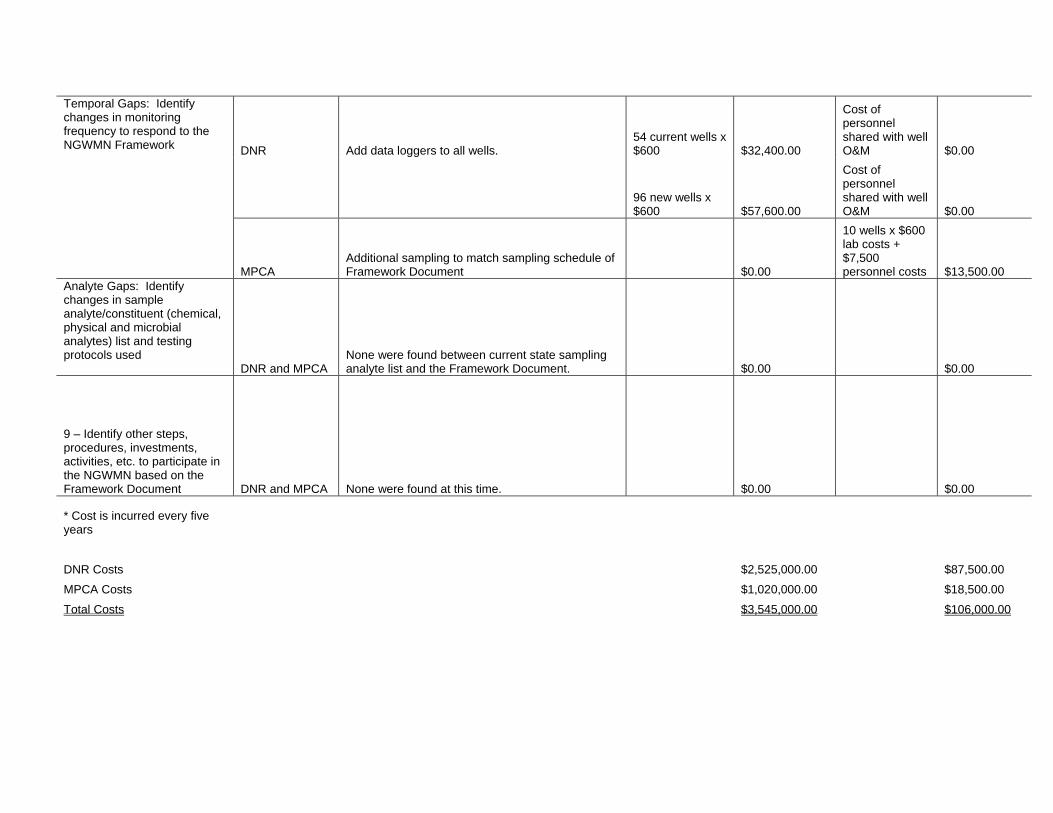
Temporal Gaps: Identify changes in monitoring frequency to respond to the NGWMN Framework DNR Add data loggers to all wells.
54 current wells x $600 $32,400.00
Cost of personnel shared with well O&M $0.00
96 new wells x $600 $57,600.00
Cost of personnel shared with well O&M $0.00
MPCA Additional sampling to match sampling schedule of Framework Document $0.00
10 wells x $600 lab costs + $7,500 personnel costs $13,500.00
Analyte Gaps: Identify changes in sample analyte/constituent (chemical, physical and microbial analytes) list and testing protocols used
DNR and MPCA None were found between current state sampling analyte list and the Framework Document. $0.00 $0.00
9 – Identify other steps, procedures, investments, activities, etc. to participate in the NGWMN based on the Framework Document DNR and MPCA None were found at this time. $0.00 $0.00
* Cost is incurred every five years
DNR Costs $2,525,000.00 $87,500.00
MPCA Costs $1,020,000.00 $18,500.00
Total Costs $3,545,000.00 $106,000.00

References Berg, J.A., 2003, Geologic atlas of Goodhue County, Minnesota, Minnesota Department of Natural Resources County Atlas Series C-12, Plate 9.
Campion, M., 1997,.Geologic atlas of Rice County, Minnesota, Minnesota Department of Natural Resources County Atlas Series C-9, Plate 9.
Delin, G.N., 1990, Hydrogeology and simulation of ground-water flow in the Rochester area, southeastern Minnesota, 1987-88: U.S. Geological Survey Water-Resources Investigations Report 90-4081, Mounds View, Minnesota.
Delin, G.N., and Falteisek, J. D. 2007, Groundwater Recharge in Minnesota. USGS Fact Sheet 2007-3002.
Delin, G.N.; and Woodward, D.G., 1984, Hydrogeologic setting and the potentiometric surfaces of regional aquifers in the Hollandale Embayment, Southeastern Minnesota, 1970-80: U.S. Geological Survey Water-Supply Paper 2219.
Gilbert, R.O., 1987, Statistical methods for environmental pollution monitoring: New York, Van Nostrand Reinhold.
Hutson, S.S.; Barber, N.L.; Kenny, J.F.; Linsey, K.S.; Lumia, D.S.; and Maupin, M.A., 2004, Estimated use of water in the United States in 2000: U.S. Geological Survey Circular 1268, Reston, Virginia.
Fong, A.L.; Andrews, W.J.; and Stark, J.R, 1998, Water-quality assessment of part of the Upper Mississippi River Basin, Minnesota and Wisconsin—Ground-water quality in the Prairie du Chien-Jordan aquifer, 1996: U.S. Geological Survey Water-Resources Investigations Report 98-4248, Mounds View, Minnesota.
Jakes, D.; Clark, T.; Hsu, Y.; Hoffman, C.; Maloney, J.; Stockinger, J.; and Trojan, M., 1998, Baseline water quality of Minnesota’ principal aquifers: Minnesota Pollution Control Agency, St. Paul, Minnesota.
Lapham, W.W.; Hamilton, P.A.; and D.N. Myers, 2005, National Water-Quality Assessment Program Cycle II—Regional assessment of aquifers: U.S. Geological Survey Fact Sheet 2005-3013.
Lindgren, R.J., 2001, Ground-water recharge and flowpaths near the edge of the Decorah-Platteville-Glenwood confining unit, Rochester, Minnesota: US Geological Survey Water-Resources Investigations Report 00-4215, Mounds View, Minnesota.
Metropolitan Council, 2009, Twin Cities metropolitan area regional groundwater flow model version 2.00, Metropolitan Council Technical Report, St. Paul, Minnesota.
Minnesota Department of Natural Resources, 2009, Plan to develop a groundwater Level Monitoring network for the 11-CounyMetropolitan Area, October 2009, DNR Division of Water, St. Paul, Minnesota.
Minnesota Department of Natural Resources, 2010, Water Availability Assessment Report 2010, DNR Division of Water and Ecological Resources, St. Paul, Minnesota.
Meyer, G.N., 1990, Geologic atlas of Washington County, Minnesota, Minnesota Geological Survey County Atlas Series C-5, Plate 6, University of Minnesota.
Peterson, T.A., 2005, Geologic atlas of Wabasha County, Minnesota-- Sensitivity to pollution of the uppermost aquifers, Minnesota Department of Natural Resources, St. Paul, Minnesota.
Wahl, T.E., and R.G. Tipping, 1991, Ground-water Data Management—the County Well Index: Minnesota Geological Survey, Minneapolis, Minnesota.
Results of the Minnesota Pilot Study for the Minnesota Department of Natural Resources National Groundwater Monitoring Network • March 2011 Minnesota Pollution Control Agency
47
Appendix A
Summary of the optimal groundwater level monitoring network analysis The DNR has recently conducted an analysis of the its groundwater level monitoring network to determine the number of wells necessary to adequately characterize the state’s groundwater resources and to allow for management of the resource. Both analyses (conducted by DNR hydrologists) indicated a need for approximately 7,000 monitoring wells across the state. A summary of the two methods of analysis are presented below
1) Ideal well density based on aerial distribution This method expanded the results of a well analysis conducted in one county. Pope County recently had a geologic and hydrologic investigation completed by the state. This investigation by the DNR and Minnesota Geologic Survey (MGS) examined the geology and hydrogeology for the county and the results were published in the Geologic Atlas of Pope County Minnesota.
Using the four sand and gravel aquifers mapped in the county and the existing monitoring well network, a hypothetical groundwater network was designed. It was determined that 75 wells were needed throughout the county to adequately characterize the aquifers. Using this number of wells and dividing by the area of the county, a value of 1 well per 10 square miles was derived. This density would provide sufficient coverage across all of the county’s aquifers. Extending that ratio throughout the state (70,394 square miles) yields a value of 7,039 wells, approximately 7,000.
2) Ideal well density within existing and potential human impact areas A GIS map was created outlining irrigation districts and populated areas to represent existing human impact areas. A third area type intended to anticipate possible biofuels production areas was created by locating the intersections of railroads and natural gas pipelines. Most of these facilities are located or are expected to be located near these intersections.
The overlapping portions of these three area types were determined using GIS to create seven possible combinations of land use or possible use type. The land use types were assigned an ideal or optimum density ranking – high, medium, or low. Using selected examples of these area types, the existing observation well density was determined (1 well/8 mi2 - high density metro area; 1 well/12 mi2 - medium density areas; greater than 1 well/12 mi2 - low density areas).
The final ideal values were determined by assuming the high density value should be incrementally higher than existing – therefore, 1 well/7 mi2. The medium density selected was adequate – therefore, 1 well/12 mi2, and the low density value was chosen (somewhat arbitrarily) to be 1 well/16mi2. Multiplying these ideal values by the sums of the area categories yields the number of ideal monitoring sites. Since each site should ideally be a three well nest, the number of ideal monitoring sites was multiplied by three. The total number of wells in high density areas is 3,570, the number of wells in medium density areas is 2,490, and the number of wells in low density areas is 555 for a total number of wells of 6,615 wells, approximately 7,000.
Results of the Minnesota Pilot Study for the Minnesota Department of Natural Resources National Groundwater Monitoring Network • March 2011 Minnesota Pollution Control Agency
48

Appendix B Constituents analyzed in well water samples collected by the MPCA ambient groundwater quality monitoring network, 2010
Constituent Reporting limit Analytical method EPA 524.2 1,1,1,2-Tetrachloroethane 0.20 μg/L
1,1,1-Trichloroethane 0.20 μg/L EPA 524.2
1,1,2,2-Tetrachloroethane 0.20 μg/L EPA 524.2
EPA 524.2 1,1,2-Trichloroethane 0.20 μg/L
1,1,2-Trichlorotrifluoroethane 0.20 μg/L EPA 524.2
1,1-Dichloroethane 0.20 μg/L EPA 524.2
EPA 524.2 1,1-Dichloroethene 0.50 μg/L
1,1-Dichloropropene 0.20 μg/L EPA 524.2
1,2,3-Trichlorobenzene 1.0 μg/L EPA 524.2
1,2,3-Trichloropropane 0.50 μg/L EPA 524.2
1,2,4-Trichlorobenzene 0.50 μg/L EPA 524.2
1,2,4-Trimethylbenzene 0.50 μg/L EPA 524.2
1,2-Dibromo-3-chloropropane (DBCP) 2.0 μg/L EPA 524.2
1,2-Dibromoethane (EDB) 0.50 μg/L EPA 524.2
1,2-Dichlorobenzene 0.20 μg/L EPA 524.2
1,2-Dichloroethane 0.20 μg/L EPA 524.2
1,2-Dichloropropane 0.20 μg/L EPA 524.2
1,3,5-Trimethylbenzene 0.50 μg/L EPA 524.2
1,3-Dichlorobenzene 0.20 μg/L EPA 524.2
1,3-Dichloropropane 0.20 μg/L EPA 524.2
1,4-Dichlorobenzene 0.20 μg/L EPA 524.2
EPA 524.2 2,2-Dichloropropane 0.50 μg/L
2-Chlorotoluene 0.50 μg/L EPA 524.2
4-Chlorotoluene 0.50 μg/L EPA 524.2
EPA 524.2 Acetone 20 μg/L
Allyl chloride 0.50 μg/L EPA 524.2
Benzene 0.20 μg/L EPA 524.2
EPA 524.2 Bromobenzene 0.20 μg/L
Bromochloromethane 0.50 μg/L EPA 524.2
Bromodichloromethane 0.20 μg/L EPA 524.2
EPA 524.2 Bromoform 0.50 μg/L
Bromomethane 1.0 μg/L EPA 524.2
Carbon tetrachloride 0.20 μg/L EPA 524.2
Results of the Minnesota Pilot Study for the Minnesota Department of Natural Resources National Groundwater Monitoring Network • March 2011 Minnesota Pollution Control Agency
49

Constituent Reporting limit Analytical method Chlorobenzene 0.20 μg/L EPA 524.2
Chlorodibromomethane 0.50 μg/L EPA 524.2
Chloroethane 0.50 μg/L EPA 524.2
Chloroform 0.10 μg/L EPA 524.2
Chloromethane 1.0 μg/L EPA 524.2
Dibromomethane 0.50 μg/L EPA 524.2
Dichlorodifluoromethane 1.0 μg/L EPA 524.2
Dichlorofluoromethane 0.50 μg/L EPA 524.2
Ethyl ether 2.0 μg/L EPA 524.2
Ethylbenzene 0.50 μg/L EPA 524.2
Hexachlorobutadiene 1.0 μg/L EPA 524.2
Isopropylbenzene 0.50 μg/L EPA 524.2
Methyl ethyl ketone (MEK) 10 μg/L EPA 524.2
Methyl isobutyl ketone (MIBK) 5.0 μg/L EPA 524.2
Methyl tertiary butyl ether (MTBE) 2.0 μg/L EPA 524.2
Methylene chloride 0.50 μg/L EPA 524.2
Naphthalene 1.0 μg/L EPA 524.2
Styrene 0.50 μg/L EPA 524.2
Tetrachloroethene 0.20 μg/L EPA 524.2
Tetrahydrofuran (THF) 10 μg/L EPA 524.2
Toluene 0.50 μg/L EPA 524.2
Trichloroethene (TCE) 0.10 μg/L EPA 524.2
Trichlorofluoromethane 0.50 μg/L EPA 524.2
Vinyl chloride 0.20 μg/L EPA 524.2
cis-1,2-Dichloroethene 0.20 μg/L EPA 524.2
cis-1,3-Dichloropropene 0.20 μg/L EPA 524.2
n-Butylbenzene 0.50 μg/L EPA 524.2
n-Propylbenzene 0.50 μg/L EPA 524.2
o-Xylene 0.20 μg/L EPA 524.2
p&m-Xylenes 0.30 μg/L EPA 524.2
p-Isopropyltoluene 0.50 μg/L EPA 524.2
sec-Butylbenzene 0.50 μg/L EPA 524.2
Tert-Butylbenzene 0.50 mg/L EPA 524.2
trans-1,2-Dichloroethene 0.10 μg/L EPA 524.2
trans-1,3-Dichloropropene 0.20 μg/L EPA 524.2
Ammonia, Nitrogen 0.05 mg/L EPA 350.1
Organic plus ammonia nitrogen 0.20 mg/L EPA 351.2
Nitrate plus nitrite nitrogen 0.05 mg/L EPA 353.2
Results of the Minnesota Pilot Study for the Minnesota Department of Natural Resources National Groundwater Monitoring Network • March 2011 Minnesota Pollution Control Agency
50

Constituent Reporting limit Analytical method
National Groundwater Monitoring Network • March 2011 Minnesota Pollution Control Agency
51
Phosphorus 0.003 mg/L EPA 365.1
Organic carbon 1.0 mg/L SM 5310C
Bromide 0.005 mg/L EPA 300.1
Chloride 0.500 mg/L EPA 300.1
Sulfate 1.00 mg/L EPA 300.1
Calcium 2.00 mg/L EPA 200.7
Magnesium 2.00 mg/L EPA 200.7
Sodium 0.50 mg/L EPA 200.7
Potassium 0.50 mg/L EPA 200.7
Iron 20.0 ug/L EPA 200.7
Boron 20 ug/L EPA 200.7
Aluminum 2.50 ug/L EPA 200.8
Arsenic 0.80 ug/L EPA 200.8
Barium 2.50 ug/L EPA 200.8
Beryllium 0.30 ug/L EPA 200.8
Cadmium 0.10 ug/L EPA 200.8
Chromium 0.30 ug/L EPA 200.8
Cobalt 0.50 ug/L EPA 200.8
Copper 0.50 ug/L EPA 200.8
Lead 0.50 ug/L EPA 200.8
Lithium 5.00 ug/L EPA 200.8
Manganese 5.00 ug/L EPA 200.8
Mercury 0.400 ng/L EPA 1631
Molybdenum 0.50 ug/L EPA 200.8
Nickel 0.50 ug/L EPA 200.8
Silver 0.20 ug/L EPA 200.8
Strontium 2.00 ug/L EPA 200.8
Titanium 1.00 ug/L EPA 200.8
Vanadium 1.00 ug/L EPA 200.8
Zinc 1.00 ug/L EPA 200.8
Results of the Minnesota Pilot Study for the Minnesota Department of Natural Resources


![WAC 173-350-500 Groundwater monitoring. Groundwater ...WAC (5/6/2015 11:58 AM) [ 1 ] NOT FOR FILING WAC 173-350-500 Groundwater monitoring. (1) Groundwater monitoring– Professioanl](https://img.pdfslide.net/doc/110x75/5ed964b1f59b0f56f45f68c7/wac-173-350-500-groundwater-monitoring-groundwater-wac-562015-1158-am.jpg)