Embed Size (px)
Citation preview
DI
SC
US
SI
ON
P
AP
ER
S
ER
IE
S
Forschungsinstitut zur Zukunft der ArbeitInstitute for the Study of Labor
National Happiness and Genetic Distance:A Cautious Exploration
IZA DP No. 8300
July 2014
Eugenio ProtoAndrew J. Oswald
National Happiness and Genetic Distance:
A Cautious Exploration
Eugenio Proto CAGE, University of Warwick
Andrew J. Oswald CAGE, University of Warwick
and IZA
Discussion Paper No. 8300 July 2014
IZA
P.O. Box 7240 53072 Bonn
Germany
Phone: +49-228-3894-0 Fax: +49-228-3894-180
E-mail: [email protected]
Any opinions expressed here are those of the author(s) and not those of IZA. Research published in this series may include views on policy, but the institute itself takes no institutional policy positions. The IZA research network is committed to the IZA Guiding Principles of Research Integrity. The Institute for the Study of Labor (IZA) in Bonn is a local and virtual international research center and a place of communication between science, politics and business. IZA is an independent nonprofit organization supported by Deutsche Post Foundation. The center is associated with the University of Bonn and offers a stimulating research environment through its international network, workshops and conferences, data service, project support, research visits and doctoral program. IZA engages in (i) original and internationally competitive research in all fields of labor economics, (ii) development of policy concepts, and (iii) dissemination of research results and concepts to the interested public. IZA Discussion Papers often represent preliminary work and are circulated to encourage discussion. Citation of such a paper should account for its provisional character. A revised version may be available directly from the author.
IZA Discussion Paper No. 8300 July 2014
ABSTRACT
National Happiness and Genetic Distance: A Cautious Exploration*
This paper examines a famous puzzle in social science. Why do some nations report such high happiness? Denmark, for instance, regularly tops the league table of rich nations’ well-being; Great Britain and the US enter further down; France and Italy do relatively poorly. Yet the explanation for this ranking – one that holds even after adjustment for GDP and socio-economic and cultural variables – remains unknown. We explore a new avenue. Using data on 131 countries, we document a range of evidence consistent with the hypothesis that certain nations may have a genetic advantage in well-being. JEL Classification: I30, I31 Keywords: well-being, international, happiness, genes, GDP Corresponding author: Eugenio Proto Department of Economics University of Warwick Coventry CV4 7AL United Kingdom E-mail: [email protected]
* The first draft of this paper was written in 2012. The current title is a slightly modified version of the original title.

3
1. Introduction
This paper is a study of ‘happiness’ levels across the world. Research into the
determinants of human well-being -- by economists and many kinds of behavioral and
health scientists -- has become prominent1 and is beginning to shape policy-making in
the public sphere (Stiglitz et al. 2009)2. There also exists a literature on what might
be called the within-nation geography of happiness (Aslam and Corrado 2012,
Oswald and Wu 2011). However, a famous lacuna exists in the existing literature.
The long-observed international pattern of well-being remains unexplained.
Since the work of Edward Diener in the early 1990s (such as Diener et al.
1995), it has been known, and constantly found in replication studies3, that nations
like Denmark and the Netherlands regularly head the league table of international life-
satisfaction. Yet certain other countries, including high-GDP European countries
such as France and Italy, come surprisingly low down in an international ranking.
The reasons for this are not properly understood (although Senik 2011 provides a
novel analysis of the French case, and Helliwell and Wang 2013 examine many
possible variables). It is not because of elementary forms of measurement error: an
equivalent cross-country pattern has been found in reported hypertension and
psychiatric health (Blanchflower and Oswald 2008, Ploubidis and Grundy 2009).
Moreover, although the existence of a stable international pattern in well-being would
be expected if countries’ wealth and institutions matter and are also slow-changing,
the intellectual difficulty is that it has proved impossible in that way to account for the
empirical cross-national variation. The research paradox therefore continues.
1 Such as Diener et al. (1995), Easterlin (2003, 2013a,b), Graham (2010), Helliwell (2003), and Alesina et al. (2004). 2 Oswald and Wu (2010) uncover a close correspondence between subjective and objective well-being. 3 See, for example, Helliwell and Wang (2013). Graham (2010) and Blanchflower and Oswald (2011) summarize the literature and give results on modern data. See also the ranking in Hudson (2006).
4
Some influences are known. There is evidence that part of the long-observed
ranking can be attributed to GDP levels, the quality of government, and certain
welfare-state characteristics (such as in Di Tella et al. 2003, Graham 2010, and
Helliwell and Wang 2013). Nevertheless, even after adjusting for a range of such
factors, the underlying league-table pattern, with Denmark at or near the top in the
world happiness ranking, remains stubbornly in the data. Here we have been
influenced by the earlier work -- listed in the references -- of John Hudson, John
Helliwell and Shun Wang, and Jan Ott. There is also important new evidence that, as
a statistical matter, Denmark’s secret may be related to an avoidance of extreme
unhappiness in its citizens (Biswas-Diener et al. 2010). However, the substantive
reason for this, if it is to be part of a complete explanation, is itself unknown; so that
in turn only pushes the level of explanation one layer further back.
In this paper we consider an avenue that we originally found implausible. To
our surprise, we uncover empirical evidence consistent with a (partial) genetic
explanation. The key variable in the first form of evidence used in the paper is a
measure of genetic distance between countries’ populations. We show that this
variable is strongly correlated with international well-being differences, and that the
correlation seems not to because of potential omitted variables for factors such as
prosperity, culture, religion, or geographical position in the world. By using
regression equations, we aim to control for the potential confounding4 that geneticists
sometimes refer to as the ‘chopsticks problem’ or ‘social stratification’. We should
like to acknowledge that after the first draft of our paper was finished we discovered
4 Loosely, the chopsticks problem is that it would be possible spuriously to identify a gene that appeared to cause the use of chopsticks (whereas the deeper explanation was that cultural factors caused the chopsticks use and those were merely correlated with genetics). For this reason, papers by economists on genetic data, such as Ashraf and Galor (2013), sometimes provoke fierce responses from geneticists. However, both economists and geneticists are well aware of the problem of confounding, and both disciplines attempt to guard against it, if in their different ways and using different jargon.
5
that closely related work, though not on exactly the same data, had been presented by
Christie Scollon and colleagues in a conference poster session in 2012 (reported in
Scollon et al. 2012).
In a second form of evidence in this paper, our work also links to a modern --
not uncontroversial -- literature on depression and happiness levels in individuals that
documents statistical evidence for an association between mental well-being and (a
mutation of) the length variation in the serotonin-transporter-gene-linked polymorphic
region (5-HTTLPR). The protein-encoded serotonin transporter gene influences the
reuptake of serotonin, which is believed to be implicated in human mood. To our
knowledge, we are the first to consider this avenue as a possible way to explain the
well-being patterns at a national level. Because depression and mental disorder in
people has multiplied 'externality' effects on the happiness of others, through families
and friendship networks, it is to be expected that the effect of a genotype that
influences individual well-being could have larger effects in community-level data
than individual data.
We consider a third kind of evidence. We study US immigrants’ happiness
levels as a function of well-being levels in their families’ original home nations.
This paper builds heavily upon earlier scholars’ ideas. We have been
especially influenced by the important research of Spolaore and Wacziarg (2009) and
De Neve (2011, 2012). We employ data used by the former, elaborated from the
original genetic distance data of Cavalli-Sforza, Menozzi, and Piazza (1994), where
the focus is the set of 42 world populations for which they report bilateral distances
computed from 120 alleles. These populations are aggregated from subpopulations
characterized by high genetic similarity. More broadly, our well-being research
follows in a tradition exemplified by scholars such as Easterlin (2003), Di Tella et al.
6
(2003), Helliwell (2003), and Wolfers and Stevenson (2008). Our work also relates to
a stream of genetic research (Benjamin et al. 2012, Canli et al. 2005, Caspi et al.
2003, Chen et al. 2013, Chiao and Blizinsky 2010, Clarke et al. 2010, De Neve 2011,
De Neve et al. 2012, Fox et al. 2009, Gigantesco et al. 2011, Kuhnen et al. 2013,
Lesch et al. 1996, Risch et al. 2009, Sen et al. 2004, Stubbe et al. 2005, Szily et al.
2008, Weiss et al. 2002, 2008).
For the later analysis, we need two steps. The first is to calculate genetic
differences across nations. The second is to calculate whether those differences might
have any statistical explanatory power in a regression framework in which cross-
country well-being is the dependent variable.
Conceptually, the nature of a genetically homogeneous population Y can be
thought of as a vector of allele characteristics, y. We wish to be able to measure the
distance between this population and another population, X, with allele characteristics
x. Genetic distance, g, has to be captured in our empirical analysis by a scalar. Hence
in the case of two populations, X and Y, we need to define some form of mapping:
M(g, y, x) = 0
where g is a scalar for genetic distance, y is a vector of genetic characteristics of
country Y, and x is a vector of genetic characteristics of country X. Genetic distance
can be thought of as the genetic divergence between different species and their
populations. Because there is no unique mathematical way to calculate the distance
between two vectors, we follow an approach from within the existing literature. We
adopt ‘Nei's genetic distance’ metric, which can be viewed as the appropriate distance
measure when genetic variants come about by genetic drift and mutations.
Reassuringly, it is known that the Nei measure is correlated with other distance
measures (Nei 1972, Spolaore and Wacziarg 2009). The genetic distance between two
7
countries is a weighted transformation of the distance between homogenous
populations; this is done by taking into account the percentage of individuals
belonging to the different populations in the two countries, as in Spolaore and
Wacziarg (2009).
As one further check on our conclusions we use a form of epidemiological
approach (Fernández 2008). This relies on an examination of whether the level of
subjective well-being of the descendants of immigrants to a country -- in our case the
US -- is correlated with the level of subjective well-being of the original country. A
correlation between the two would be consistent with the hypothesis that differences
in subjective well-being are heritable. Parents transmit their genetic as well as their
cultural (broadly-speaking) traits to their offspring. Since in this paper we hope to
isolate the effect of the genes, in these later calculations we control for religion,
income, work status, age, and gender.
This paper is organized as follows. In the next three sections we analyze the
relationships between well-being and genetic distance, well-being and the 5-HTTLPR
polymorphism, and the happiness of US immigrants with their home countries’
subjective well-being. Section 5 concludes. The appendix describes the data.
2. Is There Evidence of a Link Between Genes and Well-being? A First Test
This study draws upon a number of international random-sample surveys and
uses those to examine the relationship between well-being differences and genetic
distance. The data sources include the Gallup World Poll, the World Values Surveys,
the Eurobarometer Surveys, and the European Quality of Life Surveys. Although
these data sets together provide information on hundreds of thousands of randomly
selected individuals, we are inevitably restricted, in a cross-country analysis, in
8
effective statistical power. The sample size for countries in this paper never exceeds
143 nations.
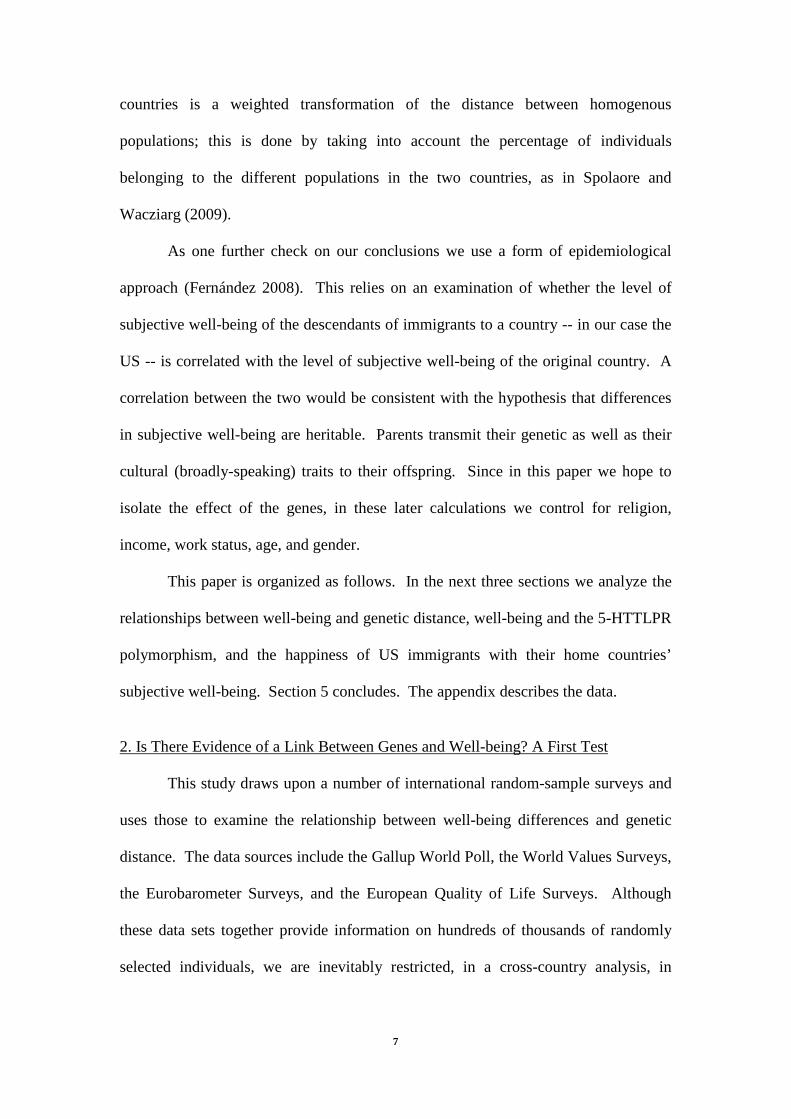
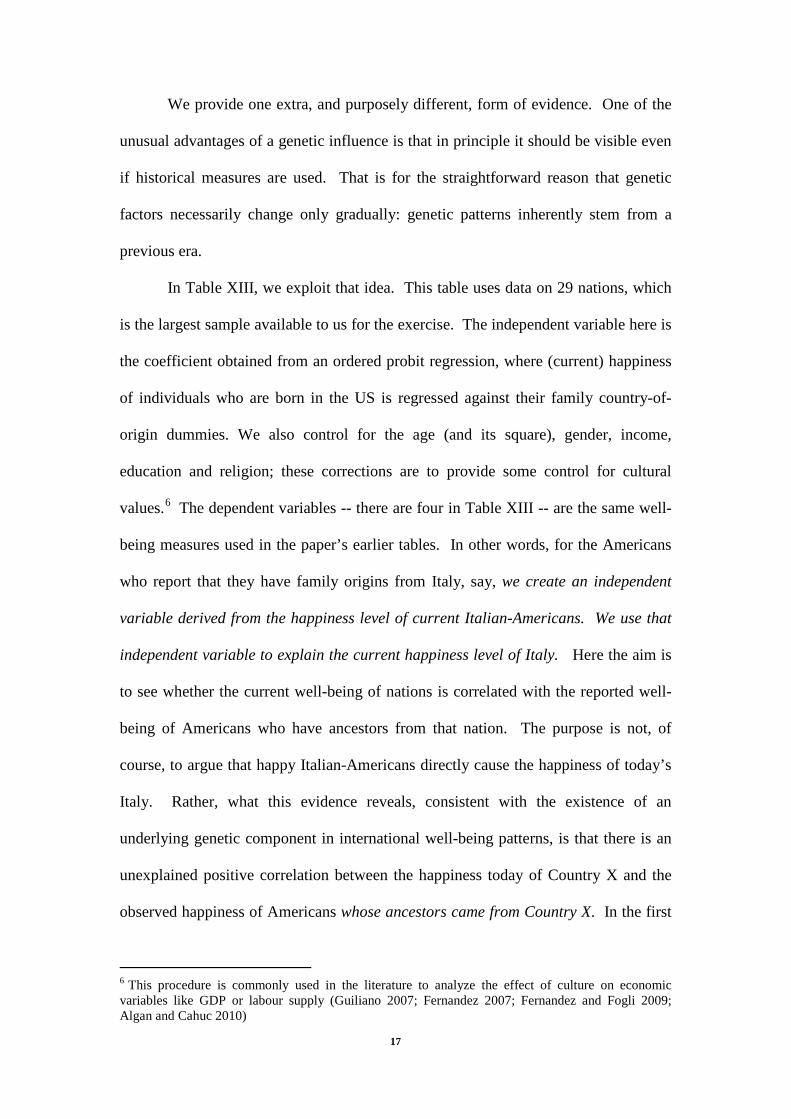
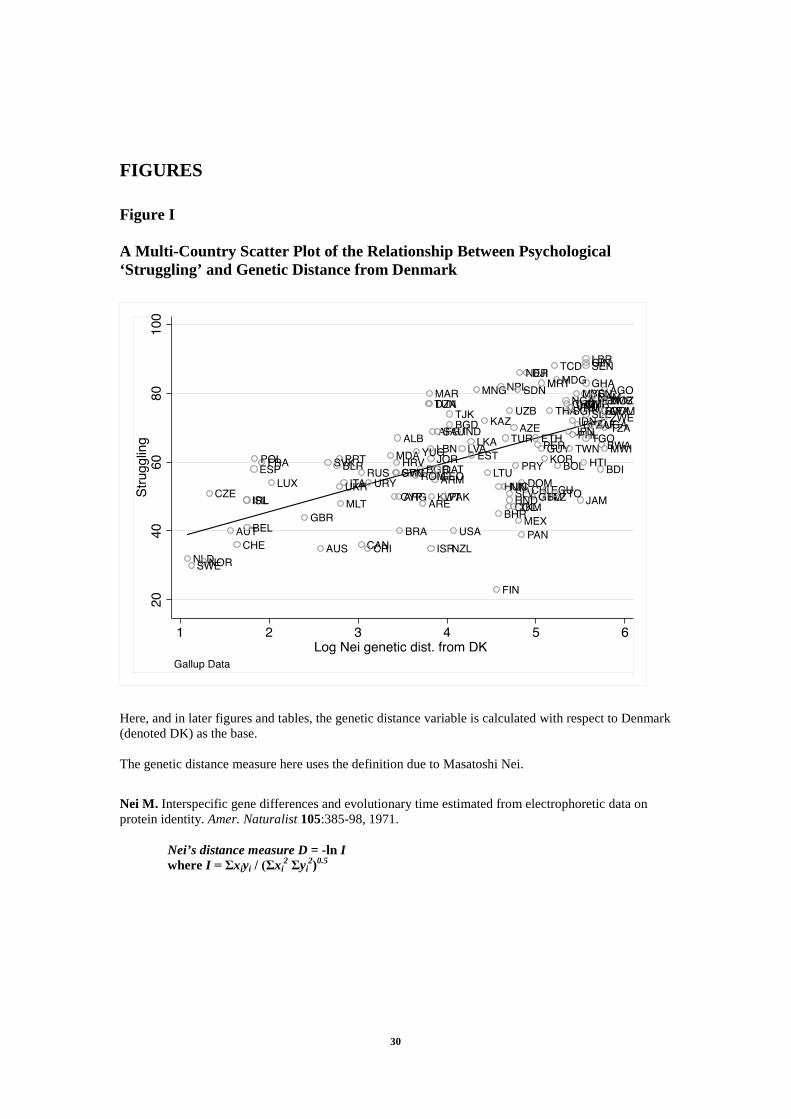
A flavour of our first evidence is conveyed by Figure I. Here we plot cross-
national data on genetic distance and well-being. The source is data from the Gallup
World Poll. On the y-axis of Figure I is a variable for (low) psychological well-being
in a country. It is ‘Struggling’, as defined by Gallup rather than by us, which is a
cross-national variable for the percentage of individuals in the country who report that
their present life situation is between 5 and 7 on a ten-point scale and who report the
perceived quality of their future life as between a 5 and an 8. On the x-axis, we plot
Nei’s genetic distance measure, which is defined here as distance from Denmark, DK.
There is a statistically significant positive correlation. In Figure I, the greater is a
nation’s genetic distance from Denmark, the lower is the reported well-being of that
nation (that is, the greater their population’s level of struggling).
Notable countries in the data set include the high well-being nations of
Netherlands and Sweden; they are depicted as dots in the south-west corner of the
graph. These nations, perhaps unsurprisingly given their geographical proximity,
have the closest genetic similarity to Denmark. Particularly unhappy countries in
Figure I include nations such as Ghana and Madagascar; these have the least genetic
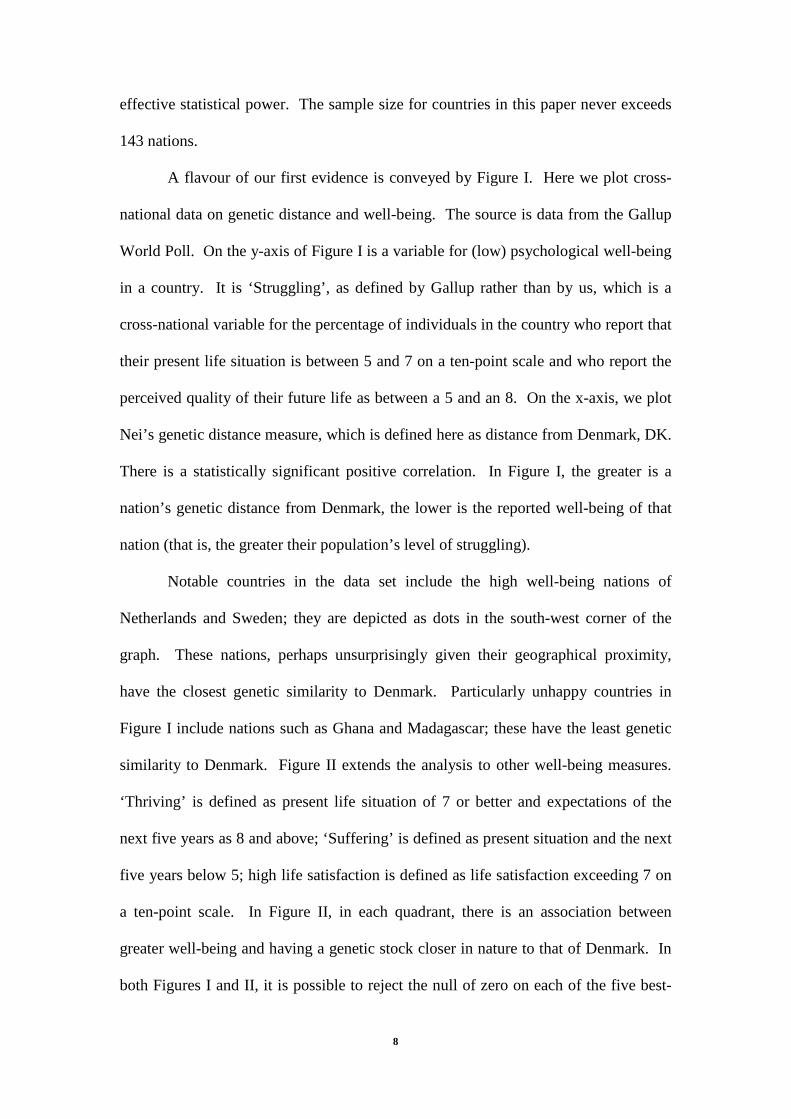
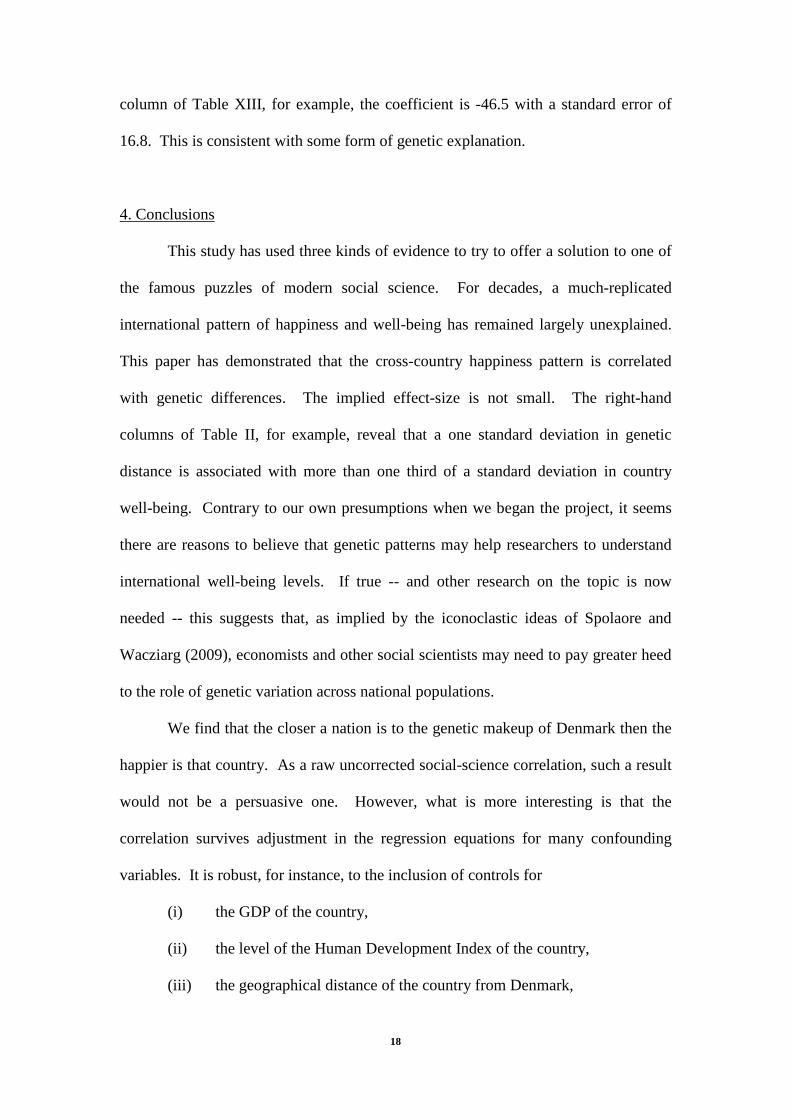
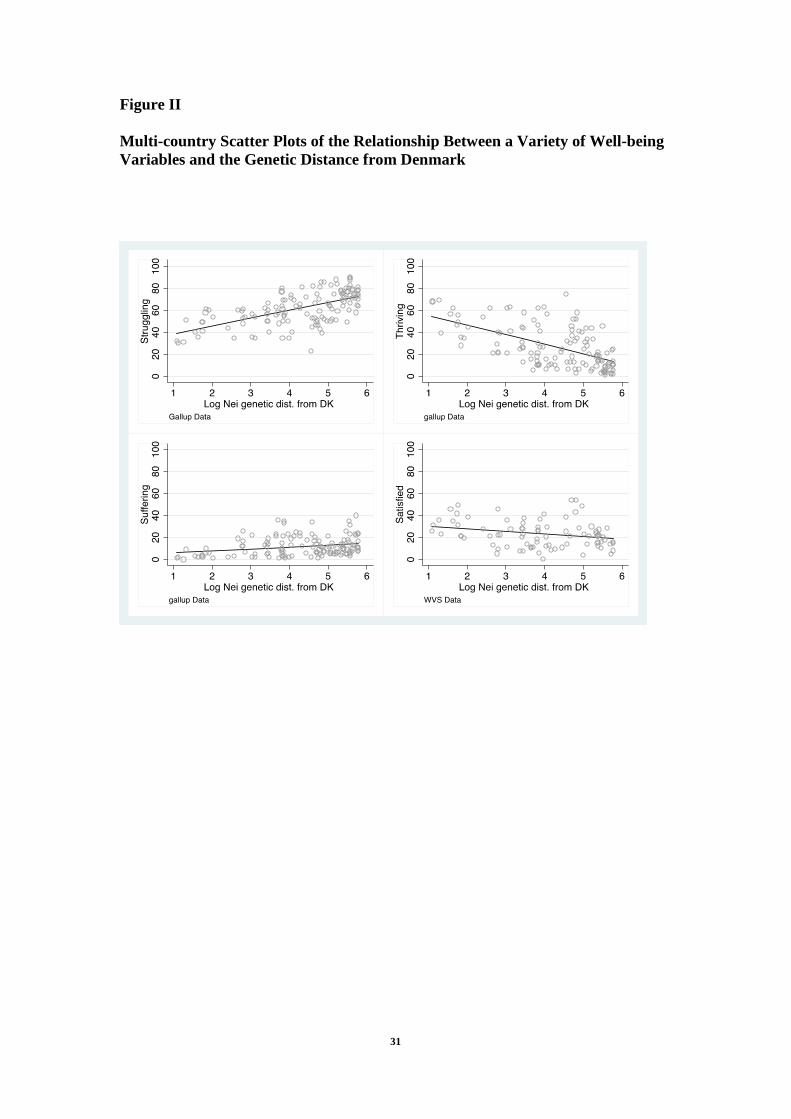
similarity to Denmark. Figure II extends the analysis to other well-being measures.
‘Thriving’ is defined as present life situation of 7 or better and expectations of the
next five years as 8 and above; ‘Suffering’ is defined as present situation and the next
five years below 5; high life satisfaction is defined as life satisfaction exceeding 7 on
a ten-point scale. In Figure II, in each quadrant, there is an association between
greater well-being and having a genetic stock closer in nature to that of Denmark. In
both Figures I and II, it is possible to reject the null of zero on each of the five best-
9
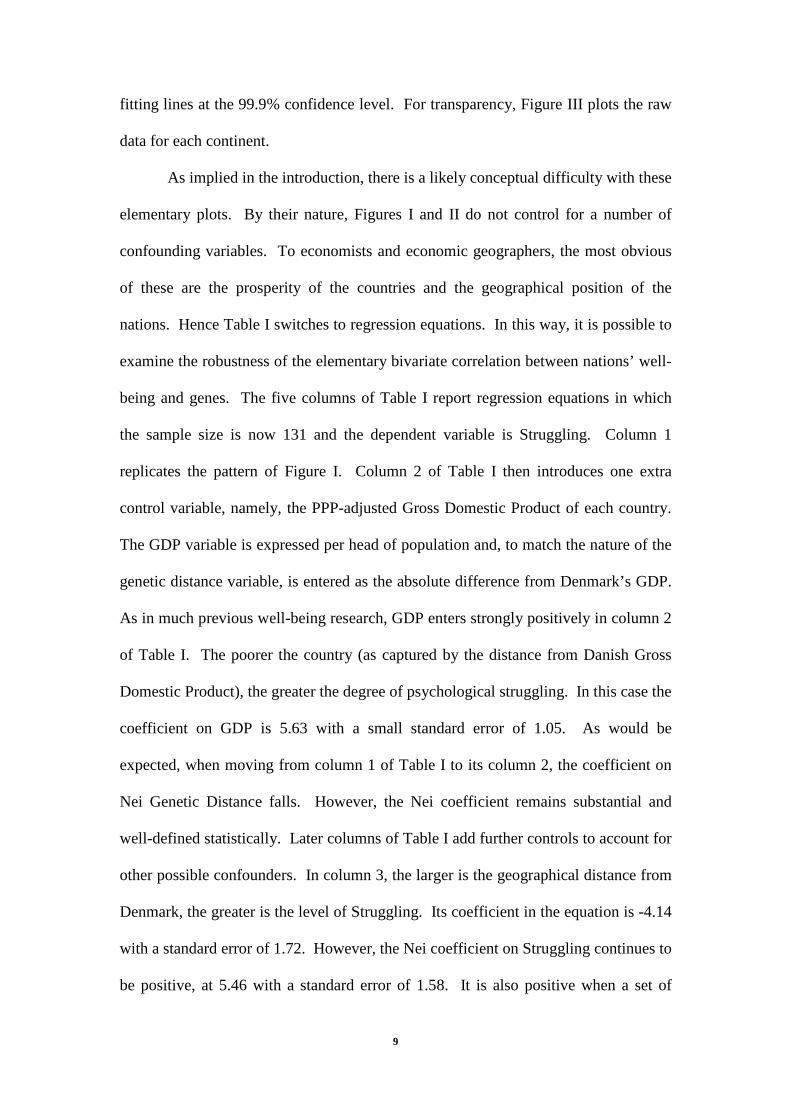
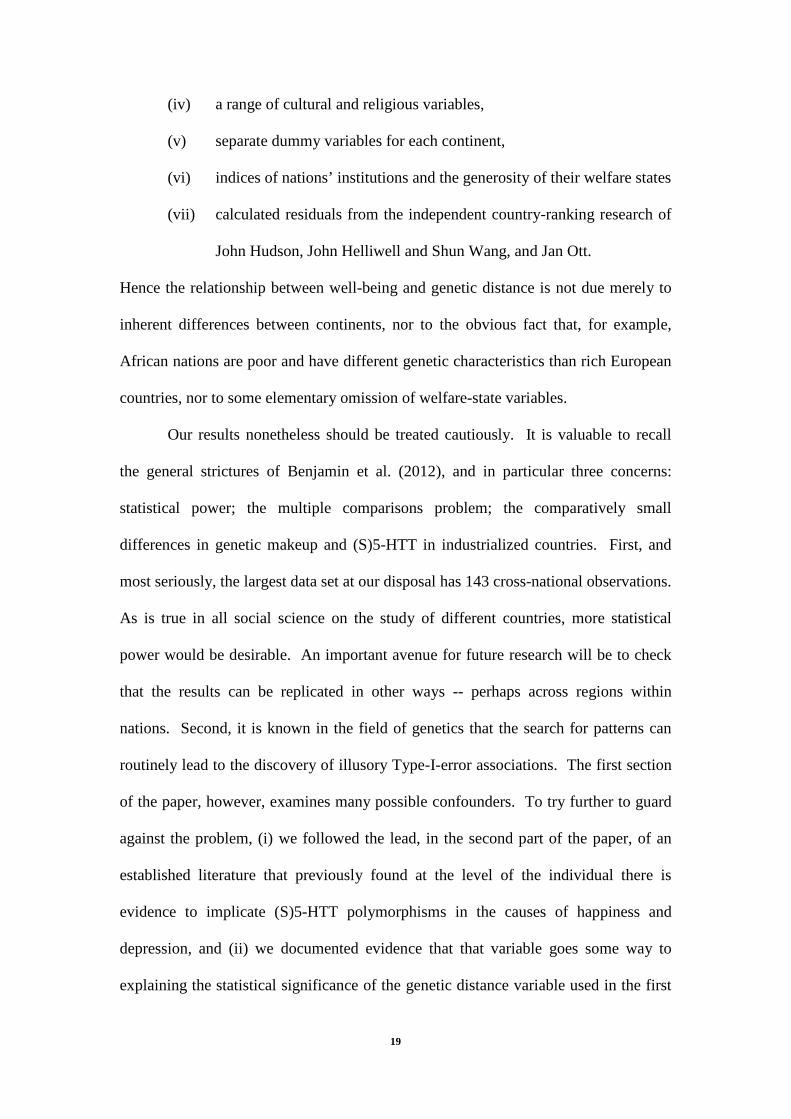
fitting lines at the 99.9% confidence level. For transparency, Figure III plots the raw
data for each continent.
As implied in the introduction, there is a likely conceptual difficulty with these
elementary plots. By their nature, Figures I and II do not control for a number of
confounding variables. To economists and economic geographers, the most obvious
of these are the prosperity of the countries and the geographical position of the
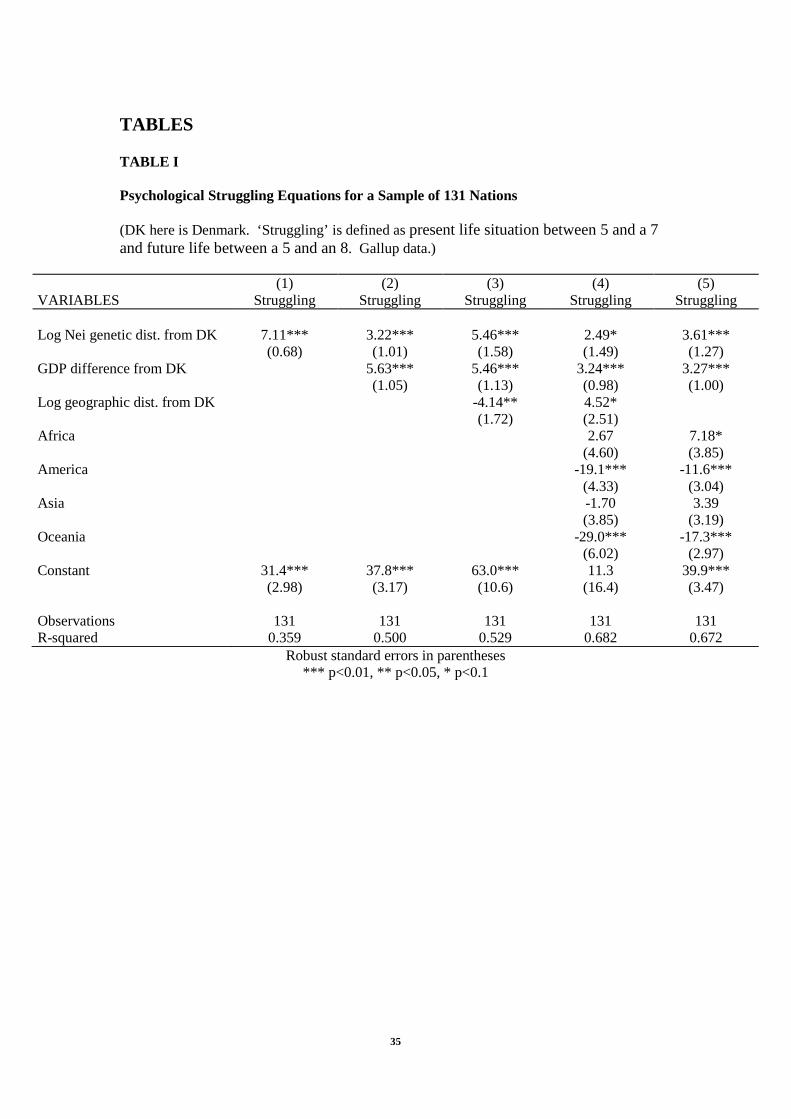
nations. Hence Table I switches to regression equations. In this way, it is possible to
examine the robustness of the elementary bivariate correlation between nations’ well-
being and genes. The five columns of Table I report regression equations in which
the sample size is now 131 and the dependent variable is Struggling. Column 1
replicates the pattern of Figure I. Column 2 of Table I then introduces one extra
control variable, namely, the PPP-adjusted Gross Domestic Product of each country.
The GDP variable is expressed per head of population and, to match the nature of the
genetic distance variable, is entered as the absolute difference from Denmark’s GDP.
As in much previous well-being research, GDP enters strongly positively in column 2
of Table I. The poorer the country (as captured by the distance from Danish Gross
Domestic Product), the greater the degree of psychological struggling. In this case the
coefficient on GDP is 5.63 with a small standard error of 1.05. As would be
expected, when moving from column 1 of Table I to its column 2, the coefficient on
Nei Genetic Distance falls. However, the Nei coefficient remains substantial and
well-defined statistically. Later columns of Table I add further controls to account for
other possible confounders. In column 3, the larger is the geographical distance from
Denmark, the greater is the level of Struggling. Its coefficient in the equation is -4.14
with a standard error of 1.72. However, the Nei coefficient on Struggling continues to
be positive, at 5.46 with a standard error of 1.58. It is also positive when a set of
10
further dummy variables are included for the different continents. However, the level
of statistical significance falls slightly below the 5% cut-off, in column 4 of Table I,
once the specification includes all of Nei distance, GDP, geographical distance, and
continent dummies. In column 5 of Table I, the Nei genetic distance measure returns
to statistical significance, and has a coefficient of 3.61 and a standard error of 1.27.
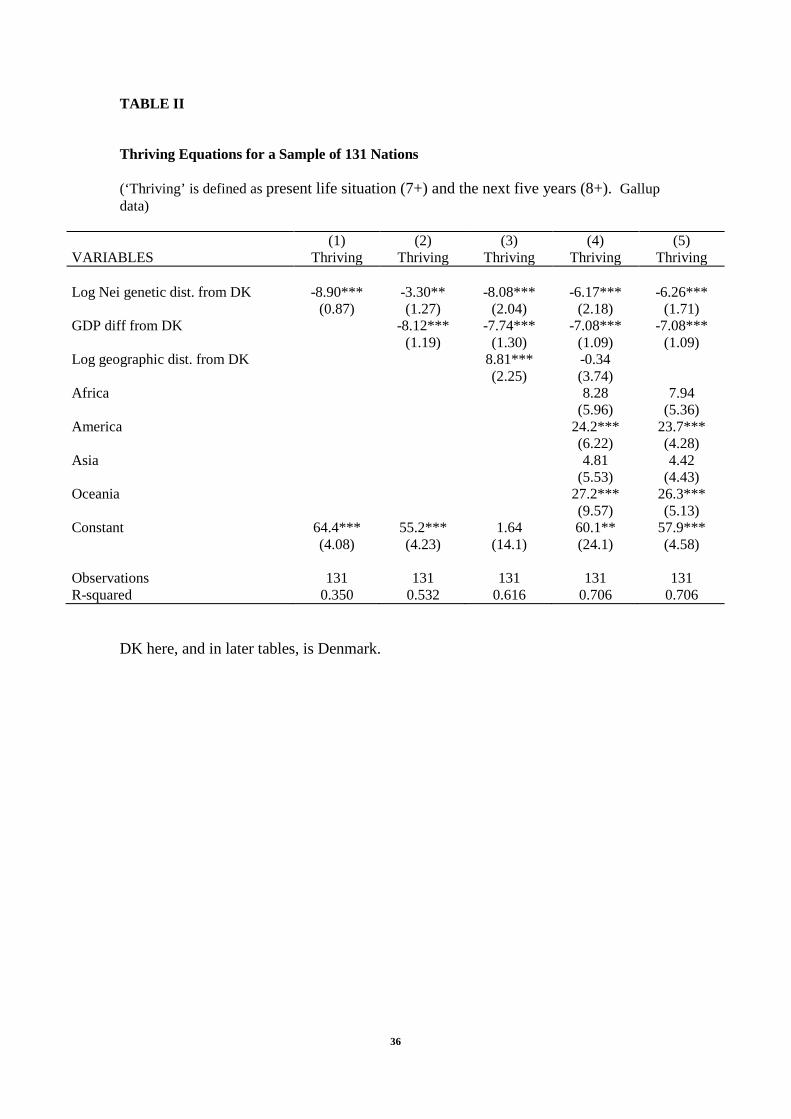
Table II switches to a different well-being variable, namely, that of Thriving.
Consistent with the prior patterns, the correlation between Thriving and genetic
distance is negative. It is possible to reject the null of zero at the 99% confidence
level for each of the five specifications, including the most demanding (arguably too
demanding given the number of data points) one in column 4, within Table II.
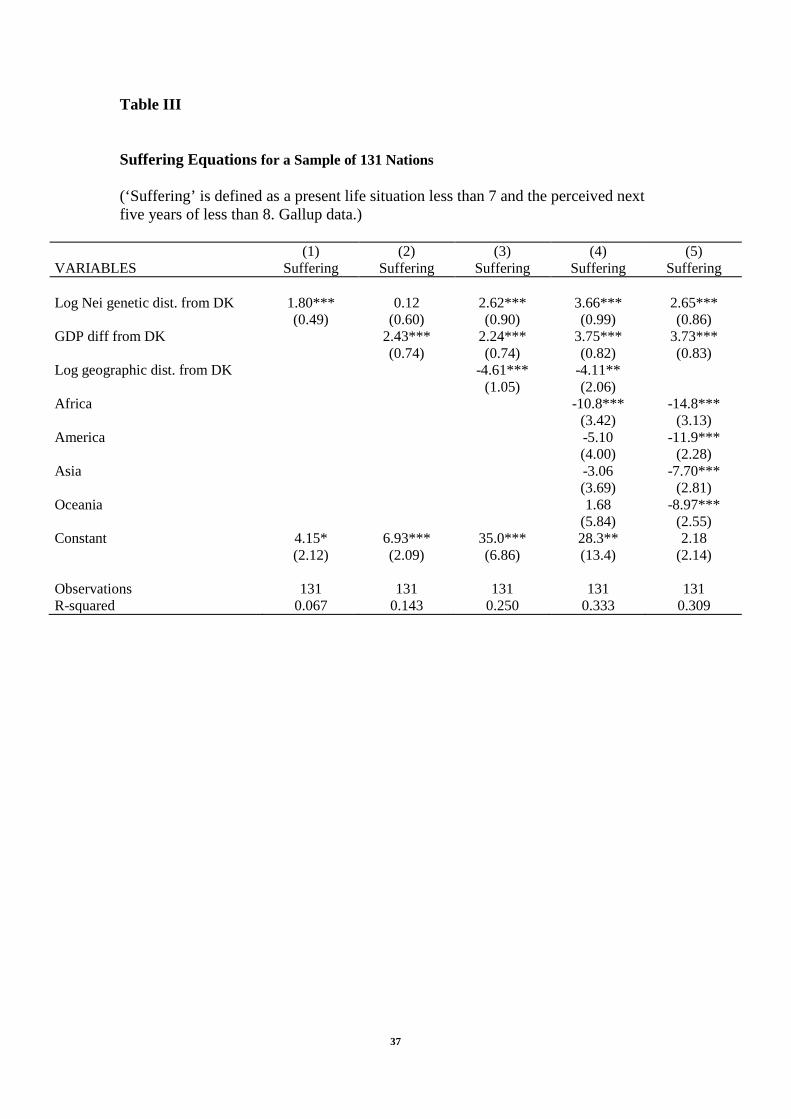
Furthermore, Table III, for the same group of 131 countries, replicates the equivalent
finding when using a Suffering dependent variable. Tables I, II and III thus suggest
the same conclusion as the early elementary bivariate graphs.
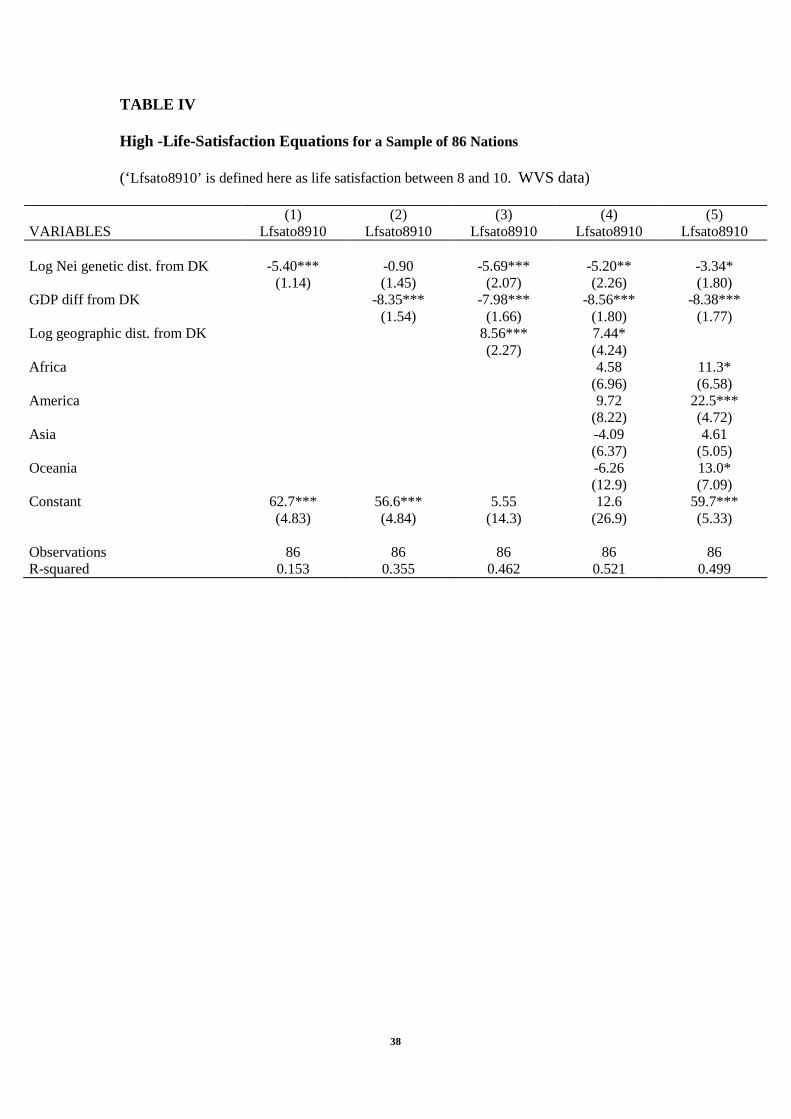
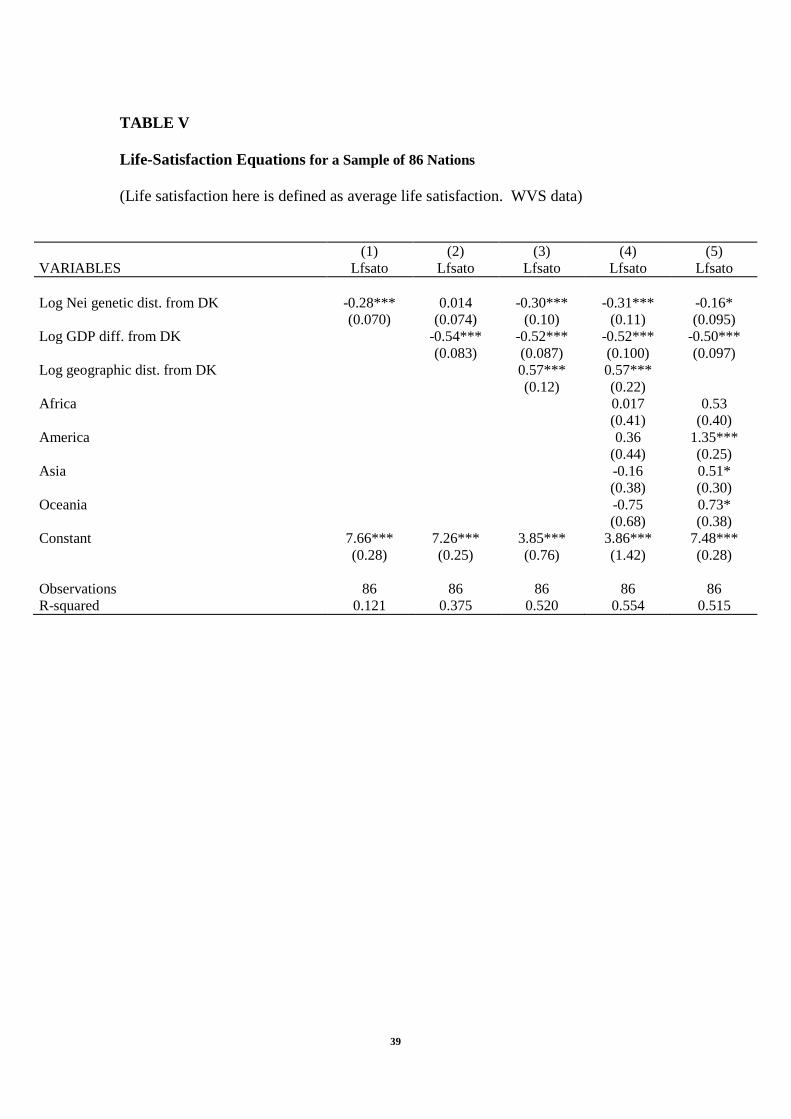
Tables IV and V switch to traditional life-satisfaction variables. These
necessarily have smaller samples. Here the source is not Gallup but instead is
information from the World Values Surveys. In the fullest specification, that of
column 4 in each table, the same result on countries is found again. Table IV takes as
its dependent variable a high level of life satisfaction (numbers over 7 out of 10)
whereas Table V’s dependent variable is mean life satisfaction. For both tables, the
larger the divergence of the genetic stock from that of Denmark, the lower is the
country’s life satisfaction. Column 5 in each of Tables IV and V sees a drop in the
significance of the Nei Genetic Distance coefficient. That might at a glance be
thought a weakness in the argument. However, the data favour the column 4
specifications, which have greater explanatory power. In the fullest specification of
11
Table IV, for instance, the coefficient on Nei distance is -5.20 with a standard error of
2.26.
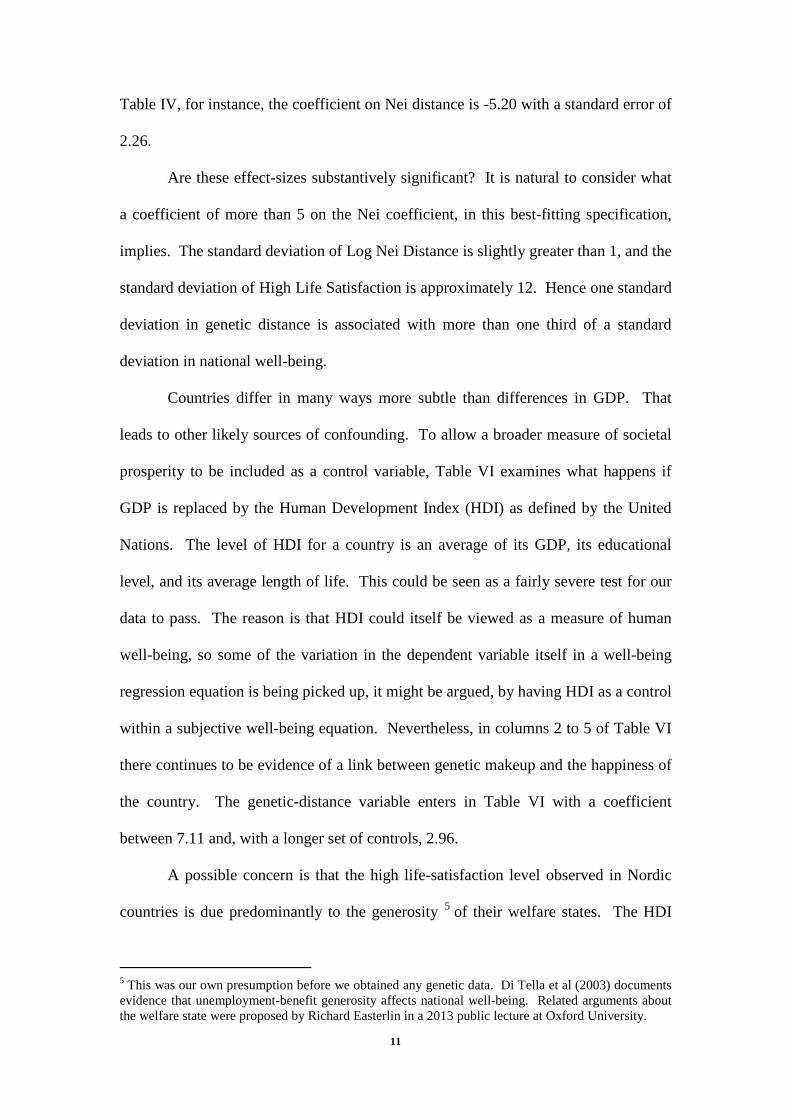
Are these effect-sizes substantively significant? It is natural to consider what
a coefficient of more than 5 on the Nei coefficient, in this best-fitting specification,
implies. The standard deviation of Log Nei Distance is slightly greater than 1, and the
standard deviation of High Life Satisfaction is approximately 12. Hence one standard
deviation in genetic distance is associated with more than one third of a standard
deviation in national well-being.
Countries differ in many ways more subtle than differences in GDP. That
leads to other likely sources of confounding. To allow a broader measure of societal
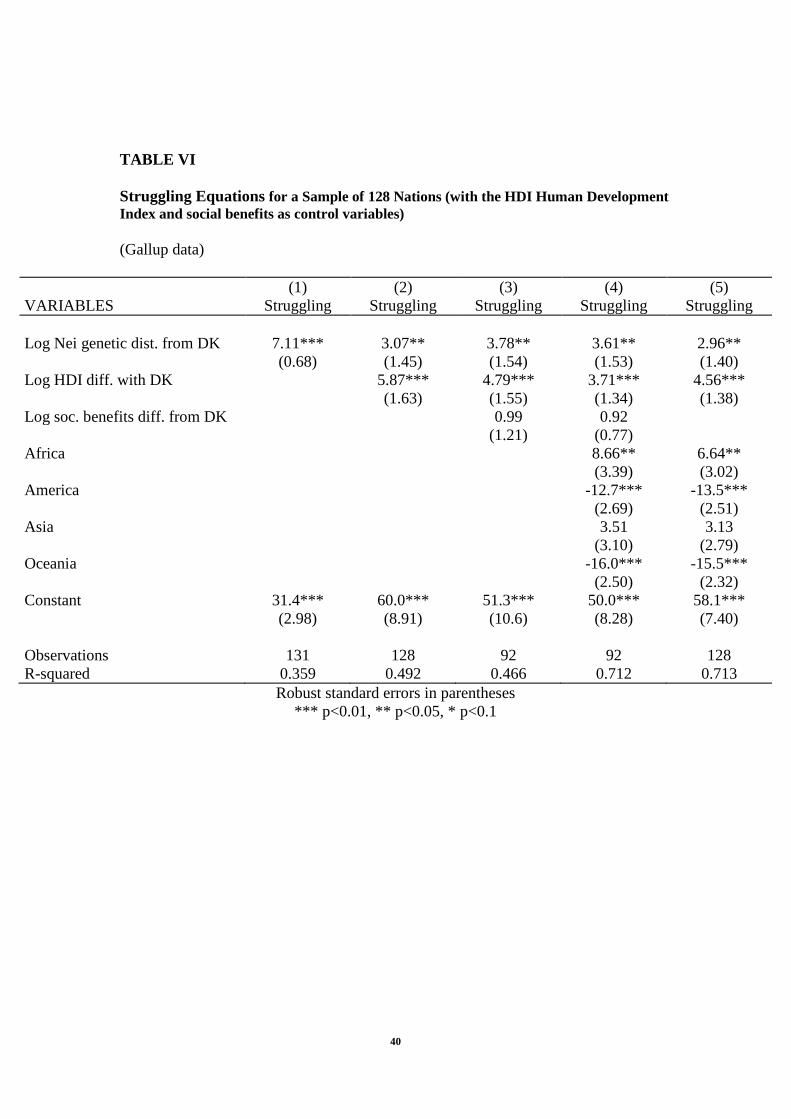
prosperity to be included as a control variable, Table VI examines what happens if
GDP is replaced by the Human Development Index (HDI) as defined by the United
Nations. The level of HDI for a country is an average of its GDP, its educational
level, and its average length of life. This could be seen as a fairly severe test for our
data to pass. The reason is that HDI could itself be viewed as a measure of human
well-being, so some of the variation in the dependent variable itself in a well-being
regression equation is being picked up, it might be argued, by having HDI as a control
within a subjective well-being equation. Nevertheless, in columns 2 to 5 of Table VI
there continues to be evidence of a link between genetic makeup and the happiness of
the country. The genetic-distance variable enters in Table VI with a coefficient
between 7.11 and, with a longer set of controls, 2.96.
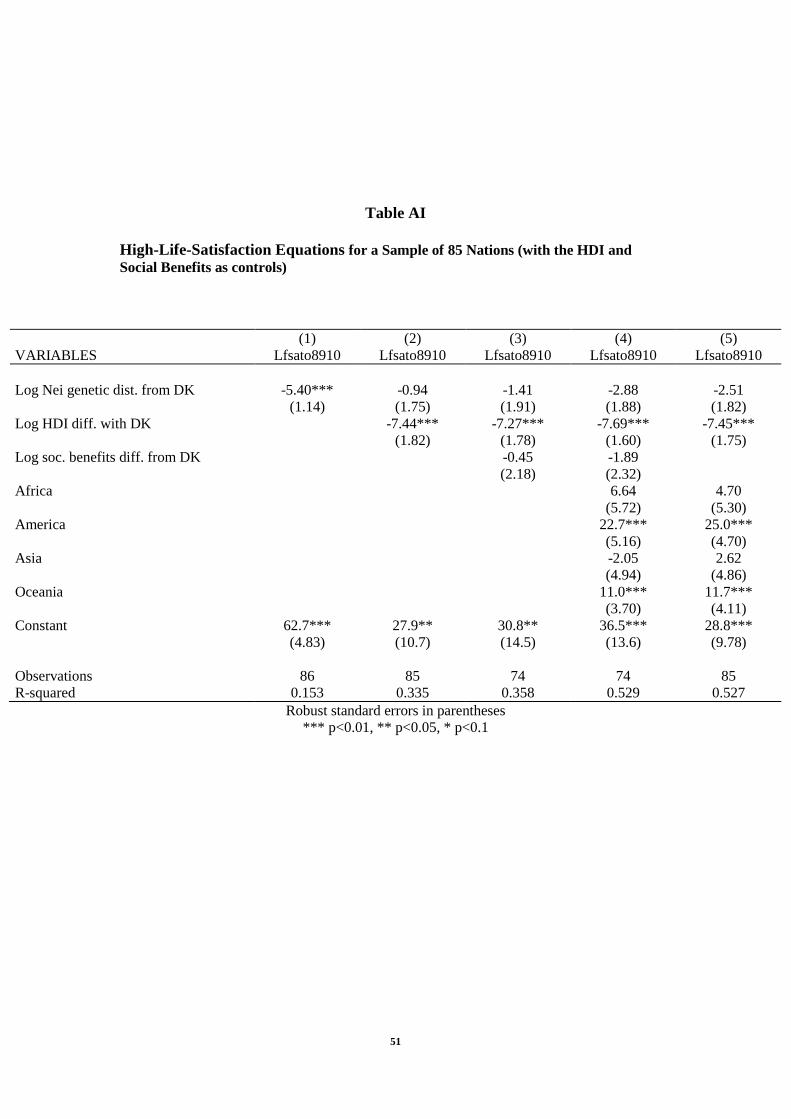
A possible concern is that the high life-satisfaction level observed in Nordic
countries is due predominantly to the generosity 5 of their welfare states. The HDI
5 This was our own presumption before we obtained any genetic data. Di Tella et al (2003) documents evidence that unemployment-benefit generosity affects national well-being. Related arguments about the welfare state were proposed by Richard Easterlin in a 2013 public lecture at Oxford University.
12
variable implicitly includes education and health levels, so in part provide a control
for this as well. Nevertheless, in column 3 of Table VI we do an explicit check. We
introduce transfers in terms of social benefits (always in logarithmic distance from
Denmark) in order to provide a fuller control for the effects of the welfare state. The
social-benefits variable is derived from World Bank data. The correlation with the
Nei variable, however, is unaffected by the inclusion of the social-benefits variable.
In columns 4 and 5 of Table VI, continent dummies are introduced; the well-being
link with the Nei variable again remains. An appendix presents similar tables for
other measures.
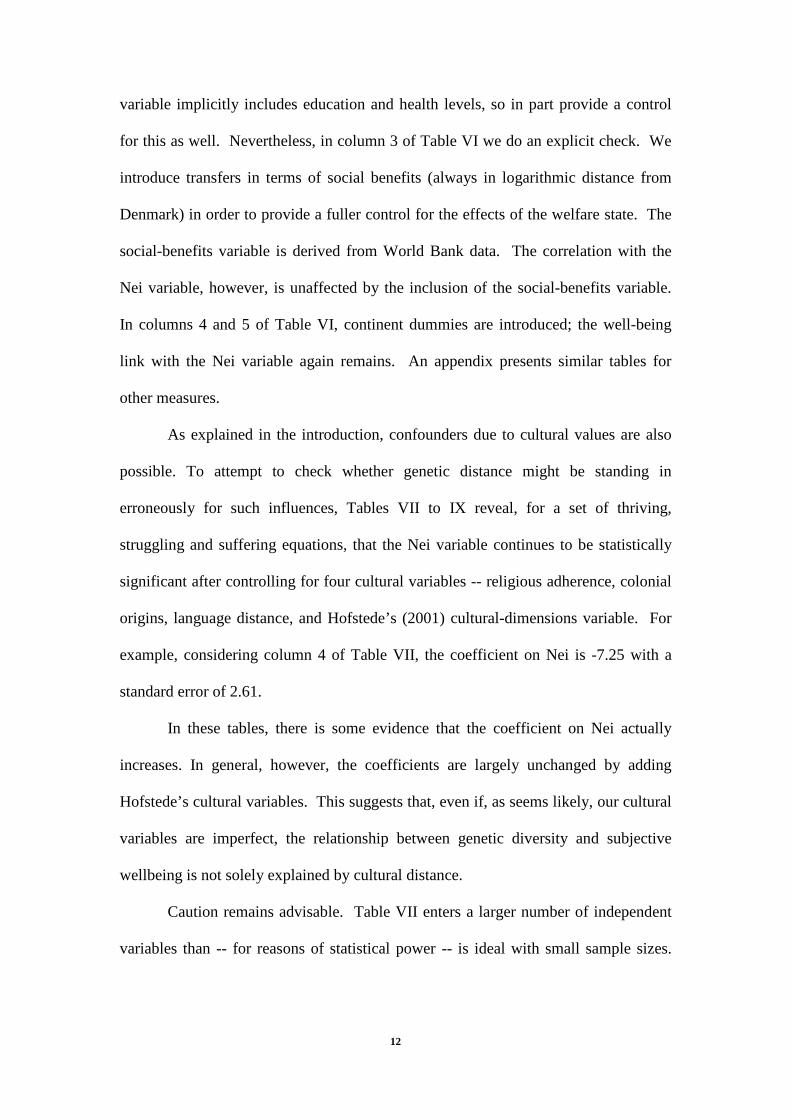
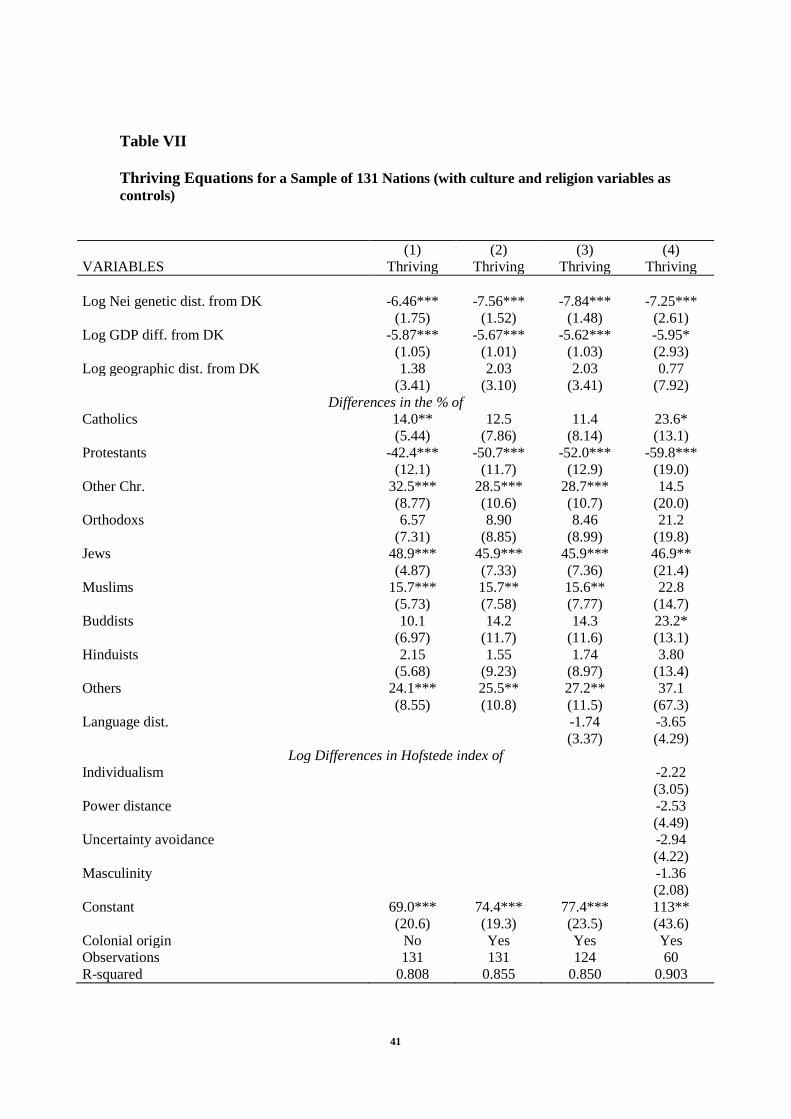
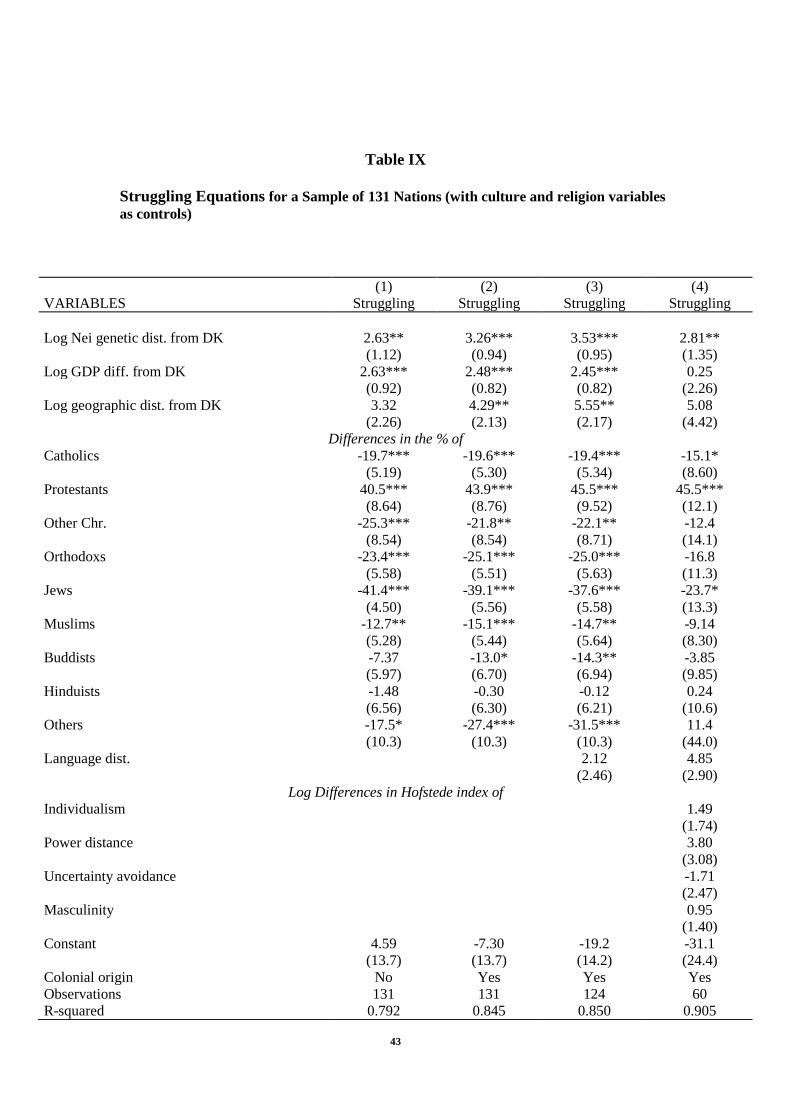
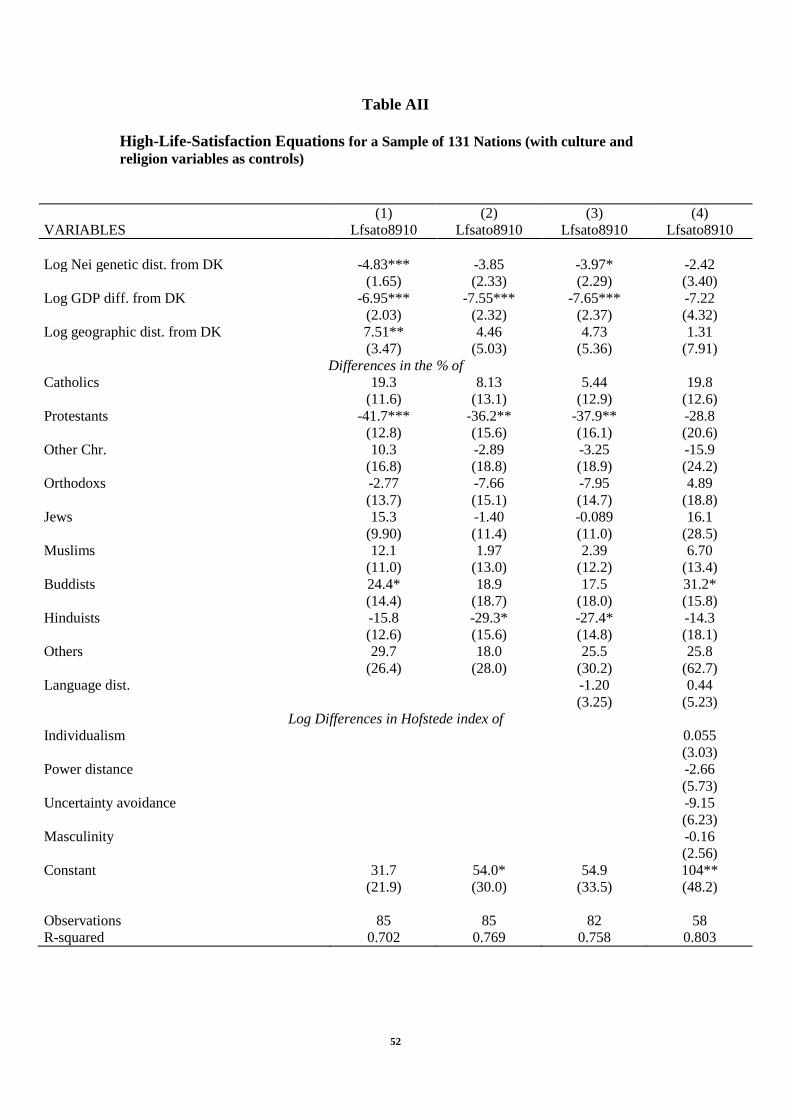
As explained in the introduction, confounders due to cultural values are also
possible. To attempt to check whether genetic distance might be standing in
erroneously for such influences, Tables VII to IX reveal, for a set of thriving,
struggling and suffering equations, that the Nei variable continues to be statistically
significant after controlling for four cultural variables -- religious adherence, colonial
origins, language distance, and Hofstede’s (2001) cultural-dimensions variable. For
example, considering column 4 of Table VII, the coefficient on Nei is -7.25 with a
standard error of 2.61.
In these tables, there is some evidence that the coefficient on Nei actually
increases. In general, however, the coefficients are largely unchanged by adding
Hofstede’s cultural variables. This suggests that, even if, as seems likely, our cultural
variables are imperfect, the relationship between genetic diversity and subjective
wellbeing is not solely explained by cultural distance.
Caution remains advisable. Table VII enters a larger number of independent
variables than -- for reasons of statistical power -- is ideal with small sample sizes.

13
Such difficulties are inherent in cross-country research, of course, but they are real
ones.
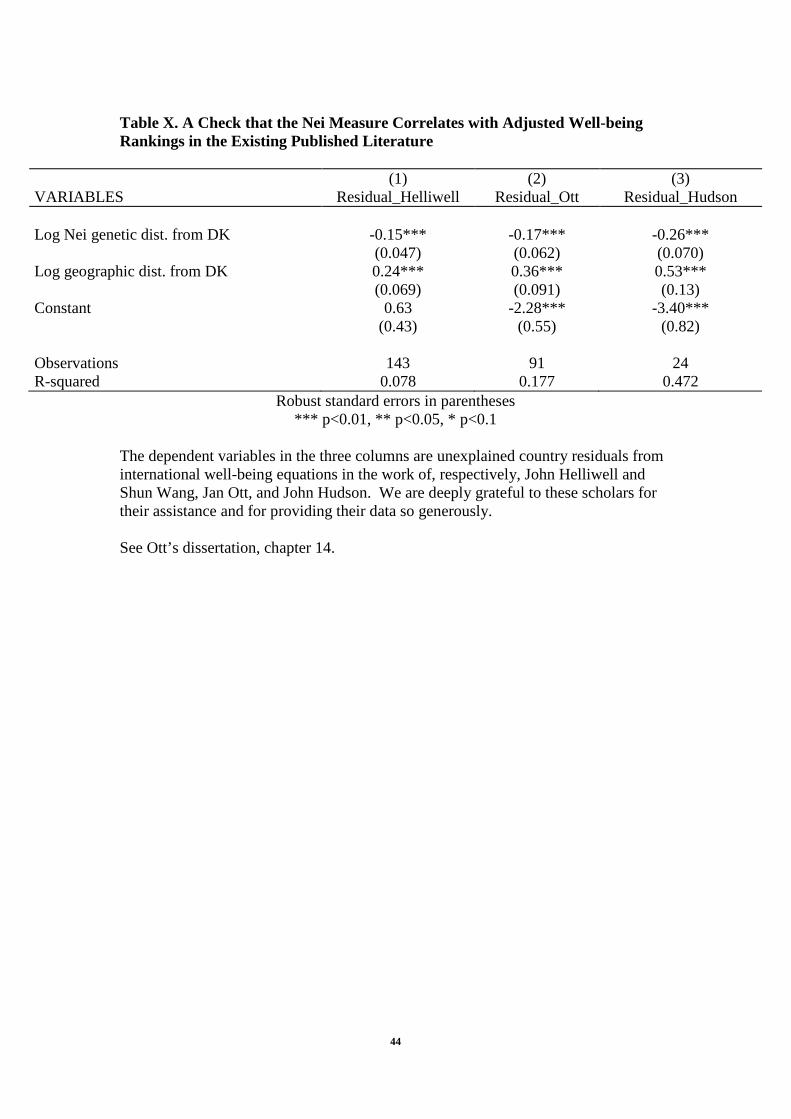
A final possibility is that Nordic countries have ‘better institutions’ in some
truly wide-ranging sense. We probe that possibility. Recently, Helliwell and Wang
(2013) calculated the residual life satisfaction (measured with the Gallup Cantrill
Ladder) after controlling for the quality of countries’ institutions and culture, with
variables measuring: perception of corruption, healthy life expectancy, GDP per
capita, freedom to make a choice, social support and generosity (in terms of culture
for charitable donations). In Table X, therefore, we use this unexplained satisfaction
as a dependent variable and show that this well-being residual correlates with our
index of genetic distance from Denmark, after controlling for geographic variables.
Table X then does similar exercises, in columns 2 and 3, for unexplained cross-
country variation in well-being using also data from Jan Ott and John Hudson. Here
the original papers are Hudson (2006) and Ott (2011).
In principle, such checks are taxing ones for our hypothesis. Nevertheless, in
each of the three columns of Table X, evidence for a correlation with Nei-distance
remains visible.
3. A Second Test: Well-being and the 5-HTT Polymorphism
Because they leave the detailed type of any genetic effect unexplained, the
previous results suffer from a potential weakness. They are in the nature of black-box
findings.
In this second section of the paper, to try to guard against such a criticism, we
build on another literature that has already identified evidence of a specific genetic
influence on mental well-being. A large literature, triggered in part by the hugely
14
cited paper of Caspi et al. (2003), has studied a particular polymorphism, 5-HTTLPR,
at the individual rather than national level. This prior research, by Caspi et al (2003)
and many others, suggests that the short and long variants of 5-HTTLPR are
correlated with different probabilities of clinical depression. In particular, the short
allele has been associated with higher scores on neuroticism and harm avoidance,
stronger attentional bias towards negative stimuli, and lower life satisfaction.
Consistent with that, our evidence in this section suggests there is a statistical
association between lower happiness of nations and the proportion of their population
who have the short allele version of the 5-HTTLPR polymorphism, which we will
refer to for brevity as (S)5-HTT. Intriguingly, among the developed nations in our
data, it is Denmark and the Netherlands that appear to have the lowest percentage of
people with (S)5-HTT. Our results should be treated as exploratory, because when
dealing with the countries for which we have 5-HTT data there is a shortage of
statistical power.
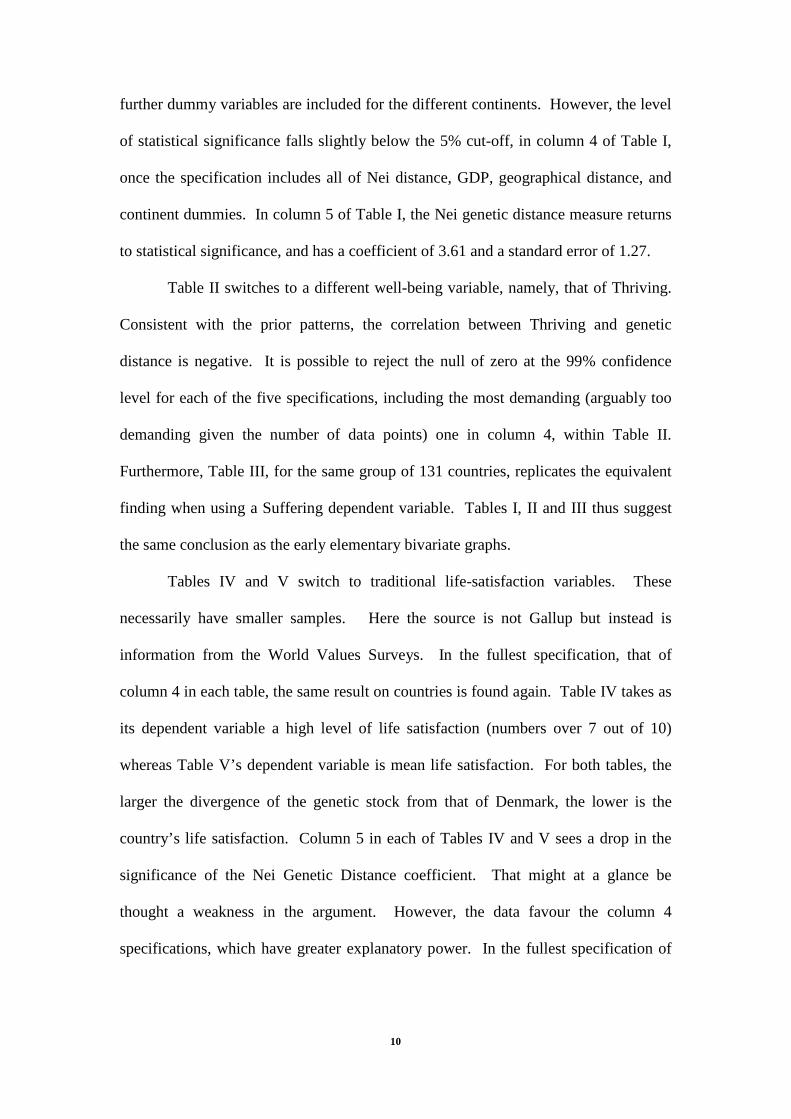
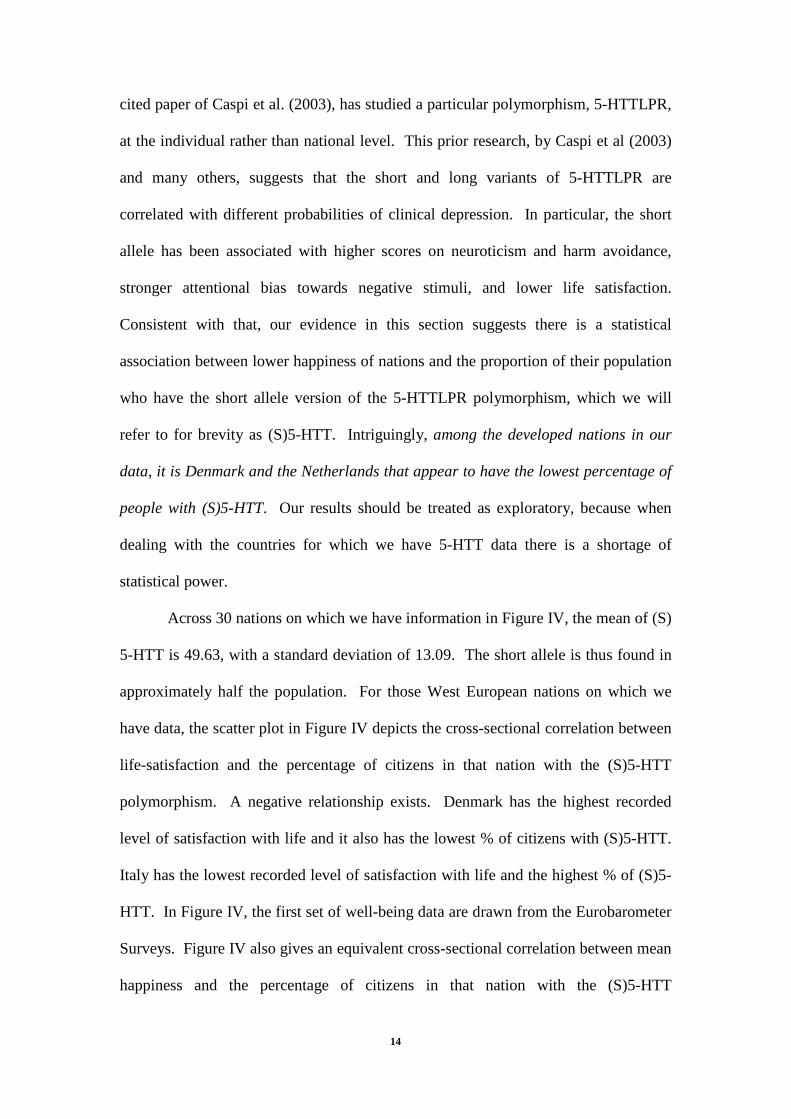
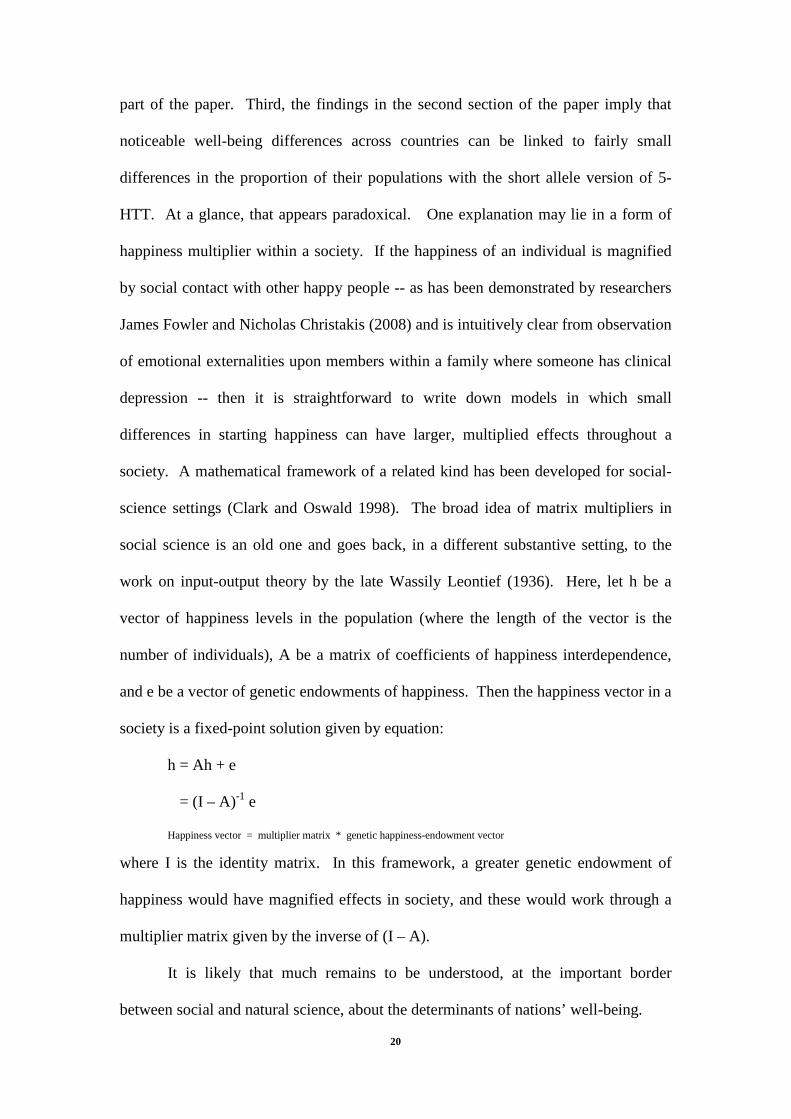
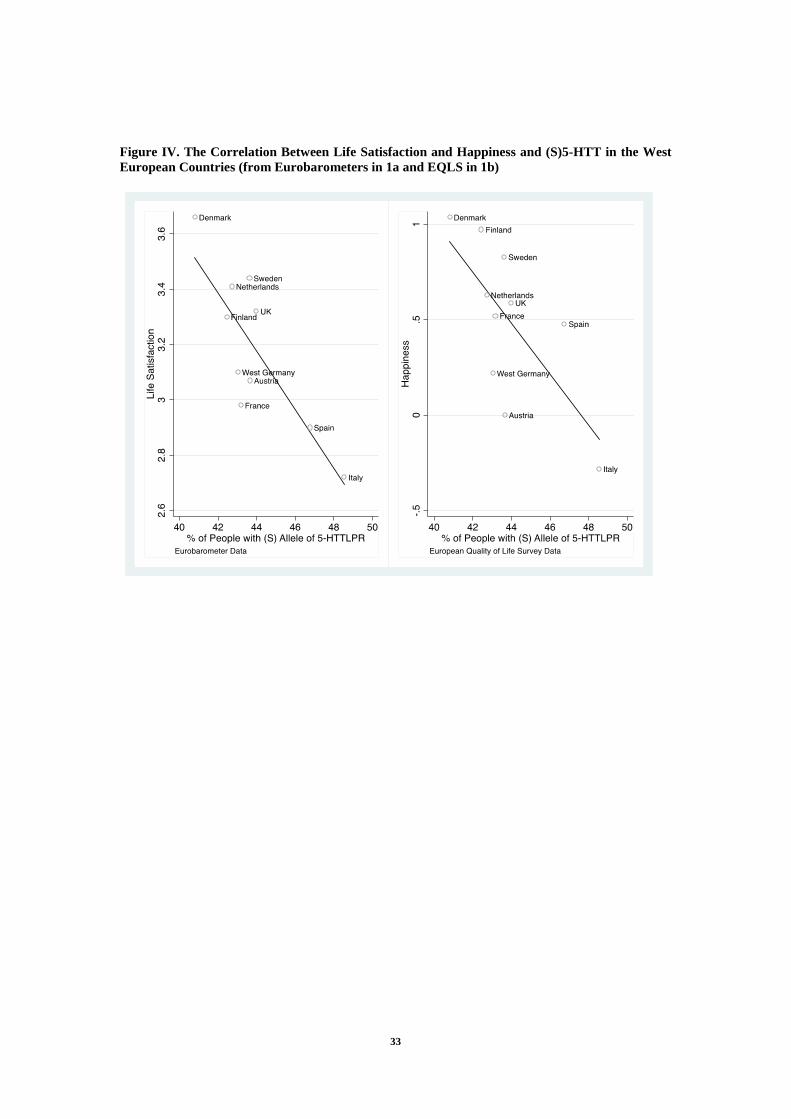
Across 30 nations on which we have information in Figure IV, the mean of (S)
5-HTT is 49.63, with a standard deviation of 13.09. The short allele is thus found in
approximately half the population. For those West European nations on which we
have data, the scatter plot in Figure IV depicts the cross-sectional correlation between
life-satisfaction and the percentage of citizens in that nation with the (S)5-HTT
polymorphism. A negative relationship exists. Denmark has the highest recorded
level of satisfaction with life and it also has the lowest % of citizens with (S)5-HTT.
Italy has the lowest recorded level of satisfaction with life and the highest % of (S)5-
HTT. In Figure IV, the first set of well-being data are drawn from the Eurobarometer
Surveys. Figure IV also gives an equivalent cross-sectional correlation between mean
happiness and the percentage of citizens in that nation with the (S)5-HTT

15
polymorphism. Here the data are drawn from the European Quality of Life Surveys.
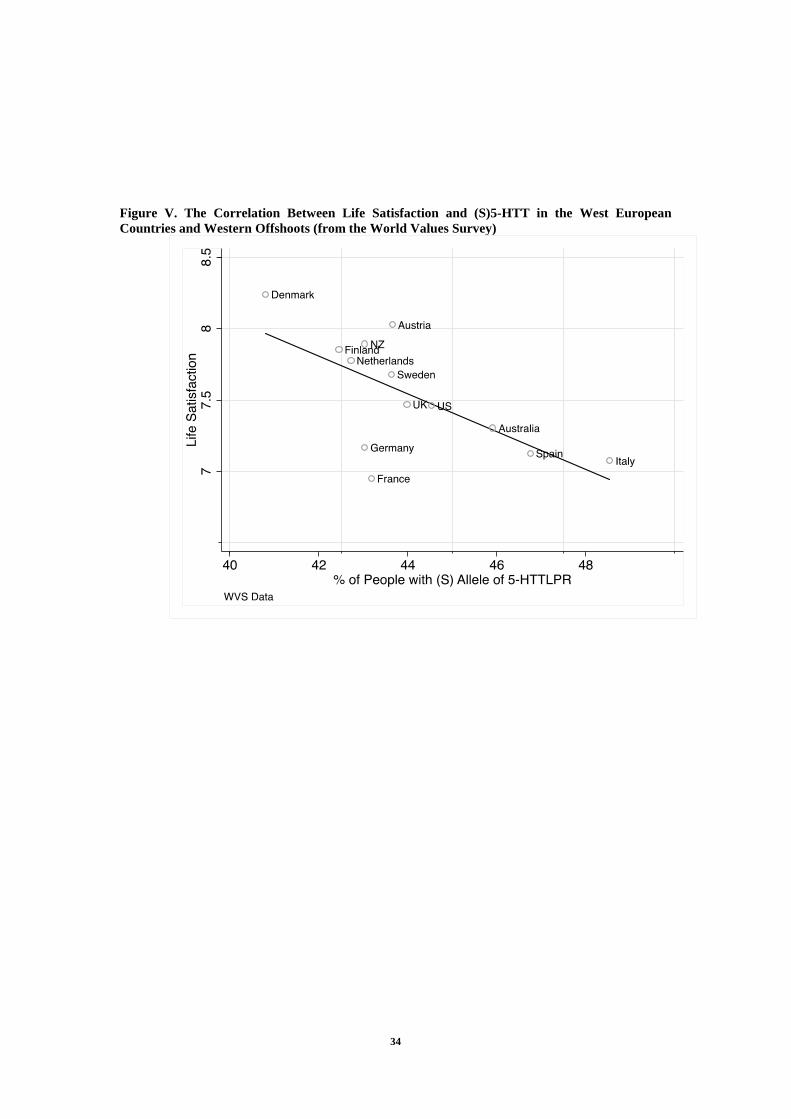
Figure V uses data on life satisfaction taken from the World Values Survey. This plot
expands the previous list of countries to the so-called Western Offshoots and includes
New Zealand, the USA, and Australia; for historical reasons these nations are
genetically, economically, and politically similar to the Western European countries.
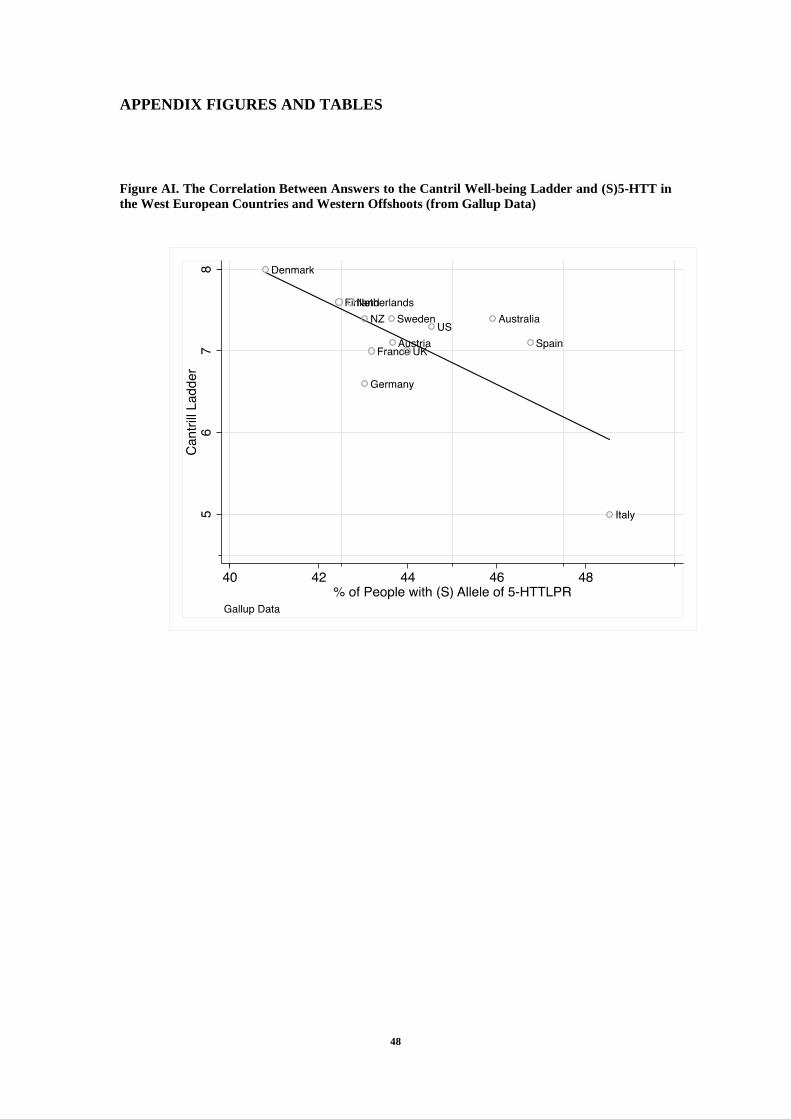
The correlation remains negative and significant. Figure AI in the appendix switches
to an alternative well-being measure on the y-axis. It uses a ‘ladder of life’ well-
being question due to Cantril (1965); the exact wording is explained below. Here the
statistical result is the same as in the earlier figures. A similar graph can be produced
using a so-called Daily Experience index developed by Gallup.
Because our variable (S)5-HTT measures the proportion of individuals with
the S allele of 5-HTT, it is perhaps natural to correlate this with a measure of well-
being that relates to proportions of individuals rather than to averages (like the mean
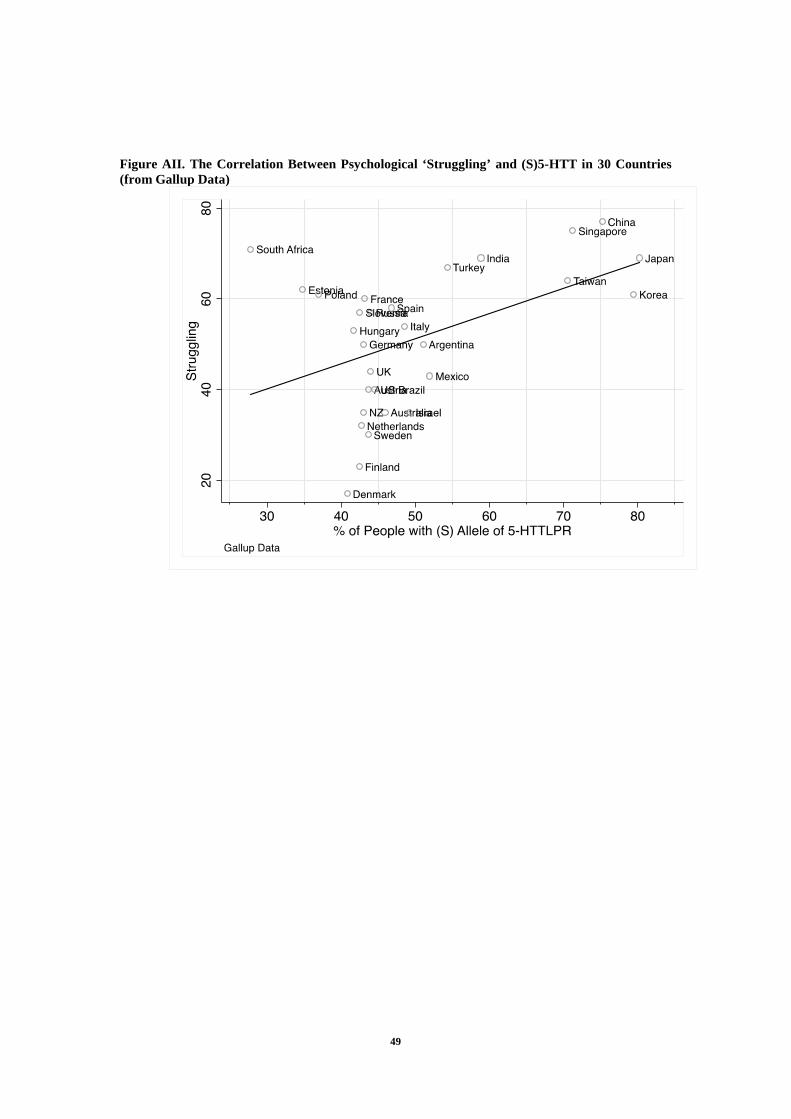
of life satisfaction, happiness or the Cantril ladder-based index). Figure AII in the
Appendix thus refines the Cantril measure to the struggling variable used earlier.
This is the proportion of people who are classified by Gallup as having low well-
being scores, as assessed by the ladder, both currently and prospectively (for more
details see the appendix), in this figure we include all countries a measure of the (S)5-
HTT share is available. Consistent with the earlier figures, there is a strong
correlation between the percentage of people struggling psychologically in a nation
and the percentage of the nation’s population who have the short allele of 5-HTT. An
equivalent figure can be produced if we consider as an alternative a thriving variable
based on the same principles as struggling.
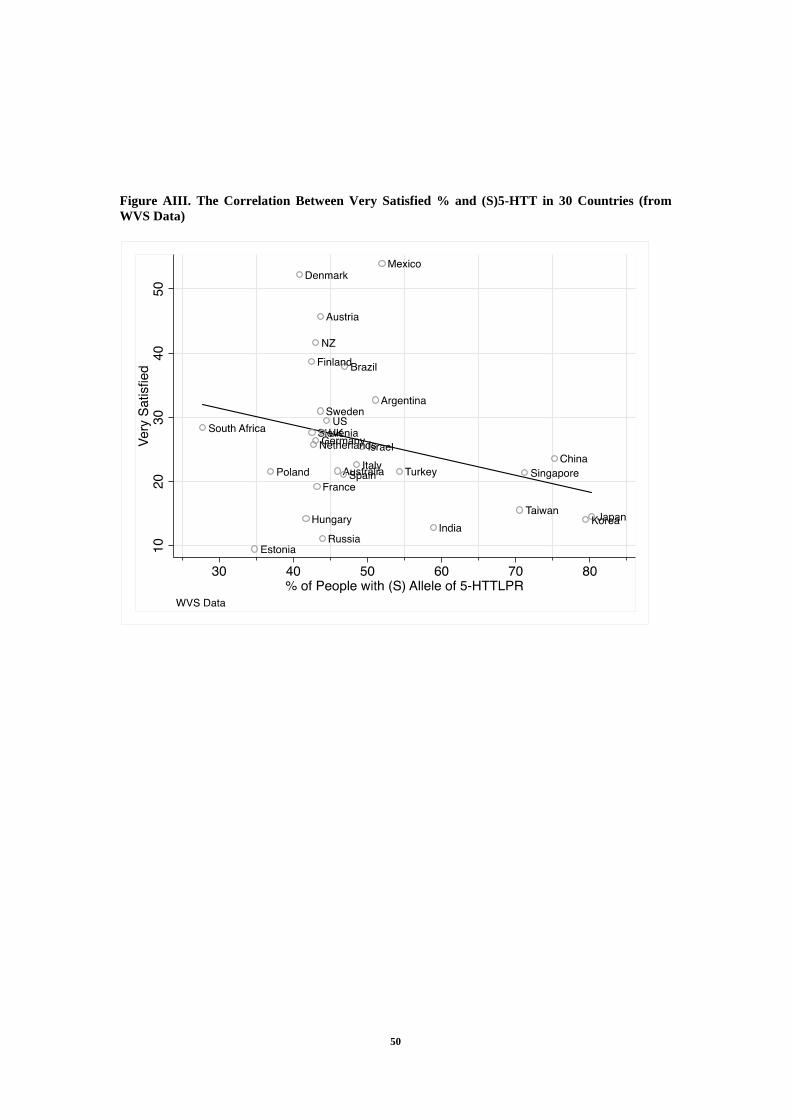
In order to check the consistency of these data with those from the World
Values Survey, Figure AIII of the Appendix shows the relationship between (S)5-
16
HTT and an index ‘Very Satisfied’ which is a measure of the proportion of
individuals reporting life satisfaction larger than 8. A similar pattern emerges if we
take instead the proportion of individuals reporting life satisfaction larger than 7
(although the p-value on the gradient is then right at the border of the 0.05 cut-off).
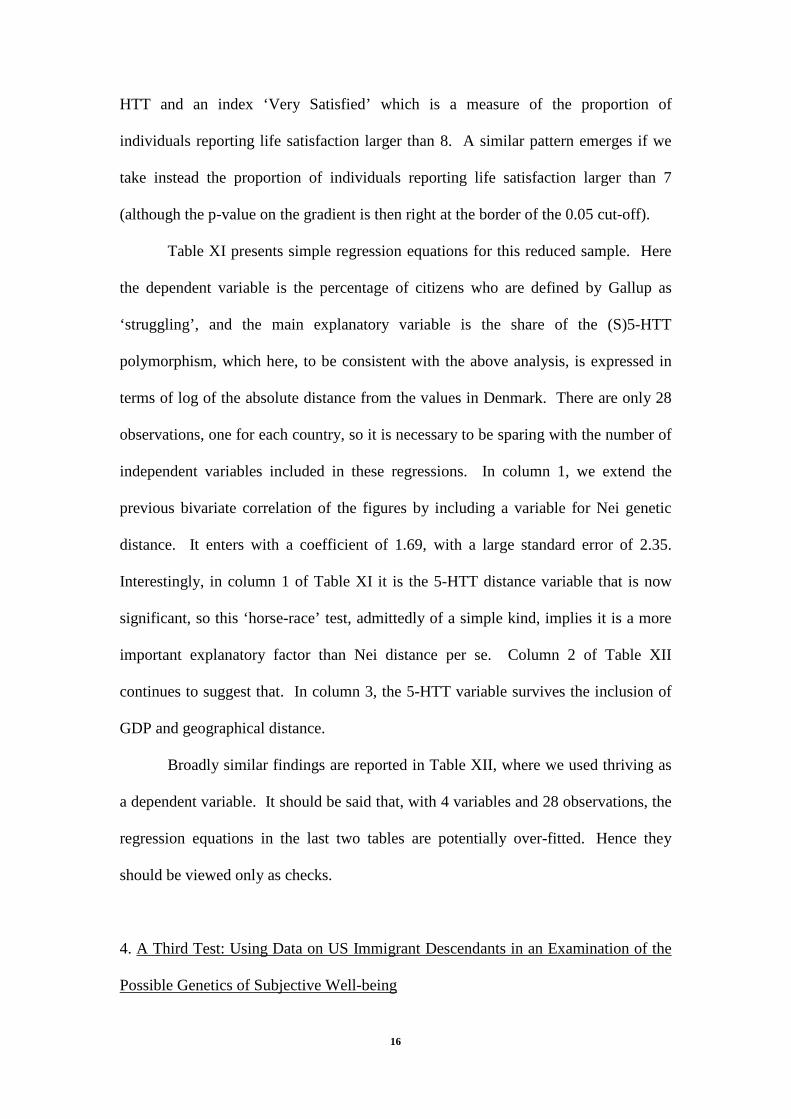
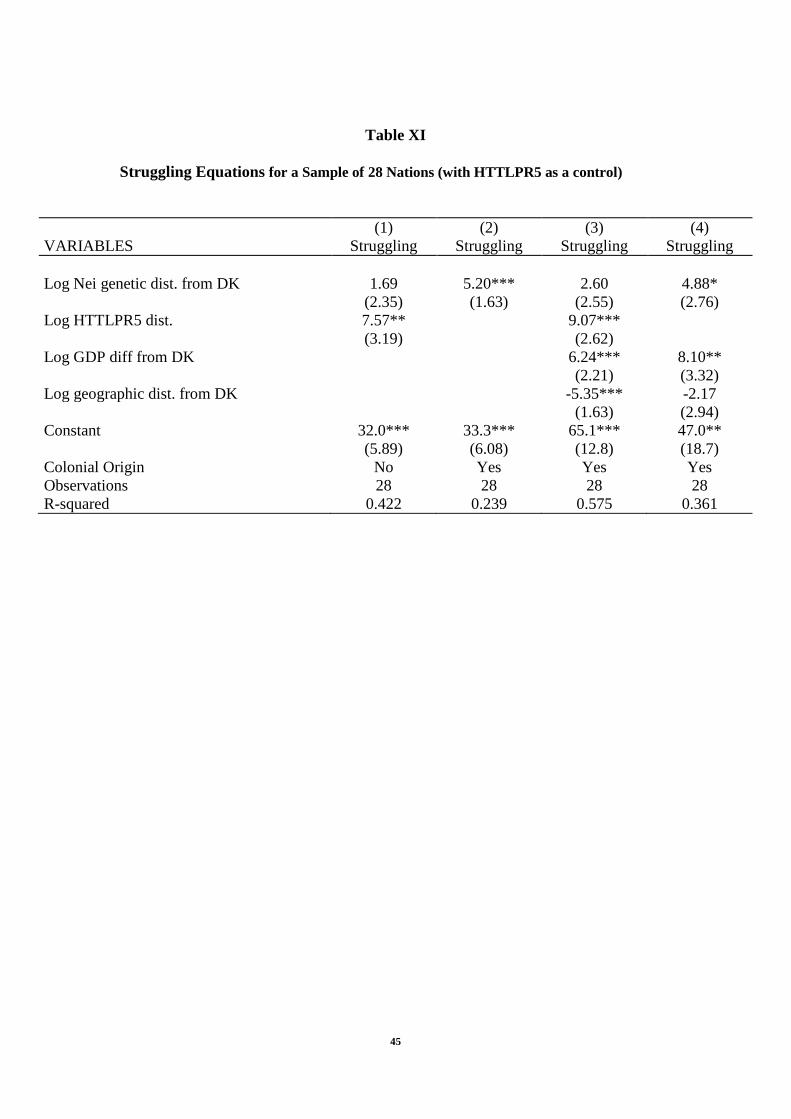
Table XI presents simple regression equations for this reduced sample. Here
the dependent variable is the percentage of citizens who are defined by Gallup as
‘struggling’, and the main explanatory variable is the share of the (S)5-HTT
polymorphism, which here, to be consistent with the above analysis, is expressed in
terms of log of the absolute distance from the values in Denmark. There are only 28
observations, one for each country, so it is necessary to be sparing with the number of
independent variables included in these regressions. In column 1, we extend the
previous bivariate correlation of the figures by including a variable for Nei genetic
distance. It enters with a coefficient of 1.69, with a large standard error of 2.35.
Interestingly, in column 1 of Table XI it is the 5-HTT distance variable that is now
significant, so this ‘horse-race’ test, admittedly of a simple kind, implies it is a more
important explanatory factor than Nei distance per se. Column 2 of Table XII
continues to suggest that. In column 3, the 5-HTT variable survives the inclusion of
GDP and geographical distance.
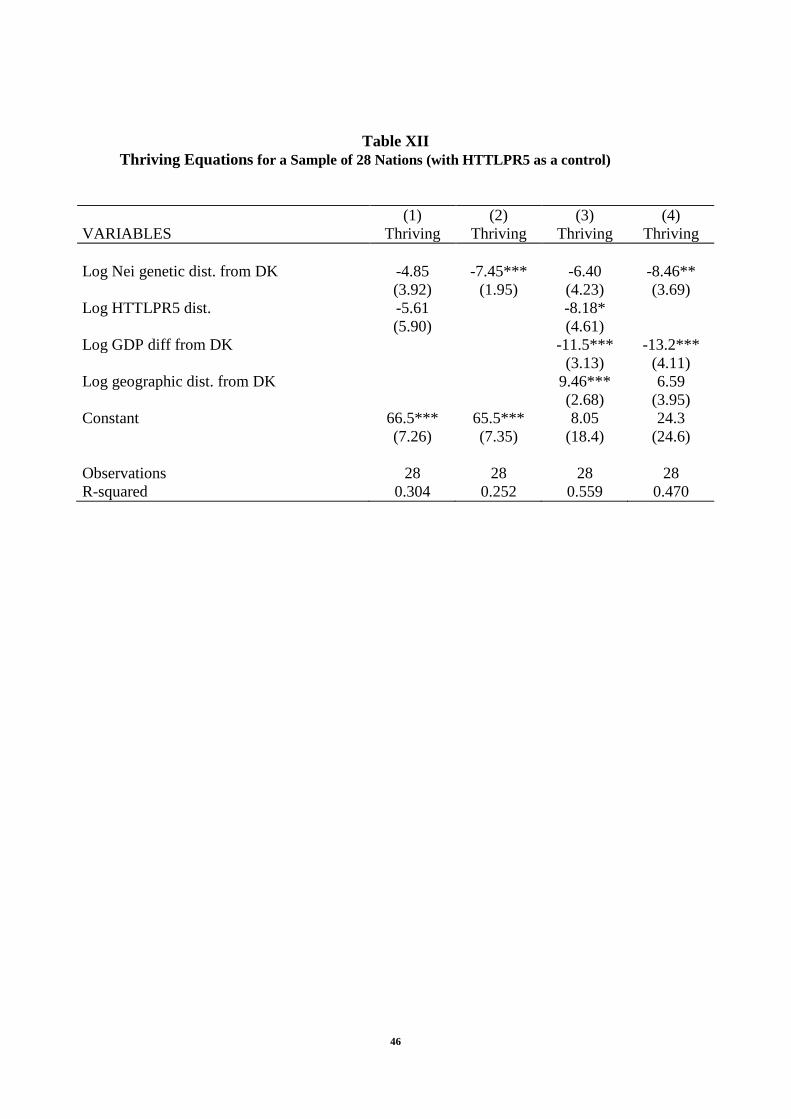
Broadly similar findings are reported in Table XII, where we used thriving as
a dependent variable. It should be said that, with 4 variables and 28 observations, the
regression equations in the last two tables are potentially over-fitted. Hence they
should be viewed only as checks.
4. A Third Test: Using Data on US Immigrant Descendants in an Examination of the
Possible Genetics of Subjective Well-being
17
We provide one extra, and purposely different, form of evidence. One of the
unusual advantages of a genetic influence is that in principle it should be visible even
if historical measures are used. That is for the straightforward reason that genetic
factors necessarily change only gradually: genetic patterns inherently stem from a
previous era.
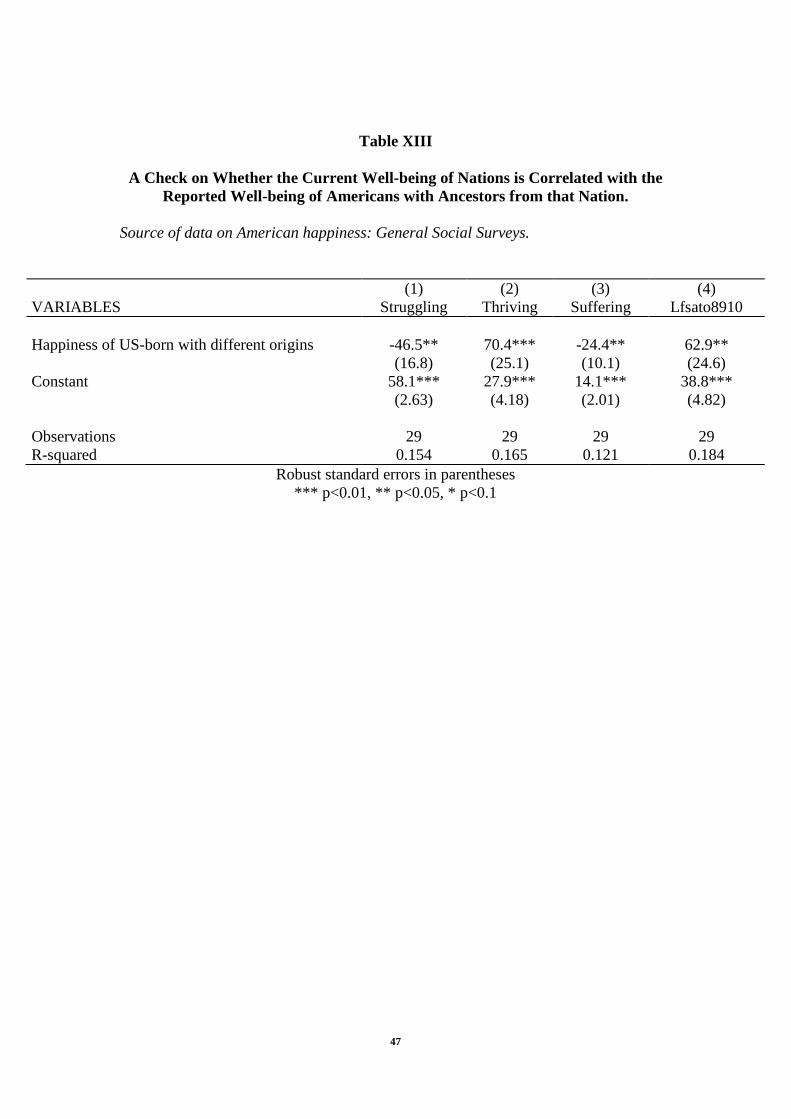
In Table XIII, we exploit that idea. This table uses data on 29 nations, which
is the largest sample available to us for the exercise. The independent variable here is
the coefficient obtained from an ordered probit regression, where (current) happiness
of individuals who are born in the US is regressed against their family country-of-
origin dummies. We also control for the age (and its square), gender, income,
education and religion; these corrections are to provide some control for cultural
values.6 The dependent variables -- there are four in Table XIII -- are the same well-
being measures used in the paper’s earlier tables. In other words, for the Americans
who report that they have family origins from Italy, say, we create an independent
variable derived from the happiness level of current Italian-Americans. We use that
independent variable to explain the current happiness level of Italy. Here the aim is
to see whether the current well-being of nations is correlated with the reported well-
being of Americans who have ancestors from that nation. The purpose is not, of
course, to argue that happy Italian-Americans directly cause the happiness of today’s
Italy. Rather, what this evidence reveals, consistent with the existence of an
underlying genetic component in international well-being patterns, is that there is an
unexplained positive correlation between the happiness today of Country X and the
observed happiness of Americans whose ancestors came from Country X. In the first
6 This procedure is commonly used in the literature to analyze the effect of culture on economic variables like GDP or labour supply (Guiliano 2007; Fernandez 2007; Fernandez and Fogli 2009; Algan and Cahuc 2010)
18
column of Table XIII, for example, the coefficient is -46.5 with a standard error of
16.8. This is consistent with some form of genetic explanation.
4. Conclusions
This study has used three kinds of evidence to try to offer a solution to one of
the famous puzzles of modern social science. For decades, a much-replicated
international pattern of happiness and well-being has remained largely unexplained.
This paper has demonstrated that the cross-country happiness pattern is correlated
with genetic differences. The implied effect-size is not small. The right-hand
columns of Table II, for example, reveal that a one standard deviation in genetic
distance is associated with more than one third of a standard deviation in country
well-being. Contrary to our own presumptions when we began the project, it seems
there are reasons to believe that genetic patterns may help researchers to understand
international well-being levels. If true -- and other research on the topic is now
needed -- this suggests that, as implied by the iconoclastic ideas of Spolaore and
Wacziarg (2009), economists and other social scientists may need to pay greater heed
to the role of genetic variation across national populations.
We find that the closer a nation is to the genetic makeup of Denmark then the
happier is that country. As a raw uncorrected social-science correlation, such a result
would not be a persuasive one. However, what is more interesting is that the
correlation survives adjustment in the regression equations for many confounding
variables. It is robust, for instance, to the inclusion of controls for
(i) the GDP of the country,
(ii) the level of the Human Development Index of the country,
(iii) the geographical distance of the country from Denmark,
19
(iv) a range of cultural and religious variables,
(v) separate dummy variables for each continent,
(vi) indices of nations’ institutions and the generosity of their welfare states
(vii) calculated residuals from the independent country-ranking research of
John Hudson, John Helliwell and Shun Wang, and Jan Ott.
Hence the relationship between well-being and genetic distance is not due merely to
inherent differences between continents, nor to the obvious fact that, for example,
African nations are poor and have different genetic characteristics than rich European
countries, nor to some elementary omission of welfare-state variables.
Our results nonetheless should be treated cautiously. It is valuable to recall
the general strictures of Benjamin et al. (2012), and in particular three concerns:
statistical power; the multiple comparisons problem; the comparatively small
differences in genetic makeup and (S)5-HTT in industrialized countries. First, and
most seriously, the largest data set at our disposal has 143 cross-national observations.
As is true in all social science on the study of different countries, more statistical
power would be desirable. An important avenue for future research will be to check
that the results can be replicated in other ways -- perhaps across regions within
nations. Second, it is known in the field of genetics that the search for patterns can
routinely lead to the discovery of illusory Type-I-error associations. The first section
of the paper, however, examines many possible confounders. To try further to guard
against the problem, (i) we followed the lead, in the second part of the paper, of an
established literature that previously found at the level of the individual there is
evidence to implicate (S)5-HTT polymorphisms in the causes of happiness and
depression, and (ii) we documented evidence that that variable goes some way to
explaining the statistical significance of the genetic distance variable used in the first
20
part of the paper. Third, the findings in the second section of the paper imply that
noticeable well-being differences across countries can be linked to fairly small
differences in the proportion of their populations with the short allele version of 5-
HTT. At a glance, that appears paradoxical. One explanation may lie in a form of
happiness multiplier within a society. If the happiness of an individual is magnified
by social contact with other happy people -- as has been demonstrated by researchers
James Fowler and Nicholas Christakis (2008) and is intuitively clear from observation
of emotional externalities upon members within a family where someone has clinical
depression -- then it is straightforward to write down models in which small
differences in starting happiness can have larger, multiplied effects throughout a
society. A mathematical framework of a related kind has been developed for social-
science settings (Clark and Oswald 1998). The broad idea of matrix multipliers in
social science is an old one and goes back, in a different substantive setting, to the
work on input-output theory by the late Wassily Leontief (1936). Here, let h be a
vector of happiness levels in the population (where the length of the vector is the
number of individuals), A be a matrix of coefficients of happiness interdependence,
and e be a vector of genetic endowments of happiness. Then the happiness vector in a
society is a fixed-point solution given by equation:
h = Ah + e
= (I – A)-1 e
Happiness vector = multiplier matrix * genetic happiness-endowment vector
where I is the identity matrix. In this framework, a greater genetic endowment of
happiness would have magnified effects in society, and these would work through a
multiplier matrix given by the inverse of (I – A).
It is likely that much remains to be understood, at the important border
between social and natural science, about the determinants of nations’ well-being.
21
Acknowledgements
This manuscript, which has been in construction for some years, has greatly benefited
from discussions with James Fearon, Claire Haworth, Marcus Munafo, Jan-
Emmanuel De Neve, Aldo Rustichini, Claudia Senik, Enrico Spolaore, and Alex
Weiss. We also thank the UK Economic and Social Research Council for its funding
of the CAGE Centre at Warwick University.
22
References Alesina A, Di Tella R, MacCulloch R (2004) Inequality and happiness: Are Europeans and Americans different? Journal of Public Economics 88: 2009-2042. Algan Y, and Cahuc P (2010) Inherited trust and growth. American Economic Review 100(5): 2060-92. Ashraf Q, Galor O (2013) The ‘Out of Africa’ hypothesis, human genetic diversity, and comparative economic development. American Economic Review 103: 1-46. Aslam A, Corrado L (2012) The geography of well-being. Journal of Economic Geography 12: 627-649. Barro, R. (2003) Religion adherence data. Harvard University, Economics Department. Benjamin DJ, Cesarini D, Chabris CF, et al. (2012) The promises and pitfalls of genoeconomics. Annual Review of Economics 4:627-662. Biswas-Diener R, Vitterso J, Diener E (2010) The Danish effect: Beginning to explain high well-being in Denmark. Social Indicators Research 97:229-246. Blanchflower DG, Oswald AJ (2008) Hypertension and happiness across nations Journal of Health Economics 27:218-233. Blanchflower DG, Oswald AJ (2011) International happiness: A new view on the measure of performance. Academy of Management Perspectives 25:6-22. Canli T, Omura K, Haas BW, et al. (2005) Beyond affect: A role for genetic variation in the serotonin transporter in neural activation during a cognitive attention task. Proc Natl Acad Sci U S A 102:12224-12229. Cantril H (1965) The Pattern of Human Concerns. New Brunswick, NJ: Rutgers University Press. Caspi A, Sugden K, Moffit TE, et al. (2003) Influence of life stress on depression: Moderation by a polymorphism in the 5-HTT gene. Science 301: 386-389. Cavalli-Sforza L, Menozzi P, Piazza A. (1994) The History and Geography of Human Genes. NJ: Princeton University Press. Chen H, Pine DS, Ernst M, et al. (2013) The MAOA gene predicts happiness in women. Progress in Neuro-Psychopharmacology & Biological Psychiatry 40: 122-125. Chiao JY, Blizinsky KD (2010) Culture-gene coevolution of individualism-collectivism and the serotonin transporter gene. Proceedings of the Royal Society. Biological Sciences 277: 529-537.
23
Clark AE, Oswald AJ (1998) Comparison-concave utility and following behavior in social and economic settings. Journal of Public Economics 70:133-155. Clarke H, Flint J, Attwood AS, et al. (2010) Association of the 5-HTTLPR genotype and unipolar depression: A meta-analysis. Psychological Medicine 40: 1767-1778. De Neve, J-E (2011) Functional polymorphism (5-HTTLPR) in the serotonin transporter gene is associated with subjective well-being: Evidence from a US nationally representative sample. Journal of Human Genetics 56: 456-459. De Neve J-E, Christakis NA, Fowler JH, Frey BS (2012) Genes, economics, and happiness. Journal of Neuroscience, Psychology, and Economics 5:193-211. Diener E, Suh EM, Smith H et al. (1995) National differences in reported subjective well-being: Why do they occur? Social Indicators Research 34:7-32. Di Tella R, MacCulloch RJ, Oswald AJ (2003) The macroeconomics of happiness. Review of Economics and Statistics 85: 809-827. Easterlin RA (2003) Explaining happiness. Proceedings of the National Academy of Sciences of the USA 100(19): 11176-11183. Easterlin RA (2013a) Happiness, growth, and public policy. Economic Inquiry 51:1-15. Easterlin RA (2013b) Lecture at Oxford University, October 2013. Fearon J (2003) Ethnic and cultural diversity by country. Journal of Economic Growth 8: 195–222 Fernández R (2007) Women, work and culture Journal of the European Economic Association 5(2-3): 305-332. Fernández R (2008) Culture and economics, in the New Palgrave Dictionary of Economics, 2nd edition, edited by Steven N. Durlauf and Lawrence E. Blume, Palgrave Macmillan (Basingstoke and New York). Fernandez R, Fogli A (2009) Culture: An empirical investigation of beliefs, work, and fertility. American Economic Journal: Macroeconomics 1: 146-177. Fowler JH, Christakis NA (2008) Dynamic spread of happiness in a large social network: Longitudinal analysis over 20 years in the Framingham Heart Study. British Medical Journal 337:Article a2338. Fox E, Ridgewell A, Ashwin C (2009) Looking on the bright side: Biased attention and the human serotonin transporter gene. Proceedings of the Royal Society B 276: 1747–1751. Gallup (2009). World Poll Methodology. Technical Report. Washington, DC.
24
Gigantesco A, Stazi MA, Alessandri G, et al. (2011) Psychological well-being (PWB): A natural life outlook? An Italian twin study on heritability of PWB in young adults. Psychological Medicine 41: 2637-2649. Graham C (2010) Happiness Around the World: The Paradox of Happy Peasants and Miserable Millionaires. Oxford University Press. Guiliano P (2007) Living arrangements in Western Europe: Does cultural origin matter? Journal of the European Economic Association, 5(5): 927-952. Helliwell J (2003) How’s life? Combining individual and national variables to explain subjective well-being. Economic Modelling 20:331-360. Helliwell J, Wang S (2013) World happiness: trends, explanations and distribution, in World Happiness Report 2013, United Nations, chapter 2. Hofstede G (2001) Culture’s Consequences: Comparing Values, Behaviors, and Organizations Across Nations. Thousand Oaks: CA 2nd edition. Sage. Hudson J (2006) Institutional trust and subjective well-being across the EU. Kyklos 59: 43-62. Kuhnen CM, Samanez-Larkin GR, Knutson B (2013) Serotonergic genotypes, neuroticism, and financial choices. PLoS ONE 8(1): e54632. Leontief WW (1936) Quantitative input and output relations in the economic system of the United States. Review of Economics and Statistics 18:105-125. Lesch KP, Bengel D, Heils A, Sabol SZ, Greenberg BD, et al. (1996) Association of anxiety-related traits with a polymorphism in the serotonin transporter gene regulatory region. Science 274: 1527–1531. Nei M (1972) Genetic distance between populations. American Naturalist. 106: 283. Oswald AJ, Wu S (2010) Objective confirmation of subjective measures of human well-being: Evidence from the USA. Science 327:576-579. Oswald AJ, Wu S. (2011) Well-being across America. Review of Economics and Statistics 93: 1118-1134. Ott JC (2011) Government and happiness in 130 nations: Good governance fosters higher level and more equality of happiness. Social Indicators Research 102:3-22. Ploubidis GB, Grundy E (2009) Later-life mental health in Europe: A country-level comparison. Journals of Gerontology Series B – Psychological Sciences and Social Sciences 64:666-676.
25
Risch N, Herrell R, Lehner T, et al. (2009) Interaction between the serotonin transporter gene (5-HTTLPR), stressful life events, and risk of depression: A meta analysis. JAMA - Journal of the American Medical Association 301: 2462-2471. Scollon CN, Koh S, Wirtz D (2012). The influence of serotonin transporter gene polymorphism (5HTTLPR) and culture on subjective well-being. Poster presented at the Annual Meeting for the Society of Personality and Social Psychology. San Diego, CA Sen S, Burmeister M, Ghosh D (2004) Meta-analysis of the association between a serotonin trans-porter promoter polymorphism (5-HTTLPR) and anxiety-related personality traits. American Journal of Medical Genetics (Neuropsychiatric Genetics) 127B: 85–89. Senik C (2011) Why are the French so unhappy? The cultural dimension of happiness. PSE working paper, Paris. Spolaore E, Wacziarg R (2009) The diffusion of development. Quarterly Journal of Economics 124: 469-529. Stevenson B, Wolfers J (2008) Economic growth and subjective well-being: Reassessing the Easterlin Paradox. Brookings Papers on Economic Activity Spring, 1: 1-102. Stigliz J, Sen AK, Fitoussi J-P (2009) Commission on the measurent of economic performance and social progress. A report to Nicholas Sarkozy. Paris. Downloadable at www.stiglitz-sen-fitoussi.fr Stubbe JH, Posthuma D, Boomsma DI, et al. (2005) Heritability of life satisfaction in adults: A twin-family study. Psychological Medicine 35: 1581-1588. Szily E, Bowen J, Unoka Z, et al. (2008) Emotion appraisal is modulated by the genetic polymorphism of the serotonin transporter. Journal of Neural Transmission 115: 819-822. Weiss A, King JE, Enns RM (2002) Subjective well-being is heritable and genetically correlated with dominance in chimpanzees (Pan troglodytes). Journal of Personality and Social Psychology 83: 1141-1149. Weiss A, Bates TC, Luciano M (2008) Happiness is a personal(ity) thing – The genetics of personality and well-being in a representative sample. Psychological Science 19: 205-210.
26
Data Appendix
Table AIII summarizes the main variables.
For the second section of the analysis, we examined associations between
nations’ well-being and the prevalence of the short (S) allele of the 5-HTTLPR.
Because a cross-national study has relatively few degrees of freedom, we focused on
the single hypothesis of a linear relationship between well-being and the proportion of
individuals in the population with the short allele 5-HTT. Throughout, significance
tests were two-tailed and alpha was set at 0.05.
Our data draw upon painstaking data collection by Joan Chiao and Katherine
Blizinsky on allelic frequency of 5-HTTLPR among 50135 individuals living in 29
nations + Taiwan (Argentina, Australia, Austria, Brazil, Denmark, Estonia, Finland,
France, Germany, Hungary, India, Israel, Italy, Japan, Korea, Mexico, the
Netherlands, New Zealand, Poland, People’s Republic of China, Russia, South Africa,
Slovenia, Singapore, Spain, Sweden, Taiwan, Turkey, UK and USA). Their data set
was compiled from 124 peer-reviewed publications.
We combined this genetic information with well-being data taken from
various social-science sources. In most cases, we used the original surveys ourselves
to calculate the well-being scores. Some of our well-being measures, however, were
developed by Gallup, based on the Cantril Self-Anchoring Striving Scale. The Cantril
Self-Anchoring Scale consists of the following: Please imagine a ladder with steps
numbered from zero at the bottom to 10 at the top. The top of the ladder represents
the best possible life for you and the bottom of the ladder represents the worst
possible life for you. On which step of the ladder would you say you personally feel
you stand at this time? (ladder-present) On which step do you think you will stand
27
about five years from now? (ladder-future). Based on statistical studies of the ladder-
present and ladder-future scales, Gallup formed an index called Thriving -- well-being
that is strong, consistent, and progressing. These respondents have positive views of
their present life situation (7+) and have positive views of the next five years (8+).
Another index is Struggling -- well-being that is moderate or inconsistent. These
respondents have moderate views of their present life situation OR moderate OR
negative views of their future; they are either struggling in the present or expect to
struggle in the future. The exact cut-offs are that Gallup classifies people in this way
if they report current life to be between a 5 and a 7 and their future life between a 5
and an 8. Finally, Suffering includes the individuals who rate both their current and
their future satisfaction levels equal to or less than 4.
We complement Gallup data by using life satisfaction data from the World
Values Survey (WVS) for both the analysis of 30 countries and the smaller sample of
European nations. In the WVS the variable used to assess personal satisfaction is the
answer to the question: “All things considered, how satisfied are you with your life as
a whole these days?" which is coded on a scale from 1 (dissatisfied) to 10 (satisfied).
We consider the data from the two last waves: 1999-2004 and 2005-2008; and we use
the proportion of individuals declaring level of life satisfaction equal to 9, 10 and
8,9,10.
Finally, we also use data on life satisfaction in 2010 from the Eurobarometer
Surveys (The Eurobarometer asks: 'On the whole how satisfied are you: very
satisfied(=4); fairly satisfied (=3); not very satisfied (=2) or not at all satisfied (=1)
with the life you lead?') and data on self-reported happiness from the European
Quality of Life Survey, 2007 (Taking all things together on a scale of 1 to 10, how
happy would you say you are? Here 1 means you are very unhappy and 10 means you
28
are very happy), taken from the coefficients in earlier work on European well-being
patterns by Blanchflower and Oswald (2008, Table 4).
Another index of well-being we considered is the residual of the Gallup
Cantrill ladder after controlling for healthy life expectancy, perception of corruption,
GDP per capita, freedom to make a choice, social support, and generosity -- as
developed in Helliwell and Wang (2013).
The country per-capita GDP data are taken from the World Bank World
Development Indicators data set and relate to year 2005; they are PPP adjusted and
are expressed in constant US Dollars. The social-benefit variable, expressed as a
percentage of GDP, relates to year 2008 and is from the World Bank World
Development Indicators data set. The United Nation HDI (Human Development
Index) relates to 2005.
The cultural variables we considered include the well-known Hofstede
cultural-dimensions variable at the country level.7 The religion adherence data are
from Barro (2003). The index of linguistic distance from Danish follows Fearon
(2003) 8 and the data on colonial origins are from the CEPII dataset
(http://www.cepii.fr/CEPII/en/bdd_modele/bdd.asp) and are expressed as dummy
variables indicating, in the case of each country, the long-term colonizer.
For Table XIII, the happiness of individuals born in the United States is
available from the General Social Survey database (GSS). This data source covers the
period 1972-2012 and provides information on the birth place and the country of
7 They were developed by Hofstede from surveys of IBM employees in approximately 60 countries. 8 Fearon (2003) used data from Ethnologue to create linguistic trees, thereby classifying languages into common families and displaying graphically the degree of relatedness of world languages. The linguistic tree in this data set contains up to 15 nested classifications. If two languages share many common nodes in the tree, these languages are more likely to trace their roots to a more recent common ancestor language. The number of common nodes in the linguistic tree, then, is a measure of linguistic similarity.

29
origin of the respondent’s forebears since 1977. The GSS variable for the country of
origin reads as follows: “From what countries or part of the world did your ancestors
come?” We use answers to that question as a marker of (a degree of) genetic
influence from that country.
30
FIGURES Figure I A Multi-Country Scatter Plot of the Relationship Between Psychological ‘Struggling’ and Genetic Distance from Denmark
Here, and in later figures and tables, the genetic distance variable is calculated with respect to Denmark (denoted DK) as the base. The genetic distance measure here uses the definition due to Masatoshi Nei.
Nei M. Interspecific gene differences and evolutionary time estimated from electrophoretic data on protein identity. Amer. Naturalist 105:385-98, 1971.
Nei’s distance measure D = -ln I where I = Σxiyi / (Σxi
2 Σyi2)0.5
31
Figure II Multi-country Scatter Plots of the Relationship Between a Variety of Well-being Variables and the Genetic Distance from Denmark
32
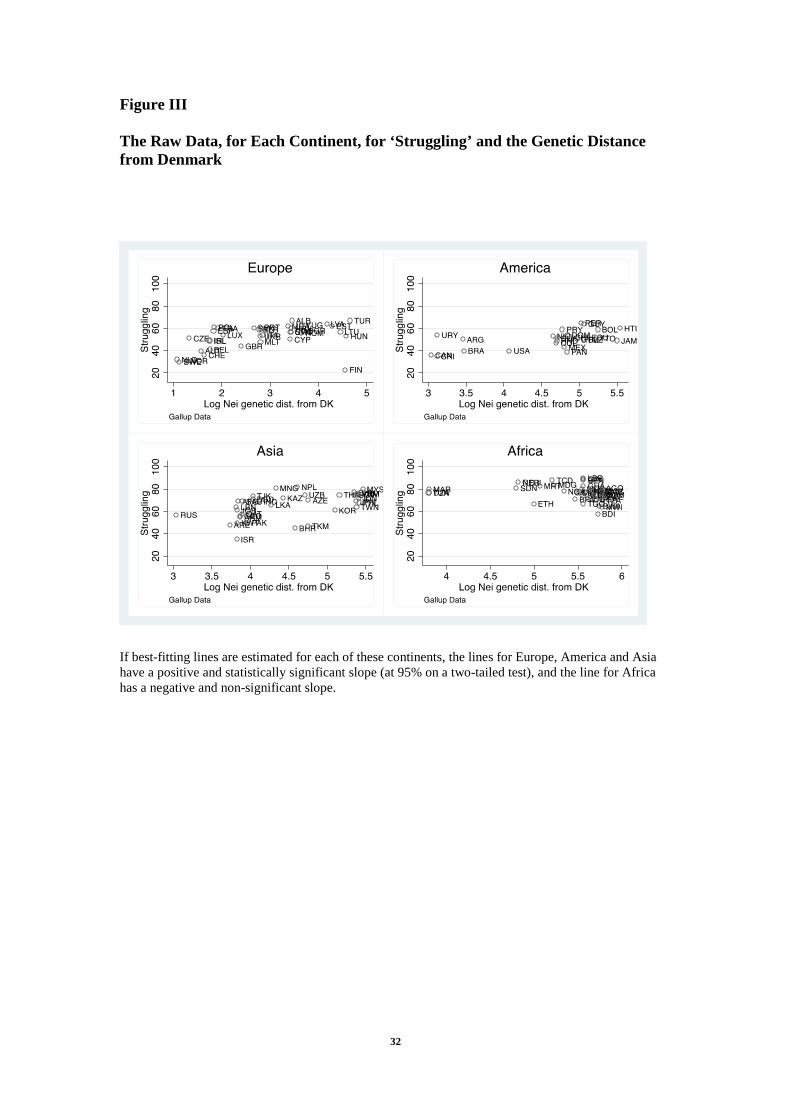
Figure III The Raw Data, for Each Continent, for ‘Struggling’ and the Genetic Distance from Denmark
If best-fitting lines are estimated for each of these continents, the lines for Europe, America and Asia have a positive and statistically significant slope (at 95% on a two-tailed test), and the line for Africa has a negative and non-significant slope.
33
Figure IV. The Correlation Between Life Satisfaction and Happiness and (S)5-HTT in the West European Countries (from Eurobarometers in 1a and EQLS in 1b)
34
Figure V. The Correlation Between Life Satisfaction and (S)5-HTT in the West European Countries and Western Offshoots (from the World Values Survey)
35
TABLES TABLE I Psychological Struggling Equations for a Sample of 131 Nations (DK here is Denmark. ‘Struggling’ is defined as present life situation between 5 and a 7 and future life between a 5 and an 8. Gallup data.)
(1) (2) (3) (4) (5) VARIABLES Struggling Struggling Struggling Struggling Struggling Log Nei genetic dist. from DK 7.11*** 3.22*** 5.46*** 2.49* 3.61*** (0.68) (1.01) (1.58) (1.49) (1.27) GDP difference from DK 5.63*** 5.46*** 3.24*** 3.27*** (1.05) (1.13) (0.98) (1.00) Log geographic dist. from DK -4.14** 4.52* (1.72) (2.51) Africa 2.67 7.18* (4.60) (3.85) America -19.1*** -11.6*** (4.33) (3.04) Asia -1.70 3.39 (3.85) (3.19) Oceania -29.0*** -17.3*** (6.02) (2.97) Constant 31.4*** 37.8*** 63.0*** 11.3 39.9*** (2.98) (3.17) (10.6) (16.4) (3.47) Observations 131 131 131 131 131 R-squared 0.359 0.500 0.529 0.682 0.672
Robust standard errors in parentheses *** p<0.01, ** p<0.05, * p<0.1
36
TABLE II Thriving Equations for a Sample of 131 Nations (‘Thriving’ is defined as present life situation (7+) and the next five years (8+). Gallup data)
(1) (2) (3) (4) (5) VARIABLES Thriving Thriving Thriving Thriving Thriving Log Nei genetic dist. from DK -8.90*** -3.30** -8.08*** -6.17*** -6.26*** (0.87) (1.27) (2.04) (2.18) (1.71) GDP diff from DK -8.12*** -7.74*** -7.08*** -7.08*** (1.19) (1.30) (1.09) (1.09) Log geographic dist. from DK 8.81*** -0.34 (2.25) (3.74) Africa 8.28 7.94 (5.96) (5.36) America 24.2*** 23.7*** (6.22) (4.28) Asia 4.81 4.42 (5.53) (4.43) Oceania 27.2*** 26.3*** (9.57) (5.13) Constant 64.4*** 55.2*** 1.64 60.1** 57.9*** (4.08) (4.23) (14.1) (24.1) (4.58) Observations 131 131 131 131 131 R-squared 0.350 0.532 0.616 0.706 0.706
DK here, and in later tables, is Denmark.
37
Table III Suffering Equations for a Sample of 131 Nations (‘Suffering’ is defined as a present life situation less than 7 and the perceived next five years of less than 8. Gallup data.)
(1) (2) (3) (4) (5) VARIABLES Suffering Suffering Suffering Suffering Suffering Log Nei genetic dist. from DK 1.80*** 0.12 2.62*** 3.66*** 2.65*** (0.49) (0.60) (0.90) (0.99) (0.86) GDP diff from DK 2.43*** 2.24*** 3.75*** 3.73*** (0.74) (0.74) (0.82) (0.83) Log geographic dist. from DK -4.61*** -4.11** (1.05) (2.06) Africa -10.8*** -14.8*** (3.42) (3.13) America -5.10 -11.9*** (4.00) (2.28) Asia -3.06 -7.70*** (3.69) (2.81) Oceania 1.68 -8.97*** (5.84) (2.55) Constant 4.15* 6.93*** 35.0*** 28.3** 2.18 (2.12) (2.09) (6.86) (13.4) (2.14) Observations 131 131 131 131 131 R-squared 0.067 0.143 0.250 0.333 0.309
38
TABLE IV High -Life-Satisfaction Equations for a Sample of 86 Nations (‘Lfsato8910’ is defined here as life satisfaction between 8 and 10. WVS data)
(1) (2) (3) (4) (5) VARIABLES Lfsato8910 Lfsato8910 Lfsato8910 Lfsato8910 Lfsato8910 Log Nei genetic dist. from DK -5.40*** -0.90 -5.69*** -5.20** -3.34* (1.14) (1.45) (2.07) (2.26) (1.80) GDP diff from DK -8.35*** -7.98*** -8.56*** -8.38*** (1.54) (1.66) (1.80) (1.77) Log geographic dist. from DK 8.56*** 7.44* (2.27) (4.24) Africa 4.58 11.3* (6.96) (6.58) America 9.72 22.5*** (8.22) (4.72) Asia -4.09 4.61 (6.37) (5.05) Oceania -6.26 13.0* (12.9) (7.09) Constant 62.7*** 56.6*** 5.55 12.6 59.7*** (4.83) (4.84) (14.3) (26.9) (5.33) Observations 86 86 86 86 86 R-squared 0.153 0.355 0.462 0.521 0.499
39
TABLE V Life-Satisfaction Equations for a Sample of 86 Nations (Life satisfaction here is defined as average life satisfaction. WVS data)
(1) (2) (3) (4) (5) VARIABLES Lfsato Lfsato Lfsato Lfsato Lfsato Log Nei genetic dist. from DK -0.28*** 0.014 -0.30*** -0.31*** -0.16* (0.070) (0.074) (0.10) (0.11) (0.095) Log GDP diff. from DK -0.54*** -0.52*** -0.52*** -0.50*** (0.083) (0.087) (0.100) (0.097) Log geographic dist. from DK 0.57*** 0.57*** (0.12) (0.22) Africa 0.017 0.53 (0.41) (0.40) America 0.36 1.35*** (0.44) (0.25) Asia -0.16 0.51* (0.38) (0.30) Oceania -0.75 0.73* (0.68) (0.38) Constant 7.66*** 7.26*** 3.85*** 3.86*** 7.48*** (0.28) (0.25) (0.76) (1.42) (0.28) Observations 86 86 86 86 86 R-squared 0.121 0.375 0.520 0.554 0.515
40
TABLE VI Struggling Equations for a Sample of 128 Nations (with the HDI Human Development Index and social benefits as control variables) (Gallup data)
(1) (2) (3) (4) (5) VARIABLES Struggling Struggling Struggling Struggling Struggling Log Nei genetic dist. from DK 7.11*** 3.07** 3.78** 3.61** 2.96** (0.68) (1.45) (1.54) (1.53) (1.40) Log HDI diff. with DK 5.87*** 4.79*** 3.71*** 4.56*** (1.63) (1.55) (1.34) (1.38) Log soc. benefits diff. from DK 0.99 0.92 (1.21) (0.77) Africa 8.66** 6.64** (3.39) (3.02) America -12.7*** -13.5*** (2.69) (2.51) Asia 3.51 3.13 (3.10) (2.79) Oceania -16.0*** -15.5*** (2.50) (2.32) Constant 31.4*** 60.0*** 51.3*** 50.0*** 58.1*** (2.98) (8.91) (10.6) (8.28) (7.40) Observations 131 128 92 92 128 R-squared 0.359 0.492 0.466 0.712 0.713
Robust standard errors in parentheses *** p<0.01, ** p<0.05, * p<0.1
41
Table VII Thriving Equations for a Sample of 131 Nations (with culture and religion variables as controls)
(1) (2) (3) (4) VARIABLES Thriving Thriving Thriving Thriving Log Nei genetic dist. from DK -6.46*** -7.56*** -7.84*** -7.25*** (1.75) (1.52) (1.48) (2.61) Log GDP diff. from DK -5.87*** -5.67*** -5.62*** -5.95* (1.05) (1.01) (1.03) (2.93) Log geographic dist. from DK 1.38 2.03 2.03 0.77 (3.41) (3.10) (3.41) (7.92)
Differences in the % of Catholics 14.0** 12.5 11.4 23.6* (5.44) (7.86) (8.14) (13.1) Protestants -42.4*** -50.7*** -52.0*** -59.8*** (12.1) (11.7) (12.9) (19.0) Other Chr. 32.5*** 28.5*** 28.7*** 14.5 (8.77) (10.6) (10.7) (20.0) Orthodoxs 6.57 8.90 8.46 21.2 (7.31) (8.85) (8.99) (19.8) Jews 48.9*** 45.9*** 45.9*** 46.9** (4.87) (7.33) (7.36) (21.4) Muslims 15.7*** 15.7** 15.6** 22.8 (5.73) (7.58) (7.77) (14.7) Buddists 10.1 14.2 14.3 23.2* (6.97) (11.7) (11.6) (13.1) Hinduists 2.15 1.55 1.74 3.80 (5.68) (9.23) (8.97) (13.4) Others 24.1*** 25.5** 27.2** 37.1 (8.55) (10.8) (11.5) (67.3) Language dist. -1.74 -3.65 (3.37) (4.29)
Log Differences in Hofstede index of Individualism -2.22 (3.05) Power distance -2.53 (4.49) Uncertainty avoidance -2.94 (4.22) Masculinity -1.36 (2.08) Constant 69.0*** 74.4*** 77.4*** 113** (20.6) (19.3) (23.5) (43.6) Colonial origin No Yes Yes Yes Observations 131 131 124 60 R-squared 0.808 0.855 0.850 0.903
42
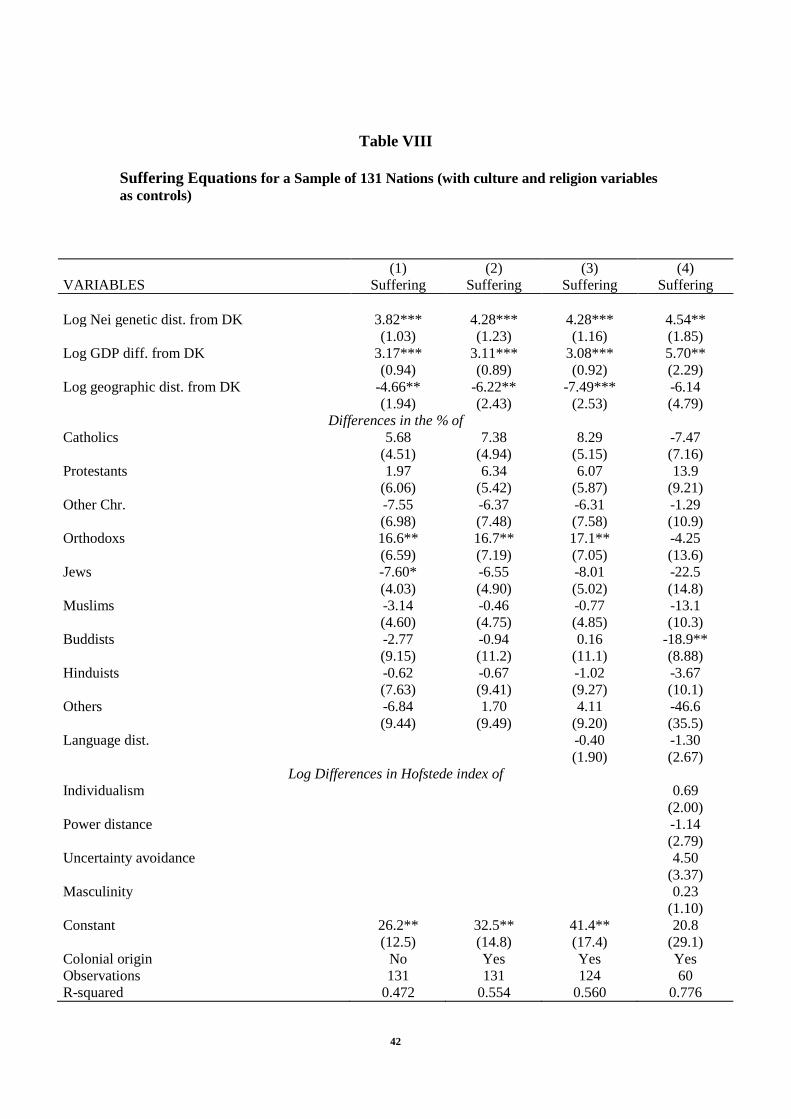
Table VIII Suffering Equations for a Sample of 131 Nations (with culture and religion variables as controls)
(1) (2) (3) (4) VARIABLES Suffering Suffering Suffering Suffering Log Nei genetic dist. from DK 3.82*** 4.28*** 4.28*** 4.54** (1.03) (1.23) (1.16) (1.85) Log GDP diff. from DK 3.17*** 3.11*** 3.08*** 5.70** (0.94) (0.89) (0.92) (2.29) Log geographic dist. from DK -4.66** -6.22** -7.49*** -6.14 (1.94) (2.43) (2.53) (4.79)
Differences in the % of Catholics 5.68 7.38 8.29 -7.47 (4.51) (4.94) (5.15) (7.16) Protestants 1.97 6.34 6.07 13.9 (6.06) (5.42) (5.87) (9.21) Other Chr. -7.55 -6.37 -6.31 -1.29 (6.98) (7.48) (7.58) (10.9) Orthodoxs 16.6** 16.7** 17.1** -4.25 (6.59) (7.19) (7.05) (13.6) Jews -7.60* -6.55 -8.01 -22.5 (4.03) (4.90) (5.02) (14.8) Muslims -3.14 -0.46 -0.77 -13.1 (4.60) (4.75) (4.85) (10.3) Buddists -2.77 -0.94 0.16 -18.9** (9.15) (11.2) (11.1) (8.88) Hinduists -0.62 -0.67 -1.02 -3.67 (7.63) (9.41) (9.27) (10.1) Others -6.84 1.70 4.11 -46.6 (9.44) (9.49) (9.20) (35.5) Language dist. -0.40 -1.30 (1.90) (2.67)
Log Differences in Hofstede index of Individualism 0.69 (2.00) Power distance -1.14 (2.79) Uncertainty avoidance 4.50 (3.37) Masculinity 0.23 (1.10) Constant 26.2** 32.5** 41.4** 20.8 (12.5) (14.8) (17.4) (29.1) Colonial origin No Yes Yes Yes Observations 131 131 124 60 R-squared 0.472 0.554 0.560 0.776
43
Table IX Struggling Equations for a Sample of 131 Nations (with culture and religion variables as controls)
(1) (2) (3) (4) VARIABLES Struggling Struggling Struggling Struggling Log Nei genetic dist. from DK 2.63** 3.26*** 3.53*** 2.81** (1.12) (0.94) (0.95) (1.35) Log GDP diff. from DK 2.63*** 2.48*** 2.45*** 0.25 (0.92) (0.82) (0.82) (2.26) Log geographic dist. from DK 3.32 4.29** 5.55** 5.08 (2.26) (2.13) (2.17) (4.42)
Differences in the % of Catholics -19.7*** -19.6*** -19.4*** -15.1* (5.19) (5.30) (5.34) (8.60) Protestants 40.5*** 43.9*** 45.5*** 45.5*** (8.64) (8.76) (9.52) (12.1) Other Chr. -25.3*** -21.8** -22.1** -12.4 (8.54) (8.54) (8.71) (14.1) Orthodoxs -23.4*** -25.1*** -25.0*** -16.8 (5.58) (5.51) (5.63) (11.3) Jews -41.4*** -39.1*** -37.6*** -23.7* (4.50) (5.56) (5.58) (13.3) Muslims -12.7** -15.1*** -14.7** -9.14 (5.28) (5.44) (5.64) (8.30) Buddists -7.37 -13.0* -14.3** -3.85 (5.97) (6.70) (6.94) (9.85) Hinduists -1.48 -0.30 -0.12 0.24 (6.56) (6.30) (6.21) (10.6) Others -17.5* -27.4*** -31.5*** 11.4 (10.3) (10.3) (10.3) (44.0) Language dist. 2.12 4.85 (2.46) (2.90)
Log Differences in Hofstede index of Individualism 1.49 (1.74) Power distance 3.80 (3.08) Uncertainty avoidance -1.71 (2.47) Masculinity 0.95 (1.40) Constant 4.59 -7.30 -19.2 -31.1 (13.7) (13.7) (14.2) (24.4) Colonial origin No Yes Yes Yes Observations 131 131 124 60 R-squared 0.792 0.845 0.850 0.905
44
Table X. A Check that the Nei Measure Correlates with Adjusted Well-being Rankings in the Existing Published Literature
(1) (2) (3) VARIABLES Residual_Helliwell Residual_Ott Residual_Hudson Log Nei genetic dist. from DK -0.15*** -0.17*** -0.26*** (0.047) (0.062) (0.070) Log geographic dist. from DK 0.24*** 0.36*** 0.53*** (0.069) (0.091) (0.13) Constant 0.63 -2.28*** -3.40*** (0.43) (0.55) (0.82) Observations 143 91 24 R-squared 0.078 0.177 0.472
Robust standard errors in parentheses *** p<0.01, ** p<0.05, * p<0.1
The dependent variables in the three columns are unexplained country residuals from international well-being equations in the work of, respectively, John Helliwell and Shun Wang, Jan Ott, and John Hudson. We are deeply grateful to these scholars for their assistance and for providing their data so generously. See Ott’s dissertation, chapter 14.
45
Table XI Struggling Equations for a Sample of 28 Nations (with HTTLPR5 as a control)
(1) (2) (3) (4) VARIABLES Struggling Struggling Struggling Struggling Log Nei genetic dist. from DK 1.69 5.20*** 2.60 4.88* (2.35) (1.63) (2.55) (2.76) Log HTTLPR5 dist. 7.57** 9.07*** (3.19) (2.62) Log GDP diff from DK 6.24*** 8.10** (2.21) (3.32) Log geographic dist. from DK -5.35*** -2.17 (1.63) (2.94) Constant 32.0*** 33.3*** 65.1*** 47.0** (5.89) (6.08) (12.8) (18.7) Colonial Origin No Yes Yes Yes Observations 28 28 28 28 R-squared 0.422 0.239 0.575 0.361
46
Table XII Thriving Equations for a Sample of 28 Nations (with HTTLPR5 as a control)
(1) (2) (3) (4) VARIABLES Thriving Thriving Thriving Thriving Log Nei genetic dist. from DK -4.85 -7.45*** -6.40 -8.46** (3.92) (1.95) (4.23) (3.69) Log HTTLPR5 dist. -5.61 -8.18* (5.90) (4.61) Log GDP diff from DK -11.5*** -13.2*** (3.13) (4.11) Log geographic dist. from DK 9.46*** 6.59 (2.68) (3.95) Constant 66.5*** 65.5*** 8.05 24.3 (7.26) (7.35) (18.4) (24.6) Observations 28 28 28 28 R-squared 0.304 0.252 0.559 0.470
47
Table XIII
A Check on Whether the Current Well-being of Nations is Correlated with the Reported Well-being of Americans with Ancestors from that Nation.
Source of data on American happiness: General Social Surveys.
(1) (2) (3) (4) VARIABLES Struggling Thriving Suffering Lfsato8910 Happiness of US-born with different origins -46.5** 70.4*** -24.4** 62.9** (16.8) (25.1) (10.1) (24.6) Constant 58.1*** 27.9*** 14.1*** 38.8*** (2.63) (4.18) (2.01) (4.82) Observations 29 29 29 29 R-squared 0.154 0.165 0.121 0.184
Robust standard errors in parentheses *** p<0.01, ** p<0.05, * p<0.1
48
APPENDIX FIGURES AND TABLES Figure AI. The Correlation Between Answers to the Cantril Well-being Ladder and (S)5-HTT in the West European Countries and Western Offshoots (from Gallup Data)
49
Figure AII. The Correlation Between Psychological ‘Struggling’ and (S)5-HTT in 30 Countries (from Gallup Data)
50
Figure AIII. The Correlation Between Very Satisfied % and (S)5-HTT in 30 Countries (from WVS Data)
51
Table AI High-Life-Satisfaction Equations for a Sample of 85 Nations (with the HDI and Social Benefits as controls)
(1) (2) (3) (4) (5) VARIABLES Lfsato8910 Lfsato8910 Lfsato8910 Lfsato8910 Lfsato8910 Log Nei genetic dist. from DK -5.40*** -0.94 -1.41 -2.88 -2.51 (1.14) (1.75) (1.91) (1.88) (1.82) Log HDI diff. with DK -7.44*** -7.27*** -7.69*** -7.45*** (1.82) (1.78) (1.60) (1.75) Log soc. benefits diff. from DK -0.45 -1.89 (2.18) (2.32) Africa 6.64 4.70 (5.72) (5.30) America 22.7*** 25.0*** (5.16) (4.70) Asia -2.05 2.62 (4.94) (4.86) Oceania 11.0*** 11.7*** (3.70) (4.11) Constant 62.7*** 27.9** 30.8** 36.5*** 28.8*** (4.83) (10.7) (14.5) (13.6) (9.78) Observations 86 85 74 74 85 R-squared 0.153 0.335 0.358 0.529 0.527
Robust standard errors in parentheses *** p<0.01, ** p<0.05, * p<0.1
52
Table AII High-Life-Satisfaction Equations for a Sample of 131 Nations (with culture and religion variables as controls)
(1) (2) (3) (4) VARIABLES Lfsato8910 Lfsato8910 Lfsato8910 Lfsato8910 Log Nei genetic dist. from DK -4.83*** -3.85 -3.97* -2.42 (1.65) (2.33) (2.29) (3.40) Log GDP diff. from DK -6.95*** -7.55*** -7.65*** -7.22 (2.03) (2.32) (2.37) (4.32) Log geographic dist. from DK 7.51** 4.46 4.73 1.31 (3.47) (5.03) (5.36) (7.91)
Differences in the % of Catholics 19.3 8.13 5.44 19.8 (11.6) (13.1) (12.9) (12.6) Protestants -41.7*** -36.2** -37.9** -28.8 (12.8) (15.6) (16.1) (20.6) Other Chr. 10.3 -2.89 -3.25 -15.9 (16.8) (18.8) (18.9) (24.2) Orthodoxs -2.77 -7.66 -7.95 4.89 (13.7) (15.1) (14.7) (18.8) Jews 15.3 -1.40 -0.089 16.1 (9.90) (11.4) (11.0) (28.5) Muslims 12.1 1.97 2.39 6.70 (11.0) (13.0) (12.2) (13.4) Buddists 24.4* 18.9 17.5 31.2* (14.4) (18.7) (18.0) (15.8) Hinduists -15.8 -29.3* -27.4* -14.3 (12.6) (15.6) (14.8) (18.1) Others 29.7 18.0 25.5 25.8 (26.4) (28.0) (30.2) (62.7) Language dist. -1.20 0.44 (3.25) (5.23)
Log Differences in Hofstede index of Individualism 0.055 (3.03) Power distance -2.66 (5.73) Uncertainty avoidance -9.15 (6.23) Masculinity -0.16 (2.56) Constant 31.7 54.0* 54.9 104** (21.9) (30.0) (33.5) (48.2) Observations 85 85 82 58 R-squared 0.702 0.769 0.758 0.803

53
Table AIII
Descriptive Data
Observations here are individual countries. Different data sets offer different numbers of countries. For example, people in 133 countries report their level of ‘struggling’ to Gallup survey interviewers. The reason that there appear to be 172 nations in Africa, etc, is that these are one-zero variables, so most of these cells are zeroes.
Variable Obs Mean Std. Dev. Min Max Struggling (Gallup) 133 61.33083 15.34587 17 90 Thriving (Gallup) 133 26.90977 19.44162 1 82 Suffering (Gallup) 133 11.74436 8.760841 0 40 Life satisfaction >8 (WVS) 88 23.37193 12.38959 .5316007 54.07555 Life satisfaction (WVS) 88 6.602505 1.063827 3.856764 8.307819 Ladder_residuals (Gallup) 154 1.969286 .5319533 .474 3.233 Log Nei genetic dist. from DK 170 4.469969 1.199524 1.080822 5.771932 Log HTTLPR5 dist. from DK 30 1.290266 3.087548 -14.08609 3.675034 HTTLPR5 30 49.63233 13.09076 27.79 80.25 Log GDP diff. from DK 172 8.645212 1.337195 5.221976 11.13045 Africa 172 .2965116 .4580527 0 1 America 172 .1918605 .3949136 0 1 Asia 172 .2383721 .4273319 0 1 Pacific 172 .0523256 .2233329 0 1 Log geographic dist. from DK 170 8.427093 .8635883 6.184798 9.811757 Log HDI diff. with DK 170 -1.915703 1.764283 -18.82479 -.4541303 Log soc. benefits diff. from DK 115 2.85587 1.351087 -5.295423 4.185104