Embed Size (px)
Citation preview

National Health Expenditures, 1929-74 I
Preliminary estimate8 of the Nation’8 health spending in fiscal; year 19Y.j and data for previous years are presented in this annual article. In fiscal year 1974, health expenditure8 passed the $100 l4liolz mark, reaching an estimated $104 t billion, or $@5 per capita. The &crease for 1974 L total epeltding was 10.6 percent, slightly higher than the revised annual increase of 9.1 percent for 1973 when mandatory economic controls were fully in effect for the health industry. Despite the accelera- tion, health expenditures remained at the 1973 proportzon of the gross national product-Y.‘? per- cent. Public spending increased twice as fast as private, mainly because of the expansion of the Medicare and Medicaid programs. Third parties financed an estimated 65 percent of all personal health care spending, with the government’8 share 38 percent and that of private health insurance 26 percent. Direct out-of-pocket payments in 19Y.j amounted to $l.j9 per person, compared with $l.jS the previous year.
AMERICANS ARE NOW SPENDING more than $100 billion a year for medical care. Pre- liminary estimates for fiscal year 1974 place total health spending at $104.2 billion, an average of $485 per person .I The 1974 outlays were 10.6 percent higher than they were a year earlier, and, although this represents the second lowest in- crease since 1966, it is a slight acceleration over the 1973 rate (table 1). Revised estimates for 1973-the only fiscal year during which manda- tory economic controls w0re fully in effect for the health industry-indicate that the annual rate of increase in that year was 9.1 percent, the smallest increase since the introduction of Medi- care and Medicaid (the State-Federal medical assistance program) in 1966. Despite the accelera- tion in 1974, however, health expenditures as a percentage of GNP (gross nat,ional product) remained the same as in 1973-7.7 percent. Since
* Division of Health Insurance Studies, Office of Re- search and Statistics
1 For comparable data on a calendar-year basis, see Nancy L. Worthington, National Health, Expenditures, Calendar Years 1929-79 (Research and Statistics Note So. l), Office of Research and Statistics, 1075 Unless otherwise stated, all figures in this Bulletin article are fiscal-year figures.
BULLETIN, FEBRUARY 1975
by NANCY 1. WORTHINGTON*
1971, health spending as a percentage of GNP appears to have leveled off after 5 years of rapid gains (chart 1).
The data reported here for recent years have been revi’sed somewhat, as is customary for this series when more reliable data become available. This year, however, a major additional revision was undertaken in the nursing-home expenditure category. In previous years, nursing-home care included only spending for care in skilled-nursing homes. Vendor payments to intermediate-care facilities under the Medicaid program were pre- viously classified with “other health . services,” since the care they provide is less intensive than that provided by a skilled-nursing facility. In this article, however, the nursing-home category includes expenditures in all facilities that pro- vide some level of nursing care, including all homes certified by Medicare and/or Medicaid as skilled-nursing facilities, those certified by Medi- caid as intermediate care facilities, and those providing some nursing care but not certified by either program. Revisions for previous years have been made in the nursing-home category so that this definition is consistent throughout.
EXPENDITURES IN FISCAL YEAR 1974
The Nation’s $104.2 billion health bill is a func- tion of a number of factors, including the price of services and supplies, per capita utilization, supply of facilities and health manpower, and the quality and quantity of inputs. Although the contribution of each factor varies according to the category of expenditure, price increases have historically been the major contributor to rising expenditures.
Beginning in August 1971, the health industry was subject to mandatory economic controls under the economic stabilization program that remained in force until April 30, 1974. Although controls on the health industry were officially in effect for 10 months of fiscal year 1974, medical care prices began to accelerate several months before the expiration of the program. As a result the last half of 1973 was characterized by unusually
3

high rates of increase, as shown below. These yearend price rises contributed substantially to the higher health spending levels in 1974.
I Percentage increase I 4 I
6 months ending- Medical %~Y
EEi private
s;YW!-
room fees =%zS charges
June 1971’ ______________ ti :: 34 December 1971__________ 3”: June 1972 _--__-_--___-_-- E 35 :: :: December1972...-..... June 1973 ________________ 19 l”g December1973...---- ‘3 2 28
2: ::
June 1974 ________________ 67 64 87 iii
f Before the economic stsbllieation program. * Much of this increase is due to the annual adjustment in the medical
care index for the price of health Insurance that 1s not en itemized component of the index but is a factor used in Its calculation
Source: Consamcr P&e In&z. Bureau of Labor Statletics.
Type of Expenditure
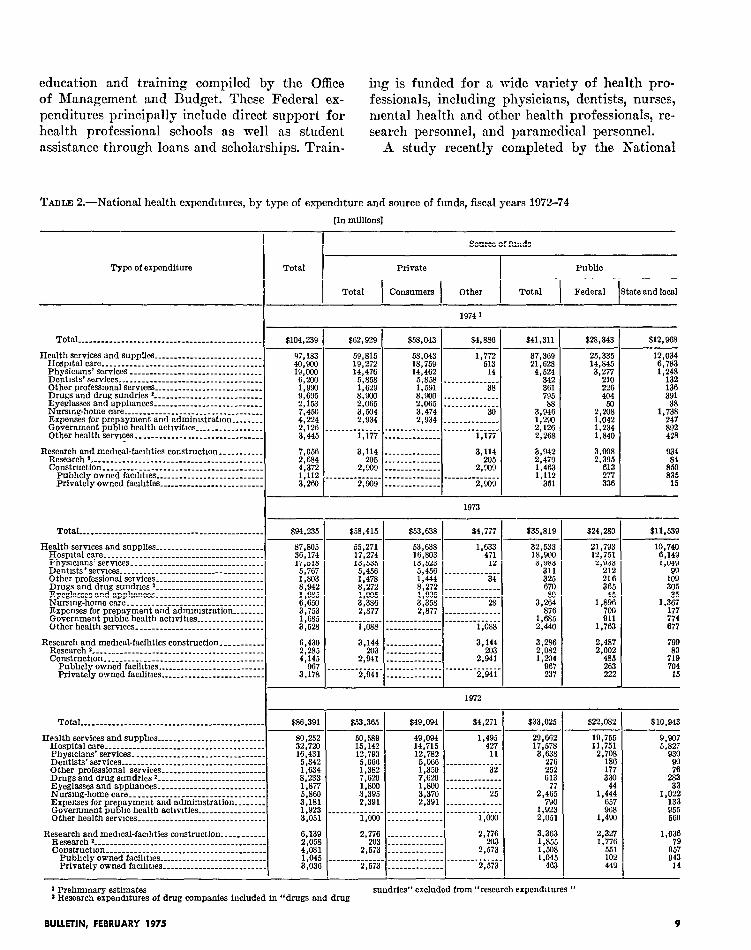
Hospital care continues to be the largest ex- penditure item, accounting for $40.9 billion or 39 percent of total spending (table 2). The 13.1- percent increase in 19’74 is the highest since 1970. This rise reflects the increase both in inpatient utilization and in costs and charges for hospital care. The tabulation below shows that the number of inpatient days in community hospitals rose 2.7 percent during 1974, the highest rise since 1968.
Ad- Fiscal year mls-
SlOns
tl% sands)
1966 _._______ 28,831 1967 _________ 27,043 1968 _________ 27,465 1909...-.-- 28,027 1970 _________ 29,233 ;;W;: ________ 30,312
__-___-- 30,706 1973 _________ 31,483 1974 _________ 32,762
Community hospitals
In- Aver- owu- out- Total P$$”
(in le:%h pzty %(;!?
thou- of$fy (per cent) thou-
sands) days) sands)
I
Number or amount in year
Ex- pense
% juste-d
Et day 1
203.741 214,454 221.971 227,633 231.601
%% 236h84 242,393
94,083 100,301 108,159 113,806 120,404
:%K l&481 170,584
Percentage change from preceding year
1967- _ _-_---- 1968. ____--_- ;9$ _ _ - - - - - -
__._____- 1971...-.... 1972.. ____ __ - 1973. _ _. _ _ ___ 1974..--....
1 Adjusted to account for the volume of outpatient visits. Source “Hospital Indlcatora ” ~foapftals, midmonth Issues, and unpub-
lished data from the Amerlcan’Hospital Association.
4 SOCIAL SECURITY
In addition, community hospital expenses per ad- justed patient day, as reported by the American Hospital Association, accelerated during 1974 after 3 years of declining rates of increase. Hos- pital charges, as measured by the semiprivate- room charges component of the Bureau of Labor Statistics consumer price index (CPI), also ac- celerated somewhat in 1974.2 Since hospitals are reimbursed through both cost-reimbursement and the payment of charges, these cost and price rises, combined with the increased utilization, brought about the increase in hospital expenditures.
Physicians’ services represent the second largest expenditure category. Outlays for the services of physicians rose an estimated 8.5 per- cent in 1974 to reach $19.0 billion. Since current data on gross receipts of physicians in private practice are not yet available from the Internal Revenue Service, expenditure estimates for 1974 are based on price and utilization changes. Revised estimates for 1973 indicate that the rise in spend- ing for physicians’ services in that year was 6.6 percent-the lowest since 1966. This deceleration mainly resulted from the dramatic reduction in physicians’ fee increases that took place during most of the economic stabilization program pe- riod. Physicians’ fees increased by only 2.6 percent during 1973. Fees began to rise faster during the last months of 1974, and as a consequence the annual increase was nearly twice as high as in 1973-5.0 percent. This inflation accounts for the higher rate of increase in expenditures for 1974.
Spending for nursing-home care reached an estimated $7.5 billion in 1974, an increase of 12 percent. The change in the definition of this category to include levels of care other than skilled was described earlier. Revised estimates for the past 8 fiscal years, shown below, demon-
Fiscal year Amount (in millions) Percentage dlstributlon
Total Private Public
~
Total Private PubUc ~-----
1967 ________ 1908.. ______
81.761 y&t 8907 51.8 2.360 E : 62 1
lQ69.. ___ ___ 3.057 1,354 :%i 100 0 2;
1970. _ ______ iti ;;w&-- _ --__-
yg 2,145
-_______ S:860 2.919
p;:
2:465 E : it;
1973 ________ 6,650 “3.3$
1974 ________ 7.450 3:Ko4 !:Z :iE * Ef 100 0 iY.8 PO
*A more comprehensive measure of hospital charges is the composite hospital service charges component of the WI, introduced in January 1972. Comparable data are not available for earlier periods.

TABLE 1.-A selected fiec &F
e&e and per capita national health expenditures, by source of funds, and percent of gross national product, years, 1929-74
olwa natIoual P$t,“t
bIllIona)
-
-
Total
Per capita Percent
&P
strate both the rapid growth in the nursing-home industry and the changes in sources of financing for nursing-home care. The impact of Medicaid payments for intermediate care is evident as the private share of total spending has continued to drop since 1971.
The fastest-growing expenditure category in 1974 was “government public health activities.” Spending for this category reached $2.1 billion. The overall increase of 26 percent was spurred by a 35percent increase in Federal spending. About half of the Federal rise does not represent an actual increase in spending but instead can be traced to the reclassification of expenditures formerly made by the Office of Economic Oppor- tunity (OEO). Health activities of the OEO, outlays for which totaled more than $150 million in 1973, have been transferred to the Department of Health, Education, and Welfare. As a result, spending for health activities originating with OEO is no longer shown separately but is in- cluded as of 1974 with “government public health activities” and is not allocated by type of ex- penditure.
In addition, Federal expenditures for public health activities, medical research, and other health-related endeavors, held down somewhat during 1973 by the impoundment of Federal funds, were boosted slightly by the release of some of these funds during 1974. The slight decline registered in the residual “other health services” category from 1973 does not reflect a
BULLETIN, FEBRUARY 1975
Health expendIturea
i YiYlt mUlIous)
PrIvat.8
Per capita I
Percfnt
&I
i Amount
IP m Iona)
Publla
Per capita
real decline in spending but stems simply from the unavailability of data on school health ex- penditures as of 1974.
Source of Funds
Although growth rates for private and public funds varied from year to year, the proportion of the total each represents remained essentially the same from 1968 to 1973. In 1974, however, public spending increased twice as fast as private (15.3 percent, compared with 7.7 percent), and the pub- lic share of the total grew 11/ percentage points to 39.6 percent. This rising share is largely due to expanded coverage under Medicare and Medi- caid.
The public, or government, contribution to health spending is financed by all levels of gov- ernment-Federal, State, and local. Since Medi- care and Medicaid were implemented, the Federal share of total public spending has been pre- dominant, representing nearly 70 percent in 1974.
Private health expenditures represent, for the most part, payments made to providers of serv- ices by private consumers or by private insurers in their behalf. Consumer payments, which in- clude both patient payments and insurance bene- fits, amounted to $58.0 billion in 1974, about $4.4 billion more than the 1973 total.
The remaining private spending consists of philanthropy, amounts spent by industry for
s

CHABT l.-National health expenditures and percent of gross national product, selected flecal year& lW%-74
$104.2
(In bllhons) $77.2
$25 9
$69 2
Pe mrcent of GNP
1971
Fiscal years
maintenance of in-plant health services (classified under L‘other health services”), expenditures made from capital funds for expansion, renovation, or new construction of medical facilities, and out- lays for research by private foundations. These expenditures totaled $4.9 billion in 1974.
The type of service purchased differs with the source of funds. About three-tenths of private health funds-but more than half the public funds-went for hospital care. Similarly, nursing- home care accounted for less than 6 percent of private expenditures but represented 9.6 percent of public outlays. The proportion spent for medi- cal research was far smaller in the private sector -0.3 percent, compared with 6.0 percent in the nonprivate sector.
The above analysis by source of funds classifies all of the Medicare outlays, including voluntary premium payments by individuals, as public ex- penditures. The classification conforms with that of social insurance in the Social Security Admin- istration’s social welfare expenditure series, where all outlays under various government programs, including those financed through enrollee con- tributions, are treated as public outlays.8 This classification system tends to slightly understate the private share.
In contrast, only 2 percent of the public medical care dollar was spent for out-of-hospital drugs, compared with 14 percent of the private dollar. About 35 percent of private funds were spent for the services of health professionals-doctors, dentists, nurses, and other medical personnel. Only 13 percent of public funds were spent for these services.
In 1974, premium payments by individuals (excluding those paid by Medicaid) accounted for more than 10 percent of the $11.3 billion Medicare total. If these premium payments were classified as private expenditures, the private share of national health expenditures would be raised from 60.4 percent of the total to 61.5 per- cent.
The estimated source of funds for Medicare
a See Alfred M. Skolnik and Sophie R. Dales, “Social Welfare Expenditures, 1974,” BoclaZ t3ecurity Bulletin, January 1976.
6 SOCIAL SECURITY

outlays in fiscal years 1972-74 is shown below for both hospital insurance and medical insurance.
Source of funds 1 I 1972 I 1973 I 1974
T&a;sfedicare expenditures (in mil- .__-__-__--____--_____________ $8,819 2 $9,478 8 $11,321 9
--___ Percent from-
Paymlltax.-....-....-..-..-------------- 61 6 70 0 ‘71 6 Premium payments by enrollees _________ Premium payments by Medicaid ________
_ 14 2 16 ‘: : “: ;:
Oeneral revenues _________________________ 22 6 17 0 17 0 ---
Hospital insurance expenditures (in millions)---.-.-.-..-.......----....-. $6,275 6 86,841 7 $8,643 7
--- Percent from-
Payroll tax _-____._._____________________ 90 6 94 7 195 5 General revenues _________________________ 96 53 45
-~- Bupplementary medical insurance ex-
penditures (in mIllions) ______________ 82,643 7 $2,637 1 $3,273 3 ~--
Percent from- Premium payments by enrollees _________
“i ‘: 447 41 b
Premium payments by Medirsid ________ General revenues _________________________ 60 6 5z Kci
1 Excludes smell amounts transferred from the railroad retirement account and from interest on investments.
2 Includes small amounts paid in HI premiums by persons previously uninsured.
Expenditures Under Public Programs
The government at all levels spent $37.4 billion for health services and supplies in 1974. More than $25 billion (68 percent) of this amount came from Federal sources; the remainder came from State and local sources.
Table 3 lists each government program along with amounts spent during fiscal years 1972 through 1974 for various types of health services and supplies. The Federal and the State and local sources of funds are shown separately to dis- tinguish between those programs financed solely by Federal funds, those by State and local funds, and those by both. These programs and their outlays are the same as those currently reported in the annual social welfare expenditures article of the BULLETIN.
Expenditures for health services and supplies in 19’74 were $4.8 billion or 14.9 percent higher than in 1973. This increase is more than 50 per- cent higher than that registered in 1973 and is the result of several factors, including the ex- pansion of the Medicare program and the ac- celerated inflation rate.
The Medicare and Medicaid progrjms ac- counted for 80 percent of the overall rise in public spending. Each program spent more than $11 billion for benefits and administration in 1974. Together, they made up three-fifths of the total
government health budget. Medicare has been substantially the larger since the two programs began in 1966. Because of significant increases registered in vendor medical payments under Medicaid in recent years, however, that program now spends nearly as much as Medicare.
Expenditures under Medicare rose by $1.8 billion 0; 19.4 percent in 1974. Much of this increase stems from the expanded coverage au- thorized under the 1972 amendments to the Social Security Act. Under the law, Medicare coverage was extended, as of July 1, 1973, to persons who have been entitled to receive cash benefits because of disability for at least 2 years and to persons with chronic kidney disease, and hospital insur- ance coverage was opened to previously uninsured persons aged 65 and over who enroll voluntarily and pay a premium. At that t’ime, an estimated 1.7 million disabled persons and 9,300 persons with chronic renal disease were eligible for Medi- care coverage,* and, as of December 1973, an additional 12,300 persons have enrolled qnder the voluntary hospital insurance program.
Medicare expenditures for each covered service increased substantially during 1974. The fastest- rising benefit category was skilled-nursing care (classified as nursing-home care), which increased an estimated 45 percent-from $154 million to $224 million. This rise, largely attributable to the coverage of the disabled, is the first for this category since 1969.
Payments under Medicaid were $2.0 billion (21.8 percent) higher in 1974 than in 1973. As with Medicare, Medicaid spending for all types of benefits increased rapidly during the year. The steady growth in Medicaid spending-a trend in recent years-can be attributed to ever-increasing numbers of recipients and to rising health costs.
.’
A relatively small amount of duplication oc- curs in the Medicare and Medicaid amounts-a factor t,hat causes total public expenditures to be slightly overstated. Medicaid expenditures in- clude premiums paid into Medicare’s supple- mentary medical insurance trust fund for cov- emge under State “buy-in” agreements for aged or disabled persons who either receive public assistance money payments or are medically in- digent. Since premium payments into the trust
4 Martin Ruther, Disability Beneficiaries EZigible for Afedicare, July 1, 1973 (Health Insurance Statistics Note No 61), Office of Research and Statistics, 1974.
BULLETIN, FEBRUARY 1975 7
fund are in turn used to finance services under the supplementary medical insurance program, they are counted again. The amounts of premiums paid by States under such agreements since the beginning of Medicare are shown below:
Amount Fiscal year (in 7nWom) l%i ______________________________________ $321 1968 ______________________________________ 53.0 1969 ______________________________________ 758 1970 -------_-----___---_------------------ 97.2 1971 --__---_____-___---_------------------ 131.5 1972 ______________________________________ 137.9 1973 ______________________________________ 1493 1974 ______________________________________ 155.2
The third largest category of public expendi- ture, general hospital and medical care, mostly represents government spending for direct pro- vision of medical services (excepting those pro- vided to veterans and to the military). Federal spending includes primarily the operation of Pub- lic Health Service hospitals and Indian health services. State and local spending, nearly 80 per- cent of the total for this category, includes for the most part funds for the operation of State or locally owned psychiatric hospitals. Total expend- itures for general hospital and medical care reached $5.0 billion in 1974, up 8.3 percent from 1973. This increase was the lowest since 1969.
Spending under two government programs is no longer shown separately, as noted earlier. Estimates of school health outlays can no longer be obtained, and spending for this purpose is in- cluded with the education category in the social welfare expenditures series and excluded from health expenditures. The health activities of the Office of Economic Opportunity have been trans- ferred to the Department of Health, Education, and Welfare and are currently included in “gov- ernment public health activities.”
Fifty-eight percent of all public outlays for health services and supplies financed hospital care. This proportion differs among the various pro- grams and depends on the coverage extended by each individual program. In 19’74, hospital ex- penditures accounted for nearly all outlays under the general hospital and medical care category and 71 percent of the expenditures under Medi- care and the Veterans Administration programs. Only 15 percent of the expenditures for maternal and child health services purchased hospital care.
For physicians’ services--accounting for 12
percent of public outlays for health-the distri- bution also varies among the programs. Medicare used 20 percent of its funds for physicians’ serv- ices, workmen’s compensation spent 43 percent, and the Veterans Administration spent less than 1 percent. It should be noted that most of the expenditures made by the Veterans Adminis- tration and the Department of Defense for phy- sicians’ services are included with hospital care expenditures (see Definitions, pages 14-20).
Data on administrative costs of government programs are available in full for two programs (Medicare and Medicaid) and in part for two others (Department of Defense and Veterans Administration contract medical care programs). Administrative costs for these programs increased 47 percent in 1974, reflecting both the increased cost associated with program expansion and ris- ing claims volume and the escalation in overhead costs due to increased management control efforts.
Government outlays for medical research and construction went up 20 percent in 1974, increas- ing by $656 million. Both research and construc- t)ion registered similar percentage increases. For research, the 1974 rise is 11/2 times that for 1973; for construction, the 1974 increase follows a 20- percent decline in 1973.
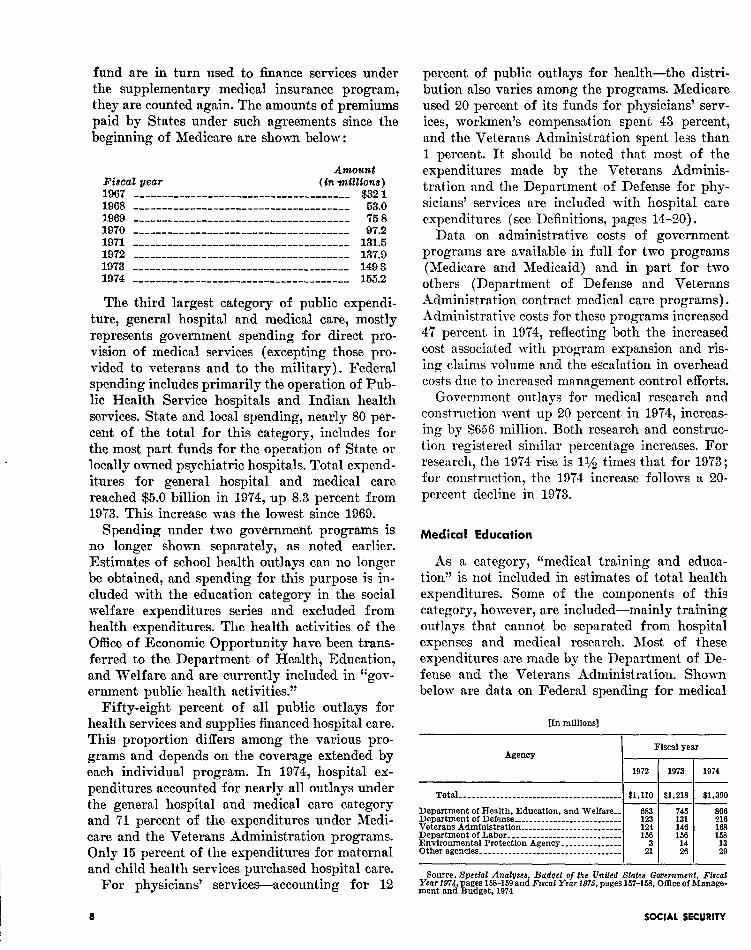
Medical Education
As a category, ‘<medical training and educa- tion” is not included in estimates of total health expenditures. Some of the components of this category, however, are included-mainly training outlays that cannot be separated from hospital expenses and medical research. Most of these expenditures are made by the Department of De- fense and the Veterans Administration. Shown below are data on Federal spending for medical
[m millions]
Agency Fiscal year
1972 1973 1974
Total ________________________________________ I $1.110 I $1.218 I $1.390 -A&
Department of Health, Education, and Welfare.- 683 Department of Defense ___________________________ 12 E Veterans Administration _________________________ 146 Department of Labor ____________________________ 166 :: EnvIronmental Protection Agency _______________ Other agencies--......-...----------------------- 2; :;: 2
Source. Special Analyses Budqct of the United States Government, Fiscal Year 1~4 ages 158-159 snd Fmal Year 1976, pages 157-168, OWce of Manage- ment and udget, 1974 3
8 SOCIAL SECURITY
education and training compiled by the Office ing is funded for a wide variety of health pro- of Management and Budget. These Federal ex- fessionals, including physicians, dentists, nurses, penditures principally include direct support for mental health and other health professionals, re- health professional schools as well as student search personnel, and paramedical personnel. assistance through loans and scholarships. Train- A study recently completed by the National
TABLE L.-National health expenditures, by type of expenditure and source of funds, fiscal years 1972-74
[In millions]
Source of funds
Type of expenditure Total
Total
Private Publfc
Consumers I
Other Total Federal State and local
Total _______________ L ______________________________
Health servicea and supplies ___________________________ IIospltalcare.-....-..-.-...-----------~-----~------- Physicians’ services _________________________________ Dentists’ servlccs.. __________________________________ Other professlonal services ___________________________ Drugs and drug sundries f ___________________________ Eyeglasses and apphances ___________________________ Nursmg-home care-. _________________________________ Expenses for prepayment and adminIstratIon..-..--- Qovernment pubhc health actlvitres ____ ____ _ ________ Other health servmes ________________________________
Research and medmal-faclhties constructIon.--..--.... Rescarch*.---..-.....--.....------------------------ Construction ____---_____---_-__-____________________
Pubhcly owned faclhtles-.-. _______________________ Privately owned faelhties ____________._____________
$104,239
97,183 40,900 19,mo
6,200 1,990 9,695 2,153 7.450 4,224 2.126 3,445
;sg
4:372 1.112 3,266
$62,929
59,815 19,272 14,476
5,858 1,629 8,906 2,065 3,504 2,934
---___------ 1.177
3,114 205
2,909 --____------
2.909
1974 1
$58,043 $4,886 --
58.043 1,772 18,759 613 14,462 14
5,858 ______________ 1,591 8,900 ___________ ““. 2,065 ______________ 3,474 30 2,934 ---_-_-_---__.
__--_----____ ______-._____. ___-___-_-___ 1,177
-______-_____ 3,114 ----------_-_ 205 __-__________ 2,%x -----_------- ---_-_-------. -----_---__-_ 2,909
1973
$41,311 $23,343 $12.968
37,369 21,625
4.624 342 361 795
3.G 1,290 2,126 2,268
25,335 14,845
32;;:
226 404
2,g 1,042 1.234 1,840
3,942 3,008 2,479 2,395 1,463 613 1,112 277
351 336
Total ________________________________________------
Health services and supplies ___________________________ Hospltalcare....-...~------------------------------- Physicians’ services ____ _ ____________________________ Dentists ’ servmes __________________________ _________ _ Other professional services ___________________________ Drugs and drug sundnes 1___________________________ Eyeglasses and apphances. _____________________ ___ __ Nurslng-homecare....---.----....---------~--~----~ Expenses for prepayment and admmntration........ Government publm health actlvitles _________ _ ______ _ Other health services _____________________ _ _________ _
Research and medical-facilities construction..---...... Research 2 ________________________________________ ___ Construction _____________ _ ______ _ ____ ____ ___________
Pubhcly owned facihtles _____________._____________ Privately owned faclhtles. _________________________
$94,235 $58,415 $53,638 $4,777 635,819 ~-
87,865 55,271 53,638 1,633 32.533 36.174 17.274 16,603 471 18.900 175.;;; 13,535 13,523 12 3,983
1:803 5,456 5,456 1,478 1,444 ----------fi-
311 325
i%: 8,272 8,272 _________ _____ 670
6:650 1.905 1,905 ______._______ 3,386 3,353 3.2:
3,753 2,877 2,877 ______ . . ...“.
876 1.685 ______________ ______________ ______________ 1,685 3,528 1.088 ___--__--_-___ 1,033 2,440
6.430 3,144 __--____------ 3,286 2,285 203 _ - - _ _ _ _ - - - _ - - -
“*E 2.082
4,145 2,941 _ ______---_-__ 2.941 1,264 967 ______________ ______________ ------‘-i~sii- 967
3,178 2,941 __________ ____ 237
Total ________________________________________------
Health services and supples ____ _ ______________________ IIospitalcare.....------~-~-----------------------~-- Physicians’ services. _________________ _ _____ _ ________ Dentists’ services-.... ____ _ _____.____________________ Other professional services ____________ .____ _ ________ Drugsanddrugsundriesz __________ ____ _____________ Eyeglasses and apphances. _________ ___ ._____________ Nursmg-home care-- ______________ _____ ___ _____ _ ____ Expenses for prepayment and admimstration.--.-.-- Government pubhc health actwlties.. _______________ Other health services ______ _ _________________________
Research andmedlcal-faahties construction-.--------. Researchz....-.---.-._-.-..----------------~-------- Construction ______________________________ _ _______ __
Pubhcly owned Iacihtles. _____________ _ __________ __ Privately owned facrhtles __________________________
$86,391
80,252
%:: 5:342 1,634 8,233 1,877 5,860 3.181 1,923 3,051
6,139 2,058 4,081 1,045 3,036
1972
$53,365 1 $49,094 1 $4,271 1 $33.025 $22,082 $10,943
50,589 49,094 1.495 29,662 15,142 14,715 427 17,578
12,793 12,782 11 5,066 ye.; _ _____----- 1,382
7:620 pi-
“+g
252 7.626 ______________ 613 1,800 1.800 ______________ ;.;a; 3,370 2.391 _______-___ 95. 2,4;:
_____________ __-____-_-____ ‘-----‘-i-ooo‘ 1,;: 1,000 -______-_-__-- 2.051
2,776 _ _____________ 2,776 3,363 203 ______________
2,673 ______________ 2% ;.a$
_______-_-___ ---____---____ -------------- 1:045 2,573 ______________ 2,573 463
12,034 6,783 1,248
132 136 391
1.733: 247 892 428
$24,280 $11.539
21,793 12.751
2,933 212 216
346: 1,896
700 911
1,763
2,487 2,002
485 263 222
19,755 11,751
2,703 186 177 330
1.4:: 657
1.2
2,327 1,776
551 102 449
10.740
%i ‘99 109 305
1,336:: 177
i::
799
7:: 704
15
--
9,907 5,827
930
%
“2
‘$g
955 660
1,036
!33!
14
1 Prehminary estimates a Research expenditures of drug companies included in “drugs and drug
sundries” excluded from “research expenditures ”
BULLETIN, FEBRUARY 1975

TABLE 3.-Expenditures for health services and supplies under public programs, by program, type of expendtture, and source of funds, fiscal years 1972-74
[In millions]
Program and source of funds Total Hospital care
$$ Den- Other pro- Dru9s “iiE?- t1sts fessional and drug
g;$ti N;uo’sg-
services services services sundries appli- ClWl3 ph%ilt *rices activities
1974
Total _____________________________ $37.369 0
Health insurance for the aged r f ________ 11.321 9 Temporary drsability insurance (medi-
cal benetIts)s __________________________ 71 2 Workmen’s wmpensstron (medrcal
benefits)‘_____________________________ 1.459 0 Pubhc assrstance (vendor medical
payments)2 ___________________________ 11,218 4 Qeneral hospital and medical care.....-- Defense Department hospital and med-
6,022 4
ical care (includmg mlhtary depend- ents)‘..............------------------- 2.709 0
Maternal and child health services...... 469 8 School health 5 ____ _ _____________________ _________ Other public health activitres ______ _____ 2,126 2 Veteran’s hosprtal and medrcal care 4 ___ Medical vocattonal rehsbilltatlon.......
2,;;; ;
Office of Economic Opportumty a _______ _________
8,005 7
62 6
730 4
4,105 2 4,907 6
1,715 3 70 4
_-_---__, _ - _ - -. - _.
1,967 2 74 3
-----__-.
Federal _____________________________ 25.334 7 14,845 4
Health insurance for the aged 1 * ________ 11,321 9 Workmen’s compensation (medrcal
benefits) ______________________________ 36 0 Pubhc assistance (vendor medrcal
payments) ____________________________ 6,824 1 General hospital and medrcal care-.-...- 1,933 0 Defense Department hosprtal and med-
ical care (mcluding military depend- ents)‘--.-_--------.------------------- 2,709 0
Maternal and chrld health services....-- 236 0 Other public health activrties ____________ 1,234 0 Veterans’ hospital and medical care *---- Medrcal vocationalrehabilitation.-.-...
2,:; ;
Office of Economic Opportunity 8 _______ _________
State and local ______________________ 12,034 3
Temporary drsability insurance (medi- ical benefits J _________________________ 71 2
Workmen’s compensatron (medrcal benefitsY _____________________________ 1,414 0
Public assrstance (vendor medrcal payments) ___________________________ 6,394 3
Cleneral hospital and medxal care----..- Maternal and child health services-.-...
3,;;: ;
School health S ___________ _ ______________ _________. Other public health activltres ___._______ 892 2 Medrcal vocational rehabilitation-.---.. 39 4
--
See footnotes at end of table.
8.005 7
23 4
2,121 0 918 1
1.715 3 36 3
_-----__. 1,967 2
53 4
6,733 0
62 5
707 0
1.984 1 3,983 4
3s 1 _ _ _ _ _ - _ _ __---__-.
14 9
$1,524 3 $342 0 -~
2.318 2 __________
16 1 __________
617 0 __-____-_-
1.222 6 267 3 11 6 33
$361 3 $794 9 $37.8 $3,946 3 $2,126 2 $2,263 0 $1,289 9 ----P-P
106 8 __________ ___a______ 224 0 _______.__ -_--__---- 667 2
11 8 8 _ _ _ _ - _ _ _ _ _ - _ - _ _ _ -. _ _ - _ _ - - _ - - - - - _ _ - _ - - _ - -
44 6 230 29 0 _ _---__ _-_ ---_ -_- ___ - __ ___---- -___-_-_--
173 6 743 3 --_-______ 3,697 0 __________ 640 2 669 4 __ww------ 1 1 -_-_-____ _ __ _ _-. __ __ __-____.__ 98 6 __________
169 2 15 6 __________ 4 8 --____-_-_ _ __ _ -.____ __------__ 731 9 43 4 10 6 35 2 10 2 13 7 ______-___ ____-_-.__ 286 4 ______ “-”
_-_-_--__-___-_---- _--_------ --____---- ----_-__-_ ----_.---_ _______.__ __________ __________ --_------ ________-- ____------ --____---- ----_-_--_ __-_--____ 2,126 2 _________. __________
25 8 44 9 -_____---- 1M) 6 __________ __________ ______ “?.
25 7 126 3 _ _________ 661 0 31 0 IS 6 __________ __________ __________ __________
_______-_ __________ __--_--_-- --___-____ __-_____-- ____-_-___ __----_-__-_--------________-_ 3,2768--~~~~
209 6 225 6 404 2 49 8 2.207 8 1,234 0 1,839 7 1.042 6
2.318 2 __________ 106 8 __________ __________ 224 0 _______.__ ___-__---- 667 2
9 0 __----____ 22 7 7 __-_--___- _______.__ ______---. ________ *_
631 6 138 1 89 7 __-_ 1,858 5 -______-_. 279 0 322 0 11 6 3 8 __ --_-_ __ _
38: y :::‘-: -_ ____ -v----e--- -_------__ 98 6 __________
‘3”; ;2 16 72 5 __________ 26 8 79 4 8 -- _._ _-_ 6 6 -_ __________ - -__ --__-_ __________ _--------- 119 781 3 9 ________-- 22 3
--------_-__------- ---------- ---___---- -_--__-_-_ -----___-- 1,234 0 .--‘asi-~
__________ 26 8 44 9 __-_-_--- - 26 7 125 3 _______.__ 31 0 80 6 __________ __________
. . . ..~“.~- 14 9 ____-.____ ____---.__ -___-----_ ------_---
_-___--_- -___------ ____-_-_-- --______-- ----___-__ __-_-.____ ______-___ -___-_---__---_----- --~-~~~~-
1,247 6 132 6 135 8 390 7 37 9 1,738 6 892 2 428 2 247 3 ---~-~~-- 16 1 __________ 11 8 8 -____.______-_-_-___________-_ -e-e------
608 0 __ _ _- - -_- - 42 4 28 3 28 3 -_-.-.____ -_-----___ -_____-_-_ -*--------
699 9 129 2 83 9 359 3 _ _________ 1,738 6 __________ 261 0 247 3 .-_---___ -___-_-_-- --_-_----- --______-_ ---.______ ____-___________-_______-----_ ___-_-_---
12 4 33 84 23 5 1 ____ _ --___ -____--_-- 167 2 __________
Academy of Sciences’ Institute of Medicine pre- sents estimates of the total cost of education for eight health professions .5 The study reports that $3.1 billion was spent for the education of more than 300,000 students in 1972. About 25 percent ($765 million) of this expenditure was financed by unrestricted Federal and State government funds. The remaining amount was financed through private sources or through other types of Federal and State support.
TRENDS IN HEALTH EXPENDITURES
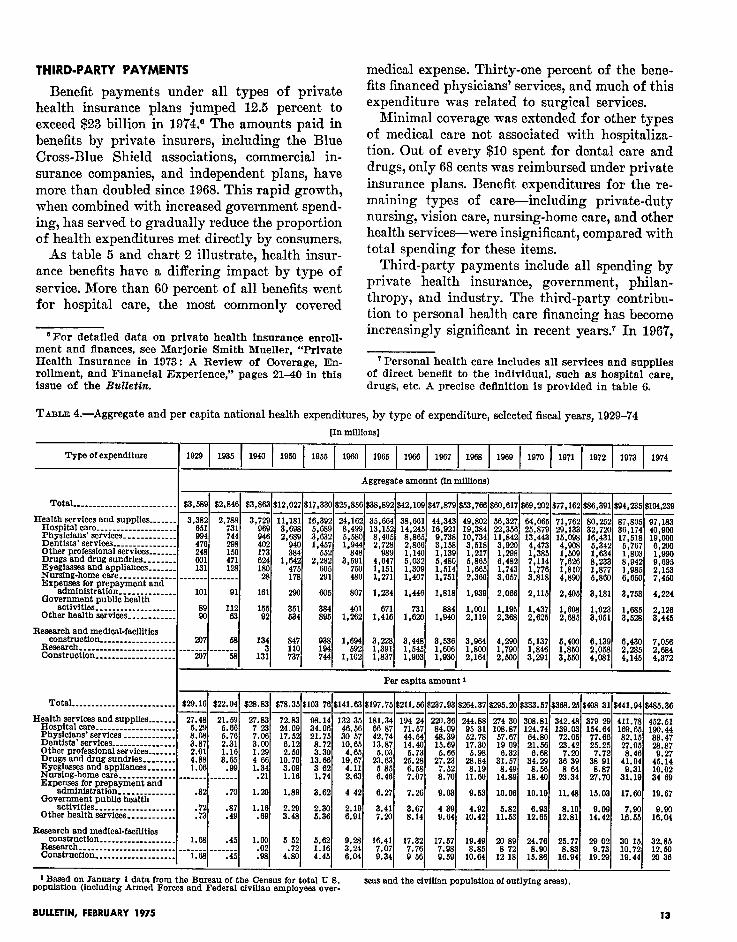
Much attention has been focused on the rapid growth in health spending since the mid-1960’s. During the 9 fiscal years since 1965, health ex- penditures have increased on the average more than 11 percent a year, from $39 billion to $104 billion (table 4).
‘Costs of Education in the Health Professions: Report of a Study, Parts I and II, Kational Academy of Sciences, Institute of Medicine, 1974 The eight professions in- cluded in the study are medicine, osteopathy, dentistry, optometry, pharmacy, podiatry, veterinary medicine, and nursing.
It is difficult to pinpoint, the precise contribution of each of the sources of increase. Inflation has undoubtedly had a significant impact on health spending levels in recent, years, but it is often very difficult to separate pure inflation from price rises attributable to more extensive care. Tech- nological developments in areas such as equip-
10 SOCIAL SECURITY
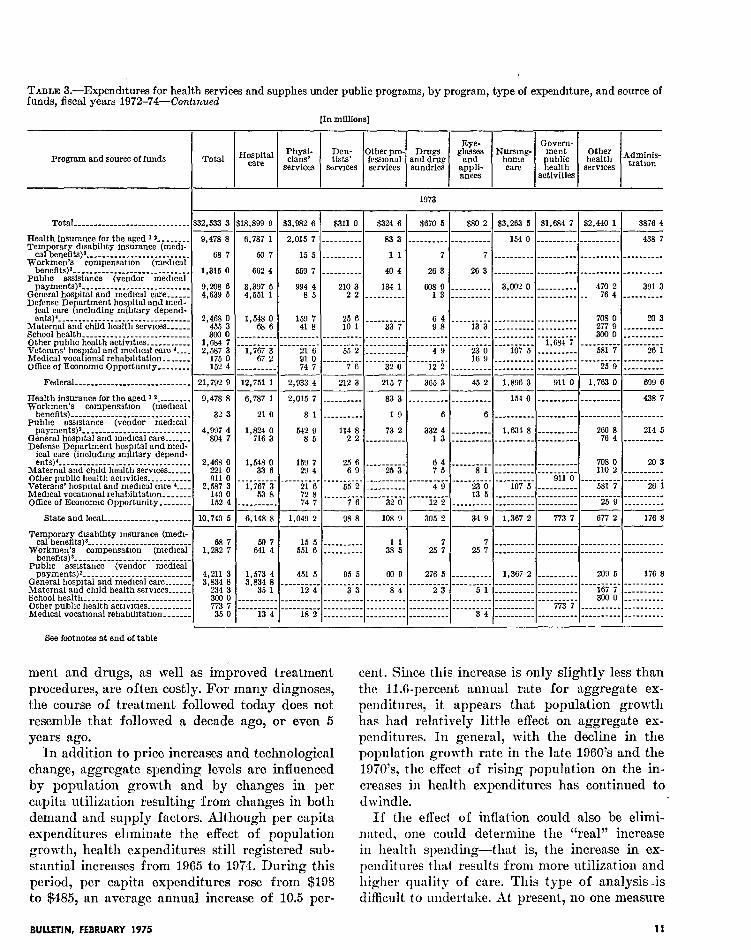
TABLE 3.-Expenditures for health services and supplies under public programs, by program, type of expendkure, and source of funds, fiscal years 1972-74-Contmued
[In millions]
Program and source of funds Den-
Total Hospital $ys!- care tists,
Other pro- Drugs fewonal and drug
g$%js N;Fsg- “lYlEin- ,“,“a:;; Adminis-
SWViWS servxes services sundries appli- care !El% services tratlon
BDWS activities
I-
Total _____________________________ $32,533 3 Total _____________________________ $32,533 3
Health insurance for the aged 12 ________ Health insurance for the aged 12 ________ Temporary dlsablhty insurance (medt- Temporary dlsablhty insurance (medt-
9,478 8 9,478 8
cal benefits)‘__________________________ cal benefits)‘__________________________ 687 687 Workmen’s compensation (medical Workmen’s compensation (medical
benefits)% _____________________________ benefits)% _____________________________ 1.315 0 1.315 0 Public assistance (vendor medlcal Public assistance (vendor medical
payments)* ___________________________ payments)* ___________________________ 9,208 6 9,208 6 General hospital and medmal care.-.-.- General hospital and medmal care.-.-.- Defense Department hospital and med- Defense Department hospital and med-
4,639 5 4,639 5
ical care (mcludine mihtarv deuend- ical care (including military depend- ents)‘----:--------~.--.-..-~__-I-.---- ents)‘__-______________________________
Maternal and child health servwes------ Maternal and child health services------ 2,468 0
455 3 School health ___________________________ School health ___________________________ 300 0 Other pubhc health activities ___________ Other pubhc health activities ___________ Veterans’ hospital and medlcal care de--- Veterans’ hospital and medical care de---
1,684 7 3
Medical vocational rehabilitation.--.-.. Medical vocational rehabilitation.--.-.. 2,587
175 0 Office of Economx Ouoortumtv ________ Office of Economx Opportunity ________ -_ 152 4
Federal _____________________________ 21,792 9 Federal _____________________________ 21,792 9
Health insurance for the aged 11_________ Health insurance for the aged 11_________ Workmen’s compensation (medmal Workmen’s compensation (medmal
9,478 8 9,478 8
benefits) ______________________________ benefits) ______________________________ 32 3 32 3 Pubhc assistance (vendor medxal Pubhc assistance (vendor medxal
payments)l___________________________ 4,99: ; payments)l___________________________ 4,99: ; General hospital and medical care.-.-.-. General hospital and medical care.-.-.-. Defense Department hos Defense Department hos
P P ltal and med- ltal and med-
ical care (including mi itary depend- ical care (including mi itary depend- ents)‘-..--------------.--------------- ents)‘-..--------------.--------------- 2,468 0 2,468 0
Maternal and child health services-..--. Maternal and child health services-..--. 221 0 221 0 Other public health actwlties..-... _ ____ Other public health actwlties..-... _ ____ 911 0 911 0 Veterans’ hospital and medical care (---- Veterans’ hospital and medical care (---- 2,587 3 2,587 3 MedIcal vocational rehabilitation---...- MedIcal vocational rehabilitation---...- 140 0 140 0 Office of Economic Opportunity ________ Office of Economic Opportunity ________ 152 4 152 4
State and local ______________________ State and local ______________________ 10,740 5 10,740 5
Temporary disabihty insurance (medi- cal benefitsI _____________ _ ____________
Workmen’s compensatron (medical benefitsY. ____________________________
Pubho assistance (vendor medical payments)2 ________ :__________ _ _______
General hospital and medlcal care-..-... Maternal and child health services-..... Sohoolhealth-.-_-.......-.----~-------- Other pubhc health activities. __________ Medical vocational rehabllitatlon--.....
I .8,899 9 53,932 6
6,7871- 2,015 7
507 15 5
662 4 559 7
3,397 6 994 4 4,551 1 85
1,548 0 159 7 686 41 8
_ _ - - - _ _ _ , _ - - _ _ _ _ _ _ .i-isli- - _ - - - - - - -
’ 67 2 21 6 91 0
.-__- ---- 74 7 -- 12,751 1 2,933 4 -- 6,787 1 2,015 7
21 0 81
1,824 0 542 9 716 3 85
1,548 0 159 7 336 294
.i-j6j‘3‘ _------_-
‘538 21 6 72 8
. _ - - - - - - _ 74 7 -- 6,148 8 1,049 2
--
1,573 4 451 6 3,834 8 ____-____
35 1 12 4 _-_--------------- ----ii‘i- _-----_--
18 2
1973
$311 0 $324 6 $670 6 $80 2 $3,263 5 $1,634 7 $2,440 1 $876 4 -~~~~~-- - _ _ _ _ - - - - 83 3 _____-____ -_______-- 154 0 __--_____- -_-_---___ 438 7
.--___---- 40 4 26 3 26 3 _ _________ __________ ____a_____ __________
210 3 134 1 608 9 __________ 3m2 0 ---------- 470 2 391 3 2 2 -_ __- -- - -- 1 3 ____ _-___ _ ___ _-_ ____ --_ _-___- - __ 76 4 __________
25 6 __________ 6 4 _ _______ __ __________ __ ___ __ _ __ 708 0 10 1 33 7 98 13 3 __-------_ -----___-- 277 9 ______ “?
._---_-----_---------------_-- -_____-----_-------- -_-__-__-- 300 0 _--___ ___ -
._--__---- ___------- ----__-_-- ___------- _--------- 55 2 __________ 49 230
1.684 7 ____ jsi-f _--__-___- 107 5 -_______-- 26 1
.-----i-s- ‘----ii‘o- ---------- 16 9 __________ __________ __________ __________ 12 2 __________ __--___--- -__------- 25 9 __________
----GE- ---p-p
212 3 365 3 45 2 1,896 3 911 0 1,763 0 699 6 ~~-_L_--
- 83 -- - -- -- _ _- -_-_------ .________- 154 0 _______-_- __________ 438 7
.--____--- 19 6 6 _ _ _ _ _ _ _ _ _ _ _ _ _ _ _ _ _ _ _ _ _ _ _ _ _ _ - _ _ _ _. _ _ _ _ _ _ _ _
114 8 73 2 33! $ _____-___- 1.634 8 -----__--- ?? ? 214 5 2 2 -__---- -- - ,.C ,? I I
1 3 --__-_---- 76 4 _________*
” 4
’ _____-_--_ I __-____-_-
____-_--_ __-__-_-_- -___--_--- 708 0 8 1 __ -_- ___-- - -- _ _ - _ - - - 110 2 _----- “.”
- - - _ - - - 911 0 ____------ _________- 107 5 -__-__-_-- 581 7 26 1
z; j: --_------- 0 4 - 25 3 75
.____-_--- -___------ ---‘--~-F -__-_-_--- -__ 55 2 _-__-----_ 23 0
._____---- “---3~~ _--------- 13 5 -__ 76 s 12 2 __________ ___
-----P-w 98 8 108 9 305 2 34 9 1,367 2 1 773 7 1 677 2 )
-----P-w 176 8
-----__--- _--____--- 3: i 25 ::
7 - _ _ _ - _ _ _ _ _ - - _ - _ _ - _ - - - - _ _ _ - - - - - - - - - - - - - - - 25 7 _____ _____ __________ __________ __________
05 5 609 276 5 __________ 1,367 2 __________ 209 5 176 8 .--__-.--- ____._____ _--_--__-- _--___---_ --_------- __-_______ -____--_-_ -_----____
33 a4 23 5 1 ___----_-- ------__-- 167 7 __________ __________ ____-_____ __-______- ______-__- ___----_-- -------_-- 300 0 _-----__-- -_--__---_ ___----_-- -------__- --____-_------------ 773 7 ______-_-- __---___-- -____----_-__--_-___ _------__- 3 4 __-_ -__ ___ ----_ __- -- ---__----- - - -- --- - - -
See footnotes at end of table
ment and drugs, as well as improved treatment procedures, are often costly. For many diagnoses, the course of treatment followed today does not resemble that followed a decade ago, or even 5 years ago.
In addition to price increases and technological change, aggregate spending levels are influenced by population growth and by changes in per capita utilization resulting from changes in both demand and supply factors. Although per capita expenditures eliminate the effect, of population growth, health expenditures still registered sub- stantial increases from 1965 to 1974. During this period, per capita expenditures rose from $198 to $485, an average annual increase of 10.5 per-
cent. Since this increase is only slightly less than the 11.6-percent annual rate for aggregate ex- penditures, it appears that population growth has had relatively little effect on aggregate ex- penditures. In general, with the decline in the population growth rate in the late 1960’s and the 1970’s, the efl’ect of rising population on the in- creases in health expenditures has continued to dwindle.
If the effect of inflation could also be elimi- nated, one could determine the “real” increase in health spending-that is, the increase in ex- penditures that results from more utilization and higher quality of care. This type of analysis -is difficult to undertake. At present, no one measure
BULLETIN, FEBRUARY 1975 11

TABLE 3.-Expenditures for health services and supplies under pubhc programs, by program, type of expenditure, and source of funds, fiscal years 197%7&-Contznued
[In millions]
Program and source of funds IIospita1 ‘Fn;?-
Eye- Den- %?%’
Total care tists’ Other pro. Drugs fesshal and drug
g;ws;s Nbuo’sn-
services services services sundries apph- care E:%t mlces activities
1972
b29,em 8 Total _____________________________ ! Total _____________________________ $29,681 8
IIealth insurance for the aged 1 t ________ Health insurance for the aged ’ ’ ________ Temporary dlsabihty insurance (medi- Temporary dlsabihty insurance (medi-
8,819 2
cal benefit?.)‘__________________________ cal benefit?.)‘__________________________ 68 3 Workmen’s comoensatlon (medical Workmen’s compensation (medical
b.enefltsY _______ I ____________. _________ benefltsjs _____________________________ Public ssslstance (vendor medical Public assistance (vendor medical
1,180 0
payments)” ____________ _ ______________ payments)” ____________ _ ______________ General hospital and medical care-.-.-.. General hospital and medical care-.-.-..
7,751 6
Defense Department hospital and med- Defense Department hospital and med- 4,211 7
ical care (includmg mihtary depend- ical care (includmg mihtary depend- ents ‘-_--_----_----------------------- ents ‘-_--_----_-----------------------
Maternal and child health services....-- Maternal and child health services....-- 2,341 0
495 3
8,819 2
683
1,130 0
7,751 6 4,211 7
2,341 0 495 3 281 3
1,922 7 2,255 6
179 2 155 9
School health. ___________ _ ______________ School health. ___________ _ ______________ 281 3 Other pubhc health activities. __________ Other pubhc health activities. __________ Veterans’ hospltal and medlcal care (m--V Veterans’ hospltal and medlcal care (m--V
1,922 7
Medxal vocational rehablhtatlon....... Medxal vocational rehablhtatlon....... 2,255 6
179 2 Office of Economic Opportunity ________ Office of Economic Opportumty ________ 155 9
Federal.....-..-.-.-.---------------- Federal.....-..-.-.-...-............ 19,754 6 19,754 6
Health insurance for the aged * f- __ _____ Health insurance for the aged 1 f ________ Workmen’s compensation (medical Workmen’s compensation (medlcal
8.819 2 8.819 2
benefits).-.---.-_--------------------- benefits).-.---.-_--------------------- 26 9 26 9 Public assistance (vendor medical Public assistance (vendor medlcal
paymentsP-.-. ____________________ ___ payments)“-.-. ____________________ ___ General hospital and medlcal care-----.- General hospital and medlcal care-----.-
4,166 2 4,166 2 619 3 619 3
Defense Department hospital and med- Defense Department hospital and med- ical care (mcludmg mihtary depecd- ical care (mcludmg mihtary depecd- ents)‘--.......-.--.--------------.---- ents)‘--.......-.--.--------------.----
hlaternal and chdd health servxes-..... hlaternal and chdd health servxes-..... 2,341 0
259 0 Other pubhc health activities ___________ Other pubhc health activities ___________ Veterans’ hospitnl and medlcal care I.--- Veterans’ hospitnl and medlcal care I.--- Medxal vocational rehabllltation--.-... Medxal vocational rehabllltation--.-...
2.g i
Office of Economic Opportunity ________ Office of Economic Opportunity ________ 155 9
State and local ______________________ State and local ______________________ 9.907 3
2,341 0 259 0 9680
2,255 6 143 4 155 9
9.907 3 A
Temporary disability insurance (medl- cal benefits)s __________________________ 68 3
Workmen’s compensation (medxal benefitsI .____________________________ 1.153 1
Public assistance (vendor medlcal paymentS)z. __________________________ 3,585 4
General hospital and medlcal care..--.-- Maternal and child health servxes..-.--
3,592 4 236 3
School health.. _________________________ 281 3 Other pubhc health activities ______ _____ 954 7 Medical vocatIona rehabilitation.....-_ 35 8
17,577 5
6,215 1
504
594 1
3,363 8 4.141 8
1,476 0 74 2
_---- --_. -i-ssi‘i
* 70 0 ----- --_,
11,750 9
6,215 1
17 6
1,806 0 549 4
2,707 9
1.904 5
67
449 5 74
1,476 0 138 0 38 8 34 0
- - - - - - - _ - _ _ _ - - - -. 1,592 1 18 4
560 73 0 _ _ _ _ _ _ _ _ 76 4
5,826 7 929 6
604 15 4
676 6
1.557 9 3,592 4
35 4
495 8
387 7 _ _ _ - _ - - -.
12 5
$3,637 5
1,904 5
15 4
542 5
837 2 74
138 0 46 5
_--__-- -. _--_--- -.
18 4 91 2 76 4
-
_- _. -. -.
_. -, _.
_- _-
-. _.
_- _- -, -,
_. . -, -. -.
-
$276 6 1 $252 2 1 $613 2
. - - - - _ _ _ _ 76 6 _________
._-__-_ -_ 11 7
.____-- -- 36 2 236
187 9 67 8 654 7 1 7 __--_-____ 13
19 7 ____------ 11 5 37 8 1: ::
.__-____-__-____--- _________
.-_-___-_ _____----_ ____--___ 47 9 __-____--- 41
______-_-______--_- _________ 78 32 7 12 5
-~- 186 2 176 6 329 9
--- ___-_-- -_ 76 6 _________
__--_-- -- 16 6
loo 9 36 4 297 8 1 7 ___ __ _-_ __ I3
19 7 __--____-_ 82 29 3 El
__--_---____--_---- _-_-__-_- 47 9 _____--_-_ 41
-----j-~- ____---_-- _________ 32 7 12 5
-~.- 903 75 6 233 3
---
_ _ _ _ _ _ _ - _ 11 7
___-___ -_ 346 231
87 0 31 4 256 9
.__-___-_ __-__-____ ---__-_-_ .-------_ __-_---_-- -_-- -----, I I .-_-----_ -_-----_-- ____----_, 1. Includes premmm payments for supplementary medlcal insurance by or
in behalf of enrollees 1 Includes duphcatlon in the Medicare and Medicaid amounts where
premmm payments for MedIcare are financed by Medicaid for cash assist- ante reclplents and, m some States, for the medIcally mdlgent
s Includes medical benefits paid under pubhc law by prwate insurance
(or set of measures) of pure inflation exists that could be appropriately applied to the variety of expenditure categories.
The medical care component of the CPI has been used frequently in the past to convert per capita personal health expenditures from current dollars to constant dollars. This component, al- though useful as a general measure of price infla- tion for a group of standard health services, cannot appropriately be used to deflate total expenditures for personal health care. The serv- ices priced by the Bureau of Labor Statistics
12
-
-- - -.
-_ -_
_. - -_ - -_
-_ -- -- - -_
__ -_
-_ _ -_
__ -- --
_- - -- . -_ . ._
-
$76 7
,____ -_-. 7
236
$2,465 2 $1,922 7 $2,059 6 $789 6 --___-
168 0 --________ ---_____-- 455 0
_______-- -_____-_-_ -----_--_- ..----eee__
,__-_-- -. 2.206 2 __________ 237 6 296 3 _ - - _ _ - - _____---- ---_-__--- 69 4 __________
.____--- 14 6
- _ _ - _ - -.
“-‘iFi 18 1
- - _ - - _ _.
44 1
______ _.
.6
___------ ---_-----_ 686 4 15 8 -__---_-- ---_------ 299 5 --__--__-_ ________- --__------ 281 3 _ _________ _ _ _ _ _ - _ - - 1,922 7 __________ _---______
91 0 ------_-__ 459 9 225 _--_____- ---__-_-__ ‘--‘-is-s- :---‘---‘- _--____-- _-----__-_ ---______ ----
1,443 5 968 0 1,490 4 656 9 ----
168 0 -______-__ __-____-_- 455 0
---------,----------,----------I----------
1,184 5 __________ 127 5 163 6 --------- --____---- 69 4 -_--____ “_
- _ _ _ _ _ _, 94
_ _ _ _ _ _ -, 19 7 14 6
- _ - _ _ _ -.
32 6
________- ----______ 686 4 15 8 -______-- --_-__-___ 130 7 ----_--__- . _ _ _ _ _ _ - - 968 0 ---_____-- ----_____-
91 0 ------__-_ 459 9 226 _-_--_-__ __________ _--_______ ---_______ -_-____-_ ---__-___- 26 6 __________
7
23 1
__-_---.
----i-ii
___---_-_ I---- - _ _ _- -, - --_ --- --, - - - - _ - _ _ _ _ 1,021 8 __________ 110 0 132 7
_____--__ -_________ _*________ -__----___ _-_------ --__-_---w 168 8 __________ _-_-----_ .-me__---* 281 3 ----__--__ _-_____ -- 954 7 -_-_____-_ ----_-___- ._______. -_________ _____________-_____-
carriers and self-insurers 4 Payments for services outside the hospital (excluding”other health serv-
ices”) represent only those made under contract medlcal care programs 5 Beginning m 1974, data not separable from total education expendlturea 6 Beginning in 1974, included with “other public health activities ”
that make up the medical care component repre- sent only a portion of the total services for which expenditures are made. Nursing-home care and private-duty nursing, for example, are not priced at all. In addition, the weights assigned to each component of the index (such as hospital service charges, physicians’ fees, etc.) differ from the relative weights of each expenditure category. To illustrate, hospital service charges are assigned a weight of about 27 percent in the medical care index, yet hospital care expenditures account for 45 percent of personal health spending.
SOCIAL SECURITY
THIRD-PARTY PAYMENTS
Benefit payments under all types of private health insurance plans jumped 12.5 percent to exceed $23 billion in 19’74.6 The amounts paid in benefits by private insurers, including the Blue Cross-Blue Shield associations, commercial in- surance companies, and independent plans, have more than doubled since 1968. This rapid growth, when combined with increased government spend- ing, has served to gradually reduce the proportion of health expenditures met directly by consumers.
As table 5 and chart 2 illustrate, health insur- ance benefits have a differing impact by type of service. More than 60 percent of all benefits went for hospital care, the most commonly covered
“For detailed data on private health insurance enroll- ment and finances, see Marjorie Smith Mueller, “Private Health Insurance in 1973: A Review of Coverage, En- rollment, and Financial Experience,” pages 2140 in this issue of the Bulletin.
medical expense. Thirty-one percent of the bene- fits financed physicians’ services, and much of this expenditure was related to surgical services.
Minimal coverage was extended for other types of medical care not associated with hospitaliza- tion. Out of every $10 spent for dental care and drugs, only 68 cent)s was reimbursed under private insurance plans. Benefit, expenditures for the re- maining types of care-including private-duty nursing, vision care, nursing-home care, and other health services-were insignificant, compared with total spending for these items.
Third-party payments include all spending by private health insurance, government, philan- thropy, and industry. The third-party contribu- tion to personal health care financing has become increasingly significant in recent years.7 In 1967,
’ Personal health care includes all services and supplies of direct benefit to the individual, such as hospital care, drugs, etc. A precise definition is provided in table 6.
TABLE 4.-Aggregate and per capita national health expenditures, by type of expenditure, selected fiscal years, 1929-74
pn millions]
Type of expenditure 1929 1 1935 1 1946 1 1950 1 1955 1 1960 1 1965 1 1966 1 1867 ] I.968 1 1969 1 1970 1 1971 1 1972 1 1973 1 1974
Aggregate amount (in millions)
Total __________________________ I I I I I I I I I I I I I I I I $33.589 $2,846 $3,883 $12.027 $17.330 $25,856 $38,892 $42,109 $47,879 $53,766 $60,617 $69,202 $77.162 $86,391 $94,235 $104,239 l-l-
Health services and supplies _______ Hospital care.......-------------
3,382 651
Physicians’ services _____________ Dentists’ services ______________ __ E Other professional services _______ 248 Drugs and drug sundries ________ EYeglaSSeS and annliances. ______ ii: Nursing-home csii. __ __ _ ____ _ __ _ Expenses for prepayment and
_____ i. .
administration ______________ 101 Qovermnent public health
activities. ___________________ 89 Other health services ____________ 90
2,788 731 744
E 471 128
,_____-
91
112 63
-. 3,729
969
2; 173 624 180
28
161
155 92
11.181 3.698 “S&
384 1,642
::i
-. ‘pg
3:632 1,457
552
“~~~ 291
605
-. 24,162
8,499 5,580
‘*% 3,591
E
807
1.22
35,664 13,152
8.405 2,728
989
?% 1:271
38,661 1;,:2$
2:866 1,140
?E 1:407
44,343 16,921 y;
1:139 5,480 1,514 1.751
49,802 19,384 10,734 3,518 1,217 5,865 1.665 2,380
y;; 11:842 3,926 1,298 6,482 1.743 3,057
64.06511,762 25,879 29.133 y;; lj*oQ&?
1:385 I:509 7,114 7,626 1,776 1,810 3.818 4,890
3E 16:431
5.342 1,634
i!*E 5:860
2,115 2,405 3,181
1,437 1,698 1,923 2,625 2,685 3.051
A 87,805 36.174 17,518
5,767 1,803 8,942 1,985 6,650
4,224
2.126 3,445
Research and medical-facilities
I
. . . . 8.. I 81 I I I I ,
Per capita amount 1
Total __________________________ $29.16 $22.04 $28.83 $78.35 $103 76 $141.63 $197.75 $211.56 $237.93 $264.37 8295.20 $333.57 $368.25 $408 31 3441.94 $485.36 -----------------
Health services and supplies _______ Hospitslcere.................... 27.33 72.83 98.14 132 35 181.34 194 24 220.36 244.88 30 Physicians’ services ____________.
7 23 24.09 34.06 46.56 66 87 71.57 84.09 95 31 274 108.87 308.81 124.74 342.48 139.03 379 154.64 23 411.78 452.51
Dentists’ services ________________ 21.75 30 57 42.74 44.54 48.39 52.78 169.65 190.44
57.67 64.80 72.05 77.66 82.15 88.47
Other professional services _______ Drugs and drug sundries ________ Eyeglasses and appliances _______ Nursing-home care ___.__________ Expenses for prepayment and 1.74 2.63 6.46 7.07 8.70 11.60 14.89 18.40 23.34 27.70 31.19 34 69
administration ______________ Government public health .82 .70 1.20 1.89 3.62 4 42 6.27 7.26 9.03 0.53 10.06 10.19 11.48 16.03 17.60 19.67
activities ____________________ Other health services-.. 1.16 2.28 2.30 2.19 __________
53” 2: 3.41 i% 4 39 4.92 5.82 6.93 8.10 9.09 7.96 9.90 .69 3.48 5.36 6.91 7.20 . 9.64 10.42 11.53 12.65 12.81 14.42 16.55 16.04
Research and medical-facilities construction __________________ _ Resesrch...-......-.------------ 1.68 1.00 5 62 5.62 9.28 16.41
Construction ____________________ _______ . . ..f .02 .72 1.16 3.24 7.07 17.32 7.76 17.57 7.98 19.49 8.85 20 8 89 24.76 8.96 25.77 29 02 30 lb 32.85
1.63 .45 72 8.83 Q.73 10.72 12.56 .98 4.86 4.45 6.04 9.34 9 56 9.59 10.64 12 18 lb.86 16.94 19.29 36 19.44 20
* Based on January 1 data from the Bureau of the Census for total U 5. population (including Armed Forces and Federal civilian employees over-
BULLETIN, FEBRUARY 1975
seas and the clvilian population of outlying areas).
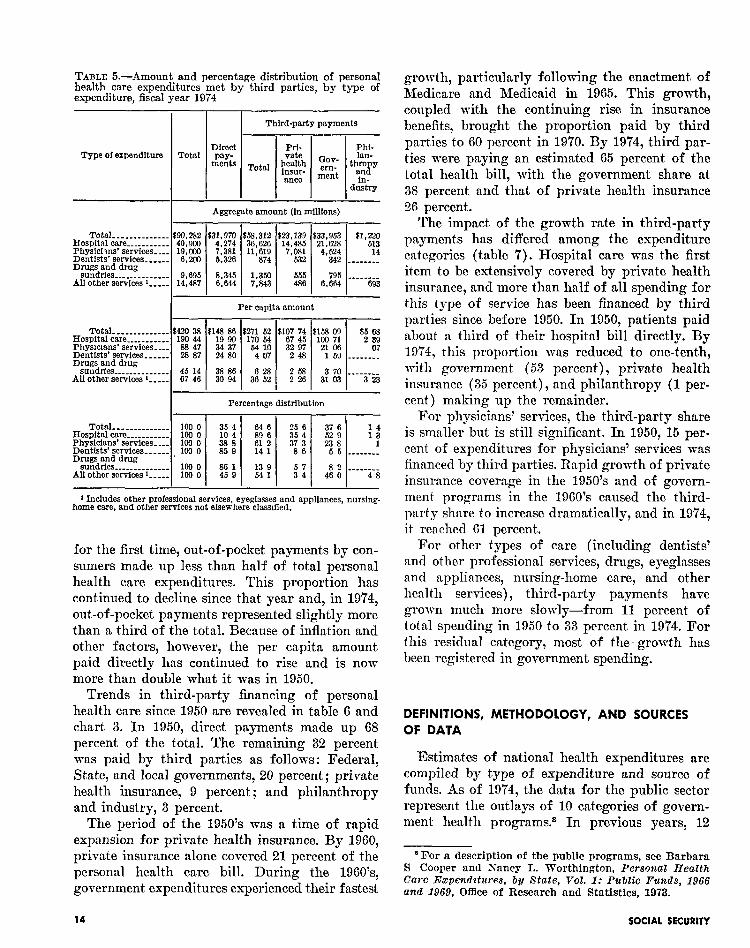
TABLE 5.-Amount and percentage distribution of personal health care expenditures met by third parties, by type of expenditure, fiscal year 1974
I I I I I I Third-party payments
Direct Type of expenditure Total
dustry
I Aggregate amount (in millions)
s&dries _____: ________ 9,695 All other services L-1 14,487 1 ::::: ( ::::: 1
Per capita amount
Total ______________ $420 38 $148 86 $271 62 $107 74 $156 09 Hospital care ___________ 190 44 19 90 170 54 67 45 190 71 $i ii Physxlans’ services--.. 88 47 34 37 64 10 21 06 Dentists’ services..-... 28 87 24 80 4 07 “i 2 1 59 . . . . ..“1 Drugs and drug
sundries ______________ 45 14 ii 2
6 28 2 68 3 70 --_ ----_ All other services ‘q-m-- 67 46 36 52 2 26 31 03 3 23
Percentage distribution
I I 1 I I Total ______________ 100 0 64 6 25 6
Hospital care ___________ 100 o !Ei : 89 6 35 4 2 t :: Physicians’ servicesS..- 1W 0 61 2 37 3 23 8 Dentists’ services ______ , 100 0
% 141 86 5 5 _______ _’
Drugs and drug sundries ______________ 100 0 86 1 13 9
3”: 8 2 --_----_
AU other services I----- 100 0 459 541 46 0 48
1 Includes other professional services, eyeglasses and appliances, nursing- home cam, and other services not elsewhere clas.s~fled.
for the first time, out-of-pocket payments by con- sumers made up less than half of total personal health care expenditures. This proportion has continued to decline since that year and, in 1974, out-of-pocket payments represented slightly more than a third of the total. Because of inflation and other factors, however, the per capita amount paid directly has continued to rise and is nom more than double what it was in 1950.
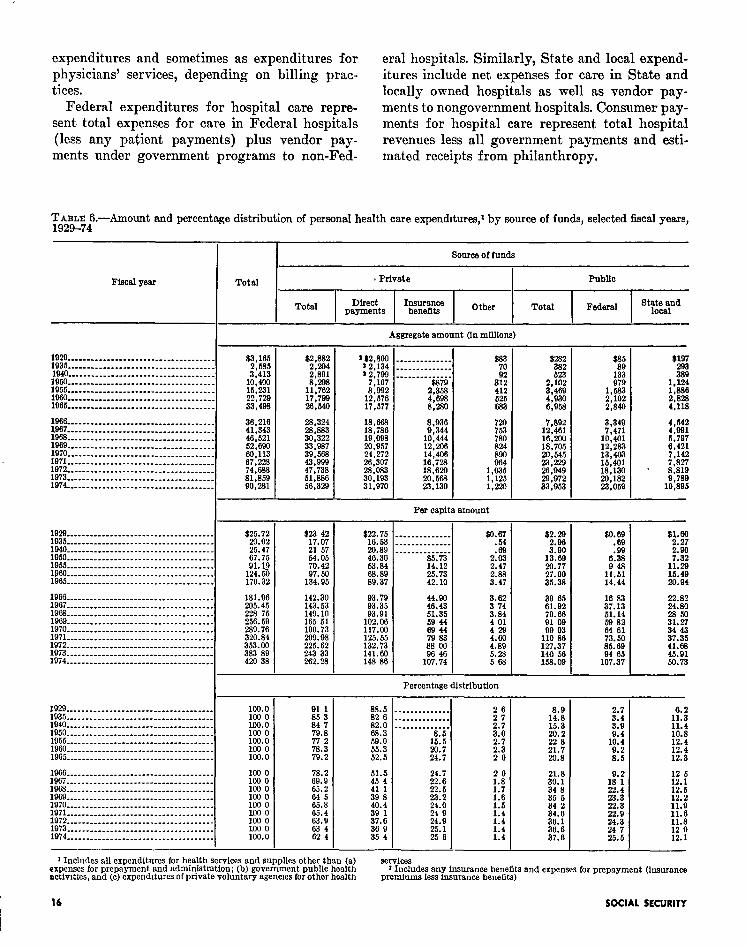
Trends in third-party financing of personal health care since 1950 are revealed in table 6 and chart 3. In 1950, direct payment,s made up 68 percent of the total. The remaining 32 percent was paid by third parties as follows: Federal, State, and local governments, 20 percent; private health insurance, 9 percent; and philanthropy and industry, 3 percent.
The period of the 1950’s was a time of rapid expansion for private health insurance. By 1960, private insurance alone covered 21 percent of the personal health care bill. During the 1960’s, government expenditures experienced their fastest
growth, particularly following the enactment of Medicare and Medicaid in 1965. This growth, coupled with the continuing rise in insurance benefits, brought the proportion paid by third parties to 60 percent in 1970. By 1974, third par- ties were paying an estimated 65 percent of the total health bill, with the government share at 38 percent and that of private health insurance 26 percent.
The impact of the groath rate in third-party payments has differed among the expenditure categories (table 7). Hospital care mas the first item to be extensively covered by private health insurance, and more than half of all spending for this type of service has been financed by third parties since before 1950. In 1950, patients paid about a third of their hospital bill directly. By 1974, this proportion was reduced to one-tenth, with government (53 percent), private health insurance (35 percent), and philanthropy (1 per- cent) making up the remainder.
For physicians’ services, the third-party share is smaller but is still significant. In 1950, 15 per- cent of expenditures for physicians’ services was financed by third parties. Rapid growth of private insurance coverage in the 1950’s and of govern- ment programs in the 1960’s caused the third- party share to increase dramatically, and in 1974, it reached 61 percent.
For other types of care (including dentists’ and other professional services, drugs, eyeglasses an d appliances, nursing-home care, and other health services), third-party payments have grown much more slowly-from 11 percent of total spending in 1950 to 33 percent in 1974. For this residual category, most of the- growth has been registered in government spending.
DEFINITIONS, METHODOLOGY, AND SOURCES OF DATA
Estimates of national health expenditures are compiled by type of expenditure and source of funds. As of 1974, the data for the public sector represent the outlays of 10 categories of govern- ment health programs.* In previous years, 12
‘For a description of the public programs, see Barbara S Cooper and Ir’ancy 1,. Worthington, Personal Health Cure Eapendztwes, by State, Vol. 1: Public Funds, 1966 and 1969, Office of Research and Statistics, 1973.
14 SOCIAL SECURITY

&ART 2 -Percentage distribution of per capita personal health care expendtitures, by tme of expenditure and sour of funds, fiscal year 19’74
i
Public
$88
52 9% H THIRD-
\ Prwate health IIIIIII msurance 35 44
IIIIIII
$67
re
4%
Hospital Physmans’ care services
such categories were shown, but for two of these categories-school health and Office of Economic Opportunity-data are no longer shown sepa- rately. For several Federal health programs, the data are taken from the Office of Management and Budget special analysis of health programaD For the remainder, the data are supplied by the various agencies.
In the private sector, the data are estimated first on a calendar-year basis by type of expendi- ture and are then converted to fiscal-year figures on the basis of price and utilization change dur- ing G-month periods. The general method is to estimate the total outlays for each type of medi- cal service or expenditure and then to deduct the amounts paid to public and private hospitals, physicians in private practice, etc., under the public programs reported in the social welfare expenditure series. The fiscal-year figures for each public program are allocated by type of expendi- ture on the basis of published and unpublished reports for each program. In general, the con- sumer expenditures are residual amounts, derived
’ See “Special Analysis J * Federal Health Programs,” Special Analyses, Budget of thp Unztcd States Govem- ment, FiscaE Pear 1975, Office of Management and Budget, 1974.
BULLETIN, FEBRUARY 1975
Dentists’ Drugs and servlces drug sundrles
All other services
by deducting philanthropic and government ex- penditures from the tot,al spent. for each type of service.
Hospital Care
The estimates of expenditures for hospital care are derived chiefly from American Hospital As- sociation data on hospital finances, incre.ased slightly to allow for osteopathic hospitals. Ex- penditures for the education and training of physicians and other health personnel are in- cluded only where they are not separable from the costs of hospital operations.
Expenditures by the Veterans Administration and the Department of Defense for physicians’ services (except under contract medical care prd- grams) are included as part of hospital care
expenditures. Services of salaried physicians in psychiatric, tuberculosis, and general hospitals- whether public or private-are part of hospital care, but self -employed physicians’ services in hospitals are not counted as hospital expenditures. The costs of drugs used in hospitals are also included with hospital care. Anesthesia and X-ray services are sometimes classified as hospital care
15
expenditures and sometimes as expenditures for era1 hospitals. Similarly, State and local expend- physicians’ services, depending on billing prac- itures include net expenses for care in State and tices. locally owned hospitals as well as vendor pay-
Federal expenditures for hospital care repre- ments to nongovernment hospitals. Consumer pay- sent total expenses for care in Federal hospitals ments for hospital care represent total hospital (less any patient payments) plus vendor pay- revenues less all government payments and esti- ments under government programs to non-Fed- mated receipts from philanthropy.
$.2.;f3.-Amount and percentage distribution of personal health care expenditures,* by source of funds, selected fiscal years,
Souroa of funds
Fiscal year Total
Total
b Private
Direct payments I%EE Other
PubUc
Total
I
Federal St;te~d
Aggregate amount (in mIllions)
1929 --.--- .-- _____ ___ __ ____-___ _______ __ _ ~~3~-------------------------------.-----
$3 ( 16.5 2,585
_____--_____---_____-.--------------- 3,413 ;;w&. ~--~--~~~~~~~~~~-~~~~~ * _____________ 10,4Q3
_____--______________________________
:~:::::::::::::::::::::::::::::::::::~:
15.231 22,729 33,498
lBBB.........-.-.-......................- 1967 ------.-__-__________________________ 23”:: 1969.~. --- --- - - _- -_-_- _ _ _ _- -_-__ _ -- _- _ __ _ 1969 ______ __ _ __ __ ____ ___ _ _ _ ___ __ _ _ _ ___ _ _ _
4s:Em
1970...---..........----------------.---- 52,680
1971____________________-------.-.------- E48" 1972 -_-----_---_------------------------- :;;"4- -~~~‘------ ** ___- * _-__---____
74:68a
1929 _____ _ __ ___ ____ _ ____ _ _ _ __ __ __________ 1935 ____-- -_ _ __ ___-- _ - - - - __ _ _ _ __ __ _ __ __- -
“2$;;
1940....-.....-.....-.------------------- 25147 1950.- - _ - - _ _ _ _ _ _ - - - _ _ - - - - _ _ _ _ _ _ _ - _ _ _ _ - _ - 67.75 1955-.-..-.-..-.........................- 1
1 60 ___----_____-_-__-_____ __.___________
9l.u 124.50
1 65 -_----_-______-____-- ________-_______ 170.32
1966-..-...-..-..-......................- 1967..-.--.--.-..-..--------.------~----- %Z 1968..-..-.-----..-----------------~----- 228'75 lB69... _ _-- ____ _____--___ __ _ -- _. _ _ _. _ __ _ _ 256.59 1970 -_____-___-_-__-_-__- -__ _ - _- _ _ _ _ _. _ _ _ 289.76 1971-.......---..----------------------~- 320.84 1972.......--_-.------------------------- 1973 __________________ __ _ __ _ _ _ _ _ _ _ _ _ _ ___ _ EE 1974 ~~~~~~-~-----~--~ -----_ _ __. _. _ __ _ _ _ _ _ 420 38
1929 ____ ________________-___ _-_ -_ - __ _. __ - 100.0 y&--. - - - _ - _ - - _ -- - - - - - - -_ - - - - - - - - _ _ _ - _ - 106 0
___---_.___-__----------------------- loo.0 1950 _____..______________________________ loo 0 1955 -___- _ ____.__--_------__------------- 100.0 1960 _______.___._.____-_----------------- 1965 _____________________________________ :EE
X166... _ _ _ _ __ __ _ _ __ _______ _______________ 100 0 1967... . - _. - _- - _ _ _ _ __- -- -- --_--- - _- -_____ loo 0 1968 _-______- _ _--___________-_-_-________ 100 0 1969 _____________ _ _______________________ 100 0 1970 -__--_-_____-____-_____ _____ __-_- _-_- 100 0 1971____________________________ _ ________ loo 0 1972 _____________________________________ 100 0 1973 _____________________________________ 100 0 1974.....-..--......-----.---~----*------ 100.0
-
[
-
-
-
3;,8$3:
2:BBl
z.324 30:322 33,987
xi? 47:738 61,686 56,329
$E if 21'57
Ki 97:50
134.95
142.30 143.53 149.10
% ill XJB:OB 225.62
;:"2.z
91 1 85 3 84 7
:z 78.3 79.2
78.2 69.9 65.2 64 5 65.8 65.4 63.9 63 4 62 4
'$2,8W _-___________. ;",.;g --_-----* * ___.
7:107 .-_-_-e--v---~ $879
8,992 12,576 2% 17,577 a:280
18,668 18,786 ix! 19,098 10:444 20,957 12,206 24,272 14,406 26,307 28.083 30,193 31.970
3;;.;;
2O:SB 46.30 63.84 68.89 89.37
.-__ _ -____ __
ii*:: 93:91
::-z cd:35
lOZ.c+3 69 44 117.00 69 44 125.55 79 83 132.73 88 00 141.60 96 46 148 86 107.74
88.5 82 6
61.5
:: : 39 8
Per capita amount
Percentage distribution
7,892 12,461 16,200 18,705 20,545
1G 29:972 33,953
12 15:3 20.2 22 8 21.7 20.8
21.8 30.1
it i 34 2
- %
10:401
:EJi l&O1 18.130 20,182 23.059
?2 .9-a Ez
11.51 14.44
-
- -
1 -
I
‘I& 389
:*i% 2:SS 4,118
:% a:797 6,421 7,142 7,827
"8% 1O:BQb
‘21:: t%
Ilk9 15.48 20.94
22.82 24.80
$.i
1:.i 11:4 10.8
:t: 12:3
12 6
El 12:2 1l.Q 11.6 11.8
:i.i
1 Includes all expenditures for health services and supplies other than (a) services expenses for prepayment and administration; (b) government public health activrties, and (c) expenditures of private voluntary agencies for other health
’ Includes any insurance benefits and expenses for prepayment (insurance premiums less insurance benefits)
16 SOCIAL SECURITY

CHAET 3.-Distribution of personal health care expenditures, by source of funds, selected fiscal years, 1950-74
Public
THIRD- Philanthropy ’ I’ PARTY and Industry
PAYMENTS Prrvate health insurance
DIRECT PAYMENTS
Services of Physicians and Other Health Professionals
Estimated expenditures for the services of physicians and dentists in private practice are based on the gross incomes from self-employment practice reported by physicians and dentists to the Internal Revenue Service (and shown in its report, Statistics of Income-Business Income Tax Return). Gross receipts are totaled for practitioners in sole proprietorships and partner- ships. The total also includes the estimated gross income of corporate offices, that portion of gross receipts of medical laboratories estimated to rep- resent patient payments, and the estimated ex- penses of group-practice prepayment plans in providing physicians’ services (to the extent that these are not included in physicians’ income from self-employment), as well as those of group- practice dental clinics. Estimated receipts of physicians for life insurance -examinations are deducted.
The salaries of physicians and dentists on the staffs of hospitals and hospital outpatient facili- ties are considered a component of hospital care. The salaries of physicians and dentists serving in field services of the Armed Forces are included in “other health services.” Where they can be separated, expenditures for the education and training of medical personnel are considered as expenditures for education and are excluded from health expenditures.
The Internal Revenue Service also provides data on the income of other health professionals in private practice. Estimated salaries of visiting nurses are added to the private income of other health professionals. Deductions and exclusions are made in the same manner as for expenditures for physicians’ and dentists’ services.
Drugs, Drug Sundries, Eyeglasses, and Appliances
The gross receipts of physicians and dentists Expenditures in these categories include only represent total expenditures for these services. the spending for outpatient drugs and appliances Consumer payments are estimated by deducting and exclude those provided to inpatients. The vendor payments under government programs basic source of the est,imates for drugs and drug and estimated payments to physicians and den- sundries and for eyeglasses and appliances is tists from philanthropic agencies. the report of personal consumption expenditures
BULLETIN, FEBRUARY 1975 17
Fiscal years
1970 1974

in the Department of Commerce national income accounts in the Survey of Current Business. To estimate the consumer portion, workmen’s com- pensation payments are subtracted.’ The Depart- ment of Commerce counts this expenditure as a consumer expenditure, but the Office of Research and Statistics considers it an expenditure of government. Total expenditures for drugs and appliances represent t,he sum of these consumer expenditure estimates and the expenditures under all public programs for these products.
tures for providing such services in the case of. organizations that directly provide services). In ot,her words, it is the amount retained by health insurance organizations for operating expenses, additions to reserves, and profits. It is considered a consumer expenditure.
Data on the financial experience of health in- surance organizations are reported annually by the Office of Research and Statistics in an article on private health insurance also appearing in the February BULLETIN.
The administration component represents the
Nursing-Home Care
Expenditures for nursing-home care encom- pass spending by both private and public sources in all facilities providing some level of nursing care. Included are all nursing homes certified by Medicare and/or Medicaid as skilled-nursing fa- cilities and those certified by Medicaid as inter- mediate-care facilities and all other homes pro- viding some level of nursing care even though they are not certified under either program.
TABLE 7.-Amount and percentage distribution of personal health care expenditures, by type of expenditure and source of funds, selected fiscal years, 1950-74
Type of expenditure and
fiscal year Total
Source of funds
m
-- Aggregate amount (in millions)
Expenditure estimates are based on periodic surveys of nursing homes conducted by the Na- tional Center for Health Statistics of the De- partment of Health, Education, and Welfare. The estimates for total expenditures are derived from survey data on utilization and charges for a total universe of nursing-care homes and per- sonal-care homes with nursing, as defined by the Center.lO Estimates for intervening years (for which no data are available) are based on avail- able economic and other indicators.
Hospital care 1050 _-_________ 1955 -----__-- _- 1960 ___________ 1965 -----___-_-
“:Jii 1:5s3 2,434
$610 1,560 % 3,124 224 6,488 300
1966 ___________ 1967 --______-__ 1968 ___________ 1969. __________. 1970 _________ __. 1971___________. 1972 ______ _____. 1973 ___________. 1974 ___________.
14,245 16,921 19,384 22.356 25,879
3::: 36:174 40,900
8,840 2,628 8,484 2,084 9,030 2,009
10,503 2,313 12,727 3,174 14,006 2,962 15,142 2,955 17,274 4,013 19,272 4,274
IO:644 371
11,760 iTi 12,790 471 14,485 513
6.405 8,437
10,304 11,853 13,152 15,127 17,578 18,9CO 21,623
- Per capita amount
Consumer expenditures in nursing homes repre- sent the difference between total nursing-home expenditures and expenditures from philanthropic and government sources for services in skilled- nursing facilities and intermediate-care facilities.
Hospital care 1950 ___________, 1955 ------___-_. 1960.--em.-- 1965-T..-.--.
1966 ___________. 1967 ____________ 1968 ___________. 1969 ___________. 1970 ___________. 1971___________. 1972 ___________. 1973 -----______. 1974 ____I _-_--..
1 61 1 67 1 67
38 19 1 69 44 26 1 79 50 80 1 91 55 58 2 02 59 98 2 21 67 44 2 39
I I I I
41 93
:t ti 63 40 72 19 83 OS 88 64
loo 71
Percentage distribution
Expenses for Prepayment and Administration
Prepayment expenses represent the difference between the earned premiums or subscription income of health insurance organizations and their claims or benefit expenditures (or expendi-
Hospital cam 1950 ------___--. 1955 ___________. 1960. ___-__ _-__. 1965 ___________.
i:: : 18 6 18 5
18 4
:i : 10 4 12 3 10 2
1: Y 10 4
16 5
:i ii 41 7
45 7 45 9
E
lo For a complete definition, see .UonthZ2/ Vztal h’tatzs- tics Report, vol. 23, No. 6, Supplement, National Center for Health Statwtics, 1974, pages 11-12.
1966 -_----_____. 1967 ____________ 1968... _________ 1969 _____ _ ______ 1970. ___________ 1971_____ _ _____. 1972 ___________. lQ73...-........ 1974 ___________.
41 4
E ‘: 35 1
iti i 35 9 35 4 35 4
18 SOCIAL SECURITY

administrative expenses (where they are reported) of federally financed health programs. Such data were available for Medicare and Medicaid and for ihe Veterans Administration and Department of Defense contract medical care programs.
TABLE 7.-Amount and percentage distribution of personal health care expenditures, by type of expenditure and source of funds, selected fiscal years, 1950-74-Conlznued
6ource of funds
Type of expenditure and
fiscal year
Government Public Health Activities
The category “government public health activi- ties” is the same as the “other public health ac-
Aggregate amount (in nullionS)
-F- I All other
services ’ 1950 _--______-- 1955 _--_---_--- 1960. --_ - -- ---- 1965 --_--------
1966 ___________ 1967-s---we 1969 --_----__-- 1969 -__-_---__- 1970-----.- 1971---------_- 1972 ---_-____-- 1973 -__________ 1974 --------__-
5;.g $ 7:3Os
f “Z f:: 650 293 1,000
9,828 238 374 1,501
288 492 611 766 916
1.096 1,100 1,346 1,573
391 406
:z 509 653 697 642 693
1.889 2,609 3,540 4,180 4,462 4,804 5,733
$4 013 5’910 8: 650
%~ 7:650
11,941 10,440
:xE 16:403
x:6 12:864
18,492 14,314 20.791 16,329 22,997 18.193 2%
30: 381
21,077 19,803
22,581
TABLE ‘I.-Amount and percentage distribution of personal health care expenditures, by type of expenditure and source of funds, selected fiscal years, 1950-74-Contznued
Total
52,689 “5.63;
8:405
EE 10: 734 11.842 13,443
:2E? 17: 518 19, wo
Source of funds
P&ate) Type of expenditure and
fiscal year
Total Other 1 Publ’c Per capita amount
$i? ;i 41 90 63 08
56 36 60 01
ii “7: 78 71
ii 2 98 84
105 14
$3”: it 47 38 60 72
65 85 72 97 80 66 90 05
E :; 12; 69 132 10 141 46
$: :i “i t: 1 60 5 48 1 90 7 63
1 96 2 02 2 11 2 27 2 45 2 64
3” 8 3 23
9 49 12 96 17 41 20 36 21 51 22 93 27 10 33 25 36 32
All other services *
1x50.-.-.-.. 1955 --________- 1960 ___________ 1965 ___________
te amount (in millions)
5;‘;;; $218 7,378
%3’ ;:g
IO:512 11.8W 12.793 13,535 14,476
5;2;; $270
3:685 797
1,524 5,315 2,654
5,502 2,756 5,415 2,898 5,148 3,220
XE 6: 169 6,759
7.381 67:%
Per capita amount
$23 20 __ ______. 30 31 _____-__. 40 03 50 27 49 97 1 21
Physicians’ services
1950 _____------. 1955 __________-. 1960 ___________. 1965 ___________.
1966 ___________, 1967 ___________, 1968.. _ -- ----- - 1969 -------_--- 1970 _--------_-. ;;3; :----------.
_---------. 1973 __________- 1974------...
1966 ___________ 1967 ___________ 1968.--m..-.... 1969-s......... 1970..-...-- 1971.-.-.-.--.- 1972........... 1973 _-_---____- 1974 _-----____-
1 45 2 44
“3: 4 42 6 23 6 20 6 31 7 32
1: 598
1,415 10 2,356
1: 2,672 2,931
ii 84 78 95
ii :: 94 59
Percentage distribution
93 0 89 6 88 4 87 4
85 6
;; : 77 4
;: i 77 5 74 8 74 3
1: ,” 11 6 12 6
14 4 17 8 21 6 22 6 21 5 20 9 22 4 25 2 25 7
All other services 1
1950 ___________ 1955 ___________ 1960 ___________ 1965--v--w-
100 0 100 0 100 0 100 0
103 0 100 0 loo 0 loo 0 loo 0 100 0
:Ei i 100 0
%f 84 5 82 3
80 4 76 1 72 1
2 !: 71 9 70 9 67 8 66 9
Physiokms’ services
1950 ___________ 1955 ___________ 1960 ___________ 1965 __________-
1966 __________- 1967 ___________ 19&L-.-....-.- 1969 ___________ 1970 _---__-___- 1971_-_--_____- 1972 ___________ 1973 ____ _ __ ____ 1974 ___________
3 01 7 03
11 58 13 01 14 13 15 74 17 19 18 68 21 06
$14 85 51 76 50 05 15 49 20 18 it 3’: ii 27 02 12 99 05
2 t: :: 2 25 31
z ii :: ii 21 54
31 59 33 19 ‘,“7 ii
1966 __________- 1967--.-v..- 1968 ___________ 19RQ __-_______- 1970 _--_--____- 1971.-..-....-. 1972 _-------.. _ 1973-e..-mm.... 1974 _-______-_-
30 16 32 97
1 Includes dentists’ services, other professional servxes, drugs and drug sundries, eyeglasses and apphances, nursmg-home care, and other health services
1 Included in physlclans’ serwces, data not available separately. Percentage distribution
95 1 93 4 “7: i
ii 66 63 0 2
-
I
-
10 0 21 9 27 3 30 4
31 1
ii! 33 2 34 2 35 0 36 7 37 3
03
i 1
:
:
:
: 1
1: : 21 9 22 6 21 8 21 8 P 1 22 7 23 8
Physicians’ services
195L _- _ __ __-- 1955 ___________ 1960 ___________ 1965 __________-
tivities” category in the social welfare series of the Office of Research and Statistics. The Federal portion consists of outlays for the organization and clelivery of health services, the prevention and control of health problems, and similar health activities administered by various Federal agen- cies, chiefly the Department of Health, Education, and Welfare. The data for these programs are
1966 ___________ 1967 ___________ 1968.-v....--.. 1969 ___________ 1970 _-_--_-___- 1971___--_-____ 1972. --_-______ lY73 _-----__-_- 1974 __________.
BULLETIN, FEBRUARY 1975 19
taken from the Special Analyses of the Budget. The State and local portion represents expend-
itures of all State and local health departments and intergovernment payments to the States and localities for public health activities. It excludes expenditures of other State and local government departments for air-pollution and water-pollution control, sanitation, water supplies, and sewage
\ treatment. The source of these data is Govern- ment Finances (annual publication of the Bureau of the Census).
Other Health Services
Items of expenditure that could not be else- where classified are brought together in the cate- gory “other health services.‘! It includes, for each public program, the residual amount of expendi- tures not classified as a specific type of medical service. In addition, it includes the following: (1) Industrial in-plant services, (2) school health services, before 1974, (3) medical activities in Federal units other than hospitals, and (4) a portion of private voluntary health agency ex- penses.
Industrial in-plant services consist of amounts spent for maintaining in-plant health services and are based on estimates made by the National Institute for Occupational Safety and Health of the Public Health Service.
Until 1974, expenditures for school health were estimated by the Ofice of Education and reported as a separate item in the social welfare expendi- ture series. As of 1974, separate estimates for this item were no longer available and, although expenditures for this purpose continue to be in- cluded in the social welfare expenditure series as part, of total expenditures for education, school health is no longer included as a health expendi- ture.
Medical activities in Federal units other than hospitals are residual amounts that represent pri- marily the cost of maintaining outpatient facili- ties (separately from hospitals) and field and shipboard medical stations.
Expenditures for private voluntary health
agencies, included in the “other” private outlays, are the expenditures that remain after amounts for hospital care, physicians’ services, etc.,, have been distributed. They represent the amounts spent for health education, lobbying, fundraising, etc.
Medical Research
Expenditures for medical research include all such spending by agencies whose primary object is the advancement of human health. Also in- cluded are those research expenditures directly *related to health that are made by other agencies, such as those of the Department of Defense or the National Aeronautics and Space Administra- tion. Research expenditures of drug and medical supply companies are excluded, since they are included in the cost of the product. The Federal amounts represent those reported as medical re- search in the Special Analyse: of the Budget. The amounts shown for State and local govern- ments and private expenditures are based on published estimates that have been prepared by the National Institutes of Health-primarily in the annual publication, Basic Data Relating to the National Institutes of Health.
Construction of Medical Facilities
Expenditures for construction represent “value put in place” for the hospitals, nursing homes, medical clinics, and medical research facilities but not for private office buildings providing office space for private practitioners. Excluded are amounts spent for construction of water-treatment or sewage-treatment plants and Federal grants for these purposes.
The data for value put in place for construc- tion of publicly and privately owned medical facilities in each year are taken from the De- partment of Commerce report, Constmction 12eview. Amounts spent by Federal and State and local governments for construction are sub- tracted from the total. The residual represents the amount coming from private funds.
20 SOCIAL SECURITY