Embed Size (px)
Citation preview
National Hip Fracture Database National report 2013
National Hip Fracture Database National report 2013
2 Copyright © National Hip Fracture Database 2013. All rights reserved.
National Hip Fracture Database National report 2013Prepared on behalf of the Clinical Effectiveness and Evaluation Unit at the Royal College of Physicians
This report was prepared by the members of the workstream delivery team
Antony Johansen, NHFD clinical lead, orthogeriatric medicineRob Wakeman, NHFD clinical lead, orthopaedic surgeryChris Boulton, NHFD project managerFay Plant, NHFD project coordinator Jonathan Roberts, web developerAndy Williams, NHFD project coordinator
Data analysis and chart production byQuantics Consulting Ltd, www.quantics.co.uk
Speed search for your hospitals results:Go to ‘Edit’ at the top of the report – then ‘Find’.Type in your hospital codeThe code will be highlighted wherever it appears in the report.
Brief extracts from this publication may be reproduced provided the source is fully acknowledged.
Enquiries and comments about this report would be welcomed. Please contact:
NHFD, Falls and Fragility Fracture Audit Programme, Royal College of Physicians, 11 St. Andrews Place, Regent’s Park, London. NW1 4LE
A summary of this report is also available onlinewww.nhfd.co.uk
Copyright © National Hip Fracture Database 2013. All rights reserved. 3
National Hip Fracture DatabaseNational report 2013
CONTENTSExecutive summary ..................................................................................................................... 4–5Introduction ............................................................................................................................. 6–15Participating hospitals. ........................................................................................................... 16–17Completeness of data fields submitted for the 2013 National Reports ........................................18Casemix...................... ..................................................................................................................19Admitted from.. ...........................................................................................................................20Pre-operative AMT score... ...........................................................................................................21Post-operative AMT score. ............................................................................................................22A&E to orthopaedic ward in 4 hours (Blue Book Standard 1) .. ....................................................23Type of anaesthesia................................ ......................................................................................24Time to surgery........... .................................................................................................................25Surgery within 36 hours of admission.. ........................................................................................26Surgery on the day or day after admission ...................................................................................27Surgery within 48 hours and during normal working hours (Blue Book Standard 2) ....................28Reason for delay beyond 36 hours.. .............................................................................................29Cumulative time to surgery ..........................................................................................................30Patients treated without surgery ..................................................................................................31Operations performed by fracture type .................................................................................. 32–37Development of pressure ulcers (Blue Book Standard 3) .............................................................38Pre-operative medical assessments (Blue Book Standard 4)..........................................................39Bone health assessment and treatment at discharge (Blue Book Standard 5) ..............................40Specialist falls assessment (Blue Book Standard 6) .......................................................................41Length of acute and post-acute Trust stay (NHFD data) ...............................................................42Superspell (third party data) .........................................................................................................43Discharge destination from Trust .................................................................................................44Re-operation within 30 days ........................................................................................................45Follow up data completeness at 30 and 120 days .................................................................. 46–47Casemix adjusted outcomes ................................................................................................... 48–52Trend analysis. ..............................................................................................................................53Best Practice Tariff .................................................................................................................. 54–60Facilities Audit ........................................................................................................................ 61–64Regional summary tables. ...................................................................................................... 65–76Glossary (terms denoted by ▲) ................................................................................................ 77–78References ....................................................................................................................................79Appendix A – Using audit to improve care – Good practice examples ................................... 80–85Appendix B – Facilities Audit tables. ....................................................................................... 86–92Further appendices .......................................................................................................................93Acknowledgements ......................................................................................................................94
4 Copyright © National Hip Fracture Database 2013. All rights reserved.
Executive summaryThe National Hip Fracture Database (NHFD) is a clinically led, web-based audit of hip fracture care and secondary prevention. All 186 eligible hospitals in England, Wales and Northern Ireland are now regularly uploading data.
The NHFD is the largest and fastest-growing national hip fracture audit in the world with:
• Over quarter of a million cases recorded since its launch in 2007
• 95% of all cases occurring annually being documented by the NHFD
• 5,500 records being added every month
This report covers casemix, care and outcomes of 61,508 cases submitted between 1 April 2012 and 31 March 2013 by 180 hospitals meeting the case threshold of 100 (or a high percentage submission rate in smaller hospitals).
Care is audited against standards defined by the British Orthopaedic Association (BOA) and British Geriatrics Society (BGS), and comparison with the same six standards from our 2012 National Report shows that this year:
• 50% of patients are admitted to an orthopaedic ward within four hours (down from 52% in 2012)
• 86% receive surgery within 48 hours (improved from 83%)
• 3.5% are reported as having developed pressure ulcers (improved from 3.7%)
• 47% are reported as assessed pre-operatively by an orthogeriatrician (up from 43%)
• 69% are discharged on bone protection medication (unchanged)
• 94% received a falls assessment prior to discharge (up from 92%)
Our results are set alongside data from national data sources to allow a more comprehensive picture of total length of stay and mortality.
Casemix adjusted reporting on two key measures (30 day mortality, and return to own home by 30 days) is used to compare different hospitals’ outcomes.
These outcomes are drawn against the mean and standard deviation according to the size of the unit and in the case of 30-day mortality, protocols have been developed to check the quality of data for outlying hospitals, and to feed back information that might help them in reviewing their clinical service.
Five hospitals triggered an ‘alert’ in terms of significantly increased 30 day mortality in this analysis, and their performance was reviewed with reference to the data submitted over the three year period 2010–13.
For three hospitals this ‘alert’ needs to be viewed alongside reassuring figures for previous years, but two were confirmed to exhibit a consistent cause for concern.
Copyright © National Hip Fracture Database 2013. All rights reserved. 5
National Hip Fracture DatabaseNational report 2013
These two hospitals showed a consistent pattern, significant at a 95% level of confidence.
Clinicians and managers have used NHFD participation to prompt, monitor and evaluate clinical and service developments to improve the quality and cost effectiveness of hip fracture care. The report includes brief summaries of successful innovations that might encourage similar developments elsewhere.
In England, the NHFD has successfully supported the first four years of the Department of Health’s Best Practice Tariff (BPT) initiative, which rewards the achievement of specified standards:
• surgery within 36 hours
• shared care by surgeon and geriatrician
• care protocol agreed by geriatrician, surgeon and anaesthetist
• assessment by geriatrician within 72 hours
• pre- and post-operative abbreviated mental test score assessment
• geriatrician-led multi-disciplinary rehabilitation
• secondary prevention of falls
• bone health assessment
Participation in BPT has steadily increased between 2010 and 2013.
A temporary fall at the start 2012–13 reflected the additional challenge of a requirement to perform the abbreviated mental test, but in the last quarter 60% of patients have achieved BPT – a marked improvement on the 55% figure for the same period in 2011–12.
This National Report describes 61,508 admissions with hip fracture across England, Wales and Northern Ireland. We show that this equates with the continuous occupation of over 4,000 beds across the NHS.
It is clear that the NHFD serves as a vital means of auditing the management of a condition which costs one and a half billion pounds each year.
6 Copyright © National Hip Fracture Database 2013. All rights reserved.
IntroductionThis year marks the 50th anniversary of Bobby Irvine and Michael Devas’ description of the first collaborative approach to the care of frail older people with hip fracture. The geriatric orthopaedic unit they set up in Hastings was the first of many such services which were developed to meet the needs of these patients.
Other enthusiasts subsequently put together informal or formal arrangements suited to the particular pressures in different parts of the country – with diverse patterns of referral, liaison and collaborative care emerging over the years. Many different models evolved, so that it is only in the last few years that an evidence base has emerged to prove the benefits associated with such collaborative working.
This fifth National Report of the NHFD gives us an opportunity to salute the legacy of Devas and Irvine.
The National Hip Fracture Database
In 2005 the success of collaboration between the BOA and the BGS in providing training for junior surgeons and geriatricians led these organisations to champion a change in approach to the care of older people with hip fracture in this country. Their joint publication of the Blue Book – ‘The care of patients with fragility fracture’1 – proposed six quality standards which remain central to the organisation of care for this vulnerable group of individuals.
Health organisations were challenged to provide prompt admission to orthopaedic wards, early surgical repair of the fracture, protection against pressure ulcers▲, routine access to acute orthogeriatric assessment and support, and assessment for bone protection therapy▲ and falls prevention▲ to avoid future falls and fractures.
At the same time the BOA and the BGS proposed an independent, clinically-led, web-based audit – to monitor the quality and outcome of the care provided to individual patients, and to help individual trauma units to improve the organisation of their services.
With start-up funding from industry sources the NHFD was launched in 2007. In 2009 the NHFD was recognised by the National Clinical Audit Advisory Group for central funding, and the programme secured Healthcare Quality Improvement Partnership (HQIP) funding until 2014.
From 2012 the NHFD moved to be managed as part of the Falls and Fragility Fracture Audit Programme (FFFAP) within the Royal College of Physicians in London, benefitting from links with the other FFFAP work-streams addressing the development of Fracture Liaison Services and the prevention of falls in institutional care settings.
As organisations redesign their services, the number of hospitals treating acute hip fractures has reduced slightly. All 186 eligible hospitals in England, Wales, Northern Ireland and the Channel Islands are registered with NHFD, and all now regularly contribute data.
The NHFD’s ability to detail casemix, performance and outcome, prompted the selection of hip fracture as a topic for the Department of Health’s BPT initiative2 in England. This offers additional payment when the NHFD records that a patient’s care meets agreed standards – surgery within 36 hours, jointly agreed care protocols, shared care, cognitive assessment, geriatrician-led peri-operative assessment and multi-disciplinary rehabilitation▲, and secondary prevention including falls and bone health assessment.
Copyright © National Hip Fracture Database 2013. All rights reserved. 7
National Hip Fracture DatabaseNational report 2013
Since the start of BPT in April 2010 we have seen a steady rise in the number of participating hospitals, of cases submitted, and of cases meeting the tariff standards.
Individual trauma units upload casemix, clinical performance monitoring, and outcome details into a simple web-based tool. These data are analysed throughout the year, so clinicians and healthcare managers can use the same web-site to monitor their monthly and annual performance against the six standards of the Blue Book and to benchmark their performance against other units on a regional or national basis.
With a tendency towards increasing specialisation and centralisation of trauma services many patients will be admitted to units that are some way from their home, and may move to rehabilitation wards and community rehabilitation beds before their eventual discharge. The development of clinical pathways across different hospitals, Trusts, and other organisations is crucial if such care is to be efficiently organised and if patients are to be offered continuity of clinical care. The development of orthogeriatric clinical networks has been an additional benefit of units’ collaboration in the NHFD.
The NHFD project coordinators have organised a series of well-attended regional meetings, to bring together clinicians and managers to share expertise, and improve the quality and cost-effectiveness of the care they provide. The NHFD web-site offers additional support; case studies, good practice examples, model job descriptions, and business plans, so that by sharing information individual clinicians can benefit from others’ experience.
The success of all this is demonstrated in this fifth National Report – but the NHFD is far more than just an annual report, and this document should be read as just part of the NHFD’s work.
The 2013 National Report
Earlier this year the total number of patients recorded in the NHFD exceeded a quarter of a million. This report considers a total of 61,508 patients admitted between 1 April 2012 and 31 March 2013 – bringing together data from all 180 hospitals in England, Wales and Northern Ireland which reported data on over 100 cases or (in the five units which admit fewer than this) reported data on over two thirds of their cases.
The main body of the report presents comparative data in a series of tables and charts which rank individual hospitals. These allow a local team to understand how their casemix – patients’ age, sex-ratio, place of residence, anaesthetic grade, cognitive state, walking ability, and fracture type – compare with that reported in other units.
In this year’s report we rank hospitals on the basis of the proportion of hip fractures which have been sustained following an in-patient fall (Chart 2). The fact that inpatient fallers make up as much of 15% of admissions to some units will be of interest to local health providers, as will the observation that the catchment area of some of these units includes hospitals with no alternative to single room accommodation.
The same approach is used to describe the patients’ progress – from admission through to discharge, with details of time to an orthopaedic ward and time to surgery, and of operations performed, medical assessment, development of any pressure ulcers, secondary prevention measures, length of acute hospital stay and destination on discharge.
Outcome is summarised with a number of key measures which have been adjusted to take into account the casemix of the patients admitted to individual hospitals.
8 Copyright © National Hip Fracture Database 2013. All rights reserved.
The priority of most patients and their families is that they are helped to regain independence and mobility, and are able to return to their previous residence as soon as possible. Casemix adjusted data on the percentage of patients returning to their own home by 30 days after hip fracture are therefore our key outcome measure. The report also includes casemix adjusted mortality figures at 30 days.
For the first time, this report includes overall NHS length of stay or ‘super-spell’▲ figures, not only for England, but also for Wales and Northern Ireland. These have been derived from reference to national databases –Health Episode Statistics (HES) in England, Patient Episode Database Wales (PEDW) in Wales, and Fracture Outcome Research Database (FORD) in Northern Ireland. This super-spell data at last addresses the difficulty of describing the overall patient experience when different stages of care are provided in different organisations. Figures from different hospitals, Trusts, and other NHS organisations are being linked to define how long it actually takes a patient to return home, or to be settled in their placement.
Progress so far
Performance
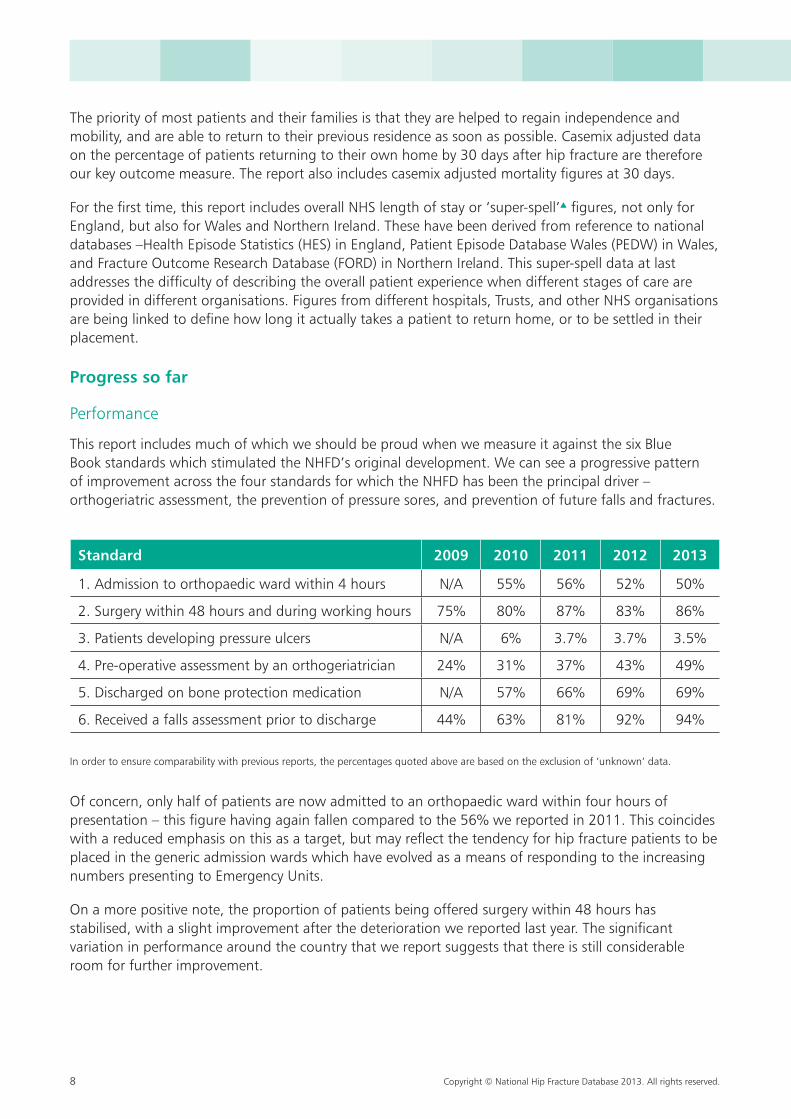
This report includes much of which we should be proud when we measure it against the six Blue Book standards which stimulated the NHFD’s original development. We can see a progressive pattern of improvement across the four standards for which the NHFD has been the principal driver – orthogeriatric assessment, the prevention of pressure sores, and prevention of future falls and fractures.
Standard 2009 2010 2011 2012 2013
1. Admission to orthopaedic ward within 4 hours N/A 55% 56% 52% 50%
2. Surgery within 48 hours and during working hours 75% 80% 87% 83% 86%
3. Patients developing pressure ulcers N/A 6% 3.7% 3.7% 3.5%
4. Pre-operative assessment by an orthogeriatrician 24% 31% 37% 43% 49%
5. Discharged on bone protection medication N/A 57% 66% 69% 69%
6. Received a falls assessment prior to discharge 44% 63% 81% 92% 94%
In order to ensure comparability with previous reports, the percentages quoted above are based on the exclusion of ‘unknown’ data.
Of concern, only half of patients are now admitted to an orthopaedic ward within four hours of presentation – this figure having again fallen compared to the 56% we reported in 2011. This coincides with a reduced emphasis on this as a target, but may reflect the tendency for hip fracture patients to be placed in the generic admission wards which have evolved as a means of responding to the increasing numbers presenting to Emergency Units.
On a more positive note, the proportion of patients being offered surgery within 48 hours has stabilised, with a slight improvement after the deterioration we reported last year. The significant variation in performance around the country that we report suggests that there is still considerable room for further improvement.
Copyright © National Hip Fracture Database 2013. All rights reserved. 9
National Hip Fracture DatabaseNational report 2013
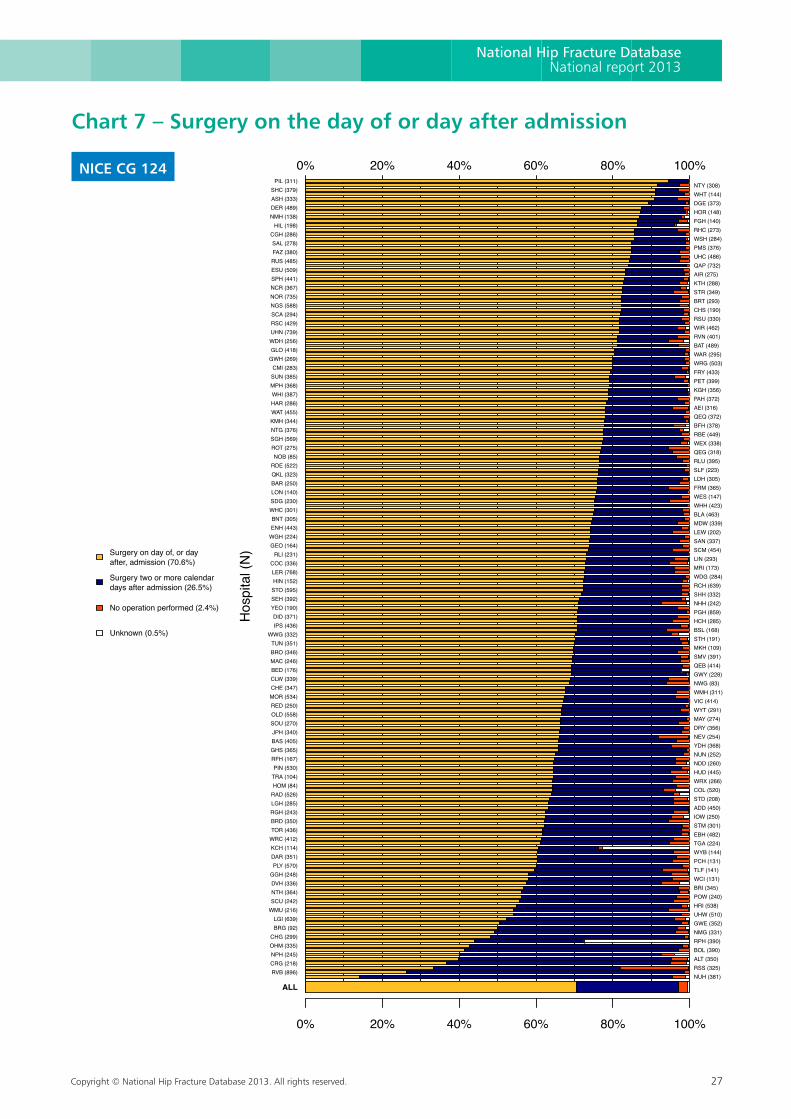
The more ambitious target set by National Institute for Health and Care Excellence (NICE)3 in 2011 remains a challenge – with only 70% of patients currently being offered surgery ‘on the day of, or the day after admission’.
Mortality
Hip fracture is the commonest cause of injury related death, and is commonly seen by patients, their relatives and friends as the final insult that led to their death. Many of these deaths are a reflection of frailty and pre-existing illness, and not all mortality is preventable. Variation in the age and complexity of patients admitted to different hospitals makes it challenging to demonstrate whether an individual unit is doing everything necessary to avoid preventable deaths, but casemix adjustment helps us to correct for this.
The overall rate of mortality at 30 days in the casemix adjusted analysis is 8.2% – compared with the 8.1% figure we reported for 2011–12 in our supplement earlier this year. Some of the apparent variation in mortality between units will be a chance statistical finding, but our approach does allow us to identify units where performance is particularly poor, and to highlight those where outstanding performance should be recognised.
We identified a number of Trusts (FRY, LDH, STR, WAT, WHH) which are outliers in that they fall outside the 2SD threshold in this year’s funnel plot [Chart 29].
However, it is not clear that this indicates a consistent pattern of failing or justifiable cause for concern. FRY and WHH were not outliers when data collected over the three year period 2010–13 was considered, and although STR did remain an outlier in this three year analysis, the absolute excess mortality for each of these units was less than one case per year.
In contrast, two units (LDH and WAT) triggered concerns on 2012–13 data, and were still outliers when the three years’ data were analysed. Both units remained at or above the 3SD ‘alarm’ threshold for the 2010–13 period [Chart 30]. Each showed an excess mortality which in absolute terms equated with over 12 deaths during the three year period, and which was significant at a 95% confidence limit.
Return home
Older people often report being more concerned about potential loss of independence, than about the risk of dying after a hip fracture. As a result success in rehabilitation remains the NHFD’s key marker of the quality of multidisciplinary care.
The overall rate of return home from home at 30 days for all cases included in the case-mix adjusted analysis was 43.3% in 2011, 44.6% in 2012, and this year has improved further – to 46.2%.
The quality of follow-up data has again improved this year, but these figures continue to be based on relatively poor data returns, with only 44.8% complete for the 30 day time point.
Length of Stay
Length of stay (LOS) is the main component of the overall cost of hip fracture care. Potential reductions in LOS were key to the improved cost-effectiveness achieved by Hip Fracture Programmes that were identified by the economic model of the NICE Guideline3 (CG124) on hip fracture.
10 Copyright © National Hip Fracture Database 2013. All rights reserved.
This report describes a further small reduction in the mean length of acute and post-acute stay within the admitting hospital – from 21.2 days in 2011, to 20.2 days in 2012 – and 20 days this year (Chart 22).
The NHFD has commissioned the Royal College of Surgeons’ Clinical Effectiveness Unit (RCS CEU) to link data on individual patients in the NHFD with details of their inpatient care held in national databases. This seeks to capture length of stay not only in the hospital to which a patient is originally admitted, but also the whole of subsequent NHS stay in other Trusts or organisations.
The first description of this approach to ‘super-spell’ was included in our supplementary report published earlier this year. That report considered patients in England using Health Episode Statistics (HES) data for the 2010–11 year.
In this 2013 National Report we include the same analyses for the 2011–12 year – extended with new data from PEDW data from Wales, and with additional data from FORD for Northern Ireland (Chart 23).
The development of Local Health Boards means that in Wales patients do not move between acute and community Trusts in the same geographical area. There is less need to identify the elements of care provided by different organisations, and PEDW categorises length of stay differently from HES. PEDW data simply split between a spell of trauma/rehabilitation in the admitting hospital, and any spell of rehabilitation or long-stay inpatient care that might follow in a second hospital.
Technical and practical difficulties inherent in attempting to identify 60,000 patients with hip fracture in HES mean that while this report features NHFD figures for 2012–13, we report super-spell figures for 2011–12.
In spite of this the super-spell data gives a crucial insight into the real cost of hip fracture – capturing the whole time a patient has to spend in hospital, and the whole cost to the health service in terms of overall hospital bed occupancy.
The HES figure for mean super-spell in England is 22 days. This may still understate NHS stay as it remains unclear whether HES reliably captures the full extent of NHS funded rehabilitation in intermediate care and care homes – which is an increasingly important component of Community Trust provision in England.
In contrast PEDW records a super-spell of 35 days in Wales, reflecting a LOS in rehabilitation beds that is over twice as long as the figure for England. This pattern is consistent with data submitted to the NHFD; nine of the ten longest LOS figures being for hospitals in Wales. Long-stay and continuing care hospital beds are an element of provision in Wales, but the impact of long-stay patients will have been limited in this report since LOS figures beyond 365 days are excluded from this analysis.
The FORD data indicate a super-spell of 33 days for Northern Ireland that is also substantially longer then the HES figure for England. This will in part reflect a greater use of rehabilitation beds as part of a hub and spoke model, with centralisation of hip fracture surgery in a small number of trauma units which serve a wide geographic catchment area.
Copyright © National Hip Fracture Database 2013. All rights reserved. 11
National Hip Fracture DatabaseNational report 2013
Future development of the NHFD
Improving ascertainment
This national report contains the most complete data set so far – the largest number of hospitals, the largest number of patients, and the most complete datasets.
A national clinical audit should seek to acquire complete data on all cases, and the NHFD constantly questions what might be happening in situations where patients are not being reported:
• hospitals which in the past were not submitting any data
• hospitals which still submit too few patients to support reliable analysis
• hospitals where a proportion of patients are missed, but where there is a risk that these may be missed for a reason that might lead to biased performance and outcome figures (for instance if fitter patients were lost when moved for total hip replacement in a different unit)
• hospitals where follow-up is incomplete and where there is a risk of bias (for instance, if inpatient deaths are all recorded, but some discharge data missed – estimates of inpatient mortality might be artificially elevated)
Encouragingly, since May 2013 all hospitals are now contributing data. Only 6 units were excluded from this year’s report on the basis of the poor number of cases submitted. Individual charts in the report highlight where data is incomplete. However, it is not straightforward to establish how complete our data are, since there is no external ‘gold-standard’ against which our figures could be checked.
Until this year the most reliable available estimate of total hip fracture numbers for these countries has been our own – from participating sites’ Facilities Audit reports of how many patients they are seeing. Increasingly these units’ estimates have been based on previous years’ experience of data submission to the NHFD, refined by local understanding of whether a proportion of patients might have been missed.
However, we have attempted to validate the completeness of case ascertainment▲ through the RCS CEU data comparison exercise described above.
The HES and PEDW databases have their own uncertainties, and in particular their dependence on coding means that they may not identify all patients with hip fracture. HES showed 59,344 admissions in England in 2011–12, PEDW showed 3,804 admissions in Wales.
These figures correspond well with our own estimates. Our facilities audit had estimated 58,638 hip fracture admissions in England, and 3,810 in Wales, and for 2012–13 we report data submitted on 55,998 in England, and on 3,665 in Wales.
FORD identified 1,695 patients in Northern Ireland in 2011–12. The NHFD already links directly with FORD so numbers will correspond very closely. All four hospitals in Northern Ireland are now contributing data, so for 2012–13 our facilities audit estimate increased to 1,936, and this report includes 1,845 patients.
There is no reason to believe that HES and PEDW provide a more reliable estimate of total hip fracture numbers than our own figures, but we can feel confident in our case ascertainment since we have collected and report data on 94.9% of all the hip fractures recorded in these national databases, and on 95.5% of the number expected from our own facilities audit.
12 Copyright © National Hip Fracture Database 2013. All rights reserved.
Improving follow-up
Follow-up data remains disappointing in some areas, and 30 day follow-up data is only complete in 37.4% of cases. However, this report still demonstrates an immediate impact on patient independence, with new care home placements for a significant number of those who suffer a hip fracture.
We show that 23% of those surviving the injury go to care homes directly from the acute hospital (only 19.2% were admitted from such care), and a further 21.6% transfer to rehabilitation wards. At present the incompleteness of follow-up data for the patients who are offered additional rehabilitation means that the overall rate of new care home placement following hip fracture cannot be estimated.
Given that each such placement after hip fracture carries a mean life-time cost of £64,000 an understanding of longer term outcome would be a key economic measure that the NHFD should seek to deliver. Such a move may reflect greater difficulty with mobility or self-care, but may also reflect a loss of confidence on the part of the patient or their relatives – so that a fear of future falls precipitates a move to institutional care.
Provision of coordinated multidisciplinary rehabilitation and secondary prevention of falls are clearly key to avoiding unnecessary loss of independence.
Improving description of care
This and previous National Reports have been focused on audit of current practice against the standards set out in the BOA/BGS ‘Blue Book’ and the criteria set out for BPT in England.
The demonstration that 78.4% of patients are having a post-operative abbreviated mental test▲ is an indication of how rapidly participating hospitals can respond to innovation or change in these criteria.
Ongoing work seeks to extend this remit so that we can explore other aspects of care, and other measures of performance and outcome. Short term ‘Sprint’ audits▲ will be the first step in this development.
The NHFD and Anaesthetic Management
Anaesthesia was not included in the initial core dataset for the NHFD as these details did not form part of the Blue Book standards. However, since April 2011 limited information has been collected on the type of anaesthesia, and the use of nerve blocks for hip fracture surgery as part of the core dataset.
In 2011 representatives from NHFD and the Association of Anaesthetists of Great Britain and Ireland (AAGBI) decided to collaborate and develop a comprehensive Anaesthesia Sprint Audit of Practice (ASAP).
This seeks to assess adherence to the AAGBI guidelines4 on the management of proximal femoral fracture which in 2011 recommended:
• that surgery and anaesthesia are undertaken by appropriately experienced surgeons and anaesthetists
• that the Nottingham Hip Fracture Score5 is used to predict Postoperative mortality
• consideration of spinal/epidural anaesthesia for all patients undergoing hip fracture repair unless otherwise contraindicated
Copyright © National Hip Fracture Database 2013. All rights reserved. 13
National Hip Fracture DatabaseNational report 2013
• not using opioid analgesics as the sole adjunct to anaesthesia
• that either spinal or general anaesthesia is administrated (simultaneous administration is associated with precipitous falls in blood pressure)
• use of supplemental oxygen during spinal anaesthesia
• co-administration of intrathecal opioids during spinal anaesthesia
• pre or Postoperative peripheral nerve blockade to supplement either general or spinal anaesthesia
• monitoring of intraoperative blood pressure
• identification of bone cement implantation syndrome, by monitoring for hypoxia or hypotension shortly after cementing or reaming
The objectives of the ASAP sprint audit are to:
• describe the use of different anaesthesia, peripheral nerve blockade, opioids and sedative medication
• define the prevalence and implications of hypotension developing during anaesthesia
• establish the seniority of the operating surgeon/anaesthetist
• identify operative markers of bone cement implantation syndrome
• establish whether the Nottingham Hip Fracture Score is a robust method of conducting casemix analysis
Data is being collected prospectively in the summer of 2013. The ASAP sprint will involve the addition of 8 fields to the NHFD data set. ASAP data will be linked to outcome measures of the NHFD; primarily 30-day mortality, Postoperative worsening of abbreviated mental test score, and return to normal residence. Currently, out of the 186 hospitals contributing to the NHFD 167 hospitals have signed up for the ASAP sprint audit.
The NHFD and NICE Quality Standard 16
In 2011 NICE published ‘The Management of Hip Fracture in Adults’3 along with a series of implementation tools and resources. In 2012 they published a set of Quality Standards for hip fracture (NICE QS16)6.
These included a number of areas about which the existing NHFD dataset provides information, and this report already includes charts which test specific standards within QS16 – in particular those which state that people with hip fracture should:
• have their cognitive status assessed, measured and recorded from admission
• have surgery on the day of, or the day after, admission
• receive cemented arthroplasty for displaced intracapsular fracture, with the offer of total hip replacement if clinically eligible
14 Copyright © National Hip Fracture Database 2013. All rights reserved.
• be offered a multifactorial risk assessment to identify and address future falls risk, and are offered individualised intervention if appropriate
• be offered a bone health assessment to identify future fracture risk and pharmacological intervention as needed before discharge from hospital.
The NHFD team is currently proposing a new Sprint Audit to extend the NHFD’s coverage to the remaining elements of QS16 – quality standards which state that people with hip fracture should:
• receive prompt and effective pain management, in a manner that takes into account the hierarchy of pain management drugs, throughout their hospital stay
• have their surgery scheduled on a planned trauma list, with consultant or senior staff supervision
• receive extramedullary implants such as a sliding hip screw in preference to an intramedullary nail for trochanteric fractures above and including the lesser trochanter (AO classification types A1 and A2)
• be offered a physiotherapist assessment the day after surgery and mobilisation at least once a day unless contraindicated
• be offered a formal Hip Fracture Programme from admission
• be offered early supported discharge (if they are eligible), led by the Hip Fracture Programme team
• and that the Hip Fracture Programme team retains a comprehensive and continuing clinical and service governance lead for all stages of the pathway of care, including the policies and criteria for both intermediate care and early supported discharge
It is planned that these areas should form the focus of a specific Sprint Audit – an audit that would also approach the question of the patient experience. Since cognitive impairment is so prevalent in this patient group this will be challenging, but an extension of our work to assess the quality of the patient’s experience with respect to pain management is clearly a minimum requirement if we are to understand the impact of hip fracture from their perspective.
Further detail on how NHFD reporting maps to NICE Clinical Guidance can be found in our 2012 National Report (available on nhfd.co.uk) Charts which report against NICE guidance are indicated with the tag
NICE CG 124
Copyright © National Hip Fracture Database 2013. All rights reserved. 15
National Hip Fracture DatabaseNational report 2013
The NHFD and Clinical Commissioning Groups
The Clinical Commissioning Group Outcomes Indicator Set is currently being developed as part of NHS England’s approach to quality improvement. Its aim is to support Clinical Commisioning Groups (CCGs) and health and wellbeing partners, to plan for health improvement and to provide clear, comparative information for patients and the public about the quality of health services commissioned by CCGs.
The following hip fracture indicators are included in the set of recommended indicators that are under consideration by NHS England for 2014–1515.
If accepted, hip fracture incidence will be calculated from the Hospital Episode Statistics. The remaining three indicators will be derived from data submitted to the NHFD:
1. Of people with hip fracture, the proportion who receive a formal Hip Fracture Programme from admission evidenced as having a joint acute care protocol at admission, and evidence of MDT rehabilitation agreed with a [named responsible orthogeriatrician and orthopaedic surgeon, with GMC numbers recorded.
2. Of people with hip fracture, the proportion who receive surgery on the day of, or the day after, admission.
3. Of people with hip fracture, the proportion who receive a multifactorial risk assessment of future falls risk, led by the Hip Fracture programme team evidenced by GMC number of responsible clinician.
This reinforces the importance of submitting complete, accurate data to the NHFD.
16 Copyright © National Hip Fracture Database 2013. All rights reserved.
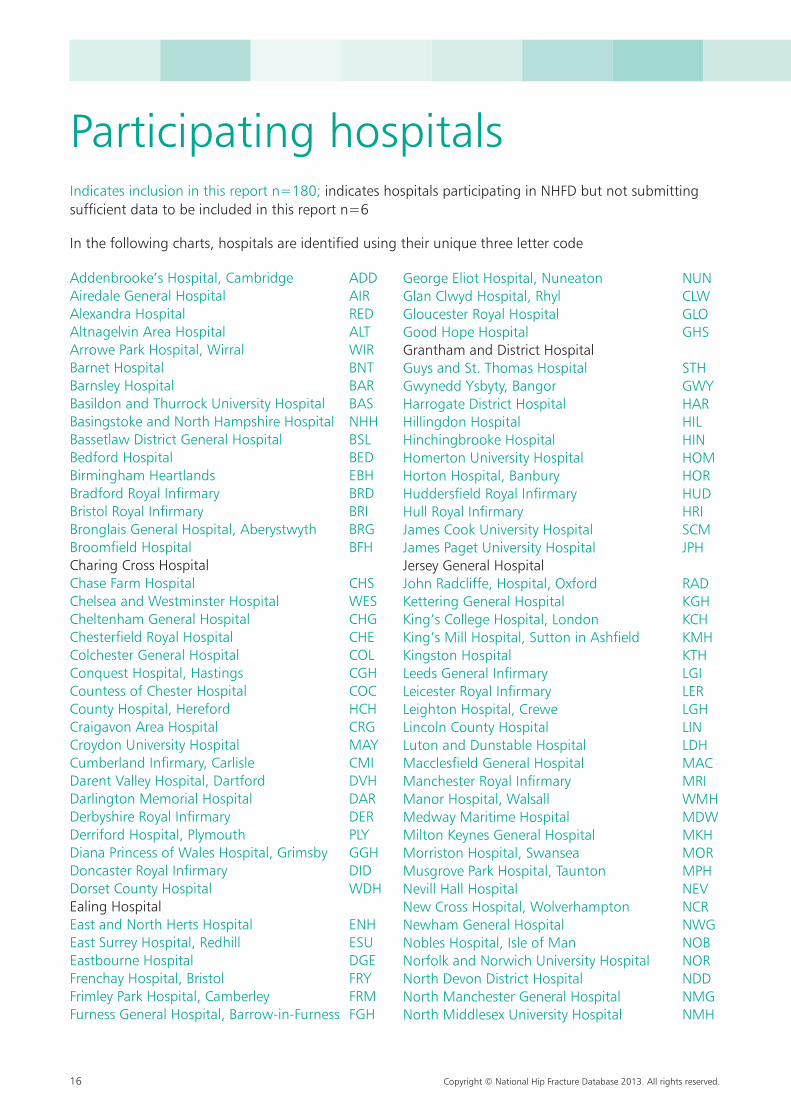
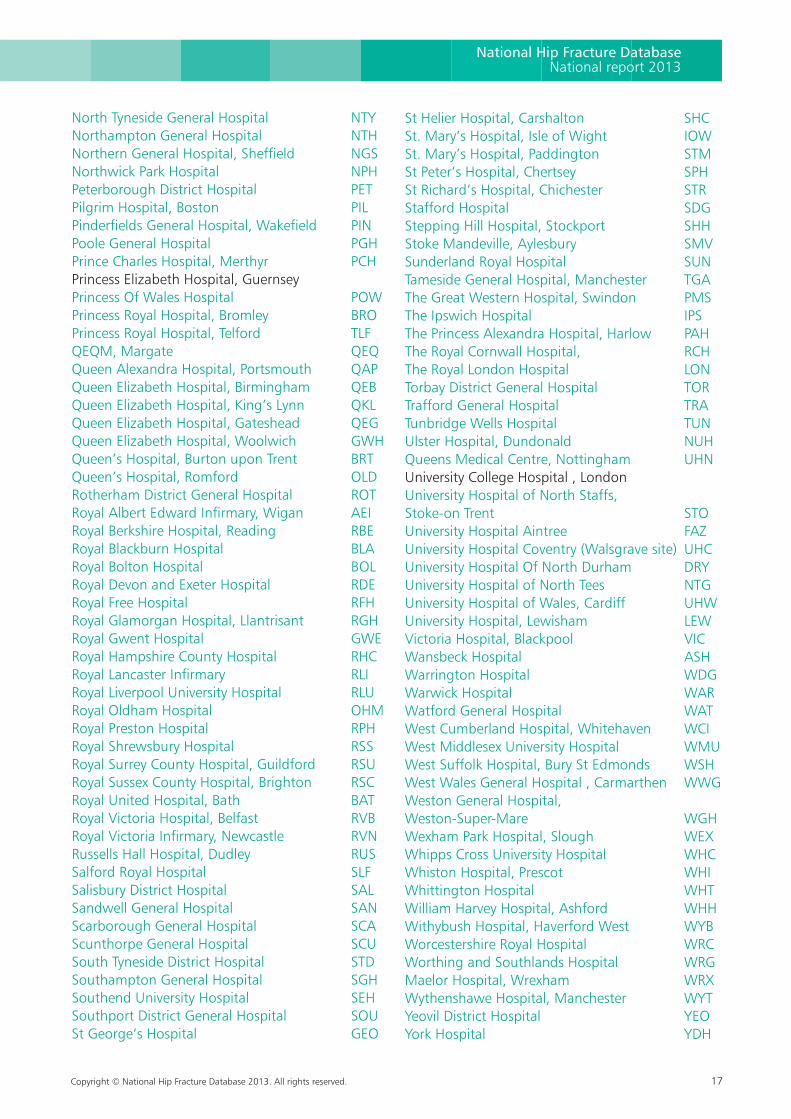
Participating hospitalsIndicates inclusion in this report n=180; indicates hospitals participating in NHFD but not submitting sufficient data to be included in this report n=6
In the following charts, hospitals are identified using their unique three letter code
Addenbrooke’s Hospital, Cambridge ADDAiredale General Hospital AIRAlexandra Hospital REDAltnagelvin Area Hospital ALTArrowe Park Hospital, Wirral WIRBarnet Hospital BNTBarnsley Hospital BARBasildon and Thurrock University Hospital BASBasingstoke and North Hampshire Hospital NHHBassetlaw District General Hospital BSLBedford Hospital BEDBirmingham Heartlands EBHBradford Royal Infirmary BRDBristol Royal Infirmary BRIBronglais General Hospital, Aberystwyth BRGBroomfield Hospital BFHCharing Cross Hospital Chase Farm Hospital CHSChelsea and Westminster Hospital WESCheltenham General Hospital CHGChesterfield Royal Hospital CHEColchester General Hospital COLConquest Hospital, Hastings CGHCountess of Chester Hospital COCCounty Hospital, Hereford HCHCraigavon Area Hospital CRGCroydon University Hospital MAYCumberland Infirmary, Carlisle CMIDarent Valley Hospital, Dartford DVHDarlington Memorial Hospital DARDerbyshire Royal Infirmary DERDerriford Hospital, Plymouth PLYDiana Princess of Wales Hospital, Grimsby GGHDoncaster Royal Infirmary DIDDorset County Hospital WDHEaling Hospital East and North Herts Hospital ENHEast Surrey Hospital, Redhill ESUEastbourne Hospital DGEFrenchay Hospital, Bristol FRYFrimley Park Hospital, Camberley FRMFurness General Hospital, Barrow-in-Furness FGH
George Eliot Hospital, Nuneaton NUNGlan Clwyd Hospital, Rhyl CLWGloucester Royal Hospital GLOGood Hope Hospital GHSGrantham and District HospitalGuys and St. Thomas Hospital STHGwynedd Ysbyty, Bangor GWYHarrogate District Hospital HARHillingdon Hospital HILHinchingbrooke Hospital HINHomerton University Hospital HOMHorton Hospital, Banbury HORHuddersfield Royal Infirmary HUDHull Royal Infirmary HRIJames Cook University Hospital SCMJames Paget University Hospital JPHJersey General Hospital John Radcliffe, Hospital, Oxford RADKettering General Hospital KGHKing’s College Hospital, London KCHKing’s Mill Hospital, Sutton in Ashfield KMHKingston Hospital KTHLeeds General Infirmary LGILeicester Royal Infirmary LERLeighton Hospital, Crewe LGHLincoln County Hospital LINLuton and Dunstable Hospital LDHMacclesfield General Hospital MACManchester Royal Infirmary MRIManor Hospital, Walsall WMHMedway Maritime Hospital MDWMilton Keynes General Hospital MKHMorriston Hospital, Swansea MORMusgrove Park Hospital, Taunton MPHNevill Hall Hospital NEVNew Cross Hospital, Wolverhampton NCRNewham General Hospital NWGNobles Hospital, Isle of Man NOBNorfolk and Norwich University Hospital NORNorth Devon District Hospital NDDNorth Manchester General Hospital NMGNorth Middlesex University Hospital NMH
Copyright © National Hip Fracture Database 2013. All rights reserved. 17
National Hip Fracture DatabaseNational report 2013
North Tyneside General Hospital NTYNorthampton General Hospital NTHNorthern General Hospital, Sheffield NGSNorthwick Park Hospital NPHPeterborough District Hospital PETPilgrim Hospital, Boston PILPinderfields General Hospital, Wakefield PINPoole General Hospital PGHPrince Charles Hospital, Merthyr PCHPrincess Elizabeth Hospital, GuernseyPrincess Of Wales Hospital POWPrincess Royal Hospital, Bromley BROPrincess Royal Hospital, Telford TLFQEQM, Margate QEQQueen Alexandra Hospital, Portsmouth QAPQueen Elizabeth Hospital, Birmingham QEBQueen Elizabeth Hospital, King’s Lynn QKLQueen Elizabeth Hospital, Gateshead QEGQueen Elizabeth Hospital, Woolwich GWHQueen’s Hospital, Burton upon Trent BRTQueen’s Hospital, Romford OLDRotherham District General Hospital ROTRoyal Albert Edward Infirmary, Wigan AEIRoyal Berkshire Hospital, Reading RBERoyal Blackburn Hospital BLARoyal Bolton Hospital BOLRoyal Devon and Exeter Hospital RDERoyal Free Hospital RFHRoyal Glamorgan Hospital, Llantrisant RGHRoyal Gwent Hospital GWERoyal Hampshire County Hospital RHCRoyal Lancaster Infirmary RLIRoyal Liverpool University Hospital RLURoyal Oldham Hospital OHMRoyal Preston Hospital RPHRoyal Shrewsbury Hospital RSSRoyal Surrey County Hospital, Guildford RSURoyal Sussex County Hospital, Brighton RSCRoyal United Hospital, Bath BATRoyal Victoria Hospital, Belfast RVBRoyal Victoria Infirmary, Newcastle RVNRussells Hall Hospital, Dudley RUSSalford Royal Hospital SLFSalisbury District Hospital SALSandwell General Hospital SANScarborough General Hospital SCAScunthorpe General Hospital SCUSouth Tyneside District Hospital STDSouthampton General Hospital SGHSouthend University Hospital SEHSouthport District General Hospital SOUSt George’s Hospital GEO
St Helier Hospital, Carshalton SHCSt. Mary’s Hospital, Isle of Wight IOWSt. Mary’s Hospital, Paddington STMSt Peter’s Hospital, Chertsey SPHSt Richard’s Hospital, Chichester STRStafford Hospital SDGStepping Hill Hospital, Stockport SHHStoke Mandeville, Aylesbury SMVSunderland Royal Hospital SUNTameside General Hospital, Manchester TGAThe Great Western Hospital, Swindon PMSThe Ipswich Hospital IPSThe Princess Alexandra Hospital, Harlow PAHThe Royal Cornwall Hospital, RCHThe Royal London Hospital LONTorbay District General Hospital TORTrafford General Hospital TRATunbridge Wells Hospital TUNUlster Hospital, Dundonald NUHQueens Medical Centre, Nottingham UHNUniversity College Hospital , LondonUniversity Hospital of North Staffs, Stoke-on Trent STOUniversity Hospital Aintree FAZUniversity Hospital Coventry (Walsgrave site) UHCUniversity Hospital Of North Durham DRYUniversity Hospital of North Tees NTGUniversity Hospital of Wales, Cardiff UHWUniversity Hospital, Lewisham LEWVictoria Hospital, Blackpool VICWansbeck Hospital ASHWarrington Hospital WDGWarwick Hospital WARWatford General Hospital WATWest Cumberland Hospital, Whitehaven WCIWest Middlesex University Hospital WMUWest Suffolk Hospital, Bury St Edmonds WSHWest Wales General Hospital , Carmarthen WWGWeston General Hospital, Weston-Super-Mare WGHWexham Park Hospital, Slough WEXWhipps Cross University Hospital WHCWhiston Hospital, Prescot WHIWhittington Hospital WHTWilliam Harvey Hospital, Ashford WHHWithybush Hospital, Haverford West WYBWorcestershire Royal Hospital WRCWorthing and Southlands Hospital WRGMaelor Hospital, Wrexham WRXWythenshawe Hospital, Manchester WYTYeovil District Hospital YEOYork Hospital YDH
18 Copyright © National Hip Fracture Database 2013. All rights reserved.
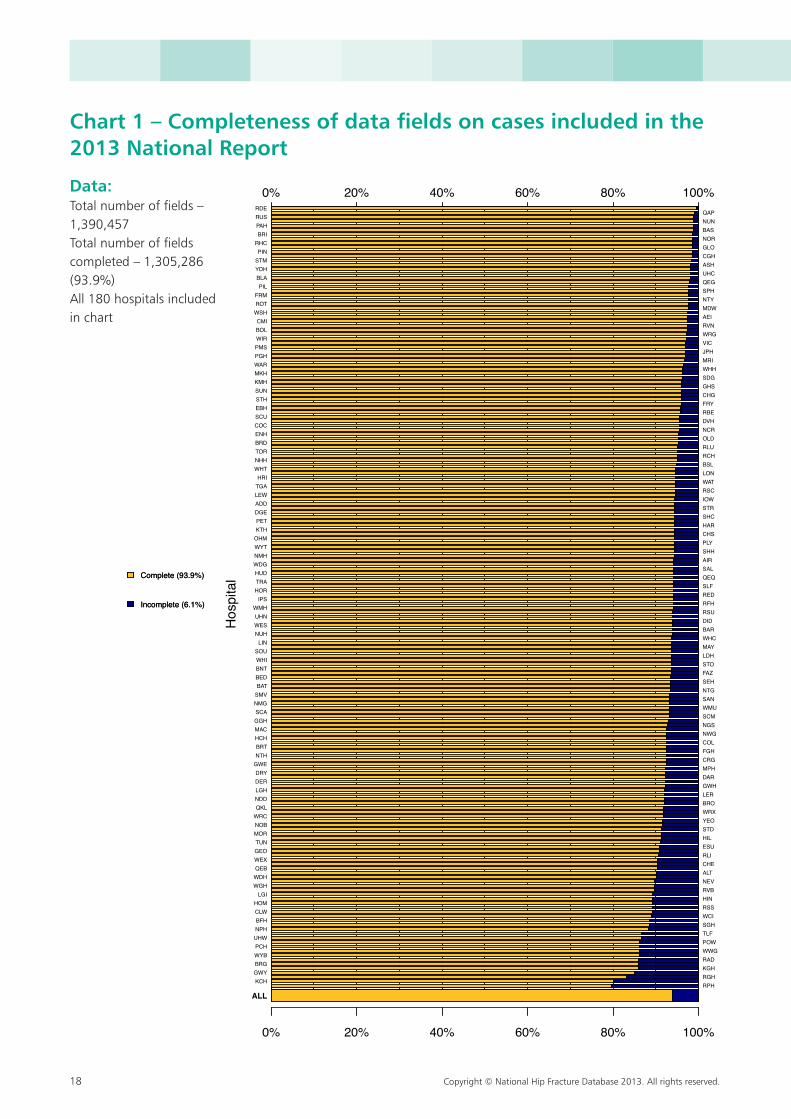
Chart 1 – Completeness of data fields on cases included in the 2013 National Report
Data:Total number of fields – 1,390,457Total number of fields completed – 1,305,286 (93.9%)All 180 hospitals included in chart
Complete (93.9%)
Incomplete (6.1%)
0% 20% 40% 60% 80% 100%
0% 20% 40% 60% 80% 100%
Complete (93.9%)
Incomplete (6.1%)
KCHGWYBRGWYBPCHUHWNPHBFHCLWHOM
LGIWGHWDHQEBWEXGEOTUNMORNOBWRCQKLNDDLGHDERDRY
GWENTHBRTHCHMACGGHSCANMGSMVBATBEDBNTWHISOU
LINNUHWESUHN
WMHIPS
HORTRAHUDWDGNMHWYTOHMKTHPETDGEADDLEWTGAHRI
WHTNHHTORBRDENHCOCSCUEBHSTHSUNKMHMKHWARPGHPMSWIRBOLCMI
WSHROTFRM
PILBLAYDHSTMPIN
RHCBRIPAHRUSRDE
RPHRGHKGHRADWWGPOWTLFSGHWCIRSSHINRVBNEVALTCHERLIESUHILSTDYEOWRXBROLERGWHDARMPHCRGFGHCOLNWGNGSSCMWMUSANNTGSEHFAZSTOLDHMAYWHCBARDIDRSURFHREDSLFQEQSALAIRSHHPLYCHSHARSHCSTRIOWRSCWATLONBSLRCHRLUOLDNCRDVHRBEFRYCHGGHSSDGWHHMRIJPHVICWRGRVNAEIMDWNTYSPHQEGUHCASHCGHGLONORBASNUNQAP
Hos
pita
l
ALL
Copyright © National Hip Fracture Database 2013. All rights reserved. 19
National Hip Fracture DatabaseNational report 2013
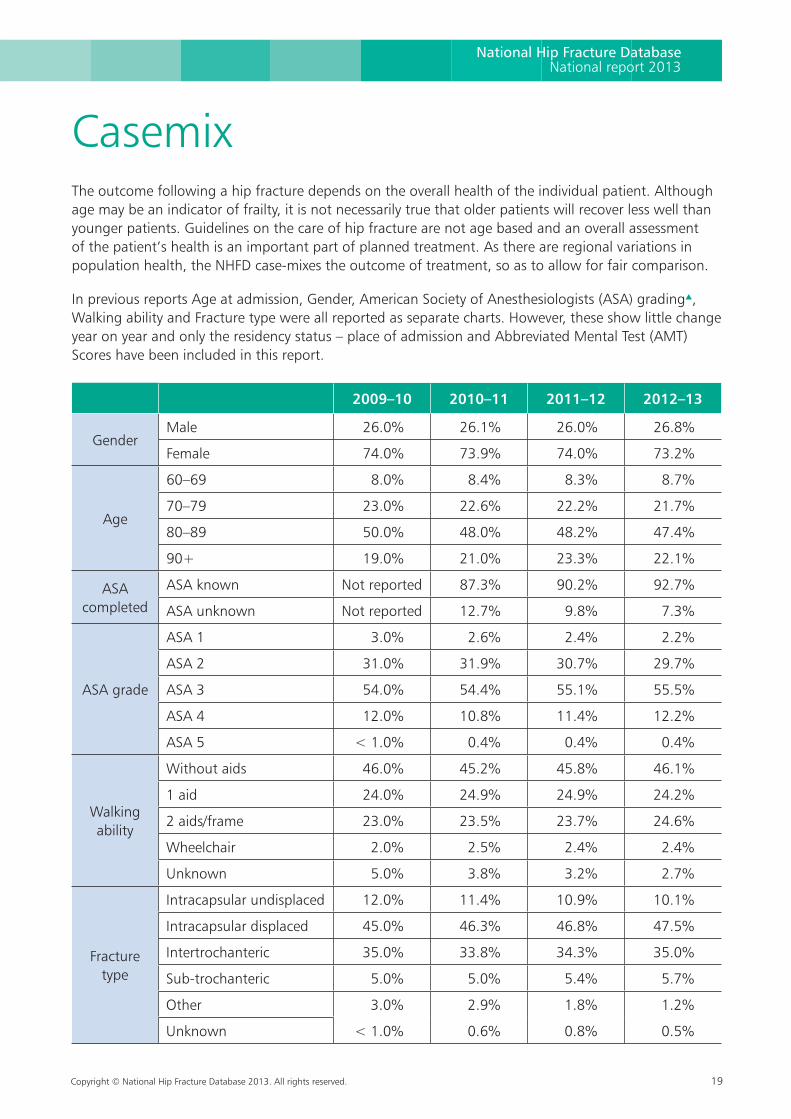
Casemix The outcome following a hip fracture depends on the overall health of the individual patient. Although age may be an indicator of frailty, it is not necessarily true that older patients will recover less well than younger patients. Guidelines on the care of hip fracture are not age based and an overall assessment of the patient’s health is an important part of planned treatment. As there are regional variations in population health, the NHFD case-mixes the outcome of treatment, so as to allow for fair comparison.
In previous reports Age at admission, Gender, American Society of Anesthesiologists (ASA) grading▲, Walking ability and Fracture type were all reported as separate charts. However, these show little change year on year and only the residency status – place of admission and Abbreviated Mental Test (AMT) Scores have been included in this report.
2009–10 2010–11 2011–12 2012–13
GenderMale 26.0% 26.1% 26.0% 26.8%
Female 74.0% 73.9% 74.0% 73.2%
Age
60–69 8.0% 8.4% 8.3% 8.7%
70–79 23.0% 22.6% 22.2% 21.7%
80–89 50.0% 48.0% 48.2% 47.4%
90+ 19.0% 21.0% 23.3% 22.1%
ASA completed
ASA known Not reported 87.3% 90.2% 92.7%
ASA unknown Not reported 12.7% 9.8% 7.3%
ASA grade
ASA 1 3.0% 2.6% 2.4% 2.2%
ASA 2 31.0% 31.9% 30.7% 29.7%
ASA 3 54.0% 54.4% 55.1% 55.5%
ASA 4 12.0% 10.8% 11.4% 12.2%
ASA 5 < 1.0% 0.4% 0.4% 0.4%
Walking ability
Without aids 46.0% 45.2% 45.8% 46.1%
1 aid 24.0% 24.9% 24.9% 24.2%
2 aids/frame 23.0% 23.5% 23.7% 24.6%
Wheelchair 2.0% 2.5% 2.4% 2.4%
Unknown 5.0% 3.8% 3.2% 2.7%
Fracture type
Intracapsular undisplaced 12.0% 11.4% 10.9% 10.1%
Intracapsular displaced 45.0% 46.3% 46.8% 47.5%
Intertrochanteric 35.0% 33.8% 34.3% 35.0%
Sub-trochanteric 5.0% 5.0% 5.4% 5.7%
Other 3.0% 2.9% 1.8% 1.2%
Unknown < 1.0% 0.6% 0.8% 0.5%
20 Copyright © National Hip Fracture Database 2013. All rights reserved.
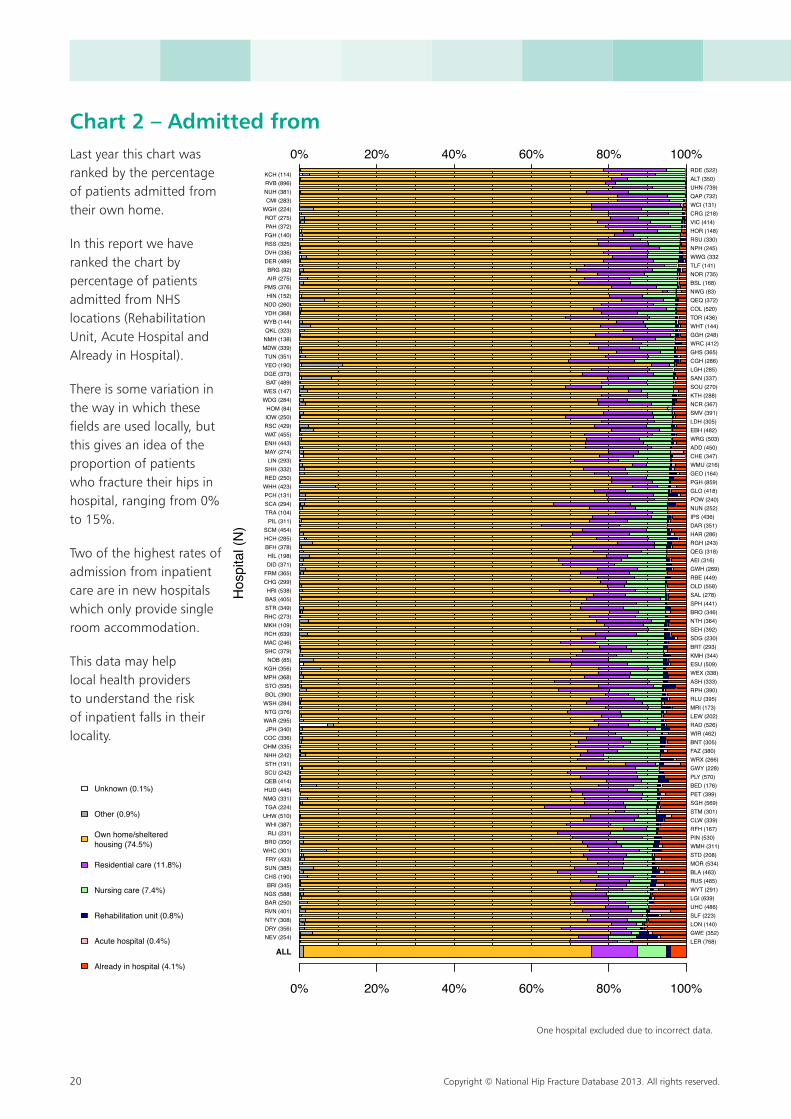
Chart 2 – Admitted fromLast year this chart was ranked by the percentage of patients admitted from their own home.
In this report we have ranked the chart by percentage of patients admitted from NHS locations (Rehabilitation Unit, Acute Hospital and Already in Hospital).
There is some variation in the way in which these fields are used locally, but this gives an idea of the proportion of patients who fracture their hips in hospital, ranging from 0% to 15%.
Two of the highest rates of admission from inpatient care are in new hospitals which only provide single room accommodation.
This data may help local health providers to understand the risk of inpatient falls in their locality.
0% 20% 40% 60% 80% 100%
0% 20% 40% 60% 80% 100%
Unknown (0.1%)
Other (0.9%)
Own home/shelteredhousing (74.5%)
Residential care (11.8%)
Nursing care (7.4%)
Rehabilitation unit (0.8%)
Acute hospital (0.4%)
Already in hospital (4.1%)
Hos
pita
l (N
)
ALL
NEV (254)DRY (356)NTY (308)RVN (401)BAR (250)NGS (588)BRI (345)
CHS (190)SUN (385)FRY (433)
WHC (301)BRD (350)RLI (231)
WHI (387)UHW (510)TGA (224)NMG (331)HUD (445)QEB (414)SCU (242)STH (191)NHH (242)OHM (335)COC (336)JPH (340)
WAR (295)NTG (376)WSH (284)BOL (390)STO (595)MPH (368)KGH (356)
NOB (85)SHC (379)MAC (246)RCH (639)MKH (109)RHC (273)STR (349)BAS (405)HRI (538)
CHG (299)FRM (365)DID (371)HIL (198)
BFH (378)HCH (285)SCM (454)
PIL (311)TRA (104)SCA (294)PCH (131)WHH (423)RED (250)SHH (332)LIN (293)
MAY (274)ENH (443)WAT (455)RSC (429)IOW (250)HOM (84)
WDG (284)WES (147)BAT (489)
DGE (373)YEO (190)TUN (351)
MDW (339)NMH (138)QKL (323)WYB (144)YDH (368)NDD (260)HIN (152)
PMS (376)AIR (275)BRG (92)
DER (489)DVH (336)RSS (325)FGH (140)PAH (372)ROT (275)
WGH (224)CMI (283)
NUH (381)RVB (896)KCH (114)
LER (768)GWE (352)LON (140)SLF (223)UHC (486)LGI (639)WYT (291)RUS (485)BLA (463)MOR (534)STD (208)WMH (311)PIN (530)RFH (167)CLW (339)STM (301)SGH (569)PET (399)BED (176)PLY (570)GWY (228)WRX (266)FAZ (380)BNT (305)WIR (462)RAD (526)LEW (202)MRI (173)RLU (395)RPH (390)ASH (333)WEX (338)ESU (509)KMH (344)BRT (293)SDG (230)SEH (392)NTH (364)BRO (346)SPH (441)SAL (278)OLD (558)RBE (449)GWH (269)AEI (316)QEG (318)RGH (243)HAR (286)DAR (351)IPS (436)NUN (252)POW (240)GLO (418)PGH (859)GEO (164)WMU (216)CHE (347)ADD (450)WRG (503)EBH (482)LDH (305)SMV (391)NCR (367)KTH (288)SOU (270)SAN (337)LGH (285)CGH (286)GHS (365)WRC (412)GGH (248)WHT (144)TOR (436)COL (520)QEQ (372)NWG (83)BSL (168)NOR (735)TLF (141)WWG (332)NPH (245)RSU (330)HOR (148)VIC (414)CRG (218)WCI (131)QAP (732)UHN (739)ALT (350)RDE (522)
One hospital excluded due to incorrect data.
0% 20% 40% 60% 80% 100%
0% 20% 40% 60% 80% 100%
Unknown (0.1%)
Other (0.9%)
Own home/shelteredhousing (74.5%)
Residential care (11.8%)
Nursing care (7.4%)
Rehabilitation unit (0.8%)
Acute hospital (0.4%)
Already in hospital (4.1%)
Hos
pita
l (N
)
ALL
NEV (254)DRY (356)NTY (308)RVN (401)BAR (250)NGS (588)BRI (345)
CHS (190)SUN (385)FRY (433)
WHC (301)BRD (350)RLI (231)
WHI (387)UHW (510)TGA (224)NMG (331)HUD (445)QEB (414)SCU (242)STH (191)NHH (242)OHM (335)COC (336)JPH (340)
WAR (295)NTG (376)WSH (284)BOL (390)STO (595)MPH (368)KGH (356)
NOB (85)SHC (379)MAC (246)RCH (639)MKH (109)RHC (273)STR (349)BAS (405)HRI (538)
CHG (299)FRM (365)DID (371)HIL (198)
BFH (378)HCH (285)SCM (454)
PIL (311)TRA (104)SCA (294)PCH (131)WHH (423)RED (250)SHH (332)LIN (293)
MAY (274)ENH (443)WAT (455)RSC (429)IOW (250)HOM (84)
WDG (284)WES (147)BAT (489)
DGE (373)YEO (190)TUN (351)
MDW (339)NMH (138)QKL (323)WYB (144)YDH (368)NDD (260)HIN (152)
PMS (376)AIR (275)BRG (92)
DER (489)DVH (336)RSS (325)FGH (140)PAH (372)ROT (275)
WGH (224)CMI (283)
NUH (381)RVB (896)KCH (114)
LER (768)GWE (352)LON (140)SLF (223)UHC (486)LGI (639)WYT (291)RUS (485)BLA (463)MOR (534)STD (208)WMH (311)PIN (530)RFH (167)CLW (339)STM (301)SGH (569)PET (399)BED (176)PLY (570)GWY (228)WRX (266)FAZ (380)BNT (305)WIR (462)RAD (526)LEW (202)MRI (173)RLU (395)RPH (390)ASH (333)WEX (338)ESU (509)KMH (344)BRT (293)SDG (230)SEH (392)NTH (364)BRO (346)SPH (441)SAL (278)OLD (558)RBE (449)GWH (269)AEI (316)QEG (318)RGH (243)HAR (286)DAR (351)IPS (436)NUN (252)POW (240)GLO (418)PGH (859)GEO (164)WMU (216)CHE (347)ADD (450)WRG (503)EBH (482)LDH (305)SMV (391)NCR (367)KTH (288)SOU (270)SAN (337)LGH (285)CGH (286)GHS (365)WRC (412)GGH (248)WHT (144)TOR (436)COL (520)QEQ (372)NWG (83)BSL (168)NOR (735)TLF (141)WWG (332)NPH (245)RSU (330)HOR (148)VIC (414)CRG (218)WCI (131)QAP (732)UHN (739)ALT (350)RDE (522)
One hospital excluded due to incorrect data.
One hospital excluded due to incorrect data.
Copyright © National Hip Fracture Database 2013. All rights reserved. 21
National Hip Fracture DatabaseNational report 2013
0% 20% 40% 60% 80% 100%
0% 20% 40% 60% 80% 100%
0−6 (29.6%)
7−10 (58.2%)
Unknown (12.2%) Hos
pita
l (N
)
ALL
RPH (390)POW (240)CLW (339)ALT (350)
NDD (260)SOU (270)NEV (254)TLF (141)RSS (325)CRG (218)HOM (84)RVB (896)STH (191)CHG (299)NUH (381)DER (489)
WDG (284)BFH (378)YEO (190)TUN (351)HIN (152)
WRC (412)HIL (198)PLY (570)LGI (639)JPH (340)
WAR (295)MPH (368)RAD (526)WHT (144)SLF (223)
FRM (365)NWG (83)
CGH (286)KTH (288)GEO (164)CHE (347)BRO (346)RDE (522)QEB (414)WIR (462)
WRX (266)BAT (489)BRT (293)CMI (283)BRD (350)EBH (482)COL (520)MRI (173)HAR (286)RED (250)ROT (275)BAS (405)LER (768)SAL (278)
WEX (338)GWH (269)DVH (336)MAY (274)RSU (330)SHH (332)RUS (485)
WHH (423)HRI (538)
NHH (242)UHN (739)GLO (418)QEG (318)SCU (242)ESU (509)STO (595)AIR (275)
NGS (588)RHC (273)BNT (305)SMV (391)COC (336)CHS (190)KMH (344)BLA (463)BED (176)FGH (140)ADD (450)NTG (376)IOW (250)SCA (294)SDG (230)
WMH (311)TGA (224)ASH (333)
PCH (131)UHW (510)KCH (114)BRG (92)WYB (144)RGH (243)GWY (228)NTH (364)GWE (352)WCI (131)GGH (248)WMU (216)LIN (293)RFH (167)STR (349)MOR (534)VIC (414)BRI (345)MKH (109)WES (147)STD (208)RSC (429)NPH (245)WWG (332)WYT (291)WHC (301)HCH (285)NOR (735)PIL (311)NMG (331)SAN (337)PGH (859)TRA (104)RCH (639)RLU (395)LDH (305)SGH (569)RVN (401)KGH (356)HUD (445)QKL (323)FRY (433)QAP (732)GHS (365)RLI (231)WGH (224)SEH (392)BOL (390)LEW (202)LGH (285)WHI (387)DGE (373)WSH (284)IPS (436)FAZ (380)MAC (246)DRY (356)ENH (443)BAR (250)PMS (376)MDW (339)WAT (455)TOR (436)RBE (449)HOR (148)WRG (503)NOB (85)OLD (558)LON (140)SCM (454)QEQ (372)NCR (367)NUN (252)SHC (379)UHC (486)PAH (372)YDH (368)SPH (441)WDH (256)PET (399)DAR (351)NTY (308)STM (301)PIN (530)OHM (335)DID (371)SUN (385)AEI (316)NMH (138)BSL (168)
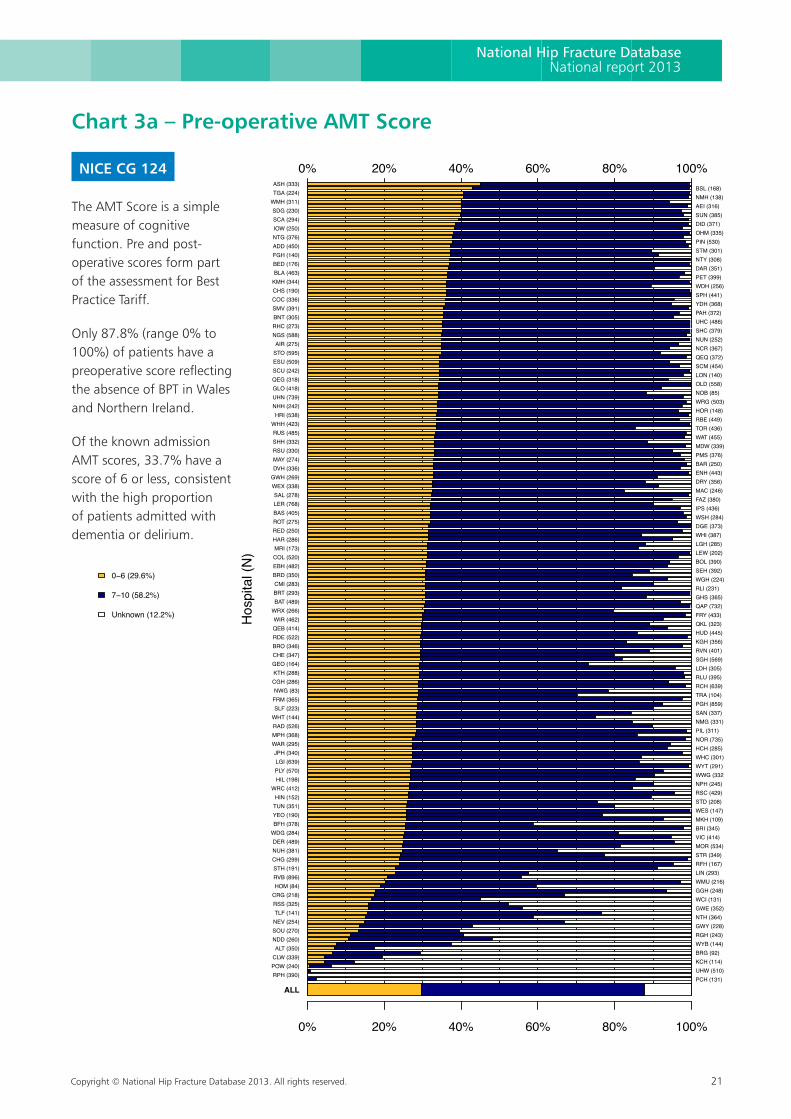
Chart 3a – Pre-operative AMT Score
NICE CG 124
The AMT Score is a simple measure of cognitive function. Pre and post-operative scores form part of the assessment for Best Practice Tariff.
Only 87.8% (range 0% to 100%) of patients have a preoperative score reflecting the absence of BPT in Wales and Northern Ireland.
Of the known admission AMT scores, 33.7% have a score of 6 or less, consistent with the high proportion of patients admitted with dementia or delirium.
22 Copyright © National Hip Fracture Database 2013. All rights reserved.
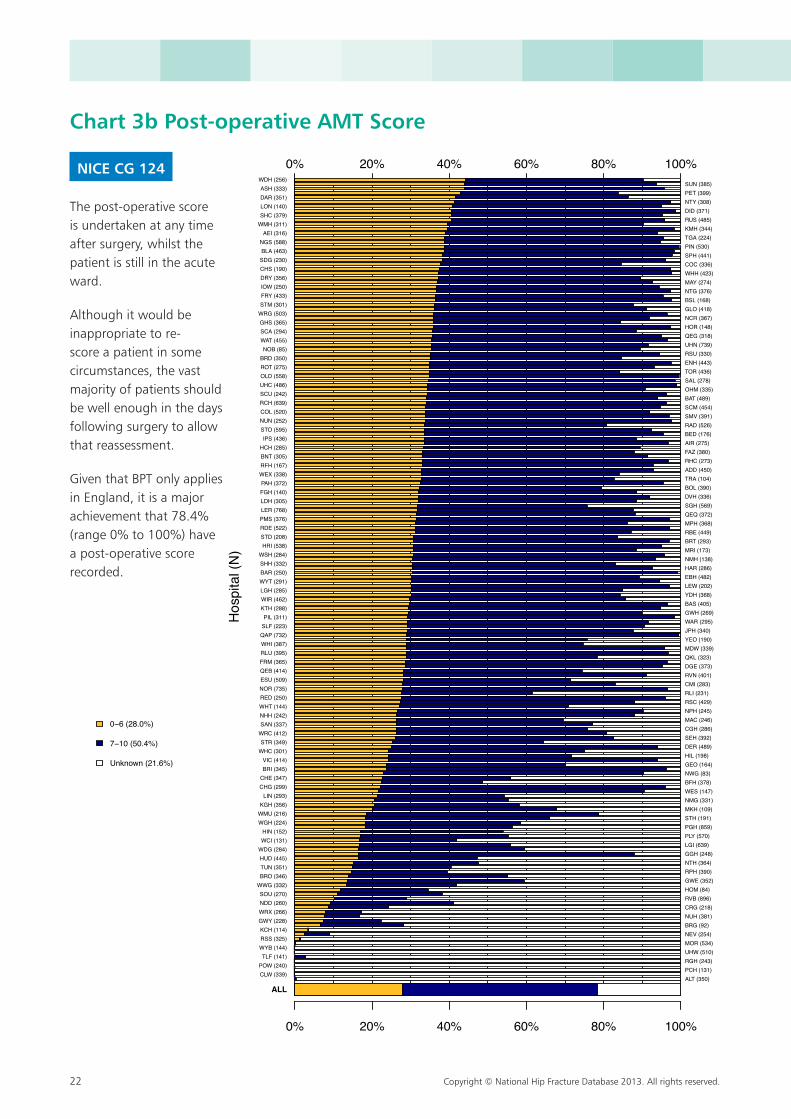
Chart 3b Post-operative AMT Score
NICE CG 124
The post-operative score is undertaken at any time after surgery, whilst the patient is still in the acute ward.
Although it would be inappropriate to re-score a patient in some circumstances, the vast majority of patients should be well enough in the days following surgery to allow that reassessment.
Given that BPT only applies in England, it is a major achievement that 78.4% (range 0% to 100%) have a post-operative score recorded.
0% 20% 40% 60% 80% 100%
0% 20% 40% 60% 80% 100%
0−6 (28.0%)
7−10 (50.4%)
Unknown (21.6%) Hos
pita
l (N
)
ALL
CLW (339)POW (240)
TLF (141)WYB (144)RSS (325)KCH (114)GWY (228)WRX (266)NDD (260)SOU (270)
WWG (332)BRO (346)TUN (351)HUD (445)WDG (284)WCI (131)HIN (152)
WGH (224)WMU (216)KGH (356)
LIN (293)CHG (299)CHE (347)BRI (345)VIC (414)
WHC (301)STR (349)
WRC (412)SAN (337)NHH (242)WHT (144)RED (250)NOR (735)ESU (509)QEB (414)FRM (365)RLU (395)WHI (387)QAP (732)SLF (223)PIL (311)
KTH (288)WIR (462)LGH (285)WYT (291)BAR (250)SHH (332)WSH (284)
HRI (538)STD (208)RDE (522)PMS (376)LER (768)LDH (305)FGH (140)PAH (372)
WEX (338)RFH (167)BNT (305)HCH (285)IPS (436)
STO (595)NUN (252)COL (520)RCH (639)SCU (242)UHC (486)OLD (558)ROT (275)BRD (350)NOB (85)
WAT (455)SCA (294)GHS (365)WRG (503)STM (301)FRY (433)IOW (250)DRY (356)CHS (190)SDG (230)BLA (463)NGS (588)AEI (316)
WMH (311)SHC (379)LON (140)DAR (351)ASH (333)
WDH (256)
ALT (350)PCH (131)RGH (243)UHW (510)MOR (534)NEV (254)BRG (92)NUH (381)CRG (218)RVB (896)HOM (84)GWE (352)RPH (390)NTH (364)GGH (248)LGI (639)PLY (570)PGH (859)STH (191)MKH (109)NMG (331)WES (147)BFH (378)NWG (83)GEO (164)HIL (198)DER (489)SEH (392)CGH (286)MAC (246)NPH (245)RSC (429)RLI (231)CMI (283)RVN (401)DGE (373)QKL (323)MDW (339)YEO (190)JPH (340)WAR (295)GWH (269)BAS (405)YDH (368)LEW (202)EBH (482)HAR (286)NMH (138)MRI (173)BRT (293)RBE (449)MPH (368)QEQ (372)SGH (569)DVH (336)BOL (390)TRA (104)ADD (450)RHC (273)FAZ (380)AIR (275)BED (176)RAD (526)SMV (391)SCM (454)BAT (489)OHM (335)SAL (278)TOR (436)ENH (443)RSU (330)UHN (739)QEG (318)HOR (148)NCR (367)GLO (418)BSL (168)NTG (376)MAY (274)WHH (423)COC (336)SPH (441)PIN (530)TGA (224)KMH (344)RUS (485)DID (371)NTY (308)PET (399)SUN (385)
0% 20% 40% 60% 80% 100%
0% 20% 40% 60% 80% 100%
0−6 (28.0%)
7−10 (50.4%)
Unknown (21.6%) Hos
pita
l (N
)
ALL
CLW (339)POW (240)
TLF (141)WYB (144)RSS (325)KCH (114)GWY (228)WRX (266)NDD (260)SOU (270)
WWG (332)BRO (346)TUN (351)HUD (445)WDG (284)WCI (131)HIN (152)
WGH (224)WMU (216)KGH (356)
LIN (293)CHG (299)CHE (347)BRI (345)VIC (414)
WHC (301)STR (349)
WRC (412)SAN (337)NHH (242)WHT (144)RED (250)NOR (735)ESU (509)QEB (414)FRM (365)RLU (395)WHI (387)QAP (732)SLF (223)PIL (311)
KTH (288)WIR (462)LGH (285)WYT (291)BAR (250)SHH (332)WSH (284)
HRI (538)STD (208)RDE (522)PMS (376)LER (768)LDH (305)FGH (140)PAH (372)
WEX (338)RFH (167)BNT (305)HCH (285)IPS (436)
STO (595)NUN (252)COL (520)RCH (639)SCU (242)UHC (486)OLD (558)ROT (275)BRD (350)NOB (85)
WAT (455)SCA (294)GHS (365)WRG (503)STM (301)FRY (433)IOW (250)DRY (356)CHS (190)SDG (230)BLA (463)NGS (588)AEI (316)
WMH (311)SHC (379)LON (140)DAR (351)ASH (333)
WDH (256)
ALT (350)PCH (131)RGH (243)UHW (510)MOR (534)NEV (254)BRG (92)NUH (381)CRG (218)RVB (896)HOM (84)GWE (352)RPH (390)NTH (364)GGH (248)LGI (639)PLY (570)PGH (859)STH (191)MKH (109)NMG (331)WES (147)BFH (378)NWG (83)GEO (164)HIL (198)DER (489)SEH (392)CGH (286)MAC (246)NPH (245)RSC (429)RLI (231)CMI (283)RVN (401)DGE (373)QKL (323)MDW (339)YEO (190)JPH (340)WAR (295)GWH (269)BAS (405)YDH (368)LEW (202)EBH (482)HAR (286)NMH (138)MRI (173)BRT (293)RBE (449)MPH (368)QEQ (372)SGH (569)DVH (336)BOL (390)TRA (104)ADD (450)RHC (273)FAZ (380)AIR (275)BED (176)RAD (526)SMV (391)SCM (454)BAT (489)OHM (335)SAL (278)TOR (436)ENH (443)RSU (330)UHN (739)QEG (318)HOR (148)NCR (367)GLO (418)BSL (168)NTG (376)MAY (274)WHH (423)COC (336)SPH (441)PIN (530)TGA (224)KMH (344)RUS (485)DID (371)NTY (308)PET (399)SUN (385)
Copyright © National Hip Fracture Database 2013. All rights reserved. 23
National Hip Fracture DatabaseNational report 2013
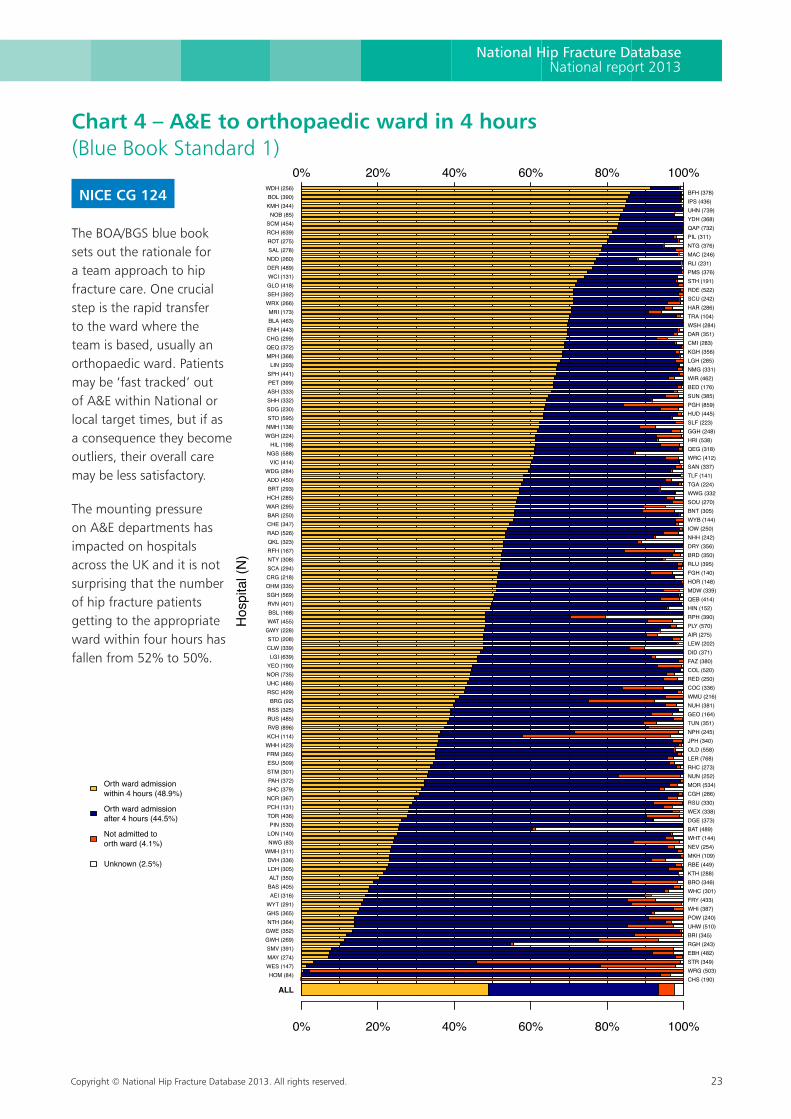
Chart 4 – A&E to orthopaedic ward in 4 hours (Blue Book Standard 1)
NICE CG 124
The BOA/BGS blue book sets out the rationale for a team approach to hip fracture care. One crucial step is the rapid transfer to the ward where the team is based, usually an orthopaedic ward. Patients may be ‘fast tracked’ out of A&E within National or local target times, but if as a consequence they become outliers, their overall care may be less satisfactory.
The mounting pressure on A&E departments has impacted on hospitals across the UK and it is not surprising that the number of hip fracture patients getting to the appropriate ward within four hours has fallen from 52% to 50%.
0% 20% 40% 60% 80% 100%
0% 20% 40% 60% 80% 100%
Orth ward admissionwithin 4 hours (48.9%)
Orth ward admissionafter 4 hours (44.5%)
Not admitted toorth ward (4.1%)
Unknown (2.5%)
Hos
pita
l (N
)
ALL
HOM (84)WES (147)MAY (274)SMV (391)GWH (269)GWE (352)NTH (364)GHS (365)WYT (291)
AEI (316)BAS (405)ALT (350)LDH (305)DVH (336)
WMH (311)NWG (83)LON (140)PIN (530)
TOR (436)PCH (131)NCR (367)SHC (379)PAH (372)STM (301)ESU (509)FRM (365)WHH (423)KCH (114)RVB (896)RUS (485)RSS (325)BRG (92)
RSC (429)UHC (486)NOR (735)YEO (190)LGI (639)
CLW (339)STD (208)
GWY (228)WAT (455)BSL (168)RVN (401)SGH (569)OHM (335)CRG (218)SCA (294)NTY (308)RFH (167)QKL (323)RAD (526)CHE (347)BAR (250)WAR (295)HCH (285)BRT (293)ADD (450)
WDG (284)VIC (414)
NGS (588)HIL (198)
WGH (224)NMH (138)STO (595)SDG (230)SHH (332)ASH (333)PET (399)SPH (441)LIN (293)
MPH (368)QEQ (372)CHG (299)ENH (443)BLA (463)MRI (173)
WRX (266)SEH (392)GLO (418)WCI (131)DER (489)NDD (260)SAL (278)ROT (275)RCH (639)SCM (454)
NOB (85)KMH (344)BOL (390)
WDH (256)
CHS (190)WRG (503)STR (349)EBH (482)RGH (243)BRI (345)UHW (510)POW (240)WHI (387)FRY (433)WHC (301)BRO (346)KTH (288)RBE (449)MKH (109)NEV (254)WHT (144)BAT (489)DGE (373)WEX (338)RSU (330)CGH (286)MOR (534)NUN (252)RHC (273)LER (768)OLD (558)JPH (340)NPH (245)TUN (351)GEO (164)NUH (381)WMU (216)COC (336)RED (250)COL (520)FAZ (380)DID (371)LEW (202)AIR (275)PLY (570)RPH (390)HIN (152)QEB (414)MDW (339)HOR (148)FGH (140)RLU (395)BRD (350)DRY (356)NHH (242)IOW (250)WYB (144)BNT (305)SOU (270)WWG (332)TGA (224)TLF (141)SAN (337)WRC (412)QEG (318)HRI (538)GGH (248)SLF (223)HUD (445)PGH (859)SUN (385)BED (176)WIR (462)NMG (331)LGH (285)KGH (356)CMI (283)DAR (351)WSH (284)TRA (104)HAR (286)SCU (242)RDE (522)STH (191)PMS (376)RLI (231)MAC (246)NTG (376)PIL (311)QAP (732)YDH (368)UHN (739)IPS (436)BFH (378)
0% 20% 40% 60% 80% 100%
0% 20% 40% 60% 80% 100%
Orth ward admissionwithin 4 hours (48.9%)
Orth ward admissionafter 4 hours (44.5%)
Not admitted toorth ward (4.1%)
Unknown (2.5%)
Hos
pita
l (N
)
ALL
HOM (84)WES (147)MAY (274)SMV (391)GWH (269)GWE (352)NTH (364)GHS (365)WYT (291)
AEI (316)BAS (405)ALT (350)LDH (305)DVH (336)
WMH (311)NWG (83)LON (140)PIN (530)
TOR (436)PCH (131)NCR (367)SHC (379)PAH (372)STM (301)ESU (509)FRM (365)WHH (423)KCH (114)RVB (896)RUS (485)RSS (325)BRG (92)
RSC (429)UHC (486)NOR (735)YEO (190)LGI (639)
CLW (339)STD (208)
GWY (228)WAT (455)BSL (168)RVN (401)SGH (569)OHM (335)CRG (218)SCA (294)NTY (308)RFH (167)QKL (323)RAD (526)CHE (347)BAR (250)WAR (295)HCH (285)BRT (293)ADD (450)
WDG (284)VIC (414)
NGS (588)HIL (198)
WGH (224)NMH (138)STO (595)SDG (230)SHH (332)ASH (333)PET (399)SPH (441)LIN (293)
MPH (368)QEQ (372)CHG (299)ENH (443)BLA (463)MRI (173)
WRX (266)SEH (392)GLO (418)WCI (131)DER (489)NDD (260)SAL (278)ROT (275)RCH (639)SCM (454)
NOB (85)KMH (344)BOL (390)
WDH (256)
CHS (190)WRG (503)STR (349)EBH (482)RGH (243)BRI (345)UHW (510)POW (240)WHI (387)FRY (433)WHC (301)BRO (346)KTH (288)RBE (449)MKH (109)NEV (254)WHT (144)BAT (489)DGE (373)WEX (338)RSU (330)CGH (286)MOR (534)NUN (252)RHC (273)LER (768)OLD (558)JPH (340)NPH (245)TUN (351)GEO (164)NUH (381)WMU (216)COC (336)RED (250)COL (520)FAZ (380)DID (371)LEW (202)AIR (275)PLY (570)RPH (390)HIN (152)QEB (414)MDW (339)HOR (148)FGH (140)RLU (395)BRD (350)DRY (356)NHH (242)IOW (250)WYB (144)BNT (305)SOU (270)WWG (332)TGA (224)TLF (141)SAN (337)WRC (412)QEG (318)HRI (538)GGH (248)SLF (223)HUD (445)PGH (859)SUN (385)BED (176)WIR (462)NMG (331)LGH (285)KGH (356)CMI (283)DAR (351)WSH (284)TRA (104)HAR (286)SCU (242)RDE (522)STH (191)PMS (376)RLI (231)MAC (246)NTG (376)PIL (311)QAP (732)YDH (368)UHN (739)IPS (436)BFH (378)
24 Copyright © National Hip Fracture Database 2013. All rights reserved.
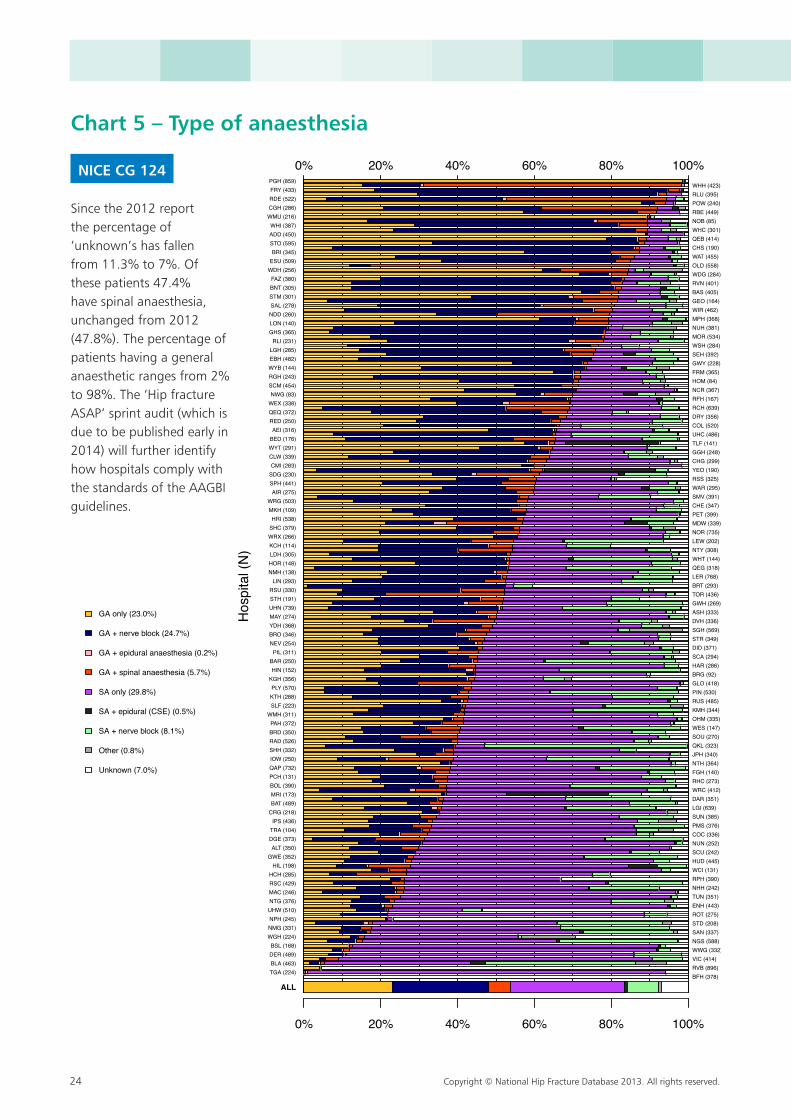
Chart 5 – Type of anaesthesia
NICE CG 124
Since the 2012 report the percentage of ‘unknown’s has fallen from 11.3% to 7%. Of these patients 47.4% have spinal anaesthesia, unchanged from 2012 (47.8%). The percentage of patients having a general anaesthetic ranges from 2% to 98%. The ‘Hip fracture ASAP’ sprint audit (which is due to be published early in 2014) will further identify how hospitals comply with the standards of the AAGBI guidelines.
0% 20% 40% 60% 80% 100%
0% 20% 40% 60% 80% 100%
GA only (23.0%)
GA + nerve block (24.7%)
GA + epidural anaesthesia (0.2%)
GA + spinal anaesthesia (5.7%)
SA only (29.8%)
SA + epidural (CSE) (0.5%)
SA + nerve block (8.1%)
Other (0.8%)
Unknown (7.0%)
Hos
pita
l (N
)
ALL
TGA (224)BLA (463)DER (489)BSL (168)
WGH (224)NMG (331)NPH (245)
UHW (510)NTG (376)MAC (246)RSC (429)HCH (285)
HIL (198)GWE (352)
ALT (350)DGE (373)TRA (104)IPS (436)
CRG (218)BAT (489)MRI (173)BOL (390)PCH (131)QAP (732)IOW (250)SHH (332)RAD (526)BRD (350)PAH (372)
WMH (311)SLF (223)KTH (288)PLY (570)
KGH (356)HIN (152)
BAR (250)PIL (311)
NEV (254)BRO (346)YDH (368)MAY (274)UHN (739)STH (191)RSU (330)LIN (293)
NMH (138)HOR (148)LDH (305)KCH (114)WRX (266)SHC (379)HRI (538)
MKH (109)WRG (503)
AIR (275)SPH (441)SDG (230)CMI (283)
CLW (339)WYT (291)BED (176)AEI (316)
RED (250)QEQ (372)WEX (338)NWG (83)
SCM (454)RGH (243)WYB (144)EBH (482)LGH (285)RLI (231)
GHS (365)LON (140)NDD (260)SAL (278)STM (301)BNT (305)FAZ (380)
WDH (256)ESU (509)BRI (345)
STO (595)ADD (450)WHI (387)
WMU (216)CGH (286)RDE (522)FRY (433)PGH (859)
BFH (378)RVB (896)VIC (414)WWG (332)NGS (588)SAN (337)STD (208)ROT (275)ENH (443)TUN (351)NHH (242)RPH (390)WCI (131)HUD (445)SCU (242)NUN (252)COC (336)PMS (376)SUN (385)LGI (639)DAR (351)WRC (412)RHC (273)FGH (140)NTH (364)JPH (340)QKL (323)SOU (270)WES (147)OHM (335)KMH (344)RUS (485)PIN (530)GLO (418)BRG (92)HAR (286)SCA (294)DID (371)STR (349)SGH (569)DVH (336)ASH (333)GWH (269)TOR (436)BRT (293)LER (768)QEG (318)WHT (144)NTY (308)LEW (202)NOR (735)MDW (339)PET (399)CHE (347)SMV (391)WAR (295)RSS (325)YEO (190)CHG (299)GGH (248)TLF (141)UHC (486)COL (520)DRY (356)RCH (639)RFH (167)NCR (367)HOM (84)FRM (365)GWY (228)SEH (392)WSH (284)MOR (534)NUH (381)MPH (368)WIR (462)GEO (164)BAS (405)RVN (401)WDG (284)OLD (558)WAT (455)CHS (190)QEB (414)WHC (301)NOB (85)RBE (449)POW (240)RLU (395)WHH (423)
0% 20% 40% 60% 80% 100%
0% 20% 40% 60% 80% 100%
GA only (23.0%)
GA + nerve block (24.7%)
GA + epidural anaesthesia (0.2%)
GA + spinal anaesthesia (5.7%)
SA only (29.8%)
SA + epidural (CSE) (0.5%)
SA + nerve block (8.1%)
Other (0.8%)
Unknown (7.0%)
Hos
pita
l (N
)
ALL
TGA (224)BLA (463)DER (489)BSL (168)
WGH (224)NMG (331)NPH (245)
UHW (510)NTG (376)MAC (246)RSC (429)HCH (285)
HIL (198)GWE (352)
ALT (350)DGE (373)TRA (104)IPS (436)
CRG (218)BAT (489)MRI (173)BOL (390)PCH (131)QAP (732)IOW (250)SHH (332)RAD (526)BRD (350)PAH (372)
WMH (311)SLF (223)KTH (288)PLY (570)
KGH (356)HIN (152)
BAR (250)PIL (311)
NEV (254)BRO (346)YDH (368)MAY (274)UHN (739)STH (191)RSU (330)LIN (293)
NMH (138)HOR (148)LDH (305)KCH (114)WRX (266)SHC (379)HRI (538)
MKH (109)WRG (503)
AIR (275)SPH (441)SDG (230)CMI (283)
CLW (339)WYT (291)BED (176)AEI (316)
RED (250)QEQ (372)WEX (338)NWG (83)
SCM (454)RGH (243)WYB (144)EBH (482)LGH (285)RLI (231)
GHS (365)LON (140)NDD (260)SAL (278)STM (301)BNT (305)FAZ (380)
WDH (256)ESU (509)BRI (345)
STO (595)ADD (450)WHI (387)
WMU (216)CGH (286)RDE (522)FRY (433)PGH (859)
BFH (378)RVB (896)VIC (414)WWG (332)NGS (588)SAN (337)STD (208)ROT (275)ENH (443)TUN (351)NHH (242)RPH (390)WCI (131)HUD (445)SCU (242)NUN (252)COC (336)PMS (376)SUN (385)LGI (639)DAR (351)WRC (412)RHC (273)FGH (140)NTH (364)JPH (340)QKL (323)SOU (270)WES (147)OHM (335)KMH (344)RUS (485)PIN (530)GLO (418)BRG (92)HAR (286)SCA (294)DID (371)STR (349)SGH (569)DVH (336)ASH (333)GWH (269)TOR (436)BRT (293)LER (768)QEG (318)WHT (144)NTY (308)LEW (202)NOR (735)MDW (339)PET (399)CHE (347)SMV (391)WAR (295)RSS (325)YEO (190)CHG (299)GGH (248)TLF (141)UHC (486)COL (520)DRY (356)RCH (639)RFH (167)NCR (367)HOM (84)FRM (365)GWY (228)SEH (392)WSH (284)MOR (534)NUH (381)MPH (368)WIR (462)GEO (164)BAS (405)RVN (401)WDG (284)OLD (558)WAT (455)CHS (190)QEB (414)WHC (301)NOB (85)RBE (449)POW (240)RLU (395)WHH (423)
Copyright © National Hip Fracture Database 2013. All rights reserved. 25
National Hip Fracture DatabaseNational report 2013
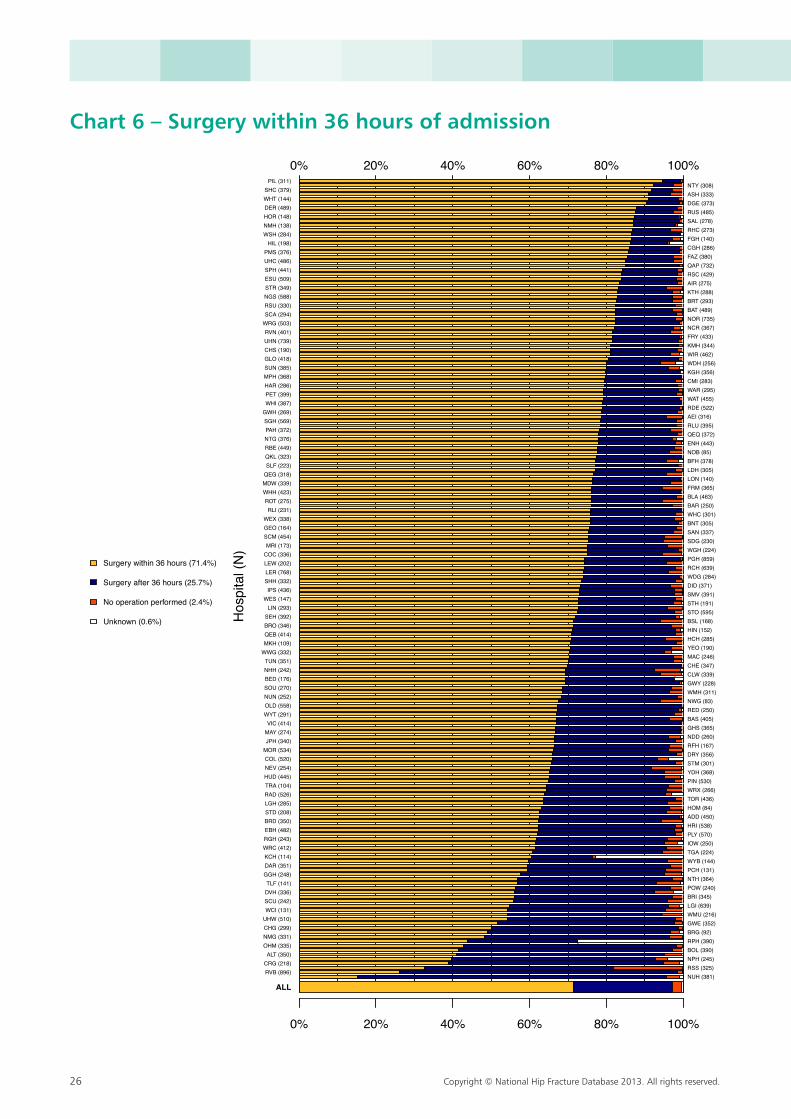
Time to surgeryWe present three charts on time to surgery. Surgery within 36 hours of admission is a BPT criterion whilst surgery on ‘the day of or the day after admission’ is a NICE guideline and surgery within 48 hours and during normal working hours is a Blue Book standard.
The first two charts are extremely similar, with an average compliance of 71% (up from 67% in 2012). The range from 14% to 94% demonstrates clearly how care varies around the UK. Four of the five hospitals with less than 40% of patients operated on within 36 hours are situated in Northern Ireland which operates a centralised ‘hub and spoke’ service.
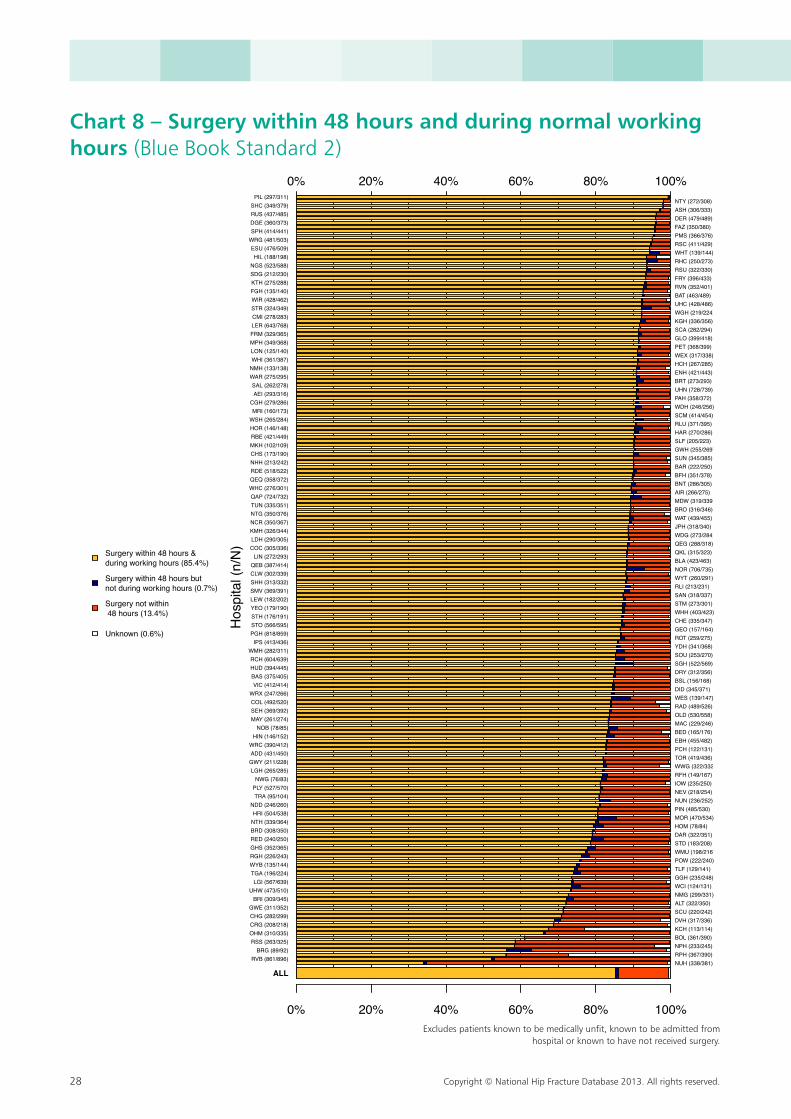
The third chart, surgery within 48 hours and during normal working hours, excludes people who break their hips in hospital or who remain medically unfit at 48 hours, consequently we would expect almost 100% of hospitals to comply with this standard. It is pleasing to see the average rise from 82.4 in 2012 to 85.4%, but the range shows unacceptable variation – from 44% to 98%.
The reason for delay at 36 hours is now recorded for 91.3% of patients, an improvement on 85.8% in 2012.
Nationally, the cause for delay continues to be attributed evenly between medical and administrative causes, but the percentage of delays for administrative reasons varies between different units – from 0% to 79%.
There is clearly an opportunity for providers to review their provision of trauma lists as this is by far the commonest reason for delay accounting for 40% of known causes.
The cumulative time to theatre chart shows a consistent year on year improvement as time to theatre is reduced across the hospitals participating in the NHFD.
There is no evidence of any generalised ‘gaming’, or suggestion that patients who are at the point of breaching the BPT 36 hour limit are being prioritised at the expense of those who have already breached. The variance of the curve every 24 hours appears to result from the diurnal rhythm of admissions (which predominantly occur between 11:00 and 23:00), and of trauma operating lists (which are mainly between 08:00 and 20:00).
The percentage of patients not treated with surgery has fallen from 2.8% in 2011 to 2.4%. The range however is from 0% to 18%. Only one hospital (RSS) continues to treat more than 10% of its patients non-surgically.
26 Copyright © National Hip Fracture Database 2013. All rights reserved.
0% 20% 40% 60% 80% 100%
0% 20% 40% 60% 80% 100%
Surgery within 36 hours (71.4%)
Surgery after 36 hours (25.7%)
No operation performed (2.4%)
Unknown (0.6%) Hos
pita
l (N
)
ALL
RVB (896)CRG (218)ALT (350)
OHM (335)NMG (331)CHG (299)UHW (510)WCI (131)SCU (242)DVH (336)TLF (141)
GGH (248)DAR (351)KCH (114)
WRC (412)RGH (243)EBH (482)BRD (350)STD (208)LGH (285)RAD (526)TRA (104)HUD (445)NEV (254)COL (520)MOR (534)JPH (340)MAY (274)VIC (414)
WYT (291)OLD (558)NUN (252)SOU (270)BED (176)NHH (242)TUN (351)
WWG (332)MKH (109)QEB (414)BRO (346)SEH (392)LIN (293)
WES (147)IPS (436)
SHH (332)LER (768)LEW (202)COC (336)MRI (173)
SCM (454)GEO (164)WEX (338)
RLI (231)ROT (275)
WHH (423)MDW (339)QEG (318)SLF (223)QKL (323)RBE (449)NTG (376)PAH (372)SGH (569)
GWH (269)WHI (387)PET (399)HAR (286)MPH (368)SUN (385)GLO (418)CHS (190)UHN (739)RVN (401)
WRG (503)SCA (294)RSU (330)NGS (588)STR (349)ESU (509)SPH (441)UHC (486)PMS (376)
HIL (198)WSH (284)NMH (138)HOR (148)DER (489)WHT (144)SHC (379)
PIL (311)
NUH (381)RSS (325)NPH (245)BOL (390)RPH (390)BRG (92)GWE (352)WMU (216)LGI (639)BRI (345)POW (240)NTH (364)PCH (131)WYB (144)TGA (224)IOW (250)PLY (570)HRI (538)ADD (450)HOM (84)TOR (436)WRX (266)PIN (530)YDH (368)STM (301)DRY (356)RFH (167)NDD (260)GHS (365)BAS (405)RED (250)NWG (83)WMH (311)GWY (228)CLW (339)CHE (347)MAC (246)YEO (190)HCH (285)HIN (152)BSL (168)STO (595)STH (191)SMV (391)DID (371)WDG (284)RCH (639)PGH (859)WGH (224)SDG (230)SAN (337)BNT (305)WHC (301)BAR (250)BLA (463)FRM (365)LON (140)LDH (305)BFH (378)NOB (85)ENH (443)QEQ (372)RLU (395)AEI (316)RDE (522)WAT (455)WAR (295)CMI (283)KGH (356)WDH (256)WIR (462)KMH (344)FRY (433)NCR (367)NOR (735)BAT (489)BRT (293)KTH (288)AIR (275)RSC (429)QAP (732)FAZ (380)CGH (286)FGH (140)RHC (273)SAL (278)RUS (485)DGE (373)ASH (333)NTY (308)
Chart 6 – Surgery within 36 hours of admission
Copyright © National Hip Fracture Database 2013. All rights reserved. 27
National Hip Fracture DatabaseNational report 2013
0% 20% 40% 60% 80% 100%
0% 20% 40% 60% 80% 100%
Surgery on day of, or dayafter, admission (70.6%)
Surgery two or more calendardays after admission (26.5%)
No operation performed (2.4%)
Unknown (0.5%)
Hos
pita
l (N
)
ALL
RVB (896)CRG (218)NPH (245)OHM (335)CHG (299)
BRG (92)LGI (639)
WMU (216)SCU (242)NTH (364)DVH (336)GGH (248)PLY (570)
DAR (351)KCH (114)
WRC (412)TOR (436)BRD (350)RGH (243)LGH (285)RAD (526)HOM (84)TRA (104)PIN (530)
RFH (167)GHS (365)BAS (405)JPH (340)
SOU (270)OLD (558)RED (250)MOR (534)CHE (347)CLW (339)BED (176)MAC (246)BRO (346)TUN (351)
WWG (332)IPS (436)DID (371)
YEO (190)SEH (392)STO (595)HIN (152)LER (768)
COC (336)RLI (231)
GEO (164)WGH (224)ENH (443)BNT (305)
WHC (301)SDG (230)LON (140)BAR (250)QKL (323)RDE (522)NOB (85)
ROT (275)SGH (569)NTG (376)KMH (344)WAT (455)HAR (286)WHI (387)
MPH (368)SUN (385)CMI (283)
GWH (269)GLO (418)WDH (256)UHN (739)RSC (429)SCA (294)NGS (588)NOR (735)NCR (367)SPH (441)ESU (509)RUS (485)FAZ (380)SAL (278)
CGH (286)HIL (198)
NMH (138)DER (489)ASH (333)SHC (379)
PIL (311)
NUH (381)RSS (325)ALT (350)BOL (390)RPH (390)NMG (331)GWE (352)UHW (510)HRI (538)POW (240)BRI (345)WCI (131)TLF (141)PCH (131)WYB (144)TGA (224)EBH (482)STM (301)IOW (250)ADD (450)STD (208)COL (520)WRX (266)HUD (445)NDD (260)NUN (252)YDH (368)NEV (254)DRY (356)MAY (274)WYT (291)VIC (414)WMH (311)NWG (83)GWY (228)QEB (414)SMV (391)MKH (109)STH (191)BSL (168)HCH (285)PGH (859)NHH (242)SHH (332)RCH (639)WDG (284)MRI (173)LIN (293)SCM (454)SAN (337)LEW (202)MDW (339)BLA (463)WHH (423)WES (147)FRM (365)LDH (305)SLF (223)RLU (395)QEG (318)WEX (338)RBE (449)BFH (378)QEQ (372)AEI (316)PAH (372)KGH (356)PET (399)FRY (433)WRG (503)WAR (295)BAT (489)RVN (401)WIR (462)RSU (330)CHS (190)BRT (293)STR (349)KTH (288)AIR (275)QAP (732)UHC (486)PMS (376)WSH (284)RHC (273)FGH (140)HOR (148)DGE (373)WHT (144)NTY (308)
Chart 7 – Surgery on the day of or day after admission
NICE CG 124
28 Copyright © National Hip Fracture Database 2013. All rights reserved.
0% 20% 40% 60% 80% 100%
0% 20% 40% 60% 80% 100%
Surgery within 48 hours &during working hours (85.4%)
Surgery within 48 hours butnot during working hours (0.7%)
Surgery not within 48 hours (13.4%)
Unknown (0.6%)
Hos
pita
l (n/
N)
ALL
RVB (861/896)BRG (89/92)
RSS (263/325)OHM (310/335)CRG (208/218)CHG (282/299)GWE (311/352)
BRI (309/345)UHW (473/510)
LGI (567/639)TGA (196/224)WYB (135/144)RGH (226/243)GHS (352/365)RED (240/250)BRD (308/350)NTH (339/364)HRI (504/538)
NDD (246/260)TRA (95/104)
PLY (527/570)NWG (76/83)
LGH (265/285)GWY (211/228)ADD (431/450)
WRC (390/412)HIN (146/152)
NOB (78/85)MAY (261/274)SEH (369/392)COL (492/520)WRX (247/266)
VIC (412/414)BAS (375/405)HUD (394/445)RCH (604/639)
WMH (282/311)IPS (413/436)
PGH (818/859)STO (566/595)STH (176/191)YEO (179/190)LEW (182/202)SMV (369/391)SHH (313/332)CLW (302/339)QEB (387/414)
LIN (272/293)COC (305/336)LDH (290/305)KMH (326/344)NCR (350/367)NTG (350/376)TUN (335/351)QAP (724/732)WHC (276/301)QEQ (358/372)RDE (518/522)NHH (213/242)CHS (173/190)MKH (102/109)RBE (421/449)HOR (146/148)WSH (265/284)MRI (160/173)
CGH (279/286)AEI (293/316)
SAL (262/278)WAR (275/295)NMH (133/138)WHI (361/387)LON (125/140)MPH (349/368)FRM (329/365)LER (643/768)CMI (278/283)STR (324/349)WIR (428/462)FGH (135/140)KTH (275/288)SDG (212/230)NGS (523/588)
HIL (188/198)ESU (476/509)
WRG (481/503)SPH (414/441)DGE (360/373)RUS (437/485)SHC (349/379)
PIL (297/311)
NUH (338/381)RPH (367/390)NPH (233/245)BOL (361/390)KCH (113/114)DVH (317/336)SCU (220/242)ALT (322/350)NMG (299/331)WCI (124/131)GGH (235/248)TLF (129/141)POW (222/240)WMU (198/216)STD (183/208)DAR (322/351)HOM (78/84)MOR (470/534)PIN (485/530)NUN (236/252)NEV (218/254)IOW (235/250)RFH (149/167)WWG (322/332)TOR (419/436)PCH (122/131)EBH (455/482)BED (165/176)MAC (229/246)OLD (530/558)RAD (489/526)WES (139/147)DID (345/371)BSL (156/168)DRY (312/356)SGH (522/569)SOU (253/270)YDH (341/368)ROT (259/275)GEO (157/164)CHE (335/347)WHH (403/423)STM (273/301)SAN (318/337)RLI (213/231)WYT (260/291)NOR (706/735)BLA (423/463)QKL (315/323)QEG (288/318)WDG (273/284)JPH (318/340)WAT (439/455)BRO (316/346)MDW (319/339)AIR (266/275)BNT (286/305)BFH (351/378)BAR (222/250)SUN (345/385)GWH (255/269)SLF (205/223)HAR (270/286)RLU (371/395)SCM (414/454)WDH (246/256)PAH (358/372)UHN (728/739)BRT (273/293)ENH (421/443)HCH (267/285)WEX (317/338)PET (368/399)GLO (399/418)SCA (282/294)KGH (336/356)WGH (219/224)UHC (428/486)BAT (463/489)RVN (352/401)FRY (396/433)RSU (322/330)RHC (250/273)WHT (139/144)RSC (411/429)PMS (366/376)FAZ (350/380)DER (479/489)ASH (306/333)NTY (272/308)
Excludes patients known to be medically unfit, known to be admitted from hospital or known to have not received surgery.
Chart 8 – Surgery within 48 hours and during normal working hours (Blue Book Standard 2)
Excludes patients known to be medically unfit, known to be admitted from hospital or known to have not received surgery.
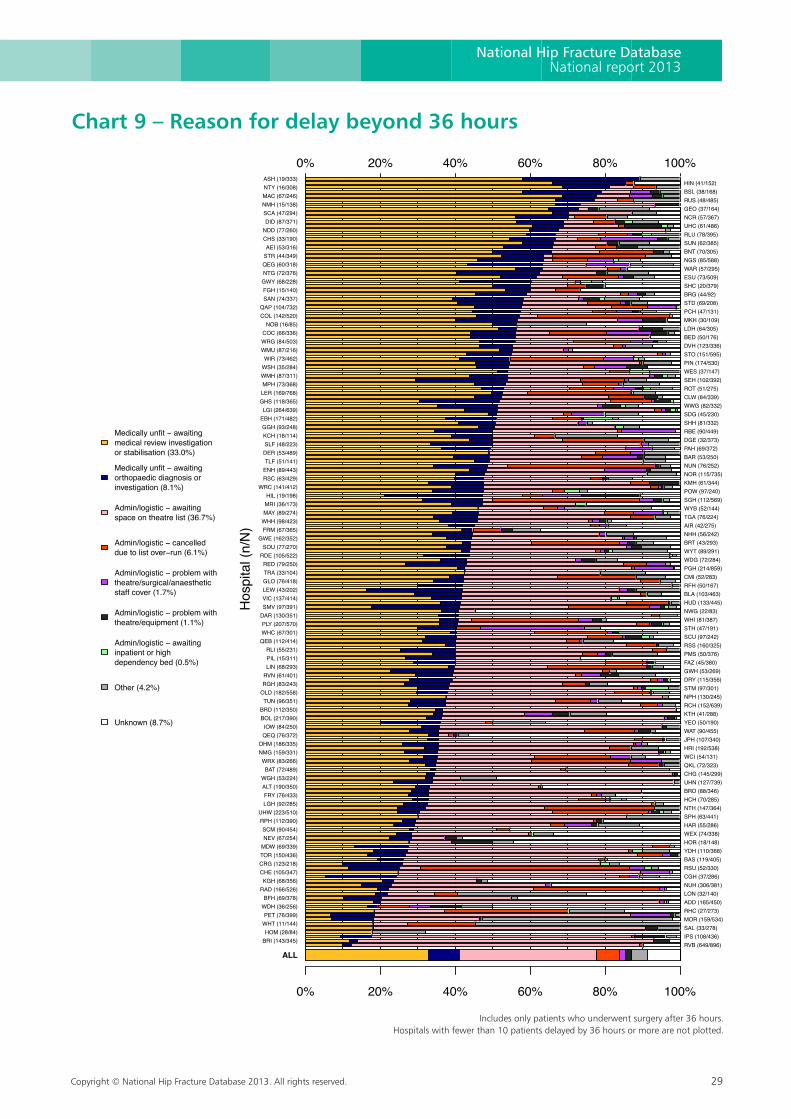
Copyright © National Hip Fracture Database 2013. All rights reserved. 29
National Hip Fracture DatabaseNational report 2013
Chart 9 – Reason for delay beyond 36 hours
0% 20% 40% 60% 80% 100%
0% 20% 40% 60% 80% 100%
Medically unfit − awaitingmedical review investigationor stabilisation (33.0%)
Medically unfit − awaitingorthopaedic diagnosis orinvestigation (8.1%)
Admin/logistic − awaitingspace on theatre list (36.7%)
Admin/logistic − cancelleddue to list over−run (6.1%)
Admin/logistic − problem withtheatre/surgical/anaestheticstaff cover (1.7%)
Admin/logistic − problem withtheatre/equipment (1.1%)
Admin/logistic − awaitinginpatient or highdependency bed (0.5%)
Other (4.2%)
Unknown (8.7%)
Hos
pita
l (n/
N)
ALL
BRI (143/345)HOM (28/84)
WHT (11/144)PET (76/399)
WDH (36/256)BFH (69/378)
RAD (166/526)KGH (68/356)
CHE (105/347)CRG (123/218)TOR (150/436)MDW (69/339)NEV (67/254)SCM (90/454)
RPH (112/390)UHW (223/510)
LGH (92/285)FRY (76/433)
ALT (190/350)WGH (53/224)
BAT (72/489)WRX (83/266)
NMG (159/331)OHM (186/335)
QEQ (76/372)IOW (84/250)
BOL (217/390)BRD (112/350)
TUN (96/351)OLD (182/558)RGH (83/243)RVN (61/401)LIN (68/293)PIL (15/311)RLI (55/231)
QEB (112/414)WHC (67/301)PLY (207/570)
DAR (130/351)SMV (97/391)VIC (137/414)LEW (43/202)GLO (76/418)TRA (33/104)RED (79/250)
RDE (105/522)SOU (77/270)
GWE (162/352)FRM (67/365)WHH (98/423)MAY (89/274)MRI (36/173)HIL (19/198)
WRC (141/412)RSC (63/429)ENH (89/443)TLF (51/141)
DER (53/489)SLF (48/223)KCH (18/114)GGH (93/248)
EBH (171/482)LGI (264/639)
GHS (118/365)LER (169/768)MPH (73/368)WMH (87/311)WSH (35/284)WIR (73/462)
WMU (87/216)WRG (84/503)COC (66/336)
NOB (16/85)COL (142/520)QAP (104/732)
SAN (74/337)FGH (15/140)
GWY (68/228)NTG (72/376)QEG (60/318)STR (44/349)AEI (53/316)
CHS (33/190)NDD (77/260)DID (87/371)
SCA (47/294)NMH (15/138)MAC (67/246)NTY (16/308)ASH (19/333)
RVB (649/896)IPS (108/436)SAL (33/278)MOR (159/534)RHC (27/273)ADD (165/450)LON (32/140)NUH (306/381)CGH (37/286)RSU (52/330)BAS (119/405)YDH (110/368)HOR (18/148)WEX (74/338)HAR (55/286)SPH (63/441)NTH (147/364)HCH (70/285)BRO (88/346)UHN (127/739)CHG (145/299)QKL (72/323)WCI (54/131)HRI (192/538)JPH (107/340)WAT (90/455)YEO (50/190)KTH (41/288)RCH (152/639)NPH (130/245)STM (97/301)DRY (115/356)GWH (53/269)FAZ (45/380)PMS (50/376)RSS (160/325)SCU (97/242)STH (47/191)WHI (81/387)NWG (22/83)HUD (133/445)BLA (103/463)RFH (50/167)CMI (52/283)PGH (214/859)WDG (72/284)WYT (89/291)BRT (43/293)NHH (56/242)AIR (42/275)TGA (76/224)WYB (52/144)SGH (112/569)POW (97/240)KMH (61/344)NOR (115/735)NUN (76/252)BAR (53/250)PAH (69/372)DGE (32/373)RBE (90/449)SHH (81/332)SDG (45/230)WWG (82/332)CLW (84/339)ROT (51/275)SEH (102/392)WES (37/147)PIN (174/530)STO (151/595)DVH (123/336)BED (50/176)LDH (64/305)MKH (30/109)PCH (47/131)STD (69/208)BRG (44/92)SHC (20/379)ESU (73/509)WAR (57/295)NGS (85/588)BNT (70/305)SUN (62/385)RLU (78/395)UHC (61/486)NCR (57/367)GEO (37/164)RUS (48/485)BSL (38/168)HIN (41/152)
Includes only patients who underwent surgery after 36 hours.Hospitals with fewer than 10 patients delayed by 36 hours or more are not plotted.
Includes only patients who underwent surgery after 36 hours.Hospitals with fewer than 10 patients delayed by 36 hours or more are not plotted.
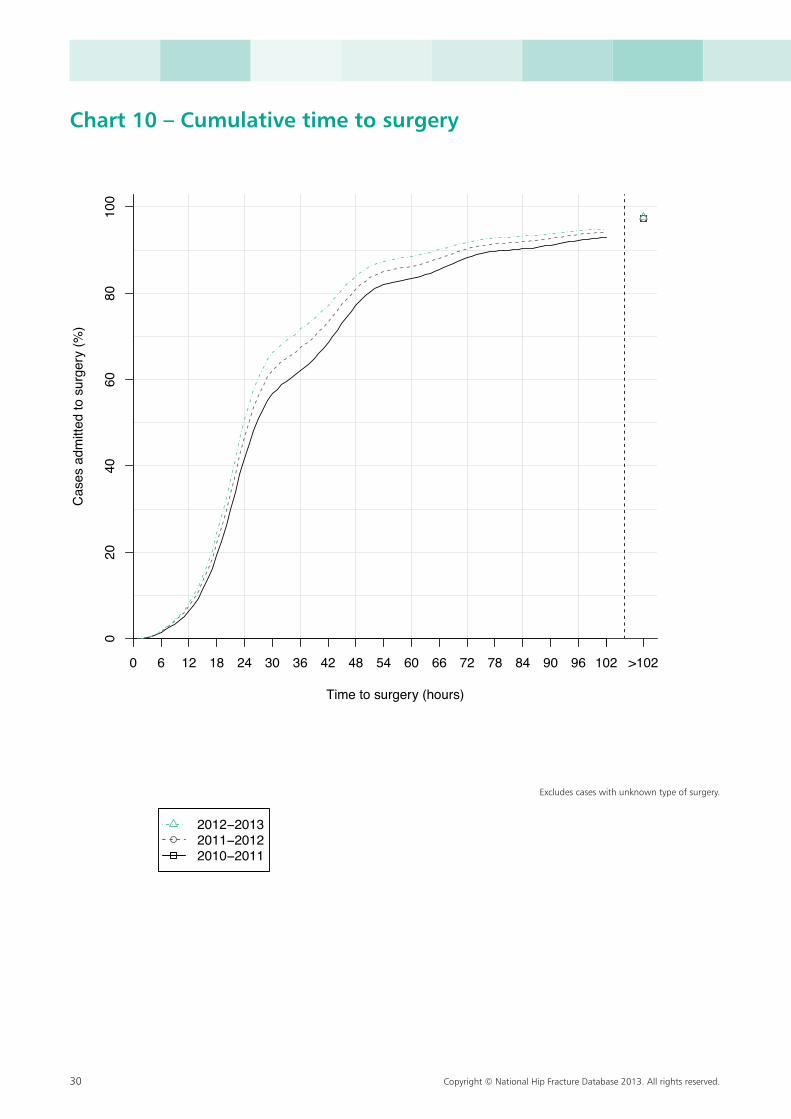
30 Copyright © National Hip Fracture Database 2013. All rights reserved.
Chart 10 – Cumulative time to surgery
Time to surgery (hours)
Cas
es a
dmitt
ed to
sur
gery
(%)
0 6 12 18 24 30 36 42 48 54 60 66 72 78 84 90 96 102 >102
020
4060
8010
0
2012−20132011−20122010−2011
Excludes cases with unknown type of surgery.
Time to surgery (hours)
Cas
es a
dmitt
ed to
sur
gery
(%)
0 6 12 18 24 30 36 42 48 54 60 66 72 78 84 90 96 102 >102
020
4060
8010
0
2012−20132011−20122010−2011
Excludes cases with unknown type of surgery.
Excludes cases with unknown type of surgery.
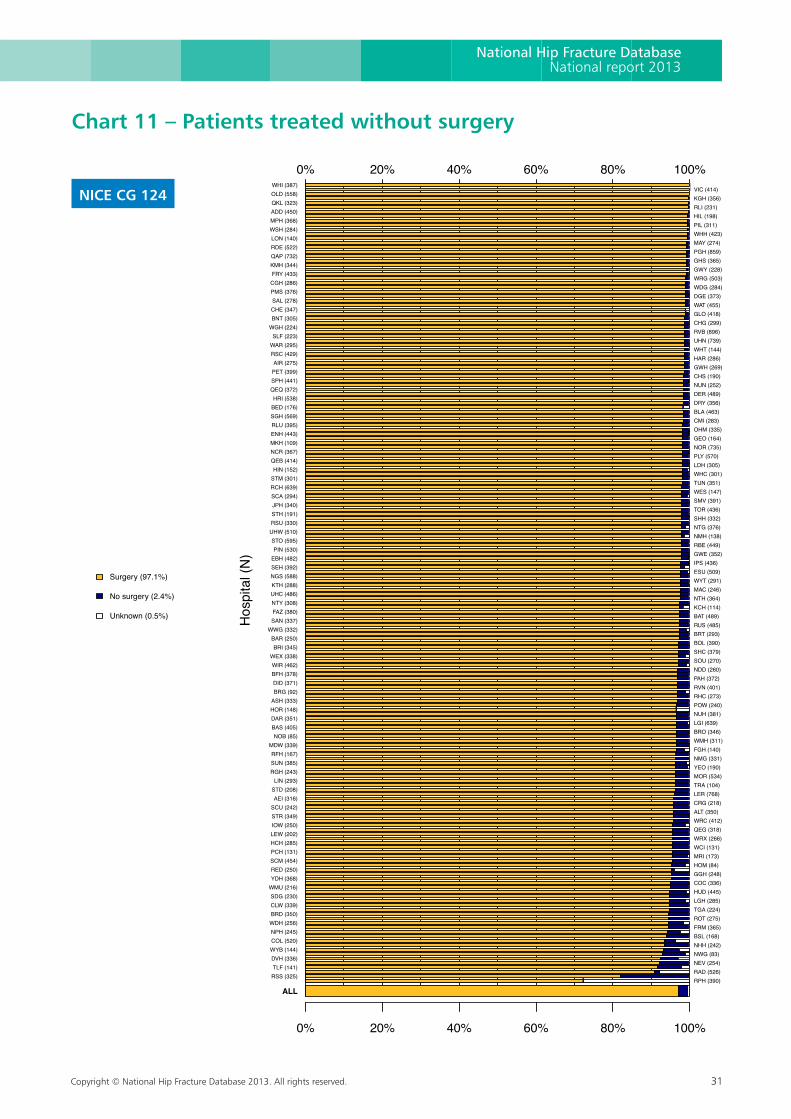
Copyright © National Hip Fracture Database 2013. All rights reserved. 31
National Hip Fracture DatabaseNational report 2013
0% 20% 40% 60% 80% 100%
0% 20% 40% 60% 80% 100%
Surgery (97.1%)
No surgery (2.4%)
Unknown (0.5%) Hos
pita
l (N
)
ALL
RSS (325)TLF (141)DVH (336)WYB (144)COL (520)NPH (245)
WDH (256)BRD (350)CLW (339)SDG (230)
WMU (216)YDH (368)RED (250)SCM (454)PCH (131)HCH (285)LEW (202)IOW (250)STR (349)SCU (242)AEI (316)
STD (208)LIN (293)
RGH (243)SUN (385)RFH (167)
MDW (339)NOB (85)
BAS (405)DAR (351)HOR (148)ASH (333)BRG (92)DID (371)
BFH (378)WIR (462)
WEX (338)BRI (345)
BAR (250)WWG (332)
SAN (337)FAZ (380)NTY (308)UHC (486)KTH (288)NGS (588)SEH (392)EBH (482)PIN (530)
STO (595)UHW (510)RSU (330)STH (191)JPH (340)SCA (294)RCH (639)STM (301)HIN (152)
QEB (414)NCR (367)MKH (109)ENH (443)RLU (395)SGH (569)BED (176)HRI (538)
QEQ (372)SPH (441)PET (399)AIR (275)
RSC (429)WAR (295)SLF (223)
WGH (224)BNT (305)CHE (347)SAL (278)PMS (376)CGH (286)FRY (433)KMH (344)QAP (732)RDE (522)LON (140)WSH (284)MPH (368)ADD (450)QKL (323)OLD (558)WHI (387)
RPH (390)RAD (526)NEV (254)NWG (83)NHH (242)BSL (168)FRM (365)ROT (275)TGA (224)LGH (285)HUD (445)COC (336)GGH (248)HOM (84)MRI (173)WCI (131)WRX (266)QEG (318)WRC (412)ALT (350)CRG (218)LER (768)TRA (104)MOR (534)YEO (190)NMG (331)FGH (140)WMH (311)BRO (346)LGI (639)NUH (381)POW (240)RHC (273)RVN (401)PAH (372)NDD (260)SOU (270)SHC (379)BOL (390)BRT (293)RUS (485)BAT (489)KCH (114)NTH (364)MAC (246)WYT (291)ESU (509)IPS (436)GWE (352)RBE (449)NMH (138)NTG (376)SHH (332)TOR (436)SMV (391)WES (147)TUN (351)WHC (301)LDH (305)PLY (570)NOR (735)GEO (164)OHM (335)CMI (283)BLA (463)DRY (356)DER (489)NUN (252)CHS (190)GWH (269)HAR (286)WHT (144)UHN (739)RVB (896)CHG (299)GLO (418)WAT (455)DGE (373)WDG (284)WRG (503)GWY (228)GHS (365)PGH (859)MAY (274)WHH (423)PIL (311)HIL (198)RLI (231)KGH (356)VIC (414)
Chart 11 – Patients treated without surgery
NICE CG 124
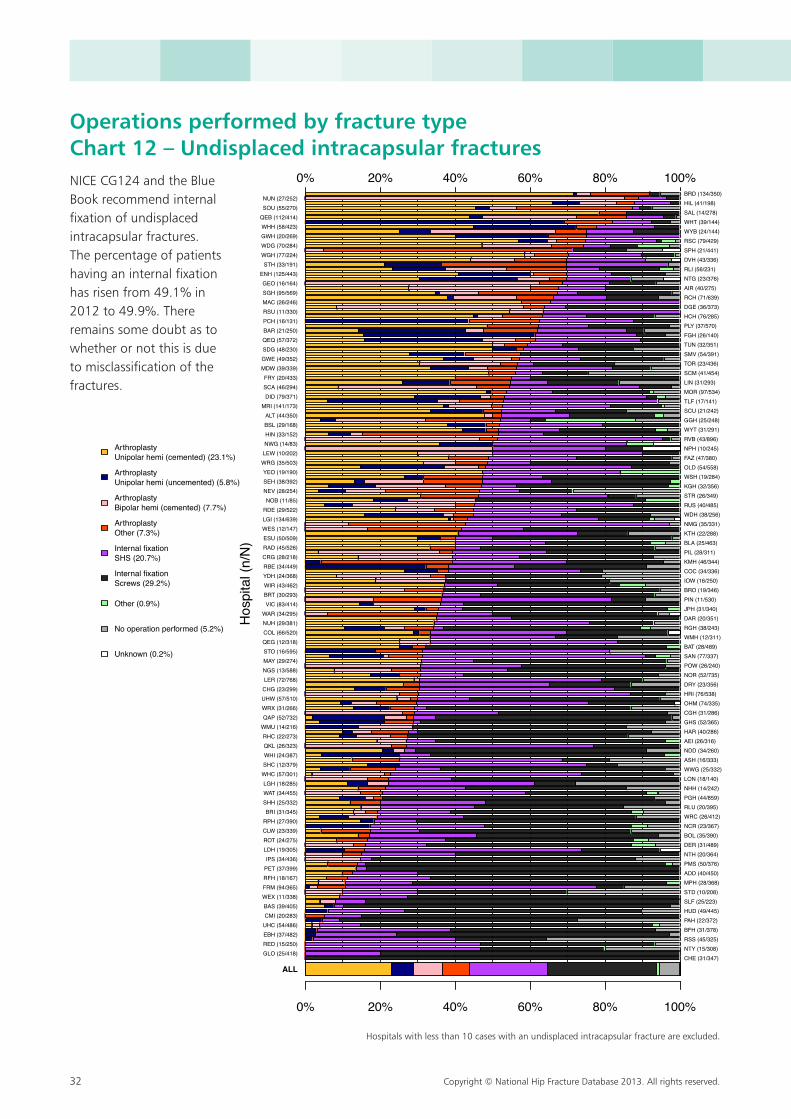
32 Copyright © National Hip Fracture Database 2013. All rights reserved.
0% 20% 40% 60% 80% 100%
0% 20% 40% 60% 80% 100%
ArthroplastyUnipolar hemi (cemented) (23.1%)
ArthroplastyUnipolar hemi (uncemented) (5.8%)
ArthroplastyBipolar hemi (cemented) (7.7%)
ArthroplastyOther (7.3%)
Internal fixationSHS (20.7%)
Internal fixationScrews (29.2%)
Other (0.9%)
No operation performed (5.2%)
Unknown (0.2%)
Hos
pita
l (n/
N)
ALL
GLO (25/418)RED (15/250)EBH (37/482)UHC (54/486)CMI (20/283)BAS (39/405)
WEX (11/338)FRM (94/365)RFH (18/167)PET (37/399)IPS (34/436)
LDH (19/305)ROT (24/275)CLW (23/339)RPH (27/390)BRI (31/345)
SHH (25/332)WAT (34/455)LGH (18/285)
WHC (57/301)SHC (12/379)WHI (24/387)QKL (26/323)RHC (22/273)
WMU (14/216)QAP (52/732)WRX (31/266)UHW (57/510)CHG (23/299)LER (72/768)NGS (13/588)MAY (29/274)STO (16/595)QEG (12/318)COL (66/520)NUH (29/381)WAR (34/295)
VIC (83/414)BRT (30/293)WIR (43/462)YDH (24/368)RBE (34/449)CRG (28/218)RAD (45/526)ESU (50/509)WES (12/147)LGI (134/639)RDE (29/522)NOB (11/85)
NEV (28/254)SEH (38/392)YEO (19/190)
WRG (35/503)LEW (10/202)NWG (14/83)HIN (33/152)BSL (29/168)ALT (44/350)
MRI (141/173)DID (79/371)
SCA (46/294)FRY (20/433)
MDW (39/339)GWE (49/352)SDG (48/230)QEQ (57/372)BAR (21/250)PCH (16/131)RSU (11/330)MAC (26/246)SGH (95/569)GEO (16/164)
ENH (125/443)STH (33/191)
WGH (77/224)WDG (70/284)GWH (20/269)WHH (58/423)
QEB (112/414)SOU (55/270)NUN (27/252)
CHE (31/347)NTY (15/308)RSS (45/325)BFH (31/378)PAH (22/372)HUD (49/445)SLF (25/223)STD (10/208)MPH (28/368)ADD (40/450)PMS (50/376)NTH (20/364)DER (31/489)BOL (35/390)NCR (23/367)WRC (26/412)RLU (20/395)PGH (44/859)NHH (14/242)LON (18/140)WWG (25/332)ASH (16/333)NDD (34/260)AEI (26/316)HAR (40/286)GHS (52/365)CGH (31/286)OHM (74/335)HRI (76/538)DRY (23/356)NOR (52/735)POW (26/240)SAN (77/337)BAT (28/489)WMH (12/311)RGH (38/243)DAR (20/351)JPH (31/340)PIN (11/530)BRO (19/346)IOW (16/250)COC (34/336)KMH (46/344)PIL (28/311)BLA (25/463)KTH (22/288)NMG (35/331)WDH (38/256)RUS (40/485)STR (26/349)KGH (32/356)WSH (19/284)OLD (54/558)FAZ (47/380)NPH (10/245)RVB (43/896)WYT (31/291)GGH (25/248)SCU (21/242)TLF (17/141)MOR (97/534)LIN (31/293)SCM (41/454)TOR (23/436)SMV (54/391)TUN (32/351)FGH (26/140)PLY (37/570)HCH (76/285)DGE (36/373)RCH (71/639)AIR (40/275)NTG (23/376)RLI (56/231)DVH (43/336)SPH (21/441)RSC (79/429)WYB (24/144)WHT (39/144)SAL (14/278)HIL (41/198)BRD (134/350)
Hospitals with less than 10 cases with an undisplaced intercapsular fracture are excluded.
Operations performed by fracture type Chart 12 – Undisplaced intracapsular fractures NICE CG124 and the Blue Book recommend internal fixation of undisplaced intracapsular fractures. The percentage of patients having an internal fixation has risen from 49.1% in 2012 to 49.9%. There remains some doubt as to whether or not this is due to misclassification of the fractures.
Hospitals with less than 10 cases with an undisplaced intracapsular fracture are excluded.
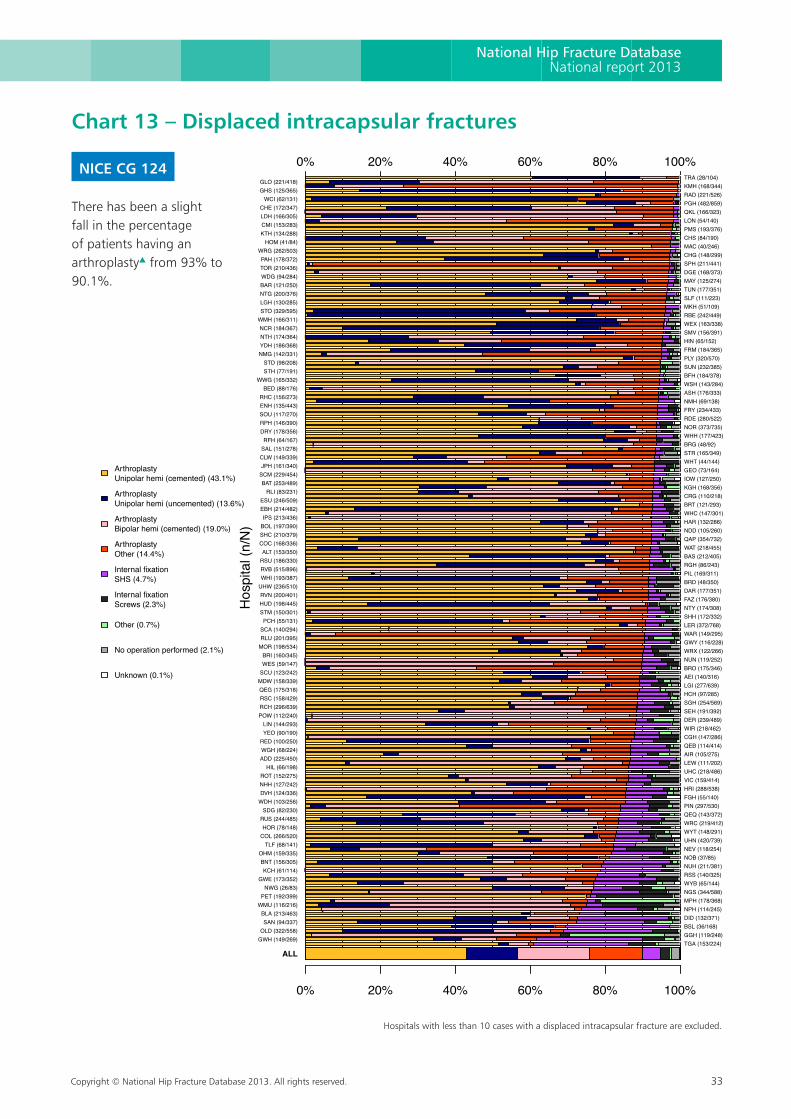
Copyright © National Hip Fracture Database 2013. All rights reserved. 33
National Hip Fracture DatabaseNational report 2013
0% 20% 40% 60% 80% 100%
0% 20% 40% 60% 80% 100%
ArthroplastyUnipolar hemi (cemented) (43.1%)
ArthroplastyUnipolar hemi (uncemented) (13.6%)
ArthroplastyBipolar hemi (cemented) (19.0%)
ArthroplastyOther (14.4%)
Internal fixationSHS (4.7%)
Internal fixationScrews (2.3%)
Other (0.7%)
No operation performed (2.1%)
Unknown (0.1%)
Hos
pita
l (n/
N)
ALL
GWH (149/269)OLD (322/558)
SAN (94/337)BLA (213/463)
WMU (116/216)PET (192/399)
NWG (26/83)GWE (173/352)
KCH (61/114)BNT (156/305)
OHM (159/335)TLF (68/141)
COL (266/520)HOR (78/148)
RUS (244/485)SDG (82/230)
WDH (103/256)DVH (124/336)NHH (127/242)ROT (152/275)
HIL (66/198)ADD (225/450)WGH (68/224)RED (100/250)YEO (90/190)LIN (144/293)
POW (112/240)RCH (296/639)RSC (158/429)QEG (175/318)MDW (158/339)SCU (123/242)WES (59/147)BRI (160/345)
MOR (198/534)RLU (201/395)SCA (140/294)PCH (55/131)
STM (150/301)HUD (198/445)RVN (200/401)
UHW (236/510)WHI (193/387)RVB (515/896)RSU (186/330)ALT (153/350)
COC (168/336)SHC (210/379)BOL (197/390)IPS (213/436)
EBH (214/482)ESU (246/509)
RLI (83/231)BAT (253/489)
SCM (229/454)JPH (161/340)CLW (149/339)SAL (151/278)RFH (64/167)
DRY (178/356)RPH (146/390)SOU (117/270)ENH (135/443)RHC (156/273)
BED (88/176)WWG (165/332)
STH (77/191)STD (98/208)
NMG (142/331)YDH (186/368)NTH (174/364)NCR (184/367)
WMH (166/311)STO (329/595)LGH (130/285)NTG (200/376)BAR (121/250)WDG (94/284)TOR (210/436)PAH (178/372)
WRG (262/503)HOM (41/84)
KTH (134/288)CMI (153/283)LDH (166/305)CHE (172/347)
WCI (62/131)GHS (125/365)GLO (221/418)
TGA (153/224)GGH (119/248)BSL (36/168)DID (132/371)NPH (114/245)MPH (178/368)NGS (344/588)WYB (65/144)RSS (140/325)NUH (211/381)NOB (37/85)NEV (118/254)UHN (420/739)WYT (148/291)WRC (219/412)QEQ (143/372)PIN (297/530)FGH (55/140)HRI (288/538)VIC (159/414)UHC (218/486)LEW (111/202)AIR (105/275)QEB (114/414)CGH (147/286)WIR (218/462)DER (239/489)SEH (191/392)SGH (254/569)HCH (97/285)LGI (277/639)AEI (140/316)BRO (175/346)NUN (119/252)WRX (122/266)GWY (116/228)WAR (149/295)LER (372/768)SHH (172/332)NTY (174/308)FAZ (176/380)DAR (177/351)BRD (48/350)PIL (169/311)RGH (86/243)BAS (212/405)WAT (218/455)QAP (354/732)NDD (105/260)HAR (132/286)WHC (147/301)BRT (121/293)CRG (110/218)KGH (168/356)IOW (127/250)GEO (73/164)WHT (44/144)STR (165/349)BRG (48/92)WHH (177/423)NOR (373/735)RDE (280/522)FRY (234/433)NMH (69/138)ASH (176/333)WSH (143/284)BFH (184/378)SUN (232/385)PLY (320/570)FRM (184/365)HIN (65/152)SMV (156/391)WEX (163/338)RBE (242/449)MKH (51/109)SLF (111/223)TUN (177/351)MAY (125/274)DGE (168/373)SPH (211/441)CHG (148/299)MAC (40/246)CHS (84/190)PMS (193/376)LON (54/140)QKL (166/323)PGH (482/859)RAD (221/526)KMH (168/344)TRA (28/104)
Hospitals with less than 10 cases with a displaced intercapsular fracture are excluded.
Chart 13 – Displaced intracapsular fractures
NICE CG 124
There has been a slight fall in the percentage of patients having an arthroplasty▲ from 93% to 90.1%.
Hospitals with less than 10 cases with a displaced intracapsular fracture are excluded.
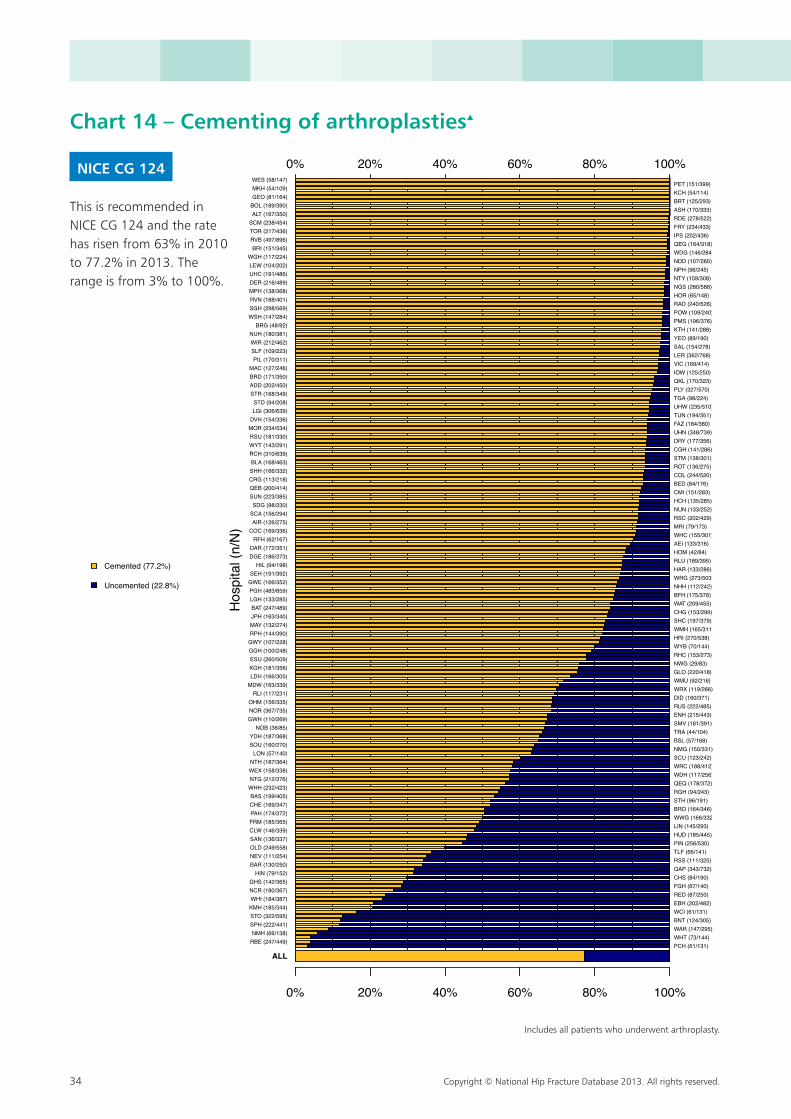
34 Copyright © National Hip Fracture Database 2013. All rights reserved.
0% 20% 40% 60% 80% 100%
0% 20% 40% 60% 80% 100%
Cemented (77.2%)
Uncemented (22.8%)
Hos
pita
l (n/
N)
ALL
RBE (247/449)NMH (66/138)
SPH (222/441)STO (322/595)KMH (185/344)WHI (184/387)NCR (180/367)GHS (142/365)
HIN (79/152)BAR (130/250)NEV (111/254)OLD (249/558)SAN (136/337)CLW (146/339)FRM (185/365)PAH (174/372)CHE (169/347)BAS (199/405)
WHH (232/423)NTG (212/376)WEX (158/338)NTH (187/364)LON (57/140)
SOU (160/270)YDH (187/368)
NOB (36/85)GWH (110/269)NOR (367/735)OHM (156/335)
RLI (117/231)MDW (163/339)LDH (166/305)KGH (181/356)ESU (260/509)GGH (100/248)GWY (107/228)RPH (144/390)MAY (132/274)JPH (163/340)BAT (247/489)LGH (133/285)PGH (483/859)GWE (166/352)SEH (191/392)
HIL (94/198)DGE (186/373)DAR (172/351)
RFH (62/167)COC (169/336)
AIR (126/275)SCA (156/294)SDG (98/230)
SUN (223/385)QEB (200/414)CRG (113/218)SHH (166/332)BLA (168/463)RCH (310/639)WYT (143/291)RSU (181/330)MOR (234/534)DVH (154/336)LGI (306/639)STD (94/208)
STR (168/349)ADD (202/450)BRD (171/350)MAC (127/246)
PIL (170/311)SLF (109/223)WIR (212/462)NUH (180/381)
BRG (48/92)WSH (147/284)SGH (298/569)RVN (188/401)MPH (138/368)DER (216/489)UHC (191/486)LEW (104/202)
WGH (117/224)BRI (151/345)
RVB (497/896)TOR (217/436)SCM (238/454)ALT (167/350)BOL (189/390)GEO (81/164)MKH (54/109)WES (58/147)
PCH (61/131)WHT (73/144)WAR (147/295)BNT (124/305)WCI (61/131)EBH (202/482)RED (87/250)FGH (67/140)CHS (84/190)QAP (343/732)RSS (111/325)TLF (66/141)PIN (256/530)HUD (185/445)LIN (145/293)WWG (166/332)BRO (164/346)STH (96/191)RGH (94/243)QEQ (178/372)WDH (117/256)WRC (188/412)SCU (123/242)NMG (150/331)BSL (57/168)TRA (44/104)SMV (181/391)ENH (215/443)RUS (222/485)DID (160/371)WRX (119/266)WMU (92/216)GLO (220/418)NWG (29/83)RHC (153/273)WYB (70/144)HRI (270/538)WMH (165/311)SHC (197/379)CHG (153/299)WAT (209/455)BFH (175/378)NHH (112/242)WRG (273/503)HAR (133/286)RLU (189/395)HOM (42/84)AEI (133/316)WHC (155/301)MRI (79/173)RSC (202/429)NUN (133/252)HCH (135/285)CMI (151/283)BED (84/176)COL (244/520)ROT (136/275)STM (138/301)CGH (141/286)DRY (177/356)UHN (348/739)FAZ (184/380)TUN (194/351)UHW (235/510)TGA (98/224)PLY (327/570)QKL (170/323)IOW (125/250)VIC (169/414)LER (362/768)SAL (154/278)YEO (89/190)KTH (141/288)PMS (196/376)POW (109/240)RAD (240/526)HOR (65/148)NGS (280/588)NTY (159/308)NPH (96/245)NDD (107/260)WDG (146/284)QEG (164/318)IPS (202/436)FRY (234/433)RDE (278/522)ASH (170/333)BRT (125/293)KCH (54/114)PET (151/399)
Includes all patients who underwent arthroplasty.
Chart 14 – Cementing of arthroplasties▲
NICE CG 124
This is recommended in NICE CG 124 and the rate has risen from 63% in 2010 to 77.2% in 2013. The range is from 3% to 100%.
Includes all patients who underwent arthroplasty.
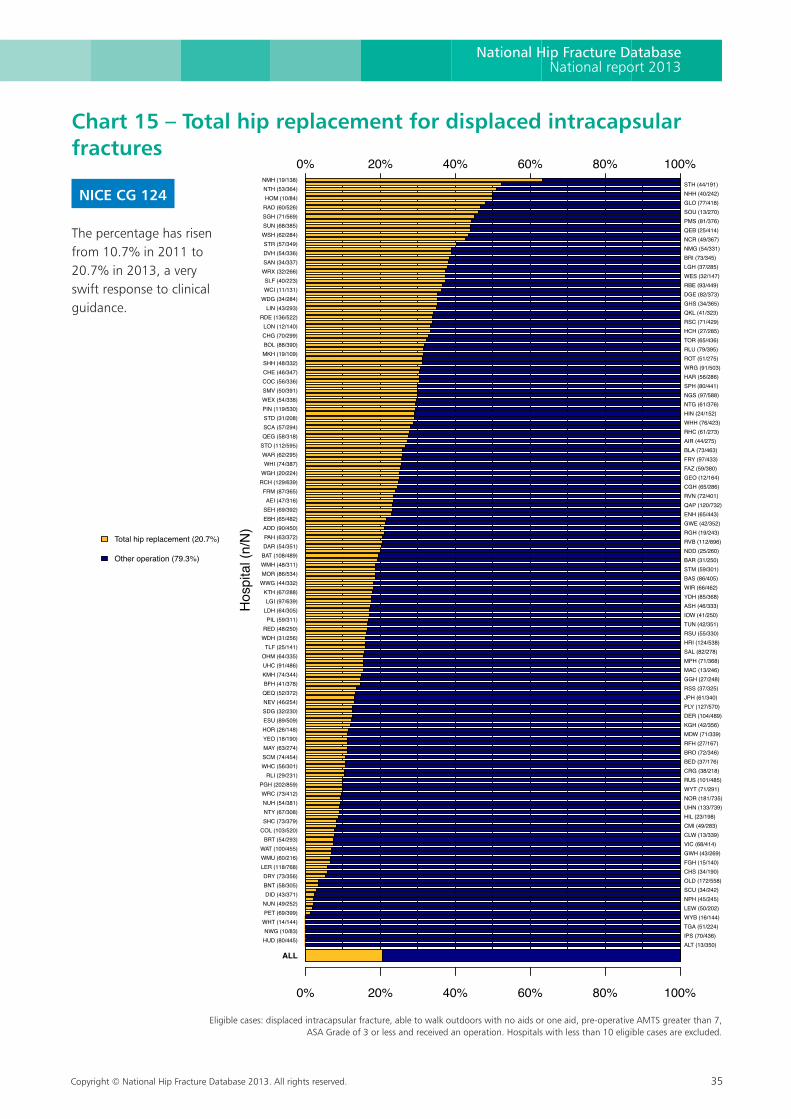
Copyright © National Hip Fracture Database 2013. All rights reserved. 35
National Hip Fracture DatabaseNational report 2013
0% 20% 40% 60% 80% 100%
0% 20% 40% 60% 80% 100%
Total hip replacement (20.7%)
Other operation (79.3%)
Hos
pita
l (n/
N)
ALL
HUD (80/445)NWG (10/83)
WHT (14/144)PET (69/399)NUN (49/252)DID (43/371)
BNT (58/305)DRY (73/356)
LER (118/768)WMU (60/216)WAT (100/455)
BRT (54/293)COL (103/520)SHC (73/379)NTY (67/308)NUH (54/381)WRC (73/412)
PGH (202/859)RLI (29/231)
WHC (56/301)SCM (74/454)MAY (63/274)YEO (18/190)HOR (26/148)ESU (89/509)SDG (32/230)NEV (46/254)QEQ (52/372)BFH (41/378)KMH (74/344)UHC (91/486)OHM (64/335)TLF (25/141)
WDH (31/256)RED (48/250)
PIL (59/311)LDH (64/305)LGI (97/639)
KTH (67/288)WWG (44/332)MOR (86/534)WMH (48/311)BAT (108/489)DAR (54/351)PAH (63/372)ADD (90/450)EBH (65/482)SEH (69/392)AEI (47/316)
FRM (87/365)RCH (129/639)WGH (20/224)WHI (74/387)
WAR (62/295)STO (112/595)QEG (58/318)SCA (57/294)STD (31/208)PIN (119/530)WEX (54/338)SMV (50/391)COC (56/336)CHE (46/347)SHH (48/332)MKH (19/109)BOL (88/390)CHG (70/299)LON (12/140)
RDE (136/522)LIN (43/293)
WDG (34/284)WCI (11/131)SLF (40/223)
WRX (32/266)SAN (34/337)DVH (54/336)STR (57/349)
WSH (62/284)SUN (68/385)SGH (71/569)RAD (60/526)HOM (10/84)
NTH (53/364)NMH (19/138)
ALT (13/350)IPS (70/436)TGA (51/224)WYB (16/144)LEW (50/202)NPH (45/245)SCU (34/242)OLD (172/558)CHS (34/190)FGH (15/140)GWH (43/269)VIC (68/414)CLW (13/339)CMI (49/283)HIL (23/198)UHN (133/739)NOR (181/735)WYT (71/291)RUS (101/485)CRG (38/218)BED (37/176)BRO (72/346)RFH (27/167)MDW (71/339)KGH (42/356)DER (104/489)PLY (127/570)JPH (61/340)RSS (37/325)GGH (27/248)MAC (13/246)MPH (71/368)SAL (82/278)HRI (124/538)RSU (55/330)TUN (42/351)IOW (41/250)ASH (46/333)YDH (85/368)WIR (66/462)BAS (86/405)STM (59/301)BAR (31/250)NDD (25/260)RVB (112/896)RGH (19/243)GWE (42/352)ENH (65/443)QAP (120/732)RVN (72/401)CGH (65/286)GEO (12/164)FAZ (59/380)FRY (97/433)BLA (73/463)AIR (44/275)RHC (61/273)WHH (76/423)HIN (24/152)NTG (61/376)NGS (97/588)SPH (80/441)HAR (56/286)WRG (91/503)ROT (51/275)RLU (79/395)TOR (65/436)HCH (27/285)RSC (71/429)QKL (41/323)GHS (34/365)DGE (82/373)RBE (93/449)WES (32/147)LGH (37/285)BRI (73/345)NMG (54/331)NCR (49/367)QEB (25/414)PMS (81/376)SOU (13/270)GLO (77/418)NHH (40/242)STH (44/191)
Eligible cases: displaced intracapsular fracture, able to walk outdoors with no aids or one aid, pre−operative AMTS greater than 7, ASA Grade of 3 or less and received an operation. Hospitals with less than 10 eligible cases are excluded.
Chart 15 – Total hip replacement for displaced intracapsular fractures
NICE CG 124
The percentage has risen from 10.7% in 2011 to 20.7% in 2013, a very swift response to clinical guidance.
Eligible cases: displaced intracapsular fracture, able to walk outdoors with no aids or one aid, pre-operative AMTS greater than 7, ASA Grade of 3 or less and received an operation. Hospitals with less than 10 eligible cases are excluded.
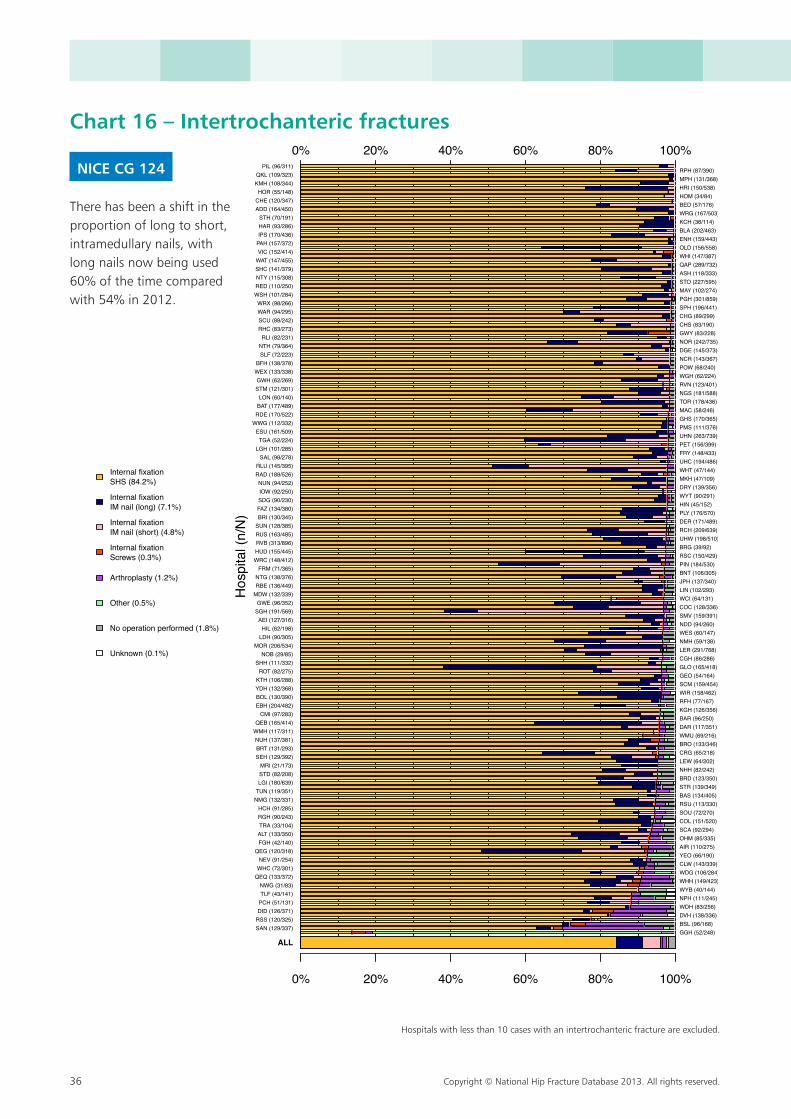
36 Copyright © National Hip Fracture Database 2013. All rights reserved.
Chart 16 – Intertrochanteric fractures
NICE CG 124
There has been a shift in the proportion of long to short, intramedullary nails, with long nails now being used 60% of the time compared with 54% in 2012.
0% 20% 40% 60% 80% 100%
0% 20% 40% 60% 80% 100%
Internal fixationSHS (84.2%)
Internal fixationIM nail (long) (7.1%)
Internal fixationIM nail (short) (4.8%)
Internal fixationScrews (0.3%)
Arthroplasty (1.2%)
Other (0.5%)
No operation performed (1.8%)
Unknown (0.1%)
Hos
pita
l (n/
N)
ALL
SAN (129/337)RSS (120/325)DID (126/371)PCH (51/131)TLF (43/141)NWG (31/83)
QEQ (133/372)WHC (72/301)NEV (91/254)
QEG (120/318)FGH (42/140)ALT (133/350)TRA (33/104)RGH (90/243)HCH (91/285)
NMG (132/331)TUN (119/351)LGI (180/639)STD (82/208)MRI (21/173)
SEH (129/392)BRT (131/293)NUH (137/381)
WMH (117/311)QEB (165/414)
CMI (97/283)EBH (204/482)BOL (130/390)YDH (132/368)KTH (106/288)ROT (82/275)
SHH (111/332)NOB (29/85)
MOR (206/534)LDH (90/305)HIL (62/198)
AEI (127/316)SGH (191/569)GWE (96/352)
MDW (132/339)RBE (136/449)NTG (138/376)FRM (71/365)
WRC (148/412)HUD (155/445)RVB (313/896)RUS (163/485)SUN (128/385)BRI (130/345)FAZ (134/380)SDG (90/230)IOW (92/250)NUN (94/252)
RAD (188/526)RLU (145/395)
SAL (98/278)LGH (101/285)
TGA (52/224)ESU (161/509)
WWG (112/332)RDE (170/522)BAT (177/489)LON (60/140)
STM (121/301)GWH (62/269)
WEX (133/338)BFH (138/378)
SLF (72/223)NTH (79/364)RLI (82/231)
RHC (83/273)SCU (88/242)WAR (94/295)WRX (98/266)
WSH (101/284)RED (110/250)NTY (115/308)SHC (141/379)WAT (147/455)VIC (152/414)PAH (157/372)IPS (170/436)HAR (93/286)STH (70/191)
ADD (164/450)CHE (120/347)HOR (55/148)
KMH (108/344)QKL (109/323)
PIL (96/311)
GGH (52/248)BSL (96/168)DVH (138/336)WDH (83/256)NPH (111/245)WYB (40/144)WHH (149/423)WDG (106/284)CLW (143/339)YEO (66/190)AIR (110/275)OHM (85/335)SCA (92/294)COL (151/520)SOU (72/270)RSU (113/330)BAS (134/405)STR (139/349)BRD (123/350)NHH (82/242)LEW (64/202)CRG (65/218)BRO (133/346)WMU (69/216)DAR (117/351)BAR (96/250)KGH (126/356)RFH (77/167)WIR (158/462)SCM (159/454)GEO (54/164)GLO (165/418)CGH (86/286)LER (291/768)NMH (59/138)WES (60/147)NDD (94/260)SMV (159/391)COC (128/336)WCI (64/131)LIN (102/293)JPH (137/340)BNT (106/305)PIN (184/530)RSC (150/429)BRG (39/92)UHW (198/510)RCH (209/639)DER (171/489)PLY (176/570)HIN (45/152)WYT (90/291)DRY (139/356)MKH (47/109)WHT (47/144)UHC (194/486)FRY (148/433)PET (156/399)UHN (263/739)PMS (111/376)GHS (170/365)MAC (58/246)TOR (178/436)NGS (181/588)RVN (123/401)WGH (62/224)POW (68/240)NCR (143/367)DGE (145/373)NOR (242/735)GWY (83/228)CHS (83/190)CHG (89/299)SPH (196/441)PGH (301/859)MAY (102/274)STO (227/595)ASH (118/333)QAP (289/732)WHI (147/387)OLD (156/558)ENH (159/443)BLA (202/463)KCH (36/114)WRG (167/503)BED (57/176)HOM (34/84)HRI (150/538)MPH (131/368)RPH (87/390)
Hospitals with less than 10 cases with an intertrochanteric fracture are excluded.Hospitals with less than 10 cases with an intertrochanteric fracture are excluded.
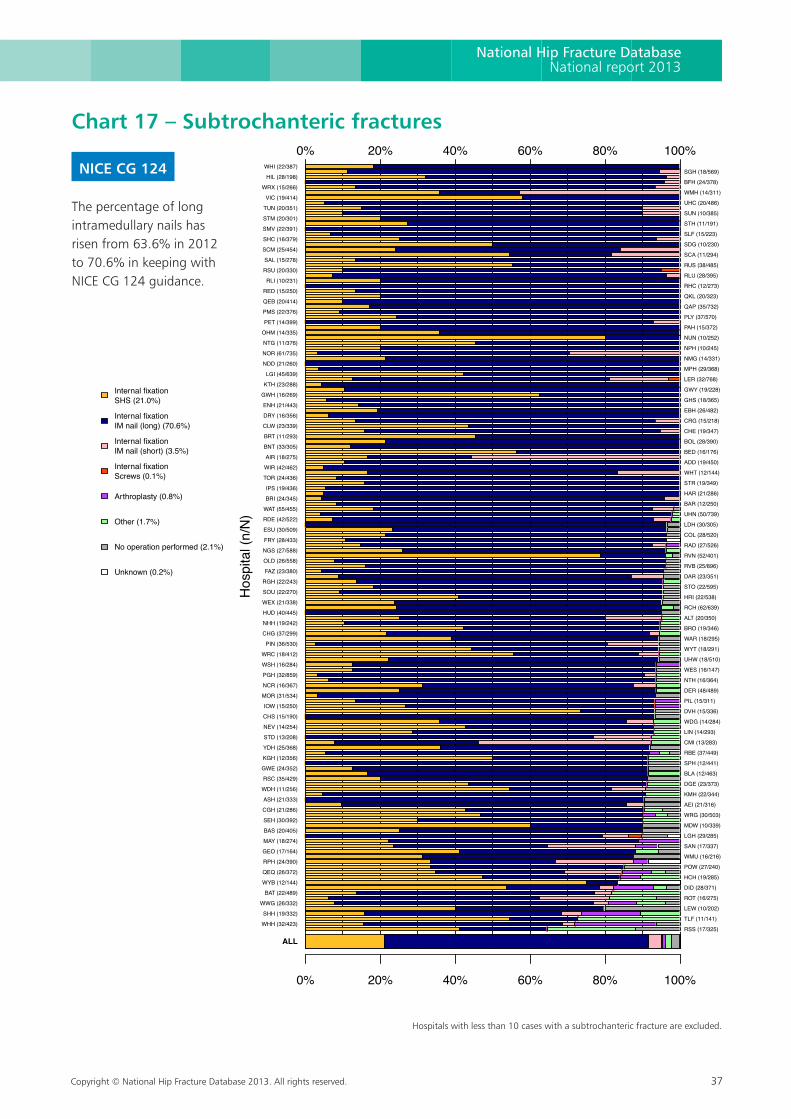
Copyright © National Hip Fracture Database 2013. All rights reserved. 37
National Hip Fracture DatabaseNational report 2013
Chart 17 – Subtrochanteric fractures
NICE CG 124
The percentage of long intramedullary nails has risen from 63.6% in 2012 to 70.6% in keeping with NICE CG 124 guidance.
0% 20% 40% 60% 80% 100%
0% 20% 40% 60% 80% 100%
Internal fixationSHS (21.0%)
Internal fixationIM nail (long) (70.6%)
Internal fixationIM nail (short) (3.5%)
Internal fixationScrews (0.1%)
Arthroplasty (0.8%)
Other (1.7%)
No operation performed (2.1%)
Unknown (0.2%)
Hos
pita
l (n/
N)
ALL
WHH (32/423)
SHH (19/332)
WWG (26/332)
BAT (22/489)
WYB (12/144)
QEQ (26/372)
RPH (24/390)
GEO (17/164)
MAY (18/274)
BAS (20/405)
SEH (30/392)
CGH (21/286)
ASH (21/333)
WDH (11/256)
RSC (35/429)
GWE (24/352)
KGH (12/356)
YDH (25/368)
STD (13/208)
NEV (14/254)
CHS (15/190)
IOW (15/250)
MOR (31/534)
NCR (16/367)
PGH (32/859)
WSH (16/284)
WRC (18/412)
PIN (36/530)
CHG (37/299)
NHH (19/242)
HUD (40/445)
WEX (21/338)
SOU (22/270)
RGH (22/243)
FAZ (23/380)
OLD (26/558)
NGS (27/588)
FRY (28/433)
ESU (30/509)
RDE (42/522)
WAT (55/455)
BRI (24/345)
IPS (19/436)
TOR (24/436)
WIR (42/462)
AIR (18/275)
BNT (33/305)
BRT (11/293)
CLW (23/339)
DRY (16/356)
ENH (21/443)
GWH (16/269)
KTH (23/288)
LGI (45/639)
NDD (21/260)
NOR (61/735)
NTG (11/376)
OHM (14/335)
PET (14/399)
PMS (22/376)
QEB (20/414)
RED (15/250)
RLI (10/231)
RSU (20/330)
SAL (15/278)
SCM (25/454)
SHC (16/379)
SMV (22/391)
STM (20/301)
TUN (20/351)
VIC (19/414)
WRX (15/266)
HIL (28/198)
WHI (22/387)
RSS (17/325)
TLF (11/141)
LEW (10/202)
ROT (16/275)
DID (28/371)
HCH (19/285)
POW (27/240)
WMU (16/216)
SAN (17/337)
LGH (29/285)
MDW (10/339)
WRG (30/503)
AEI (21/316)
KMH (22/344)
DGE (23/373)
BLA (12/463)
SPH (12/441)
RBE (37/449)
CMI (13/283)
LIN (14/293)
WDG (14/284)
DVH (15/336)
PIL (15/311)
DER (48/489)
NTH (16/364)
WES (16/147)
UHW (18/510)
WYT (18/291)
WAR (18/295)
BRO (19/346)
ALT (20/350)
RCH (62/639)
HRI (22/538)
STO (22/595)
DAR (23/351)
RVB (25/896)
RVN (52/401)
RAD (27/526)
COL (28/520)
LDH (30/305)
UHN (50/739)
BAR (12/250)
HAR (21/286)
STR (19/349)
WHT (12/144)
ADD (19/450)
BED (16/176)
BOL (28/390)
CHE (19/347)
CRG (15/218)
EBH (26/482)
GHS (18/365)
GWY (19/228)
LER (32/768)
MPH (29/368)
NMG (14/331)
NPH (10/245)
NUN (10/252)
PAH (15/372)
PLY (37/570)
QAP (35/732)
QKL (20/323)
RHC (12/273)
RLU (28/395)
RUS (38/485)
SCA (11/294)
SDG (10/230)
SLF (15/223)
STH (11/191)
SUN (10/385)
UHC (20/486)
WMH (14/311)
BFH (24/378)
SGH (18/569)
Hospitals with less than 10 cases with a subtrochanteric fracture are excluded.Hospitals with less than 10 cases with a subtrochanteric fracture are excluded.
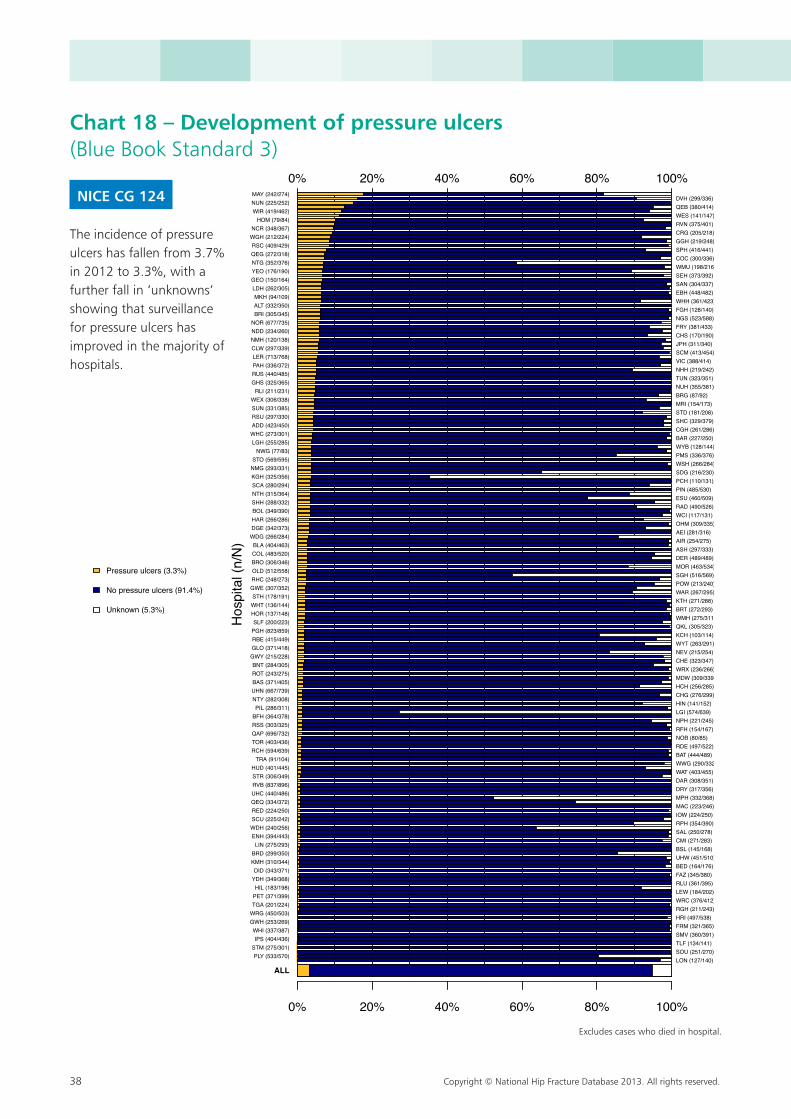
38 Copyright © National Hip Fracture Database 2013. All rights reserved.
0% 20% 40% 60% 80% 100%
0% 20% 40% 60% 80% 100%
Pressure ulcers (3.3%)
No pressure ulcers (91.4%)
Unknown (5.3%)
Hos
pita
l (n/
N)
ALL
PLY (533/570)STM (275/301)IPS (404/436)
WHI (337/387)GWH (253/269)WRG (450/503)TGA (201/224)PET (371/399)HIL (183/198)
YDH (349/368)DID (343/371)
KMH (310/344)BRD (299/350)LIN (275/293)
ENH (394/443)WDH (240/256)SCU (225/242)RED (224/250)QEQ (334/372)UHC (440/486)RVB (837/896)STR (306/349)HUD (401/445)
TRA (91/104)RCH (594/639)TOR (403/436)QAP (696/732)RSS (303/325)BFH (364/378)PIL (286/311)
NTY (282/308)UHN (667/739)BAS (371/405)ROT (243/275)BNT (284/305)
GWY (215/228)GLO (371/418)RBE (415/449)PGH (823/859)SLF (200/223)
HOR (137/148)WHT (136/144)STH (178/191)
GWE (307/352)RHC (248/273)OLD (512/558)BRO (306/346)COL (483/520)BLA (404/463)
WDG (266/284)DGE (342/373)HAR (266/286)BOL (349/390)SHH (288/332)NTH (315/364)SCA (280/294)KGH (325/356)NMG (293/331)STO (569/595)
NWG (77/83)LGH (255/285)
WHC (273/301)ADD (423/450)RSU (297/330)SUN (331/385)WEX (306/338)
RLI (211/231)GHS (325/365)RUS (440/485)PAH (336/372)LER (713/768)CLW (297/339)NMH (120/138)NDD (234/260)NOR (677/735)
BRI (305/345)ALT (332/350)MKH (94/109)
LDH (262/305)GEO (150/164)YEO (176/190)NTG (352/376)QEG (272/318)RSC (409/429)
WGH (212/224)NCR (348/367)
HOM (79/84)WIR (419/462)NUN (225/252)MAY (242/274)
LON (127/140)SOU (251/270)TLF (134/141)SMV (360/391)FRM (321/365)HRI (497/538)RGH (211/243)WRC (376/412)LEW (184/202)RLU (361/395)FAZ (345/380)BED (164/176)UHW (451/510)BSL (145/168)CMI (271/283)SAL (250/278)RPH (354/390)IOW (224/250)MAC (223/246)MPH (332/368)DRY (317/356)DAR (308/351)WAT (403/455)WWG (290/332)BAT (444/489)RDE (497/522)NOB (80/85)RFH (154/167)NPH (221/245)LGI (574/639)HIN (141/152)CHG (276/299)HCH (256/285)MDW (309/339)WRX (236/266)CHE (323/347)NEV (215/254)WYT (263/291)KCH (103/114)QKL (305/323)WMH (275/311)BRT (272/293)KTH (271/288)WAR (267/295)POW (213/240)SGH (516/569)MOR (463/534)DER (489/489)ASH (297/333)AIR (254/275)AEI (281/316)OHM (309/335)WCI (117/131)RAD (490/526)ESU (460/509)PIN (485/530)PCH (110/131)SDG (216/230)WSH (266/284)PMS (336/376)WYB (128/144)BAR (227/250)CGH (261/286)SHC (329/379)STD (181/208)MRI (154/173)BRG (87/92)NUH (355/381)TUN (323/351)NHH (219/242)VIC (388/414)SCM (413/454)JPH (311/340)CHS (170/190)FRY (381/433)NGS (523/588)FGH (128/140)WHH (361/423)EBH (448/482)SAN (304/337)SEH (373/392)WMU (198/216)COC (300/336)SPH (416/441)GGH (219/248)CRG (205/218)RVN (375/401)WES (141/147)QEB (380/414)DVH (299/336)
Excludes cases that died in hospital.
Chart 18 – Development of pressure ulcers (Blue Book Standard 3)
NICE CG 124
The incidence of pressure ulcers has fallen from 3.7% in 2012 to 3.3%, with a further fall in ‘unknowns’ showing that surveillance for pressure ulcers has improved in the majority of hospitals.
Excludes cases who died in hospital.
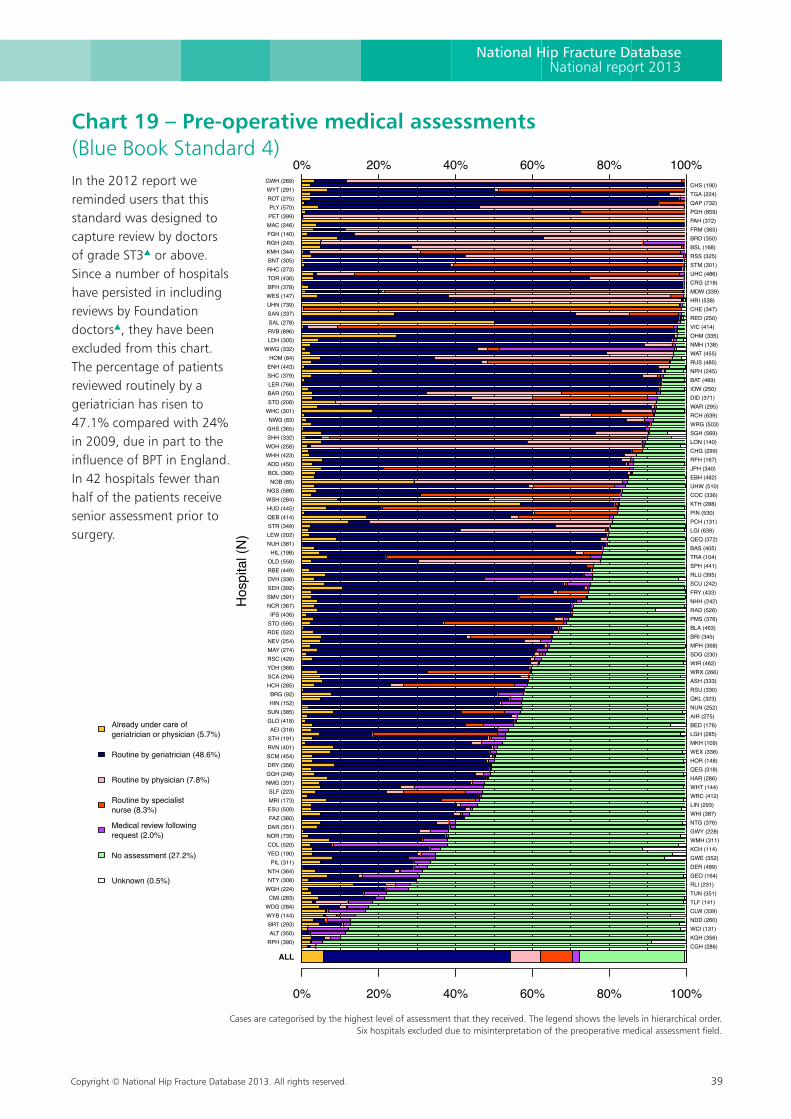
Copyright © National Hip Fracture Database 2013. All rights reserved. 39
National Hip Fracture DatabaseNational report 2013
0% 20% 40% 60% 80% 100%
0% 20% 40% 60% 80% 100%
Already under care ofgeriatrician or physician (5.7%)
Routine by geriatrician (48.6%)
Routine by physician (7.8%)
Routine by specialistnurse (8.3%)
Medical review followingrequest (2.0%)
No assessment (27.2%)
Unknown (0.5%)
Hos
pita
l (N
)
ALL
RPH (390)ALT (350)BRT (293)
WYB (144)WDG (284)
CMI (283)WGH (224)NTY (308)NTH (364)PIL (311)
YEO (190)COL (520)NOR (735)DAR (351)FAZ (380)ESU (509)MRI (173)SLF (223)
NMG (331)GGH (248)DRY (356)SCM (454)RVN (401)STH (191)AEI (316)
GLO (418)SUN (385)HIN (152)BRG (92)
HCH (285)SCA (294)YDH (368)RSC (429)MAY (274)NEV (254)RDE (522)STO (595)IPS (436)
NCR (367)SMV (391)SEH (392)DVH (336)RBE (449)OLD (558)HIL (198)
NUH (381)LEW (202)STR (349)QEB (414)HUD (445)WSH (284)NGS (588)
NOB (85)BOL (390)ADD (450)
WHH (423)WDH (256)SHH (332)GHS (365)NWG (83)
WHC (301)STD (208)BAR (250)LER (768)SHC (379)ENH (443)HOM (84)
WWG (332)LDH (305)RVB (896)SAL (278)SAN (337)UHN (739)WES (147)BFH (378)TOR (436)RHC (273)BNT (305)KMH (344)RGH (243)FGH (140)MAC (246)PET (399)PLY (570)
ROT (275)WYT (291)GWH (269)
CGH (286)KGH (356)WCI (131)NDD (260)CLW (339)TLF (141)TUN (351)RLI (231)GEO (164)DER (489)GWE (352)KCH (114)WMH (311)GWY (228)NTG (376)WHI (387)LIN (293)WRC (412)WHT (144)HAR (286)QEG (318)HOR (148)WEX (338)MKH (109)LGH (285)BED (176)AIR (275)NUN (252)QKL (323)RSU (330)ASH (333)WRX (266)WIR (462)SDG (230)MPH (368)BRI (345)BLA (463)PMS (376)RAD (526)NHH (242)FRY (433)SCU (242)RLU (395)SPH (441)TRA (104)BAS (405)QEQ (372)LGI (639)PCH (131)PIN (530)KTH (288)COC (336)UHW (510)EBH (482)JPH (340)RFH (167)CHG (299)LON (140)SGH (569)WRG (503)RCH (639)WAR (295)DID (371)IOW (250)BAT (489)NPH (245)RUS (485)WAT (455)NMH (138)OHM (335)VIC (414)RED (250)CHE (347)HRI (538)MDW (339)CRG (218)UHC (486)STM (301)RSS (325)BSL (168)BRD (350)FRM (365)PAH (372)PGH (859)QAP (732)TGA (224)CHS (190)
Cases are categorised by the highest level of assessment that they received. The legend shows the levels in hierarchical order.Six hospitals excluded due to misinterpretation of the preoperative medical assessment field.
0% 20% 40% 60% 80% 100%
0% 20% 40% 60% 80% 100%
Already under care ofgeriatrician or physician (5.7%)
Routine by geriatrician (48.6%)
Routine by physician (7.8%)
Routine by specialistnurse (8.3%)
Medical review followingrequest (2.0%)
No assessment (27.2%)
Unknown (0.5%)
Hos
pita
l (N
)
ALL
RPH (390)ALT (350)BRT (293)
WYB (144)WDG (284)
CMI (283)WGH (224)NTY (308)NTH (364)PIL (311)
YEO (190)COL (520)NOR (735)DAR (351)FAZ (380)ESU (509)MRI (173)SLF (223)
NMG (331)GGH (248)DRY (356)SCM (454)RVN (401)STH (191)AEI (316)
GLO (418)SUN (385)HIN (152)BRG (92)
HCH (285)SCA (294)YDH (368)RSC (429)MAY (274)NEV (254)RDE (522)STO (595)IPS (436)
NCR (367)SMV (391)SEH (392)DVH (336)RBE (449)OLD (558)HIL (198)
NUH (381)LEW (202)STR (349)QEB (414)HUD (445)WSH (284)NGS (588)
NOB (85)BOL (390)ADD (450)
WHH (423)WDH (256)SHH (332)GHS (365)NWG (83)
WHC (301)STD (208)BAR (250)LER (768)SHC (379)ENH (443)HOM (84)
WWG (332)LDH (305)RVB (896)SAL (278)SAN (337)UHN (739)WES (147)BFH (378)TOR (436)RHC (273)BNT (305)KMH (344)RGH (243)FGH (140)MAC (246)PET (399)PLY (570)
ROT (275)WYT (291)GWH (269)
CGH (286)KGH (356)WCI (131)NDD (260)CLW (339)TLF (141)TUN (351)RLI (231)GEO (164)DER (489)GWE (352)KCH (114)WMH (311)GWY (228)NTG (376)WHI (387)LIN (293)WRC (412)WHT (144)HAR (286)QEG (318)HOR (148)WEX (338)MKH (109)LGH (285)BED (176)AIR (275)NUN (252)QKL (323)RSU (330)ASH (333)WRX (266)WIR (462)SDG (230)MPH (368)BRI (345)BLA (463)PMS (376)RAD (526)NHH (242)FRY (433)SCU (242)RLU (395)SPH (441)TRA (104)BAS (405)QEQ (372)LGI (639)PCH (131)PIN (530)KTH (288)COC (336)UHW (510)EBH (482)JPH (340)RFH (167)CHG (299)LON (140)SGH (569)WRG (503)RCH (639)WAR (295)DID (371)IOW (250)BAT (489)NPH (245)RUS (485)WAT (455)NMH (138)OHM (335)VIC (414)RED (250)CHE (347)HRI (538)MDW (339)CRG (218)UHC (486)STM (301)RSS (325)BSL (168)BRD (350)FRM (365)PAH (372)PGH (859)QAP (732)TGA (224)CHS (190)
Cases are categorised by the highest level of assessment that they received. The legend shows the levels in hierarchical order.Six hospitals excluded due to misinterpretation of the preoperative medical assessment field.
Chart 19 – Pre-operative medical assessments (Blue Book Standard 4)In the 2012 report we reminded users that this standard was designed to capture review by doctors of grade ST3▲ or above. Since a number of hospitals have persisted in including reviews by Foundation doctors▲, they have been excluded from this chart. The percentage of patients reviewed routinely by a geriatrician has risen to 47.1% compared with 24% in 2009, due in part to the influence of BPT in England. In 42 hospitals fewer than half of the patients receive senior assessment prior to surgery.
Cases are categorised by the highest level of assessment that they received. The legend shows the levels in hierarchical order.Six hospitals excluded due to misinterpretation of the preoperative medical assessment field.
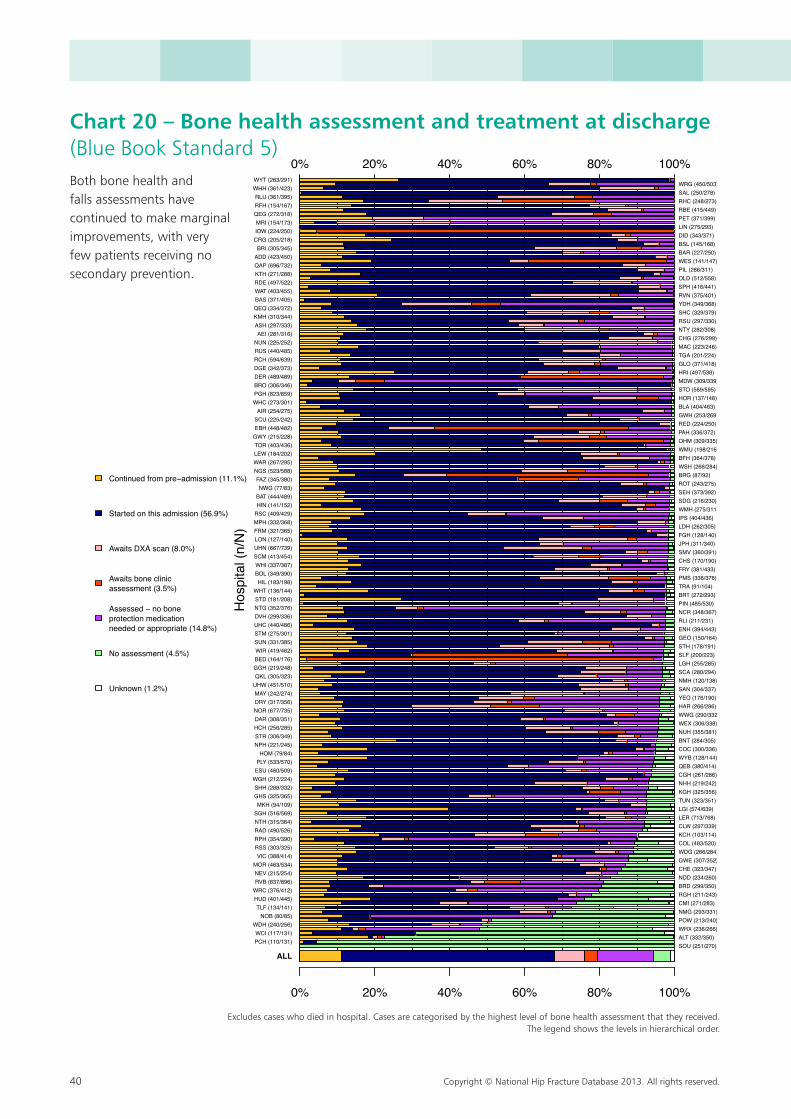
40 Copyright © National Hip Fracture Database 2013. All rights reserved.
0% 20% 40% 60% 80% 100%
0% 20% 40% 60% 80% 100%
Continued from pre−admission (11.1%)
Started on this admission (56.9%)
Awaits DXA scan (8.0%)
Awaits bone clinicassessment (3.5%)
Assessed − no boneprotection medicationneeded or appropriate (14.8%)
No assessment (4.5%)
Unknown (1.2%)
Hos
pita
l (n/
N)
ALL
PCH (110/131)WCI (117/131)
WDH (240/256)NOB (80/85)
TLF (134/141)HUD (401/445)WRC (376/412)RVB (837/896)NEV (215/254)MOR (463/534)
VIC (388/414)RSS (303/325)RPH (354/390)RAD (490/526)NTH (315/364)SGH (516/569)MKH (94/109)
GHS (325/365)SHH (288/332)
WGH (212/224)ESU (460/509)PLY (533/570)HOM (79/84)
NPH (221/245)STR (306/349)HCH (256/285)DAR (308/351)NOR (677/735)DRY (317/356)MAY (242/274)
UHW (451/510)QKL (305/323)
GGH (219/248)BED (164/176)WIR (419/462)SUN (331/385)STM (275/301)UHC (440/486)DVH (299/336)NTG (352/376)STD (181/208)WHT (136/144)
HIL (183/198)BOL (349/390)WHI (337/387)
SCM (413/454)UHN (667/739)LON (127/140)FRM (321/365)MPH (332/368)RSC (409/429)HIN (141/152)BAT (444/489)NWG (77/83)
FAZ (345/380)NGS (523/588)WAR (267/295)LEW (184/202)TOR (403/436)
GWY (215/228)EBH (448/482)SCU (225/242)AIR (254/275)
WHC (273/301)PGH (823/859)BRO (306/346)DER (489/489)DGE (342/373)RCH (594/639)RUS (440/485)NUN (225/252)AEI (281/316)
ASH (297/333)KMH (310/344)QEQ (334/372)BAS (371/405)WAT (403/455)RDE (497/522)KTH (271/288)QAP (696/732)ADD (423/450)BRI (305/345)
CRG (205/218)IOW (224/250)MRI (154/173)
QEG (272/318)RFH (154/167)RLU (361/395)
WHH (361/423)WYT (263/291)
SOU (251/270)ALT (332/350)WRX (236/266)POW (213/240)NMG (293/331)CMI (271/283)RGH (211/243)BRD (299/350)NDD (234/260)CHE (323/347)GWE (307/352)WDG (266/284)COL (483/520)KCH (103/114)CLW (297/339)LER (713/768)LGI (574/639)TUN (323/351)KGH (325/356)NHH (219/242)CGH (261/286)QEB (380/414)WYB (128/144)COC (300/336)BNT (284/305)NUH (355/381)WEX (306/338)WWG (290/332)HAR (266/286)YEO (176/190)SAN (304/337)NMH (120/138)SCA (280/294)LGH (255/285)SLF (200/223)STH (178/191)GEO (150/164)ENH (394/443)RLI (211/231)NCR (348/367)PIN (485/530)BRT (272/293)TRA (91/104)PMS (336/376)FRY (381/433)CHS (170/190)SMV (360/391)JPH (311/340)FGH (128/140)LDH (262/305)IPS (404/436)WMH (275/311)SDG (216/230)SEH (373/392)ROT (243/275)BRG (87/92)WSH (266/284)BFH (364/378)WMU (198/216)OHM (309/335)PAH (336/372)RED (224/250)GWH (253/269)BLA (404/463)HOR (137/148)STO (569/595)MDW (309/339)HRI (497/538)GLO (371/418)TGA (201/224)MAC (223/246)CHG (276/299)NTY (282/308)RSU (297/330)SHC (329/379)YDH (349/368)RVN (375/401)SPH (416/441)OLD (512/558)PIL (286/311)WES (141/147)BAR (227/250)BSL (145/168)DID (343/371)LIN (275/293)PET (371/399)RBE (415/449)RHC (248/273)SAL (250/278)WRG (450/503)
Excludes cases who died in hospital. Cases are categorised by the highest level of bonee health assessment that they received.The legend shows the levels in hierarchical order
Chart 20 – Bone health assessment and treatment at discharge (Blue Book Standard 5)Both bone health and falls assessments have continued to make marginal improvements, with very few patients receiving no secondary prevention.
Excludes cases who died in hospital. Cases are categorised by the highest level of bone health assessment that they received.The legend shows the levels in hierarchical order.
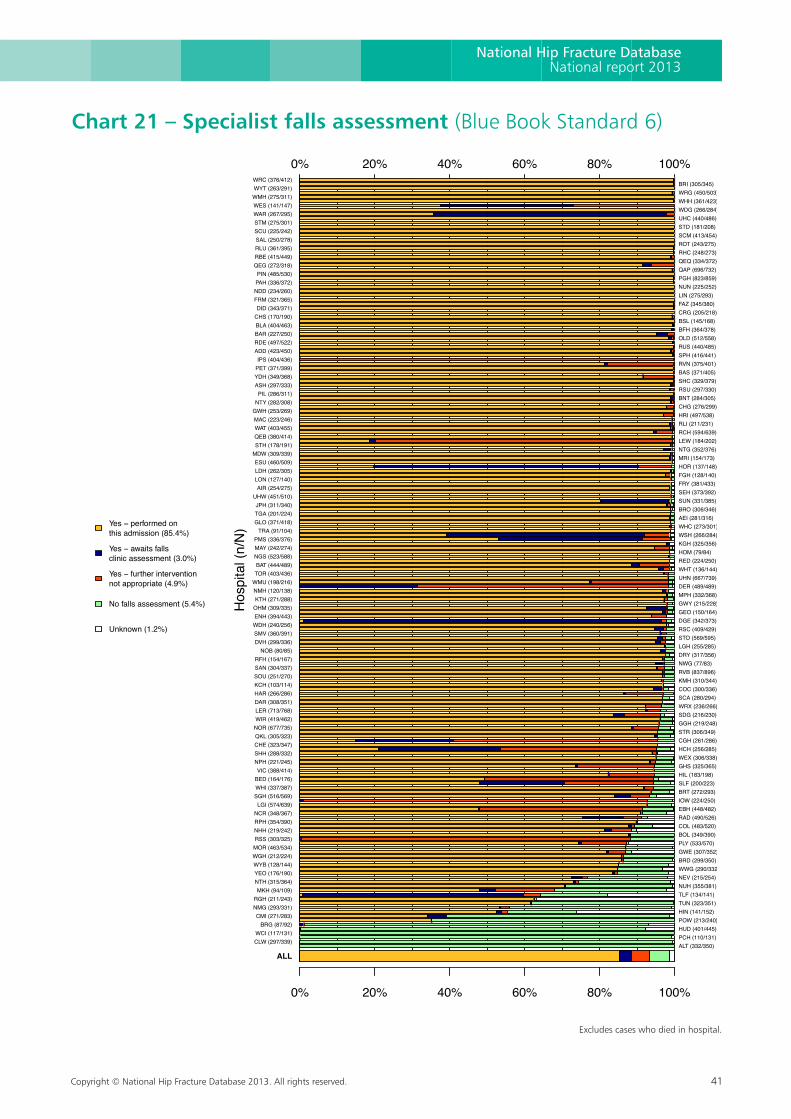
Copyright © National Hip Fracture Database 2013. All rights reserved. 41
National Hip Fracture DatabaseNational report 2013
0% 20% 40% 60% 80% 100%
0% 20% 40% 60% 80% 100%
Yes − performed onthis admission (85.4%)
Yes − awaits fallsclinic assessment (3.0%)
Yes − further interventionnot appropriate (4.9%)
No falls assessment (5.4%)
Unknown (1.2%)
Hos
pita
l (n/
N)
ALL
CLW (297/339)WCI (117/131)
BRG (87/92)CMI (271/283)
NMG (293/331)RGH (211/243)
MKH (94/109)NTH (315/364)YEO (176/190)WYB (128/144)WGH (212/224)MOR (463/534)RSS (303/325)NHH (219/242)RPH (354/390)NCR (348/367)LGI (574/639)
SGH (516/569)WHI (337/387)BED (164/176)VIC (388/414)
NPH (221/245)SHH (288/332)CHE (323/347)QKL (305/323)NOR (677/735)WIR (419/462)LER (713/768)DAR (308/351)HAR (266/286)KCH (103/114)SOU (251/270)SAN (304/337)RFH (154/167)
NOB (80/85)DVH (299/336)SMV (360/391)WDH (240/256)ENH (394/443)OHM (309/335)KTH (271/288)NMH (120/138)WMU (198/216)TOR (403/436)BAT (444/489)
NGS (523/588)MAY (242/274)PMS (336/376)
TRA (91/104)GLO (371/418)TGA (201/224)JPH (311/340)
UHW (451/510)AIR (254/275)
LON (127/140)LDH (262/305)ESU (460/509)
MDW (309/339)STH (178/191)QEB (380/414)WAT (403/455)MAC (223/246)GWH (253/269)NTY (282/308)PIL (286/311)
ASH (297/333)YDH (349/368)PET (371/399)IPS (404/436)
ADD (423/450)RDE (497/522)BAR (227/250)BLA (404/463)CHS (170/190)DID (343/371)
FRM (321/365)NDD (234/260)PAH (336/372)PIN (485/530)
QEG (272/318)RBE (415/449)RLU (361/395)SAL (250/278)SCU (225/242)STM (275/301)WAR (267/295)WES (141/147)WMH (275/311)WYT (263/291)WRC (376/412)
ALT (332/350)PCH (110/131)HUD (401/445)POW (213/240)HIN (141/152)TUN (323/351)TLF (134/141)NUH (355/381)NEV (215/254)WWG (290/332)BRD (299/350)GWE (307/352)PLY (533/570)BOL (349/390)COL (483/520)RAD (490/526)EBH (448/482)IOW (224/250)BRT (272/293)SLF (200/223)HIL (183/198)GHS (325/365)WEX (306/338)HCH (256/285)CGH (261/286)STR (306/349)GGH (219/248)SDG (216/230)WRX (236/266)SCA (280/294)COC (300/336)KMH (310/344)RVB (837/896)NWG (77/83)DRY (317/356)LGH (255/285)STO (569/595)RSC (409/429)DGE (342/373)GEO (150/164)GWY (215/228)MPH (332/368)DER (489/489)UHN (667/739)WHT (136/144)RED (224/250)HOM (79/84)KGH (325/356)WSH (266/284)WHC (273/301)AEI (281/316)BRO (306/346)SUN (331/385)SEH (373/392)FRY (381/433)FGH (128/140)HOR (137/148)MRI (154/173)NTG (352/376)LEW (184/202)RCH (594/639)RLI (211/231)HRI (497/538)CHG (276/299)BNT (284/305)RSU (297/330)SHC (329/379)BAS (371/405)RVN (375/401)SPH (416/441)RUS (440/485)OLD (512/558)BFH (364/378)BSL (145/168)CRG (205/218)FAZ (345/380)LIN (275/293)NUN (225/252)PGH (823/859)QAP (696/732)QEQ (334/372)RHC (248/273)ROT (243/275)SCM (413/454)STD (181/208)UHC (440/486)WDG (266/284)WHH (361/423)WRG (450/503)BRI (305/345)
Excludes cases who died in hospital.
Chart 21 – Specialist falls assessment (Blue Book Standard 6)
Excludes cases who died in hospital.
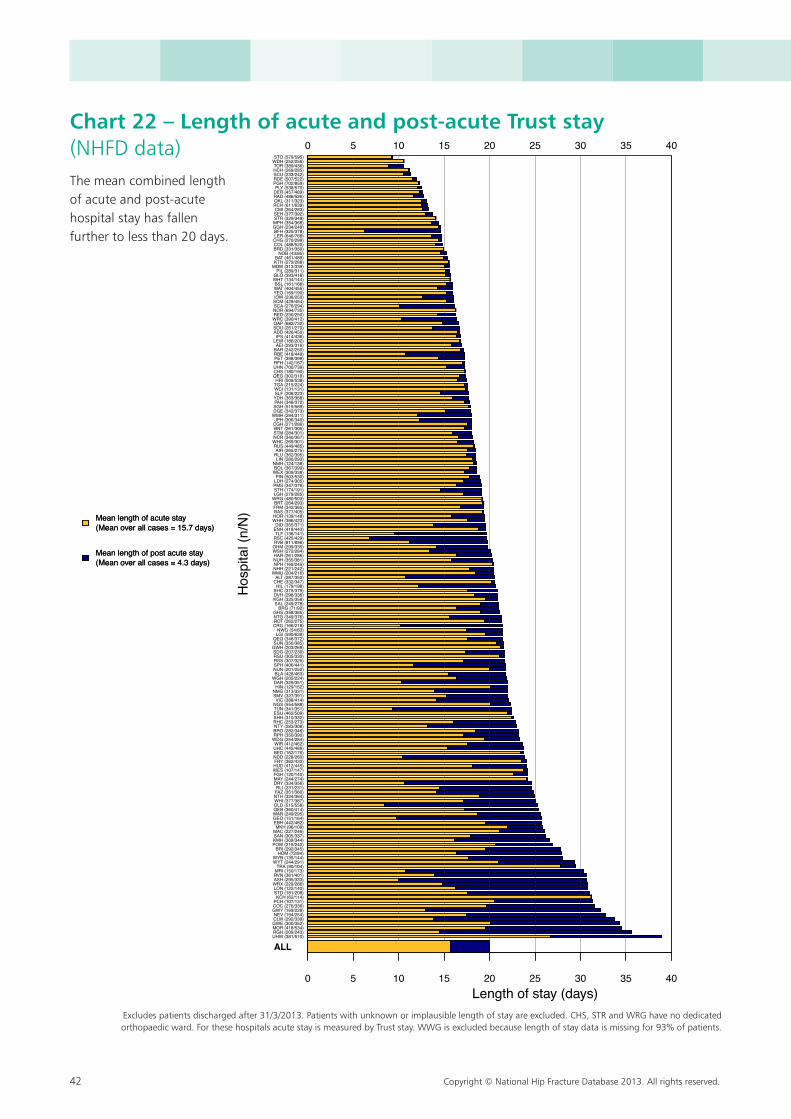
42 Copyright © National Hip Fracture Database 2013. All rights reserved.
Mean length of acute stay(Mean over all cases = 15.7 days)
Mean length of post acute stay(Mean over all cases = 4.3 days)
0 5 10 15 20 25 30 35 40
0 5 10 15 20 25 30 35 40
Mean length of acute stay(Mean over all cases = 15.7 days)
Mean length of post acute stay(Mean over all cases = 4.3 days)
UHW (381/510)RGH (209/243)MOR (418/534)GWE (300/352)CLW (292/339)NEV (194/254)
GWY (169/228)COC (276/336)PCH (107/131)
KCH (62/114)STD (181/208)LON (122/140)WRX (229/266)ASH (295/333)RVN (361/401)MRI (150/173)TRA (90/104)
WYT (244/291)WYB (135/144)
HOM (72/84)BRI (292/345)
POW (215/240)KMH (309/344)SAN (305/337)MAC (227/246)MKH (96/109)
EBH (442/482)GEO (151/164)WAR (249/295)QEB (360/414)OLD (515/558)WHI (377/387)NTH (324/364)FAZ (351/380)RLI (231/231)
DRY (334/356)MAY (244/274)FGH (120/140)WES (107/147)HUD (412/445)FRY (362/433)NDD (228/260)BED (162/176)UHC (445/486)WIR (412/462)
WDG (254/284)RPH (350/390)BRO (282/346)NTY (283/308)RHC (253/273)SHH (310/332)ESU (462/509)TUN (341/351)NGS (554/588)VIC (388/414)
SMV (327/391)NMG (313/331)
HIN (129/152)DAR (329/351)
WGH (205/224)BLA (428/463)NUN (201/252)SPH (406/441)RSS (307/325)RSU (305/330)SDG (207/230)
GWH (203/269)SUN (350/385)QEQ (346/372)
LGI (590/639)NWG (54/83)
CRG (166/218)ROT (262/275)NTG (349/376)GHS (358/365)
BRG (71/92)SAL (249/278)KGH (325/356)DVH (298/336)SHC (375/379)HIL (179/198)
CHE (332/347)ALT (287/350)
WMU (204/216)NHH (221/242)NPH (169/245)NUH (355/381)HAR (261/286)WSH (272/284)OHM (299/335)RVB (811/896)RSC (425/429)TLF (138/141)
ENH (418/443)DID (355/371)
WHH (386/423)HOR (139/148)BAS (377/405)FRM (342/365)BRT (264/293)
WRG (480/503)LGH (279/285)STH (174/191)PMS (347/376)LDH (274/305)PIN (503/530)
WEX (309/338)BOL (367/390)NMH (124/138)
LIN (280/293)RLU (362/395)AIR (265/275)
RUS (449/485)WHC (269/301)NCR (340/367)STM (284/301)BNT (261/305)CGH (271/286)JPH (306/340)
WMH (294/311)DGE (342/373)SGH (519/569)PAH (348/372)YDH (363/368)SLF (206/223)WCI (131/131)TGA (215/224)HRI (509/538)
QEG (302/318)CHS (180/190)UHN (700/739)RFH (142/167)PET (398/399)RBE (418/449)BAR (242/250)AEI (293/316)
LEW (186/202)IPS (414/436)
ADD (426/450)SOU (261/270)QAP (682/732)WRC (390/412)RED (230/250)NOR (694/735)SCA (276/294)SCM (429/454)IOW (238/250)YEO (169/190)WAT (404/455)BSL (161/168)
WHT (134/144)GLO (393/418)
PIL (289/311)MDW (313/339)KTH (279/288)BAT (461/489)
NOB (43/85)BRD (331/350)COL (488/520)CHG (270/299)LER (646/768)BFH (325/378)
GGH (234/248)MPH (354/368)STR (329/349)SEH (377/392)CMI (264/283)
RCH (611/639)QKL (311/323)RAD (486/526)DER (457/489)PLY (538/570)
PGH (702/859)RDE (507/522)SCU (233/242)HCH (269/285)TOR (389/436)
WDH (252/256)STO (579/595)
Hos
pita
l (n/
N)
ALL
Length of stay (days)Excludes patients discharged after 31/3/2013. Patients with unknown or implausible length of stay are excluded. CHS, STR and WRG have no dedicated orthopaedic ward.
For these hospitals acute stay is measured by Trust stay. WWG is excluded because length of stay data is missing for 93% of patients.
Chart 22 – Length of acute and post-acute Trust stay (NHFD data)The mean combined length of acute and post-acute hospital stay has fallen further to less than 20 days.
Excludes patients discharged after 31/3/2013. Patients with unknown or implausible length of stay are excluded. CHS, STR and WRG have no dedicated orthopaedic ward. For these hospitals acute stay is measured by Trust stay. WWG is excluded because length of stay data is missing for 93% of patients.
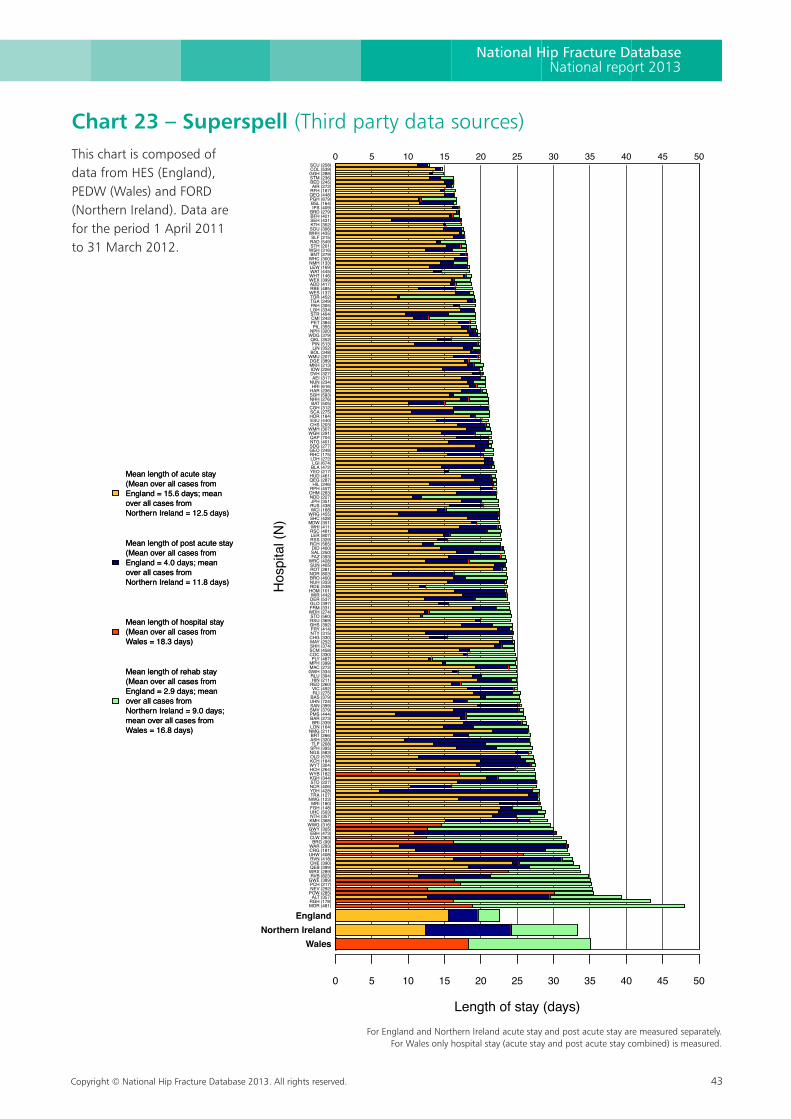
Copyright © National Hip Fracture Database 2013. All rights reserved. 43
National Hip Fracture DatabaseNational report 2013
Chart 23 – Superspell (Third party data sources)This chart is composed of data from HES (England), PEDW (Wales) and FORD (Northern Ireland). Data are for the period 1 April 2011 to 31 March 2012.
Mean length of acute stay(Mean over all cases fromEngland = 15.6 days; meanover all cases fromNorthern Ireland = 12.5 days)
Mean length of post acute stay(Mean over all cases fromEngland = 4.0 days; meanover all cases fromNorthern Ireland = 11.8 days)
Mean length of hospital stay(Mean over all cases fromWales = 18.3 days)
Mean length of rehab stay(Mean over all cases fromEngland = 2.9 days; meanover all cases fromNorthern Ireland = 9.0 days;mean over all cases fromWales = 16.8 days)
MOR (481)RGH (178)ALT (357)
POW (285)NEV (292)PCH (217)
GWE (389)RVB (823)
WRX (289)QEB (399)CHE (390)RVN (418)
UHW (408)CRG (181)WAR (293)
BRG (99)CLW (363)EBH (473)
GWY (305)WWG (316)KMH (368)NTH (357)UHC (503)FGH (148)MRI (180)
NWG (123)TRA (127)YDH (428)NCR (406)STD (227)KGH (344)WYB (182)HCH (264)WYT (304)KCH (184)OLD (576)NGS (583)SPH (395)TLF (208)
ASH (320)BRT (266)
NMG (211)LON (164)BRI (339)
BAR (273)PMS (444)SMV (379)SAN (399)UHN (724)BAS (379)RLI (275)VIC (492)
RED (260)HIN (211)
RLU (394)GWH (334)MAC (272)MPH (399)PLY (487)
COC (330)SCM (458)SHH (374)MAY (252)CHG (330)NTY (315)FRY (414)GHS (392)RSU (369)STO (560)
WDH (274)FRM (331)GLO (397)DER (537)WIR (442)
HOM (101)RDE (538)NUH (333)BRO (400)NOR (803)ROT (281)SUN (405)
WRC (428)FAZ (393)SAL (250)DID (400)
RCH (565)RSS (329)LER (807)RSC (481)WHI (411)
MDW (351)SHC (428)
WRG (455)WCI (168)RUS (438)JPH (351)
NDD (227)OHM (263)RPH (457)HIL (246)
QEG (287)HUD (461)YEO (217)BLA (472)LGI (674)
LDH (272)RHC (175)GEO (248)SDG (277)NTG (401)QAP (704)
WGH (291)WMH (307)CHS (203)ESU (440)HOR (184)SCA (275)CGH (312)BAT (505)
NHH (276)SGH (593)HAR (236)HRI (616)
NUN (234)AEI (317)
DVH (327)IOW (226)MKH (213)DGE (389)
WMU (207)BOL (348)LIN (352)PIN (513)
QKL (352)WDG (379)NPH (320)
PIL (355)PET (384)CMI (242)STR (404)LGH (334)PAH (305)TGA (249)TOR (452)WES (137)RBE (485)ADD (417)WEX (399)WHT (146)WAT (445)LEW (169)NMH (133)WHC (300)BNT (279)
WSH (316)STH (201)RAD (549)SLF (215)
WHH (435)SOU (306)KTH (352)SEH (431)BFH (421)BRD (279)IPS (409)
BSL (164)PGH (879)QEQ (448)RFH (187)AIR (272)
BED (245)STM (236)GGH (288)COL (539)SCU (258)
0 5 10 15 20 25 30 35 40 45 50
0 5 10 15 20 25 30 35 40 45 50
Mean length of acute stay(Mean over all cases fromEngland = 15.6 days; meanover all cases fromNorthern Ireland = 12.5 days)
Mean length of post acute stay(Mean over all cases fromEngland = 4.0 days; meanover all cases fromNorthern Ireland = 11.8 days)
Mean length of hospital stay(Mean over all cases fromWales = 18.3 days)
Mean length of rehab stay(Mean over all cases fromEngland = 2.9 days; meanover all cases fromNorthern Ireland = 9.0 days;mean over all cases fromWales = 16.8 days)
Hos
pita
l (N
)
WalesNorthern Ireland
England
Length of stay (days)
For England and Northern Ireland acute stay and post acute stay are measured separately. For Wales only hospital stay (acute stay and post acute stay combined) is measured.
For England and Northern Ireland acute stay and post acute stay are measured separately. For Wales only hospital stay (acute stay and post acute stay combined) is measured.
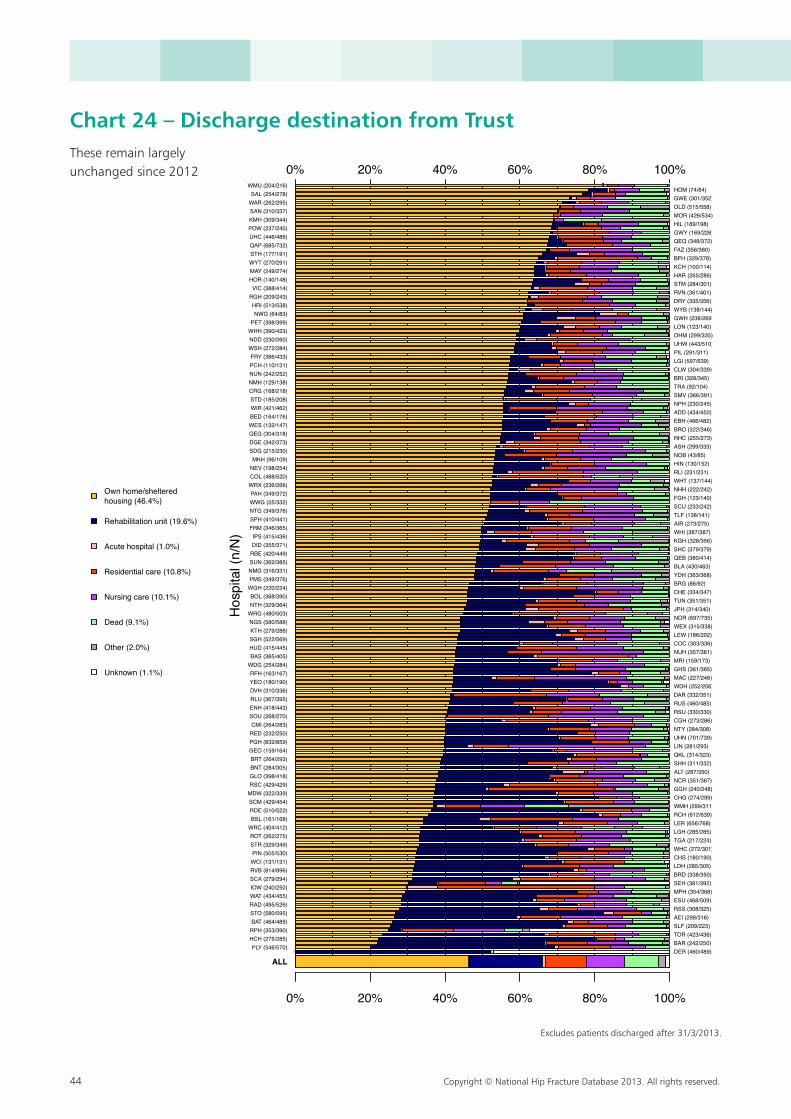
44 Copyright © National Hip Fracture Database 2013. All rights reserved.
Chart 24 – Discharge destination from Trust These remain largely unchanged since 2012
0% 20% 40% 60% 80% 100%
0% 20% 40% 60% 80% 100%
Own home/shelteredhousing (46.4%)
Rehabilitation unit (19.6%)
Acute hospital (1.0%)
Residential care (10.8%)
Nursing care (10.1%)
Dead (9.1%)
Other (2.0%)
Unknown (1.1%)
Hos
pita
l (n/
N)
ALL
PLY (546/570)HCH (275/285)RPH (353/390)BAT (464/489)STO (580/595)RAD (495/526)WAT (434/455)IOW (240/250)SCA (279/294)RVB (814/896)WCI (131/131)PIN (505/530)
STR (329/349)ROT (262/275)
WRC (404/412)BSL (161/168)RDE (510/522)SCM (429/454)MDW (322/339)RSC (429/429)GLO (398/418)BNT (284/305)BRT (264/293)GEO (159/164)PGH (832/859)RED (232/250)CMI (264/283)
SOU (268/270)ENH (418/443)RLU (367/395)DVH (310/336)YEO (180/190)RFH (163/167)
WDG (254/284)BAS (385/405)HUD (415/445)SGH (522/569)KTH (279/288)NGS (580/588)
WRG (480/503)NTH (329/364)BOL (368/390)
WGH (220/224)PMS (349/376)NMG (316/331)SUN (362/385)RBE (420/449)DID (355/371)IPS (415/436)
FRM (346/365)SPH (410/441)NTG (349/376)WWG (25/332)PAH (349/372)
WRX (236/266)COL (488/520)NEV (198/254)MKH (96/109)
SDG (215/230)DGE (342/373)QEG (304/318)WES (132/147)BED (164/176)WIR (421/462)STD (185/208)CRG (168/218)NMH (129/138)NUN (242/252)PCH (110/131)FRY (386/433)
WSH (272/284)NDD (230/260)WHH (390/423)PET (398/399)
NWG (64/83)HRI (513/538)
RGH (209/243)VIC (388/414)
HOR (140/148)MAY (249/274)WYT (270/291)STH (177/191)QAP (685/732)UHC (446/486)POW (237/240)KMH (309/344)SAN (310/337)WAR (262/295)SAL (254/278)
WMU (204/216)
DER (460/489)BAR (242/250)TOR (423/436)SLF (209/223)AEI (298/316)RSS (308/325)ESU (468/509)MPH (354/368)SEH (381/392)BRD (338/350)LDH (285/305)CHS (180/190)WHC (272/301)TGA (217/224)LGH (285/285)LER (656/768)RCH (612/639)WMH (299/311)CHG (274/299)GGH (240/248)NCR (351/367)ALT (287/350)SHH (311/332)QKL (314/323)LIN (281/293)UHN (701/739)NTY (284/308)CGH (273/286)RSU (330/330)RUS (460/485)DAR (332/351)WDH (252/256)MAC (227/246)GHS (361/365)MRI (159/173)NUH (357/381)COC (303/336)LEW (186/202)WEX (315/338)NOR (697/735)JPH (314/340)TUN (351/351)CHE (334/347)BRG (86/92)YDH (363/368)BLA (430/463)QEB (380/414)SHC (379/379)KGH (328/356)WHI (387/387)AIR (273/275)TLF (138/141)SCU (233/242)FGH (123/140)NHH (222/242)WHT (137/144)RLI (231/231)HIN (130/152)NOB (43/85)ASH (299/333)RHC (255/273)BRO (322/346)EBH (466/482)ADD (434/450)NPH (230/245)SMV (366/391)TRA (92/104)BRI (328/345)CLW (304/339)LGI (597/639)PIL (291/311)UHW (443/510)OHM (299/335)LON (123/140)GWH (238/269)WYB (138/144)DRY (335/356)RVN (361/401)STM (284/301)HAR (265/286)KCH (100/114)BFH (329/378)FAZ (356/380)QEQ (348/372)GWY (169/228)HIL (189/198)MOR (426/534)OLD (515/558)GWE (301/352)HOM (74/84)
Excludes patients discharged after 31/3/2013.Excludes patients discharged after 31/3/2013.
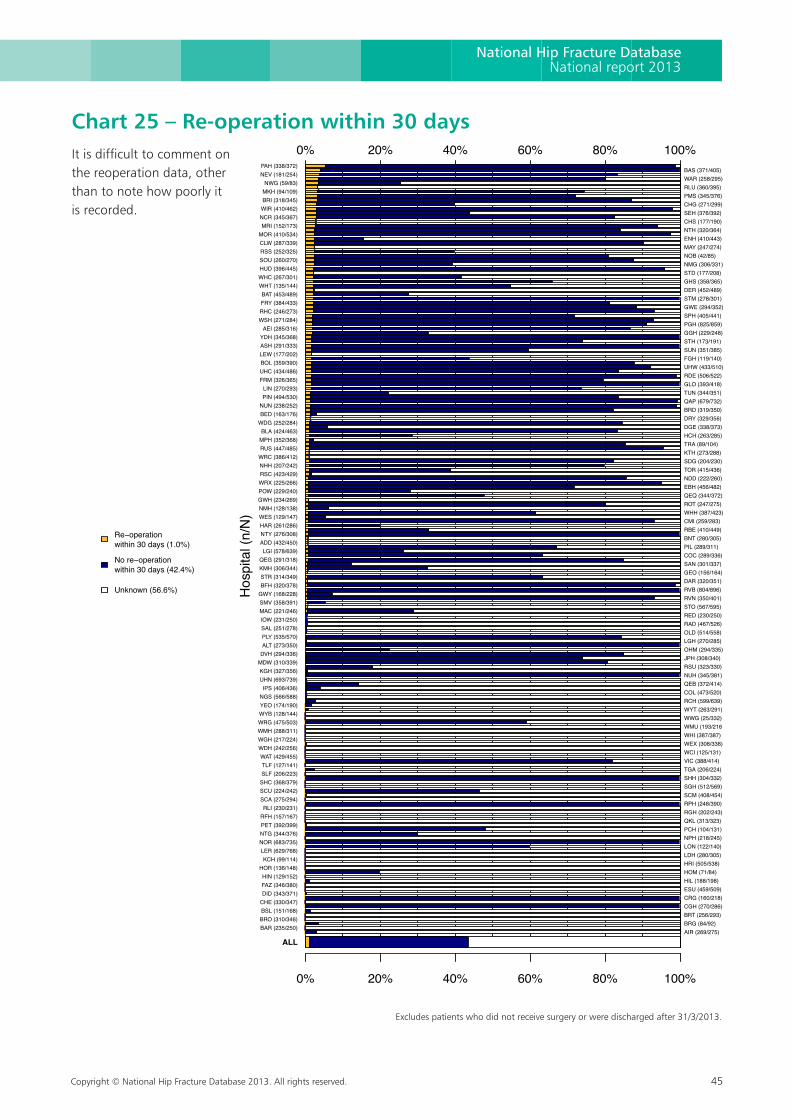
Copyright © National Hip Fracture Database 2013. All rights reserved. 45
National Hip Fracture DatabaseNational report 2013
Chart 25 – Re-operation within 30 days It is difficult to comment on the reoperation data, other than to note how poorly it is recorded.
0% 20% 40% 60% 80% 100%
0% 20% 40% 60% 80% 100%
Re−operationwithin 30 days (1.0%)
No re−operationwithin 30 days (42.4%)
Unknown (56.6%) Hos
pita
l (n/
N)
ALL
BAR (235/250)BRO (310/346)BSL (151/168)CHE (330/347)DID (343/371)FAZ (346/380)HIN (129/152)
HOR (136/148)KCH (99/114)
LER (629/768)NOR (683/735)NTG (344/376)PET (392/399)RFH (157/167)RLI (230/231)
SCA (275/294)SCU (224/242)SHC (368/379)SLF (206/223)TLF (127/141)WAT (429/455)
WDH (242/256)WGH (217/224)WMH (288/311)WRG (475/503)WYB (128/144)YEO (174/190)NGS (566/588)IPS (406/436)
UHN (693/739)KGH (327/356)
MDW (310/339)DVH (294/336)ALT (273/350)PLY (535/570)SAL (251/278)IOW (231/250)MAC (221/246)SMV (358/391)GWY (168/228)BFH (320/378)STR (314/349)KMH (306/344)QEG (291/318)
LGI (578/639)ADD (432/450)NTY (276/308)HAR (261/286)WES (129/147)NMH (128/138)GWH (234/269)POW (229/240)WRX (225/266)RSC (423/429)NHH (207/242)WRC (386/412)RUS (447/485)MPH (352/368)BLA (424/463)
WDG (252/284)BED (163/176)NUN (238/252)PIN (494/530)LIN (270/293)
FRM (326/365)UHC (434/486)BOL (359/390)LEW (177/202)ASH (291/333)YDH (345/368)AEI (285/316)
WSH (271/284)RHC (246/273)FRY (384/433)BAT (453/489)
WHT (135/144)WHC (267/301)HUD (396/445)SOU (260/270)RSS (252/325)CLW (287/339)MOR (410/534)MRI (152/173)
NCR (345/367)WIR (410/462)BRI (318/345)MKH (94/109)NWG (59/83)
NEV (181/254)PAH (338/372)
AIR (269/275)BRG (84/92)BRT (256/293)CGH (270/286)CRG (160/218)ESU (459/509)HIL (188/198)HOM (71/84)HRI (505/538)LDH (280/305)LON (122/140)NPH (218/245)PCH (104/131)QKL (313/323)RGH (202/243)RPH (248/390)SCM (408/454)SGH (512/569)SHH (304/332)TGA (206/224)VIC (388/414)WCI (125/131)WEX (308/338)WHI (387/387)WMU (193/216)WWG (25/332)WYT (263/291)RCH (599/639)COL (473/520)QEB (372/414)NUH (345/381)RSU (323/330)JPH (308/340)OHM (294/335)LGH (270/285)OLD (514/558)RAD (467/526)RED (230/250)STO (567/595)RVN (350/401)RVB (804/896)DAR (320/351)GEO (156/164)SAN (301/337)COC (289/336)PIL (289/311)BNT (280/305)RBE (410/449)CMI (259/283)WHH (387/423)ROT (247/275)QEQ (344/372)EBH (456/482)NDD (222/260)TOR (415/436)SDG (204/230)KTH (273/288)TRA (89/104)HCH (263/285)DGE (338/373)DRY (329/356)BRD (319/350)QAP (679/732)TUN (344/351)GLO (393/418)RDE (506/522)UHW (433/510)FGH (119/140)SUN (351/385)STH (173/191)GGH (229/248)PGH (825/859)SPH (405/441)GWE (294/352)STM (278/301)DER (452/489)GHS (358/365)STD (177/208)NMG (306/331)NOB (42/85)MAY (247/274)ENH (410/443)NTH (320/364)CHS (177/190)SEH (376/392)CHG (271/299)PMS (345/376)RLU (360/395)WAR (258/295)BAS (371/405)
Excludes patients who did not receive surgery or were discharged after 31/03/2013.Excludes patients who did not receive surgery or were discharged after 31/3/2013.
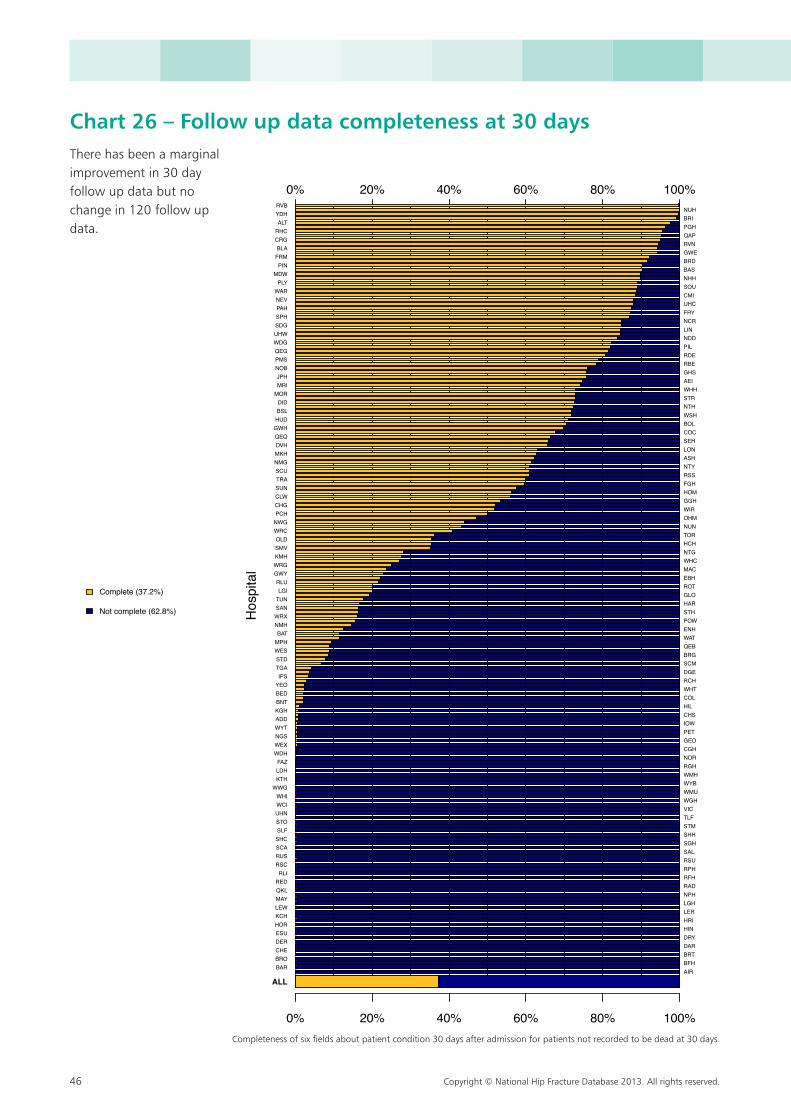
46 Copyright © National Hip Fracture Database 2013. All rights reserved.
Chart 26 – Follow up data completeness at 30 daysThere has been a marginal improvement in 30 day follow up data but no change in 120 follow up data.
0% 20% 40% 60% 80% 100%
0% 20% 40% 60% 80% 100%
Complete (37.2%)
Not complete (62.8%) Hos
pita
l
ALL
BARBROCHEDERESUHORKCHLEWMAYQKLREDRLI
RSCRUSSCASHCSLFSTOUHNWCIWHI
WWGKTHLDHFAZ
WDHWEXNGSWYTADDKGHBNTBEDYEOIPS
TGASTD
WESMPHBAT
NMHWRXSANTUNLGI
RLUGWYWRGKMHSMVOLD
WRCNWGPCHCHGCLWSUNTRASCUNMGMKHDVHQEQGWHHUDBSLDID
MORMRIJPH
NOBPMSQEGWDGUHWSDGSPHPAHNEVWARPLY
MDWPIN
FRMBLA
CRGRHCALT
YDHRVB
AIRBFHBRTDARDRYHINHRILERLGHNPHRADRFHRPHRSUSALSGHSHHSTMTLFVICWGHWMUWYBWMHRGHNORCGHGEOPETIOWCHSHILCOLWHTRCHDGESCMBRGQEBWATENHPOWSTHHARGLOROTEBHMACWHCNTGHCHTORNUNOHMWIRGGHHOMFGHRSSNTYASHLONSEHCOCBOLWSHNTHSTRWHHAEIGHSRBERDEPILNDDLINNCRFRYUHCCMISOUNHHBASBRDGWERVNQAPPGHBRINUH
Completeness of six fields about patient condition 30 days after admission for patients not recorded to be dead at 30 days.
Completeness of six fields about patient condition 30 days after admission for patients not recorded to be dead at 30 days.
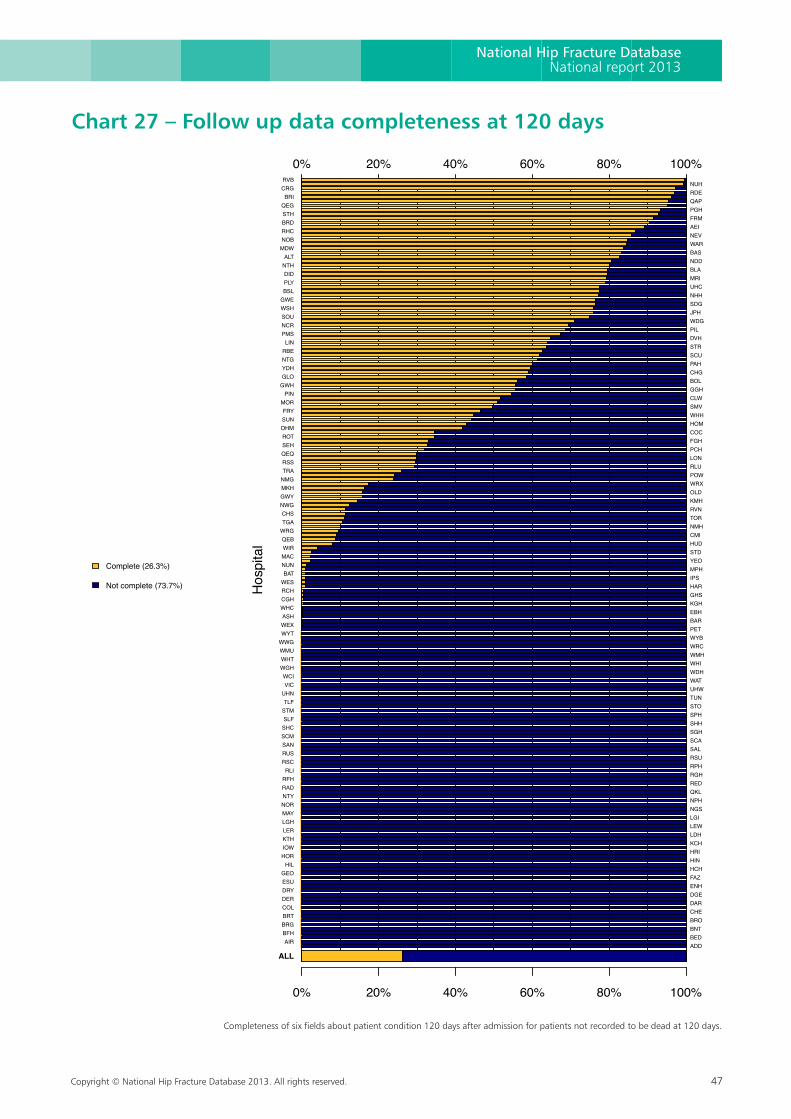
Copyright © National Hip Fracture Database 2013. All rights reserved. 47
National Hip Fracture DatabaseNational report 2013
Chart 27 – Follow up data completeness at 120 days
0% 20% 40% 60% 80% 100%
0% 20% 40% 60% 80% 100%
Complete (26.3%)
Not complete (73.7%) Hos
pita
l
ALL
AIRBFHBRGBRTCOLDERDRYESUGEO
HILHORIOWKTHLERLGHMAYNORNTYRADRFHRLI
RSCRUSSANSCMSHCSLFSTMTLF
UHNVIC
WCIWGHWHTWMUWWGWYTWEXASH
WHCCGHRCHWESBAT
NUNMACWIRQEB
WRGTGACHS
NWGGWYMKHNMGTRARSSQEQSEHROT
OHMSUNFRY
MORPIN
GWHGLOYDHNTGRBELIN
PMSNCRSOUWSHGWEBSLPLYDID
NTHALT
MDWNOBRHCBRDSTHQEG
BRICRGRVB
ADDBEDBNTBROCHEDARDGEENHFAZHCHHINHRIKCHLDHLEWLGINGSNPHQKLREDRGHRPHRSUSALSCASGHSHHSPHSTOTUNUHWWATWDHWHIWMHWRCWYBPETBAREBHKGHGHSHARIPSMPHYEOSTDHUDCMINMHTORRVNKMHOLDWRXPOWRLULONPCHFGHCOCHOMWHHSMVCLWGGHBOLCHGPAHSCUSTRDVHPILWDGJPHSDGNHHUHCMRIBLANDDBASWARNEVAEIFRMPGHQAPRDENUH
Completeness of six fields about patient condition 120 days after admission for patients not recorded to be dead at 120 days.Completeness of six fields about patient condition 120 days after admission for patients not recorded to be dead at 120 days.
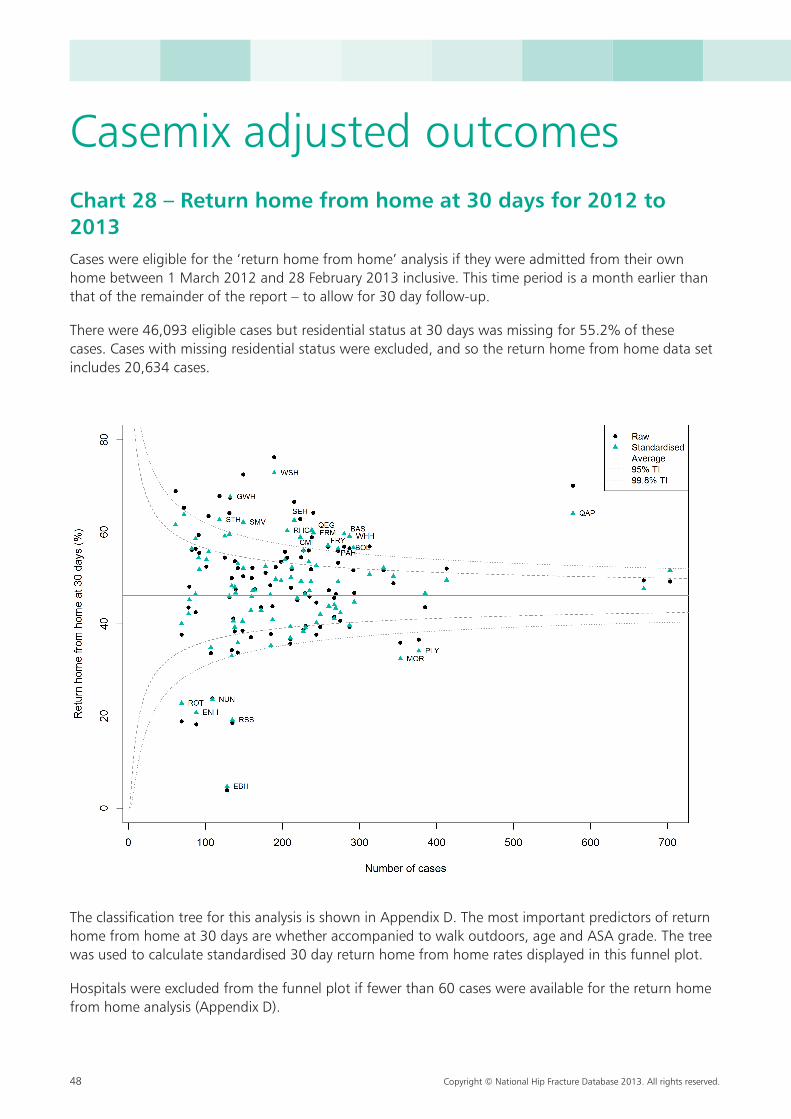
48 Copyright © National Hip Fracture Database 2013. All rights reserved.
Casemix adjusted outcomesChart 28 – Return home from home at 30 days for 2012 to 2013Cases were eligible for the ‘return home from home’ analysis if they were admitted from their own home between 1 March 2012 and 28 February 2013 inclusive. This time period is a month earlier than that of the remainder of the report – to allow for 30 day follow-up.
There were 46,093 eligible cases but residential status at 30 days was missing for 55.2% of these cases. Cases with missing residential status were excluded, and so the return home from home data set includes 20,634 cases.
The classification tree for this analysis is shown in Appendix D. The most important predictors of return home from home at 30 days are whether accompanied to walk outdoors, age and ASA grade. The tree was used to calculate standardised 30 day return home from home rates displayed in this funnel plot.
Hospitals were excluded from the funnel plot if fewer than 60 cases were available for the return home from home analysis (Appendix D).
Copyright © National Hip Fracture Database 2013. All rights reserved. 49
National Hip Fracture DatabaseNational report 2013
The overall rate of return home from home at 30 days for all cases included in the analysis is 46.2%.
Many hospitals lie outside of the 95% and 99.8% tolerance intervals, but caution is necessary when drawing conclusions about these hospitals. This ‘over-dispersion’ is a common feature of provider comparison analyses. It may arise because hospitals differ in their policies regarding return home from home or because of the high proportion of missing data.
There are seven hospitals with standardised rates of return home from home at 30 days below the 99.8% tolerance intervals.
The unit with the lowest standardised rate (4.7%) was EBH – with 40.6% (compared to a national average of 12.8%) of those admitted from home still being in the acute hospital, and a further 39.8% (compared to 21.7%) still in a rehabilitation unit at 30 days. This hospital also had the lowest standardised rate of return home from home at 30 days in 2011–12 (4.9%), and the second lowest rate in 2010–11 (11.7%).
The six other hospitals where the standardised return home from home rates are below the 99.8% tolerance interval are RSS, ENH, ROT, NUN, MOR and PLY. Three of these (RSS, NUN and PLY) also had return home from home rates below the 99.8% limit in the 2011–12 analysis.
There are fifteen hospitals with particularly good return home from home rates at 30 days – adjusted return home from home rates are above the 99.8% tolerance interval. The two most impressive are WSH and GWH, each with standardised rates of return home of approximately 70%. Eight of these (FRM, FRY, GWH, PAH, QAP, QEG, RHC and WSH), had performed similarly well in the 2011–12 analysis.
Four hospitals (BAS, CMI, SMV and STH) had return home from home rates between the upper 95% and 99.8% tolerance intervals in the 2011–2012 analysis.
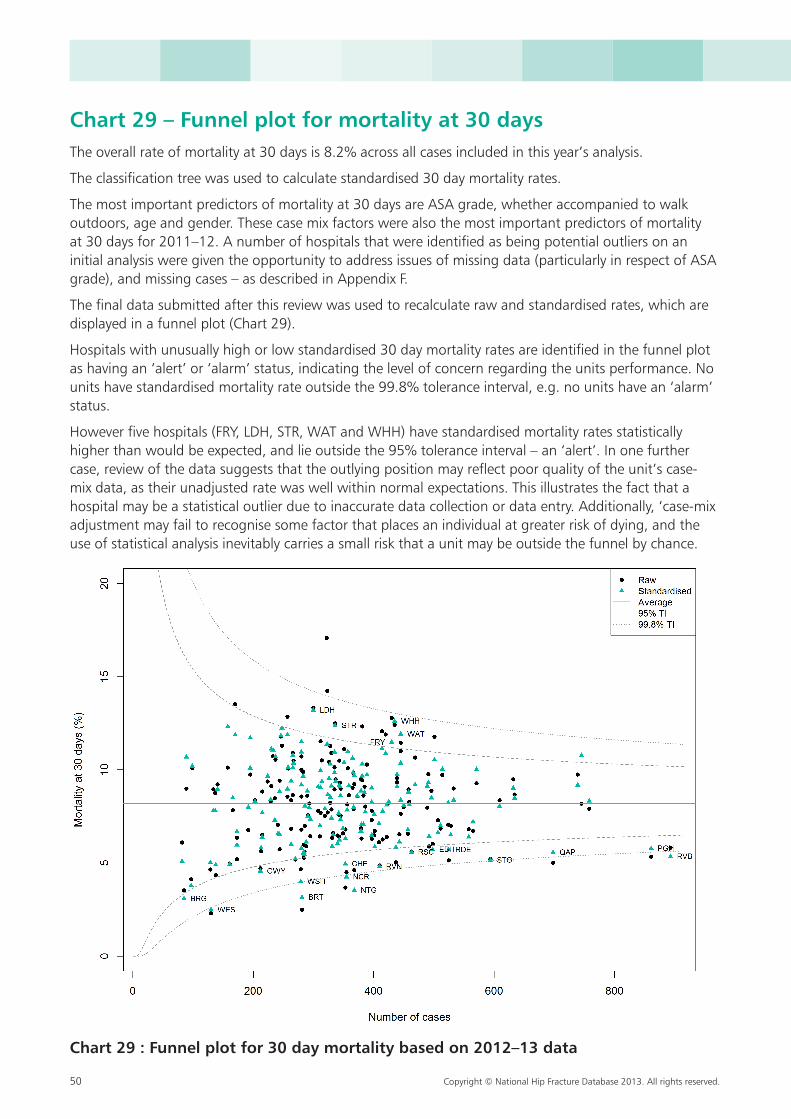
50 Copyright © National Hip Fracture Database 2013. All rights reserved.
Chart 29 – Funnel plot for mortality at 30 daysThe overall rate of mortality at 30 days is 8.2% across all cases included in this year’s analysis.
The classification tree was used to calculate standardised 30 day mortality rates.
The most important predictors of mortality at 30 days are ASA grade, whether accompanied to walk outdoors, age and gender. These case mix factors were also the most important predictors of mortality at 30 days for 2011–12. A number of hospitals that were identified as being potential outliers on an initial analysis were given the opportunity to address issues of missing data (particularly in respect of ASA grade), and missing cases – as described in Appendix F.
The final data submitted after this review was used to recalculate raw and standardised rates, which are displayed in a funnel plot (Chart 29).
Hospitals with unusually high or low standardised 30 day mortality rates are identified in the funnel plot as having an ‘alert’ or ‘alarm’ status, indicating the level of concern regarding the units performance. No units have standardised mortality rate outside the 99.8% tolerance interval, e.g. no units have an ‘alarm’ status.
However five hospitals (FRY, LDH, STR, WAT and WHH) have standardised mortality rates statistically higher than would be expected, and lie outside the 95% tolerance interval – an ‘alert’. In one further case, review of the data suggests that the outlying position may reflect poor quality of the unit’s case-mix data, as their unadjusted rate was well within normal expectations. This illustrates the fact that a hospital may be a statistical outlier due to inaccurate data collection or data entry. Additionally, ‘case-mix adjustment may fail to recognise some factor that places an individual at greater risk of dying, and the use of statistical analysis inevitably carries a small risk that a unit may be outside the funnel by chance.
Chart 29 : Funnel plot for 30 day mortality based on 2012–13 data
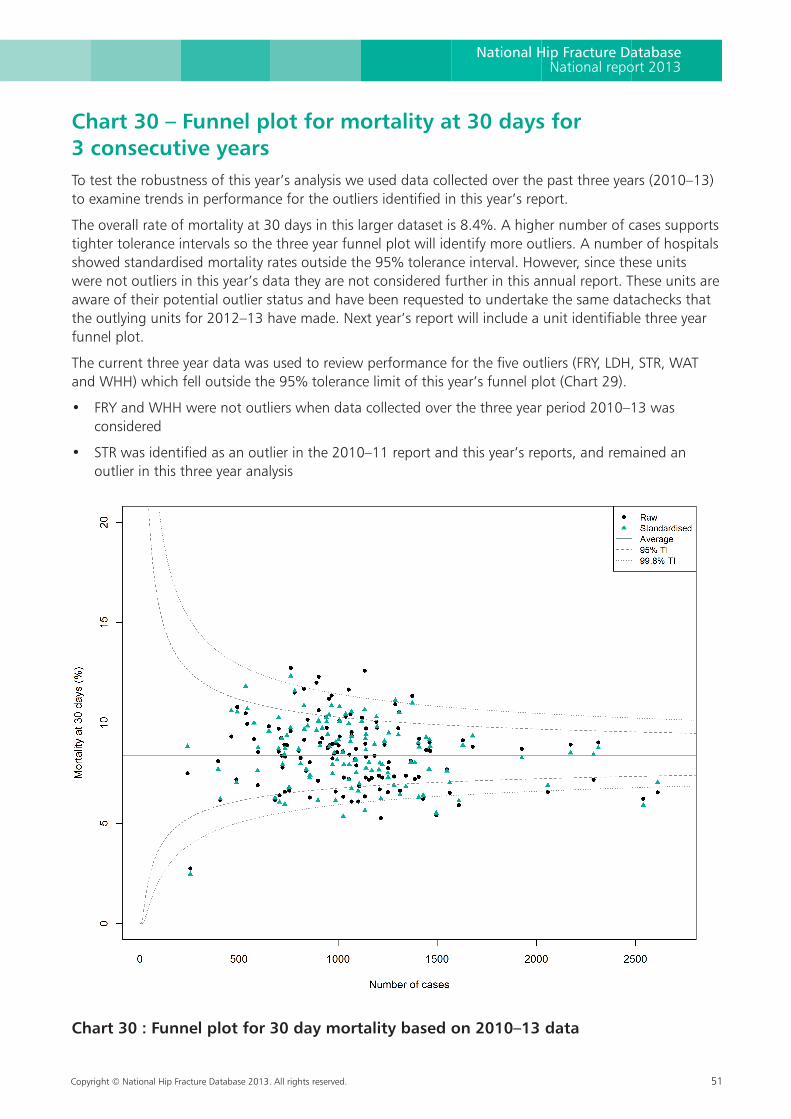
Copyright © National Hip Fracture Database 2013. All rights reserved. 51
National Hip Fracture DatabaseNational report 2013
Chart 30 – Funnel plot for mortality at 30 days for 3 consecutive yearsTo test the robustness of this year’s analysis we used data collected over the past three years (2010–13) to examine trends in performance for the outliers identified in this year’s report.
The overall rate of mortality at 30 days in this larger dataset is 8.4%. A higher number of cases supports tighter tolerance intervals so the three year funnel plot will identify more outliers. A number of hospitals showed standardised mortality rates outside the 95% tolerance interval. However, since these units were not outliers in this year’s data they are not considered further in this annual report. These units are aware of their potential outlier status and have been requested to undertake the same datachecks that the outlying units for 2012–13 have made. Next year’s report will include a unit identifiable three year funnel plot.
The current three year data was used to review performance for the five outliers (FRY, LDH, STR, WAT and WHH) which fell outside the 95% tolerance limit of this year’s funnel plot (Chart 29).
• FRY and WHH were not outliers when data collected over the three year period 2010–13 was considered
• STR was identified as an outlier in the 2010–11 report and this year’s reports, and remained an outlier in this three year analysis
Chart 30 : Funnel plot for 30 day mortality based on 2010–13 data
52 Copyright © National Hip Fracture Database 2013. All rights reserved.
In contrast, two units (LDH and WAT) triggered concerns on 2012–13 data, and these hospitals were confirmed as outliers when the three years’ data were analysed.
Over the 2010–13 period both LDH and WAT lay outside the 95% and the 99.8% thresholds for 30 day mortality (Chart 30).
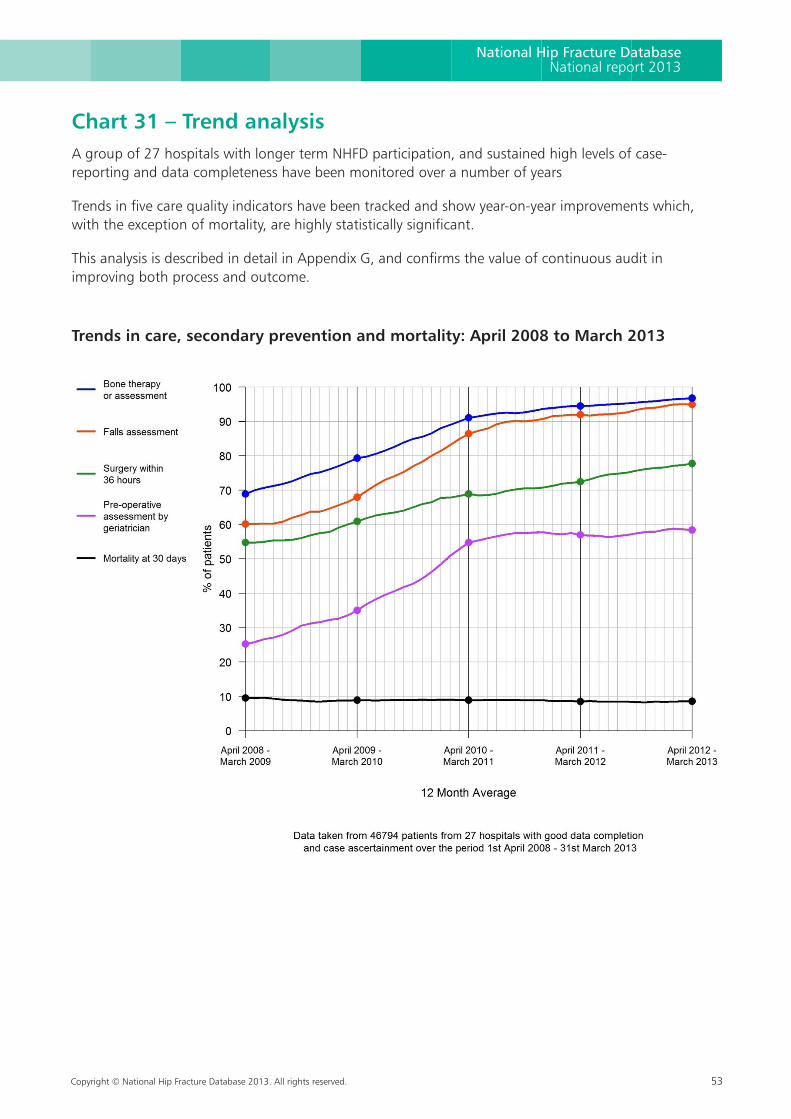
Copyright © National Hip Fracture Database 2013. All rights reserved. 53
National Hip Fracture DatabaseNational report 2013
Chart 31 – Trend analysis A group of 27 hospitals with longer term NHFD participation, and sustained high levels of case-reporting and data completeness have been monitored over a number of years
Trends in five care quality indicators have been tracked and show year-on-year improvements which, with the exception of mortality, are highly statistically significant.
This analysis is described in detail in Appendix G, and confirms the value of continuous audit in improving both process and outcome.
Trends in care, secondary prevention and mortality: April 2008 to March 2013
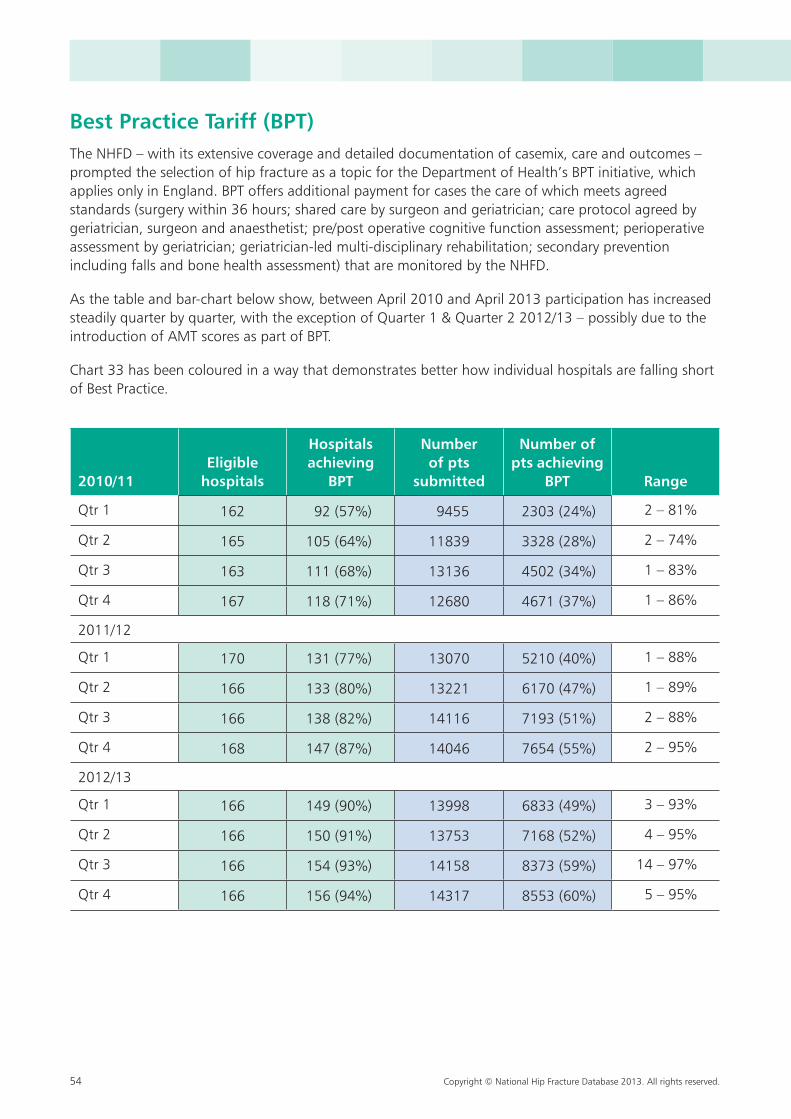
54 Copyright © National Hip Fracture Database 2013. All rights reserved.
Best Practice Tariff (BPT)The NHFD – with its extensive coverage and detailed documentation of casemix, care and outcomes – prompted the selection of hip fracture as a topic for the Department of Health’s BPT initiative, which applies only in England. BPT offers additional payment for cases the care of which meets agreed standards (surgery within 36 hours; shared care by surgeon and geriatrician; care protocol agreed by geriatrician, surgeon and anaesthetist; pre/post operative cognitive function assessment; perioperative assessment by geriatrician; geriatrician-led multi-disciplinary rehabilitation; secondary prevention including falls and bone health assessment) that are monitored by the NHFD.
As the table and bar-chart below show, between April 2010 and April 2013 participation has increased steadily quarter by quarter, with the exception of Quarter 1 & Quarter 2 2012/13 – possibly due to the introduction of AMT scores as part of BPT.
Chart 33 has been coloured in a way that demonstrates better how individual hospitals are falling short of Best Practice.
2010/11Eligible
hospitals
Hospitals achieving
BPT
Number of pts
submitted
Number of pts achieving
BPT Range
Qtr 1 162 92 (57%) 9455 2303 (24%) 2 – 81%
Qtr 2 165 105 (64%) 11839 3328 (28%) 2 – 74%
Qtr 3 163 111 (68%) 13136 4502 (34%) 1 – 83%
Qtr 4 167 118 (71%) 12680 4671 (37%) 1 – 86%
2011/12
Qtr 1 170 131 (77%) 13070 5210 (40%) 1 – 88%
Qtr 2 166 133 (80%) 13221 6170 (47%) 1 – 89%
Qtr 3 166 138 (82%) 14116 7193 (51%) 2 – 88%
Qtr 4 168 147 (87%) 14046 7654 (55%) 2 – 95%
2012/13
Qtr 1 166 149 (90%) 13998 6833 (49%) 3 – 93%
Qtr 2 166 150 (91%) 13753 7168 (52%) 4 – 95%
Qtr 3 166 154 (93%) 14158 8373 (59%) 14 – 97%
Qtr 4 166 156 (94%) 14317 8553 (60%) 5 – 95%
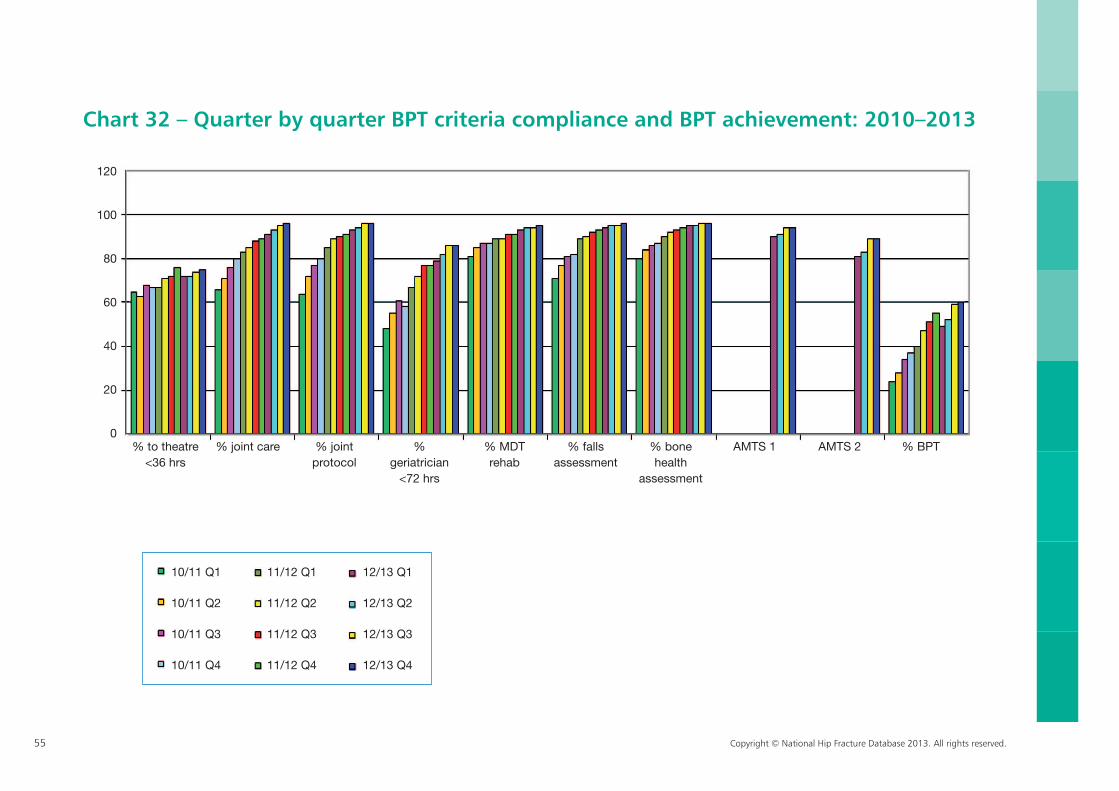
55 Copyright © National Hip Fracture Database 2013. All rights reserved.
Chart 32 – Quarter by quarter BPT criteria compliance and BPT achievement: 2010–2013
% to theatre % joint care % joint % % MDT % falls % bone AMTS 1 AMTS 2 % BPT <36 hrs protocol geriatrician rehab assessment health <72 hrs assessment
10/11 Q1 11/12 Q1 12/13 Q1
10/11 Q2 11/12 Q2 12/13 Q2
10/11 Q3 11/12 Q3 12/13 Q3
10/11 Q4 11/12 Q4 12/13 Q4
120
100
80
60
40
20
0
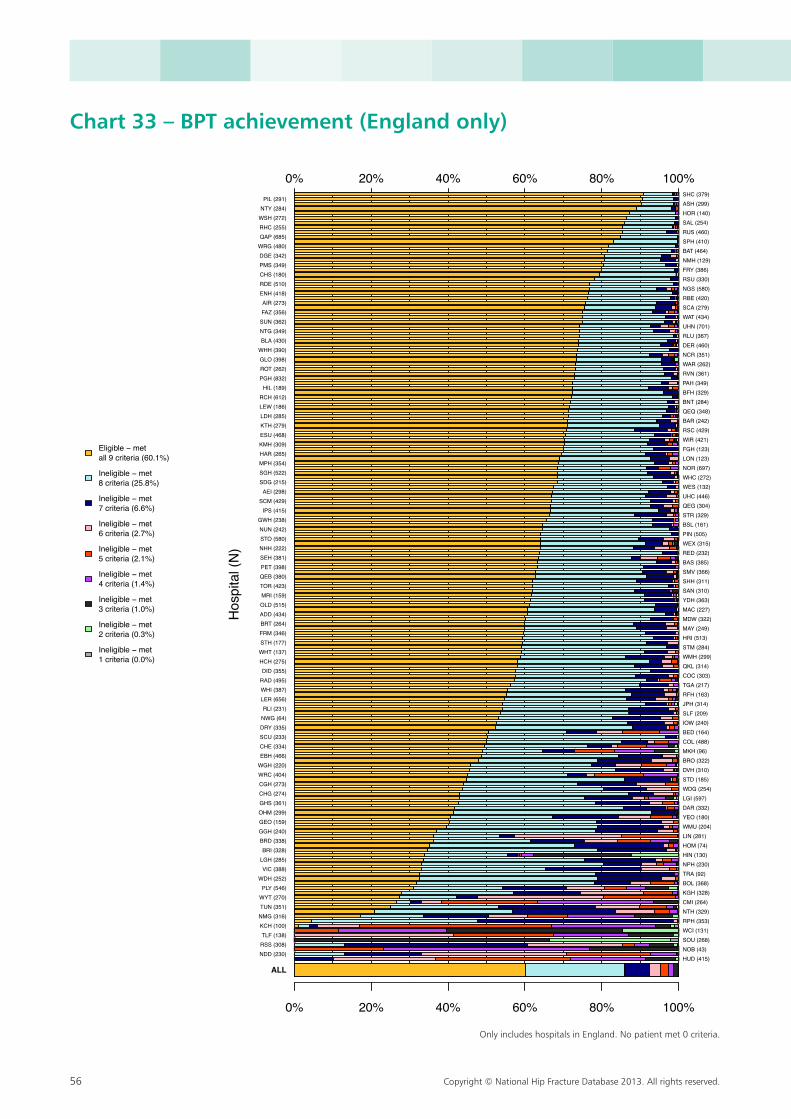
56 Copyright © National Hip Fracture Database 2013. All rights reserved.
Chart 33 – BPT achievement (England only)
0% 20% 40% 60% 80% 100%
0% 20% 40% 60% 80% 100%
Eligible − metall 9 criteria (60.1%)
Ineligible − met8 criteria (25.8%)
Ineligible − met7 criteria (6.6%)
Ineligible − met6 criteria (2.7%)
Ineligible − met5 criteria (2.1%)
Ineligible − met4 criteria (1.4%)
Ineligible − met3 criteria (1.0%)
Ineligible − met2 criteria (0.3%)
Ineligible − met1 criteria (0.0%)
Hos
pita
l (N
)
ALL
NDD (230)RSS (308)TLF (138)
KCH (100)NMG (316)TUN (351)WYT (270)PLY (546)
WDH (252)VIC (388)
LGH (285)BRI (328)
BRD (338)GGH (240)GEO (159)OHM (299)GHS (361)CHG (274)CGH (273)WRC (404)WGH (220)EBH (466)CHE (334)SCU (233)DRY (335)NWG (64)RLI (231)
LER (656)WHI (387)RAD (495)DID (355)
HCH (275)WHT (137)STH (177)FRM (346)BRT (264)ADD (434)OLD (515)MRI (159)TOR (423)QEB (380)PET (398)SEH (381)NHH (222)STO (580)NUN (242)
GWH (238)IPS (415)
SCM (429)AEI (298)
SDG (215)SGH (522)MPH (354)HAR (265)KMH (309)ESU (468)KTH (279)LDH (285)LEW (186)RCH (612)
HIL (189)PGH (832)ROT (262)GLO (398)WHH (390)BLA (430)NTG (349)SUN (362)FAZ (356)AIR (273)
ENH (418)RDE (510)CHS (180)PMS (349)DGE (342)
WRG (480)QAP (685)RHC (255)WSH (272)NTY (284)PIL (291)
HUD (415)NOB (43)SOU (268)WCI (131)RPH (353)NTH (329)CMI (264)KGH (328)BOL (368)TRA (92)NPH (230)HIN (130)HOM (74)LIN (281)WMU (204)YEO (180)DAR (332)LGI (597)WDG (254)STD (185)DVH (310)BRO (322)MKH (96)COL (488)BED (164)IOW (240)SLF (209)JPH (314)RFH (163)TGA (217)COC (303)QKL (314)WMH (299)STM (284)HRI (513)MAY (249)MDW (322)MAC (227)YDH (363)SAN (310)SHH (311)SMV (366)BAS (385)RED (232)WEX (315)PIN (505)BSL (161)STR (329)QEG (304)UHC (446)WES (132)WHC (272)NOR (697)LON (123)FGH (123)WIR (421)RSC (429)BAR (242)QEQ (348)BNT (284)BFH (329)PAH (349)RVN (361)WAR (262)NCR (351)DER (460)RLU (367)UHN (701)WAT (434)SCA (279)RBE (420)NGS (580)RSU (330)FRY (386)NMH (129)BAT (464)SPH (410)RUS (460)SAL (254)HOR (140)ASH (299)SHC (379)
Only includes hospitals in England. No patient met 0 criteria.
Only includes hospitals in England. No patient met 0 criteria.
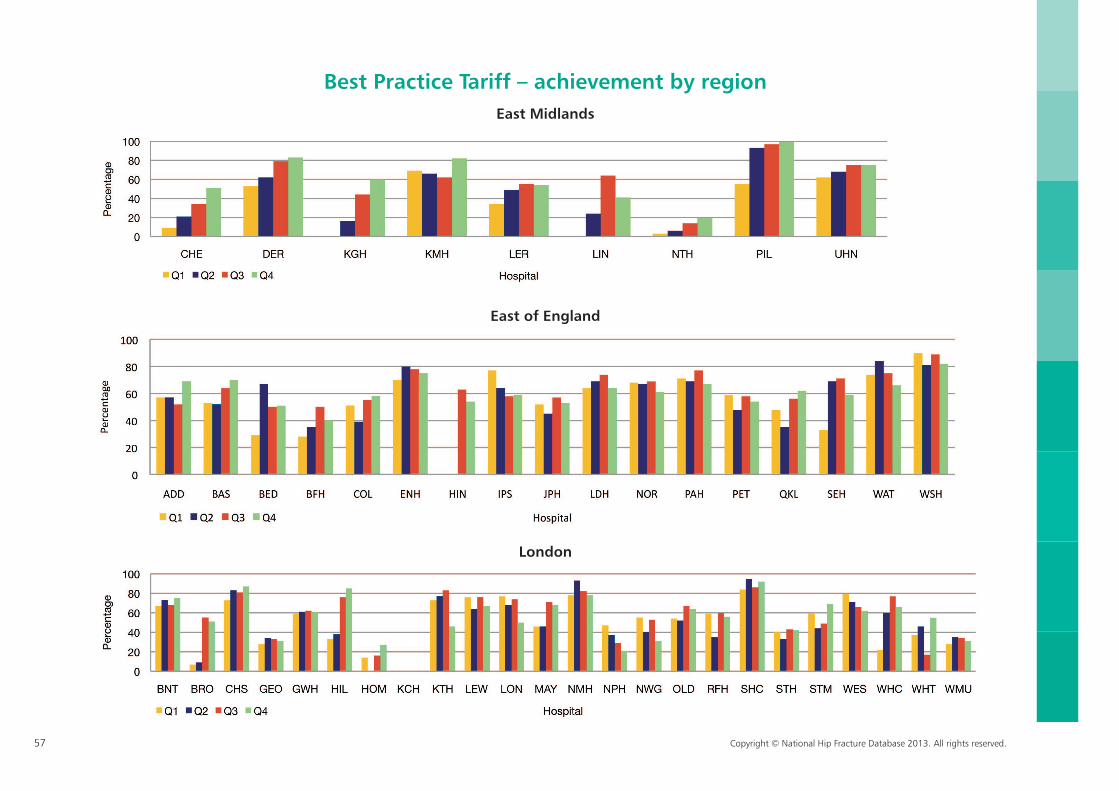
57 Copyright © National Hip Fracture Database 2013. All rights reserved.
Best Practice Tariff – achievement by regionEast Midlands
East of England
London
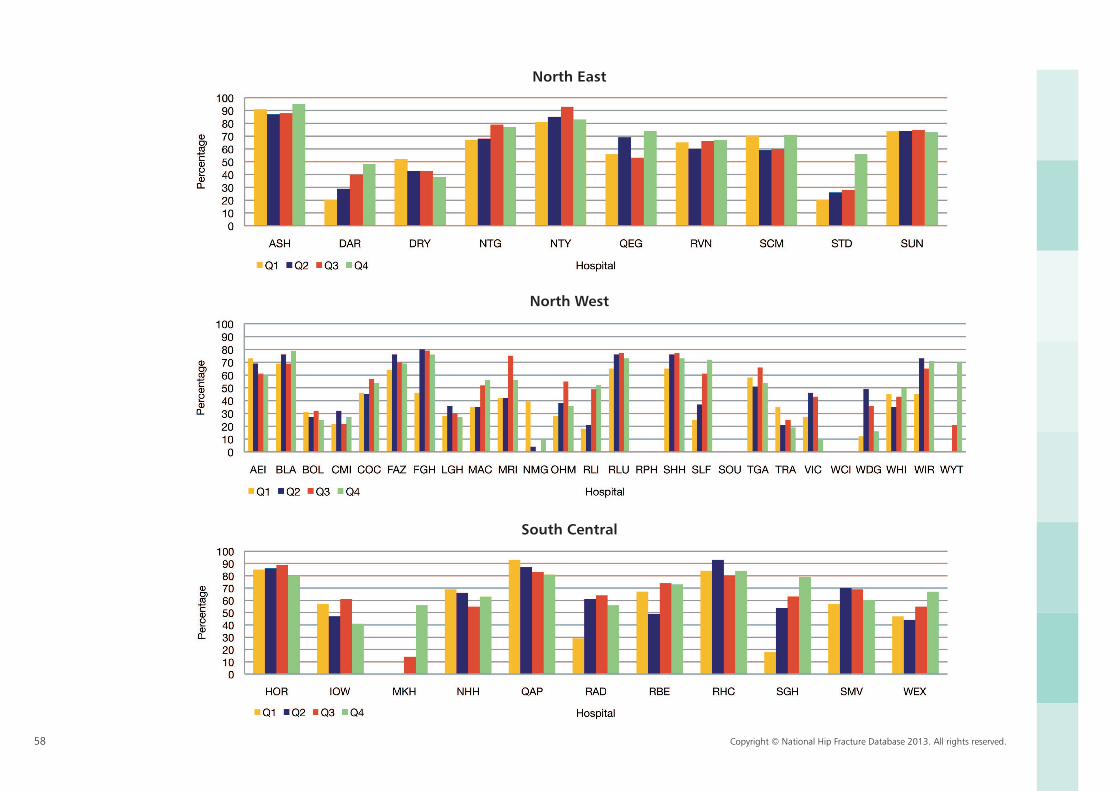
58 Copyright © National Hip Fracture Database 2013. All rights reserved.
North East
North West
South Central
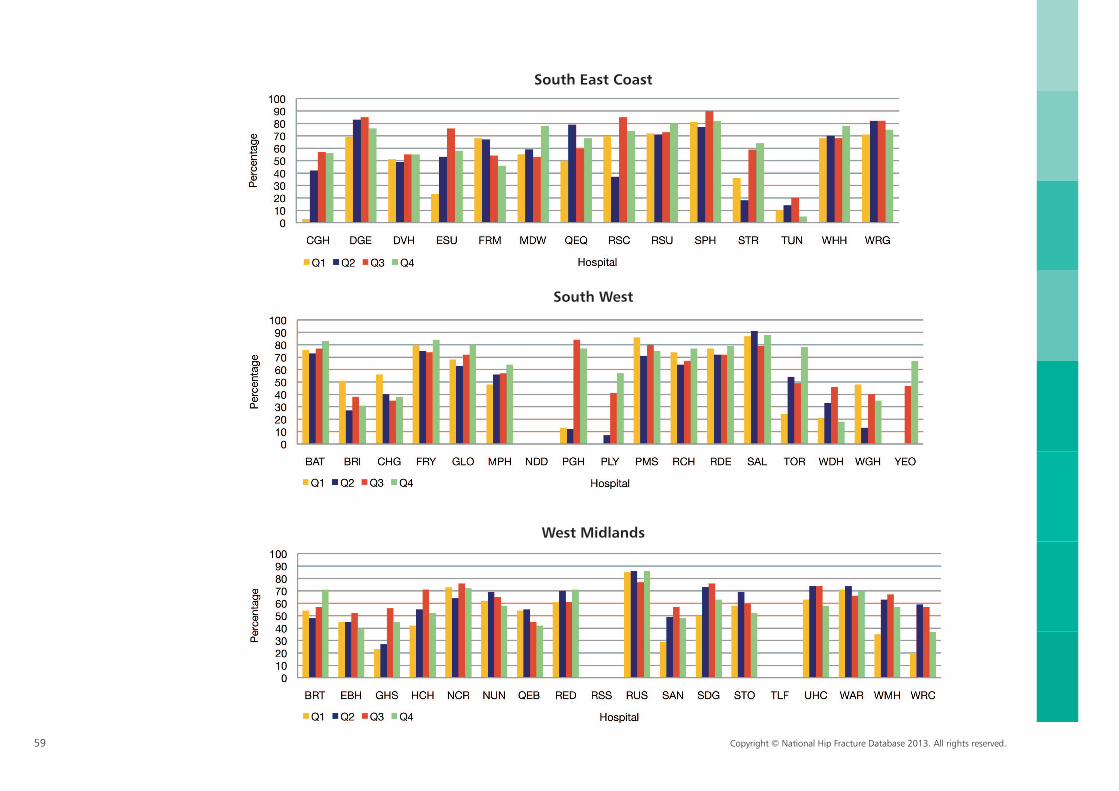
59 Copyright © National Hip Fracture Database 2013. All rights reserved.
South East Coast
South West
West Midlands
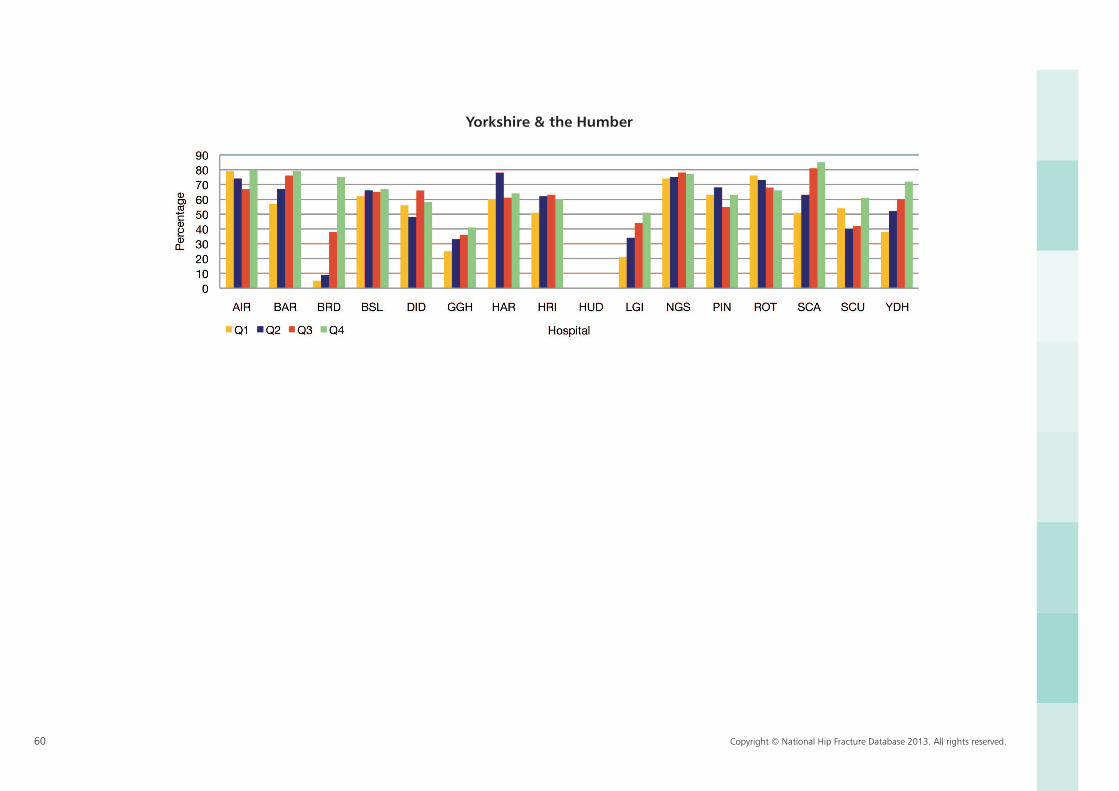
60 Copyright © National Hip Fracture Database 2013. All rights reserved.
Yorkshire & the Humber
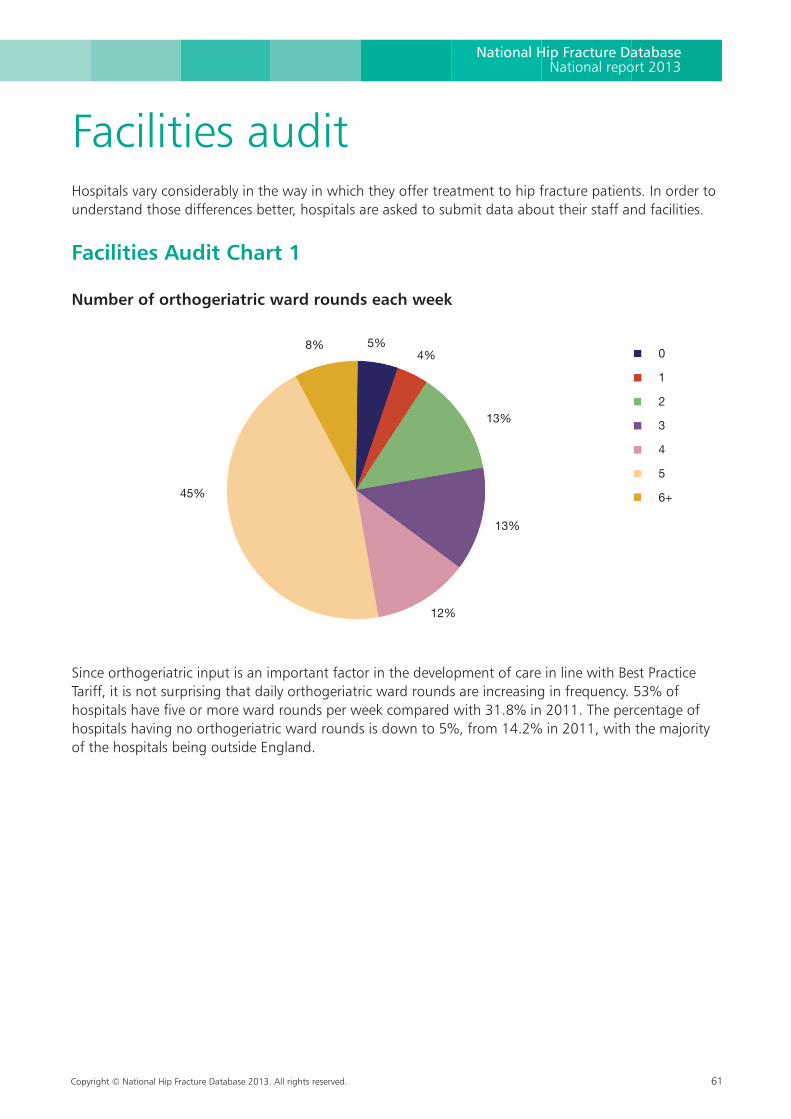
Copyright © National Hip Fracture Database 2013. All rights reserved. 61
National Hip Fracture DatabaseNational report 2013
Facilities auditHospitals vary considerably in the way in which they offer treatment to hip fracture patients. In order to understand those differences better, hospitals are asked to submit data about their staff and facilities.
Facilities Audit Chart 1
Number of orthogeriatric ward rounds each week
Since orthogeriatric input is an important factor in the development of care in line with Best Practice Tariff, it is not surprising that daily orthogeriatric ward rounds are increasing in frequency. 53% of hospitals have five or more ward rounds per week compared with 31.8% in 2011. The percentage of hospitals having no orthogeriatric ward rounds is down to 5%, from 14.2% in 2011, with the majority of the hospitals being outside England.
0
1
2
3
4
5
6+
13%
13%
4%
45%
12%
8% 5%
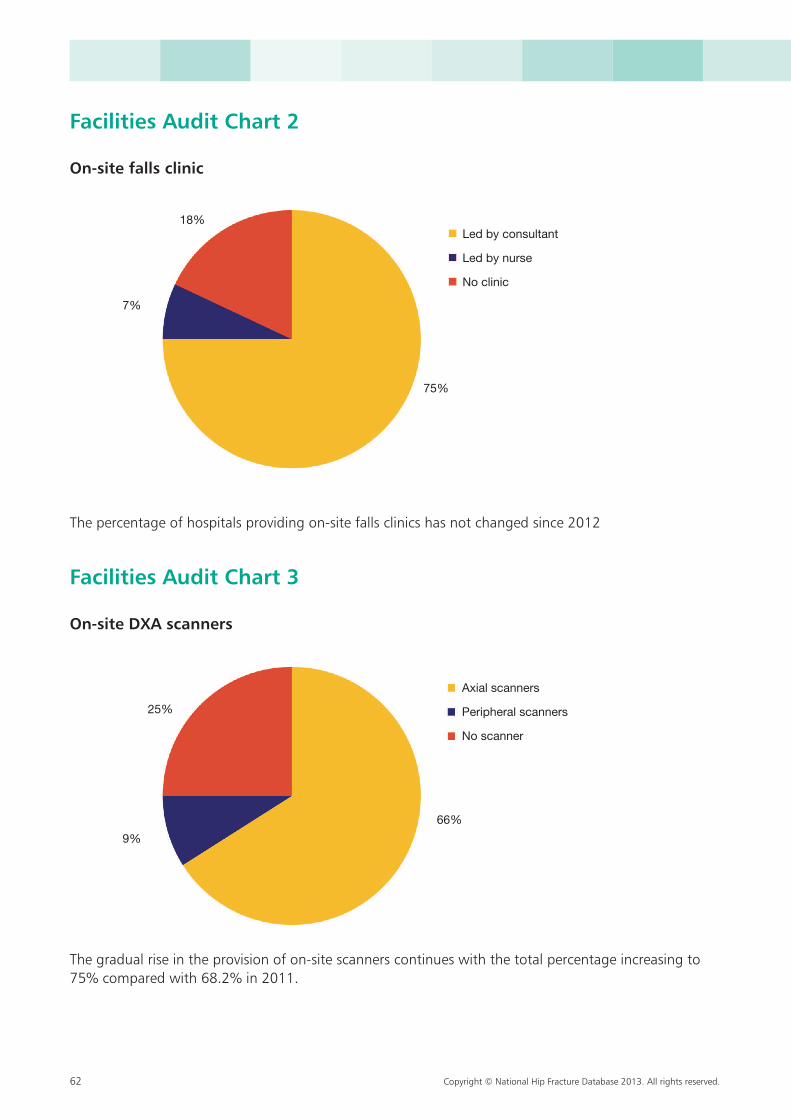
62 Copyright © National Hip Fracture Database 2013. All rights reserved.
Facilities Audit Chart 2
On-site falls clinic
The percentage of hospitals providing on-site falls clinics has not changed since 2012
Facilities Audit Chart 3
On-site DXA scanners
The gradual rise in the provision of on-site scanners continues with the total percentage increasing to 75% compared with 68.2% in 2011.
Led by consultant
Led by nurse
No clinic
Axial scanners
Peripheral scanners
No scanner
18%
75%
7%
66%
25%
9%
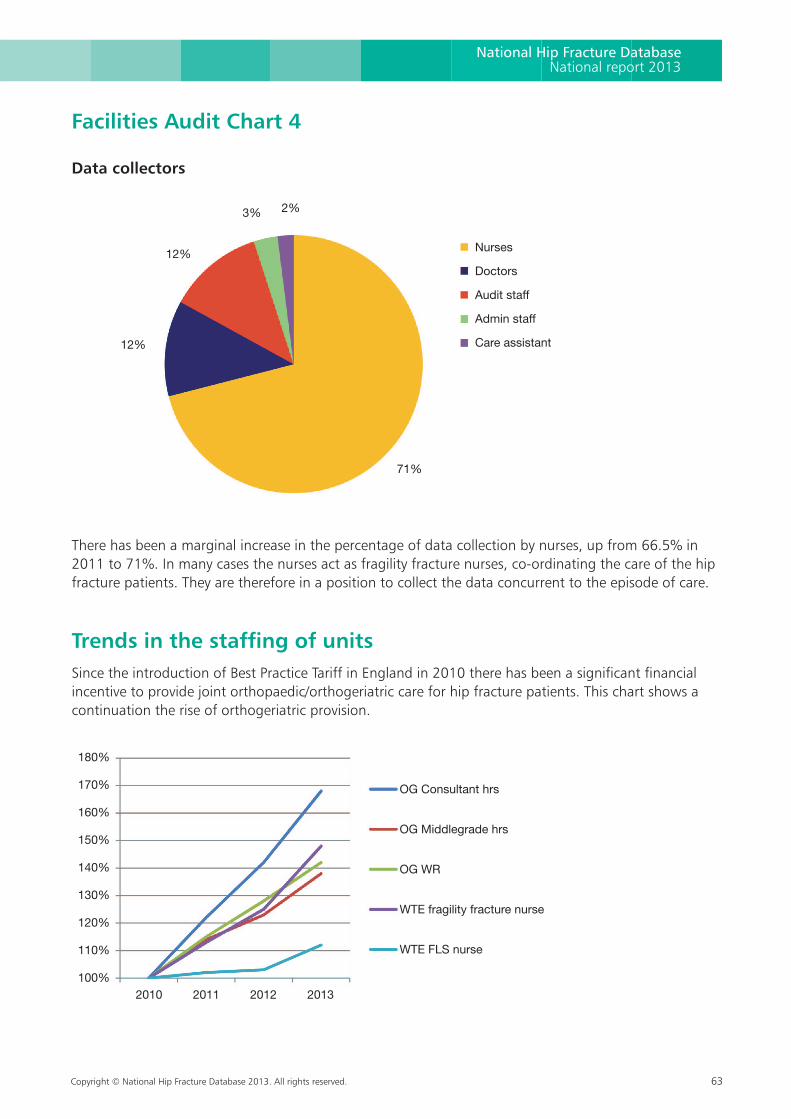
Copyright © National Hip Fracture Database 2013. All rights reserved. 63
National Hip Fracture DatabaseNational report 2013
Facilities Audit Chart 4
Data collectors
There has been a marginal increase in the percentage of data collection by nurses, up from 66.5% in 2011 to 71%. In many cases the nurses act as fragility fracture nurses, co-ordinating the care of the hip fracture patients. They are therefore in a position to collect the data concurrent to the episode of care.
Trends in the staffing of unitsSince the introduction of Best Practice Tariff in England in 2010 there has been a significant financial incentive to provide joint orthopaedic/orthogeriatric care for hip fracture patients. This chart shows a continuation the rise of orthogeriatric provision.
2%3%
12%
12%
71%
Nurses
Doctors
Audit staff
Admin staff
Care assistant
OG Consultant hrs
OG Middlegrade hrs
OG WR
WTE fragility fracture nurse
WTE FLS nurse
2010 2011 2012 2013
180%
170%
160%
150%
140%
130%
120%
110%
100%
64 Copyright © National Hip Fracture Database 2013. All rights reserved.
Unsurprisingly, the greatest rise is in the hours of consultant orthogeriatrician time allocated to the trauma wards, 68% in three years.
Fracture liaison
The secondary prevention of osteoporotic fractures is vitally important, especially since less serious fractures identified at an earlier stage in the osteoporotic process might trigger interventions to prevent hip fractures.
An effective means to achieving this is the Fracture Liaison Service▲, where specially trained staff identify patients with fragility fractures and assess their treatment requirements.
It is gratifying to see an increase in the time allocated to fracture liaison work, up 12% since 2010. However, disappointingly 64% of hospitals say that they have no Fracture Liaison Nurse, an indication that there is still considerable scope for service improvement.
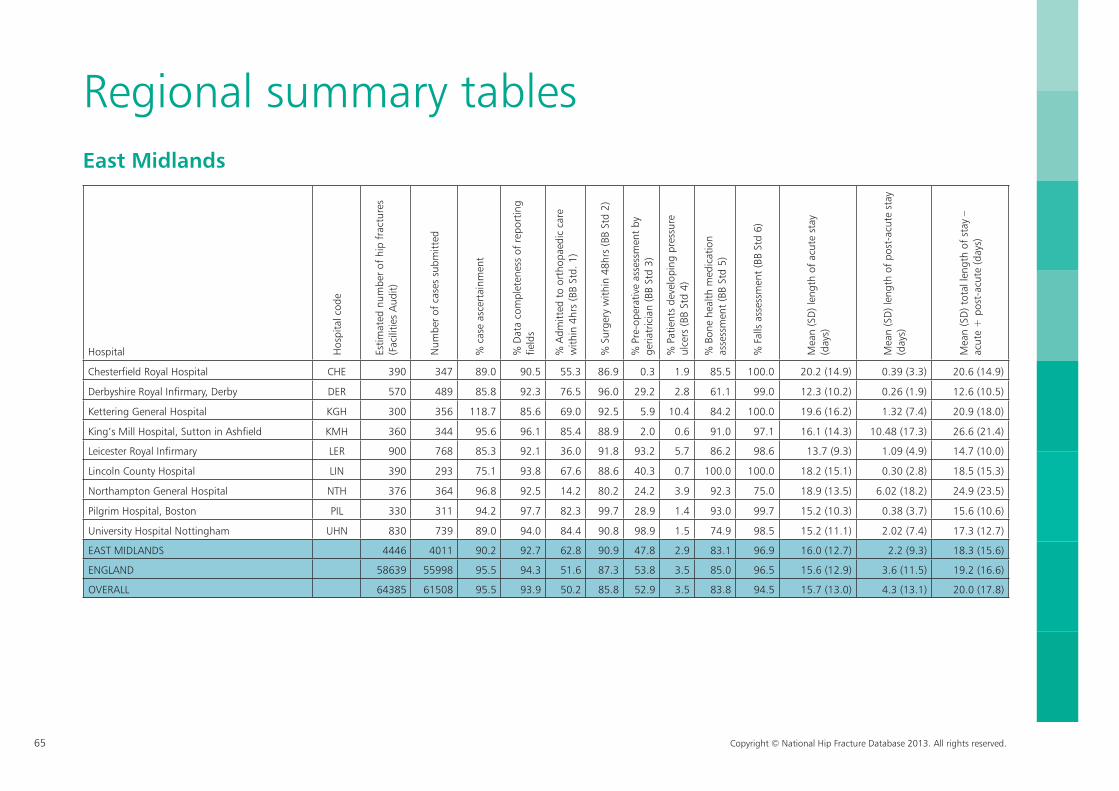
65 Copyright © National Hip Fracture Database 2013. All rights reserved.
Hospital Hos
pita
l cod
e
Estim
ated
num
ber
of h
ip f
ract
ures
(F
acili
ties
Aud
it)
Num
ber
of c
ases
sub
mitt
ed
% c
ase
asce
rtai
nmen
t
% D
ata
com
plet
enes
s of
rep
ortin
g fie
lds
% A
dmitt
ed t
o or
thop
aedi
c ca
re
with
in 4
hrs
(BB
Std.
1)
% S
urge
ry w
ithin
48h
rs (B
B St
d 2)
% P
re-o
pera
tive
asse
ssm
ent
by
geria
tric
ian
(BB
Std
3)
% P
atie
nts
deve
lopi
ng p
ress
ure
ulce
rs (B
B St
d 4)
% B
one
heal
th m
edic
atio
n as
sess
men
t (B
B St
d 5)
% F
alls
ass
essm
ent
(BB
Std
6)
Mea
n (S
D) l
engt
h of
acu
te s
tay
(day
s)
Mea
n (S
D) l
engt
h of
pos
t-ac
ute
stay
(d
ays)
Mea
n (S
D) t
otal
leng
th o
f st
ay –
ac
ute
+ p
ost-
acut
e (d
ays)
Chesterfield Royal Hospital CHE 390 347 89.0 90.5 55.3 86.9 0.3 1.9 85.5 100.0 20.2 (14.9) 0.39 (3.3) 20.6 (14.9)
Derbyshire Royal Infirmary, Derby DER 570 489 85.8 92.3 76.5 96.0 29.2 2.8 61.1 99.0 12.3 (10.2) 0.26 (1.9) 12.6 (10.5)
Kettering General Hospital KGH 300 356 118.7 85.6 69.0 92.5 5.9 10.4 84.2 100.0 19.6 (16.2) 1.32 (7.4) 20.9 (18.0)
King’s Mill Hospital, Sutton in Ashfield KMH 360 344 95.6 96.1 85.4 88.9 2.0 0.6 91.0 97.1 16.1 (14.3) 10.48 (17.3) 26.6 (21.4)
Leicester Royal Infirmary LER 900 768 85.3 92.1 36.0 91.8 93.2 5.7 86.2 98.6 13.7 (9.3) 1.09 (4.9) 14.7 (10.0)
Lincoln County Hospital LIN 390 293 75.1 93.8 67.6 88.6 40.3 0.7 100.0 100.0 18.2 (15.1) 0.30 (2.8) 18.5 (15.3)
Northampton General Hospital NTH 376 364 96.8 92.5 14.2 80.2 24.2 3.9 92.3 75.0 18.9 (13.5) 6.02 (18.2) 24.9 (23.5)
Pilgrim Hospital, Boston PIL 330 311 94.2 97.7 82.3 99.7 28.9 1.4 93.0 99.7 15.2 (10.3) 0.38 (3.7) 15.6 (10.6)
University Hospital Nottingham UHN 830 739 89.0 94.0 84.4 90.8 98.9 1.5 74.9 98.5 15.2 (11.1) 2.02 (7.4) 17.3 (12.7)
EAST MIDLANDS 4446 4011 90.2 92.7 62.8 90.9 47.8 2.9 83.1 96.9 16.0 (12.7) 2.2 (9.3) 18.3 (15.6)
ENGLAND 58639 55998 95.5 94.3 51.6 87.3 53.8 3.5 85.0 96.5 15.6 (12.9) 3.6 (11.5) 19.2 (16.6)
OVERALL 64385 61508 95.5 93.9 50.2 85.8 52.9 3.5 83.8 94.5 15.7 (13.0) 4.3 (13.1) 20.0 (17.8)
Regional summary tables East Midlands
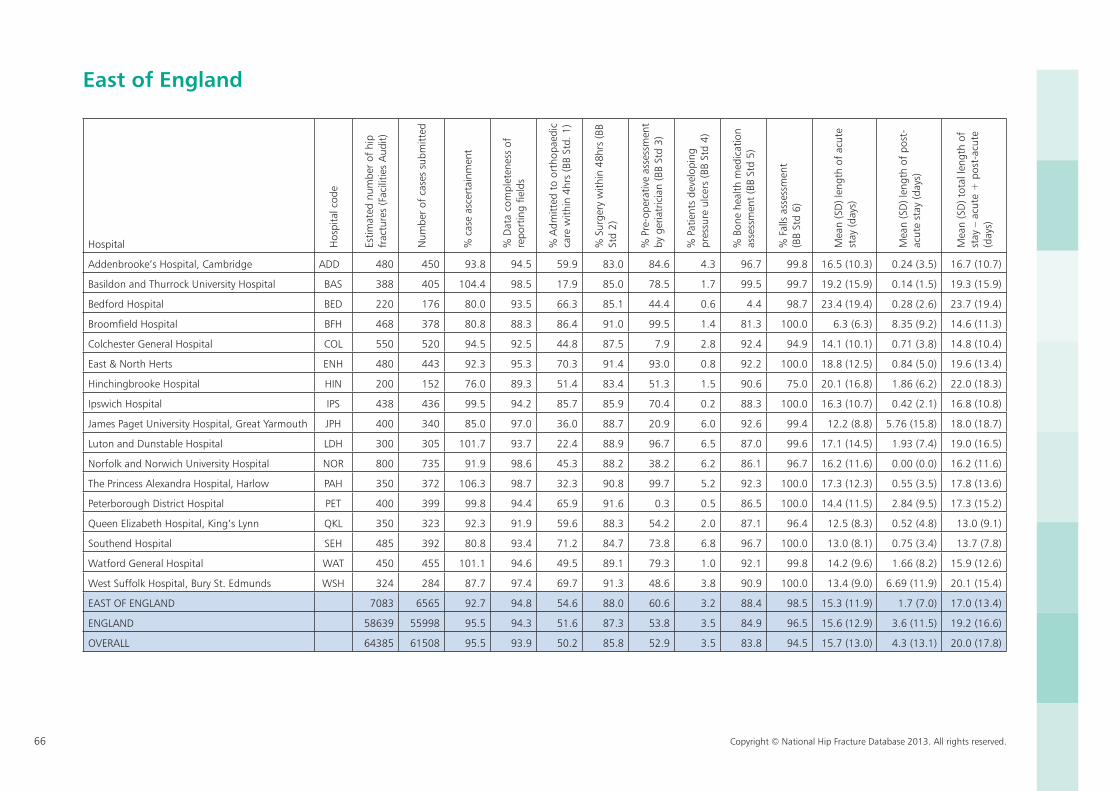
66 Copyright © National Hip Fracture Database 2013. All rights reserved.
Hospital Hos
pita
l cod
e
Estim
ated
num
ber
of h
ip
frac
ture
s (F
acili
ties
Aud
it)
Num
ber
of c
ases
sub
mitt
ed
% c
ase
asce
rtai
nmen
t
% D
ata
com
plet
enes
s of
re
port
ing
field
s
% A
dmitt
ed t
o or
thop
aedi
c ca
re w
ithin
4hr
s (B
B St
d. 1
)
% S
urge
ry w
ithin
48h
rs (B
B St
d 2)
% P
re-o
pera
tive
asse
ssm
ent
by g
eria
tric
ian
(BB
Std
3)
% P
atie
nts
deve
lopi
ng
pres
sure
ulc
ers
(BB
Std
4)
% B
one
heal
th m
edic
atio
n as
sess
men
t (B
B St
d 5)
% F
alls
ass
essm
ent
(B
B St
d 6)
Mea
n (S
D) l
engt
h of
acu
te
stay
(day
s)
Mea
n (S
D) l
engt
h of
pos
t-ac
ute
stay
(day
s)
Mea
n (S
D) t
otal
leng
th o
f st
ay –
acu
te +
pos
t-ac
ute
(day
s)
Addenbrooke’s Hospital, Cambridge ADD 480 450 93.8 94.5 59.9 83.0 84.6 4.3 96.7 99.8 16.5 (10.3) 0.24 (3.5) 16.7 (10.7)
Basildon and Thurrock University Hospital BAS 388 405 104.4 98.5 17.9 85.0 78.5 1.7 99.5 99.7 19.2 (15.9) 0.14 (1.5) 19.3 (15.9)
Bedford Hospital BED 220 176 80.0 93.5 66.3 85.1 44.4 0.6 4.4 98.7 23.4 (19.4) 0.28 (2.6) 23.7 (19.4)
Broomfield Hospital BFH 468 378 80.8 88.3 86.4 91.0 99.5 1.4 81.3 100.0 6.3 (6.3) 8.35 (9.2) 14.6 (11.3)
Colchester General Hospital COL 550 520 94.5 92.5 44.8 87.5 7.9 2.8 92.4 94.9 14.1 (10.1) 0.71 (3.8) 14.8 (10.4)
East & North Herts ENH 480 443 92.3 95.3 70.3 91.4 93.0 0.8 92.2 100.0 18.8 (12.5) 0.84 (5.0) 19.6 (13.4)
Hinchingbrooke Hospital HIN 200 152 76.0 89.3 51.4 83.4 51.3 1.5 90.6 75.0 20.1 (16.8) 1.86 (6.2) 22.0 (18.3)
Ipswich Hospital IPS 438 436 99.5 94.2 85.7 85.9 70.4 0.2 88.3 100.0 16.3 (10.7) 0.42 (2.1) 16.8 (10.8)
James Paget University Hospital, Great Yarmouth JPH 400 340 85.0 97.0 36.0 88.7 20.9 6.0 92.6 99.4 12.2 (8.8) 5.76 (15.8) 18.0 (18.7)
Luton and Dunstable Hospital LDH 300 305 101.7 93.7 22.4 88.9 96.7 6.5 87.0 99.6 17.1 (14.5) 1.93 (7.4) 19.0 (16.5)
Norfolk and Norwich University Hospital NOR 800 735 91.9 98.6 45.3 88.2 38.2 6.2 86.1 96.7 16.2 (11.6) 0.00 (0.0) 16.2 (11.6)
The Princess Alexandra Hospital, Harlow PAH 350 372 106.3 98.7 32.3 90.8 99.7 5.2 92.3 100.0 17.3 (12.3) 0.55 (3.5) 17.8 (13.6)
Peterborough District Hospital PET 400 399 99.8 94.4 65.9 91.6 0.3 0.5 86.5 100.0 14.4 (11.5) 2.84 (9.5) 17.3 (15.2)
Queen Elizabeth Hospital, King’s Lynn QKL 350 323 92.3 91.9 59.6 88.3 54.2 2.0 87.1 96.4 12.5 (8.3) 0.52 (4.8) 13.0 (9.1)
Southend Hospital SEH 485 392 80.8 93.4 71.2 84.7 73.8 6.8 96.7 100.0 13.0 (8.1) 0.75 (3.4) 13.7 (7.8)
Watford General Hospital WAT 450 455 101.1 94.6 49.5 89.1 79.3 1.0 92.1 99.8 14.2 (9.6) 1.66 (8.2) 15.9 (12.6)
West Suffolk Hospital, Bury St. Edmunds WSH 324 284 87.7 97.4 69.7 91.3 48.6 3.8 90.9 100.0 13.4 (9.0) 6.69 (11.9) 20.1 (15.4)
EAST OF ENGLAND 7083 6565 92.7 94.8 54.6 88.0 60.6 3.2 88.4 98.5 15.3 (11.9) 1.7 (7.0) 17.0 (13.4)
ENGLAND 58639 55998 95.5 94.3 51.6 87.3 53.8 3.5 84.9 96.5 15.6 (12.9) 3.6 (11.5) 19.2 (16.6)
OVERALL 64385 61508 95.5 93.9 50.2 85.8 52.9 3.5 83.8 94.5 15.7 (13.0) 4.3 (13.1) 20.0 (17.8)
East of England
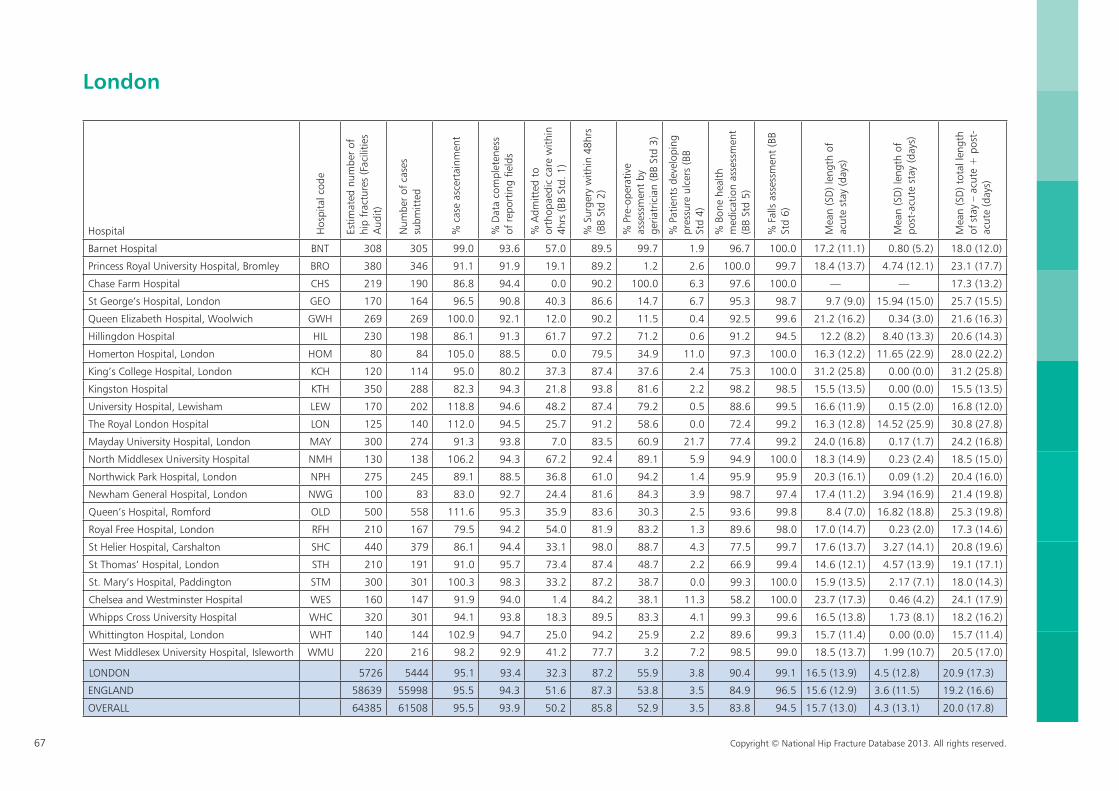
67 Copyright © National Hip Fracture Database 2013. All rights reserved.
London
Hospital Hos
pita
l cod
e
Estim
ated
num
ber
of
hip
frac
ture
s (F
acili
ties
Aud
it)
Num
ber
of c
ases
su
bmitt
ed
% c
ase
asce
rtai
nmen
t
% D
ata
com
plet
enes
s of
rep
ortin
g fie
lds
% A
dmitt
ed t
o or
thop
aedi
c ca
re w
ithin
4h
rs (B
B St
d. 1
)
% S
urge
ry w
ithin
48h
rs
(BB
Std
2)
% P
re-o
pera
tive
asse
ssm
ent
by
geria
tric
ian
(BB
Std
3)
% P
atie
nts
deve
lopi
ng
pres
sure
ulc
ers
(BB
Std
4)
% B
one
heal
th
med
icat
ion
asse
ssm
ent
(BB
Std
5)
% F
alls
ass
essm
ent
(BB
Std
6)
Mea
n (S
D) l
engt
h of
ac
ute
stay
(day
s)
Mea
n (S
D) l
engt
h of
po
st-a
cute
sta
y (d
ays)
Mea
n (S
D) t
otal
leng
th
of s
tay
– ac
ute
+ p
ost-
acut
e (d
ays)
Barnet Hospital BNT 308 305 99.0 93.6 57.0 89.5 99.7 1.9 96.7 100.0 17.2 (11.1) 0.80 (5.2) 18.0 (12.0)
Princess Royal University Hospital, Bromley BRO 380 346 91.1 91.9 19.1 89.2 1.2 2.6 100.0 99.7 18.4 (13.7) 4.74 (12.1) 23.1 (17.7)
Chase Farm Hospital CHS 219 190 86.8 94.4 0.0 90.2 100.0 6.3 97.6 100.0 — — 17.3 (13.2)
St George’s Hospital, London GEO 170 164 96.5 90.8 40.3 86.6 14.7 6.7 95.3 98.7 9.7 (9.0) 15.94 (15.0) 25.7 (15.5)
Queen Elizabeth Hospital, Woolwich GWH 269 269 100.0 92.1 12.0 90.2 11.5 0.4 92.5 99.6 21.2 (16.2) 0.34 (3.0) 21.6 (16.3)
Hillingdon Hospital HIL 230 198 86.1 91.3 61.7 97.2 71.2 0.6 91.2 94.5 12.2 (8.2) 8.40 (13.3) 20.6 (14.3)
Homerton Hospital, London HOM 80 84 105.0 88.5 0.0 79.5 34.9 11.0 97.3 100.0 16.3 (12.2) 11.65 (22.9) 28.0 (22.2)
King’s College Hospital, London KCH 120 114 95.0 80.2 37.3 87.4 37.6 2.4 75.3 100.0 31.2 (25.8) 0.00 (0.0) 31.2 (25.8)
Kingston Hospital KTH 350 288 82.3 94.3 21.8 93.8 81.6 2.2 98.2 98.5 15.5 (13.5) 0.00 (0.0) 15.5 (13.5)
University Hospital, Lewisham LEW 170 202 118.8 94.6 48.2 87.4 79.2 0.5 88.6 99.5 16.6 (11.9) 0.15 (2.0) 16.8 (12.0)
The Royal London Hospital LON 125 140 112.0 94.5 25.7 91.2 58.6 0.0 72.4 99.2 16.3 (12.8) 14.52 (25.9) 30.8 (27.8)
Mayday University Hospital, London MAY 300 274 91.3 93.8 7.0 83.5 60.9 21.7 77.4 99.2 24.0 (16.8) 0.17 (1.7) 24.2 (16.8)
North Middlesex University Hospital NMH 130 138 106.2 94.3 67.2 92.4 89.1 5.9 94.9 100.0 18.3 (14.9) 0.23 (2.4) 18.5 (15.0)
Northwick Park Hospital, London NPH 275 245 89.1 88.5 36.8 61.0 94.2 1.4 95.9 95.9 20.3 (16.1) 0.09 (1.2) 20.4 (16.0)
Newham General Hospital, London NWG 100 83 83.0 92.7 24.4 81.6 84.3 3.9 98.7 97.4 17.4 (11.2) 3.94 (16.9) 21.4 (19.8)
Queen’s Hospital, Romford OLD 500 558 111.6 95.3 35.9 83.6 30.3 2.5 93.6 99.8 8.4 (7.0) 16.82 (18.8) 25.3 (19.8)
Royal Free Hospital, London RFH 210 167 79.5 94.2 54.0 81.9 83.2 1.3 89.6 98.0 17.0 (14.7) 0.23 (2.0) 17.3 (14.6)
St Helier Hospital, Carshalton SHC 440 379 86.1 94.4 33.1 98.0 88.7 4.3 77.5 99.7 17.6 (13.7) 3.27 (14.1) 20.8 (19.6)
St Thomas’ Hospital, London STH 210 191 91.0 95.7 73.4 87.4 48.7 2.2 66.9 99.4 14.6 (12.1) 4.57 (13.9) 19.1 (17.1)
St. Mary’s Hospital, Paddington STM 300 301 100.3 98.3 33.2 87.2 38.7 0.0 99.3 100.0 15.9 (13.5) 2.17 (7.1) 18.0 (14.3)
Chelsea and Westminster Hospital WES 160 147 91.9 94.0 1.4 84.2 38.1 11.3 58.2 100.0 23.7 (17.3) 0.46 (4.2) 24.1 (17.9)
Whipps Cross University Hospital WHC 320 301 94.1 93.8 18.3 89.5 83.3 4.1 99.3 99.6 16.5 (13.8) 1.73 (8.1) 18.2 (16.2)
Whittington Hospital, London WHT 140 144 102.9 94.7 25.0 94.2 25.9 2.2 89.6 99.3 15.7 (11.4) 0.00 (0.0) 15.7 (11.4)
West Middlesex University Hospital, Isleworth WMU 220 216 98.2 92.9 41.2 77.7 3.2 7.2 98.5 99.0 18.5 (13.7) 1.99 (10.7) 20.5 (17.0)
LONDON 5726 5444 95.1 93.4 32.3 87.2 55.9 3.8 90.4 99.1 16.5 (13.9) 4.5 (12.8) 20.9 (17.3)
ENGLAND 58639 55998 95.5 94.3 51.6 87.3 53.8 3.5 84.9 96.5 15.6 (12.9) 3.6 (11.5) 19.2 (16.6)
OVERALL 64385 61508 95.5 93.9 50.2 85.8 52.9 3.5 83.8 94.5 15.7 (13.0) 4.3 (13.1) 20.0 (17.8)
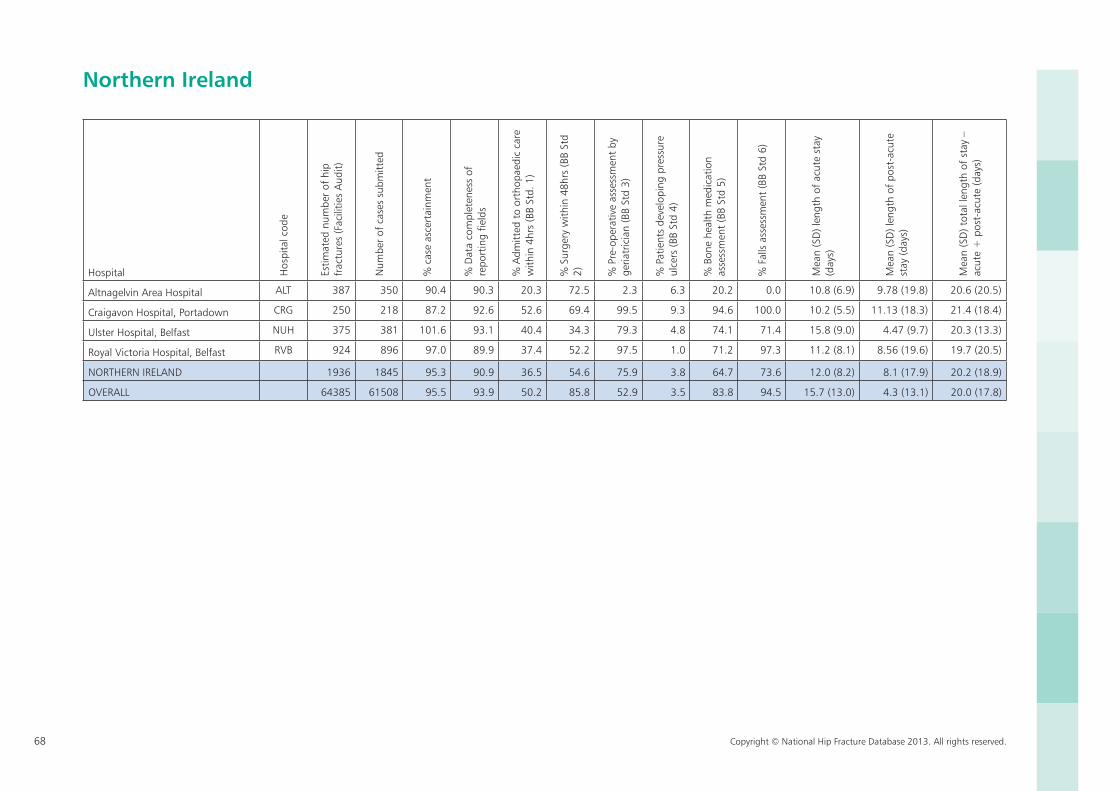
68 Copyright © National Hip Fracture Database 2013. All rights reserved.
Northern Ireland
Hospital Hos
pita
l cod
e
Estim
ated
num
ber
of h
ip
frac
ture
s (F
acili
ties
Aud
it)
Num
ber
of c
ases
sub
mitt
ed
% c
ase
asce
rtai
nmen
t
% D
ata
com
plet
enes
s of
re
port
ing
field
s
% A
dmitt
ed t
o or
thop
aedi
c ca
re
with
in 4
hrs
(BB
Std.
1)
% S
urge
ry w
ithin
48h
rs (B
B St
d 2) %
Pre
-ope
rativ
e as
sess
men
t by
ge
riatr
icia
n (B
B St
d 3)
% P
atie
nts
deve
lopi
ng p
ress
ure
ulce
rs (B
B St
d 4)
% B
one
heal
th m
edic
atio
n as
sess
men
t (B
B St
d 5)
% F
alls
ass
essm
ent
(BB
Std
6)
Mea
n (S
D) l
engt
h of
acu
te s
tay
(day
s)
Mea
n (S
D) l
engt
h of
pos
t-ac
ute
stay
(day
s)
Mea
n (S
D) t
otal
leng
th o
f st
ay –
ac
ute
+ p
ost-
acut
e (d
ays)
Altnagelvin Area Hospital ALT 387 350 90.4 90.3 20.3 72.5 2.3 6.3 20.2 0.0 10.8 (6.9) 9.78 (19.8) 20.6 (20.5)
Craigavon Hospital, Portadown CRG 250 218 87.2 92.6 52.6 69.4 99.5 9.3 94.6 100.0 10.2 (5.5) 11.13 (18.3) 21.4 (18.4)
Ulster Hospital, Belfast NUH 375 381 101.6 93.1 40.4 34.3 79.3 4.8 74.1 71.4 15.8 (9.0) 4.47 (9.7) 20.3 (13.3)
Royal Victoria Hospital, Belfast RVB 924 896 97.0 89.9 37.4 52.2 97.5 1.0 71.2 97.3 11.2 (8.1) 8.56 (19.6) 19.7 (20.5)
NORTHERN IRELAND 1936 1845 95.3 90.9 36.5 54.6 75.9 3.8 64.7 73.6 12.0 (8.2) 8.1 (17.9) 20.2 (18.9)
OVERALL 64385 61508 95.5 93.9 50.2 85.8 52.9 3.5 83.8 94.5 15.7 (13.0) 4.3 (13.1) 20.0 (17.8)
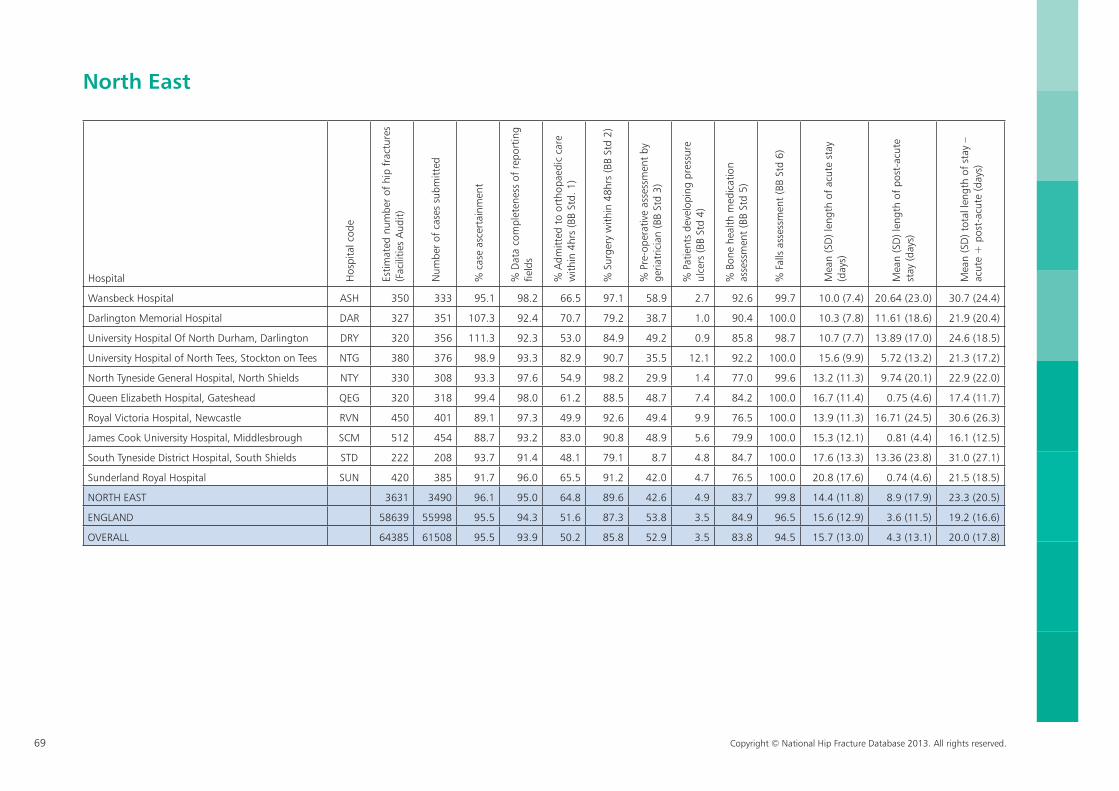
69 Copyright © National Hip Fracture Database 2013. All rights reserved.
North East
Hospital Hos
pita
l cod
e
Estim
ated
num
ber
of h
ip
frac
ture
s (F
acili
ties
Aud
it)
Num
ber
of c
ases
sub
mitt
ed
% c
ase
asce
rtai
nmen
t
% D
ata
com
plet
enes
s of
re
port
ing
field
s
% A
dmitt
ed t
o or
thop
aedi
c ca
re
with
in 4
hrs
(BB
Std.
1)
% S
urge
ry w
ithin
48h
rs (B
B St
d 2) %
Pre
-ope
rativ
e as
sess
men
t by
ge
riatr
icia
n (B
B St
d 3)
% P
atie
nts
deve
lopi
ng p
ress
ure
ulce
rs (B
B St
d 4)
% B
one
heal
th m
edic
atio
n as
sess
men
t (B
B St
d 5)
% F
alls
ass
essm
ent
(BB
Std
6)
Mea
n (S
D) l
engt
h of
acu
te s
tay
(day
s)
Mea
n (S
D) l
engt
h of
pos
t-ac
ute
stay
(day
s)
Mea
n (S
D) t
otal
leng
th o
f st
ay –
ac
ute
+ p
ost-
acut
e (d
ays)
Altnagelvin Area Hospital ALT 387 350 90.4 90.3 20.3 72.5 2.3 6.3 20.2 0.0 10.8 (6.9) 9.78 (19.8) 20.6 (20.5)
Craigavon Hospital, Portadown CRG 250 218 87.2 92.6 52.6 69.4 99.5 9.3 94.6 100.0 10.2 (5.5) 11.13 (18.3) 21.4 (18.4)
Ulster Hospital, Belfast NUH 375 381 101.6 93.1 40.4 34.3 79.3 4.8 74.1 71.4 15.8 (9.0) 4.47 (9.7) 20.3 (13.3)
Royal Victoria Hospital, Belfast RVB 924 896 97.0 89.9 37.4 52.2 97.5 1.0 71.2 97.3 11.2 (8.1) 8.56 (19.6) 19.7 (20.5)
NORTHERN IRELAND 1936 1845 95.3 90.9 36.5 54.6 75.9 3.8 64.7 73.6 12.0 (8.2) 8.1 (17.9) 20.2 (18.9)
OVERALL 64385 61508 95.5 93.9 50.2 85.8 52.9 3.5 83.8 94.5 15.7 (13.0) 4.3 (13.1) 20.0 (17.8)
Hospital Hos
pita
l cod
e
Estim
ated
num
ber
of h
ip f
ract
ures
(F
acili
ties
Aud
it)
Num
ber
of c
ases
sub
mitt
ed
% c
ase
asce
rtai
nmen
t
% D
ata
com
plet
enes
s of
rep
ortin
g fie
lds
% A
dmitt
ed t
o or
thop
aedi
c ca
re
with
in 4
hrs
(BB
Std.
1)
% S
urge
ry w
ithin
48h
rs (B
B St
d 2)
% P
re-o
pera
tive
asse
ssm
ent
by
geria
tric
ian
(BB
Std
3)
% P
atie
nts
deve
lopi
ng p
ress
ure
ulce
rs (B
B St
d 4)
% B
one
heal
th m
edic
atio
n as
sess
men
t (B
B St
d 5)
% F
alls
ass
essm
ent
(BB
Std
6)
Mea
n (S
D) l
engt
h of
acu
te s
tay
(day
s)
Mea
n (S
D) l
engt
h of
pos
t-ac
ute
stay
(day
s)
Mea
n (S
D) t
otal
leng
th o
f st
ay –
ac
ute
+ p
ost-
acut
e (d
ays)
Wansbeck Hospital ASH 350 333 95.1 98.2 66.5 97.1 58.9 2.7 92.6 99.7 10.0 (7.4) 20.64 (23.0) 30.7 (24.4)
Darlington Memorial Hospital DAR 327 351 107.3 92.4 70.7 79.2 38.7 1.0 90.4 100.0 10.3 (7.8) 11.61 (18.6) 21.9 (20.4)
University Hospital Of North Durham, Darlington DRY 320 356 111.3 92.3 53.0 84.9 49.2 0.9 85.8 98.7 10.7 (7.7) 13.89 (17.0) 24.6 (18.5)
University Hospital of North Tees, Stockton on Tees NTG 380 376 98.9 93.3 82.9 90.7 35.5 12.1 92.2 100.0 15.6 (9.9) 5.72 (13.2) 21.3 (17.2)
North Tyneside General Hospital, North Shields NTY 330 308 93.3 97.6 54.9 98.2 29.9 1.4 77.0 99.6 13.2 (11.3) 9.74 (20.1) 22.9 (22.0)
Queen Elizabeth Hospital, Gateshead QEG 320 318 99.4 98.0 61.2 88.5 48.7 7.4 84.2 100.0 16.7 (11.4) 0.75 (4.6) 17.4 (11.7)
Royal Victoria Hospital, Newcastle RVN 450 401 89.1 97.3 49.9 92.6 49.4 9.9 76.5 100.0 13.9 (11.3) 16.71 (24.5) 30.6 (26.3)
James Cook University Hospital, Middlesbrough SCM 512 454 88.7 93.2 83.0 90.8 48.9 5.6 79.9 100.0 15.3 (12.1) 0.81 (4.4) 16.1 (12.5)
South Tyneside District Hospital, South Shields STD 222 208 93.7 91.4 48.1 79.1 8.7 4.8 84.7 100.0 17.6 (13.3) 13.36 (23.8) 31.0 (27.1)
Sunderland Royal Hospital SUN 420 385 91.7 96.0 65.5 91.2 42.0 4.7 76.5 100.0 20.8 (17.6) 0.74 (4.6) 21.5 (18.5)
NORTH EAST 3631 3490 96.1 95.0 64.8 89.6 42.6 4.9 83.7 99.8 14.4 (11.8) 8.9 (17.9) 23.3 (20.5)
ENGLAND 58639 55998 95.5 94.3 51.6 87.3 53.8 3.5 84.9 96.5 15.6 (12.9) 3.6 (11.5) 19.2 (16.6)
OVERALL 64385 61508 95.5 93.9 50.2 85.8 52.9 3.5 83.8 94.5 15.7 (13.0) 4.3 (13.1) 20.0 (17.8)
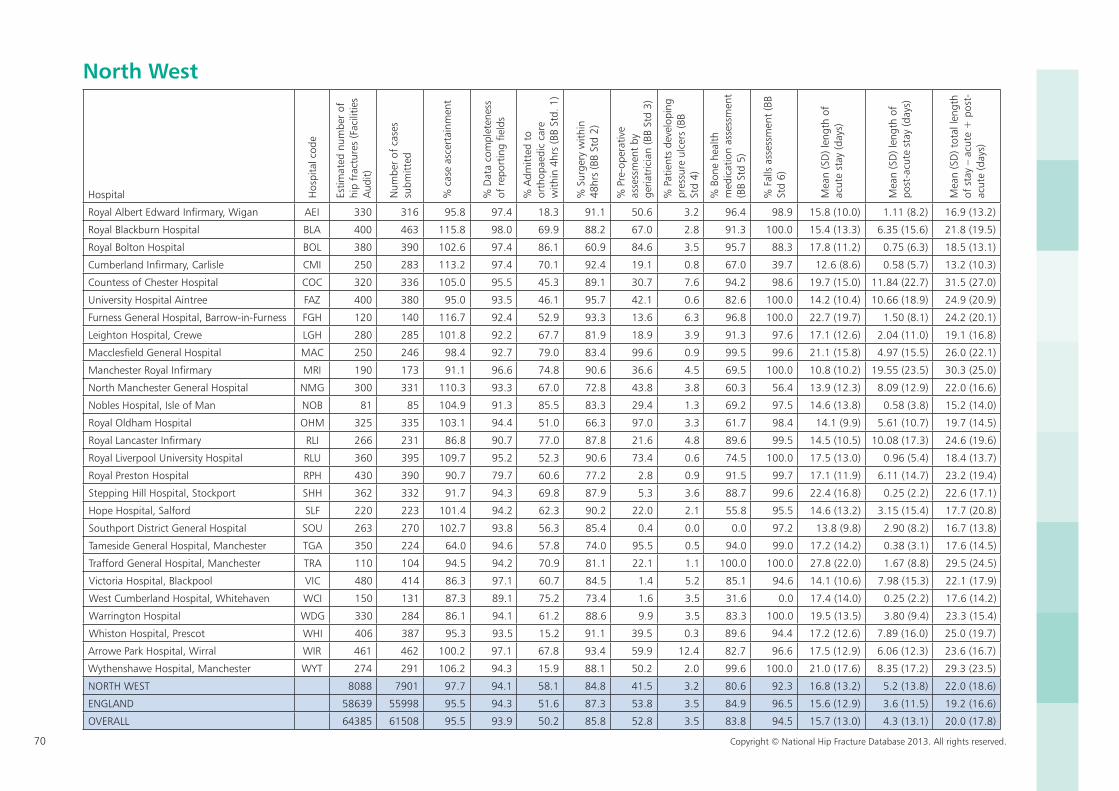
70 Copyright © National Hip Fracture Database 2013. All rights reserved.
North West
Hospital Hos
pita
l cod
e
Estim
ated
num
ber
of
hip
frac
ture
s (F
acili
ties
Aud
it)
Num
ber
of c
ases
su
bmitt
ed
% c
ase
asce
rtai
nmen
t
% D
ata
com
plet
enes
s of
rep
ortin
g fie
lds
% A
dmitt
ed t
o or
thop
aedi
c ca
re
with
in 4
hrs
(BB
Std.
1)
% S
urge
ry w
ithin
48
hrs
(BB
Std
2)
% P
re-o
pera
tive
asse
ssm
ent
by
geria
tric
ian
(BB
Std
3)
% P
atie
nts
deve
lopi
ng
pres
sure
ulc
ers
(BB
Std
4)
% B
one
heal
th
med
icat
ion
asse
ssm
ent
(BB
Std
5)
% F
alls
ass
essm
ent
(BB
Std
6)
Mea
n (S
D) l
engt
h of
ac
ute
stay
(day
s)
Mea
n (S
D) l
engt
h of
po
st-a
cute
sta
y (d
ays)
Mea
n (S
D) t
otal
leng
th
of s
tay
– ac
ute
+ p
ost-
acut
e (d
ays)
Royal Albert Edward Infirmary, Wigan AEI 330 316 95.8 97.4 18.3 91.1 50.6 3.2 96.4 98.9 15.8 (10.0) 1.11 (8.2) 16.9 (13.2)
Royal Blackburn Hospital BLA 400 463 115.8 98.0 69.9 88.2 67.0 2.8 91.3 100.0 15.4 (13.3) 6.35 (15.6) 21.8 (19.5)
Royal Bolton Hospital BOL 380 390 102.6 97.4 86.1 60.9 84.6 3.5 95.7 88.3 17.8 (11.2) 0.75 (6.3) 18.5 (13.1)
Cumberland Infirmary, Carlisle CMI 250 283 113.2 97.4 70.1 92.4 19.1 0.8 67.0 39.7 12.6 (8.6) 0.58 (5.7) 13.2 (10.3)
Countess of Chester Hospital COC 320 336 105.0 95.5 45.3 89.1 30.7 7.6 94.2 98.6 19.7 (15.0) 11.84 (22.7) 31.5 (27.0)
University Hospital Aintree FAZ 400 380 95.0 93.5 46.1 95.7 42.1 0.6 82.6 100.0 14.2 (10.4) 10.66 (18.9) 24.9 (20.9)
Furness General Hospital, Barrow-in-Furness FGH 120 140 116.7 92.4 52.9 93.3 13.6 6.3 96.8 100.0 22.7 (19.7) 1.50 (8.1) 24.2 (20.1)
Leighton Hospital, Crewe LGH 280 285 101.8 92.2 67.7 81.9 18.9 3.9 91.3 97.6 17.1 (12.6) 2.04 (11.0) 19.1 (16.8)
Macclesfield General Hospital MAC 250 246 98.4 92.7 79.0 83.4 99.6 0.9 99.5 99.6 21.1 (15.8) 4.97 (15.5) 26.0 (22.1)
Manchester Royal Infirmary MRI 190 173 91.1 96.6 74.8 90.6 36.6 4.5 69.5 100.0 10.8 (10.2) 19.55 (23.5) 30.3 (25.0)
North Manchester General Hospital NMG 300 331 110.3 93.3 67.0 72.8 43.8 3.8 60.3 56.4 13.9 (12.3) 8.09 (12.9) 22.0 (16.6)
Nobles Hospital, Isle of Man NOB 81 85 104.9 91.3 85.5 83.3 29.4 1.3 69.2 97.5 14.6 (13.8) 0.58 (3.8) 15.2 (14.0)
Royal Oldham Hospital OHM 325 335 103.1 94.4 51.0 66.3 97.0 3.3 61.7 98.4 14.1 (9.9) 5.61 (10.7) 19.7 (14.5)
Royal Lancaster Infirmary RLI 266 231 86.8 90.7 77.0 87.8 21.6 4.8 89.6 99.5 14.5 (10.5) 10.08 (17.3) 24.6 (19.6)
Royal Liverpool University Hospital RLU 360 395 109.7 95.2 52.3 90.6 73.4 0.6 74.5 100.0 17.5 (13.0) 0.96 (5.4) 18.4 (13.7)
Royal Preston Hospital RPH 430 390 90.7 79.7 60.6 77.2 2.8 0.9 91.5 99.7 17.1 (11.9) 6.11 (14.7) 23.2 (19.4)
Stepping Hill Hospital, Stockport SHH 362 332 91.7 94.3 69.8 87.9 5.3 3.6 88.7 99.6 22.4 (16.8) 0.25 (2.2) 22.6 (17.1)
Hope Hospital, Salford SLF 220 223 101.4 94.2 62.3 90.2 22.0 2.1 55.8 95.5 14.6 (13.2) 3.15 (15.4) 17.7 (20.8)
Southport District General Hospital SOU 263 270 102.7 93.8 56.3 85.4 0.4 0.0 0.0 97.2 13.8 (9.8) 2.90 (8.2) 16.7 (13.8)
Tameside General Hospital, Manchester TGA 350 224 64.0 94.6 57.8 74.0 95.5 0.5 94.0 99.0 17.2 (14.2) 0.38 (3.1) 17.6 (14.5)
Trafford General Hospital, Manchester TRA 110 104 94.5 94.2 70.9 81.1 22.1 1.1 100.0 100.0 27.8 (22.0) 1.67 (8.8) 29.5 (24.5)
Victoria Hospital, Blackpool VIC 480 414 86.3 97.1 60.7 84.5 1.4 5.2 85.1 94.6 14.1 (10.6) 7.98 (15.3) 22.1 (17.9)
West Cumberland Hospital, Whitehaven WCI 150 131 87.3 89.1 75.2 73.4 1.6 3.5 31.6 0.0 17.4 (14.0) 0.25 (2.2) 17.6 (14.2)
Warrington Hospital WDG 330 284 86.1 94.1 61.2 88.6 9.9 3.5 83.3 100.0 19.5 (13.5) 3.80 (9.4) 23.3 (15.4)
Whiston Hospital, Prescot WHI 406 387 95.3 93.5 15.2 91.1 39.5 0.3 89.6 94.4 17.2 (12.6) 7.89 (16.0) 25.0 (19.7)
Arrowe Park Hospital, Wirral WIR 461 462 100.2 97.1 67.8 93.4 59.9 12.4 82.7 96.6 17.5 (12.9) 6.06 (12.3) 23.6 (16.7)
Wythenshawe Hospital, Manchester WYT 274 291 106.2 94.3 15.9 88.1 50.2 2.0 99.6 100.0 21.0 (17.6) 8.35 (17.2) 29.3 (23.5)
NORTH WEST 8088 7901 97.7 94.1 58.1 84.8 41.5 3.2 80.6 92.3 16.8 (13.2) 5.2 (13.8) 22.0 (18.6)
ENGLAND 58639 55998 95.5 94.3 51.6 87.3 53.8 3.5 84.9 96.5 15.6 (12.9) 3.6 (11.5) 19.2 (16.6)
OVERALL 64385 61508 95.5 93.9 50.2 85.8 52.8 3.5 83.8 94.5 15.7 (13.0) 4.3 (13.1) 20.0 (17.8)
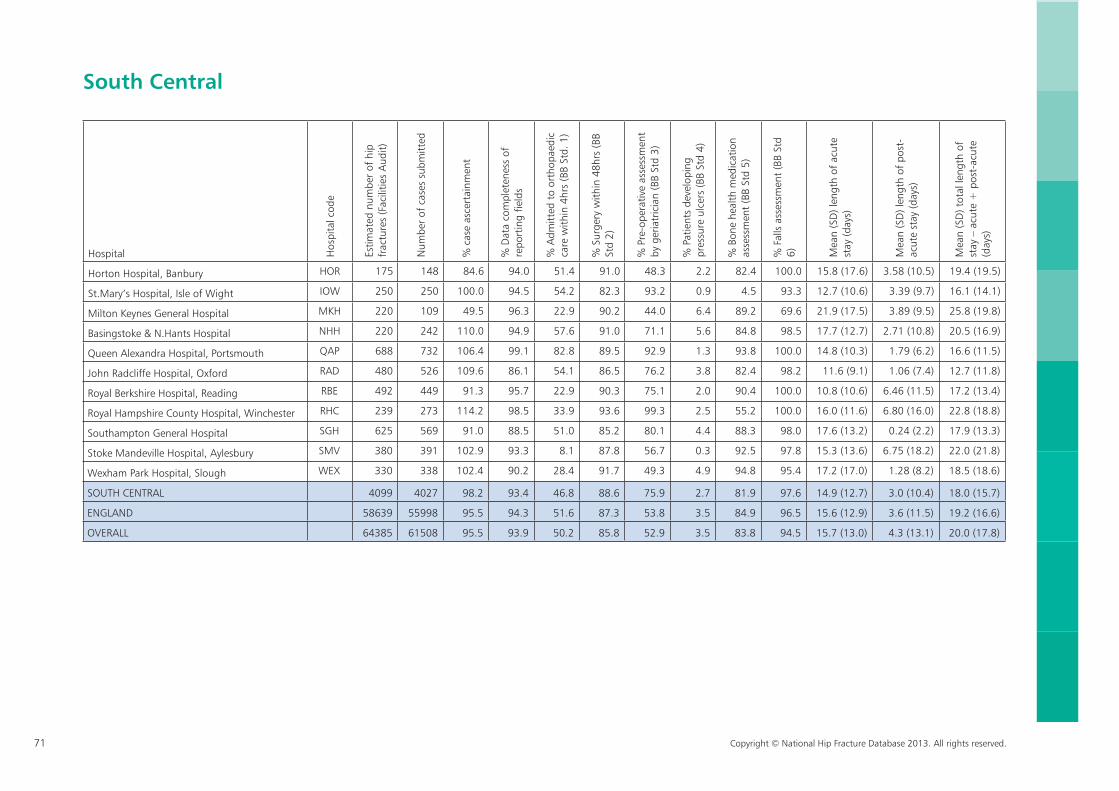
71 Copyright © National Hip Fracture Database 2013. All rights reserved.
South Central
Hospital Hos
pita
l cod
e
Estim
ated
num
ber
of h
ip
frac
ture
s (F
acili
ties
Aud
it)
Num
ber
of c
ases
sub
mitt
ed
% c
ase
asce
rtai
nmen
t
% D
ata
com
plet
enes
s of
re
port
ing
field
s
% A
dmitt
ed t
o or
thop
aedi
c ca
re w
ithin
4hr
s (B
B St
d. 1
)
% S
urge
ry w
ithin
48h
rs (B
B St
d 2)
% P
re-o
pera
tive
asse
ssm
ent
by g
eria
tric
ian
(BB
Std
3)
% P
atie
nts
deve
lopi
ng
pres
sure
ulc
ers
(BB
Std
4)
% B
one
heal
th m
edic
atio
n as
sess
men
t (B
B St
d 5)
% F
alls
ass
essm
ent
(BB
Std
6) Mea
n (S
D) l
engt
h of
acu
te
stay
(day
s)
Mea
n (S
D) l
engt
h of
pos
t-ac
ute
stay
(day
s)
Mea
n (S
D) t
otal
leng
th o
f st
ay –
acu
te +
pos
t-ac
ute
(day
s)
Horton Hospital, Banbury HOR 175 148 84.6 94.0 51.4 91.0 48.3 2.2 82.4 100.0 15.8 (17.6) 3.58 (10.5) 19.4 (19.5)
St.Mary’s Hospital, Isle of Wight IOW 250 250 100.0 94.5 54.2 82.3 93.2 0.9 4.5 93.3 12.7 (10.6) 3.39 (9.7) 16.1 (14.1)
Milton Keynes General Hospital MKH 220 109 49.5 96.3 22.9 90.2 44.0 6.4 89.2 69.6 21.9 (17.5) 3.89 (9.5) 25.8 (19.8)
Basingstoke & N.Hants Hospital NHH 220 242 110.0 94.9 57.6 91.0 71.1 5.6 84.8 98.5 17.7 (12.7) 2.71 (10.8) 20.5 (16.9)
Queen Alexandra Hospital, Portsmouth QAP 688 732 106.4 99.1 82.8 89.5 92.9 1.3 93.8 100.0 14.8 (10.3) 1.79 (6.2) 16.6 (11.5)
John Radcliffe Hospital, Oxford RAD 480 526 109.6 86.1 54.1 86.5 76.2 3.8 82.4 98.2 11.6 (9.1) 1.06 (7.4) 12.7 (11.8)
Royal Berkshire Hospital, Reading RBE 492 449 91.3 95.7 22.9 90.3 75.1 2.0 90.4 100.0 10.8 (10.6) 6.46 (11.5) 17.2 (13.4)
Royal Hampshire County Hospital, Winchester RHC 239 273 114.2 98.5 33.9 93.6 99.3 2.5 55.2 100.0 16.0 (11.6) 6.80 (16.0) 22.8 (18.8)
Southampton General Hospital SGH 625 569 91.0 88.5 51.0 85.2 80.1 4.4 88.3 98.0 17.6 (13.2) 0.24 (2.2) 17.9 (13.3)
Stoke Mandeville Hospital, Aylesbury SMV 380 391 102.9 93.3 8.1 87.8 56.7 0.3 92.5 97.8 15.3 (13.6) 6.75 (18.2) 22.0 (21.8)
Wexham Park Hospital, Slough WEX 330 338 102.4 90.2 28.4 91.7 49.3 4.9 94.8 95.4 17.2 (17.0) 1.28 (8.2) 18.5 (18.6)
SOUTH CENTRAL 4099 4027 98.2 93.4 46.8 88.6 75.9 2.7 81.9 97.6 14.9 (12.7) 3.0 (10.4) 18.0 (15.7)
ENGLAND 58639 55998 95.5 94.3 51.6 87.3 53.8 3.5 84.9 96.5 15.6 (12.9) 3.6 (11.5) 19.2 (16.6)
OVERALL 64385 61508 95.5 93.9 50.2 85.8 52.9 3.5 83.8 94.5 15.7 (13.0) 4.3 (13.1) 20.0 (17.8)
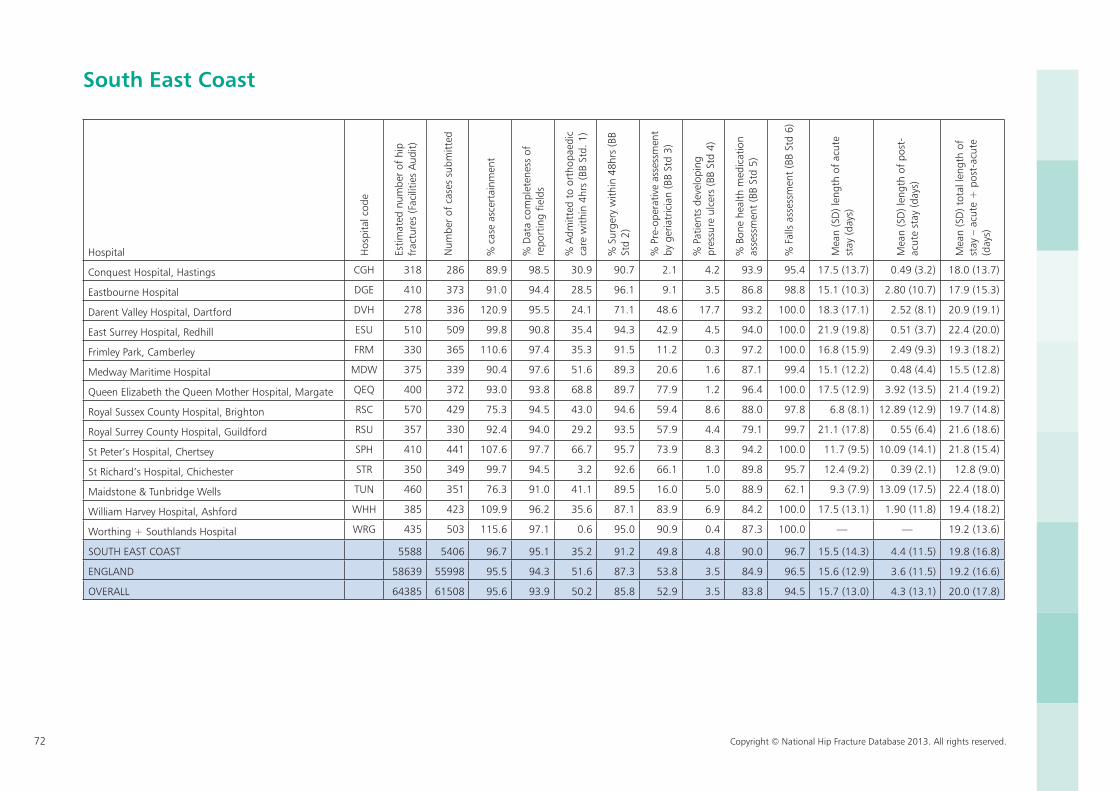
72 Copyright © National Hip Fracture Database 2013. All rights reserved.
South East Coast
Hospital Hos
pita
l cod
e
Estim
ated
num
ber
of h
ip
frac
ture
s (F
acili
ties
Aud
it)
Num
ber
of c
ases
sub
mitt
ed
% c
ase
asce
rtai
nmen
t
% D
ata
com
plet
enes
s of
re
port
ing
field
s
% A
dmitt
ed t
o or
thop
aedi
c ca
re w
ithin
4hr
s (B
B St
d. 1
)
% S
urge
ry w
ithin
48h
rs (B
B St
d 2)
% P
re-o
pera
tive
asse
ssm
ent
by g
eria
tric
ian
(BB
Std
3)
% P
atie
nts
deve
lopi
ng
pres
sure
ulc
ers
(BB
Std
4)
% B
one
heal
th m
edic
atio
n as
sess
men
t (B
B St
d 5)
% F
alls
ass
essm
ent
(BB
Std
6)
Mea
n (S
D) l
engt
h of
acu
te
stay
(day
s)
Mea
n (S
D) l
engt
h of
pos
t-ac
ute
stay
(day
s)
Mea
n (S
D) t
otal
leng
th o
f st
ay –
acu
te +
pos
t-ac
ute
(day
s)
Conquest Hospital, Hastings CGH 318 286 89.9 98.5 30.9 90.7 2.1 4.2 93.9 95.4 17.5 (13.7) 0.49 (3.2) 18.0 (13.7)
Eastbourne Hospital DGE 410 373 91.0 94.4 28.5 96.1 9.1 3.5 86.8 98.8 15.1 (10.3) 2.80 (10.7) 17.9 (15.3)
Darent Valley Hospital, Dartford DVH 278 336 120.9 95.5 24.1 71.1 48.6 17.7 93.2 100.0 18.3 (17.1) 2.52 (8.1) 20.9 (19.1)
East Surrey Hospital, Redhill ESU 510 509 99.8 90.8 35.4 94.3 42.9 4.5 94.0 100.0 21.9 (19.8) 0.51 (3.7) 22.4 (20.0)
Frimley Park, Camberley FRM 330 365 110.6 97.4 35.3 91.5 11.2 0.3 97.2 100.0 16.8 (15.9) 2.49 (9.3) 19.3 (18.2)
Medway Maritime Hospital MDW 375 339 90.4 97.6 51.6 89.3 20.6 1.6 87.1 99.4 15.1 (12.2) 0.48 (4.4) 15.5 (12.8)
Queen Elizabeth the Queen Mother Hospital, Margate QEQ 400 372 93.0 93.8 68.8 89.7 77.9 1.2 96.4 100.0 17.5 (12.9) 3.92 (13.5) 21.4 (19.2)
Royal Sussex County Hospital, Brighton RSC 570 429 75.3 94.5 43.0 94.6 59.4 8.6 88.0 97.8 6.8 (8.1) 12.89 (12.9) 19.7 (14.8)
Royal Surrey County Hospital, Guildford RSU 357 330 92.4 94.0 29.2 93.5 57.9 4.4 79.1 99.7 21.1 (17.8) 0.55 (6.4) 21.6 (18.6)
St Peter’s Hospital, Chertsey SPH 410 441 107.6 97.7 66.7 95.7 73.9 8.3 94.2 100.0 11.7 (9.5) 10.09 (14.1) 21.8 (15.4)
St Richard’s Hospital, Chichester STR 350 349 99.7 94.5 3.2 92.6 66.1 1.0 89.8 95.7 12.4 (9.2) 0.39 (2.1) 12.8 (9.0)
Maidstone & Tunbridge Wells TUN 460 351 76.3 91.0 41.1 89.5 16.0 5.0 88.9 62.1 9.3 (7.9) 13.09 (17.5) 22.4 (18.0)
William Harvey Hospital, Ashford WHH 385 423 109.9 96.2 35.6 87.1 83.9 6.9 84.2 100.0 17.5 (13.1) 1.90 (11.8) 19.4 (18.2)
Worthing + Southlands Hospital WRG 435 503 115.6 97.1 0.6 95.0 90.9 0.4 87.3 100.0 — — 19.2 (13.6)
SOUTH EAST COAST 5588 5406 96.7 95.1 35.2 91.2 49.8 4.8 90.0 96.7 15.5 (14.3) 4.4 (11.5) 19.8 (16.8)
ENGLAND 58639 55998 95.5 94.3 51.6 87.3 53.8 3.5 84.9 96.5 15.6 (12.9) 3.6 (11.5) 19.2 (16.6)
OVERALL 64385 61508 95.6 93.9 50.2 85.8 52.9 3.5 83.8 94.5 15.7 (13.0) 4.3 (13.1) 20.0 (17.8)
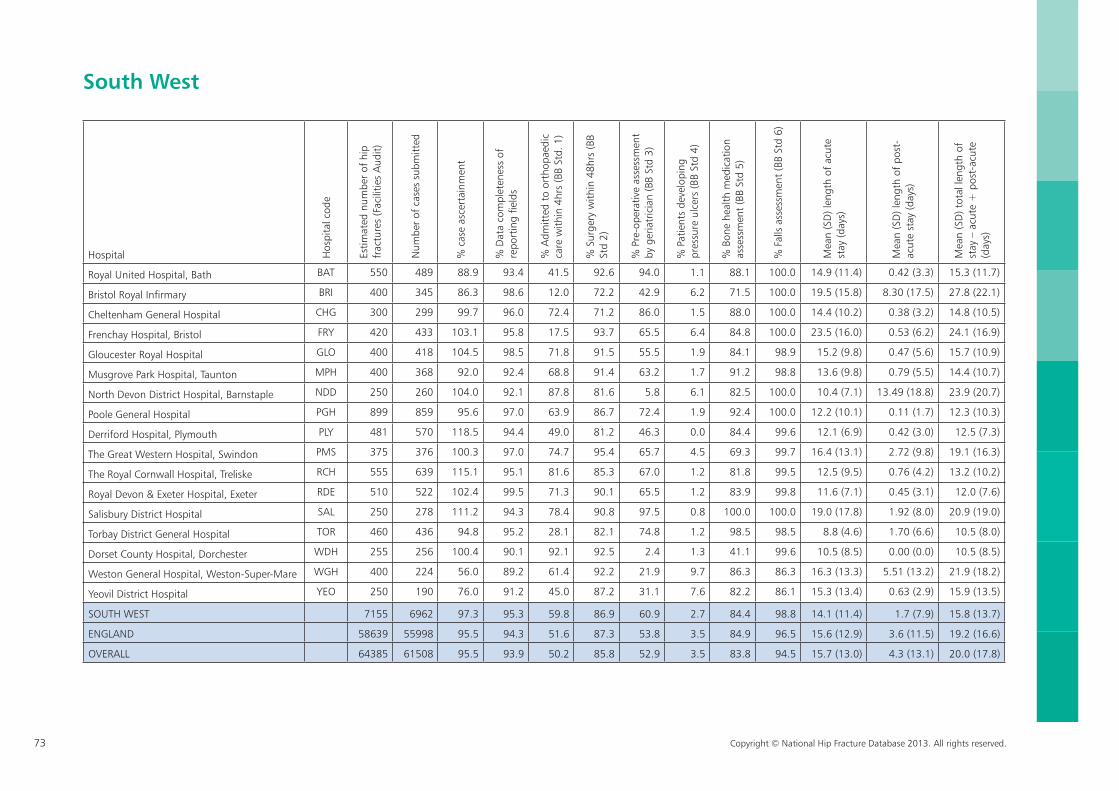
73 Copyright © National Hip Fracture Database 2013. All rights reserved.
South West
Hospital Hos
pita
l cod
e
Estim
ated
num
ber
of h
ip
frac
ture
s (F
acili
ties
Aud
it)
Num
ber
of c
ases
sub
mitt
ed
% c
ase
asce
rtai
nmen
t
% D
ata
com
plet
enes
s of
re
port
ing
field
s
% A
dmitt
ed t
o or
thop
aedi
c ca
re w
ithin
4hr
s (B
B St
d. 1
)
% S
urge
ry w
ithin
48h
rs (B
B St
d 2)
% P
re-o
pera
tive
asse
ssm
ent
by g
eria
tric
ian
(BB
Std
3)
% P
atie
nts
deve
lopi
ng
pres
sure
ulc
ers
(BB
Std
4)
% B
one
heal
th m
edic
atio
n as
sess
men
t (B
B St
d 5)
% F
alls
ass
essm
ent
(BB
Std
6)
Mea
n (S
D) l
engt
h of
acu
te
stay
(day
s)
Mea
n (S
D) l
engt
h of
pos
t-ac
ute
stay
(day
s)
Mea
n (S
D) t
otal
leng
th o
f st
ay –
acu
te +
pos
t-ac
ute
(day
s)
Royal United Hospital, Bath BAT 550 489 88.9 93.4 41.5 92.6 94.0 1.1 88.1 100.0 14.9 (11.4) 0.42 (3.3) 15.3 (11.7)
Bristol Royal Infirmary BRI 400 345 86.3 98.6 12.0 72.2 42.9 6.2 71.5 100.0 19.5 (15.8) 8.30 (17.5) 27.8 (22.1)
Cheltenham General Hospital CHG 300 299 99.7 96.0 72.4 71.2 86.0 1.5 88.0 100.0 14.4 (10.2) 0.38 (3.2) 14.8 (10.5)
Frenchay Hospital, Bristol FRY 420 433 103.1 95.8 17.5 93.7 65.5 6.4 84.8 100.0 23.5 (16.0) 0.53 (6.2) 24.1 (16.9)
Gloucester Royal Hospital GLO 400 418 104.5 98.5 71.8 91.5 55.5 1.9 84.1 98.9 15.2 (9.8) 0.47 (5.6) 15.7 (10.9)
Musgrove Park Hospital, Taunton MPH 400 368 92.0 92.4 68.8 91.4 63.2 1.7 91.2 98.8 13.6 (9.8) 0.79 (5.5) 14.4 (10.7)
North Devon District Hospital, Barnstaple NDD 250 260 104.0 92.1 87.8 81.6 5.8 6.1 82.5 100.0 10.4 (7.1) 13.49 (18.8) 23.9 (20.7)
Poole General Hospital PGH 899 859 95.6 97.0 63.9 86.7 72.4 1.9 92.4 100.0 12.2 (10.1) 0.11 (1.7) 12.3 (10.3)
Derriford Hospital, Plymouth PLY 481 570 118.5 94.4 49.0 81.2 46.3 0.0 84.4 99.6 12.1 (6.9) 0.42 (3.0) 12.5 (7.3)
The Great Western Hospital, Swindon PMS 375 376 100.3 97.0 74.7 95.4 65.7 4.5 69.3 99.7 16.4 (13.1) 2.72 (9.8) 19.1 (16.3)
The Royal Cornwall Hospital, Treliske RCH 555 639 115.1 95.1 81.6 85.3 67.0 1.2 81.8 99.5 12.5 (9.5) 0.76 (4.2) 13.2 (10.2)
Royal Devon & Exeter Hospital, Exeter RDE 510 522 102.4 99.5 71.3 90.1 65.5 1.2 83.9 99.8 11.6 (7.1) 0.45 (3.1) 12.0 (7.6)
Salisbury District Hospital SAL 250 278 111.2 94.3 78.4 90.8 97.5 0.8 100.0 100.0 19.0 (17.8) 1.92 (8.0) 20.9 (19.0)
Torbay District General Hospital TOR 460 436 94.8 95.2 28.1 82.1 74.8 1.2 98.5 98.5 8.8 (4.6) 1.70 (6.6) 10.5 (8.0)
Dorset County Hospital, Dorchester WDH 255 256 100.4 90.1 92.1 92.5 2.4 1.3 41.1 99.6 10.5 (8.5) 0.00 (0.0) 10.5 (8.5)
Weston General Hospital, Weston-Super-Mare WGH 400 224 56.0 89.2 61.4 92.2 21.9 9.7 86.3 86.3 16.3 (13.3) 5.51 (13.2) 21.9 (18.2)
Yeovil District Hospital YEO 250 190 76.0 91.2 45.0 87.2 31.1 7.6 82.2 86.1 15.3 (13.4) 0.63 (2.9) 15.9 (13.5)
SOUTH WEST 7155 6962 97.3 95.3 59.8 86.9 60.9 2.7 84.4 98.8 14.1 (11.4) 1.7 (7.9) 15.8 (13.7)
ENGLAND 58639 55998 95.5 94.3 51.6 87.3 53.8 3.5 84.9 96.5 15.6 (12.9) 3.6 (11.5) 19.2 (16.6)
OVERALL 64385 61508 95.5 93.9 50.2 85.8 52.9 3.5 83.8 94.5 15.7 (13.0) 4.3 (13.1) 20.0 (17.8)
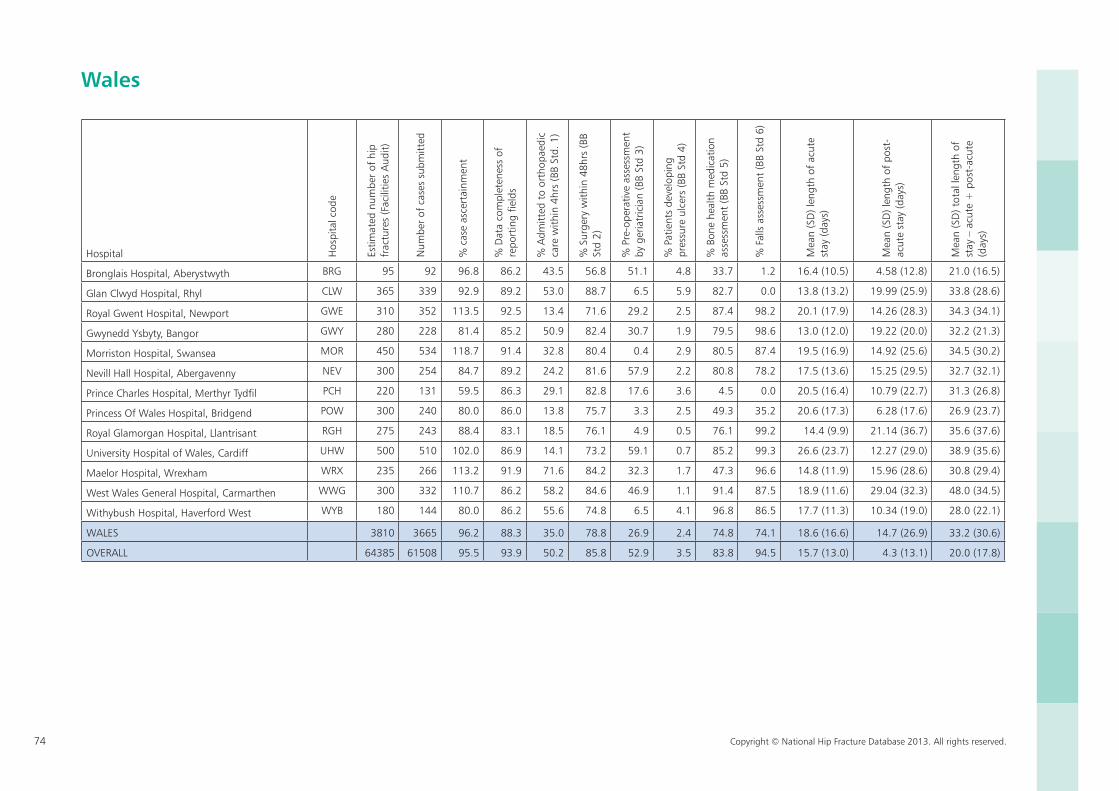
74 Copyright © National Hip Fracture Database 2013. All rights reserved.
Wales
Hospital Hos
pita
l cod
e
Estim
ated
num
ber
of h
ip
frac
ture
s (F
acili
ties
Aud
it)
Num
ber
of c
ases
sub
mitt
ed
% c
ase
asce
rtai
nmen
t
% D
ata
com
plet
enes
s of
re
port
ing
field
s
% A
dmitt
ed t
o or
thop
aedi
c ca
re w
ithin
4hr
s (B
B St
d. 1
)
% S
urge
ry w
ithin
48h
rs (B
B St
d 2)
% P
re-o
pera
tive
asse
ssm
ent
by g
eria
tric
ian
(BB
Std
3)
% P
atie
nts
deve
lopi
ng
pres
sure
ulc
ers
(BB
Std
4)
% B
one
heal
th m
edic
atio
n as
sess
men
t (B
B St
d 5)
% F
alls
ass
essm
ent
(BB
Std
6)
Mea
n (S
D) l
engt
h of
acu
te
stay
(day
s)
Mea
n (S
D) l
engt
h of
pos
t-ac
ute
stay
(day
s)
Mea
n (S
D) t
otal
leng
th o
f st
ay –
acu
te +
pos
t-ac
ute
(day
s)
Bronglais Hospital, Aberystwyth BRG 95 92 96.8 86.2 43.5 56.8 51.1 4.8 33.7 1.2 16.4 (10.5) 4.58 (12.8) 21.0 (16.5)
Glan Clwyd Hospital, Rhyl CLW 365 339 92.9 89.2 53.0 88.7 6.5 5.9 82.7 0.0 13.8 (13.2) 19.99 (25.9) 33.8 (28.6)
Royal Gwent Hospital, Newport GWE 310 352 113.5 92.5 13.4 71.6 29.2 2.5 87.4 98.2 20.1 (17.9) 14.26 (28.3) 34.3 (34.1)
Gwynedd Ysbyty, Bangor GWY 280 228 81.4 85.2 50.9 82.4 30.7 1.9 79.5 98.6 13.0 (12.0) 19.22 (20.0) 32.2 (21.3)
Morriston Hospital, Swansea MOR 450 534 118.7 91.4 32.8 80.4 0.4 2.9 80.5 87.4 19.5 (16.9) 14.92 (25.6) 34.5 (30.2)
Nevill Hall Hospital, Abergavenny NEV 300 254 84.7 89.2 24.2 81.6 57.9 2.2 80.8 78.2 17.5 (13.6) 15.25 (29.5) 32.7 (32.1)
Prince Charles Hospital, Merthyr Tydfil PCH 220 131 59.5 86.3 29.1 82.8 17.6 3.6 4.5 0.0 20.5 (16.4) 10.79 (22.7) 31.3 (26.8)
Princess Of Wales Hospital, Bridgend POW 300 240 80.0 86.0 13.8 75.7 3.3 2.5 49.3 35.2 20.6 (17.3) 6.28 (17.6) 26.9 (23.7)
Royal Glamorgan Hospital, Llantrisant RGH 275 243 88.4 83.1 18.5 76.1 4.9 0.5 76.1 99.2 14.4 (9.9) 21.14 (36.7) 35.6 (37.6)
University Hospital of Wales, Cardiff UHW 500 510 102.0 86.9 14.1 73.2 59.1 0.7 85.2 99.3 26.6 (23.7) 12.27 (29.0) 38.9 (35.6)
Maelor Hospital, Wrexham WRX 235 266 113.2 91.9 71.6 84.2 32.3 1.7 47.3 96.6 14.8 (11.9) 15.96 (28.6) 30.8 (29.4)
West Wales General Hospital, Carmarthen WWG 300 332 110.7 86.2 58.2 84.6 46.9 1.1 91.4 87.5 18.9 (11.6) 29.04 (32.3) 48.0 (34.5)
Withybush Hospital, Haverford West WYB 180 144 80.0 86.2 55.6 74.8 6.5 4.1 96.8 86.5 17.7 (11.3) 10.34 (19.0) 28.0 (22.1)
WALES 3810 3665 96.2 88.3 35.0 78.8 26.9 2.4 74.8 74.1 18.6 (16.6) 14.7 (26.9) 33.2 (30.6)
OVERALL 64385 61508 95.5 93.9 50.2 85.8 52.9 3.5 83.8 94.5 15.7 (13.0) 4.3 (13.1) 20.0 (17.8)
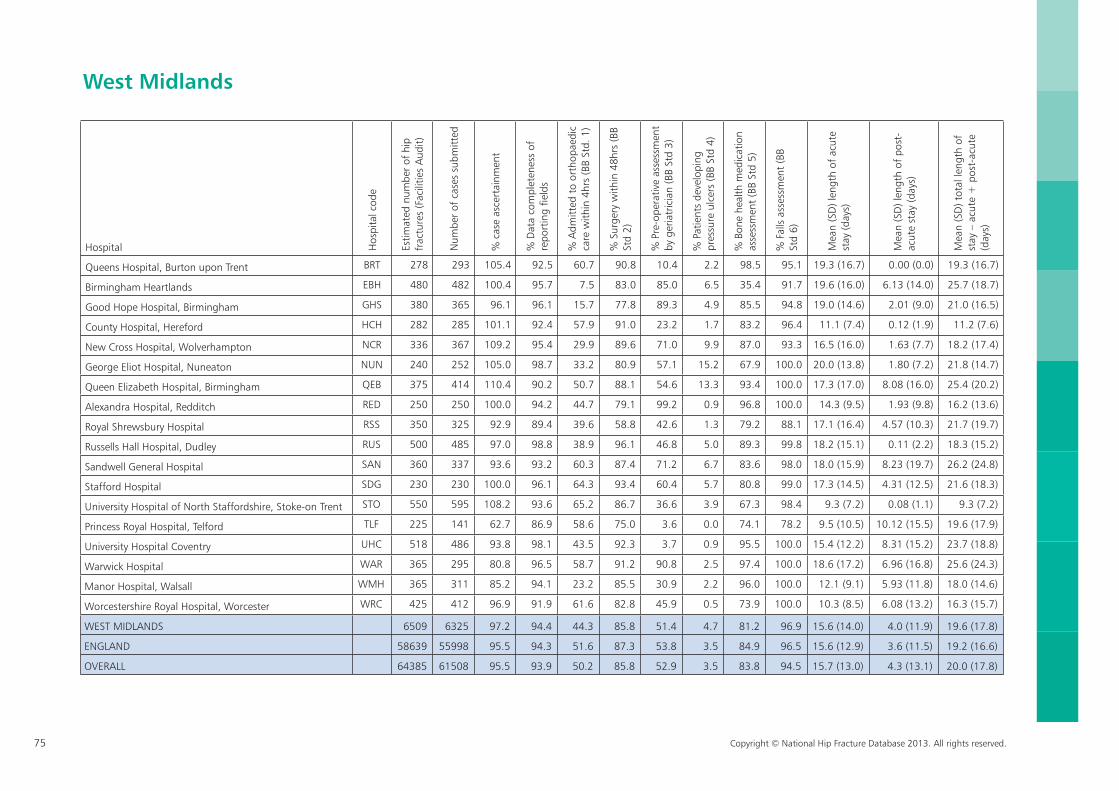
75 Copyright © National Hip Fracture Database 2013. All rights reserved.
West Midlands
Hospital Hos
pita
l cod
e
Estim
ated
num
ber
of h
ip
frac
ture
s (F
acili
ties
Aud
it)
Num
ber
of c
ases
sub
mitt
ed
% c
ase
asce
rtai
nmen
t
% D
ata
com
plet
enes
s of
re
port
ing
field
s
% A
dmitt
ed t
o or
thop
aedi
c ca
re w
ithin
4hr
s (B
B St
d. 1
)
% S
urge
ry w
ithin
48h
rs (B
B St
d 2)
% P
re-o
pera
tive
asse
ssm
ent
by g
eria
tric
ian
(BB
Std
3)
% P
atie
nts
deve
lopi
ng
pres
sure
ulc
ers
(BB
Std
4)
% B
one
heal
th m
edic
atio
n as
sess
men
t (B
B St
d 5)
% F
alls
ass
essm
ent
(BB
Std
6)
Mea
n (S
D) l
engt
h of
acu
te
stay
(day
s)
Mea
n (S
D) l
engt
h of
pos
t-ac
ute
stay
(day
s)
Mea
n (S
D) t
otal
leng
th o
f st
ay –
acu
te +
pos
t-ac
ute
(day
s)
Queens Hospital, Burton upon Trent BRT 278 293 105.4 92.5 60.7 90.8 10.4 2.2 98.5 95.1 19.3 (16.7) 0.00 (0.0) 19.3 (16.7)
Birmingham Heartlands EBH 480 482 100.4 95.7 7.5 83.0 85.0 6.5 35.4 91.7 19.6 (16.0) 6.13 (14.0) 25.7 (18.7)
Good Hope Hospital, Birmingham GHS 380 365 96.1 96.1 15.7 77.8 89.3 4.9 85.5 94.8 19.0 (14.6) 2.01 (9.0) 21.0 (16.5)
County Hospital, Hereford HCH 282 285 101.1 92.4 57.9 91.0 23.2 1.7 83.2 96.4 11.1 (7.4) 0.12 (1.9) 11.2 (7.6)
New Cross Hospital, Wolverhampton NCR 336 367 109.2 95.4 29.9 89.6 71.0 9.9 87.0 93.3 16.5 (16.0) 1.63 (7.7) 18.2 (17.4)
George Eliot Hospital, Nuneaton NUN 240 252 105.0 98.7 33.2 80.9 57.1 15.2 67.9 100.0 20.0 (13.8) 1.80 (7.2) 21.8 (14.7)
Queen Elizabeth Hospital, Birmingham QEB 375 414 110.4 90.2 50.7 88.1 54.6 13.3 93.4 100.0 17.3 (17.0) 8.08 (16.0) 25.4 (20.2)
Alexandra Hospital, Redditch RED 250 250 100.0 94.2 44.7 79.1 99.2 0.9 96.8 100.0 14.3 (9.5) 1.93 (9.8) 16.2 (13.6)
Royal Shrewsbury Hospital RSS 350 325 92.9 89.4 39.6 58.8 42.6 1.3 79.2 88.1 17.1 (16.4) 4.57 (10.3) 21.7 (19.7)
Russells Hall Hospital, Dudley RUS 500 485 97.0 98.8 38.9 96.1 46.8 5.0 89.3 99.8 18.2 (15.1) 0.11 (2.2) 18.3 (15.2)
Sandwell General Hospital SAN 360 337 93.6 93.2 60.3 87.4 71.2 6.7 83.6 98.0 18.0 (15.9) 8.23 (19.7) 26.2 (24.8)
Stafford Hospital SDG 230 230 100.0 96.1 64.3 93.4 60.4 5.7 80.8 99.0 17.3 (14.5) 4.31 (12.5) 21.6 (18.3)
University Hospital of North Staffordshire, Stoke-on Trent STO 550 595 108.2 93.6 65.2 86.7 36.6 3.9 67.3 98.4 9.3 (7.2) 0.08 (1.1) 9.3 (7.2)
Princess Royal Hospital, Telford TLF 225 141 62.7 86.9 58.6 75.0 3.6 0.0 74.1 78.2 9.5 (10.5) 10.12 (15.5) 19.6 (17.9)
University Hospital Coventry UHC 518 486 93.8 98.1 43.5 92.3 3.7 0.9 95.5 100.0 15.4 (12.2) 8.31 (15.2) 23.7 (18.8)
Warwick Hospital WAR 365 295 80.8 96.5 58.7 91.2 90.8 2.5 97.4 100.0 18.6 (17.2) 6.96 (16.8) 25.6 (24.3)
Manor Hospital, Walsall WMH 365 311 85.2 94.1 23.2 85.5 30.9 2.2 96.0 100.0 12.1 (9.1) 5.93 (11.8) 18.0 (14.6)
Worcestershire Royal Hospital, Worcester WRC 425 412 96.9 91.9 61.6 82.8 45.9 0.5 73.9 100.0 10.3 (8.5) 6.08 (13.2) 16.3 (15.7)
WEST MIDLANDS 6509 6325 97.2 94.4 44.3 85.8 51.4 4.7 81.2 96.9 15.6 (14.0) 4.0 (11.9) 19.6 (17.8)
ENGLAND 58639 55998 95.5 94.3 51.6 87.3 53.8 3.5 84.9 96.5 15.6 (12.9) 3.6 (11.5) 19.2 (16.6)
OVERALL 64385 61508 95.5 93.9 50.2 85.8 52.9 3.5 83.8 94.5 15.7 (13.0) 4.3 (13.1) 20.0 (17.8)
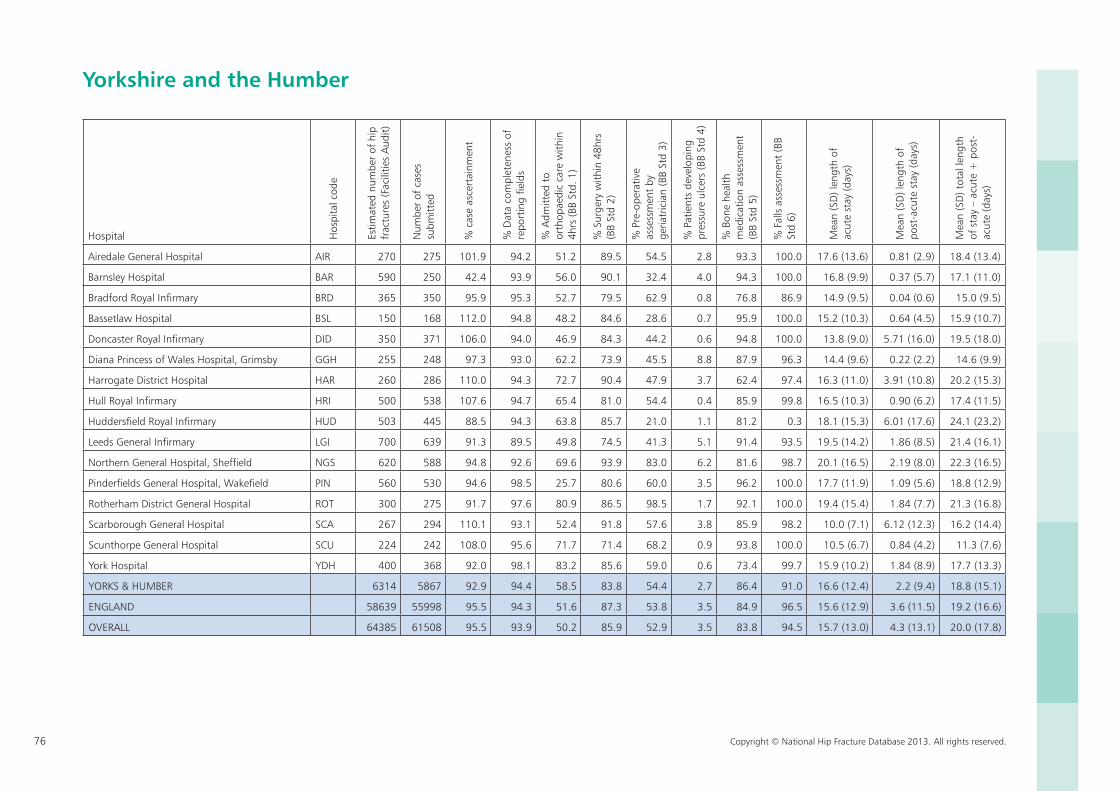
76 Copyright © National Hip Fracture Database 2013. All rights reserved.
Yorkshire and the Humber
Hospital Hos
pita
l cod
e
Estim
ated
num
ber
of h
ip
frac
ture
s (F
acili
ties
Aud
it)
Num
ber
of c
ases
su
bmitt
ed
% c
ase
asce
rtai
nmen
t
% D
ata
com
plet
enes
s of
re
port
ing
field
s
% A
dmitt
ed t
o or
thop
aedi
c ca
re w
ithin
4h
rs (B
B St
d. 1
)
% S
urge
ry w
ithin
48h
rs
(BB
Std
2)
% P
re-o
pera
tive
asse
ssm
ent
by
geria
tric
ian
(BB
Std
3)
% P
atie
nts
deve
lopi
ng
pres
sure
ulc
ers
(BB
Std
4)
% B
one
heal
th
med
icat
ion
asse
ssm
ent
(BB
Std
5)
% F
alls
ass
essm
ent
(BB
Std
6)
Mea
n (S
D) l
engt
h of
ac
ute
stay
(day
s)
Mea
n (S
D) l
engt
h of
po
st-a
cute
sta
y (d
ays)
Mea
n (S
D) t
otal
leng
th
of s
tay
– ac
ute
+ p
ost-
acut
e (d
ays)
Airedale General Hospital AIR 270 275 101.9 94.2 51.2 89.5 54.5 2.8 93.3 100.0 17.6 (13.6) 0.81 (2.9) 18.4 (13.4)
Barnsley Hospital BAR 590 250 42.4 93.9 56.0 90.1 32.4 4.0 94.3 100.0 16.8 (9.9) 0.37 (5.7) 17.1 (11.0)
Bradford Royal Infirmary BRD 365 350 95.9 95.3 52.7 79.5 62.9 0.8 76.8 86.9 14.9 (9.5) 0.04 (0.6) 15.0 (9.5)
Bassetlaw Hospital BSL 150 168 112.0 94.8 48.2 84.6 28.6 0.7 95.9 100.0 15.2 (10.3) 0.64 (4.5) 15.9 (10.7)
Doncaster Royal Infirmary DID 350 371 106.0 94.0 46.9 84.3 44.2 0.6 94.8 100.0 13.8 (9.0) 5.71 (16.0) 19.5 (18.0)
Diana Princess of Wales Hospital, Grimsby GGH 255 248 97.3 93.0 62.2 73.9 45.5 8.8 87.9 96.3 14.4 (9.6) 0.22 (2.2) 14.6 (9.9)
Harrogate District Hospital HAR 260 286 110.0 94.3 72.7 90.4 47.9 3.7 62.4 97.4 16.3 (11.0) 3.91 (10.8) 20.2 (15.3)
Hull Royal Infirmary HRI 500 538 107.6 94.7 65.4 81.0 54.4 0.4 85.9 99.8 16.5 (10.3) 0.90 (6.2) 17.4 (11.5)
Huddersfield Royal Infirmary HUD 503 445 88.5 94.3 63.8 85.7 21.0 1.1 81.2 0.3 18.1 (15.3) 6.01 (17.6) 24.1 (23.2)
Leeds General Infirmary LGI 700 639 91.3 89.5 49.8 74.5 41.3 5.1 91.4 93.5 19.5 (14.2) 1.86 (8.5) 21.4 (16.1)
Northern General Hospital, Sheffield NGS 620 588 94.8 92.6 69.6 93.9 83.0 6.2 81.6 98.7 20.1 (16.5) 2.19 (8.0) 22.3 (16.5)
Pinderfields General Hospital, Wakefield PIN 560 530 94.6 98.5 25.7 80.6 60.0 3.5 96.2 100.0 17.7 (11.9) 1.09 (5.6) 18.8 (12.9)
Rotherham District General Hospital ROT 300 275 91.7 97.6 80.9 86.5 98.5 1.7 92.1 100.0 19.4 (15.4) 1.84 (7.7) 21.3 (16.8)
Scarborough General Hospital SCA 267 294 110.1 93.1 52.4 91.8 57.6 3.8 85.9 98.2 10.0 (7.1) 6.12 (12.3) 16.2 (14.4)
Scunthorpe General Hospital SCU 224 242 108.0 95.6 71.7 71.4 68.2 0.9 93.8 100.0 10.5 (6.7) 0.84 (4.2) 11.3 (7.6)
York Hospital YDH 400 368 92.0 98.1 83.2 85.6 59.0 0.6 73.4 99.7 15.9 (10.2) 1.84 (8.9) 17.7 (13.3)
YORKS & HUMBER 6314 5867 92.9 94.4 58.5 83.8 54.4 2.7 86.4 91.0 16.6 (12.4) 2.2 (9.4) 18.8 (15.1)
ENGLAND 58639 55998 95.5 94.3 51.6 87.3 53.8 3.5 84.9 96.5 15.6 (12.9) 3.6 (11.5) 19.2 (16.6)
OVERALL 64385 61508 95.5 93.9 50.2 85.9 52.9 3.5 83.8 94.5 15.7 (13.0) 4.3 (13.1) 20.0 (17.8)
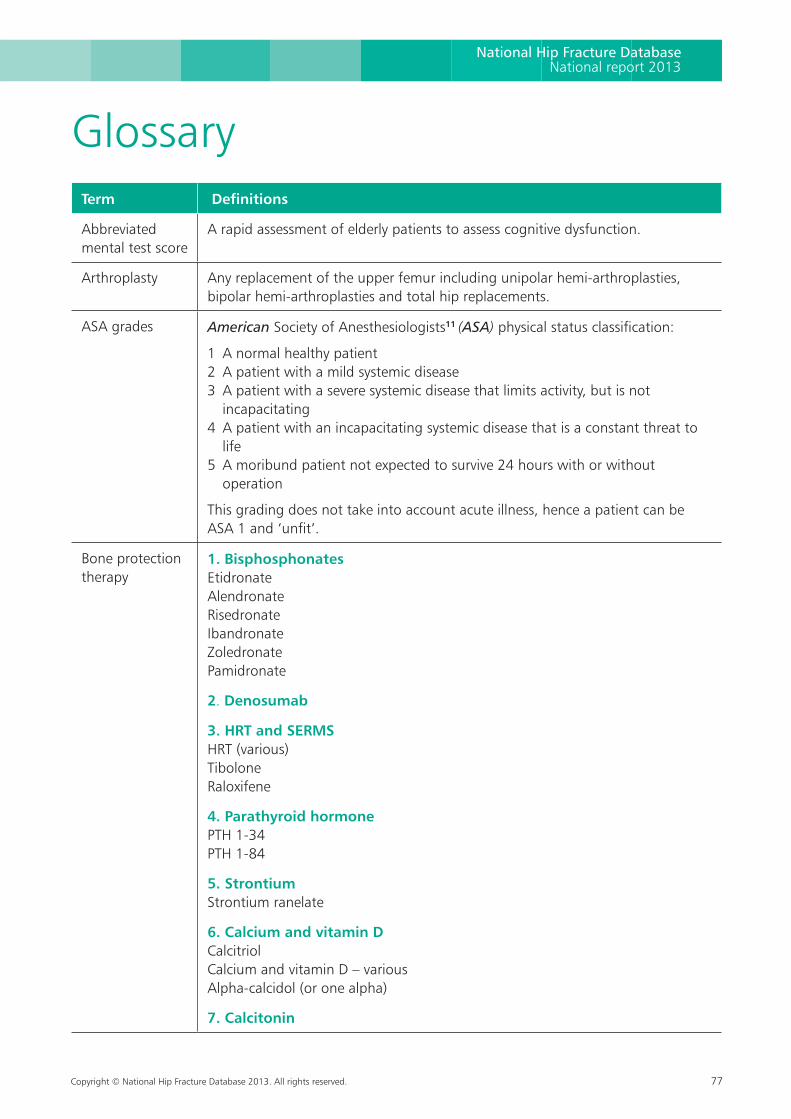
Copyright © National Hip Fracture Database 2013. All rights reserved. 77
National Hip Fracture DatabaseNational report 2013
GlossaryTerm Definitions
Abbreviated mental test score
A rapid assessment of elderly patients to assess cognitive dysfunction.
Arthroplasty Any replacement of the upper femur including unipolar hemi-arthroplasties, bipolar hemi-arthroplasties and total hip replacements.
ASA grades American Society of Anesthesiologists11 (ASA) physical status classification:
1 A normal healthy patient2 A patient with a mild systemic disease3 A patient with a severe systemic disease that limits activity, but is not
incapacitating4 A patient with an incapacitating systemic disease that is a constant threat to
life5 A moribund patient not expected to survive 24 hours with or without
operation
This grading does not take into account acute illness, hence a patient can be ASA 1 and ‘unfit’.
Bone protection therapy
1. Bisphosphonates EtidronateAlendronateRisedronateIbandronate ZoledronatePamidronate
2. Denosumab
3. HRT and SERMS HRT (various) Tibolone Raloxifene
4. Parathyroid hormone PTH 1-34 PTH 1-84
5. Strontium Strontium ranelate
6. Calcium and vitamin D Calcitriol Calcium and vitamin D – variousAlpha-calcidol (or one alpha)
7. Calcitonin
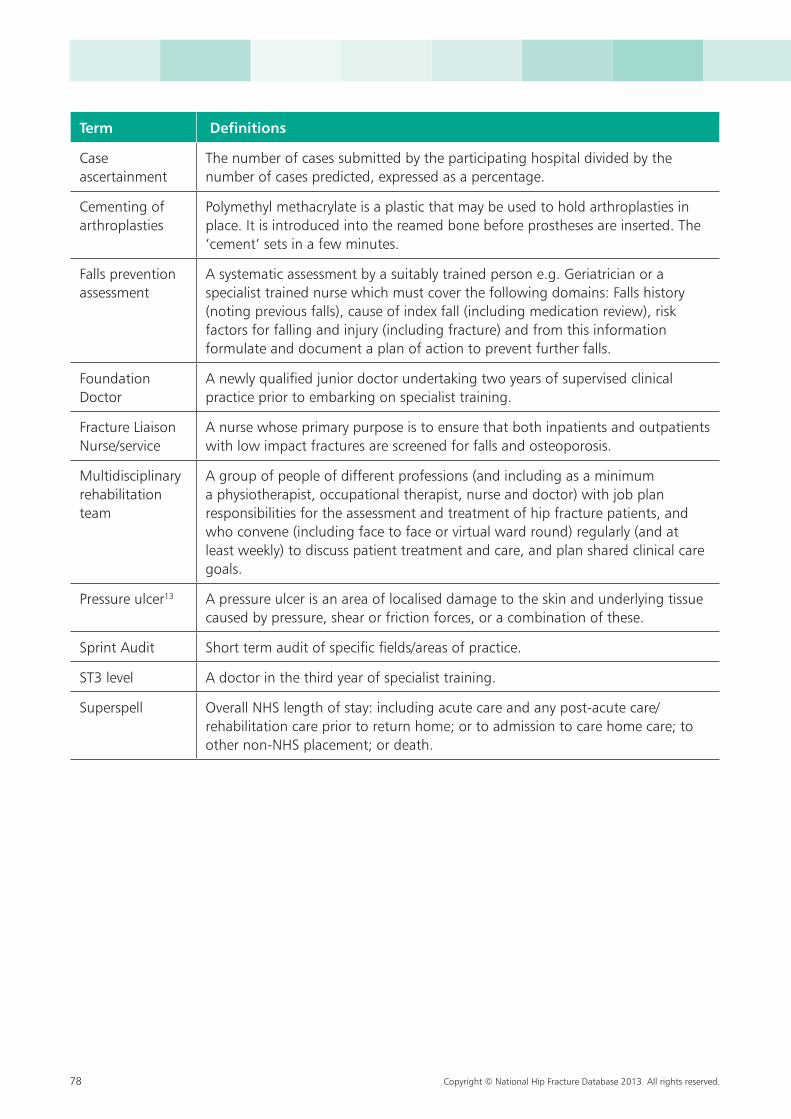
78 Copyright © National Hip Fracture Database 2013. All rights reserved.
Term Definitions
Case ascertainment
The number of cases submitted by the participating hospital divided by the number of cases predicted, expressed as a percentage.
Cementing of arthroplasties
Polymethyl methacrylate is a plastic that may be used to hold arthroplasties in place. It is introduced into the reamed bone before prostheses are inserted. The ‘cement’ sets in a few minutes.
Falls prevention assessment
A systematic assessment by a suitably trained person e.g. Geriatrician or a specialist trained nurse which must cover the following domains: Falls history (noting previous falls), cause of index fall (including medication review), risk factors for falling and injury (including fracture) and from this information formulate and document a plan of action to prevent further falls.
Foundation Doctor
A newly qualified junior doctor undertaking two years of supervised clinical practice prior to embarking on specialist training.
Fracture Liaison Nurse/service
A nurse whose primary purpose is to ensure that both inpatients and outpatients with low impact fractures are screened for falls and osteoporosis.
Multidisciplinary rehabilitation team
A group of people of different professions (and including as a minimum a physiotherapist, occupational therapist, nurse and doctor) with job plan responsibilities for the assessment and treatment of hip fracture patients, and who convene (including face to face or virtual ward round) regularly (and at least weekly) to discuss patient treatment and care, and plan shared clinical care goals.
Pressure ulcer13 A pressure ulcer is an area of localised damage to the skin and underlying tissue caused by pressure, shear or friction forces, or a combination of these.
Sprint Audit Short term audit of specific fields/areas of practice.
ST3 level A doctor in the third year of specialist training.
Superspell Overall NHS length of stay: including acute care and any post-acute care/rehabilitation care prior to return home; or to admission to care home care; to other non-NHS placement; or death.
Copyright © National Hip Fracture Database 2013. All rights reserved. 79
National Hip Fracture DatabaseNational report 2013
References 1. British Orthopaedic Association. The Care of patients with fragility fracture. Br Orthop Ass 2007.
Available from: http://www.boa.ac.uk
2. Best Practice Tariff. http://www.dh.gov.uk/health/2012/02/confirmation-pbr-arrangements/
3. National Institute for Clinical Excellence, 2011, www.nice.org.uk/guidance/CG124
4. National Institute for Clinical Excellence, 2012, www.nice.org.uk/guidance/QS16
5. Maxwell MJ, Moran CG, Moppett IK. Development and validation of a pre-operative scoring system to predict 30 day mortality in patients undergoing hip fracture surgery. Br J Anaesth 2008;101:511–
6. Griffiths, R et al. Management of proximal femoral fractures 2011. Anaesthesia 2012, vol 67, pp 85–98
7. Spiegelhalter, DJ. Funnel plots for comparing institutional performance. Statistics in Medicine 2005241185–1202
8. Handling over-dispersion of performance indicators. Spiegelhalter, DJ. 2005, Quality and Safety in Health Care, Vol. 14, p. 347.
9. Seaton SE, Barker L, Lingsma HF, Steyerberg EW, Manktelow BN. What is the probability of detecting poorly performing hospitals using funnel plots? BMJ Qual Saf bmjqs-2012-001689 Published Online First:5 July 2013
10. National Clinical Audit Advisory Group, for the Healthcare Quality Improvement Partnership (HQIP) and Department of Health. Detection and management of outliers. 2011.
11. American Society of Anaesthesiologists (1963). New classification of physical status. Anaesthesiology 1963 vol. 24 p111.
12. HES: http://www.hesonline.nhs.uk/Ease/servlet/ContentServer?siteID=1937
13. European Pressure Ulcer Advisory Panel (1999) Guidelines on treatment of pressure ulcers. EPUAP Review 1, 31–33
14. Clinical Commissioning Groups Outcomes Indicators Set http://www.england.nhs.uk/ccg-ois/
80 Copyright © National Hip Fracture Database 2013. All rights reserved.
Appendix A Using audit to improve care Improving care and achieving Best Practice Tariff: Airedale NHS Foundation Trust
In May of 2011 Airedale NHS Foundation Trust started an orthogeriatrics service. The specific aims of the service were to achieve Best Practice for patients with fracture neck of femurs based on the Blue Book indicators. The service started from a zero starting point, where no patients were submitted by Airedale NHS Foundation Trust to the National Hip Fracture Database.
The overall aim is to provide optimal medical, surgical and anaesthetic care to patients who have been part of the service.
The service is based on a small team, all located within the same site. This service has been implemented and grown considerably within the last 24 months, based on a strong multidisciplinary team ethic and close working between Geriatrics, Orthopaedics, Anaesthetics and Emergency Department. The Nurse specialist has been key to coordinating the links between the specialities.
The key to the success has been a neck of fracture trauma board and a neck of fracture spreadsheet being kept to highlight all the key indicators to be achieved.
Other initiatives have included close collaboration with the Emergency Department to ensure femoral nerve blocks are done to reduce opiate anaesthesia, nursing care pathways assist in the management of the patient and a neck of femur patient and relative information booklet.
This service has grown to achieve 70%, Best Practice in the first year .The subsequent year 2012–13 has shown a further improvement in the service to 79%. The length of stay in hospital for these patients has fallen significantly. In recognition of these achievements, the service was shortlisted for a Healthcare Innovations award in 2012.
Improving care and reducing time to theatre: North Manchester General Hospital
North Manchester General Hospital now accepts orthopaedic trauma for both North Manchester and Bury following a reconfiguration of services in March 2012. At this time there was Orthogeriatric cover for hip fracture patients for only 3 half days per week.
In order to improve the service, a Multidisciplinary Service Development Group (MSDG) was set up and we have now gained a full time Orthogeriatrics Consultant in February of this year and a (currently locum) Orthogeriatrics Speciality Doctor. The MSDG meets once a month to identify problems and provide solutions.
Our figures have improved dramatically. In June 2013 average time to theatre was 31 hours and average length of stay was 7 days compared to March 2012 when average time to theatre was 57 hours and length of stay 20 days.
Copyright © National Hip Fracture Database 2013. All rights reserved. 81
National Hip Fracture DatabaseNational report 2013
After attending the Northwest Hip Fracture Meeting in March 2013 the MSDG uses information from this day and continues to work on improving the service for our patients. Achievement of the Best Practice Tariff has improved from 10% in quarter 4 of 2012–13 (when there was no consistent OG cover) to 33% in quarter 1 of 2013–14.
Using audit data to improve practice: Calderdale and Huddersfield NHS Foundation Trust
In February 2010, Calderdale and Huddersfield NHS Foundation Trust (CHFT) appointed a dedicated Trauma Co-ordinator as a result of the Rapid Improvement Programme for Orthopaedics in 2008. This was increased to 1.6 whole time equivalent (WTE) in September 2011. Prior to February 2010, NHFD data entry was sporadic, as was data completeness. This was due to data collection not being the responsibility of a specific member of staff.
As is nationally expected, the number of fractured neck of femur patients has increased from 415 in 2009–10 to 477 in 2012–13. We currently have an average time to theatre of 33 hours and length of stay averages 22.7 days.
In March 2013, CHFT was highlighted as being an outlier of 30 day mortality at 13.1% in 2011–12. Once aware of this situation, we sought an external opinion for advice on where we could improve the care we provide. As a result, a multidisciplinary review lead by the British Orthopaedic Association was instigated. They visited in May 2013, and after a review of data and documentation, key staff were interviewed. The following day, feedback was provided.
As a Trust, we felt both inspired and invigorated by their positive, supportive outlook. Current good practice in the ward environment was complimented upon. They also acknowledged that changes had already been made and suggested other areas worth considering for improvement.
Whilst we await formal feedback, our practices continue to evolve, and we look forward to reporting significant improvements in the near future.
Improving care: University Hospital Lewisham
Following significant delays in times to theatre in 2010 and early 2011, the pre-operative assessment of the patients was changed to include the outreach consultant anaesthetist as well as consultant orthogeriatrician, to ensure optimisation to theatre and to plan post-operative care. In addition integration with community providers has allowed in-reach of teams to allow earlier supported discharge.
In 2011/12 an average of 62% of patients were in theatre within 36 hours. Delays were due to lack of theatre space and medically unfit. In 2012–13 75% of patients to theatre within 36 hours.
63% of patients are discharged straight back to their own home compared to 42% in 2010–11, with an average length of stay reduced 5 days to 18.4 days in 2011–12 compared to 24.1 days in 2010–11 and readmissions have almost halved (16% to 8.8%).
82 Copyright © National Hip Fracture Database 2013. All rights reserved.
Improving care and reducing length of stay: James Cook Hospital
In September 2012 a generic multi-speciality trauma admissions unit underwent a transition to a dedicated hip fracture ward. Communication in discharge planning has been improved through single site physiotherapy and occupational therapy teams, a ward-based social worker, daily MDT meetings with input from an Orthogeriatrician.
The morning trauma meeting has moved, and the hip fracture unit is visited first on the daily trauma round – to enable senior decision makers to integrate with ward staff and the anaesthetic team in coordination of care.
A change of approach across many domains has led to:
• average acute LOS decreasing by 6 days in the first six months from 20 days to 14 days
• 40% of patients return directly home from the acute ward, but this is achieved earlier 11.5 days compared to 16 day previously
• a further 35% of patients return to their original residence after rehabilitation in one of the community hospitals
• risk of pressure sores and inpatient falls both appear to have been reduced by single site care.
Improving care and reducing pressure ulcer incidence: Royal Liverpool University Hospital
The Royal Liverpool University Hospital first joined the NHFD back in 2008. In 2010 NHFD report we found 7% patients developing pressure ulcers (national 3.9%). A multidisciplinary team initiative was set up resulting in 0.9% patients developing pressure ulcers by 2012.
Our project ‘Sustaining the reduction of pressure ulcers in patients with hip fracture’ was recently awarded the ‘Eva Higgins Prize’ at the British Geriatrics Society Scientific meeting.
The NHFD has provided us with a great platform for improvements; we present our data monthly to our orthopaedic trauma directorate and aim to constantly improve the care we deliver with monthly action plans.
Not only have we seen year by year improvements in best practice in the form of Blue Book Standards/Best Practice Tariff but also multiple other areas for example dementia care, continence care and improvements in nutrition for patients with hip fractures.
This has all been achieved through extensive collaborative work.
Improving care and reducing time to theatre: Royal Devon and Exeter Hospital
In the last quarter of 2012, 75% of patients from the Exeter Hip Fracture Service at the Royal Devon and Exeter Hospital had surgery within 36 hours of admission. 25% of patients did not reach theatre within this time, either due to lack of theatre time (12% of the total) or due to fitness for surgery (12%), which included patients previously on warfarin awaiting surgery.
Copyright © National Hip Fracture Database 2013. All rights reserved. 83
National Hip Fracture DatabaseNational report 2013
Since January 2013, an early start initiative for the operative list was implemented in our trauma theatre, optimizing its utilization from 8:00 every morning and prioritizing hip fracture patients as first cases. These procedures are performed or supervised by an experienced surgeon whilst the post-take ward round and meeting normally take place.
In February 2013 a formal audit of compliance to our Trust guidelines for reversal of warfarinisation was also carried out for this group of patients, aiming towards prompt action as soon as a hip fracture is diagnosed, identifying correctable delays in the process and leading to shorter reversal periods of anticoagulation.
These implementations, amongst others, have contributed towards an improvement in the percentage of patients reaching theatres within 36 hours. The figure for the month of April improved to 93%.
Improving care: Pilgrim Hospital, Boston
The last 12 months have seen major improvements in outcomes and patient experience. An Orthopaedics Associate Specialist with a real commitment has taken on a Lead Clinician role as a champion for patients with hip fracture. Three new morning trauma lists to supplement the previous five afternoon week-day lists, and extended week-end trauma lists have played an important role in minimising delays.
Patients are admitted by on-call teams prompt, receive prompt pre-op. optimisation by Trauma Coordinators, Anaesthetists and the Orthopaedic Specialist, are listed first on dedicated trauma lists with Consultant Anaesthetists and Senior Surgeons operating or supervising trainees, and transfer to the care of the multidisciplinary Hip Fracture Service team post-op.
With the support of the Orthogeriatrician the Orthopaedic Specialist carries out robust ward rounds every day, and monitors the progress of post-op. patients.
As a consequence Pilgrim hospital is achieving BPT for most hip fracture patients, and has seen:
• a one day reduction in time-to-theatre from 42.5 hours last year 18.4 hours recently
• a four day reduction in the length of stay
• a halving of 30 day mortality from 15% to 7.4%
Improving care: East Lancashire Hospitals NHS Trust
East Lancashire Hospitals NHS Trust has contributed to the NHFD with a high case ascertainment for past 3 years. Over this time period, there has been the introduction of an integrated care pathway, fracture neck femur care bundle, a fast tracking system, and a dedicated hip fracture unit in a 46 bed trauma ward
2 consultant orthogeriatricians provide perioperative care through daily ward rounds (Mon-Fri), coordinate rehabilitation and discharge through weekly multidisciplinary case conferences, undertake fall and bone health clinics; and lead the fracture liaison service.
84 Copyright © National Hip Fracture Database 2013. All rights reserved.
The recent introduction of a clinical group comprising orthopaedic surgeons and orthogeriatricians (with anaesthetic involvement as required) undertaking joint primary and secondary mortality reviews allows us to monitor our mortality and morbidity. In addition this group helps share good practice and lessons to be learnt.
Over the last three years we have consistently improved our Best Practice Tariff standards from 15.62% in 2010–11 to 65.33% in 2011–12 and 73% in 2012–13. There has been consistent improvement in five out of six standards year on year for last three years. The platform has identified the main areas for improvement including length of stay and unexpected variation in mortality which may require further detailed investigation.
In line with current Department of Health directives, we have improved the ward environment and care of patients suffering from delirium and dementia; with a designated bay and increased nursing support for these particularly vulnerable patients.
Improving Care: The Royal Hampshire County Hospital
The Royal Hampshire County Hospital (Hampshire Hospitals Foundation Trust) started implementation of an Enhanced Recovery (ER) Pathway for patients with a hip fracture in February 2012.
The #NOF Enhanced Recovery pathway utilises the principles of ER, but key details of the pathway that support the care and management of patients presenting with a hip fracture are:
• GP’s summary notes obtained on admission
• minimum fasting pre-operatively with administration of pre-op drinks (fast from food for 6 hours, and clear fluids for 2 hours) Oral intake encouraged as soon as possible post operatively so avoiding iv fluids where possible
• Hb results are obtained within an hour on day 1 to facilitate mobility.
• joint therapy working enhancing rehabilitation.
Using these principles for care delivery there has been a reduction in acute length of stay by a day.
Time from admission to surgery has reduced by 6.39 hours to 19.95 hours, and 72% of patients return to their preadmission residence as against 55% at the start of this work.
Improving Care: Worthing Hospital
Worthing Hospital treats between 400 and 500 hip fractures annually from an elderly population with high levels of comorbidity. Data collated by The National Hip Fracture Database (NHFD) and Dr. Foster in early 2011 identified a higher than expected hospital standardised mortality ratio (HSMR) after hip fracture.
As a result, the hip fracture pathway was redesigned according to practice recommendations from the National Institute for Health and Clinical Excellence (NICE) and the British Orthopaedic Association / British Geriatrics Society ‘Blue book’.
Copyright © National Hip Fracture Database 2013. All rights reserved. 85
National Hip Fracture DatabaseNational report 2013
The effect of practice change on outcomes and quality indicators such as mortality and length of stay (LOS) after hip fracture was analysed.
Changes to the patient pathway included
• admitted under geriatrician to ward specialising in perioperative hip fracture care
• pre operative Orthogeriatrician review
• prioritised for all day trauma list
• on-site rehabilitation
There was a significant drop in mean LOS (from 28 to 21 days) and mean time to surgery (42 to 28 hours) as well as time to orthogeriatric assessment. There was no significant difference in crude mortality between groups but the HSMR dropped to the expected level. The post intervention group had significantly higher numbers of patients over the age of 90 and with ASA >_3.
Implementing an effective orthogeriatric pathway at our hospital has resulted in significant improvements in clinical outcomes and quality indicators despite an increase in the complexity of an already challenging case mix.
Benchmarking data from national databases such as the NHFD and Dr. Foster may be used to facilitate improvement in service delivery. However, careful examination of local data is still important to correct discrepancies, adjust for local case mix and account for the differences in methodology used by these organisations.
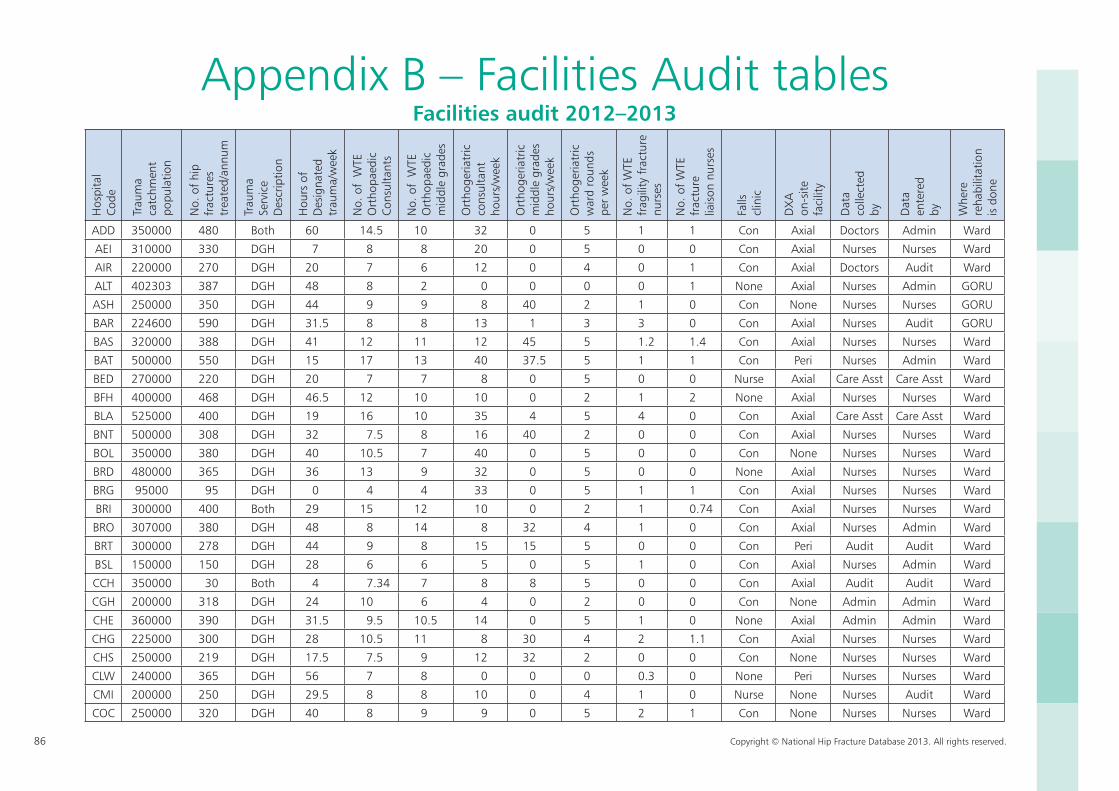
86 Copyright © National Hip Fracture Database 2013. All rights reserved.
Hos
pita
lCo
de
Trau
ma
catc
hmen
tpo
pula
tion
No.
of
hip
frac
ture
str
eate
d/an
num
Trau
ma
Serv
ice
Des
crip
tion
Hou
rs o
fD
esig
nate
dtr
aum
a/w
eek
No.
of
WTE
O
rtho
paed
icCo
nsul
tant
s
No.
of
WTE
O
rtho
paed
icm
iddl
e gr
ades
Ort
hoge
riatr
icco
nsul
tant
ho
urs/
wee
k
Ort
hoge
riatr
icm
iddl
e gr
ades
hour
s/w
eek
Ort
hoge
riatr
icw
ard
roun
ds
per
wee
k
No.
of
WTE
frag
ility
fra
ctur
enu
rses
No.
of
WTE
frac
ture
liais
on n
urse
s
Falls
clin
ic
DX
Aon
-site
faci
lity
Dat
aco
llect
edby D
ata
ente
red
by Whe
rere
habi
litat
ion
is d
one
ADD 350000 480 Both 60 14.5 10 32 0 5 1 1 Con Axial Doctors Admin Ward
AEI 310000 330 DGH 7 8 8 20 0 5 0 0 Con Axial Nurses Nurses Ward
AIR 220000 270 DGH 20 7 6 12 0 4 0 1 Con Axial Doctors Audit Ward
ALT 402303 387 DGH 48 8 2 0 0 0 0 1 None Axial Nurses Admin GORU
ASH 250000 350 DGH 44 9 9 8 40 2 1 0 Con None Nurses Nurses GORU
BAR 224600 590 DGH 31.5 8 8 13 1 3 3 0 Con Axial Nurses Audit GORU
BAS 320000 388 DGH 41 12 11 12 45 5 1.2 1.4 Con Axial Nurses Nurses Ward
BAT 500000 550 DGH 15 17 13 40 37.5 5 1 1 Con Peri Nurses Admin Ward
BED 270000 220 DGH 20 7 7 8 0 5 0 0 Nurse Axial Care Asst Care Asst Ward
BFH 400000 468 DGH 46.5 12 10 10 0 2 1 2 None Axial Nurses Nurses Ward
BLA 525000 400 DGH 19 16 10 35 4 5 4 0 Con Axial Care Asst Care Asst Ward
BNT 500000 308 DGH 32 7.5 8 16 40 2 0 0 Con Axial Nurses Nurses Ward
BOL 350000 380 DGH 40 10.5 7 40 0 5 0 0 Con None Nurses Nurses Ward
BRD 480000 365 DGH 36 13 9 32 0 5 0 0 None Axial Nurses Nurses Ward
BRG 95000 95 DGH 0 4 4 33 0 5 1 1 Con Axial Nurses Nurses Ward
BRI 300000 400 Both 29 15 12 10 0 2 1 0.74 Con Axial Nurses Nurses Ward
BRO 307000 380 DGH 48 8 14 8 32 4 1 0 Con Axial Nurses Admin Ward
BRT 300000 278 DGH 44 9 8 15 15 5 0 0 Con Peri Audit Audit Ward
BSL 150000 150 DGH 28 6 6 5 0 5 1 0 Con Axial Nurses Admin Ward
CCH 350000 30 Both 4 7.34 7 8 8 5 0 0 Con Axial Audit Audit Ward
CGH 200000 318 DGH 24 10 6 4 0 2 0 0 Con None Admin Admin Ward
CHE 360000 390 DGH 31.5 9.5 10.5 14 0 5 1 0 None Axial Admin Admin Ward
CHG 225000 300 DGH 28 10.5 11 8 30 4 2 1.1 Con Axial Nurses Nurses Ward
CHS 250000 219 DGH 17.5 7.5 9 12 32 2 0 0 Con None Nurses Nurses Ward
CLW 240000 365 DGH 56 7 8 0 0 0 0.3 0 None Peri Nurses Nurses Ward
CMI 200000 250 DGH 29.5 8 8 10 0 4 1 0 Nurse None Nurses Audit Ward
COC 250000 320 DGH 40 8 9 9 0 5 2 1 Con None Nurses Nurses Ward
Appendix B – Facilities Audit tables Facilities audit 2012–2013
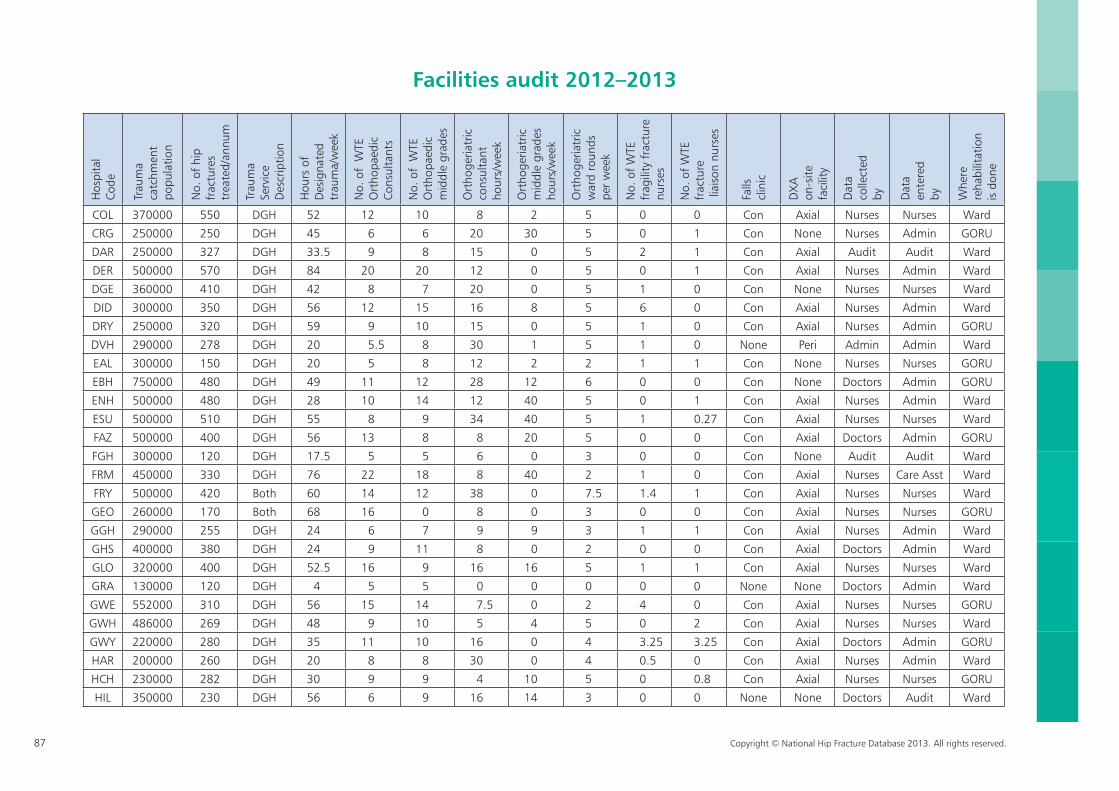
87 Copyright © National Hip Fracture Database 2013. All rights reserved.
Hos
pita
lCo
de
Trau
ma
catc
hmen
tpo
pula
tion
No.
of
hip
frac
ture
str
eate
d/an
num
Trau
ma
Serv
ice
Des
crip
tion
Hou
rs o
fD
esig
nate
dtr
aum
a/w
eek
No.
of
WTE
O
rtho
paed
icCo
nsul
tant
s
No.
of
WTE
O
rtho
paed
icm
iddl
e gr
ades
Ort
hoge
riatr
icco
nsul
tant
ho
urs/
wee
k
Ort
hoge
riatr
icm
iddl
e gr
ades
hour
s/w
eek
Ort
hoge
riatr
icw
ard
roun
ds
per
wee
k
No.
of
WTE
frag
ility
fra
ctur
enu
rses
No.
of
WTE
frac
ture
liais
on n
urse
s
Falls
clin
ic
DX
Aon
-site
faci
lity
Dat
aco
llect
edby D
ata
ente
red
by Whe
rere
habi
litat
ion
is d
one
ADD 350000 480 Both 60 14.5 10 32 0 5 1 1 Con Axial Doctors Admin Ward
AEI 310000 330 DGH 7 8 8 20 0 5 0 0 Con Axial Nurses Nurses Ward
AIR 220000 270 DGH 20 7 6 12 0 4 0 1 Con Axial Doctors Audit Ward
ALT 402303 387 DGH 48 8 2 0 0 0 0 1 None Axial Nurses Admin GORU
ASH 250000 350 DGH 44 9 9 8 40 2 1 0 Con None Nurses Nurses GORU
BAR 224600 590 DGH 31.5 8 8 13 1 3 3 0 Con Axial Nurses Audit GORU
BAS 320000 388 DGH 41 12 11 12 45 5 1.2 1.4 Con Axial Nurses Nurses Ward
BAT 500000 550 DGH 15 17 13 40 37.5 5 1 1 Con Peri Nurses Admin Ward
BED 270000 220 DGH 20 7 7 8 0 5 0 0 Nurse Axial Care Asst Care Asst Ward
BFH 400000 468 DGH 46.5 12 10 10 0 2 1 2 None Axial Nurses Nurses Ward
BLA 525000 400 DGH 19 16 10 35 4 5 4 0 Con Axial Care Asst Care Asst Ward
BNT 500000 308 DGH 32 7.5 8 16 40 2 0 0 Con Axial Nurses Nurses Ward
BOL 350000 380 DGH 40 10.5 7 40 0 5 0 0 Con None Nurses Nurses Ward
BRD 480000 365 DGH 36 13 9 32 0 5 0 0 None Axial Nurses Nurses Ward
BRG 95000 95 DGH 0 4 4 33 0 5 1 1 Con Axial Nurses Nurses Ward
BRI 300000 400 Both 29 15 12 10 0 2 1 0.74 Con Axial Nurses Nurses Ward
BRO 307000 380 DGH 48 8 14 8 32 4 1 0 Con Axial Nurses Admin Ward
BRT 300000 278 DGH 44 9 8 15 15 5 0 0 Con Peri Audit Audit Ward
BSL 150000 150 DGH 28 6 6 5 0 5 1 0 Con Axial Nurses Admin Ward
CCH 350000 30 Both 4 7.34 7 8 8 5 0 0 Con Axial Audit Audit Ward
CGH 200000 318 DGH 24 10 6 4 0 2 0 0 Con None Admin Admin Ward
CHE 360000 390 DGH 31.5 9.5 10.5 14 0 5 1 0 None Axial Admin Admin Ward
CHG 225000 300 DGH 28 10.5 11 8 30 4 2 1.1 Con Axial Nurses Nurses Ward
CHS 250000 219 DGH 17.5 7.5 9 12 32 2 0 0 Con None Nurses Nurses Ward
CLW 240000 365 DGH 56 7 8 0 0 0 0.3 0 None Peri Nurses Nurses Ward
CMI 200000 250 DGH 29.5 8 8 10 0 4 1 0 Nurse None Nurses Audit Ward
COC 250000 320 DGH 40 8 9 9 0 5 2 1 Con None Nurses Nurses Ward
Hos
pita
lCo
de
Trau
ma
catc
hmen
tpo
pula
tion
No.
of
hip
frac
ture
str
eate
d/an
num
Trau
ma
Serv
ice
Des
crip
tion
Hou
rs o
fD
esig
nate
dtr
aum
a/w
eek
No.
of
WTE
O
rtho
paed
icCo
nsul
tant
s
No.
of
WTE
O
rtho
paed
icm
iddl
e gr
ades
Ort
hoge
riatr
icco
nsul
tant
ho
urs/
wee
k
Ort
hoge
riatr
icm
iddl
e gr
ades
hour
s/w
eek
Ort
hoge
riatr
icw
ard
roun
ds
per
wee
k
No.
of
WTE
frag
ility
fra
ctur
enu
rses
No.
of
WTE
frac
ture
liai
son
nurs
es
Falls
clin
ic
DX
Aon
-site
faci
lity
Dat
aco
llect
edby D
ata
ente
red
by Whe
rere
habi
litat
ion
is d
one
COL 370000 550 DGH 52 12 10 8 2 5 0 0 Con Axial Nurses Nurses Ward
CRG 250000 250 DGH 45 6 6 20 30 5 0 1 Con None Nurses Admin GORU
DAR 250000 327 DGH 33.5 9 8 15 0 5 2 1 Con Axial Audit Audit Ward
DER 500000 570 DGH 84 20 20 12 0 5 0 1 Con Axial Nurses Admin Ward
DGE 360000 410 DGH 42 8 7 20 0 5 1 0 Con None Nurses Nurses Ward
DID 300000 350 DGH 56 12 15 16 8 5 6 0 Con Axial Nurses Admin Ward
DRY 250000 320 DGH 59 9 10 15 0 5 1 0 Con Axial Nurses Admin GORU
DVH 290000 278 DGH 20 5.5 8 30 1 5 1 0 None Peri Admin Admin Ward
EAL 300000 150 DGH 20 5 8 12 2 2 1 1 Con None Nurses Nurses GORU
EBH 750000 480 DGH 49 11 12 28 12 6 0 0 Con None Doctors Admin GORU
ENH 500000 480 DGH 28 10 14 12 40 5 0 1 Con Axial Nurses Admin Ward
ESU 500000 510 DGH 55 8 9 34 40 5 1 0.27 Con Axial Nurses Nurses Ward
FAZ 500000 400 DGH 56 13 8 8 20 5 0 0 Con Axial Doctors Admin GORU
FGH 300000 120 DGH 17.5 5 5 6 0 3 0 0 Con None Audit Audit Ward
FRM 450000 330 DGH 76 22 18 8 40 2 1 0 Con Axial Nurses Care Asst Ward
FRY 500000 420 Both 60 14 12 38 0 7.5 1.4 1 Con Axial Nurses Nurses Ward
GEO 260000 170 Both 68 16 0 8 0 3 0 0 Con Axial Nurses Nurses GORU
GGH 290000 255 DGH 24 6 7 9 9 3 1 1 Con Axial Nurses Admin Ward
GHS 400000 380 DGH 24 9 11 8 0 2 0 0 Con Axial Doctors Admin Ward
GLO 320000 400 DGH 52.5 16 9 16 16 5 1 1 Con Axial Nurses Nurses Ward
GRA 130000 120 DGH 4 5 5 0 0 0 0 0 None None Doctors Admin Ward
GWE 552000 310 DGH 56 15 14 7.5 0 2 4 0 Con Axial Nurses Nurses GORU
GWH 486000 269 DGH 48 9 10 5 4 5 0 2 Con Axial Nurses Nurses Ward
GWY 220000 280 DGH 35 11 10 16 0 4 3.25 3.25 Con Axial Doctors Admin GORU
HAR 200000 260 DGH 20 8 8 30 0 4 0.5 0 Con Axial Nurses Admin Ward
HCH 230000 282 DGH 30 9 9 4 10 5 0 0.8 Con Axial Nurses Nurses GORU
HIL 350000 230 DGH 56 6 9 16 14 3 0 0 None None Doctors Audit Ward
Facilities audit 2012–2013
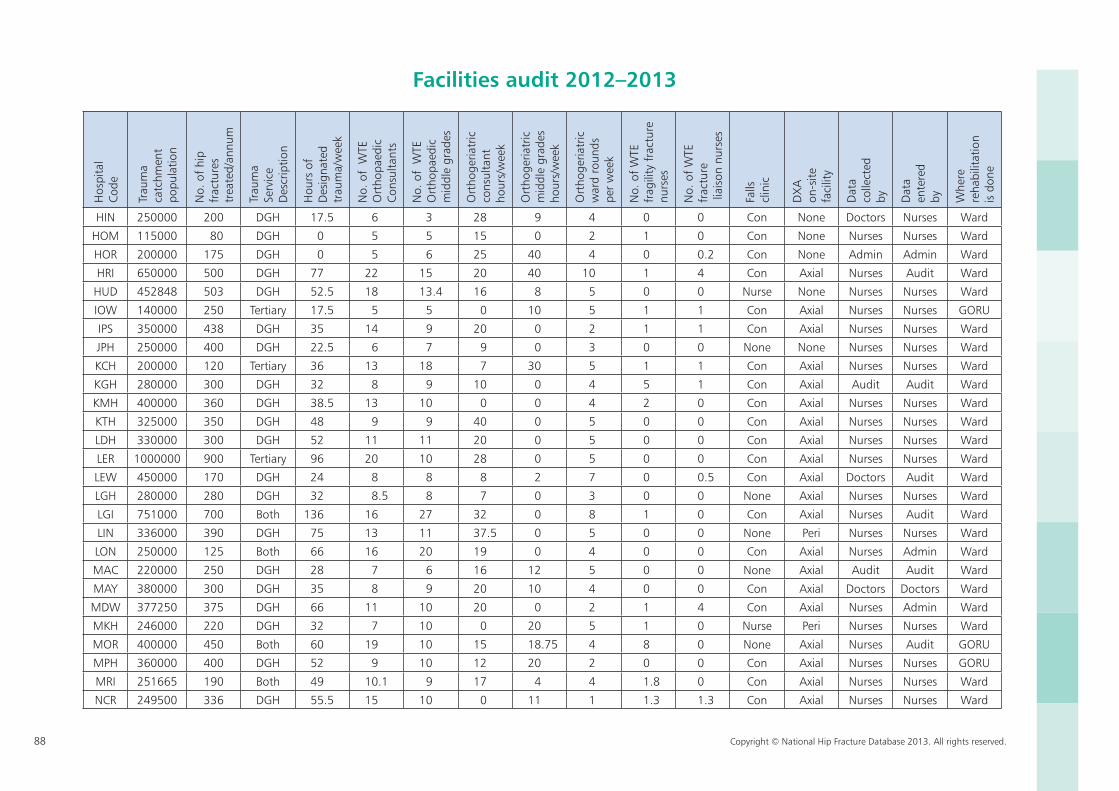
88 Copyright © National Hip Fracture Database 2013. All rights reserved.
Hos
pita
lCo
de
Trau
ma
catc
hmen
tpo
pula
tion
No.
of
hip
frac
ture
str
eate
d/an
num
Trau
ma
Serv
ice
Des
crip
tion
Hou
rs o
fD
esig
nate
dtr
aum
a/w
eek
No.
of
WTE
O
rtho
paed
icCo
nsul
tant
s
No.
of
WTE
O
rtho
paed
icm
iddl
e gr
ades
Ort
hoge
riatr
icco
nsul
tant
ho
urs/
wee
k
Ort
hoge
riatr
icm
iddl
e gr
ades
hour
s/w
eek
Ort
hoge
riatr
icw
ard
roun
ds
per
wee
k
No.
of
WTE
frag
ility
fra
ctur
enu
rses
No.
of
WTE
frac
ture
liai
son
nurs
es
Falls
clin
ic
DX
Aon
-site
faci
lity
Dat
aco
llect
edby D
ata
ente
red
by Whe
rere
habi
litat
ion
is d
one
HIN 250000 200 DGH 17.5 6 3 28 9 4 0 0 Con None Doctors Nurses Ward
HOM 115000 80 DGH 0 5 5 15 0 2 1 0 Con None Nurses Nurses Ward
HOR 200000 175 DGH 0 5 6 25 40 4 0 0.2 Con None Admin Admin Ward
HRI 650000 500 DGH 77 22 15 20 40 10 1 4 Con Axial Nurses Audit Ward
HUD 452848 503 DGH 52.5 18 13.4 16 8 5 0 0 Nurse None Nurses Nurses Ward
IOW 140000 250 Tertiary 17.5 5 5 0 10 5 1 1 Con Axial Nurses Nurses GORU
IPS 350000 438 DGH 35 14 9 20 0 2 1 1 Con Axial Nurses Nurses Ward
JPH 250000 400 DGH 22.5 6 7 9 0 3 0 0 None None Nurses Nurses Ward
KCH 200000 120 Tertiary 36 13 18 7 30 5 1 1 Con Axial Nurses Nurses Ward
KGH 280000 300 DGH 32 8 9 10 0 4 5 1 Con Axial Audit Audit Ward
KMH 400000 360 DGH 38.5 13 10 0 0 4 2 0 Con Axial Nurses Nurses Ward
KTH 325000 350 DGH 48 9 9 40 0 5 0 0 Con Axial Nurses Nurses Ward
LDH 330000 300 DGH 52 11 11 20 0 5 0 0 Con Axial Nurses Nurses Ward
LER 1000000 900 Tertiary 96 20 10 28 0 5 0 0 Con Axial Nurses Nurses Ward
LEW 450000 170 DGH 24 8 8 8 2 7 0 0.5 Con Axial Doctors Audit Ward
LGH 280000 280 DGH 32 8.5 8 7 0 3 0 0 None Axial Nurses Nurses Ward
LGI 751000 700 Both 136 16 27 32 0 8 1 0 Con Axial Nurses Audit Ward
LIN 336000 390 DGH 75 13 11 37.5 0 5 0 0 None Peri Nurses Nurses Ward
LON 250000 125 Both 66 16 20 19 0 4 0 0 Con Axial Nurses Admin Ward
MAC 220000 250 DGH 28 7 6 16 12 5 0 0 None Axial Audit Audit Ward
MAY 380000 300 DGH 35 8 9 20 10 4 0 0 Con Axial Doctors Doctors Ward
MDW 377250 375 DGH 66 11 10 20 0 2 1 4 Con Axial Nurses Admin Ward
MKH 246000 220 DGH 32 7 10 0 20 5 1 0 Nurse Peri Nurses Nurses Ward
MOR 400000 450 Both 60 19 10 15 18.75 4 8 0 None Axial Nurses Audit GORU
MPH 360000 400 DGH 52 9 10 12 20 2 0 0 Con Axial Nurses Nurses GORU
MRI 251665 190 Both 49 10.1 9 17 4 4 1.8 0 Con Axial Nurses Nurses Ward
NCR 249500 336 DGH 55.5 15 10 0 11 1 1.3 1.3 Con Axial Nurses Nurses Ward
Facilities audit 2012–2013
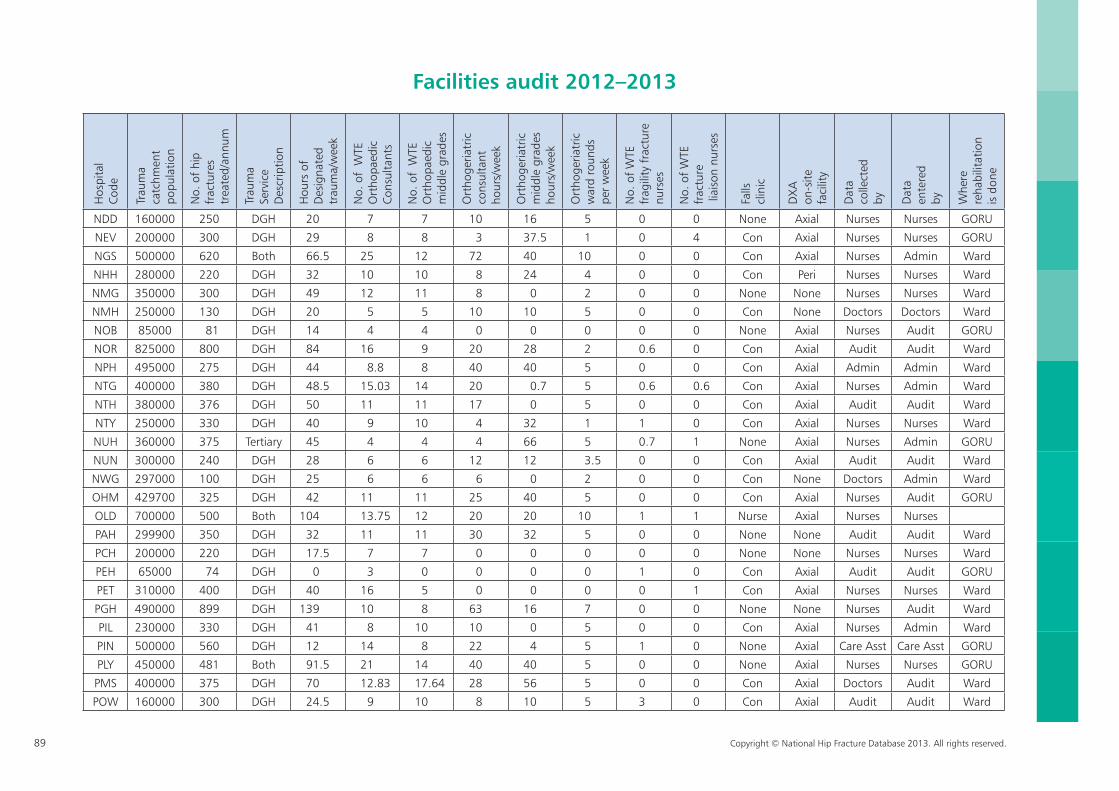
89 Copyright © National Hip Fracture Database 2013. All rights reserved.
Hos
pita
lCo
de
Trau
ma
catc
hmen
tpo
pula
tion
No.
of
hip
frac
ture
str
eate
d/an
num
Trau
ma
Serv
ice
Des
crip
tion
Hou
rs o
fD
esig
nate
dtr
aum
a/w
eek
No.
of
WTE
O
rtho
paed
icCo
nsul
tant
s
No.
of
WTE
O
rtho
paed
icm
iddl
e gr
ades
Ort
hoge
riatr
icco
nsul
tant
ho
urs/
wee
k
Ort
hoge
riatr
icm
iddl
e gr
ades
hour
s/w
eek
Ort
hoge
riatr
icw
ard
roun
ds
per
wee
k
No.
of
WTE
frag
ility
fra
ctur
enu
rses
No.
of
WTE
frac
ture
liai
son
nurs
es
Falls
clin
ic
DX
Aon
-site
faci
lity
Dat
aco
llect
edby D
ata
ente
red
by Whe
rere
habi
litat
ion
is d
one
HIN 250000 200 DGH 17.5 6 3 28 9 4 0 0 Con None Doctors Nurses Ward
HOM 115000 80 DGH 0 5 5 15 0 2 1 0 Con None Nurses Nurses Ward
HOR 200000 175 DGH 0 5 6 25 40 4 0 0.2 Con None Admin Admin Ward
HRI 650000 500 DGH 77 22 15 20 40 10 1 4 Con Axial Nurses Audit Ward
HUD 452848 503 DGH 52.5 18 13.4 16 8 5 0 0 Nurse None Nurses Nurses Ward
IOW 140000 250 Tertiary 17.5 5 5 0 10 5 1 1 Con Axial Nurses Nurses GORU
IPS 350000 438 DGH 35 14 9 20 0 2 1 1 Con Axial Nurses Nurses Ward
JPH 250000 400 DGH 22.5 6 7 9 0 3 0 0 None None Nurses Nurses Ward
KCH 200000 120 Tertiary 36 13 18 7 30 5 1 1 Con Axial Nurses Nurses Ward
KGH 280000 300 DGH 32 8 9 10 0 4 5 1 Con Axial Audit Audit Ward
KMH 400000 360 DGH 38.5 13 10 0 0 4 2 0 Con Axial Nurses Nurses Ward
KTH 325000 350 DGH 48 9 9 40 0 5 0 0 Con Axial Nurses Nurses Ward
LDH 330000 300 DGH 52 11 11 20 0 5 0 0 Con Axial Nurses Nurses Ward
LER 1000000 900 Tertiary 96 20 10 28 0 5 0 0 Con Axial Nurses Nurses Ward
LEW 450000 170 DGH 24 8 8 8 2 7 0 0.5 Con Axial Doctors Audit Ward
LGH 280000 280 DGH 32 8.5 8 7 0 3 0 0 None Axial Nurses Nurses Ward
LGI 751000 700 Both 136 16 27 32 0 8 1 0 Con Axial Nurses Audit Ward
LIN 336000 390 DGH 75 13 11 37.5 0 5 0 0 None Peri Nurses Nurses Ward
LON 250000 125 Both 66 16 20 19 0 4 0 0 Con Axial Nurses Admin Ward
MAC 220000 250 DGH 28 7 6 16 12 5 0 0 None Axial Audit Audit Ward
MAY 380000 300 DGH 35 8 9 20 10 4 0 0 Con Axial Doctors Doctors Ward
MDW 377250 375 DGH 66 11 10 20 0 2 1 4 Con Axial Nurses Admin Ward
MKH 246000 220 DGH 32 7 10 0 20 5 1 0 Nurse Peri Nurses Nurses Ward
MOR 400000 450 Both 60 19 10 15 18.75 4 8 0 None Axial Nurses Audit GORU
MPH 360000 400 DGH 52 9 10 12 20 2 0 0 Con Axial Nurses Nurses GORU
MRI 251665 190 Both 49 10.1 9 17 4 4 1.8 0 Con Axial Nurses Nurses Ward
NCR 249500 336 DGH 55.5 15 10 0 11 1 1.3 1.3 Con Axial Nurses Nurses Ward
Hos
pita
lCo
de
Trau
ma
catc
hmen
tpo
pula
tion
No.
of
hip
frac
ture
str
eate
d/an
num
Trau
ma
Serv
ice
Des
crip
tion
Hou
rs o
fD
esig
nate
dtr
aum
a/w
eek
No.
of
WTE
O
rtho
paed
icCo
nsul
tant
s
No.
of
WTE
O
rtho
paed
icm
iddl
e gr
ades
Ort
hoge
riatr
icco
nsul
tant
ho
urs/
wee
k
Ort
hoge
riatr
icm
iddl
e gr
ades
hour
s/w
eek
Ort
hoge
riatr
icw
ard
roun
ds
per
wee
k
No.
of
WTE
frag
ility
fra
ctur
enu
rses
No.
of
WTE
frac
ture
liai
son
nurs
es
Falls
clin
ic
DX
Aon
-site
faci
lity
Dat
aco
llect
edby D
ata
ente
red
by Whe
rere
habi
litat
ion
is d
one
NDD 160000 250 DGH 20 7 7 10 16 5 0 0 None Axial Nurses Nurses GORU
NEV 200000 300 DGH 29 8 8 3 37.5 1 0 4 Con Axial Nurses Nurses GORU
NGS 500000 620 Both 66.5 25 12 72 40 10 0 0 Con Axial Nurses Admin Ward
NHH 280000 220 DGH 32 10 10 8 24 4 0 0 Con Peri Nurses Nurses Ward
NMG 350000 300 DGH 49 12 11 8 0 2 0 0 None None Nurses Nurses Ward
NMH 250000 130 DGH 20 5 5 10 10 5 0 0 Con None Doctors Doctors Ward
NOB 85000 81 DGH 14 4 4 0 0 0 0 0 None Axial Nurses Audit GORU
NOR 825000 800 DGH 84 16 9 20 28 2 0.6 0 Con Axial Audit Audit Ward
NPH 495000 275 DGH 44 8.8 8 40 40 5 0 0 Con Axial Admin Admin Ward
NTG 400000 380 DGH 48.5 15.03 14 20 0.7 5 0.6 0.6 Con Axial Nurses Admin Ward
NTH 380000 376 DGH 50 11 11 17 0 5 0 0 Con Axial Audit Audit Ward
NTY 250000 330 DGH 40 9 10 4 32 1 1 0 Con Axial Nurses Nurses Ward
NUH 360000 375 Tertiary 45 4 4 4 66 5 0.7 1 None Axial Nurses Admin GORU
NUN 300000 240 DGH 28 6 6 12 12 3.5 0 0 Con Axial Audit Audit Ward
NWG 297000 100 DGH 25 6 6 6 0 2 0 0 Con None Doctors Admin Ward
OHM 429700 325 DGH 42 11 11 25 40 5 0 0 Con Axial Nurses Audit GORU
OLD 700000 500 Both 104 13.75 12 20 20 10 1 1 Nurse Axial Nurses Nurses
PAH 299900 350 DGH 32 11 11 30 32 5 0 0 None None Audit Audit Ward
PCH 200000 220 DGH 17.5 7 7 0 0 0 0 0 None None Nurses Nurses Ward
PEH 65000 74 DGH 0 3 0 0 0 0 1 0 Con Axial Audit Audit GORU
PET 310000 400 DGH 40 16 5 0 0 0 0 1 Con Axial Nurses Nurses Ward
PGH 490000 899 DGH 139 10 8 63 16 7 0 0 None None Nurses Audit Ward
PIL 230000 330 DGH 41 8 10 10 0 5 0 0 Con Axial Nurses Admin Ward
PIN 500000 560 DGH 12 14 8 22 4 5 1 0 None Axial Care Asst Care Asst GORU
PLY 450000 481 Both 91.5 21 14 40 40 5 0 0 None Axial Nurses Nurses GORU
PMS 400000 375 DGH 70 12.83 17.64 28 56 5 0 0 Con Axial Doctors Audit Ward
POW 160000 300 DGH 24.5 9 10 8 10 5 3 0 Con Axial Audit Audit Ward
Facilities audit 2012–2013
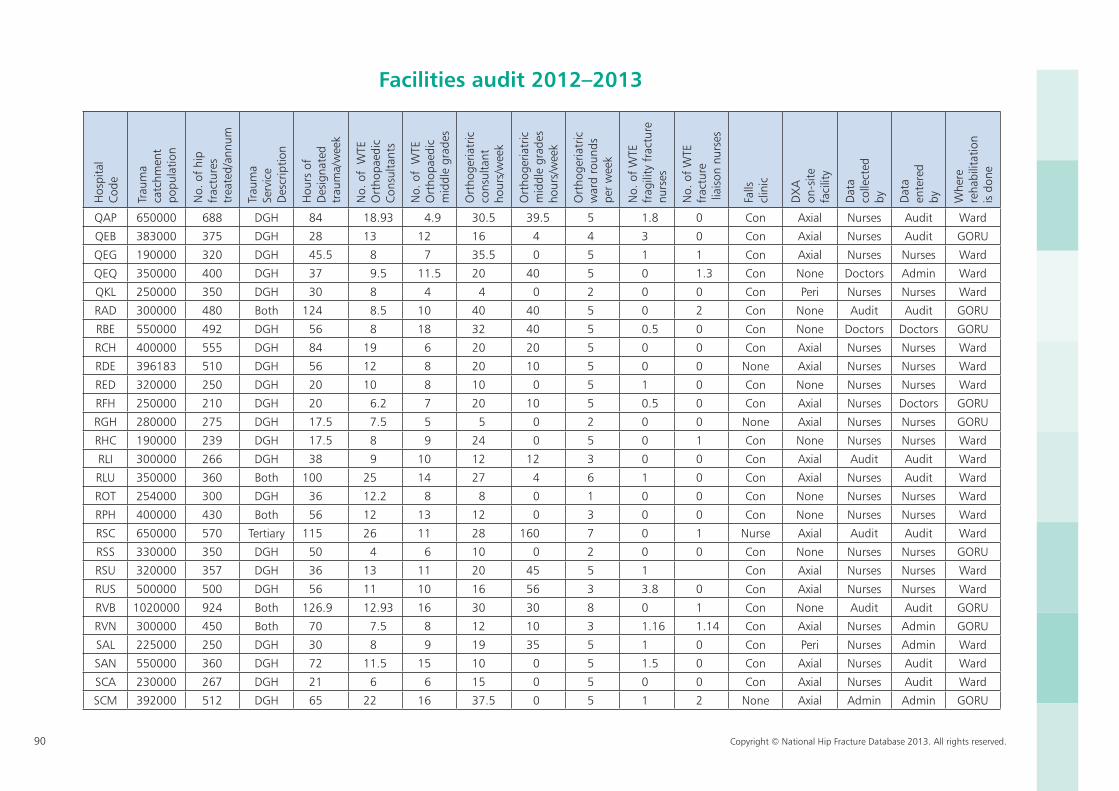
90 Copyright © National Hip Fracture Database 2013. All rights reserved.
Hos
pita
lCo
de
Trau
ma
catc
hmen
tpo
pula
tion
No.
of
hip
frac
ture
str
eate
d/an
num
Trau
ma
Serv
ice
Des
crip
tion
Hou
rs o
fD
esig
nate
dtr
aum
a/w
eek
No.
of
WTE
O
rtho
paed
icCo
nsul
tant
s
No.
of
WTE
O
rtho
paed
icm
iddl
e gr
ades
Ort
hoge
riatr
icco
nsul
tant
ho
urs/
wee
k
Ort
hoge
riatr
icm
iddl
e gr
ades
hour
s/w
eek
Ort
hoge
riatr
icw
ard
roun
ds
per
wee
k
No.
of
WTE
frag
ility
fra
ctur
enu
rses
No.
of
WTE
frac
ture
liai
son
nurs
es
Falls
clin
ic
DX
Aon
-site
faci
lity
Dat
aco
llect
edby D
ata
ente
red
by Whe
rere
habi
litat
ion
is d
one
QAP 650000 688 DGH 84 18.93 4.9 30.5 39.5 5 1.8 0 Con Axial Nurses Audit Ward
QEB 383000 375 DGH 28 13 12 16 4 4 3 0 Con Axial Nurses Audit GORU
QEG 190000 320 DGH 45.5 8 7 35.5 0 5 1 1 Con Axial Nurses Nurses Ward
QEQ 350000 400 DGH 37 9.5 11.5 20 40 5 0 1.3 Con None Doctors Admin Ward
QKL 250000 350 DGH 30 8 4 4 0 2 0 0 Con Peri Nurses Nurses Ward
RAD 300000 480 Both 124 8.5 10 40 40 5 0 2 Con None Audit Audit GORU
RBE 550000 492 DGH 56 8 18 32 40 5 0.5 0 Con None Doctors Doctors GORU
RCH 400000 555 DGH 84 19 6 20 20 5 0 0 Con Axial Nurses Nurses Ward
RDE 396183 510 DGH 56 12 8 20 10 5 0 0 None Axial Nurses Nurses Ward
RED 320000 250 DGH 20 10 8 10 0 5 1 0 Con None Nurses Nurses Ward
RFH 250000 210 DGH 20 6.2 7 20 10 5 0.5 0 Con Axial Nurses Doctors GORU
RGH 280000 275 DGH 17.5 7.5 5 5 0 2 0 0 None Axial Nurses Nurses GORU
RHC 190000 239 DGH 17.5 8 9 24 0 5 0 1 Con None Nurses Nurses Ward
RLI 300000 266 DGH 38 9 10 12 12 3 0 0 Con Axial Audit Audit Ward
RLU 350000 360 Both 100 25 14 27 4 6 1 0 Con Axial Nurses Audit Ward
ROT 254000 300 DGH 36 12.2 8 8 0 1 0 0 Con None Nurses Nurses Ward
RPH 400000 430 Both 56 12 13 12 0 3 0 0 Con None Nurses Nurses Ward
RSC 650000 570 Tertiary 115 26 11 28 160 7 0 1 Nurse Axial Audit Audit Ward
RSS 330000 350 DGH 50 4 6 10 0 2 0 0 Con None Nurses Nurses GORU
RSU 320000 357 DGH 36 13 11 20 45 5 1 Con Axial Nurses Nurses Ward
RUS 500000 500 DGH 56 11 10 16 56 3 3.8 0 Con Axial Nurses Nurses Ward
RVB 1020000 924 Both 126.9 12.93 16 30 30 8 0 1 Con None Audit Audit GORU
RVN 300000 450 Both 70 7.5 8 12 10 3 1.16 1.14 Con Axial Nurses Admin GORU
SAL 225000 250 DGH 30 8 9 19 35 5 1 0 Con Peri Nurses Admin Ward
SAN 550000 360 DGH 72 11.5 15 10 0 5 1.5 0 Con Axial Nurses Audit Ward
SCA 230000 267 DGH 21 6 6 15 0 5 0 0 Con Axial Nurses Audit Ward
SCM 392000 512 DGH 65 22 16 37.5 0 5 1 2 None Axial Admin Admin GORU
Facilities audit 2012–2013
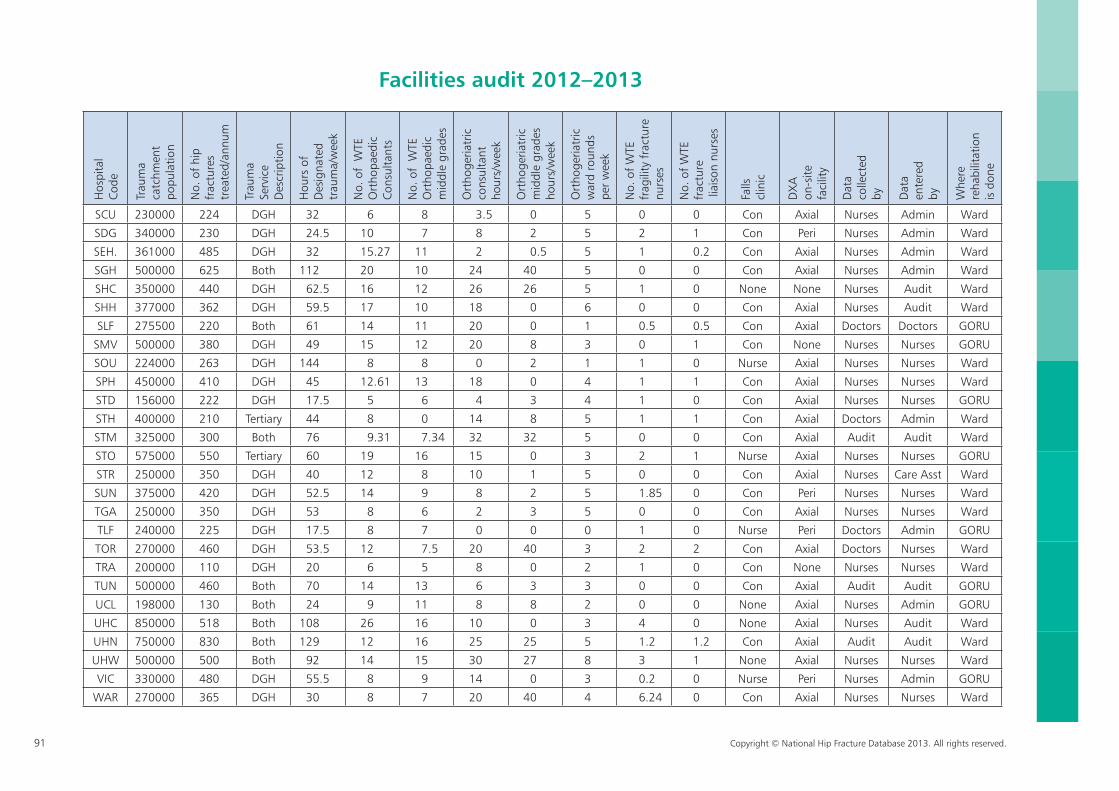
91 Copyright © National Hip Fracture Database 2013. All rights reserved.
Hos
pita
lCo
de
Trau
ma
catc
hmen
tpo
pula
tion
No.
of
hip
frac
ture
str
eate
d/an
num
Trau
ma
Serv
ice
Des
crip
tion
Hou
rs o
fD
esig
nate
dtr
aum
a/w
eek
No.
of
WTE
O
rtho
paed
icCo
nsul
tant
s
No.
of
WTE
O
rtho
paed
icm
iddl
e gr
ades
Ort
hoge
riatr
icco
nsul
tant
ho
urs/
wee
k
Ort
hoge
riatr
icm
iddl
e gr
ades
hour
s/w
eek
Ort
hoge
riatr
icw
ard
roun
ds
per
wee
k
No.
of
WTE
frag
ility
fra
ctur
enu
rses
No.
of
WTE
frac
ture
liai
son
nurs
es
Falls
clin
ic
DX
Aon
-site
faci
lity
Dat
aco
llect
edby D
ata
ente
red
by Whe
rere
habi
litat
ion
is d
one
SCU 230000 224 DGH 32 6 8 3.5 0 5 0 0 Con Axial Nurses Admin Ward
SDG 340000 230 DGH 24.5 10 7 8 2 5 2 1 Con Peri Nurses Admin Ward
SEH. 361000 485 DGH 32 15.27 11 2 0.5 5 1 0.2 Con Axial Nurses Admin Ward
SGH 500000 625 Both 112 20 10 24 40 5 0 0 Con Axial Nurses Admin Ward
SHC 350000 440 DGH 62.5 16 12 26 26 5 1 0 None None Nurses Audit Ward
SHH 377000 362 DGH 59.5 17 10 18 0 6 0 0 Con Axial Nurses Audit Ward
SLF 275500 220 Both 61 14 11 20 0 1 0.5 0.5 Con Axial Doctors Doctors GORU
SMV 500000 380 DGH 49 15 12 20 8 3 0 1 Con None Nurses Nurses GORU
SOU 224000 263 DGH 144 8 8 0 2 1 1 0 Nurse Axial Nurses Nurses Ward
SPH 450000 410 DGH 45 12.61 13 18 0 4 1 1 Con Axial Nurses Nurses Ward
STD 156000 222 DGH 17.5 5 6 4 3 4 1 0 Con Axial Nurses Nurses GORU
STH 400000 210 Tertiary 44 8 0 14 8 5 1 1 Con Axial Doctors Admin Ward
STM 325000 300 Both 76 9.31 7.34 32 32 5 0 0 Con Axial Audit Audit Ward
STO 575000 550 Tertiary 60 19 16 15 0 3 2 1 Nurse Axial Nurses Nurses GORU
STR 250000 350 DGH 40 12 8 10 1 5 0 0 Con Axial Nurses Care Asst Ward
SUN 375000 420 DGH 52.5 14 9 8 2 5 1.85 0 Con Peri Nurses Nurses Ward
TGA 250000 350 DGH 53 8 6 2 3 5 0 0 Con Axial Nurses Nurses Ward
TLF 240000 225 DGH 17.5 8 7 0 0 0 1 0 Nurse Peri Doctors Admin GORU
TOR 270000 460 DGH 53.5 12 7.5 20 40 3 2 2 Con Axial Doctors Nurses Ward
TRA 200000 110 DGH 20 6 5 8 0 2 1 0 Con None Nurses Nurses Ward
TUN 500000 460 Both 70 14 13 6 3 3 0 0 Con Axial Audit Audit GORU
UCL 198000 130 Both 24 9 11 8 8 2 0 0 None Axial Nurses Admin GORU
UHC 850000 518 Both 108 26 16 10 0 3 4 0 None Axial Nurses Audit Ward
UHN 750000 830 Both 129 12 16 25 25 5 1.2 1.2 Con Axial Audit Audit Ward
UHW 500000 500 Both 92 14 15 30 27 8 3 1 None Axial Nurses Nurses Ward
VIC 330000 480 DGH 55.5 8 9 14 0 3 0.2 0 Nurse Peri Nurses Admin GORU
WAR 270000 365 DGH 30 8 7 20 40 4 6.24 0 Con Axial Nurses Nurses Ward
Facilities audit 2012–2013
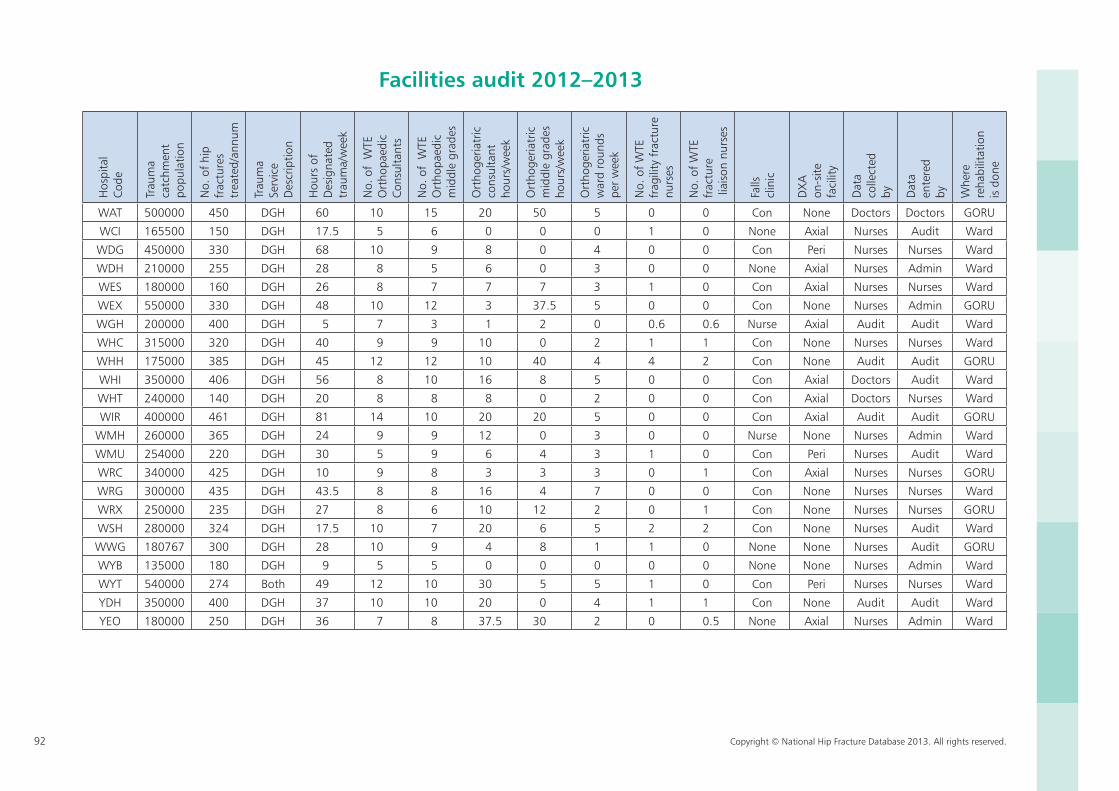
92 Copyright © National Hip Fracture Database 2013. All rights reserved.
Hos
pita
lCo
de
Trau
ma
catc
hmen
tpo
pula
tion
No.
of
hip
frac
ture
str
eate
d/an
num
Trau
ma
Serv
ice
Des
crip
tion
Hou
rs o
fD
esig
nate
dtr
aum
a/w
eek
No.
of
WTE
O
rtho
paed
icCo
nsul
tant
s
No.
of
WTE
O
rtho
paed
icm
iddl
e gr
ades
Ort
hoge
riatr
icco
nsul
tant
ho
urs/
wee
k
Ort
hoge
riatr
icm
iddl
e gr
ades
hour
s/w
eek
Ort
hoge
riatr
icw
ard
roun
ds
per
wee
k
No.
of
WTE
frag
ility
fra
ctur
enu
rses
No.
of
WTE
frac
ture
liai
son
nurs
es
Falls
clin
ic
DX
Aon
-site
faci
lity
Dat
aco
llect
edby D
ata
ente
red
by Whe
rere
habi
litat
ion
is d
one
WAT 500000 450 DGH 60 10 15 20 50 5 0 0 Con None Doctors Doctors GORU
WCI 165500 150 DGH 17.5 5 6 0 0 0 1 0 None Axial Nurses Audit Ward
WDG 450000 330 DGH 68 10 9 8 0 4 0 0 Con Peri Nurses Nurses Ward
WDH 210000 255 DGH 28 8 5 6 0 3 0 0 None Axial Nurses Admin Ward
WES 180000 160 DGH 26 8 7 7 7 3 1 0 Con Axial Nurses Nurses Ward
WEX 550000 330 DGH 48 10 12 3 37.5 5 0 0 Con None Nurses Admin GORU
WGH 200000 400 DGH 5 7 3 1 2 0 0.6 0.6 Nurse Axial Audit Audit Ward
WHC 315000 320 DGH 40 9 9 10 0 2 1 1 Con None Nurses Nurses Ward
WHH 175000 385 DGH 45 12 12 10 40 4 4 2 Con None Audit Audit GORU
WHI 350000 406 DGH 56 8 10 16 8 5 0 0 Con Axial Doctors Audit Ward
WHT 240000 140 DGH 20 8 8 8 0 2 0 0 Con Axial Doctors Nurses Ward
WIR 400000 461 DGH 81 14 10 20 20 5 0 0 Con Axial Audit Audit GORU
WMH 260000 365 DGH 24 9 9 12 0 3 0 0 Nurse None Nurses Admin Ward
WMU 254000 220 DGH 30 5 9 6 4 3 1 0 Con Peri Nurses Audit Ward
WRC 340000 425 DGH 10 9 8 3 3 3 0 1 Con Axial Nurses Nurses GORU
WRG 300000 435 DGH 43.5 8 8 16 4 7 0 0 Con None Nurses Nurses Ward
WRX 250000 235 DGH 27 8 6 10 12 2 0 1 Con None Nurses Nurses GORU
WSH 280000 324 DGH 17.5 10 7 20 6 5 2 2 Con None Nurses Audit Ward
WWG 180767 300 DGH 28 10 9 4 8 1 1 0 None None Nurses Audit GORU
WYB 135000 180 DGH 9 5 5 0 0 0 0 0 None None Nurses Admin Ward
WYT 540000 274 Both 49 12 10 30 5 5 1 0 Con Peri Nurses Nurses Ward
YDH 350000 400 DGH 37 10 10 20 0 4 1 1 Con None Audit Audit Ward
YEO 180000 250 DGH 36 7 8 37.5 30 2 0 0.5 None Axial Nurses Admin Ward
Facilities audit 2012–2013
Copyright © National Hip Fracture Database 2013. All rights reserved. 93
National Hip Fracture DatabaseNational report 2013
Further appendicesThe following further appendices are available as a separate document available from nhfd.co.uk (Other resources – NHFD – NHFD Reports and Publications – National Reports)
Appendix C – Structure and GovernanceAppendix D – Classification TreesAppendix E – Outlier managementAppendix F – Mortality analysis methodsAppendix G – Trend analysis methodsAppendix H – NHFD chart outlines
94 Copyright © National Hip Fracture Database 2013. All rights reserved.
Acknowledgements NHFD participants: clinical and audit staff in all contributing hospitals
British Geriatrics SocietyBritish Orthopaedic AssociationRoyal College of PhysiciansRoyal College of Surgeons of EnglandHealth and Social Care Information CentreDepartment of HealthNational Clinical Audit Advisory GroupHealthcare Quality Improvement PartnershipQuantics Consulting Ltd

National Hip Fracture Database National report 2013
Need to know more?Contact:NHFD Headquarters:Royal College of Physicians,11 St Andrews PlaceRegent’s ParkLondonNW1 4LE
Tel: 020 7251 8868
Project manager – Chris BoultonEmail: [email protected]: 020 3075 1511
Project coordinator – Andy WilliamsEmail: [email protected]: 07818 065915
Project coordinator – Fay PlantEmail: [email protected]: 07792 213369
National Hip Fracture Database National report 2013 – Summary