Embed Size (px)
Citation preview

Number 338 + August 5, 2003
National Hospital Ambulatory Medical Care Survey: 2001 Outpatient Department Summary
by Esther Hing, M.P.H., and Kimberly Middleton, B.S.N., M.P.H., Division of Health Care Statistics
Abstract Objectives—This report describes ambulatory care visits to hospital outpatient
departments (OPDs) in the United States. Statistics are presented on selected hospital, clinic, patient, and visit characteristics. The report highlights new items on continuity of care of OPD visits, including: whether the visit was the first or a followup for a problem, number of visits to the clinic during the past 12 months for established patients, and whether other physicians shared care for the patient’s problem. The report also highlights variation in utilization across the major types of OPD clinics surveyed.
Methods—The data presented in this report were collected from the 2001 National Hospital Ambulatory Medical Care Survey (NHAMCS). NHAMCS is part of the ambulatory care component of the National Health Care Survey that measures health care utilization across various types of providers. NHAMCS is a national probability sample survey of visits to emergency and outpatient departments of non-Federal, short-stay, and general hospitals in the United States. Sample data are weighted to produce annual national estimates.
Results—During 2001, about 83.7 million visits were made to hospital OPDs in the United States. The 2001 rate (29.9 per 100 persons) represents a 33 percent increase since 1992. Females had higher OPD visit rates than males (35.2 versus 24.3 visits per 100 persons) and black or African-American persons had higher OPD visit rates than white persons (48.8 versus 27.9 visits per 100 persons). The majority of visits to hospital OPDs were made by patients with previous visits to the clinic (84.2 percent); 70.0 percent had visited the clinic one or more times during the past 12 months. Preventive care visits comprised 15.5 percent of all OPD visits; nearly three out of four preventive care visits were made by females (72.8 percent). Diagnostic and screening services were ordered or provided at 85.0 percent of visits, therapeutic and preventive services were ordered or provided at 45.6 percent of visits, and medications were prescribed at 64.6 percent of visits. Most patients were given an appointment to return to the clinic (60.1 percent).
Keywords: NHAMCS c outpatient department visits c diagnoses c medications c ICD–9–CM
U.S. DEPARTMENT OF HEALTH AND HUMAN SERVICESCenters for Disease Control and PreventionNational Center for Health Statistics
Introduction The National Hospital Ambulatory
Medical Care Survey (NHAMCS) was inaugurated in 1992 to gather, analyze, and disseminate information about the health care provided by hospital outpatient departments (OPDs) and emergency departments (EDs). The NHAMCS is part of the ambulatory component of the National Health Care Survey that measures health care utilization across various types of providers. More information about the National Health Care Survey can be found at the National Center for Health Statistics (NCHS) Web site: www.cdc.gov/nchs/nhcs.htm.
Ambulatory medical care is the predominant method of providing health care services in the United States and occurs in a wide range of settings. The largest proportion of ambulatory care services occurs in physician offices (1). Since 1973, the NCHS has collected data on patient visits to physicians’ offices through the National Ambulatory
Acknowledgments
This report was prepared in the Division of Health Care Statistics. Dale Sanders in the Technical Services Branch generated most of the tables. Sarah Gousen in the Technical Services Branch contributed to the description of the sampling procedure and to the ‘‘Technical Notes.’’ The report was edited by Klaudia M. Cox, typeset by Annette F. Holman, and the figures were produced by Jarmila G. Ogburn of the Publications Branch, Division of Data Services.

2 Advance Data No. 338 + August 5, 2003
Medical Care Survey (NAMCS). However, visits to hospital OPDs and EDs, which represent a significant segment of ambulatory care visits, are not included in the NAMCS. Furthermore, hospital ambulatory patients are known to differ from office patients in certain demographic and medical characteristics (1). OPDs account for approximately 9 percent of all ambulatory medical care in the United States (1).
This report presents data from the 2001 NHAMCS, a nationally representative survey of hospital OPD utilization. Hospital, patient, clinic, and visit characteristics are described. In addition, new information on the continuity of care in OPD visits and variation in utilization across various types of OPD clinics are presented. Other Advance Data reports highlight visits to EDs (2) and physician offices (3).
Data highlights + In 2001, 83.7 million visits were
made to hospital OPDs, about 29.9 visits per 100 persons.
+ The visit rate in 2001 was 33 percent higher than the rate recorded in 1992 (22.5 visits per 100 persons).
+ Private insurance was the most frequent source of payment, accounting for 36.9 percent of visits, followed by Medicaid and Medicare (24.2 percent and 16.1 percent, respectively).
+ Approximately 60.5 percent of physician-supervised OPD visits were to general medical clinics and 13.2 percent were to surgery clinics.
+ The overwhelming majority of visits to hospital OPDs were made by patients with previous visits to the clinic (84.2 percent); 70.0 percent had visited the clinic one or more times during the past 12 months.
+ About one-third of all OPD visits (32.9 percent) were to the patient’s primary care physician.
+ In 3 out of 10 visits, other physicians also shared care for the patient’s condition.
+ Overall, 43.1 percent of visits were followup visits for a previously seen condition. This percent varied by
clinic type, with surgical and other clinics having a higher frequency of followup visits.
+ Preventive care visits comprised 15.5 percent of all OPD visits; nearly three out of four preventive care visits were made by females (72.8 percent).
+ About 136 million drugs were prescribed at approximately 64.6 percent of OPD visits.
+ A physician (i.e., staff physician, resident/intern, or other physician) was seen at approximately 79.9 percent of patient visits. Variations were observed in type of provider seen, including physicians and mid-level providers, by type of clinic.
Methods The data presented in this report are
from the 2001 NHAMCS, a national probability sample survey conducted by the Centers for Disease Control and Prevention, National Center for Health Statistics, Division of Health Care Statistics. The survey was conducted from January 1, 2001, through December 30, 2001.
The target universe of the NHAMCS is in-person visits made in the United States to OPDs and EDs of non-Federal, short-stay hospitals (hospitals with an average length of stay of less than 30 days) or those whose specialty is general (medical or surgical) or children’s general. The hospital sampling frame consisted of hospitals listed in the 1991 SMG Hospital Database, which was updated using the 2000 SMG Hospital Database to allow the inclusion of hospitals that opened or changed their eligibility status since the previous sample in 1991. Approximately 50 hospitals that had not been previously included were added to the 2001 sample.
A four-stage probability sample design is used in the NHAMCS (4). The design involves samples of primary sampling units (PSUs), hospitals within PSUs, clinics within OPDs, and patient visits within clinics. The PSU sample consists of 112 PSUs that comprise a probability subsample of the PSUs used in the 1985–94 National Health
Interview Survey. A sample of 479 hospitals was selected for the 2001 NHAMCS, of which 261 had eligible OPDs. Approximately 85 percent of eligible OPDs participated, with a total visit response rate of 73.6 percent (see ‘‘Technical Notes’’ for details).
A clinic was defined as an administrative unit of the OPD where ambulatory medical care is provided under the supervision of a physician and for which the hospital kept patient volume statistics. Clinics were out of scope for the survey if they provided only ancillary services such as radiology, laboratory services, physical rehabilitation, renal dialysis, and pharmacy. Other settings in which physician services were not typically provided were also out of scope for the survey. If an OPD had five or fewer clinics, then all were included in the sample. When an OPD had more than five clinics, the clinics were assigned into one of six specialty groups (i.e., general medicine, surgery, pediatrics, obstetrics/gynecology, substance abuse, and other). Within these specialty groups, clinics were grouped into clinic sampling units (SU). A clinic SU is generally one clinic, except when a clinic expects fewer than 30 visits. In that case, it is grouped with one or more other clinics to form a clinic SU. If the grouped SU was selected, all clinics included in that SU were included in the sample. A sample of SUs proportional to the total expected number of visits to the clinic was selected. Starting in 2001, clinic sampling procedures changed when there were more than five clinics. In 2000, a sample of generally five clinic SUs was selected per hospital. In 2001, the sample of clinic SUs within each specialty group was limited to two clinic SUs. Therefore, the 2001 sample of clinics generally increased because a maximum of 12 clinic SUs could be selected.
Hospital staff were asked to complete Patient Record forms (see figure I in the ‘‘Technical Notes’’) for a systematic random sample of patient visits occurring during a randomly assigned 4-week reporting period. The number of Patient Record forms completed for OPDs was 33,567.

Advance Data No. 338 + August 5, 2003 3
Figure 1. Trend in outpatient department visit rates: United States, 1992–2001
Figure 2. Annual rate of outpatient department visits by patient’s age and sex: United States, 2001
Because the estimates presented in this report are based on a sample rather than on the entire universe of OPD visits, they are subject to sampling variability. The ‘‘Technical Notes’’ at the end of this report include an explanation of sampling errors with guidelines for judging the precision of the estimates. The standard errors reported here are calculated using Taylor approximations in SUDAAN, which take into account the complex sample design of the NHAMCS (5). Data on the OPD utilization trends from 1992 through 2001 and selected trends by age of the patient are also presented. A weighted least-squares regression analysis was used to determine the significance of trends at the 0.05 level.
The U.S. Census Bureau was responsible for data collection. Data processing operations and medical coding were performed by Analytical Sciences Inc., Durham, North Carolina. As part of the quality assurance procedure, a 10-percent quality control sample of survey records was independently keyed and coded. Coding error rates ranged between 0.1 and 1.4 percent for various survey items.
Several of the tables in this report present rates of OPD visits per population. The population figures used in calculating these rates are based on Census Bureau monthly postcensal estimates of the civilian noninstitutional population of the United States as of July 1, 2001. These population estimates are based on postcensal estimates from the Census 2000 and are available from the Census Bureau. See the ‘‘Technical Notes’’ for more information about the effects of the change from 1990-based to 2000-based denominators on trends in population rates.
Results There were an estimated 83.7
million visits to OPDs in 2001, about 29.9 visits per 100 persons. While the population of the United States increased by 12 percent since 1992, the number of visits to OPDs increased by 48 percent, from 56.6 million to 83.7 million visits annually (6). The OPD
visit rate per 100 persons increased by 33 percent from 1992 through 2001 (figure 1).
Patient characteristics
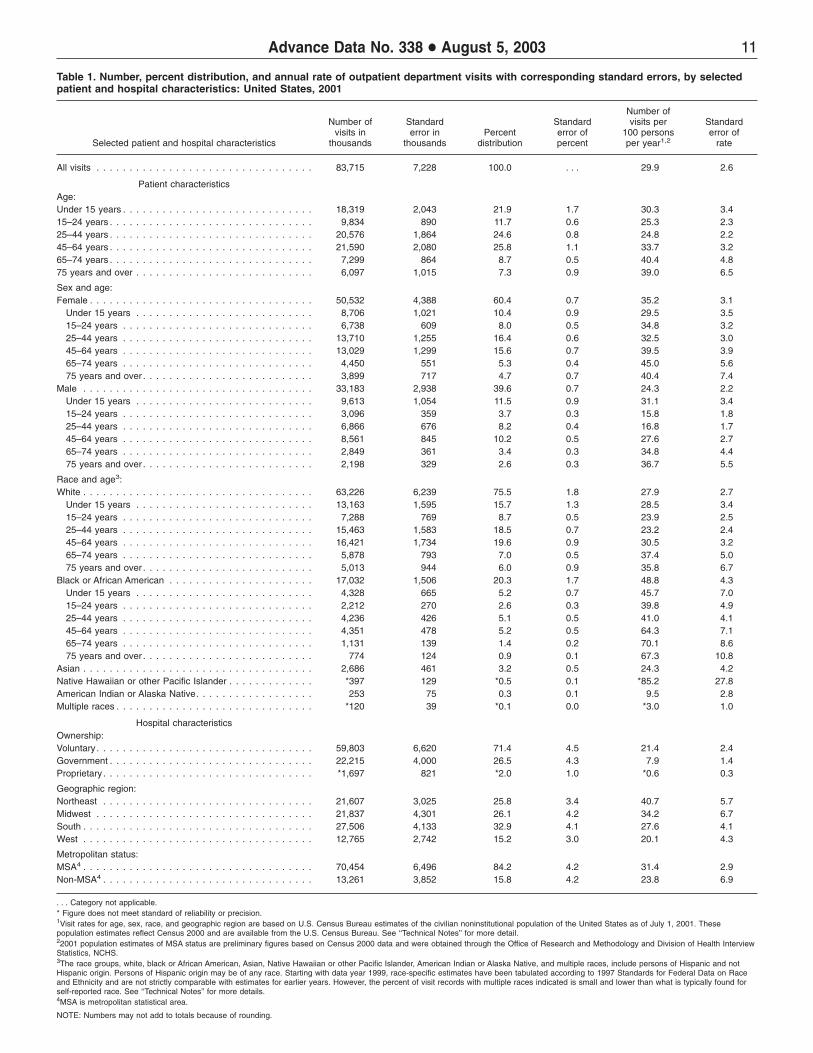
OPD visits by patient’s age, sex, and race are shown in table 1. There was a linear trend for females and males by age overall. However, the visit rate for males under 15 years of age (31.1 visits per 100 persons) was higher than the rate for those 15–24 years of age
(15.8 visits per 100 persons). The female visit rate was higher than the rate for males overall, driven by differences in the 15–64 year old age group (figure 2). In figures 2 and 3, 95 percent confidence intervals are provided to show the stability of the individual point estimates and to permit the reader to assess general patterns in the data.
White persons made 75.5 percent of all OPD visits, while black or African-American persons and Asians accounted

4 Advance Data No. 338 + August 5, 2003
Figure 3. Annual rate of outpatient department visits by patient’s age and race: United States, 2001
for 20.3 percent and 3.2 percent, respectively. For the first time, OPD visit rates by Asians, Native Hawaiian or other Pacific Islanders, and multiple race persons are presented separately because census estimates for these populations became available. The utilization rate for black or African-American persons (48.8 per 100 persons) was 75 percent higher than for white persons (27.9 per 100 persons) and 101 percent higher than for Asians (24.3 per 100 persons). There was a linear trend by age for black or African-American persons and white persons (figure 3). Although the 2001 OPD utilization rates for elderly black or African-American persons appear to have declined since 2000 (7), these differences were not statistically significant.
Hospital characteristics
Ownership—About 71.4 percent of OPD visits were made to voluntary nonprofit hospitals, while 26.5 percent of visits occurred in non-Federal government (i.e., State, county, city) hospitals (table 1). Proprietary hospitals were less likely to have the kinds of clinics that are eligible for the NHAMCS, so OPD visits for this ownership category were too small to yield reliable estimates.
Geographic region—OPD visit rates ranged from 20.1 visits per 100 persons in the West to 40.7 visits per 100 persons in the Northeast (table 1). The distribution of OPD visits by region did not differ significantly from the distribution of hospitals with in-scope OPD clinics (administrative unit of an OPD where ambulatory medical care is provided under the supervision of a physician) by region. The percent of hospitals with in-scope OPDs ranged from 12.7 percent in the West to 35.0 percent in the Midwest (data not shown).
Metropolitan status—About 84.2 percent of OPD visits were in metropolitan statistical areas (MSAs) (table 1). There was no significant difference in the visit rates for MSAs and non-MSAs.
Clinic characteristics
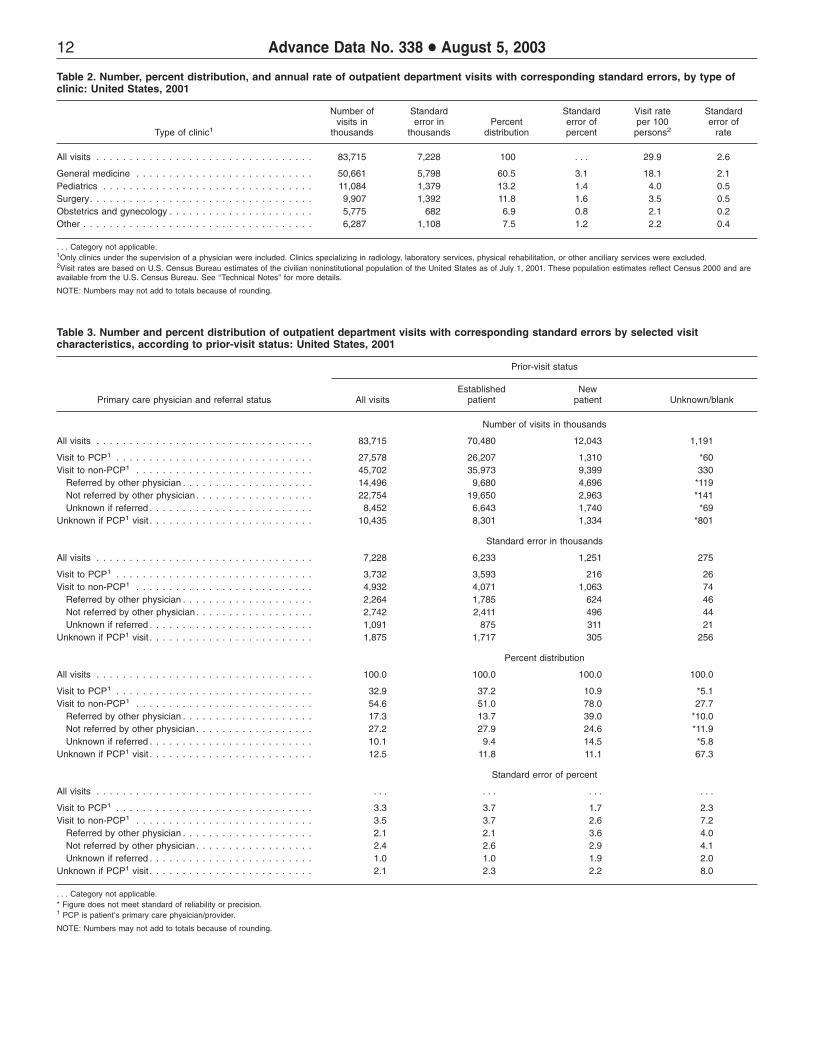
Visits to hospital OPDs were classified into the five types of clinics that were included in the sample (table 2). General medicine clinics, which included internal medicine and primary care clinics, represented 60.5 percent of all OPD visits. Surgery, pediatrics, and obstetrics and gynecology accounted for 13.2 percent, 11.8 percent, and 6.9 percent of visits, respectively. The ‘‘other’’ clinic category, which included drug, alcohol,
and substance abuse clinics, psychiatric clinics, mental health clinics, and miscellaneous specialty clinics, accounted for 7.5 percent of visits. The distribution of visits by type of clinic did not change from 2000 despite the new clinic sampling methodology. The visit rate to general medicine clinics (18.1 per 100 persons) exceeded visit rates to all other types of clinics.
Visit characteristics
Continuity of care—Continuity of care is a goal of health care achieved through an interdisciplinary process involving patients, families, health care professionals, and providers in the management of a coordinated plan of care. Based on changing needs and available resources, the process optimizes outcomes in the health status of patients. It may involve professionals from many different disciplines within multiple systems. To better understand continuity of care, new questions not included in previous survey years were added to the 2001 Patient Record form (see figure I in the ‘‘Technical Notes’’). These questions included whether the OPD visit was the first or a followup visit for a problem, the number of clinic visits by established patients during the past 12 months, and whether other physicians shared care for a patient’s problem. Two items, whether the visit was to the patient’s primary care physician and whether another physician referred the patient, were changed to clarify the referral process.
Primary care physician and referral status—In 2001, 32.9 percent of OPD visits were to the patient’s primary care physician/provider (PCP), 54.6 percent were to a physician/provider other than the patient’s PCP, and this information was unknown for 12.5 percent of visits (table 3). While 84.2 percent of OPD visits (calculated from table 3) were made by established patients (with previous visits to the clinic), only 37.2 percent of visits by these patients were to their PCP.
Of the 54.6 percent of visits to non-PCPs, 31.7 percent were referrals from another physician/provider, 49.8 percent were self-referrals, and 18.5 percent of the referral statuses were

Advance Data No. 338 + August 5, 2003 5
Figure 4. Percent distribution of outpatient department visits by episode of care and type of clinic: United States, 2001
Figure 5. Percent distribution of outpatient department visits by prior-visit status and past visits by established patients: United States, 2001
unknown (calculated from table 3). Referrals from another physician/ provider were significantly more likely for new patients (39.0 percent) than for established patients (13.7 percent) (table 3).
The pattern of visits to PCPs and non-PCPs also varied by type of clinic visited. A larger proportion of visits to general medicine and pediatric clinics were to the patient’s PCP (41.7 and 44.2 percent, respectively) than was the care for any other type of clinic (table 4). Referral visits to non-PCPs
occurred more often in surgery clinics (37.6 percent) than any other type of clinic (10.5 to 25.0 percent). Table 5 shows that 31.8 percent of OPD visits involved shared care with other physicians.
Episode of care—The term ‘‘episode of care’’ as defined by the NHAMCS is whether the sampled visit is an initial visit to this provider for a problem or a followup visit. The problem could have been an acute problem with an onset of less than 3 months, a chronic problem, or a pre- or
postsurgery visit. In 2001, 31.1 percent of OPD visits were initial visits for a problem, while 43.1 percent were followup visits for a problem. Information on the episode of care was unknown for 10.2 percent of visits (table 5). For 15.5 percent of visits, information on the episode of care was not asked because the major reason for the visit was for preventive care (see ‘‘Major reason for visit’’ for more information on this variable).
The proportion of initial visits (38.3 percent) to general medicine clinics occurred more frequently than to any other type of clinic (10.6 to 27.1 percent) (figure 4). The proportion of followup visits for a problem occurred more frequently in ‘‘other’’ clinics (81.4 percent) than among the major types of clinics (16.9 to 56.2 percent) because return visits are often part of the treatment protocols for patients seen in these clinics (e.g., alcohol or drug abuse, psychiatric, mental health, and pain management clinics) (8). Preventive care visits were more likely to occur in obstetrics and gynecology clinics (65.6 percent compared with 1.1 to 28.9 percent among the remaining clinic types).
Number of visits in the last 12 months for established patients— Established patients previously seen in the clinic made up 84.2 percent of OPD visits in 2001. Among OPD visits made by established patients, 4.6 percent had no visits within the last 12 months, and 83.1 percent reported one or more visits during the last 12 months. In 3 out of 10 visits (29.8 percent), the patient had six or more visits to the clinic within the past year. Information on the number of past visits was unknown for 12.3 percent of patients (figure 5). Overall, 18.3 percent of OPD visits were made by patients with no clinic visits during the past 12 months, either because the patient was new (14.4 percent) or because established patients had no visits within the year (3.9 percent) (table 5).
Primary expected source of payment—Private insurance was listed as the dominant expected source of payment (occurring for 36.9 percent of OPD visits in 2001). Government sources combined (Medicare and
6 Advance Data No. 338 + August 5, 2003
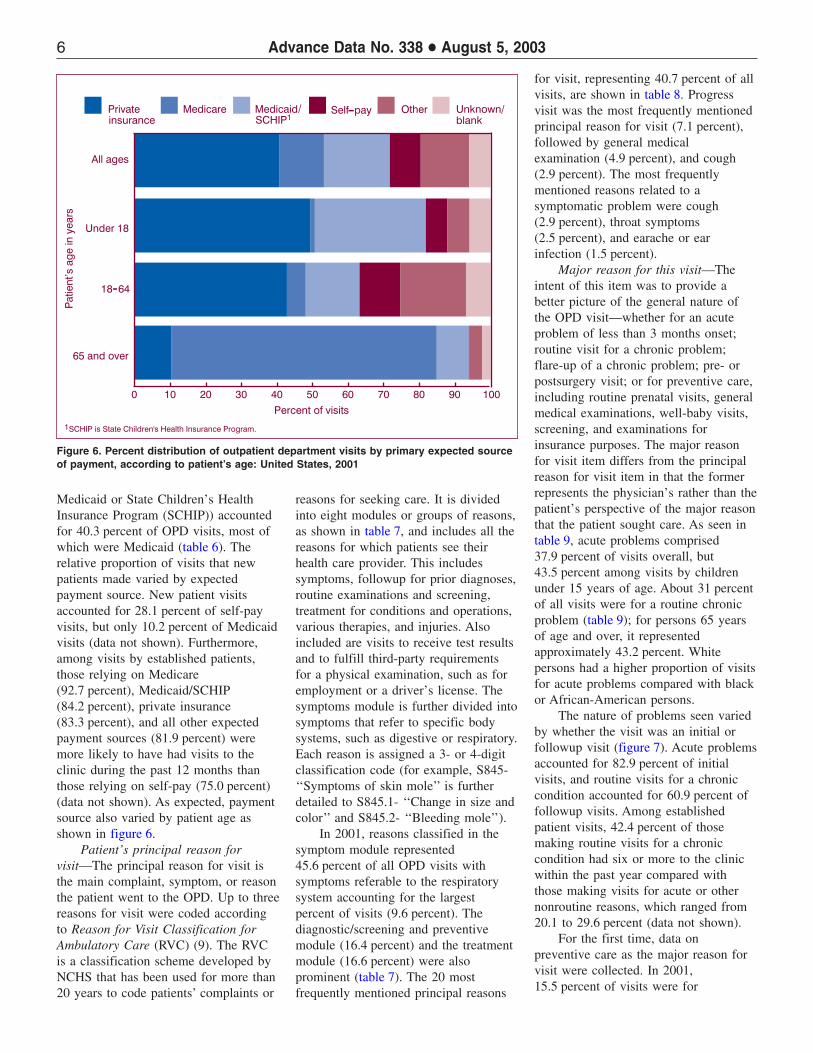
Figure 6. Percent distribution of outpatient department visits by primary expected source of payment, according to patient’s age: United States, 2001
Medicaid or State Children’s Health Insurance Program (SCHIP)) accounted for 40.3 percent of OPD visits, most of which were Medicaid (table 6). The relative proportion of visits that new patients made varied by expected payment source. New patient visits accounted for 28.1 percent of self-pay visits, but only 10.2 percent of Medicaid visits (data not shown). Furthermore, among visits by established patients, those relying on Medicare (92.7 percent), Medicaid/SCHIP (84.2 percent), private insurance (83.3 percent), and all other expected payment sources (81.9 percent) were more likely to have had visits to the clinic during the past 12 months than those relying on self-pay (75.0 percent) (data not shown). As expected, payment source also varied by patient age as shown in figure 6.
Patient’s principal reason for visit—The principal reason for visit is the main complaint, symptom, or reason the patient went to the OPD. Up to three reasons for visit were coded according to Reason for Visit Classification for Ambulatory Care (RVC) (9). The RVC is a classification scheme developed by NCHS that has been used for more than 20 years to code patients’ complaints or
reasons for seeking care. It is divided into eight modules or groups of reasons, as shown in table 7, and includes all the reasons for which patients see their health care provider. This includes symptoms, followup for prior diagnoses, routine examinations and screening, treatment for conditions and operations, various therapies, and injuries. Also included are visits to receive test results and to fulfill third-party requirements for a physical examination, such as for employment or a driver’s license. The symptoms module is further divided into symptoms that refer to specific body systems, such as digestive or respiratory. Each reason is assigned a 3- or 4-digit classification code (for example, S845-‘‘Symptoms of skin mole’’ is further detailed to S845.1- ‘‘Change in size and color’’ and S845.2- ‘‘Bleeding mole’’).
In 2001, reasons classified in the symptom module represented 45.6 percent of all OPD visits with symptoms referable to the respiratory system accounting for the largest percent of visits (9.6 percent). The diagnostic/screening and preventive module (16.4 percent) and the treatment module (16.6 percent) were also prominent (table 7). The 20 most frequently mentioned principal reasons
for visit, representing 40.7 percent of all visits, are shown in table 8. Progress visit was the most frequently mentioned principal reason for visit (7.1 percent), followed by general medical examination (4.9 percent), and cough (2.9 percent). The most frequently mentioned reasons related to a symptomatic problem were cough (2.9 percent), throat symptoms (2.5 percent), and earache or ear infection (1.5 percent).
Major reason for this visit—The intent of this item was to provide a better picture of the general nature of the OPD visit—whether for an acute problem of less than 3 months onset; routine visit for a chronic problem; flare-up of a chronic problem; pre- or postsurgery visit; or for preventive care, including routine prenatal visits, general medical examinations, well-baby visits, screening, and examinations for insurance purposes. The major reason for visit item differs from the principal reason for visit item in that the former represents the physician’s rather than the patient’s perspective of the major reason that the patient sought care. As seen in table 9, acute problems comprised 37.9 percent of visits overall, but 43.5 percent among visits by children under 15 years of age. About 31 percent of all visits were for a routine chronic problem (table 9); for persons 65 years of age and over, it represented approximately 43.2 percent. White persons had a higher proportion of visits for acute problems compared with black or African-American persons.
The nature of problems seen varied by whether the visit was an initial or followup visit (figure 7). Acute problems accounted for 82.9 percent of initial visits, and routine visits for a chronic condition accounted for 60.9 percent of followup visits. Among established patient visits, 42.4 percent of those making routine visits for a chronic condition had six or more to the clinic within the past year compared with those making visits for acute or other nonroutine reasons, which ranged from 20.1 to 29.6 percent (data not shown).
For the first time, data on preventive care as the major reason for visit were collected. In 2001, 15.5 percent of visits were for

Advance Data No. 338 + August 5, 2003 7
Figure 7. Percent distribution of initial and followup visits for a problem by major reason for visit: United States, 2001
Figure 8. Annual rate of outpatient department visits for preventive care by patient’s sex and age: United States, 2001
preventive care. Females had significantly higher proportions of visits for preventive care than males (table 10). The female visit rate for preventive care was twice that for males (6.6 visits per 100 females versus 2.6 per 100 males) because of the high utilization rate for females 15–24 years (figure 8). A large proportion of the preventive care visits by females at ages 15–24 years and 25–44 years were pregnancy related (any diagnosis coded
V22), accounting for 51 and 32 percent of their visit rates, respectively (figure 8). However, the differential in higher preventive care visit rates for females than males persisted through ages 15–44 years even after eliminating pregnancy-related visits. There were no differences in preventive care visit rates by sex among children under 15 years or the elderly (65 years and over).
The visit rate for preventive care in OPDs by black or African-American
persons (11.0 per 100 persons) was more than twice that for persons of white or other races (3.7 and 4.1 per 100 persons, respectively). This utilization pattern reverses that found in physicians’ offices, where the visit rate for preventive care by white persons was nearly twice that for black or African-American persons (56.5 versus 31.7 per 100 persons) (3). The preventive care visit rate in OPDs for black or African-American persons exceeded that for white persons in every age group and persisted even after pregnancy-related visits were excluded (data not shown).
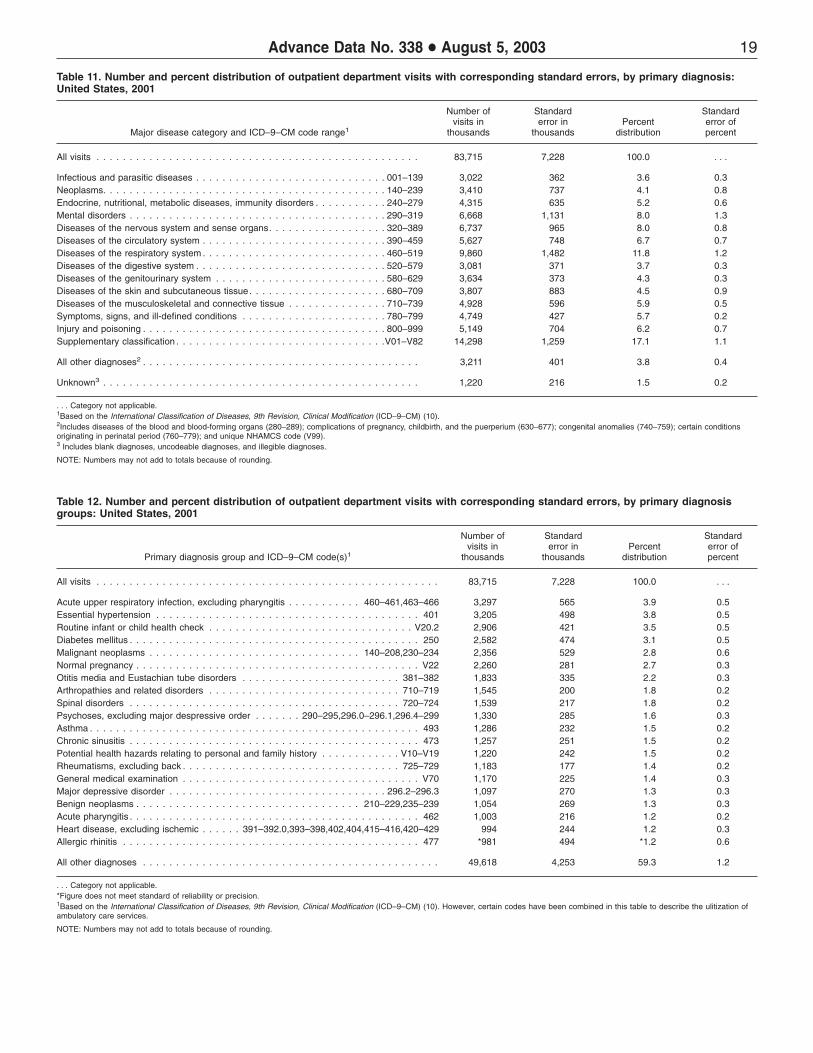
Primary diagnosis—Hospital staff were asked to record the primary diagnosis or problem associated with the patient’s most important reason for the current visit and any other significant current diagnoses. Up to three diagnoses were coded according to the International Classification of Diseases, 9th revision, Clinical Modification (ICD–9–CM) (10). OPD visits by primary diagnosis using the major disease categories specified by the ICD–9–CM are displayed in table 11. The most frequently listed disease category, accounting for 17.1 percent of visits, was ‘‘supplementary classification’’ used for diagnoses not classifiable to injury or illness (for example, general medical examination, routine prenatal examination, and health supervision of an infant or child). Diseases of the respiratory system (11.8 percent) were also prominent on the list. The 20 most frequently reported primary diagnoses, accounting for 40.7 percent of all the OPD visits in 2001, are shown in table 12. The four most frequent diagnoses recorded were acute upper respiratory infection, excluding pharyngitis (3.9 percent); essential hypertension (3.8 percent); routine infant or child health check (3.5 percent); and diabetes mellitus (3.1 percent).
Injury-related visits—Although there is a separate item or checkbox on the Patient Record form to indicate whether the visit was for an injury, poisoning, or adverse medical treatment, sometimes an injury reason for visit is specified or an injury diagnosis is rendered without the injury item being

8 Advance Data No. 338 + August 5, 2003
checked. Therefore, the visit is counted as an injury visit and the injury checkbox is coded to ‘‘Yes’’ if any of the three reasons for visit were in the injury module or any of the three diagnoses were in the injury or poisoning chapter of the ICD–9–CM (10). This provides a better indicator that the visit involves an injury than using the reason-for-visit module, ICD–9–CM injury diagnosis, or the unedited injury item alone. A more detailed discussion is documented elsewhere (11).
There were an estimated 11.1 million injury- or poisoning-related OPD visits in 2001, representing 13.3 percent of all OPD visits and yielding a rate of 4.0 visits per 100 persons (table 13). Injury rates were statistically similar regardless of age group or sex. Injury rates for black or African-American persons (5.8 visits per 100 persons per year) were highest among the three race groups shown, while the injury rate for ‘‘other race’’ was lowest (1.7 visits per 100 persons per year).
Table 14 shows OPD visits by the intent and mechanism of the first-listed external cause-of-injury codes (E-codes). Up to three external causes of injury were coded according to the ‘‘Supplementary Classification of External Causes of Injury and Poisoning’’ in the ICD–9–CM (10). The most prominent cause of injuries was falls (12.0 percent), followed by motor vehicle traffic crashes (7.3 percent). It should be noted that there are high levels of missing data for the external cause-of-injury item (39.7 percent) so the results should be interpreted with caution. For a detailed description of the cause-of-injury codes, refer to table II in the ‘‘Technical Notes.’’
Patient Record form variation—In 2001, two versions of the Patient Record form were used for data collection in hospital OPDs. One-half of sample OPDs were administered a more detailed version of the Patient Record form that included questions on both sides of the form, and the other half were administered the usual shorter version of the Patient Record form (see figure I in the ‘‘Technical Notes’’). A major difference between the questions administered on the two forms was the
inclusion of expanded checkboxes for selected diagnostic or screening services; counseling, education, or therapy services; surgical procedures; medications and injections; visit disposition; and providers seen. For this report, most information presented is based solely on items (and subitems) common to both forms. However, information on diagnostic and/or screening services (table 15) includes data collected differently on the long and short versions of the Patient Record form. That is, information recorded in checkboxes on the ‘‘long form’’ as well as corresponding write-in responses from the ‘‘short form’’ were compared for similarity in reporting levels. Only services with similar estimates were combined and presented below. Although one form had 44 checkboxes and the other only 18 checkboxes and 4 write-ins, there was no difference in the percent of visits with any (or no) diagnostic services mentioned between the two forms. A report comparing the response patterns for the two versions of the Patient Record form will be published separately.
Diagnostic and screening services—Statistics on various diagnostic and screening services ordered or provided by hospital staff during an OPD visit are displayed in table 15. At least one such service was provided at 85.0 percent of OPD visits. Blood pressure check (53.6 percent) was the leading diagnostic screening test performed. Blood tests were frequent among laboratory tests performed, ranging from complete blood count or CBC (9.8 percent of visits) to hematocrit/hemoglobin tests (2.2 percent of visits). A culture (any type) was performed in 4.5 percent of visits. Overall, any type of imaging was ordered or provided at 13.7 percent of all visits and was most often in the form of an x ray (7.4 percent of the visits). Despite differences in data-collection methodologies, the proportion of visits with specific services shown in table 15 was similar to those reported in 2000, with the exception of hematocrit/ hemoglobin and ultrasound (7). About 14 percent of the visits had no diagnostic or screening services ordered
or provided, and information was missing at 1.0 percent of visits.
Counseling/education and therapeutic services—One or more therapeutic or preventive services were ordered or provided at 45.6 percent of OPD visits during 2001. Counseling or education related to diet or nutrition (10.9 percent), mental health or stress management (4.7 percent), and exercise (4.4 percent) were mentioned most frequently (table 16). Psychotherapy and weight-reduction therapy accounted for 4.0 percent and 1.5 percent of visits, respectively.
Medication therapy—Hospital staff were instructed to record all new or continued medications ordered, supplied, or administered at the visit. This included prescription and nonprescription preparations, immunizations, desensitizing agents, and anesthetics. Up to six medications, referred to in this survey as drug mentions, were coded per visit according to a classification system developed at NCHS. A report describing the method and instruments used to collect and process drug information is available (12). As used in the NHAMCS, the term ‘‘drug’’ is interchangeable with the term ‘‘medication.’’ The term ‘‘prescribing’’ is used broadly to mean ordering or providing any medication, whether prescription or over-the-counter. Visits with one or more drug mentions are termed ‘‘drug visits’’ in the NHAMCS.
Medications were used at 54.1 million visits or 64.6 percent of OPD visits in 2001 (table 17). There were a total of 136.0 million drug mentions for an average of 162.5 drug mentions per 100 visits (table 18). Of the visits with medications, 62.8 percent had multiple drugs prescribed or continued for an average of 2.5 mentions per drug visit. The drug mention rate increased with age (figure 9). Data on the number of drug visits and drug mentions by clinic type are shown in table 18. The percent of visits with at least one drug mention ranged from 72.3 percent in general medicine clinics to 42.4 percent in surgery clinics. Drug mention rates varied by clinic type, ranging from 77.5 per 100 visits in obstetrics and

Advance Data No. 338 + August 5, 2003 9
Figure 9. Annual drug mention rates at outpatient department visits by patient’s age: United States, 2001
Figure 10. Annual drug mention rates at outpatient department visits by type of clinic: United States, 2001
gynecology clinics to 184.9 per 100 visits in general medicine clinics (figure 10).
Drug mentions are displayed by therapeutic class in table 19. This classification is based on the therapeutic categories used in the National Drug Code Directory, (NDC) 1995 edition (13). It should be noted that some drugs have more than one therapeutic application. In these cases, the drug was classified under its primary therapeutic use. Drugs used for relief of pain
(13.1 percent), respiratory tract problems (12.2 percent), and cardiovascular-renal problems (11.9 percent) were listed most frequently.
The 20 most frequently used generic substances for 2001 are shown in table 20. Drug products containing more than one ingredient (combination products) are included in the data for each ingredient. For example, acetaminophen with codeine is included in both the count for acetaminophen and the count for codeine. The most
frequently occurring generic substances in drugs mentioned at OPD visits were acetaminophen, amoxicillin, and ibuprofen.
The 20 most frequently mentioned medications according to the name written on the Patient Record form by hospital staff are shown in table 21. This could be a brand name, generic name, or therapeutic effect. Tylenol, classified as a nonnarcotic analgesic, was the drug most frequently mentioned. It accounted for 1.9 percent of all OPD drug mentions. Albuterol, classified as an antiasthmatic/bronchodilator, was prescribed at 1.6 percent of mentions. Other frequent drug mentions were amoxicillin (1.3 percent) and Motrin (1.1 percent).
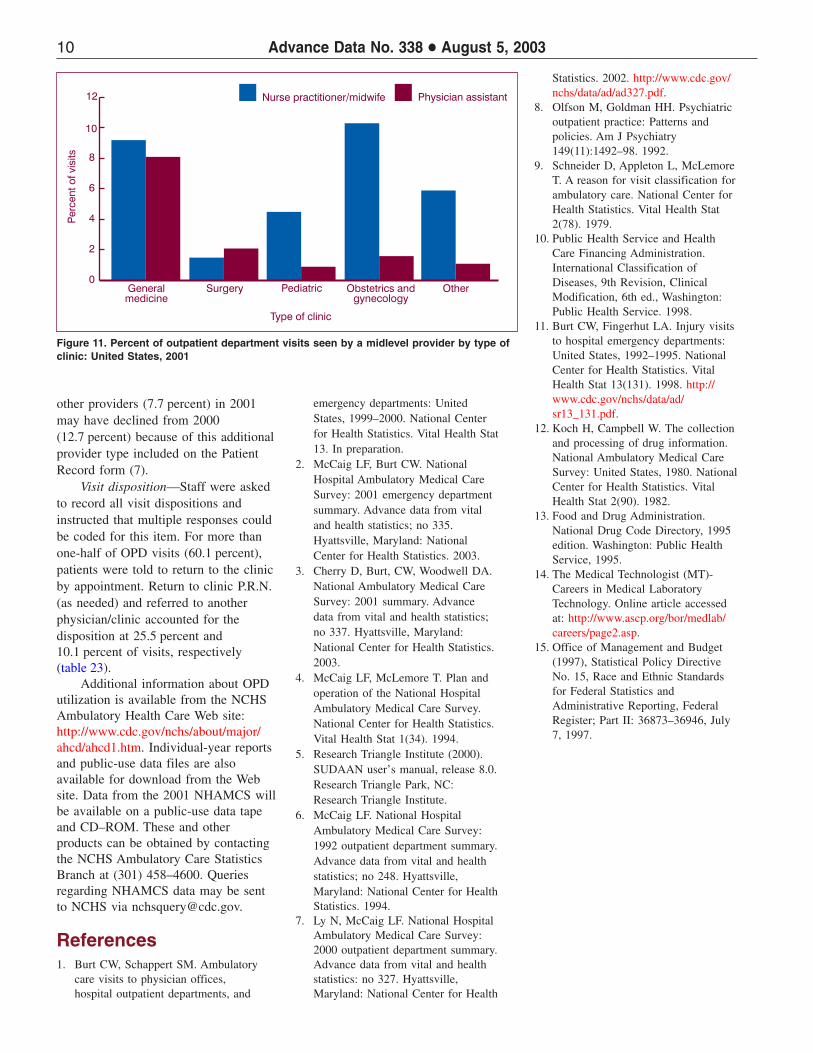
Providers seen—In this item, staff were asked to check all of the providers seen during the visit. A staff physician and resident or intern were seen at 72.0 percent and 13.5 percent of OPD visits, respectively (table 22). Visits in which any physician was seen (i.e., visits with staff physicians, residents/ interns, or other physicians) accounted for 79.9 percent of visits. The likelihood of seeing any physician was highest in surgery (90.3 percent) and pediatric clinics (87.8 percent), compared with 73.9 percent in general medicine clinics, 81.3 percent in obstetrics and gynecology clinics, and 60.9 percent in other clinics (data not shown). The proportion of visits involving midlevel providers (physician assistant or nurse practitioner/midwife) varied by clinic type (figure 11). Overall, only midlevel providers were seen at 10.2 percent of visits. This occurred most often in general medicine (14.6 percent) and obstetrics and gynecology clinics (9.0 percent) (data not shown). A registered nurse, medical/nursing assistant, and licensed practical nurse were seen at 39.5 percent, 13.7 percent, and 14.6 percent of visits, respectively. For the first time, the category ‘‘medical technician/technologist’’ was added to the list of providers seen. Visits to these providers accounted for 9.2 percent of visits. Medical technologists and technicians perform a full range of laboratory tests, then confirm and report their findings to pathologists and other physicians (14). The percent seen by all
10 Advance Data No. 338 + August 5, 2003
Figure 11. Percent of outpatient department visits seen by a midlevel provider by type of clinic: United States, 2001
other providers (7.7 percent) in 2001 may have declined from 2000 (12.7 percent) because of this additional provider type included on the Patient Record form (7).
Visit disposition—Staff were asked to record all visit dispositions and instructed that multiple responses could be coded for this item. For more than one-half of OPD visits (60.1 percent), patients were told to return to the clinic by appointment. Return to clinic P.R.N. (as needed) and referred to another physician/clinic accounted for the disposition at 25.5 percent and 10.1 percent of visits, respectively (table 23).
Additional information about OPD utilization is available from the NCHS Ambulatory Health Care Web site: http://www.cdc.gov/nchs/about/major/ ahcd/ahcd1.htm. Individual-year reports and public-use data files are also available for download from the Web site. Data from the 2001 NHAMCS will be available on a public-use data tape and CD–ROM. These and other products can be obtained by contacting the NCHS Ambulatory Care Statistics Branch at (301) 458–4600. Queries regarding NHAMCS data may be sent to NCHS via [email protected].
References 1. Burt CW, Schappert SM. Ambulatory
care visits to physician offices, hospital outpatient departments, and
emergency departments: United States, 1999–2000. National Center for Health Statistics. Vital Health Stat 13. In preparation.
2. McCaig LF, Burt CW. National Hospital Ambulatory Medical Care Survey: 2001 emergency department summary. Advance data from vital and health statistics; no 335. Hyattsville, Maryland: National Center for Health Statistics. 2003.
3. Cherry D, Burt, CW, Woodwell DA. National Ambulatory Medical Care Survey: 2001 summary. Advance data from vital and health statistics; no 337. Hyattsville, Maryland: National Center for Health Statistics. 2003.
4. McCaig LF, McLemore T. Plan and operation of the National Hospital Ambulatory Medical Care Survey. National Center for Health Statistics. Vital Health Stat 1(34). 1994.
5. Research Triangle Institute (2000). SUDAAN user’s manual, release 8.0. Research Triangle Park, NC: Research Triangle Institute.
6. McCaig LF. National Hospital Ambulatory Medical Care Survey: 1992 outpatient department summary. Advance data from vital and health statistics; no 248. Hyattsville, Maryland: National Center for Health Statistics. 1994.
7. Ly N, McCaig LF. National Hospital Ambulatory Medical Care Survey: 2000 outpatient department summary. Advance data from vital and health statistics: no 327. Hyattsville, Maryland: National Center for Health
Statistics. 2002. http://www.cdc.gov/ nchs/data/ad/ad327.pdf.
8. Olfson M, Goldman HH. Psychiatric outpatient practice: Patterns and policies. Am J Psychiatry 149(11):1492–98. 1992.
9. Schneider D, Appleton L, McLemore T. A reason for visit classification for ambulatory care. National Center for Health Statistics. Vital Health Stat 2(78). 1979.
10. Public Health Service and Health Care Financing Administration. International Classification of Diseases, 9th Revision, Clinical Modification, 6th ed., Washington: Public Health Service. 1998.
11. Burt CW, Fingerhut LA. Injury visits to hospital emergency departments: United States, 1992–1995. National Center for Health Statistics. Vital Health Stat 13(131). 1998. http:// www.cdc.gov/nchs/data/ad/ sr13_131.pdf.
12. Koch H, Campbell W. The collection and processing of drug information. National Ambulatory Medical Care Survey: United States, 1980. National Center for Health Statistics. Vital Health Stat 2(90). 1982.
13. Food and Drug Administration. National Drug Code Directory, 1995 edition. Washington: Public Health Service, 1995.
14. The Medical Technologist (MT)Careers in Medical Laboratory Technology. Online article accessed at: http://www.ascp.org/bor/medlab/ careers/page2.asp.
15. Office of Management and Budget (1997), Statistical Policy Directive No. 15, Race and Ethnic Standards for Federal Statistics and Administrative Reporting, Federal Register; Part II: 36873–36946, July 7, 1997.
Advance Data No. 338 + August 5, 2003 11
Table 1. Number, percent distribution, and annual rate of outpatient department visits with corresponding standard errors, by selected patient and hospital characteristics: United States, 2001
Number of Number of Standard Standard visits per Standard
visits in error in Percent error of 100 persons error of Selected patient and hospital characteristics thousands thousands distribution percent per year1,2 rate
All visits . . . . . . . . . . . . . . . . . . . . . . . . . . . . . . . . . 83,715 7,228 100.0 . . . 29.9 2.6
Patient characteristics Age: Under 15 years . . . . . . . . . . . . . . . . . . . . . . . . . . . . . 18,319 2,043 21.9 1.7 30.3 3.4 15–24 years . . . . . . . . . . . . . . . . . . . . . . . . . . . . . . . 9,834 890 11.7 0.6 25.3 2.3 25–44 years . . . . . . . . . . . . . . . . . . . . . . . . . . . . . . . 20,576 1,864 24.6 0.8 24.8 2.2 45–64 years . . . . . . . . . . . . . . . . . . . . . . . . . . . . . . . 21,590 2,080 25.8 1.1 33.7 3.2 65–74 years . . . . . . . . . . . . . . . . . . . . . . . . . . . . . . . 7,299 864 8.7 0.5 40.4 4.8 75 years and over . . . . . . . . . . . . . . . . . . . . . . . . . . . 6,097 1,015 7.3 0.9 39.0 6.5
Sex and age: Female . . . . . . . . . . . . . . . . . . . . . . . . . . . . . . . . . . 50,532 4,388 60.4 0.7 35.2 3.1
Under 15 years . . . . . . . . . . . . . . . . . . . . . . . . . . . 8,706 1,021 10.4 0.9 29.5 3.5 15–24 years . . . . . . . . . . . . . . . . . . . . . . . . . . . . . 6,738 609 8.0 0.5 34.8 3.2 25–44 years . . . . . . . . . . . . . . . . . . . . . . . . . . . . . 13,710 1,255 16.4 0.6 32.5 3.0 45–64 years . . . . . . . . . . . . . . . . . . . . . . . . . . . . . 13,029 1,299 15.6 0.7 39.5 3.9 65–74 years . . . . . . . . . . . . . . . . . . . . . . . . . . . . . 4,450 551 5.3 0.4 45.0 5.6 75 years and over . . . . . . . . . . . . . . . . . . . . . . . . . . 3,899 717 4.7 0.7 40.4 7.4
Male . . . . . . . . . . . . . . . . . . . . . . . . . . . . . . . . . . . 33,183 2,938 39.6 0.7 24.3 2.2 Under 15 years . . . . . . . . . . . . . . . . . . . . . . . . . . . 9,613 1,054 11.5 0.9 31.1 3.4 15–24 years . . . . . . . . . . . . . . . . . . . . . . . . . . . . . 3,096 359 3.7 0.3 15.8 1.8 25–44 years . . . . . . . . . . . . . . . . . . . . . . . . . . . . . 6,866 676 8.2 0.4 16.8 1.7 45–64 years . . . . . . . . . . . . . . . . . . . . . . . . . . . . . 8,561 845 10.2 0.5 27.6 2.7 65–74 years . . . . . . . . . . . . . . . . . . . . . . . . . . . . . 2,849 361 3.4 0.3 34.8 4.4 75 years and over . . . . . . . . . . . . . . . . . . . . . . . . . . 2,198 329 2.6 0.3 36.7 5.5
Race and age3: White . . . . . . . . . . . . . . . . . . . . . . . . . . . . . . . . . . . 63,226 6,239 75.5 1.8 27.9 2.7
Under 15 years . . . . . . . . . . . . . . . . . . . . . . . . . . . 13,163 1,595 15.7 1.3 28.5 3.4 15–24 years . . . . . . . . . . . . . . . . . . . . . . . . . . . . . 7,288 769 8.7 0.5 23.9 2.5 25–44 years . . . . . . . . . . . . . . . . . . . . . . . . . . . . . 15,463 1,583 18.5 0.7 23.2 2.4 45–64 years . . . . . . . . . . . . . . . . . . . . . . . . . . . . . 16,421 1,734 19.6 0.9 30.5 3.2 65–74 years . . . . . . . . . . . . . . . . . . . . . . . . . . . . . 5,878 793 7.0 0.5 37.4 5.0 75 years and over . . . . . . . . . . . . . . . . . . . . . . . . . . 5,013 944 6.0 0.9 35.8 6.7
Black or African American . . . . . . . . . . . . . . . . . . . . . . 17,032 1,506 20.3 1.7 48.8 4.3 Under 15 years . . . . . . . . . . . . . . . . . . . . . . . . . . . 4,328 665 5.2 0.7 45.7 7.0 15–24 years . . . . . . . . . . . . . . . . . . . . . . . . . . . . . 2,212 270 2.6 0.3 39.8 4.9 25–44 years . . . . . . . . . . . . . . . . . . . . . . . . . . . . . 4,236 426 5.1 0.5 41.0 4.1 45–64 years . . . . . . . . . . . . . . . . . . . . . . . . . . . . . 4,351 478 5.2 0.5 64.3 7.1 65–74 years . . . . . . . . . . . . . . . . . . . . . . . . . . . . . 1,131 139 1.4 0.2 70.1 8.6 75 years and over . . . . . . . . . . . . . . . . . . . . . . . . . . 774 124 0.9 0.1 67.3 10.8
Asian . . . . . . . . . . . . . . . . . . . . . . . . . . . . . . . . . . . 2,686 461 3.2 0.5 24.3 4.2 Native Hawaiian or other Pacific Islander . . . . . . . . . . . . . *397 129 *0.5 0.1 *85.2 27.8 American Indian or Alaska Native. . . . . . . . . . . . . . . . . . 253 75 0.3 0.1 9.5 2.8 Multiple races . . . . . . . . . . . . . . . . . . . . . . . . . . . . . . *120 39 *0.1 0.0 *3.0 1.0
Hospital characteristics Ownership: Voluntary . . . . . . . . . . . . . . . . . . . . . . . . . . . . . . . . . 59,803 6,620 71.4 4.5 21.4 2.4 Government . . . . . . . . . . . . . . . . . . . . . . . . . . . . . . . 22,215 4,000 26.5 4.3 7.9 1.4 Proprietary . . . . . . . . . . . . . . . . . . . . . . . . . . . . . . . . *1,697 821 *2.0 1.0 *0.6 0.3
Geographic region: Northeast . . . . . . . . . . . . . . . . . . . . . . . . . . . . . . . . 21,607 3,025 25.8 3.4 40.7 5.7 Midwest . . . . . . . . . . . . . . . . . . . . . . . . . . . . . . . . . 21,837 4,301 26.1 4.2 34.2 6.7 South . . . . . . . . . . . . . . . . . . . . . . . . . . . . . . . . . . . 27,506 4,133 32.9 4.1 27.6 4.1 West . . . . . . . . . . . . . . . . . . . . . . . . . . . . . . . . . . . 12,765 2,742 15.2 3.0 20.1 4.3
Metropolitan status: MSA4 . . . . . . . . . . . . . . . . . . . . . . . . . . . . . . . . . . . 70,454 6,496 84.2 4.2 31.4 2.9 Non-MSA4 . . . . . . . . . . . . . . . . . . . . . . . . . . . . . . . . 13,261 3,852 15.8 4.2 23.8 6.9
. . . Category not applicable. * Figure does not meet standard of reliability or precision. 1Visit rates for age, sex, race, and geographic region are based on U.S. Census Bureau estimates of the civilian noninstitutional population of the United States as of July 1, 2001. These population estimates reflect Census 2000 and are available from the U.S. Census Bureau. See ‘‘Technical Notes’’ for more detail. 22001 population estimates of MSA status are preliminary figures based on Census 2000 data and were obtained through the Office of Research and Methodology and Division of Health Interview Statistics, NCHS. 3The race groups, white, black or African American, Asian, Native Hawaiian or other Pacific Islander, American Indian or Alaska Native, and multiple races, include persons of Hispanic and not Hispanic origin. Persons of Hispanic origin may be of any race. Starting with data year 1999, race-specific estimates have been tabulated according to 1997 Standards for Federal Data on Race and Ethnicity and are not strictly comparable with estimates for earlier years. However, the percent of visit records with multiple races indicated is small and lower than what is typically found for self-reported race. See ‘‘Technical Notes’’ for more details. 4MSA is metropolitan statistical area.
NOTE: Numbers may not add to totals because of rounding.
12 Advance Data No. 338 + August 5, 2003
Table 2. Number, percent distribution, and annual rate of outpatient department visits with corresponding standard errors, by type of clinic: United States, 2001
Number of Standard Standard Visit rate Standard visits in error in Percent error of per 100 error of
Type of clinic1 thousands thousands distribution percent persons2 rate
All visits . . . . . . . . . . . . . . . . . . . . . . . . . . . . . . . . . 83,715 7,228 100 . . . 29.9 2.6
General medicine . . . . . . . . . . . . . . . . . . . . . . . . . . . 50,661 5,798 60.5 3.1 18.1 2.1 Pediatrics . . . . . . . . . . . . . . . . . . . . . . . . . . . . . . . . 11,084 1,379 13.2 1.4 4.0 0.5 Surgery. . . . . . . . . . . . . . . . . . . . . . . . . . . . . . . . . . 9,907 1,392 11.8 1.6 3.5 0.5 Obstetrics and gynecology . . . . . . . . . . . . . . . . . . . . . . 5,775 682 6.9 0.8 2.1 0.2 Other . . . . . . . . . . . . . . . . . . . . . . . . . . . . . . . . . . . 6,287 1,108 7.5 1.2 2.2 0.4
. . . Category not applicable. 1Only clinics under the supervision of a physician were included. Clinics specializing in radiology, laboratory services, physical rehabilitation, or other anciliary services were excluded. 2Visit rates are based on U.S. Census Bureau estimates of the civilian noninstitutional population of the United States as of July 1, 2001. These population estimates reflect Census 2000 and are available from the U.S. Census Bureau. See ‘‘Technical Notes’’ for more details.
NOTE: Numbers may not add to totals because of rounding.
Table 3. Number and percent distribution of outpatient department visits with corresponding standard errors by selected visit characteristics, according to prior-visit status: United States, 2001
Prior-visit status
Established New Primary care physician and referral status All visits patient patient Unknown/blank
Number of visits in thousands
All visits . . . . . . . . . . . . . . . . . . . . . . . . . . . . . . . . . 83,715 70,480 12,043 1,191
Visit to PCP1 . . . . . . . . . . . . . . . . . . . . . . . . . . . . . . 27,578 26,207 1,310 *60 Visit to non-PCP1 . . . . . . . . . . . . . . . . . . . . . . . . . . . 45,702 35,973 9,399 330
Referred by other physician . . . . . . . . . . . . . . . . . . . . 14,496 9,680 4,696 *119 Not referred by other physician . . . . . . . . . . . . . . . . . . 22,754 19,650 2,963 *141 Unknown if referred . . . . . . . . . . . . . . . . . . . . . . . . . 8,452 6,643 1,740 *69
Unknown if PCP1 visit . . . . . . . . . . . . . . . . . . . . . . . . . 10,435 8,301 1,334 *801
Standard error in thousands
All visits . . . . . . . . . . . . . . . . . . . . . . . . . . . . . . . . . 7,228 6,233 1,251 275
Visit to PCP1 . . . . . . . . . . . . . . . . . . . . . . . . . . . . . . 3,732 3,593 216 26 Visit to non-PCP1 . . . . . . . . . . . . . . . . . . . . . . . . . . . 4,932 4,071 1,063 74
Referred by other physician . . . . . . . . . . . . . . . . . . . . 2,264 1,785 624 46 Not referred by other physician . . . . . . . . . . . . . . . . . . 2,742 2,411 496 44 Unknown if referred . . . . . . . . . . . . . . . . . . . . . . . . . 1,091 875 311 21
Unknown if PCP1 visit . . . . . . . . . . . . . . . . . . . . . . . . . 1,875 1,717 305 256
Percent distribution
All visits . . . . . . . . . . . . . . . . . . . . . . . . . . . . . . . . . 100.0 100.0 100.0 100.0
Visit to PCP1 . . . . . . . . . . . . . . . . . . . . . . . . . . . . . . 32.9 37.2 10.9 *5.1 Visit to non-PCP1 . . . . . . . . . . . . . . . . . . . . . . . . . . . 54.6 51.0 78.0 27.7
Referred by other physician . . . . . . . . . . . . . . . . . . . . 17.3 13.7 39.0 *10.0 Not referred by other physician . . . . . . . . . . . . . . . . . . 27.2 27.9 24.6 *11.9 Unknown if referred . . . . . . . . . . . . . . . . . . . . . . . . . 10.1 9.4 14.5 *5.8
Unknown if PCP1 visit . . . . . . . . . . . . . . . . . . . . . . . . . 12.5 11.8 11.1 67.3
Standard error of percent
All visits . . . . . . . . . . . . . . . . . . . . . . . . . . . . . . . . . . . . . . . . . . . . .
Visit to PCP1 . . . . . . . . . . . . . . . . . . . . . . . . . . . . . . 3.3 3.7 1.7 2.3 Visit to non-PCP1 . . . . . . . . . . . . . . . . . . . . . . . . . . . 3.5 3.7 2.6 7.2
Referred by other physician . . . . . . . . . . . . . . . . . . . . 2.1 2.1 3.6 4.0 Not referred by other physician . . . . . . . . . . . . . . . . . . 2.4 2.6 2.9 4.1 Unknown if referred . . . . . . . . . . . . . . . . . . . . . . . . . 1.0 1.0 1.9 2.0
Unknown if PCP1 visit . . . . . . . . . . . . . . . . . . . . . . . . . 2.1 2.3 2.2 8.0
. . . Category not applicable. * Figure does not meet standard of reliability or precision. 1 PCP is patient’s primary care physician/provider.
NOTE: Numbers may not add to totals because of rounding.

Advance Data No. 338 + August 5, 2003 13
Table 4. Percent distribution of outpatient department visits with corresponding standard errors by type of clinic, according to primary care physician status and referral status: United States, 2001
Visit to non-PCP3
Referred Not referred Unknown Visit by other by other Unknown if PCP2
Type of clinic1 Total to PCP2 physician physician if referred visit
All visits . . . . . . . . . . . . . . . . . . . . . . . . . . . . . . . . . 100.0 32.9 17.3 27.2 10.1 12.5
General medicine . . . . . . . . . . . . . . . . . . . . . . . . . . . 100.0 41.7 13.0 23.7 9.5 12.1 Surgery. . . . . . . . . . . . . . . . . . . . . . . . . . . . . . . . . . 100.0 *5.9 37.6 33.8 13.0 9.7 Pediatrics . . . . . . . . . . . . . . . . . . . . . . . . . . . . . . . . 100.0 44.2 15.8 17.9 6.6 15.5 Obstetrics and gynecology . . . . . . . . . . . . . . . . . . . . . . 100.0 22.1 10.5 38.8 8.2 20.4 Other . . . . . . . . . . . . . . . . . . . . . . . . . . . . . . . . . . . 100.0 *2.7 25.0 47.4 17.0 *7.9
Standard error of percent
All visits . . . . . . . . . . . . . . . . . . . . . . . . . . . . . . . . . . . . 3.3 2.1 2.4 1.0 2.1
General medicine . . . . . . . . . . . . . . . . . . . . . . . . . . . . . . 4.9 3.1 3.2 1.4 2.4 Surgery. . . . . . . . . . . . . . . . . . . . . . . . . . . . . . . . . . . . . 1.9 3.0 3.9 2.6 2.1 Pediatrics . . . . . . . . . . . . . . . . . . . . . . . . . . . . . . . . . . . 5.6 3.4 4.2 1.6 3.4 Obstetrics and gynecology . . . . . . . . . . . . . . . . . . . . . . . . . 3.9 2.0 4.8 1.6 5.2 Other . . . . . . . . . . . . . . . . . . . . . . . . . . . . . . . . . . . . . . 1.1 4.4 7.1 4.4 3.1
. . . Category not applicable. * Figure does not meet standard of reliability or precision.1Only clinics under the supervision of a physician were included. Clinics specializing in radiology, laboratory services, physical rehabilitation, or other anciliary services were excluded.2PCP is patient’s primary care physician or provider.3Referral status only asked for visits to nonprimary care physicians or providers.
Table 5. Number and percent distribution of outpatient department visits with corresponding standard errors, by selected continuity-of-care visit characteristics: United States, 2001
Number of Standard Standard visits in error in Percent error of
Continuity-of-care visit characteristics thousands thousands distribution percent
All visits . . . . . . . . . . . . . . . . . . . . . . . . . . . . . . . . . 83,715 7,228 100.0 . . .
Prior-visit status and number of visits in last 12 months
Established patient. . . . . . . . . . . . . . . . . . . . . . . . . . . 70,480 6,233 84.2 0.9 None . . . . . . . . . . . . . . . . . . . . . . . . . . . . . . . . . . 3,288 391 3.9 0.3 1–2 visits . . . . . . . . . . . . . . . . . . . . . . . . . . . . . . . 18,385 1,788 22.0 1.2 3–5 visits . . . . . . . . . . . . . . . . . . . . . . . . . . . . . . . 19,135 2,002 22.9 1.1 6 visits or more . . . . . . . . . . . . . . . . . . . . . . . . . . . 21,020 2,241 25.1 1.6 Unknown . . . . . . . . . . . . . . . . . . . . . . . . . . . . . . . 8,652 1,940 10.3 2.1
New patient . . . . . . . . . . . . . . . . . . . . . . . . . . . . . . . 12,043 1,251 14.4 0.8 Unknown if patient previously seen. . . . . . . . . . . . . . . . . 1,191 275 1.4 0.3
Do other physicians share care for this problem?
Yes . . . . . . . . . . . . . . . . . . . . . . . . . . . . . . . . . . . . 26,662 3,559 31.8 3.2 No . . . . . . . . . . . . . . . . . . . . . . . . . . . . . . . . . . . . . 37,237 4,315 44.5 3.2 Unknown/blank . . . . . . . . . . . . . . . . . . . . . . . . . . . . . 19,816 2,629 23.7 2.6
Episode of care
Initial visit for problem . . . . . . . . . . . . . . . . . . . . . . . . . 26,071 3,223 31.1 2.3 Followup visit for problem . . . . . . . . . . . . . . . . . . . . . . 36,106 3,674 43.1 2.3 Unknown/blank . . . . . . . . . . . . . . . . . . . . . . . . . . . . . 8,569 1,159 10.2 1.2 Not applicable (preventive care visit)1 . . . . . . . . . . . . . . . 12,969 1,154 15.5 1.0
. . . Category not applicable. 1Preventive care includes routine prenatal, general, well-baby, screening, or insurance examinations.
NOTE: Numbers may not add to totals because of rounding.

14 Advance Data No. 338 + August 5, 2003
Table 6. Number and percent distribution of outpatient department visits with corresponding standard errors, by primary expected source of payment: United States, 2001
Number of Standard Standard visits in error in Percent error of
Primary expected source of payment thousands thousands distribution distribution
All visits . . . . . . . . . . . . . . . . . . . . . . . . . . . . . . . . . 83,715 7,228 100.0 . . .
Private insurance. . . . . . . . . . . . . . . . . . . . . . . . . . . . 30,893 3,791 36.9 2.3 Medicaid/SCHIP1 . . . . . . . . . . . . . . . . . . . . . . . . . . . . 20,267 1,833 24.2 1.9 Medicare . . . . . . . . . . . . . . . . . . . . . . . . . . . . . . . . . 13,492 1,809 16.1 1.4 Self-pay . . . . . . . . . . . . . . . . . . . . . . . . . . . . . . . . . 6,227 804 7.4 0.8 No charge/charity . . . . . . . . . . . . . . . . . . . . . . . . . . . *3,253 1,026 *3.9 1.2 Worker’s compensation . . . . . . . . . . . . . . . . . . . . . . . . 991 254 1.2 0.3 Other . . . . . . . . . . . . . . . . . . . . . . . . . . . . . . . . . . . 3,281 767 3.9 0.9 Unknown/blank . . . . . . . . . . . . . . . . . . . . . . . . . . . . . 5,312 852 6.4 0.9
. . . Category not applicable. * Figure does not meet standard of reliability or precision. 1SCHIP is State Children’s Health Insurance Program.
NOTE: Numbers may not add to totals because of rounding.
Table 7. Number and percent distribution of outpatient department visits with corresponding standard errors by patient’s principal reason for visit, United States, 2001
Number of Standard Standard visits in error in Percent errror of
Principal reason for visit and RVC code1 thousands thousands distribution percent
All visits . . . . . . . . . . . . . . . . . . . . . . . . . . . . . . . . . . . . . . . . . . . . . . . . . . . . 83,715 7,228 100.0 . . .
Symptom module. . . . . . . . . . . . . . . . . . . . . . . . . . . . . . . . . . . . . . . S001–S999 38,168 3,882 45.6 1.8 General symptoms . . . . . . . . . . . . . . . . . . . . . . . . . . . . . . . . . . . . S001–S099 4,378 460 5.2 0.3 Symptoms referable to psychological/mental disorders . . . . . . . . . . . . . . S100–S199 3,100 608 3.7 0.7 Symptoms referable to the nervous system (excluding sense organs) . . . . . S200–S259 2,231 266 2.7 0.2 Symptoms referable to the cardiovascular/lymphatic system . . . . . . . . . . . S260–S299 261 66 0.3 0.1 Symptoms referable to the eyes and ears . . . . . . . . . . . . . . . . . . . . . . S300–S399 3,582 522 4.3 0.4 Symptoms referable to the respiratory system . . . . . . . . . . . . . . . . . . . S400–S499 8,013 1,179 9.6 0.9 Symptoms referable to the digestive system. . . . . . . . . . . . . . . . . . . . . S500–S639 3,695 426 4.4 0.3 Symptoms referable to the genitourinary system . . . . . . . . . . . . . . . . . . S640–S829 2,660 261 3.2 0.2 Symptoms referable to the skin, hair, and nails . . . . . . . . . . . . . . . . . . . S830–S899 3,556 675 4.2 0.7 Symptoms referable to the musculoskeletal system . . . . . . . . . . . . . . . . S900–S999 6,691 830 8.0 0.7
Disease module . . . . . . . . . . . . . . . . . . . . . . . . . . . . . . . . . . . . . . . D001–D999 10,942 1,298 13.1 1.0 Diagnostic/screening and preventive module . . . . . . . . . . . . . . . . . . . . . . X100–X599 13,748 1,252 16.4 1.0 Treatment module . . . . . . . . . . . . . . . . . . . . . . . . . . . . . . . . . . . . . . .T100–T899 13,901 1,698 16.6 1.5 Injuries and adverse effects module . . . . . . . . . . . . . . . . . . . . . . . . . . . J001–J999 3,136 410 3.7 0.4 Test results module . . . . . . . . . . . . . . . . . . . . . . . . . . . . . . . . . . . . . R100–R700 1,846 263 2.2 0.2 Administrative module . . . . . . . . . . . . . . . . . . . . . . . . . . . . . . . . . . . . A100–A140 586 126 0.7 0.1 Other2 . . . . . . . . . . . . . . . . . . . . . . . . . . . . . . . . . . . . . . . . . . . . . U990–U999 1,388 306 1.7 0.4
. . . Category not applicable. 1 Based on A Reason for Classification for Ambulatory Care (RVC) (9). 2Includes problems and complaints not elsewhere classified, entries of ‘‘none,’’ blanks, and illegible entries.
NOTE: Numbers may not add to totals because of rounding.

Advance Data No. 338 + August 5, 2003 15
Table 8. Number and percent distribution of outpatient department visits with corresponding standard errors, by the 20 principal reasons for visit most frequently mentioned by patients: United States, 2001
Number of Standard Standard visits in error in Percent error of
Principal reason for visit and RVC code1 thousands thousands distribution percent
All visits . . . . . . . . . . . . . . . . . . . . . . . . . . . . . . . . . . . . . . . . . . . . . 83,715 7,228 100.0 . . .
Progress visit, not otherwise specified . . . . . . . . . . . . . . . . . . . . . . . T800 5,922 963 7.1 1.0 General medical examination . . . . . . . . . . . . . . . . . . . . . . . . . . . . X100 4,126 475 4.9 0.5 Cough . . . . . . . . . . . . . . . . . . . . . . . . . . . . . . . . . . . . . . . . . . S440 2,387 451 2.9 0.4 Prenatal examination, routine . . . . . . . . . . . . . . . . . . . . . . . . . . . . X205 2,310 303 2.8 0.4 Throat symptoms. . . . . . . . . . . . . . . . . . . . . . . . . . . . . . . . . . . . S455 2,058 360 2.5 0.3 Postoperative visit . . . . . . . . . . . . . . . . . . . . . . . . . . . . . . . . . . . T205 1,528 308 1.8 0.3 Counseling, not otherwise specified . . . . . . . . . . . . . . . . . . . . . . . . T605 1,330 290 1.6 0.3 Diabetes mellitus . . . . . . . . . . . . . . . . . . . . . . . . . . . . . . . . . . . . D205 1,328 385 1.6 0.4 Well-baby examination . . . . . . . . . . . . . . . . . . . . . . . . . . . . . . . . X105 1,318 197 1.6 0.2 Earache or ear infection . . . . . . . . . . . . . . . . . . . . . . . . . . . . . . . S355 1,283 236 1.5 0.2 Hypertension . . . . . . . . . . . . . . . . . . . . . . . . . . . . . . . . . . . . . . D510 1,225 310 1.5 0.3 Stomach and abdominal pain, cramps and spasms. . . . . . . . . . . . . . . S545 1,198 123 1.4 0.1 Medication, other and unspecified kinds. . . . . . . . . . . . . . . . . . . . . . T115 1,194 204 1.4 0.2 Skin rash. . . . . . . . . . . . . . . . . . . . . . . . . . . . . . . . . . . . . . . . . S860 1,122 176 1.3 0.2 Depression . . . . . . . . . . . . . . . . . . . . . . . . . . . . . . . . . . . . . . . S110 1,101 218 1.3 0.2 Headache, pain in head . . . . . . . . . . . . . . . . . . . . . . . . . . . . . . . S210 1,010 127 1.2 0.1 Fever . . . . . . . . . . . . . . . . . . . . . . . . . . . . . . . . . . . . . . . . . . . S010 981 141 1.2 0.1 Back symptoms. . . . . . . . . . . . . . . . . . . . . . . . . . . . . . . . . . . . . S905 967 137 1.2 0.1 Low back symptoms . . . . . . . . . . . . . . . . . . . . . . . . . . . . . . . . . . S910 835 153 1.0 0.2 Nasal congestion . . . . . . . . . . . . . . . . . . . . . . . . . . . . . . . . . . . . S400 827 141 1.0 0.1 All other reasons . . . . . . . . . . . . . . . . . . . . . . . . . . . . . . . . . . . . . . . . 49,665 4,371 59.3 1.3
. . . Category not applicable. 1Based on A Reason for Visit Classification for Ambulatory Care (RVC) (9).
NOTE: Numbers may not add to totals because of rounding.

16 Advance Data No. 338 + August 5, 2003
Table 9. Number and percent distribution of outpatient department visits with corresponding standard errors by major reason for visit,according to patient’s age, sex, and race: United States, 2001
Major reason for visit
Chronic Chronic Acute problem, problem, Pre- or post- Preventive Unknown/
Patient’s age, sex, and race Total problem routine flare-up surgery care1 blank
Number of visits in thousands
All visits . . . . . . . . . . . . . . . . . . . . . . . . . . . . . . . . . 83,715 31,738 26,017 6,619 3,230 12,969 3,142
Age
Under 15 years . . . . . . . . . . . . . . . . . . . . . . . . . . . . . 18,319 7,970 4,258 1,106 *588 3,936 460 15–24 years . . . . . . . . . . . . . . . . . . . . . . . . . . . . . . . 9,834 3,881 1,977 663 272 2,737 304 25–44 years . . . . . . . . . . . . . . . . . . . . . . . . . . . . . . . 20,576 8,790 5,243 1,643 795 3,267 838 45–64 years . . . . . . . . . . . . . . . . . . . . . . . . . . . . . . . 21,590 7,128 8,750 2,033 911 1,831 938 65–74 years . . . . . . . . . . . . . . . . . . . . . . . . . . . . . . . 7,299 2,190 3,044 665 *376 661 363 75 years and over . . . . . . . . . . . . . . . . . . . . . . . . . . . 6,097 1,779 2,745 510 288 536 *238
Sex
Female . . . . . . . . . . . . . . . . . . . . . . . . . . . . . . . . . . 50,532 18,371 15,133 3,987 1,752 9,443 1,847 Male . . . . . . . . . . . . . . . . . . . . . . . . . . . . . . . . . . . 33,183 13,368 10,884 2,632 1,478 3,526 1,295
Race2
White . . . . . . . . . . . . . . . . . . . . . . . . . . . . . . . . . . . 63,226 25,138 19,963 5,095 2,533 8,375 2,122 Black or African American . . . . . . . . . . . . . . . . . . . . . . 17,032 5,427 4,951 1,275 623 3,843 913 Other . . . . . . . . . . . . . . . . . . . . . . . . . . . . . . . . . . . 3,457 1,173 1,103 248 74 752 *107
Standard error in thousands
All visits . . . . . . . . . . . . . . . . . . . . . . . . . . . . . . . . . 7,228 3,681 2,610 935 496 1,154 551
Age
Under 15 years . . . . . . . . . . . . . . . . . . . . . . . . . . . . . 2,043 1,067 804 326 189 500 10215–24 years . . . . . . . . . . . . . . . . . . . . . . . . . . . . . . . 890 505 292 111 60 310 8925–44 years . . . . . . . . . . . . . . . . . . . . . . . . . . . . . . . 1,864 1,063 609 242 147 341 16545–64 years . . . . . . . . . . . . . . . . . . . . . . . . . . . . . . . 2,080 879 959 335 156 269 19065–74 years . . . . . . . . . . . . . . . . . . . . . . . . . . . . . . . 864 346 375 115 114 140 9875 years and over . . . . . . . . . . . . . . . . . . . . . . . . . . . 1,015 380 515 94 71 154 79
Sex
Female . . . . . . . . . . . . . . . . . . . . . . . . . . . . . . . . . . 4,388 2,195 1,595 569 267 843 346Male . . . . . . . . . . . . . . . . . . . . . . . . . . . . . . . . . . . 2,938 1,529 1,084 406 250 402 222
Race2
White . . . . . . . . . . . . . . . . . . . . . . . . . . . . . . . . . . . 6,239 3,275 2,274 801 451 828 374 Black or African American . . . . . . . . . . . . . . . . . . . . . . 1,506 664 470 188 104 448 255 Other . . . . . . . . . . . . . . . . . . . . . . . . . . . . . . . . . . . 536 219 211 59 22 175 32
Percent distribution
All visits . . . . . . . . . . . . . . . . . . . . . . . . . . . . . . . . . 100 37.9 31.1 7.9 3.9 15.5 3.8
Age
Under 15 years . . . . . . . . . . . . . . . . . . . . . . . . . . . . . 100 43.5 23.2 6.0 3.2 21.5 2.5 15–24 years . . . . . . . . . . . . . . . . . . . . . . . . . . . . . . . 100 39.5 20.1 6.7 2.8 27.8 3.1 25–44 years . . . . . . . . . . . . . . . . . . . . . . . . . . . . . . . 100 42.7 25.5 8.0 3.9 15.9 4.1 45–64 years . . . . . . . . . . . . . . . . . . . . . . . . . . . . . . . 100 33.0 40.5 9.4 4.2 8.5 4.3 65–74 years . . . . . . . . . . . . . . . . . . . . . . . . . . . . . . . 100 30.0 41.7 9.1 5.1 9.1 5.0 75 years and over . . . . . . . . . . . . . . . . . . . . . . . . . . . 100 29.2 45.0 8.4 4.7 8.8 *3.9
Sex
Female . . . . . . . . . . . . . . . . . . . . . . . . . . . . . . . . . . 100 36.4 29.9 7.9 3.5 18.7 3.7 Male . . . . . . . . . . . . . . . . . . . . . . . . . . . . . . . . . . . 100 40.3 32.8 7.9 4.5 10.6 3.9
Race2
White . . . . . . . . . . . . . . . . . . . . . . . . . . . . . . . . . . . 100 39.8 31.6 8.1 4.0 13.2 3.4 Black or African American . . . . . . . . . . . . . . . . . . . . . . 100 31.9 29.1 7.5 3.7 22.6 5.4 Other . . . . . . . . . . . . . . . . . . . . . . . . . . . . . . . . . . . 100 33.9 31.9 7.2 2.1 21.7 3.1
See footnotes at end of table.

Advance Data No. 338 + August 5, 2003 17
Table 9. Number and percent distribution of outpatient department visits with corresponding standard errors by major reason for visit, according to patient’s age, sex, and race: United States, 2001—Con.
Major reason for visit
Chronic Chronic Acute problem, problem, Pre- or post- Preventive Unknown/
Patient’s age, sex, and race Total problem routine flare-up surgery care1 blank
Standard error of percent
All visits . . . . . . . . . . . . . . . . . . . . . . . . . . . . . . . . . . . . 2.3 1.8 0.8 0.5 1.0 0.6
Age
Under 15 years . . . . . . . . . . . . . . . . . . . . . . . . . . . . . . . . 3.7 3.1 1.5 0.9 2.2 0.5 15–24 years . . . . . . . . . . . . . . . . . . . . . . . . . . . . . . . . . . 3.0 2.3 0.9 0.6 2.4 0.9 25–44 years . . . . . . . . . . . . . . . . . . . . . . . . . . . . . . . . . . 2.6 2.2 0.8 0.6 1.2 0.8 45–64 years . . . . . . . . . . . . . . . . . . . . . . . . . . . . .. . . . . . 2.4 2.4 1.1 0.6 0.9 0.9 65–74 years . . . . . . . . . . . . . . . . . . . . . . . . . . . . .. . . . . . 2.3 2.5 1.3 1.3 1.7 1.3 75 years and over . . . . . . . . . . . . . . . . . . . . . . . . . . . . . . 2.7 2.4 1.5 0.8 2.4 1.3
Sex
Female . . . . . . . . . . . . . . . . . . . . . . . . . . . . . . . . . . . . . 2.4 1.9 0.8 0.4 1.3 0.7 Male . . . . . . . . . . . . . . . . . . . . . . . . . . . . . . . . . . . . . . 2.4 2.0 0.9 0.6 0.9 0.6
Race2
White . . . . . . . . . . . . . . . . . . . . . . . . . . . . . . . . . . . . . . 2.6 2.1 0.9 0.6 1.1 0.6 Black or African American . . . . . . . . . . . . . . . . . . . . . . . . . 2.3 2.1 0.8 0.5 1.6 1.4 Other . . . . . . . . . . . . . . . . . . . . . . . . . . . . . . . . . . . . . . 3.2 4.0 1.4 0.6 3.4 0.8
. . . Category not applicable. * Figure does not meet standard of reliability or precision. 1Preventive care includes routine prenatal, general, screening, or insurance examinations. 2Other race includes visits by Asian, Native Hawaiian or other Pacific Islander, American Indian or Alaskan Native, and multiple races. All race categories include persons of Hispanic and not Hispanic origin. Persons of Hispanic origin may be of any race. Starting with data year 1999 race-specific estimates have been tabulated according to 1997 Standards for Federal Data on Race and Ethnicity and are not strictly comparable with estimates for earlier years. However, the percent of visit records with multiple races indicated is small and lower than what is typically found for self-reported race. See ‘‘Technical Notes’’ for more details.
NOTE: Numbers may not add to totals because of rounding.

18 Advance Data No. 338 + August 5, 2003
Table 10. Number, percent distribution, and annual rate of preventive care visits at outpatient departments with corresponding standard errors, by selected patient and visit characteristics: United States, 2001
Number of Number of Standard Standard visits per Standard
visits in error in Percent error of 100 persons error of Patient and visit characteristics thousands thousands distribution percent per year1 rate
All preventive care visits2 . . . . . . . . . . . . . . . . . . . . . . . 12,969 1,154 100.0 . . . 4.6 0.4
Age
Under 15 years . . . . . . . . . . . . . . . . . . . . . . . . . . . . . 3,936 500 30.4 3.0 6.5 0.8 15–24 years . . . . . . . . . . . . . . . . . . . . . . . . . . . . . . 2,737 310 21.1 1.8 7.0 0.8 25–44 years . . . . . . . . . . . . . . . . . . . . . . . . . . . . . . 3,267 341 25.2 1.3 3.9 0.4 45–64 years . . . . . . . . . . . . . . . . . . . . . . . . . . . . . . 1,831 269 14.1 1.4 2.9 0.4 65 years and over . . . . . . . . . . . . . . . . . . . . . . . . . . . 1,197 281 9.2 1.9 6.6 1.6
Sex and age
Female . . . . . . . . . . . . . . . . . . . . . . . . . . . . . . . . . . 9,443 843 72.8 1.7 6.6 0.6 Under 15 years . . . . . . . . . . . . . . . . . . . . . . . . . . . 1,947 249 15.0 1.4 6.6 0.8 15–24 years . . . . . . . . . . . . . . . . . . . . . . . . . . . . . 2,554 291 19.7 1.7 13.2 1.5 25–44 years . . . . . . . . . . . . . . . . . . . . . . . . . . . . . 2,923 313 22.5 1.3 6.9 0.7 45–64 years . . . . . . . . . . . . . . . . . . . . . . . . . . . . . 1,287 201 9.9 1.1 3.9 0.6 65 years and over . . . . . . . . . . . . . . . . . . . . . . . . . . 733 189 5.6 1.4 3.7 1.0
Male . . . . . . . . . . . . . . . . . . . . . . . . . . . . . . . . . . . 3,526 402 27.2 1.7 2.6 0.3 Under 15 years . . . . . . . . . . . . . . . . . . . . . . . . . . . 1,990 262 15.3 1.6 6.4 0.8 15–24 years . . . . . . . . . . . . . . . . . . . . . . . . . . . . . 184 47 1.4 0.3 0.9 0.2 25–44 years . . . . . . . . . . . . . . . . . . . . . . . . . . . . . 344 72 2.7 0.5 0.8 0.2 45–64 years . . . . . . . . . . . . . . . . . . . . . . . . . . . . . 544 101 4.2 0.6 1.8 0.3 65 years and over . . . . . . . . . . . . . . . . . . . . . . . . . . 465 126 3.6 0.9 3.3 0.9
Race3
White . . . . . . . . . . . . . . . . . . . . . . . . . . . . . . . . . . . 8,375 828 64.6 2.5 3.7 0.4 Black or African American . . . . . . . . . . . . . . . . . . . . . . 3,843 448 29.6 2.6 11.0 1.3 Other . . . . . . . . . . . . . . . . . . . . . . . . . . . . . . . . . . . 752 175 5.8 1.2 4.1 1.0
Primary expected source of payment
Medicaid/SCHIP4 . . . . . . . . . . . . . . . . . . . . . . . . . . . . 4,917 461 37.9 2.7 15.6 1.5 Private insurance. . . . . . . . . . . . . . . . . . . . . . . . . . . . 3,748 536 28.9 2.8 1.9 0.3 Self-pay/charity or no charge . . . . . . . . . . . . . . . . . . . . 1,665 284 12.8 1.8 4.0 0.7 Medicare . . . . . . . . . . . . . . . . . . . . . . . . . . . . . . . . . 1,143 284 8.8 2.0 3.0 0.7 Other5 . . . . . . . . . . . . . . . . . . . . . . . . . . . . . . . . . . 1,496 262 11.5 1.6 . . . . . .
. . . Category not applicable. 1Visit rates for age, sex, and race are based on U.S. Census Bureau estimates of the civilian noninstitutional population of the United States as of July 1, 2001. These population estimates reflect Census 2000 and are available from the U.S. Census Bureau. See the ‘‘Technical Notes’’ for more details. Visit rates by expected source of payment are based on Current Population Survey estimates on health insurance coverage. (Mills, B. Health Insurance Coverage: 2001 Current Population Reports. P60–220 September 2002.) 2Preventive care includes routine prenatal, general, well-baby, screening, or insurance examinations. 3Other race includes visits by Asian, Native Hawaiian or other Pacific Islander, American Indian or Alaskan Native, and multiple races. All race categories include persons of Hispanic and not Hispanic origin. Persons of Hispanic origin may be of any race. Starting with data year 1999, race-specific estimates have been tabulated according to 1997 Standards for Federal Data on Race and Ethnicity and are not strictly comparable with estimates for earlier years. However, the percent of visit records with multiple races indicated is small and lower than what is typically found for self-reported race. See ‘‘Technical Notes’’ for more details. 4SCHIP is State Children’s Health Insurance Program. 5Other includes worker’s compensation, unknown/blank, and payments not classified elsewhere.
NOTE: Numbers may not add to totals because of rounding.
Advance Data No. 338 + August 5, 2003 19
Table 11. Number and percent distribution of outpatient department visits with corresponding standard errors, by primary diagnosis: United States, 2001
Number of Standard Standard visits in error in Percent error of
Major disease category and ICD–9–CM code range1 thousands thousands distribution percent
All visits . . . . . . . . . . . . . . . . . . . . . . . . . . . . . . . . . . . . . . . . . . . . . . . . . 83,715 7,228 100.0 . . .
Infectious and parasitic diseases . . . . . . . . . . . . . . . . . . . . . . . . . . . . . 001–139 3,022 362 3.6 0.3 Neoplasms. . . . . . . . . . . . . . . . . . . . . . . . . . . . . . . . . . . . . . . . . . . 140–239 3,410 737 4.1 0.8 Endocrine, nutritional, metabolic diseases, immunity disorders . . . . . . . . . . . 240–279 4,315 635 5.2 0.6 Mental disorders . . . . . . . . . . . . . . . . . . . . . . . . . . . . . . . . . . . . . . . 290–319 6,668 1,131 8.0 1.3 Diseases of the nervous system and sense organs. . . . . . . . . . . . . . . . . . 320–389 6,737 965 8.0 0.8 Diseases of the circulatory system . . . . . . . . . . . . . . . . . . . . . . . . . . . . 390–459 5,627 748 6.7 0.7 Diseases of the respiratory system . . . . . . . . . . . . . . . . . . . . . . . . . . . . 460–519 9,860 1,482 11.8 1.2 Diseases of the digestive system . . . . . . . . . . . . . . . . . . . . . . . . . . . . . 520–579 3,081 371 3.7 0.3 Diseases of the genitourinary system . . . . . . . . . . . . . . . . . . . . . . . . . . 580–629 3,634 373 4.3 0.3 Diseases of the skin and subcutaneous tissue . . . . . . . . . . . . . . . . . . . . . 680–709 3,807 883 4.5 0.9 Diseases of the musculoskeletal and connective tissue . . . . . . . . . . . . . . . 710–739 4,928 596 5.9 0.5 Symptoms, signs, and ill-defined conditions . . . . . . . . . . . . . . . . . . . . . . 780–799 4,749 427 5.7 0.2 Injury and poisoning . . . . . . . . . . . . . . . . . . . . . . . . . . . . . . . . . . . . . 800–999 5,149 704 6.2 0.7 Supplementary classification . . . . . . . . . . . . . . . . . . . . . . . . . . . . . . . .V01–V82 14,298 1,259 17.1 1.1
All other diagnoses2 . . . . . . . . . . . . . . . . . . . . . . . . . . . . . . . . . . . . . . . . . . 3,211 401 3.8 0.4
Unknown3 . . . . . . . . . . . . . . . . . . . . . . . . . . . . . . . . . . . . . . . . . . . . . . . . 1,220 216 1.5 0.2
. . . Category not applicable. 1Based on the International Classification of Diseases, 9th Revision, Clinical Modification (ICD–9–CM) (10). 2Includes diseases of the blood and blood-forming organs (280–289); complications of pregnancy, childbirth, and the puerperium (630–677); congenital anomalies (740–759); certain conditions originating in perinatal period (760–779); and unique NHAMCS code (V99). 3 Includes blank diagnoses, uncodeable diagnoses, and illegible diagnoses.
NOTE: Numbers may not add to totals because of rounding.
Table 12. Number and percent distribution of outpatient department visits with corresponding standard errors, by primary diagnosis groups: United States, 2001
Number of Standard Standard visits in error in Percent error of
Primary diagnosis group and ICD–9–CM code(s)1 thousands thousands distribution percent
All visits . . . . . . . . . . . . . . . . . . . . . . . . . . . . . . . . . . . . . . . . . . . . . . . . . . . . 83,715 7,228 100.0 . . .
Acute upper respiratory infection, excluding pharyngitis . . . . . . . . . . . 460–461,463–466 3,297 565 3.9 0.5 Essential hypertension . . . . . . . . . . . . . . . . . . . . . . . . . . . . . . . . . . . . . . . . 401 3,205 498 3.8 0.5 Routine infant or child health check . . . . . . . . . . . . . . . . . . . . . . . . . . . . . . . V20.2 2,906 421 3.5 0.5 Diabetes mellitus . . . . . . . . . . . . . . . . . . . . . . . . . . . . . . . . . . . . . . . . . . . . 250 2,582 474 3.1 0.5 Malignant neoplasms . . . . . . . . . . . . . . . . . . . . . . . . . . . . . . . . 140–208,230–234 2,356 529 2.8 0.6 Normal pregnancy . . . . . . . . . . . . . . . . . . . . . . . . . . . . . . . . . . . . . . . . . . . V22 2,260 281 2.7 0.3 Otitis media and Eustachian tube disorders . . . . . . . . . . . . . . . . . . . . . . . . 381–382 1,833 335 2.2 0.3 Arthropathies and related disorders . . . . . . . . . . . . . . . . . . . . . . . . . . . . . 710–719 1,545 200 1.8 0.2 Spinal disorders . . . . . . . . . . . . . . . . . . . . . . . . . . . . . . . . . . . . . . . . . 720–724 1,539 217 1.8 0.2 Psychoses, excluding major despressive order . . . . . . . 290–295,296.0–296.1,296.4–299 1,330 285 1.6 0.3 Asthma . . . . . . . . . . . . . . . . . . . . . . . . . . . . . . . . . . . . . . . . . . . . . . . . . . 493 1,286 232 1.5 0.2 Chronic sinusitis . . . . . . . . . . . . . . . . . . . . . . . . . . . . . . . . . . . . . . . . . . . . 473 1,257 251 1.5 0.2 Potential health hazards relating to personal and family history . . . . . . . . . . . . V10–V19 1,220 242 1.5 0.2 Rheumatisms, excluding back . . . . . . . . . . . . . . . . . . . . . . . . . . . . . . . . . 725–729 1,183 177 1.4 0.2 General medical examination . . . . . . . . . . . . . . . . . . . . . . . . . . . . . . . . . . . . V70 1,170 225 1.4 0.3 Major depressive disorder . . . . . . . . . . . . . . . . . . . . . . . . . . . . . . . . . 296.2–296.3 1,097 270 1.3 0.3 Benign neoplasms . . . . . . . . . . . . . . . . . . . . . . . . . . . . . . . . . . 210–229,235–239 1,054 269 1.3 0.3 Acute pharyngitis . . . . . . . . . . . . . . . . . . . . . . . . . . . . . . . . . . . . . . . . . . . . 462 1,003 216 1.2 0.2 Heart disease, excluding ischemic . . . . . . 391–392.0,393–398,402,404,415–416,420–429 994 244 1.2 0.3 Allergic rhinitis . . . . . . . . . . . . . . . . . . . . . . . . . . . . . . . . . . . . . . . . . . . . . 477 *981 494 *1.2 0.6
All other diagnoses . . . . . . . . . . . . . . . . . . . . . . . . . . . . . . . . . . . . . . . . . . . . . 49,618 4,253 59.3 1.2
. . . Category not applicable. *Figure does not meet standard of reliability or precision. 1Based on the International Classification of Diseases, 9th Revision, Clinical Modification (ICD–9–CM) (10). However, certain codes have been combined in this table to describe the ulitization of ambulatory care services.
NOTE: Numbers may not add to totals because of rounding.

20 Advance Data No. 338 + August 5, 2003
Table 13. Number, percent distribution, and annual rate of injury-related outpatient department visits with corresponding standard errors, by patient’s age, sex, and race: United States, 2001
Number of Number of Standard Standard visits per
visits in error in Percent error of 100 persons Standard error Patient’s age, sex, and race thousands thousands distribution percent per year1 of rate
All injury-related visits . . . . . . . . . . . . . . . . . . . . . . . . . 11,145 1,233 100.0 . . . 4.0 0.4
Age
Under 15 years . . . . . . . . . . . . . . . . . . . . . . . . . . . . . 2,110 246 18.9 1.5 3.5 0.4 15–24 years . . . . . . . . . . . . . . . . . . . . . . . . . . . . . . . 1,667 263 15.0 1.4 4.3 0.7 25–44 years . . . . . . . . . . . . . . . . . . . . . . . . . . . . . . . 3,438 426 30.8 1.5 4.1 0.5 45–64 years . . . . . . . . . . . . . . . . . . . . . . . . . . . . . . . 2,578 324 23.1 1.6 4.0 0.5 65–74 years . . . . . . . . . . . . . . . . . . . . . . . . . . . . . . . 691 123 6.2 0.8 3.8 0.7 75 years and over . . . . . . . . . . . . . . . . . . . . . . . . . . . 661 164 5.9 1.3 4.2 1.0
Sex and age
Female . . . . . . . . . . . . . . . . . . . . . . . . . . . . . . . . . . 5,375 623 48.2 1.7 3.7 0.4 Under 15 years . . . . . . . . . . . . . . . . . . . . . . . . . . . 860 123 7.7 0.9 2.9 0.4 15–24 years . . . . . . . . . . . . . . . . . . . . . . . . . . . . . 673 110 6.0 0.7 3.5 0.6 25–44 years . . . . . . . . . . . . . . . . . . . . . . . . . . . . . 1,712 224 15.4 1.0 4.1 0.5 45–64 years . . . . . . . . . . . . . . . . . . . . . . . . . . . . . 1,297 199 11.6 1.3 3.9 0.6 65–74 years . . . . . . . . . . . . . . . . . . . . . . . . . . . . . 394 76 3.5 0.5 4.0 0.8 75 years and over . . . . . . . . . . . . . . . . . . . . . . . . . . 439 121 3.9 1.0 4.6 1.3
Male . . . . . . . . . . . . . . . . . . . . . . . . . . . . . . . . . . . 5,770 666 51.8 1.7 4.2 0.5 Under 15 years . . . . . . . . . . . . . . . . . . . . . . . . . . . 1,251 159 11.2 1.0 4.0 0.5 15–24 years . . . . . . . . . . . . . . . . . . . . . . . . . . . . . 994 187 8.9 1.2 5.1 1.0 25–44 years . . . . . . . . . . . . . . . . . . . . . . . . . . . . . 1,726 238 15.5 1.2 4.2 0.6 45–64 years . . . . . . . . . . . . . . . . . . . . . . . . . . . . . 1,281 172 11.5 1.0 4.1 0.6 65–74 years . . . . . . . . . . . . . . . . . . . . . . . . . . . . . 297 79 2.7 0.6 3.6 1.0 75 years and over . . . . . . . . . . . . . . . . . . . . . . . . . . 222 59 2.0 0.5 3.7 1.0
Race2
White . . . . . . . . . . . . . . . . . . . . . . . . . . . . . . . . . . . 8,809 1,096 79.0 2.0 3.9 0.5 Black or African American . . . . . . . . . . . . . . . . . . . . . . 2,029 232 18.2 2.0 5.8 0.7 Other . . . . . . . . . . . . . . . . . . . . . . . . . . . . . . . . . . . 308 63 2.8 0.5 1.7 0.3
. . . Category not applicable. 1Visit rates for age, sex, and race are based on U.S. Census Bureau estimates of the civilian noninstitutional population of the United States as of July 1, 2001. These population estimates reflect Census 2000 and are available from the U.S. Census Bureau. See the ‘‘Technical Notes’’ for more details. 2Other race includes visits by Asian, Native Hawaiian or other Pacific Islander, American Indian or Alaskan Native, and multiple races. All race categories include persons of Hispanic and not Hispanic origin. Persons of Hispanic origin may be of any race. Starting with data year 1999, race-specific estimates have been tabulated according to 1997 Standards for Federal Data on Race and Ethnicity and are not strictly comparable with estimates for earlier years. However, the percent of visit records with multiple races indicated is small and lower than what is typically found for self-reported race. See ‘‘Technical Notes’’ for more details.
NOTE: Numbers may not add to totals because of rounding.

Advance Data No. 338 + August 5, 2003 21
Table 14. Number and percent distribution of injury-related outpatient department visits with corresponding standard errors, by intent and mechanism of external cause: United States, 2001
Number of Standard Standard visits in error in Percent error of
Intent and mechanism1 thousands thousands distribution percent
All injury-related visits . . . . . . . . . . . . . . . . . . . . . . . . . . . . . . . . . . . . . . . 11,145 1,233 100.0 . . .
Unintentional injuries . . . . . . . . . . . . . . . . . . . . . . . . . . . . . . . . . . . . . . . 5,902 790 53.0 3.0 Falls . . . . . . . . . . . . . . . . . . . . . . . . . . . . . . . . . . . . . . . . . . . . . . . . 1,339 195 12.0 1.1 Motor vehicle traffic . . . . . . . . . . . . . . . . . . . . . . . . . . . . . . . . . . . . . . . 816 151 7.3 0.9 Struck against or struck accidentally by objects or persons . . . . . . . . . . . . . . 492 77 4.4 0.5 Natural and environmental factors . . . . . . . . . . . . . . . . . . . . . . . . . . . . . . 470 91 4.2 0.7 Cutting or piercing instruments or objects . . . . . . . . . . . . . . . . . . . . . . . . . 454 102 4.1 0.7 Overexertion and strenuous movements . . . . . . . . . . . . . . . . . . . . . . . . . . 419 100 3.8 0.7 Other and not elsewhere classified2 . . . . . . . . . . . . . . . . . . . . . . . . . . . . . 1,226 203 11.0 1.3 Mechanism unspecified . . . . . . . . . . . . . . . . . . . . . . . . . . . . . . . . . . . . 686 127 6.2 0.9
Intentional injuries3 . . . . . . . . . . . . . . . . . . . . . . . . . . . . . . . . . . . . . . . . . 185 33 1.7 0.3 Injuries of undetermined intent . . . . . . . . . . . . . . . . . . . . . . . . . . . . . . . . . * . . . * . . . Adverse effects of medical treatment. . . . . . . . . . . . . . . . . . . . . . . . . . . . . . 610 94 5.5 0.7 Blank cause4 . . . . . . . . . . . . . . . . . . . . . . . . . . . . . . . . . . . . . . . . . . . . 4,430 560 39.7 3.1
. . . Category not applicable. *Figure does not meet standard of reliability or precision. 1Based on the ‘‘Supplementary Classification of External Cause of Injury and Poisoning,’’ International Classification of Diseases, 9th Revision, Clinical Modification (ICD–9–CM) (10). A detailed description of the ICD–9–CM E-codes used to create the groupings in this table is provided in the ‘‘Technical Notes.’’ 2Includes suffocation, poisoning, machinery, firearm, fire and flames, drowning/submersion, nontraffic motor vehicle, pedal cycle, and other transportation. 3Includes assault, self-inflicted, and other causes of violence. 4Includes illegible entries and blanks.
NOTE: Numbers may not add to totals because of rouding.

22 Advance Data No. 338 + August 5, 2003
Table 15. Number and percent of outpatient department visits with corresponding standard errors, by diagnostic and screening services ordered or provided: United States, 2001
Number of Standard Standard visits in error in Percent error of
Diagnostic and screening services ordered or provided thousands1 thousands of visits percent
All visits . . . . . . . . . . . . . . . . . . . . . . . . . . . . . . . . . 83,715 7,228 . . . . . . None . . . . . . . . . . . . . . . . . . . . . . . . . . . . . . . . . . . 11,693 1,456 14.0 1.4
Diagnostic tests Blood pressure . . . . . . . . . . . . . . . . . . . . . . . . . . . . . 44,830 4,768 53.6 2.8 EKG2 . . . . . . . . . . . . . . . . . . . . . . . . . . . . . . . . . . . 2,157 391 2.6 0.4 Any scope procedure . . . . . . . . . . . . . . . . . . . . . . . . . 1,713 361 2.0 0.4
Sigmoidoscopy/colonoscopy . . . . . . . . . . . . . . . . . . . 1,072 261 1.3 0.3 Endoscopy . . . . . . . . . . . . . . . . . . . . . . . . . . . . . . 519 135 0.6 0.1 Cystoscopy . . . . . . . . . . . . . . . . . . . . . . . . . . . . . . *174 56 *0.2 0.1
Audiometry . . . . . . . . . . . . . . . . . . . . . . . . . . . . . . . *578 204 *0.7 0.2 Fetal monitoring . . . . . . . . . . . . . . . . . . . . . . . . . . . . 524 128 0.6 0.2 Tuberculin skin test . . . . . . . . . . . . . . . . . . . . . . . . . . 441 118 0.5 0.1 Cardiac stress test . . . . . . . . . . . . . . . . . . . . . . . . . . . *334 104 *0.4 0.1 EEG3 . . . . . . . . . . . . . . . . . . . . . . . . . . . . . . . . . . . 249 69 0.3 0.1
Laboratory tests CBC4 . . . . . . . . . . . . . . . . . . . . . . . . . . . . . . . . . . . 8,222 1,012 9.8 0.9 Urinalysis . . . . . . . . . . . . . . . . . . . . . . . . . . . . . . . . 6,653 676 7.9 0.7 Cholesterol . . . . . . . . . . . . . . . . . . . . . . . . . . . . . . . 2,450 297 2.9 0.3 Pap test . . . . . . . . . . . . . . . . . . . . . . . . . . . . . . . . . 2,387 279 2.9 0.3 Hematocrit/hemoglobin . . . . . . . . . . . . . . . . . . . . . . . . 1,810 239 2.2 0.3 PSA5 . . . . . . . . . . . . . . . . . . . . . . . . . . . . . . . . . . . 442 96 0.5 0.1
Cultures Any culture . . . . . . . . . . . . . . . . . . . . . . . . . . . . . . . 3,753 454 4.5 0.5
Throat/rapid strep test . . . . . . . . . . . . . . . . . . . . . . . 1,305 229 1.6 0.2 Urine . . . . . . . . . . . . . . . . . . . . . . . . . . . . . . . . . . 1,268 229 1.5 0.3 Cervical/urethral . . . . . . . . . . . . . . . . . . . . . . . . . . . 850 146 1.0 0.2 Stool . . . . . . . . . . . . . . . . . . . . . . . . . . . . . . . . . . 370 99 0.4 0.1
Imaging Any imaging . . . . . . . . . . . . . . . . . . . . . . . . . . . . . . . 11,428 1,455 13.7 1.2
X ray . . . . . . . . . . . . . . . . . . . . . . . . . . . . . . . . . . 6,171 847 7.4 0.8 Mammography . . . . . . . . . . . . . . . . . . . . . . . . . . . . 1,711 360 2.0 0.4 Ultrasound . . . . . . . . . . . . . . . . . . . . . . . . . . . . . . 1,170 170 1.4 0.2 Other imaging . . . . . . . . . . . . . . . . . . . . . . . . . . . . 3,523 782 4.2 0.8
Blank . . . . . . . . . . . . . . . . . . . . . . . . . . . . . . . . . . . 802 165 1.0 0.2
. . . Category not applicable. * Figure does not meet standard of reliabiity or precision.1Total exceeds ‘‘All visits’’ because more than one service may be reported per visit.2EKG is electrocardiogram.3EEG is electroencephalogram.4CBC is complete blood count.5PSA is prostate-specific antigen.
Table 16. Number and percent of outpatient department visits with corresponding standard errors, by counseling, education, or therapeutic services ordered or provided: United States, 2001
Number of Standard Standard Counseling, education, or therapeutic visits in error in Percent error of
services ordered or provided thousands1 thousands of visits percent
All visits . . . . . . . . . . . . . . . . . . . . . . . . . . . . . . . . . 83,715 7,228 . . . . . . None . . . . . . . . . . . . . . . . . . . . . . . . . . . . . . . . . . . 43,867 4,325 52.4 2.7
Diet/nutrition . . . . . . . . . . . . . . . . . . . . . . . . . . . . . . . 9,090 1,339 10.9 1.3 Mental health/stress management . . . . . . . . . . . . . . . . . 3,937 849 4.7 1.0 Exercise . . . . . . . . . . . . . . . . . . . . . . . . . . . . . . . . . 3,717 639 4.4 0.7 Psychotherapy . . . . . . . . . . . . . . . . . . . . . . . . . . . . . 3,366 663 4.0 0.8 Growth/development. . . . . . . . . . . . . . . . . . . . . . . . . . 2,582 390 3.1 0.5 Tobacco use/exposure . . . . . . . . . . . . . . . . . . . . . . . . 1,561 182 1.9 0.2 Asthma education . . . . . . . . . . . . . . . . . . . . . . . . . . . 1,297 251 1.5 0.3 Weight reduction . . . . . . . . . . . . . . . . . . . . . . . . . . . . 1,227 224 1.5 0.2 Physiotherapy. . . . . . . . . . . . . . . . . . . . . . . . . . . . . . *943 297 1.1 0.3 Other . . . . . . . . . . . . . . . . . . . . . . . . . . . . . . . . . . . 20,509 2,630 24.5 2.0
Blank . . . . . . . . . . . . . . . . . . . . . . . . . . . . . . . . . . . 1,698 337 2.0 0.4
. . . Category not applicable. *Figure does not meet standard of reliability or precision. 1Total exceeds ‘‘All visits’’ because more than one service may be reported per visit.

Advance Data No. 338 + August 5, 2003 23
Table 17. Number and percent distribution of outpatient department visits with corresponding standard errors, by medication therapy and number of medications provided or prescribed: United States, 2001
Number of Standard Standard visits in error in Percent error of
Medication therapy1 thousands thousands distribution percent
All visits . . . . . . . . . . . . . . . . . . . . . . . . . . . . . . . . . . . . . 83,715 7,228 100.0 . . . Drug visits2 . . . . . . . . . . . . . . . . . . . . . . . . . . . . . . . . . . . 54,090 5,012 64.6 1.7 Visits without mention of medication . . . . . . . . . . . . . . . . . . . . 29,625 2,828 35.4 1.7
Number of medications provided or prescribed
All visits . . . . . . . . . . . . . . . . . . . . . . . . . . . . . . . . . . . . . 83,715 7,228 100.0 . . . 0 . . . . . . . . . . . . . . . . . . . . . . . . . . . . . . . . . . . . . . . . . . 29,625 2,828 35.4 1.7 1 . . . . . . . . . . . . . . . . . . . . . . . . . . . . . . . . . . . . . . . . . . 20,127 1,970 24.0 1.0 2 . . . . . . . . . . . . . . . . . . . . . . . . . . . . . . . . . . . . . . . . . . 13,418 1,400 16.0 0.7 3 . . . . . . . . . . . . . . . . . . . . . . . . . . . . . . . . . . . . . . . . . . 7,563 789 9.0 0.4 4 . . . . . . . . . . . . . . . . . . . . . . . . . . . . . . . . . . . . . . . . . . 4,486 460 5.4 0.3 5 . . . . . . . . . . . . . . . . . . . . . . . . . . . . . . . . . . . . . . . . . . 2,524 295 3.0 0.2 6 . . . . . . . . . . . . . . . . . . . . . . . . . . . . . . . . . . . . . . . . . . 5,972 852 7.1 0.9
. . . Category not applicable. 1Includes prescription drugs, over-the-counter preparations, immunizations, and desensitizing agents. 2 Visits at which one or more drugs were provided or prescribed.
NOTE: Numbers may not add to totals because of rounding.

Table 18. Number and percent distribution of drug visits, drug mentions, and drug mention rates per 100 visits with corresponding standard errors, by type of clinic: United States, 2001
24
Drug visits Drug mentions Percent of drug visits Drug mention rates
Standard Number of Standard Standard Number of Standard Standard error Number of Standard
visits in error in Percent error of mentions in error in Percent error of Percent percent drug mentions error Type of clinic thousands1 thousands distribution percent thousands2 thousands distribution percent drug visits3 drug visits per 100 visits4 of rate
All visits . . . . . . . . . . . . . . . . . . . . . . . . . 54,090 5,012 100.0 . . . 136,050 12,993 100.0 . . . 64.6 1.7 162.5 6.8
General medicine . . . . . . . . . . . . . . . . . . . 36,648 4,374 67.8 3.1 93,648 10,887 68.8 3.2 72.3 2.1 184.9 8.7 Pediatrics . . . . . . . . . . . . . . . . . . . . . . . . 6,212 906 11.5 1.7 15,222 2,746 11.2 1.9 62.7 3.2 153.6 15.7 Surgery. . . . . . . . . . . . . . . . . . . . . . . . . . 4,699 663 8.7 1.1 12,480 2,121 9.2 1.3 42.4 3.7 112.6 14.7 Obstetrics and gynecology . . . . . . . . . . . . . . 2,660 356 4.9 0.6 4,475 711 3.3 0.5 46.1 2.9 77.5 7.8 Other . . . . . . . . . . . . . . . . . . . . . . . . . . . 3,871 741 7.2 1.3 10,225 1,971 7.5 1.4 61.6 5.1 162.6 16.6
. . . Category not applicable.1Visits at which one or more drugs were provided or prescribed by the physician.2Number of drugs mentioned at visits (up to six per visit).3Percent of visits to clinics that included one or more drug mentions (number of drug visits divided by number of clinic visits multiplied by 100).4Average number of drugs that were mentioned per 100 visits to each clinic (number of drug mentions divided by total number of visits multiplied by 100).
NOTE: Numbers may not add to totals because of rounding.
Table 19. Number, percent distribution, and annual rate of drug mentions at outpatient department visits with corresponding standard errors, by therapeutic classification: United States 2001
Number of Standard Standard Number of Standard drug mentions error in Percent error of drug mentions error of
Therapeutic classification1 in thousands thousands distribution percent per 100 visits2 rate
Advance D
ata No. 338 +
August 5, 2003
All drug mentions. . . . . . . . . . . . . . . . . . . . . . . . . . . . . . . . . . . 136,050 12,993 100.0 . . . 162.5 6.8
Drugs used for relief of pain . . . . . . . . . . . . . . . . . . . . . . . . . . . . 17,800 1,913 13.1 0.6 21.3 1.5 Respiratory tract drugs . . . . . . . . . . . . . . . . . . . . . . . . . . . . . . . 16,637 2,103 12.2 0.8 19.9 1.6 Cardiovascular-renal drugs. . . . . . . . . . . . . . . . . . . . . . . . . . . . . 16,197 2,095 11.9 0.8 19.3 1.8 Antimicrobial agents . . . . . . . . . . . . . . . . . . . . . . . . . . . . . . . . . 14,942 1,885 11.0 0.9 17.8 1.5 Central nervous system drugs . . . . . . . . . . . . . . . . . . . . . . . . . . . 12,291 1,484 9.0 0.9 14.7 1.4 Hormones and agents affecting hormonal mechanisms . . . . . . . . . . . 12,059 1,585 8.9 0.6 14.4 1.4 Metabolic/nutrients . . . . . . . . . . . . . . . . . . . . . . . . . . . . . . . . . . 9,163 1,147 6.7 0.5 10.9 1.0 Immunologics . . . . . . . . . . . . . . . . . . . . . . . . . . . . . . . . . . . . . 6,938 772 5.1 0.5 8.3 0.8 Gastrointestinal agents . . . . . . . . . . . . . . . . . . . . . . . . . . . . . . . 6,827 845 5.0 0.3 8.2 0.7 Skin/mucous membrane drugs . . . . . . . . . . . . . . . . . . . . . . . . . . 5,504 1,097 4.0 0.7 6.6 1.1 Neurologic drugs . . . . . . . . . . . . . . . . . . . . . . . . . . . . . . . . . . . 4,700 552 3.5 0.3 5.6 0.5 Hematologic agents . . . . . . . . . . . . . . . . . . . . . . . . . . . . . . . . . 2,630 345 1.9 0.2 3.1 0.4 Ophthalmics . . . . . . . . . . . . . . . . . . . . . . . . . . . . . . . . . . . . . . 2,107 399 1.5 0.2 2.5 0.4 Anesthetics . . . . . . . . . . . . . . . . . . . . . . . . . . . . . . . . . . . . . . 1,598 197 1.2 0.2 1.9 0.3 Oncolytics . . . . . . . . . . . . . . . . . . . . . . . . . . . . . . . . . . . . . . . 1,478 316 1.1 0.2 1.8 0.3 Otologics . . . . . . . . . . . . . . . . . . . . . . . . . . . . . . . . . . . . . . . . 871 146 0.6 0.1 1.0 0.1 Antiparasitics . . . . . . . . . . . . . . . . . . . . . . . . . . . . . . . . . . . . . 687 126 0.5 0.1 0.8 0.1 Contrast media/radiopharmaceuticals . . . . . . . . . . . . . . . . . . . . . . 57 15 0.0 0.0 0.1 0.0 Other and unclassified3 . . . . . . . . . . . . . . . . . . . . . . . . . . . . . . . 3,565 437 2.6 0.2 4.3 0.4
. . . Category not applicable. 0.0 Quantity more than zero but less than 0.5. 1Based on the standard drug classification used in the National Drug Code Directory, (NDC) 1995 edition (13). 2Number of drug mentions divided by total number of visits multiplied by 100. 3Includes antidotes, unclassified drugs, and homeopathic products.
NOTE: Numbers may not add to totals because of rounding.

Advance Data No. 338 + August 5, 2003 25
Table 20. Number and rate of generic substances for the 20 most frequently occurring generic substances in drug mentions at outpatient department visits with corresponding standard errors: United States, 2001
Number of Number of Standard substances Standard
occurrences in error in per 100 error of Generic substance thousands1 thousands drug mentions2 percent
Acetaminophen . . . . . . . . . . . . . . . . . . . . . . . . . . . . . 5,722 649 4.2 0.2 Amoxicillin . . . . . . . . . . . . . . . . . . . . . . . . . . . . . . . . 3,895 686 2.9 0.3 Ibuprofen. . . . . . . . . . . . . . . . . . . . . . . . . . . . . . . . . 3,019 386 2.2 0.2 Albuterol . . . . . . . . . . . . . . . . . . . . . . . . . . . . . . . . . 2,910 388 2.1 0.2 Hydrochlorothiazide . . . . . . . . . . . . . . . . . . . . . . . . . . 2,059 274 1.5 0.1 Guaifenesin . . . . . . . . . . . . . . . . . . . . . . . . . . . . . . . 1,953 422 1.4 0.2 Aspirin . . . . . . . . . . . . . . . . . . . . . . . . . . . . . . . . . . 1,923 309 1.4 0.1 Fluticasone propionate . . . . . . . . . . . . . . . . . . . . . . . . 1,921 286 1.4 0.1 Azithromycin . . . . . . . . . . . . . . . . . . . . . . . . . . . . . . 1,613 265 1.2 0.1 Furosemide . . . . . . . . . . . . . . . . . . . . . . . . . . . . . . . 1,528 267 1.1 0.1 Prednisone . . . . . . . . . . . . . . . . . . . . . . . . . . . . . . . 1,528 286 1.1 0.1 Levothyroxine . . . . . . . . . . . . . . . . . . . . . . . . . . . . . . 1,501 289 1.1 0.1 Hydrocodone . . . . . . . . . . . . . . . . . . . . . . . . . . . . . . 1,437 221 1.1 0.1 Atorvastatin calcium . . . . . . . . . . . . . . . . . . . . . . . . . . 1,433 276 1.1 0.1 Pseudoephedrine. . . . . . . . . . . . . . . . . . . . . . . . . . . . 1,417 396 1.0 0.2 Loratadine . . . . . . . . . . . . . . . . . . . . . . . . . . . . . . . . 1,289 198 0.9 0.1 Metformin . . . . . . . . . . . . . . . . . . . . . . . . . . . . . . . . 1,285 199 0.9 0.1 Trimethoprim . . . . . . . . . . . . . . . . . . . . . . . . . . . . . . 1,279 254 0.9 0.1 Clavulanate potassium . . . . . . . . . . . . . . . . . . . . . . . . 1,276 237 0.9 0.1 Rofecoxib . . . . . . . . . . . . . . . . . . . . . . . . . . . . . . . . 1,269 189 0.9 0.1
1Frequency of mention combines single-ingredient agents with mentions of the agent as an ingredient in a combination drug. 2Based on an estimated 136,050,000 drug mentions at outpatient department visits in 2001.
Table 21. Number, percent distribution, and therapeutic classification for the 20 drugs most frequently provided or prescribed at outpatient department visits with corresponding standard errors, by entry name of drug: United States, 2001
Number of Standard Standard visits in error in Percent error of
Entry name of drug1 thousands thousands distribution percent Therapeutic classification2
All drug mentions. . . . . . . . . . . . . . . . . . . . . . . 136,050 12,993 100.0 . . . . . .
Tylenol . . . . . . . . . . . . . . . . . . . . . . . . . . . . . 2,598 324 1.9 0.2 Nonnarcotic analgesics Albuterol . . . . . . . . . . . . . . . . . . . . . . . . . . . . 2,218 317 1.6 0.2 Antiasthmatics/bronchodilators Amoxicillin . . . . . . . . . . . . . . . . . . . . . . . . . . . 1,742 302 1.3 0.2 Penicillins Motrin. . . . . . . . . . . . . . . . . . . . . . . . . . . . . . 1,529 210 1.1 0.1 NSAIDs3
Prednisone . . . . . . . . . . . . . . . . . . . . . . . . . . 1,520 285 1.1 0.1 Adrenal corticosteroids Lipitor . . . . . . . . . . . . . . . . . . . . . . . . . . . . . . 1,431 276 1.1 0.1 Hyperlipidemia Lasix . . . . . . . . . . . . . . . . . . . . . . . . . . . . . . 1,366 234 1.0 0.1 Diuretics Vioxx . . . . . . . . . . . . . . . . . . . . . . . . . . . . . . 1,269 189 0.9 0.1 NSAIDs3
Paxil . . . . . . . . . . . . . . . . . . . . . . . . . . . . . . 1,231 201 0.9 0.1 Antidepressants Augmentin . . . . . . . . . . . . . . . . . . . . . . . . . . . 1,203 220 0.9 0.1 Penicillins Synthroid. . . . . . . . . . . . . . . . . . . . . . . . . . . . 1,191 261 0.9 0.2 Thyroid agents Prilosec. . . . . . . . . . . . . . . . . . . . . . . . . . . . . 1,159 201 0.9 0.1 Gastric antisecretory agents Ibuprofen. . . . . . . . . . . . . . . . . . . . . . . . . . . . 1,063 183 0.8 0.1 NSAIDs3
Zantac . . . . . . . . . . . . . . . . . . . . . . . . . . . . . 1,050 229 0.8 0.1 Gastric antisecretory agents Aspirin . . . . . . . . . . . . . . . . . . . . . . . . . . . . . 1,047 205 0.8 0.1 Nonnarcotic analgesics Celebrex . . . . . . . . . . . . . . . . . . . . . . . . . . . . 1,043 174 0.8 0.1 NSAIDs3
Prenatal vitamins . . . . . . . . . . . . . . . . . . . . . . . 1,041 189 0.8 0.1 Vitamins/minerals Keflex. . . . . . . . . . . . . . . . . . . . . . . . . . . . . . 1,005 165 0.7 0.1 Cephalosporins Glucophage . . . . . . . . . . . . . . . . . . . . . . . . . . 995 149 0.7 0.1 Blood glucose regulators Claritin . . . . . . . . . . . . . . . . . . . . . . . . . . . . . 992 148 0.7 0.1 Antihistamines All other mentions . . . . . . . . . . . . . . . . . . . . . . 109,354 10,288 80.4 0.6 . . .
. . . Category not applicable. 1The entry made by the hospital staff on the prescription or other medical records. This may be a trade name, generic name, or desired therapeutic effect. 2Theraputic classification is based on the National Drug Code Directory, 1995 Edition (13). In cases where a drug had more than one theraputic use, it was classified under its primary therapeutic use. 3NSAIDs are nonsteroidal anti-inflammatory drugs.
NOTE: Numbers may not add to totals because of rounding.

26 Advance Data No. 338 + August 5, 2003
Table 22. Number and percent of outpatient department visits with corresponding standard errors, by providers seen: United States, 2001
Number of Standard Standard visits in error in Percent error of
Type of provider thousands1 thousands of visits percent
All visits . . . . . . . . . . . . . . . . . . . . . . . . . . . . . . . . . . . . . . . . 83,715 7,228 . . . . . .
Any physician . . . . . . . . . . . . . . . . . . . . . . . . . . . . . . . . . . . . . 66,852 6,116 79.9 2.2 Staff physician . . . . . . . . . . . . . . . . . . . . . . . . . . . . . . . . . . . 60,296 5,812 72.0 2.5 Resident/intern . . . . . . . . . . . . . . . . . . . . . . . . . . . . . . . . . . . 11,338 1,393 13.5 1.6 Other physician . . . . . . . . . . . . . . . . . . . . . . . . . . . . . . . . . . 3,336 581 4.0 0.7
R.N.2 . . . . . . . . . . . . . . . . . . . . . . . . . . . . . . . . . . . . . . . . . . 33,085 3,932 39.5 3.5 L.P.N 3 . . . . . . . . . . . . . . . . . . . . . . . . . . . . . . . . . . . . . . . . . 12,210 1,912 14.6 2.1 Medical/nursing assistant . . . . . . . . . . . . . . . . . . . . . . . . . . . . . . 11,499 2,274 13.7 2.4 Medical technician/technologist . . . . . . . . . . . . . . . . . . . . . . . . . . 7,704 1,876 9.2 2.0 Nurse practitioner/midwife . . . . . . . . . . . . . . . . . . . . . . . . . . . . . 6,251 1,258 7.5 1.3 Physician assistant. . . . . . . . . . . . . . . . . . . . . . . . . . . . . . . . . . 4,590 1,232 5.5 1.4 Other provider . . . . . . . . . . . . . . . . . . . . . . . . . . . . . . . . . . . . 6,432 858 7.7 0.9
. . . Category not applicable.1Total exceeds ‘‘All visits’’ because more than one provider may be reported per visit.2R.N. is registered nurse.3L.P.N. is licensed practical nurse.
Table 23. Number and percent of outpatient department visits with corresponding standard errors, by visit disposition: United States,
Number of Standard Standard visits in error in Percent error of
Disposition thousands1 thousands of visits percent
All visits . . . . . . . . . . . . . . . . . . . . . . . . . . . . . . . . . . . . . . . . 83,715 7,228 . . . . . .
Return at specified time. . . . . . . . . . . . . . . . . . . . . . . . . . . . . . . 50,338 4,367 60.1 2.5 Return if needed, P.R.N.2 21,317 2,868 25.5 2.2 Referred to other physician . . . . . . . . . . . . . . . . . . . . . . . . . . . . 8,429 962 10.1 0.8 No followup planned . . . . . . . . . . . . . . . . . . . . . . . . . . . . . . . . . 6,904 1,071 8.2 1.0 Telephone followup planned . . . . . . . . . . . . . . . . . . . . . . . . . . . . 1,552 278 1.9 0.3 Admitted to hospital . . . . . . . . . . . . . . . . . . . . . . . . . . . . . . . . . 551 87 0.7 0.1 Other disposition . . . . . . . . . . . . . . . . . . . . . . . . . . . . . . . . . . . 1,795 347 2.1 0.4 Blank . . . . . . . . . . . . . . . . . . . . . . . . . . . . . . . . . . . . . . . . . . *1,738 736 *2.1 0.9
. . . Category not applicable. *Figure does not meet standard of reliability or precision. 1Total exceeds ‘‘All visits’’ because more than one disposition may be reported per visit. 2P.R.N. is as needed.
2001

Advance Data No. 338 + August 5, 2003 27
Table I. Coefficients appropriate for determining approximate relative standard errors by type of outpatient department estimate: National Hospital Ambulatory Medical Care Survey, 2001
Coefficient for use with estimates in thousands Lowest reliable estimate
Type of estimate A B in thousands
Visits . . . . . . . . . . . . . . . . . . . . 0.0132380 7.857 102 Drug mentions . . . . . . . . . . . . . . 0.0158950 18.087 244
Technical Notes
Data collection
The NHAMCS data collection is authorized under Section 308d of the Public Health Service Act (42 United States Code Section 306 [242k]). Participation is voluntary. In 2001, a sample of 479 general and short-stay hospitals was selected from the SMG Hospital Database. Of the 261 in-scope hospitals with eligible OPDs, 224 participated in the NHAMCS. Of the 224 participating OPDs, 99.6 percent responded fully or adequately, and 0.4 percent responded minimally for an unweighted OPD participation rate of 85.4 percent. A total of 1,166 clinics were selected from the OPDs. Of the 1,166 clinics, 1,036 provided 33,567 Patient Record forms. Of the 1,036 clinics that provided Patient Record forms, 97.0 percent responded fully or adequately, and 3.0 percent responded minimally. The clinic response rate was 86.2 percent, producing an overall OPD visit response rate of 73.6 percent.
The U.S. Census Bureau, acting as the data collection agent for the survey, provided training to field representatives (FRs) throughout the nation who, in turn, oversaw data collection at the hospital and clinic level. FRs contacted the sampled hospitals for induction into the survey after an advance letter was mailed by NCHS notifying the hospitals of their selection for the survey. Hospital staff were asked to complete the information requested on the Patient Record forms (figure I). However, in 54.4 percent of the hospital OPDs, FRs abstracted the data from medical records or computer printouts. No personally identifying information, such as patient name or address, is collected. Confidentiality of the data collected in the survey is protected under the Privacy Act, Public Health Service Act, Title 42 of the United States Code, Section 242m(d), and Title V of the E-Government Act of 2002.
Sampling errors
The standard error is primarily a measure of the sampling variability that occurs by chance when only a sample,
rather than an entire universe, is surveyed. The standard error also reflects part of the measurement error, but does not measure any systematic biases in the data. The chances are 95 out of 100 that an estimate from the sample differs from the value that would be obtained from a complete census by less than twice the standard error.
The standard errors presented in the tables and used in tests of significance for this report were approximated using SUDAAN software. SUDAAN computes standard errors by using a first-order Taylor approximation of the deviation of estimates from their expected values. A description of the software and the approach it uses has been published (5). The relative standard error (RSE) of an estimate is obtained by dividing the standard error by the estimate itself. The result is then expressed as a percent of the estimate. When it is not feasible to use statistical software, such as SUDAAN, for analyzing complex survey data, one may calculate approximate RSEs for aggregate estimates using the following general formula, where x is the aggregate of interest in thousands, and A and B are the appropriate coefficients from table I.
RSE(x) = 100* √A+B/x
Similarly, RSEs for an estimate of a percent may be calculated using the following general formula, where p is the percent of interest, expressed as a proportion, and x is the denominator of the percent in thousands, using the appropriate coefficient from table I.
RSE(x) = 100* √(B* (1–p))/p*x
The standard error for a rate may be obtained by multiplying the RSE of the total estimate by the rate.
Published and flagged estimates
Estimates are not presented unless a reasonable assumption regarding their probability distributions is possible on the basis of the Central Limit Theorem. This theorem states that given a sufficiently large sample size, the sample estimate approximates the population estimate and upon repeated sampling, its distribution would be approximately normal.
In this report, estimates are not presented if they are based on fewer than 30 cases in the sample data; only an asterisk (*) appears in the tables. Estimates based on 30 or more cases include an asterisk only if the RSE of the estimate exceeds 30 percent.
Estimation
Statistics from the NHAMCS are derived by a multistage estimation procedure that produces essentially unbiased estimates. The estimation procedure has the following three basic components:
+ inflation by reciprocals of the sampling selection probabilities
+ adjustment for nonresponse + a population weighting ratio
adjustment
NHAMCS data were adjusted to account for two types of nonresponse. The first type occurred when a sample hospital refused to provide information about its OPD that was publicly known to exist. In this case, the weights of visits to hospitals similar to the nonrespondent hospitals were inflated to account for visits represented by the nonrespondent hospitals. Hospitals were judged to be similar and grouped together for nonresponse purposes if they had the same ownership control

28 Advance Data No. 338 + August 5, 2003
group (voluntary, nonprofit versus other) and region. Beginning with 1998 data, hospitals were judged to be similar if they were in the same region (except in the West) and if they had the same MSA status (in an MSA versus not in an MSA). This adjustment was made separately by department type. This was done because the sample size was too small to use the finer breakdowns in the regions affected.
Beginning with 1997, the population weighting ratio adjustment for OPD estimates was replaced by an adjustment that controls for effects of rotating hospital sample panels into and out of the sample each year. (The full NHAMCS hospital sample is partitioned into 16 panels, which are rotated into the sample over 16 periods of 4 weeks each so that only 13 panels are used in any 1 year.) Also, beginning with 1997 data, the sampling weights of some OPDs were permanently trimmed. Modifications were made if the population-based primary sampling unit (PSU) selection probability was significantly smaller than the selection probability based on visits to the OPDs, the ideal measure of size, and if the OPD would otherwise have accounted for more than 15 percent of the estimated number of OPD visits in its region.
The second type of nonresponse occurred when a sample OPD clinic within a responding hospital failed to provide completed Patient Record forms for a sample of patient visits. The weights of visits from responding OPD clinics were inflated to account for visits to similar nonresponding OPD clinics where OPD clinics were judged to be similar if they were in the same region, clinic type, and ownership control group (voluntary, nonprofit versus other). There were six OPD clinic groups: (a) general medicine, (b) pediatrics, (c) surgery, (d) obstetrics and gynecology, (e) alcohol and/or substance abuse, and (f) other OPD clinic. Beginning with the 1998 data, formation of groups of similar clinics also considered the MSA status of the clinic (in an MSA versus not in an MSA) with the following two exceptions: in the West, MSA status was not considered; and in non-MSA clinics in the other three regions, ownership
control group (voluntary nonprofit versus other) was not considered.
Starting in 2001, clinics that responded minimally (i.e., provided substantially fewer Patient Record forms than expected) were considered nonrespondents for response rate calculations, but their records were included in the final data set. However, their visit weights were set not to exceed 50 percent of the clinic’s count of visits. The remaining weight for these minimally responding clinics was accounted for by in-scope, responding clinics of similar hospitals that were in the same PSU.
Nonsampling errors
As in any survey, results are subject to both sampling and nonsampling errors. Nonsampling errors include reporting and processing errors, as well as biases due to nonresponse and incomplete response. The magnitude of the nonsampling errors cannot be computed. However, these errors were kept to a minimum by procedures built into the operation of the survey. To eliminate ambiguities and to encourage uniform reporting, attention was given to the phrasing of questions, terms, and definitions. Also, pretesting of most data items and survey procedures was performed. Quality control procedures and consistency and edit checks reduced errors in data coding and processing. Coding errors ranged from 0.1 to 1.4 percent for various data items.
Item nonresponse rates in the NHAMCS are generally low (5 percent or less). However, levels of nonresponse can vary within the survey. Most nonresponse occurs when the needed information is not available in the medical record and/or is unknown to the person filling out the survey instrument. Nonresponse can also result when the information is available, but survey procedures are not followed and the item is left blank. In this report, the tables include a combined entry of unknown/blank to display missing data. For items where combined item nonresponse is between 30 and 50 percent, percent distributions are not discussed in the text. However, the information is shown in the tables.
These data should be interpreted with caution. If nonresponse is random, the observed distribution for the reported item (i.e., excluding cases for which the information is unknown) would be close to the true distribution. However, if nonresponse is not random, the observed distribution could vary significantly from the actual distribution. Researchers must decide how best to treat items with high levels of missing responses. For items with a nonresponse greater than 50 percent, data are not presented.
Weighted item nonresponse rates (i.e., if the item was left blank or the unknown box was marked) were 5.0 percent or less for all data items with the following exceptions: ethnicity (19.8 percent), use of tobacco (46.4 percent), primary expected source of payment (6.4 percent), primary care physician (12.5 percent), referral status (18.8 percent), past visits (11.8 percent), episode of care (10.2 percent), physicians sharing patient care (23.7 percent), and cause of injury (39.7 percent).
For some items, missing values were imputed by randomly assigning a value from Patient Record forms with similar characteristics. Imputations were based on geographic region, OPD volume by clinic type, and 3-digit ICD–9–CM codes for primary diagnosis. Imputations were performed for the following variables—birth year (0.7 percent), sex (2.5 percent), and race (15.4 percent). This represents a change from previous survey years when imputations were also performed for the following variables—ethnicity, disposition, and providers seen. Beginning in 1997, these latter items were no longer imputed. Blank or otherwise missing responses are noted in the data.
Tests of significance and rounding
Some figures in this report present 95-percent confidence intervals to indicate the stability of the point estimates relative to their individual stabilities. This permits the reader to assess substantive patterns in the data. However, it should be noted that examination of the amount of overlap

Advance Data No. 338 + August 5, 2003 29
Table II. Reclassification of external cause-of-injury codes for use with National Hospital Ambulatory Medical Care Survey data
Intent and mechanism of injury Cause-of-injury code1
Unintentional injuries . . . . . . . . . . . . . . . . . . . . . . . . . . . . . Falls . . . . . . . . . . . . . . . . . . . . . . . . . . . . . . . . . . . . . . Motor vehicle traffic . . . . . . . . . . . . . . . . . . . . . . . . . . . . . Struck against or struck accidentally by objects or persons . . . . Natural and environmental factors . . . . . . . . . . . . . . . . . . . . Cutting or piercing instruments or objects . . . . . . . . . . . . . . . Overexertion and strenuous movements . . . . . . . . . . . . . . . . Fire and flames, hot substance or object, caustic or corrosive material, and steam . . . . . . . . . . . . . . . . . . . . . . . . . . . .
Other and not elsewhere classified . . . . . . . . . . . . . . . . . . .
Mechanism unspecified . . . . . . . . . . . . . . . . . . . . . . . . . . Intentional injuries . . . . . . . . . . . . . . . . . . . . . . . . . . . . . . . Injuries of undetermined intent . . . . . . . . . . . . . . . . . . . . . . . Adverse effects of medical treatment. . . . . . . . . . . . . . . . . . . .
E800–E869, E880–E929E880.0–E886.9, E888E810–E819E916–E917E900–E909, E928.0–E928.2E920E927
E890–E899, E924E830, E832, E846–E848, E890–E899, E910–E915, E918, E921, E923, E925–E926,E929.0–E929.5E887, E928.3, E928.9, E929.8, E929.9E950–E959, E960–E969, E970–E978, E990–E999E980–E989E870–E879, E930–E949
1Based on the ‘‘Supplementary Classification of External Causes of Injury and Poisoning,’’ International Classification of Diseases, 9th Revision, Clinical Modification (ICD–9–CM) (11).
between intervals is not equivalent to standard significance testing for differences.
In this report, the determination of statistical inference is based on the two-tailed t-test. The Bonferroni inequality was used to establish the critical value for statistically significant differences (0.05 level of significance) based on the number of possible comparisons within a particular variable (or combination of variables) of interest. Terms relating to differences such as ‘‘greater than’’ or ‘‘less than’’ indicate that the difference is statistically significant. A lack of comment regarding the difference between any two estimates does not mean that the difference was tested and found to be not significant.
In the tables, estimates of OPD visits have been rounded to the nearest thousand. Consequently, estimates will not always add to totals. Rates and percents were calculated from original unrounded figures and do not necessarily agree with figures calculated from rounded data.
Race
The instructions for the race item on the Patient Record form was changed in 1999 to be consistent with standards issued by the Office of Management and Budget to promote comparability of data among Federal data sources and so that more than one race could be recorded per person (15). The new race item includes the following groups: white, black or African American, Asian,
Native Hawaiian or other Pacific Islander, and American Indian or Alaska Native. Respondents could check multiple categories for each patient. Prior to 1999, only a single race category could be checked per person. Because of the difference between single and multiple race reporting, race-specific estimates prior to 1999 are not strictly comparable with those from 1999 and subsequent years. From 1999 to the present, only a small proportion of records had multiple races indicated. Where reliable multiple- race estimates can be obtained, they are presented in one category. Estimates for specific race categories reflect visits where only a single race was reported.
According to the same standards, data on race and Hispanic origin were collected separately. Consequently, all race categories include visits by persons of Hispanic and not Hispanic origin. Persons of Hispanic origin may be of any race.
Injury groupings
Table 13 presents data on the intent and mechanism producing the injuries that resulted in visits to OPDs. Cause of injury is collected for each sampled injury visit in the NHAMCS and is coded according to the ICD–9–CM’s ‘‘Supplementary Classification of External Causes of Injury and Poisoning.’’ However, for table 13, the first-listed cause-of-injury data were grouped to highlight the interaction between intentionality of the injury and the mechanism that produced the injury.
Table II shows the E-code groupings used to produce this table.
Population figures and rate calculation
The 2001 visit rates for age, sex, race, and geographic region use Census 2000-based, postcensal estimates of the civilian noninstitutional population of the United States as of July 1, 2001, as prepared by the U.S. Census Bureau. Between 1992 and 2000, NAMCS and NHAMCS visit rates used 1990 census-based population estimates. The change in visit rates due to switching from the 1990 census-based population estimates to Census 2000-based population estimates presented in this report for age, sex, and race is minimal. For evaluating the effect of the change in base year, the 2000 NAMCS and NHAMCS visit rates were calculated using both the 1990-based population estimates and the 2000-based population estimates. In no case were differences in the two rates statistically significant. It is, therefore, reasonable to conclude that the effect of the change in base year has little impact on observed trends that cross these survey years. For more information on rate comparisons, see http://www.cdc.gov/nchs/about/major/ ahcd/ahcd1.htm.
The 2001 MSA population estimates based on Census 2000 were not available from the U.S. Census Bureau. Therefore, the 2002 MSA estimates, which were available, were used to calculate the proportions of population in MSA and non-MSA areas. The

30 Advance Data No. 338 + August 5, 2003
Census 2000-based 2001 total population estimate was then multiplied by those proportions to generate population estimates by MSA status for this report.
Population estimates for race groups in the 2001 NAMCS and NHAMCS are based on Census 2000 where respondents were able to indicate more than one race category (as requested by the 1997 Standards for Federal Data on Race and Ethnicity) (15). The multiple-race indication was adopted by the 1999 NAMCS and NHAMCS, but the denominators that were available for calculating rates in 1999 and 2000 were based on estimates from the 1990 census, which indicated single-response race categories. The NAMCS and NHAMCS had very few records for multiple-race persons, so rates for single-race groups were calculated by dividing estimates by denominators that included some unidentifiable multiple-race persons. Starting with 2001, the denominators used for calculating race-specific visit rates reflect the transition to multiple-race reporting. Specific race denominators reflect persons with a single race identification, and a separate denominator is available for persons of multiple races. In this report, a visit rate for white persons, for example, uses a denominator that reflects the ‘‘white only’’ population, and the numerator is the number of visits where white and no other race category was reported as the patient’s race by the health care provider.
Data indicate that multiple races are recorded less frequently in medical records than occur in the general population. The 2001 population estimates indicate that multiple-race persons account for 1.4 percent of the total population, whereas multiple-race patients (as indicated by the provider) account for 0.3 percent of physician office visits. This difference exists because physicians are less likely to know and record the multiple-race preference of the patient, and not because, after age-adjusting, persons with multiple races make fewer doctor visits. This implies that the race population rates calculated in 2001 are probably slight ‘‘overestimates’’ for the
single-race categories and ‘‘underestimates’’ for the multiple-race category.
Definition of terms
Clinic—A clinic is an administrative unit of the outpatient department where ambulatory medical care is provided under the supervision of a physician. The following are examples of the types of clinics included in the NHAMCS: general medicine, surgery, pediatrics, obstetrics and gynecology, substance abuse (excluding methadone maintenance), and others (e.g., psychiatry and neurology). Clinics excluded from the NHAMCS include ambulatory surgery centers, chemotherapy, employee health service, renal dialysis, methadone maintenance, and radiology.
Continuity of care—Continuity of care is a goal of health care achieved through an interdisciplinary process involving patients, families, health care professionals, and providers in the management of a coordinated plan of care. Based on changing needs and available resources, the process optimizes quality outcomes in the health status of clients. It may involve professionals from many different disciplines within multiple systems.
Drug mention—A drug mention is the health care provider’s entry on the Patient Record form of a pharmaceutical agent—by any route of administration—for prevention, diagnosis, or treatment. Generic as well as brand name drugs are included, as are nonprescription and prescription drugs. Along with all new drugs, the physician also records continued medications if the patient was specifically instructed during the visit to continue the medication. Health care providers may report up to six medications per visit.
Drug visit—A drug visit is a visit at which medication was prescribed or provided by the physician.
Emergency department—An emergency department (ED) is a hospital facility for the provision of unscheduled outpatient services to patients whose conditions require immediate care and is staffed 24 hours a day.
Episode of care—This term attempts to measure the nature of the care provided at the visit: an initial visit versus a followup visit. An episode of care begins with the initial visit for care for a particular problem and ends when the patient is no longer continuing treatment. A problem may recur later, but that is considered a new episode of care. An initial visit may be diagnostic in nature, whereas a followup visit may be to check progress or continue therapy.
Followup visit—Care was previously provided for this problem. This is the second or subsequent visit for this problem or complaint.
Hospital—To be in-scope for the NHAMCS, a hospital must have an average length of stay for all patients of less than 30 days (short stay) or be a hospital whose specialty is general (medical or surgical) or children’s general, except Federal hospitals, hospital units of institutions, and hospitals with fewer than six beds staffed for patient use.
Illness-related visit—A visit is considered illness-related if it was not an injury visit as defined below.
Initial visit—This is the first visit by a patient for care of a particular problem or complaint.
Injury-related visit—A visit is injury-related if ‘‘Yes’’ was checked in response to item 4a, ‘‘Is this visit related to injury or poisoning?’’ or if a cause-of-injury or a nature-of-injury diagnosis was provided, or if an injury-related reason for visit was reported.
Outpatient department—An outpatient department is a hospital facility where nonurgent ambulatory medical care is provided under the supervision of a physician.
Ownership—Hospitals are designated according to the primary owner of the hospital based on the SMG Hospital Database.
Voluntary nonprofit—Hospitals that are church-related or are a nonprofit corporation or have other nonprofit ownership.
Government, non-Federal— Hospitals that are operated by State, county, city, city-county, or hospital district or authority.

Advance Data No. 338 + August 5, 2003 31
Figure I. Patient Record form
32 Advance Data No. 338 + August 5, 2003
Proprietary—Hospitals that are individually owned or are partnerships or corporations.
Patient—An ambulatory patient is an individual seeking personal health services who is not currently admitted to any health care institution on the premises.
Primary care physician/ provider—The primary care physician/
Suggested citation
Hing E, Middleton K. National Hospital Ambulatory Medical Care Survey: 2001 outpatient department summary. Advance data from vital and health statistics; no 338. Hyattsville, Maryland: National Center for Health Statistics. 2003.
U.S. DEPARTMENT OFHEALTH & HUMAN SERVICES
Centers for Disease Control and PreventionNational Center for Health Statistics3311 Toledo RoadHyattsville, Maryland 20782
OFFICIAL BUSINESSPENALTY FOR PRIVATE USE, $300
To receive this publication regularly, contactthe National Center for Health Statistics bycalling 301-458-4636E-mail: [email protected]: www.cdc.gov/nchs
DHHS Publication No. (PHS) 2003-125003-0347 (07/03)
provider (PCP) plans and provides the comprehensive health care of the patient. A visit to the patient’s PCP is one in which health care is provided by the patient’s PCP or by a provider substituting for the patient’s PCP.
Visit—A visit is a direct, personal exchange between an ambulatory patient
Trade name disclaimer
The use of trade names is for identification only and does not imply endorsement by the Centers for Disease Control and Prevention, U.S. Department of Health and Human Services.
Copyright information
All material appearing in this report is in the public domain and may be reproduced or copied without permission; citation as to source, however, is appreciated.
seeking care and a physician or a hospital staff member working under the physician’s supervision for the purpose of rendering personal health services. Excluded from the NHAMCS are visits where medical care was not provided, such as visits made to drop off specimens, pay bills, and make appointments.
National Center for Health Statistics
Director Edward J. Sondik, Ph.D.
Deputy Director Jack R. Anderson
MEDIA MAIL POSTAGE & FEES PAID
CDC/NCHS PERMIT NO. G-284