Embed Size (px)
Citation preview

National Household Travel Survey
California Data (NHTS-CA)
Planning HorizonsDecember 11, 2013
10:00-12:00
Office of Travel Forecasting and AnalysisCaltrans, Division of Transportation
Planning

IN ANTIQUITY
Man Asked:• Who am I ?• Where am I ?• How did I get here?• How Do I Get There?

Who - Socio-economic characteristics of Persons, Households, Workers and Drivers
Where – Live, Work, Shop, Play
Why – Activity, Origin/Destination
What – Vehicles, Transportation Issue
When – Time , Day of the Week
How - Mode, VMT (how far - miles), VHT (how long – hours) mode
Today, these questions and a lot more are answered in the Household Travel
Surveys

Who Are We? – Age/Gender
5 6-15 16-20
21-25
26-30
31-35
36-40
41-45
46-50
51-55
56-60
61-65
66-70
71-75
76-80
81-85
86-88
89+0
500
1000
1500
2000
2500
3000
Male Female


Who Are We? - Lifecycle
0 5 10 15 20 25
2+ adults, retired, no childrenone adult, retired, no children
2+ adults, youngest child 16-21one adult, youngest child 16-21
2+ adults, youngest child 6-15one adult, youngest child 6-15
2+ adults, youngest child 0-5one adult, youngest child 0-5
2+ adults, no childrenone adult, no children
Percent of Households by Lifecycle

Household Income Distribution
> = $100,000$80,000 - $99,999$75,000 - $79,999$70,000 - $74,999$65,000 - $69,999$60,000 - $64,999$55,000 - $59,999$50,000 - $54,999$45,000 - $49,999$40,000 - $44,999$35,000 - $39,999$30,000 - $34,999$25,000 - $29,999$20,000 - $24,999$15,000 - $19,999$10,000 - $14,999
$5,000 - $9,999< $5,000
0 300 600 900 1,200 1,500 1,800 2,100 2,400 2,700
Total Households (Thousands)

Distribution of Incomes for One Adult, Youngest Child 0-5 Households
> = $100,000$80,000 - $99,999$75,000 - $79,999$70,000 - $74,999$65,000 - $69,999$60,000 - $64,999$55,000 - $59,999$50,000 - $54,999$45,000 - $49,999$40,000 - $44,999$35,000 - $39,999$30,000 - $34,999$25,000 - $29,999$20,000 - $24,999$15,000 - $19,999$10,000 - $14,999
$5,000 - $9,999< $5,000
0 5 10 15 20 25 30 35

Who Are We? – Job Category
5,412
1,9643,451
6,672
213
Total Workers by Job Cat-egory
Sales / serviceClerical / admin supportManuf, construct, maintenance, or farmingProfessional, managerial, or technicalOther

One Adult, Youngest Child 0-5 Households by Job Category
Sales /
servi
ce
Clerical
/ admin su
pport
Manuf, c
onstruct,
main
tenance
, or f
arming
Professional,
man
ageria
l, or t
echnica
lOther
01020304050 44.6
17.8 15.121.8
0.5
Perc
ent

Households by Household Vehicle Count

What are We Driving?
DODGE
FORD
CHEV
ROLE
TGM
C
VOLK
SWAG
ENBM
W
NIS
SAN /
DATS
UN
HONDA
MER
CEDES
BEN
Z
TOYO
TA
LEXUS
0500
1,0001,5002,0002,5003,0003,5004,0004,500
1,053
3,091
2,405
525 457 476
1,263
2,713
493
4,112
477
Total Vehicles by Vehicle Make
Tota
l V
eh
icle
(Th
ou
san
ds)

What Type of Vehicle?
12,525
1,757
4,186
3,697
51 167 685 3 23
Vehicles by Vehicle Type
Automobile/car/station wagonVan (mini, cargo, passenger)Sports utility vehiclePickup truckOther truckRV (recreational vehicle)MotorcycleGolf cartOther

< $5,000
$5,000 - $9,999
$10,000 - $14,999
$15,000 - $19,999
$20,000 - $24,999
$25,000 - $29,999
$30,000 - $34,999
$35,000 - $39,999
$40,000 - $44,999
$45,000 - $49,999
$50,000 - $54,999
$55,000 - $59,999
$60,000 - $64,999
$65,000 - $69,999
$70,000 - $74,999
$75,000 - $79,999
$80,000 - $99,999
> = $100,000
0
2,000
4,000
6,000
8,000
10,000
12,000
14,000
16,000
Average Annual Vehicle Miles Traveled (VMT) by Income Distribution

Average Minutes Spent Driving Per Person, Per Day Sacramento, Los Angeles, San Diego and San Francisco
by Household Composition
one adult, no ch
ildre
n
2+ adults, n
o child
ren
one adult, youngest
child
0-5
2+ adults, y
oungest ch
ild 0-5
one adult, youngest
child
6-15
2+ adults, y
oungest ch
ild 6-15
one adult, youngest
child
16-21
2+ adults, y
oungest ch
ild 16-21
one adult, re
tired, n
o child
ren
2+ adults, r
etired, n
o child
ren
0
20
40
60
80
100
120
Los Angeles Sacramento San Diego San Francisco

Highway congesti
on
Access
to / a
vailabilit
y of public
transit
Lack
of walkways o
r sidewalks
Price of t
ravel
Aggressi
ve / dist
racted driv
ers
Safety conce
rns
0%5%
10%15%20%25%30%35%
23%
9%2%
29%
15% 15%
Importance of Transportation Issues

0%
20%
40%
12% 7% 2%
39%21% 19%
Fresno
0%
20%
40%
11% 3% 3%
31%17%
34%Imperial
0%
10%
20%
30%15%
28%
2%
22% 18% 15%
San Francisco


Traffic Congestion Issue
> = $100,000$80,000 - $99,999$75,000 - $79,999$70,000 - $74,999$65,000 - $69,999$60,000 - $64,999$55,000 - $59,999$50,000 - $54,999$45,000 - $49,999$40,000 - $44,999$35,000 - $39,999$30,000 - $34,999$25,000 - $29,999$20,000 - $24,999$15,000 - $19,999$10,000 - $14,999
$5,000 - $9,999< $5,000
0 10 20 30 40 50 60 70 80
Respondent's View on Traffic Congestion by Income
A big issue A moderate issue A little issue
Percent

20
Objective of SCAG Study• Is to use NHTS data to provide updated travel characteristics for
SCAG region. • This presentation includes results of following analysis:1. Overall demographics and travel characteristics2. Relation between residential location and commuting3. Assimilation of Hispanic immigrants’ travel behavior4. Income interaction with land use – transportation relation
• Results will be provided to SCAG modelers and planners for their analysis.
Source:
Residential Land Use, Travel Characteristics, and Demography of Southern California – presented by the Southern
California Association of Governments

2121
Travel by Age
• Daily trips and travel distance are the highest for the working age population (25-64).
• The elderly still rely on a car, but drive less.
* Demographics & Travel
0%10%20%30%40%50%60%70%80%90%
100%
< 16 16-24 25-49 50-64 65-74 > 74
Driver Passenger
Auto Use by Age
Daily Trips and Distance by Age

22
Travel by Age (Elderly)
• 20% - 33% of the elderly did not travel on the survey day.
• However, when they travel, their trips are no less than the younger. Non-work Trips by Age
% of Persons Did Not Travel
0%
5%
10%
15%
20%
25%
30%
35%
40%
Below16 16-24 25-49 50-64 65-74 75+
0.0
0.5
1.0
1.5
2.0
2.5
3.0
3.5
4.0
4.5
Below16 16-24 25-49 50-64 65-74 75+
* Demographics & Travel

2323
Time of Day by Purpose
0
0.02
0.04
0.06
0.08
0.1
0.12
0.14
0.16
0 1 2 3 4 5 6 7 8 9 10 11 12 13 14 15 16 17 18 19 20 21 22 23
Time of Day by HBW
HBW
0
0.02
0.04
0.06
0.08
0.1
0.12
0.14
0.16
0 1 2 3 4 5 6 7 8 9 10 11 12 13 14 15 16 17 18 19 20 21 22 23
Time of Day by NHB
NHB
0
0.02
0.04
0.06
0.08
0.1
0.12
0.14
0.16
0 1 2 3 4 5 6 7 8 9 10 11 12 13 14 15 16 17 18 19 20 21 22 23
Time of Day by HBO
HBO
0
0.02
0.04
0.06
0.08
0.1
0.12
0.14
0.16
0 1 2 3 4 5 6 7 8 9 10 11 12 13 14 15 16 17 18 19 20 21 22 23
Time of Day by HB Shopping
HBSHOP
school
lunch
open hoursschool
* Demographics & Travel

2424
Residential Density & Commuting Distance
• Living in higher density neighborhoods:• Shorter commuting distance.
• Commuting time is about the same for all density.
* Residential Location and Commuting
0
5
10
15
20
25
30
35
0
2
4
6
8
10
12
14
16
18
20
<2 2-6 6-18 18-38 38-100 100+
Commuting Distance and Time
DISTtoWK
TIMEtoWK
Density from low to high


School Trips by Distance and Mode

Uses for O & D Survey Data Sets .
Household Origin and Destination Surveys help transportation analysts understand people's travel choices:
1. What trips or tours do people make (origins and destinations)
2. Why they travel (purposes or activities)
3. Travel patterns (amounts by household or person characteristics and by places they go)
4. How travel would change under different circumstances (travel models)
These surveys provide the detailed information about the large number of choices travelers make. Those explanations are most usefully expressed in transportation models which in turn allow analysts to estimate travel under changed circumstances, usually alternate land use and transportation system scenarios.

•School and Commute distances and
modes
•Non-driving trips by distance and
home region
•Reasons for not walking more
•Reasons for living where they do
•Trip purposes and start and end times
•Medical conditions affecting mobility
•Use of mobility devices
•Internet use: frequency, purchases,
delivery
Some Travel Pattern Descriptions

Region to Region Trips (Annual 000)
Destination Region Origin Region
MTC
Sierra
North State
SACOG/
TMPO
SJ Valley
SCAG
Central
Coast
San Diego
MTC 8,608,133 4,150 4,481 41,437 33,162 7,457 21,774 3,619
Sierra 4,923 577,586 6,699 17,745 12,496 250 732 142
North State 5,735 6,607 819,901 2,753 . 4,040 106 23
SACOG/TMPO 39,667 19,664 3,567 2,608,636 17,413 5,782 1,870 20
SJ Valley 32,532 17,650 178 17,962 4,179,801 16,021 4,502 1,226
SCAG 7,244 320 3,959 6,153 18,589 19,757,130 12,980 67,591
Central Coast 21,204 732 106 1,734 4,095 14,260 1,520,237 605
San Diego 3,407 245 267 20 717 64,882 888 3,478,987

Sample Mode Percentages
Region=MTC Miles=2-3
Mode Percent LowerCL UpperCL RowPercent RowLowerCL RowUpperCL
Missing 0.0174 0.0000 0.0400 0.1781 0.0000 0.4102
Drive/Driven 8.5533 7.8840 9.2226 87.3816 84.6328 90.1304
Other 0.1949 0.1010 0.2887 1.9909 1.0244 2.9574
Bus 0.5317 0.2910 0.7724 5.4318 2.9465 7.9172
Rail 0.0858 0.0212 0.1505 0.8767 0.2109 1.5426
Air . . . . . .
Bicycle 0.1606 0.0837 0.2375 1.6409 0.8684 2.4135
Walk 0.2447 0.1681 0.3213 2.4998 1.7276 3.2721
Total 9.7884 9.1414 10.4355 100.000 _ _

• Bike and Pedestrian Hours by Caltrans District
District WalkHrs BikeHrsD01 Eureka 814,064 78,704D02 Redding 1,089,364 74,542D03 Marysville 5,923,755 896,778D04 Oakland 16,427,130 2,524,209D05 San Louis Obispo
3,364,097 518,854
D06 Fresno 4,027,689 647,768D07 Los Angeles 21,980,348 3,251,802D08 San Bernardino 7,238,376 1,101,887D09 Bishop 97,662 10,116D10 Stockton 3,210,006 516,364D11 San Diego 6,526,006 794,366D12 Irvine 5,033,585 872,235

FHWA Contract In 2008, NHTS invited state DOTs to
supplement the sampling in their areas
Caltrans allocated $3.15 million to survey additional households and ask additional travel and attitudinal questions about biking and walking
California Original Samples – 3,000
California Add-On Samples – 18,000 to total - 21,000 (Oversampling in San Diego County to 5,500)

Areas with Supplemental Samples

Geography Total Sample (Households)
California 21,225
District 1 - Eureka 255
District 2 - Redding 326
District 3 - Marysville 1,609
District 4 - Oakland 3,808
District 5 - San Luis Obispo
735
District 6 – Fresno 990
District 7 – Los Angeles 3,767
District 8 – San Bernardino
1,566
District 9 – Bishop 22
District 10 - Stockton 815
District 11 – San Diego* 6,050
District 12 – Irvine 1,282*District 11 (San Diego) has a supplement of 4,600 households


Data FilesSETS
Information About # Observations # Variables
Households 21,225 79
Persons 44,957 245
Vehicles 44,526 96
Trips 171,661 183
Locations 171,661 36

Geographic Designations National Region State MSA/CMSA/CBSA County City Census Tract/Block Latitude/Longitude
coordinates

Customized Areas – Under Construction
Traffic Analysis Zone (TAZ)
Air Quality Conformity Regions

Analysis Tools
SAS MS Access Statistical Tool on Oakridge Lab website – output is Excel and HTML

Services Analysis on Request
Consultation
Data Downloads

How to get Data or Analyses
NHTS Website:
http://nhts.ornl.gov/
California Household Travel Survey (CHTS)http://dot.ca.gov/hq/tsip/otfa/tab/chts_travelsurvey.html
Caltrans DOTP Website:www.dot.ca.gov/hq/tsip/otfa
Leonard Seitz:[email protected](916) 654-2610
Diana [email protected](916) 653-3182
Soheila Khoii (CHTS)[email protected]

Caltrans Planning Horizons ForumDecember 11, 2013Deborah Salon, PhDInstitute of Transportation StudiesUniversity of California, Davis
Estimating total miles walked and biked by census tract in california
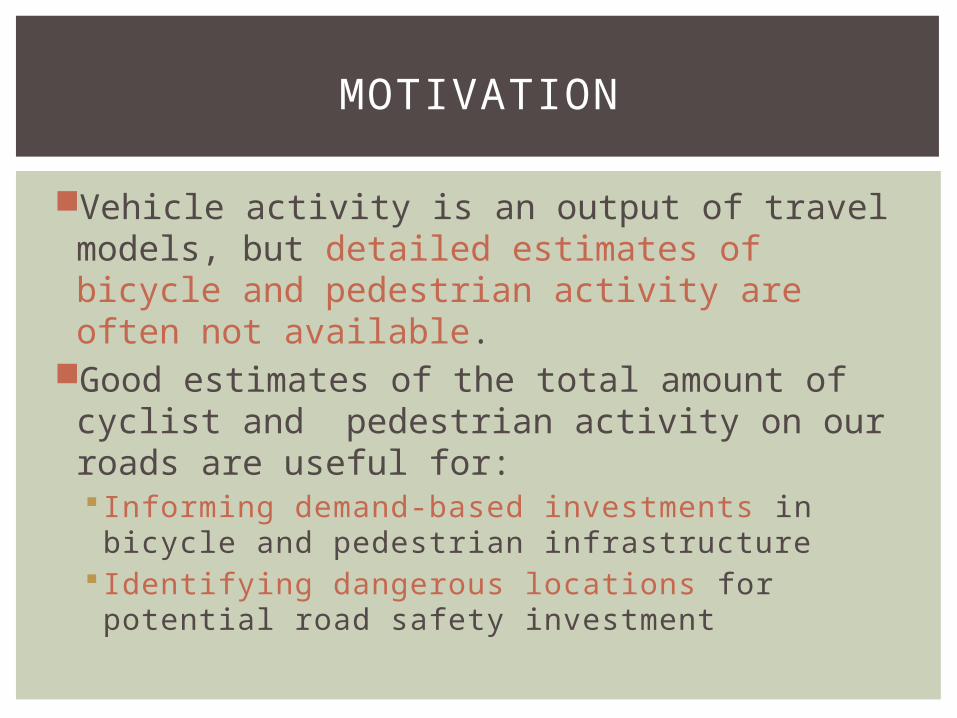
Vehicle activity is an output of travel models, but detailed estimates of bicycle and pedestrian activity are often not available.
Good estimates of the total amount of cyclist and pedestrian activity on our roads are useful for: Informing demand-based investments in bicycle and pedestrian infrastructure
Identifying dangerous locations for potential road safety investment
MOTIVATION

What are the total miles walked by pedestrians and total miles biked by cyclists living in each census tract in California?
Important Note: The estimates presented here are not of miles walked and biked within the geographic area of each tract, but we expect them to be highly correlated with these values.
RESEARCH QUESTION

1. Assign census tracts to neighborhood types based on built environment characteristics
2. Calculate miles biked and miles walked for each respondent in the 2009 NHTS and the 2010-2012 CHTS (all results presented are from NHTS)
3. Assign each survey respondent to their age-gender-home neighborhood category
4. Calculate average miles biked and miles walked for each age-gender-home neighborhood category
5. Use these averages with census data to expand travel survey data to population totals
METHOD

Cluster analysis of 10 variables yielded 4 neighborhood types: Population Density Road Density Local Job Access Regional Job Access Restaurants Within 10
Minute Walk Pct. Walk/Bike Commuters Pct. Single Family
Detached Pct. Old Housing Pct. New Housing Median House Value
NEIGHBORHOOD TYPE CLASSIFICATION

SAN FRANCISCO BAY AREA

LOS ANGELES AREA

010
2030
Perc
ent
0 2 4 6 8 10Miles Walked Per Pedestrian
NHTS
Total N (weekday)
34,123
N biked 773
N walked 7,891
% biked 2.3%
% walked 23.1%
SURVEYED INDIVIDUAL MILES WALKED AND BIKED
010
2030
40Pe
rcen
t
0 10 20 30 40 50Miles Biked Per Cyclist

Categories based on:GenderAge Group (5 groups, chosen based on biking and walking distance distributions across ages)
Home Neighborhood Type (4 Types)
Yields 40 Categories
SURVEY RESPONDENT CATEGORIES

Gender Age Group NH Type0
0.2
0.4
0.6
0.8
1
1.2
1.4
5-9
10-1
7
18-
59
60-7
4
75+
Centr
al C
ity
Urb
an
Suburb
Rura
l
AVERAGE MILES WALKED BY SURVEY RESPONDENT CATEGORY
M F

Gender Age Group NH Type0
0.05
0.1
0.15
0.2
0.25
5-9
10-3
4
35-5
9
60-6
9
70+
Centr
al C
ity
Urb
an
Suburb
Rura
l
AVERAGE MILES BIKED BY SURVEY RESPONDENT CATEGORY
M
F

Simple Expansion Formula:
where i indexes gender-age group categories.
SURVEY-TO-POPULATION ESTIMATION METHOD

EXAMPLE OF USE FOR PEDESTRIAN INFRASTRUCTURE ANALYSIS
05
1015
Perc
ent
0 200 400 600 800 1000Miles Walked Per Walkable Road Mile

EXAMPLE OF USE FOR CYCLING INFRASTRUCTURE ANALYSIS
05
1015
Perc
ent
0 100 200 300Miles Biked Per Non-Highway Road Mile

TRACT-LEVEL WALKING ESTIMATES: SAN FRANCISCO
Weekday Miles Walked Per Non-HighwayRoad Mile

TRACT-LEVEL WALKING ESTIMATES: LOS ANGELES

TRACT-LEVEL BIKING ESTIMATES: SAN FRANCISCO
Weekday Miles Biked Per Non-HighwayRoad Mile

TRACT-LEVEL BIKING ESTIMATES: LOS ANGELES

TRACT-LEVEL BIKING ESTIMATES: LOS ANGELES

EXAMPLE USE FOR SAFETY ANALYSIS
02
46
810
Perc
ent
0 .0001 .0002 .0003 .0004 .0005Accidents Per Mile Walked

EXAMPLE USE FOR SAFETY ANALYSIS
05
1015
Perc
ent
0 .001 .002 .003Accidents Per Mile Biked

MAP OF ACCIDENTS PER DISTANCE WALKED IN SAN FRANCISCO
Annual SeverePedestrian Accidents Per1000 Weekday Miles Walked

MAP OF ACCIDENTS PER DISTANCE WALKED IN LOS ANGELES

The method used here can provide estimates of cyclist and pedestrian activity based on travel survey and census data, without a full travel model
The estimates here of miles of activity per road mile are highly correlated with tract population density
The CHTS data produce somewhat lower estimates of bike/walk activity
It would be interesting to compare these results with those from a full travel model, if available
Contact: [email protected]
CONCLUSIONS

Questions/Comments