Embed Size (px)
Citation preview
National Infrastructure and Construction Pipeline
KPMG analysis —
December 2017
4
Contents
Page
1 Pipeline overview 3
2 Sectors overview 5
4 Sector highlights 6
5 Regional overview 8
6 Regional highlights 9
Disclaimer: The purpose of this report is to provide an overview of the UK Government Construction Pipeline and the National Infrastructure Pipeline across the UK. The pipeline dataset has been provided by Government Departments and presented by IPA at www.gov.uk/government/publications/national-infrastructure-and-construction-pipeline-2017. KPMG’s analysis provides commentary based on the factual evidence limited to the pipeline. KPMG has not sought to verify the accuracy of the data and no assumptions have been made where information is incomplete or missing
© 2017 KPMG LLP, a UK limited liability partnership and a member firm of the KPMG network of independent member firms affiliated with KPMG International Cooperative (“KPMG International”), a Swiss entity. All rights reserved.
Document Classification: KPMG Public
2
Overview
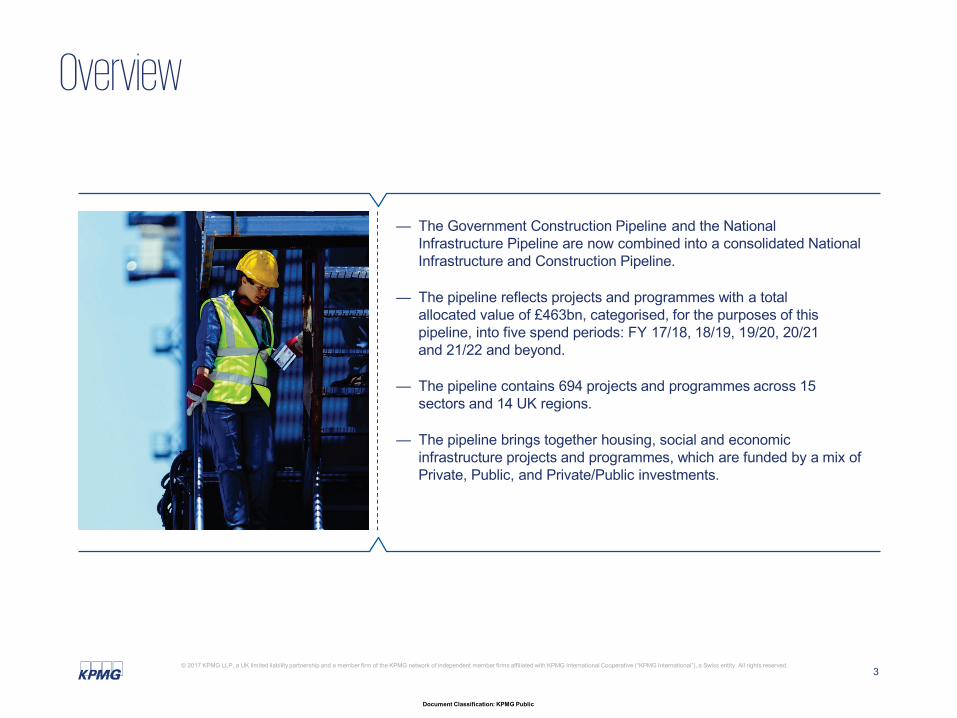
— The Government Construction Pipeline and the National Infrastructure Pipeline are now combined into a consolidated National Infrastructure and Construction Pipeline.
— The pipeline reflects projects and programmes with a total allocated value of £463bn, categorised, for the purposes of this pipeline, into five spend periods: FY 17/18, 18/19, 19/20, 20/21 and 21/22 and beyond.
— The pipeline contains 694 projects and programmes across 15 sectors and 14 UK regions.
— The pipeline brings together housing, social and economic infrastructure projects and programmes, which are funded by a mix of Private, Public, and Private/Public investments.
© 2017 KPMG LLP, a UK limited liability partnership and a member firm of the KPMG network of independent member firms affiliated with KPMG International Cooperative (“KPMG International”), a Swiss entity. All rights reserved.
Document Classification: KPMG Public
3
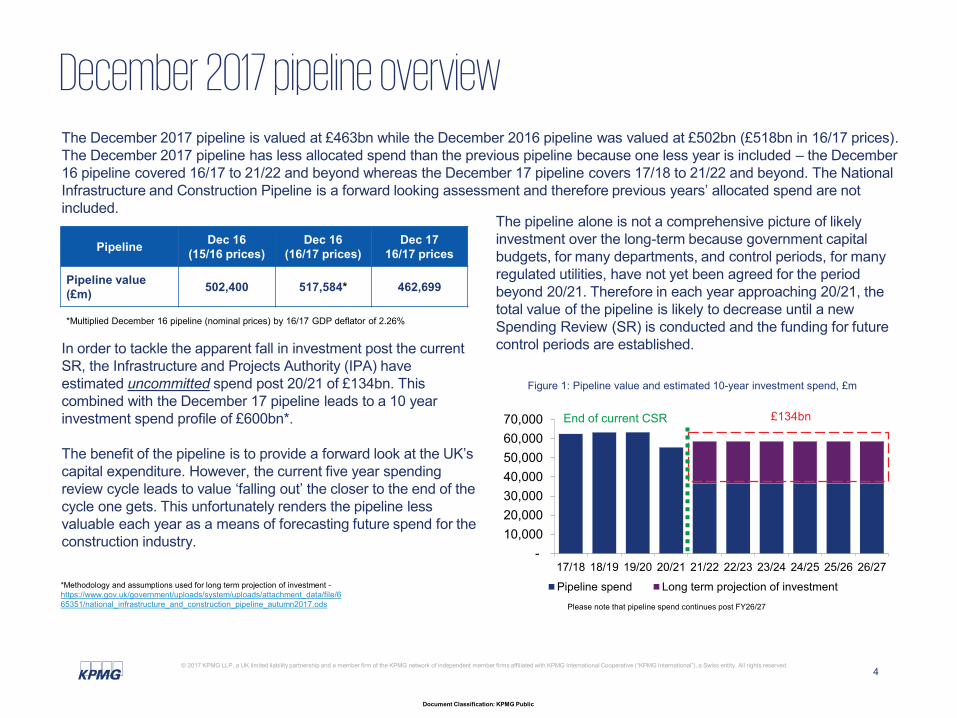
December 2017 pipeline overview The December 2017 pipeline is valued at £463bn while the December 2016 pipeline was valued at £502bn (£518bn in 16/17 prices). The December 2017 pipeline has less allocated spend than the previous pipeline because one less year is included – the December 16 pipeline covered 16/17 to 21/22 and beyond whereas the December 17 pipeline covers 17/18 to 21/22 and beyond. The National Infrastructure and Construction Pipeline is a forward looking assessment and therefore previous years’ allocated spend are not included.
Pipeline Dec 16 (15/16 prices)
Dec 16 (16/17 prices)
Dec 17 16/17 prices
Pipeline value (£m) 502,400 517,584* 462,699
*Multiplied December 16 pipeline (nominal prices) by 16/17 GDP deflator of 2.26%
In order to tackle the apparent fall in investment post the current SR, the Infrastructure and Projects Authority (IPA) have estimated uncommitted spend post 20/21 of £134bn. This combined with the December 17 pipeline leads to a 10 year investment spend profile of £600bn*.
The benefit of the pipeline is to provide a forward look at the UK’s capital expenditure. However, the current five year spending review cycle leads to value ‘falling out’ the closer to the end of the cycle one gets. This unfortunately renders the pipeline less valuable each year as a means of forecasting future spend for the construction industry.
*Methodology and assumptions used for long term projection of investment -https://www.gov.uk/government/uploads/system/uploads/attachment_data/file/6 65351/national_infrastructure_and_construction_pipeline_autumn2017.ods
The pipeline alone is not a comprehensive picture of likely investment over the long-term because government capital budgets, for many departments, and control periods, for many regulated utilities, have not yet been agreed for the period beyond 20/21. Therefore in each year approaching 20/21, the total value of the pipeline is likely to decrease until a new Spending Review (SR) is conducted and the funding f or future control periods are established.
Figure 1: Pipeline value and estimated 10-year investment spend, £m
£134bn
-10,000 20,000 30,000 40,000 50,000 60,000 70,000
17/18 18/19 19/20 20/21 21/22 22/23 23/24 24/25 25/26 26/27
Pipeline spend Long term projection of investment
End of current CSR
Please note that pipeline spend continues post FY26/27
© 2017 KPMG LLP, a UK limited liability partnership and a member firm of the KPMG network of independent member firms affiliated with KPMG International Cooperative (“KPMG International”), a Swiss entity. All rights reserved.
Document Classification: KPMG Public
4
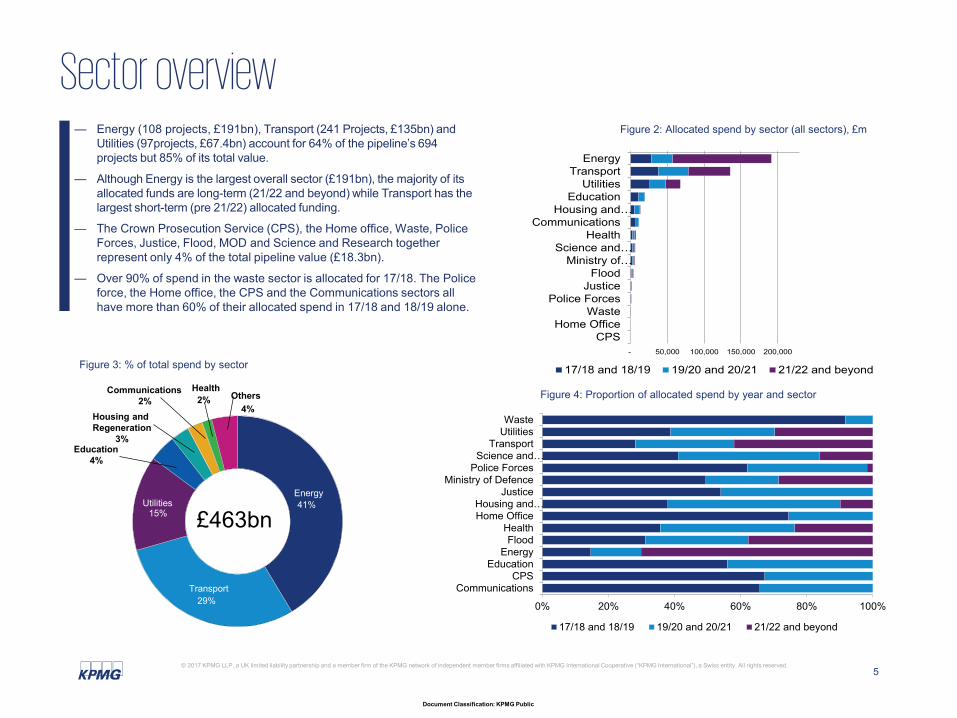
Sector overview — Energy (108 projects, £191bn), Transport (241 Projects, £135bn) and
Utilities (97projects, £67.4bn) account for 64% of the pipeline’s 694 projects but 85% of its total value.
— Although Energy is the largest overall sector (£191bn), the majority of its allocated funds are long-term (21/22 and beyond) while Transport has the largest short-term (pre 21/22) allocated funding.
— The Crown Prosecution Service (CPS), the Home office, Waste, Police Forces, Justice, Flood, MOD and Science and Research together represent only 4% of the total pipeline value (£18.3bn).
— Over 90% of spend in the waste sector is allocated for 17/18. The Police force, the Home office, the CPS and the Communications sectors all have more than 60% of their allocated spend in 17/18 and 18/19 alone.
Figure 2: Allocated spend by sector (all sectors), £m
Energy Transport
Utilities Education
Housing and…
Communications Health
Science and…Ministry of…
Flood Justice
Police Forces Waste
Home Office CPS
- 50,000 100,000 150,000 200,000
Figure 3: % of total spend by sector 17/18 and 18/19 19/20 and 20/21 21/22 and beyond Health Communications Others Figure 4: Proportion of allocated spend by year and sector 2% 2%
4% Housing and
Energy 41%
Transport 29%
Utilities 15% £463bn
Waste Utilities
Transport Science and…
Police Forces Ministry of Defence
Justice Housing and…Home Office
Health Flood
Energy Education
CPS Communications
Regeneration 3%
Education 4%
0% 20% 40% 60% 80% 100%
17/18 and 18/19 19/20 and 20/21 21/22 and beyond
© 2017 KPMG LLP, a UK limited liability partnership and a member firm of the KPMG network of independent member firms affiliated with KPMG International Cooperative (“KPMG International”), a Swiss entity. All rights reserved.
Document Classification: KPMG Public
5
Sector highlights
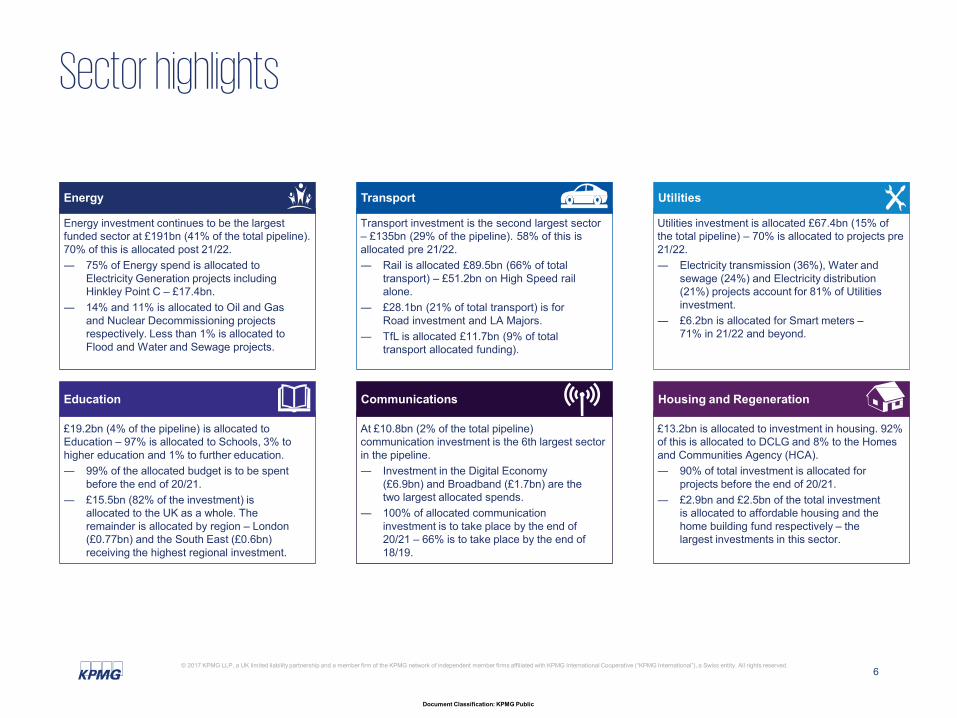
Energy
Energy investment continues to be the largest funded sector at £191bn (41% of the total pipeline). 70% of this is allocated post 21/22. ― 75% of Energy spend is allocated to
Electricity Generation projects including Hinkley Point C – £17.4bn.
― 14% and 11% is allocated to Oil and Gas and Nuclear Decommissioning projects respectively. Less than 1% is allocated to Flood and Water and Sewage projects.
Transport
Transport investment is the second largest sector – £135bn (29% of the pipeline). 58% of this is allocated pre 21/22. ― Rail is allocated £89.5bn (66% of total
transport) – £51.2bn on High Speed rail alone.
― £28.1bn (21% of total transport) is for Road investment and LA Majors.
― TfL is allocated £11.7bn (9% of total transport allocated funding).
Utilities
Utilities investment is allocated £67.4bn (15% of the total pipeline) – 70% is allocated to projects pre21/22. ― Electricity transmission (36%), Water and
sewage (24%) and Electricity distribution (21%) projects account for 81% of Utilities investment.
― £6.2bn is allocated for Smart meters – 71% in 21/22 and beyond.
Education
£19.2bn (4% of the pipeline) is allocated to Education – 97% is allocated to Schools, 3% to higher education and 1% to further education. ― 99% of the allocated budget is to be spent
before the end of 20/21. ― £15.5bn (82% of the investment) is
allocated to the UK as a whole. The remainder is allocated by region – London (£0.77bn) and the South East (£0.6bn) receiving the highest regional investment.
Communications
At £10.8bn (2% of the total pipeline) communication investment is the 6th largest sectorin the pipeline. ― Investment in the Digital Economy
(£6.9bn) and Broadband (£1.7bn) are the two largest allocated spends.
― 100% of allocated communication investment is to take place by the end of 20/21 – 66% is to take place by the end of
18/19.
Housing and Regeneration
£13.2bn is allocated to investment in housing. 92% of this is allocated to DCLG and 8% to the Homes and Communities Agency (HCA). ― 90% of total investment is allocated for
projects before the end of 20/21. ― £2.9bn and £2.5bn of the total investment
is allocated to affordable housing and the home building fund respectively – the largest investments in this sector.
© 2017 KPMG LLP, a UK limited liability partnership and a member firm of the KPMG network of independent member firms affiliated with KPMG International Cooperative (“KPMG International”), a Swiss entity. All rights reserved.
Document Classification: KPMG Public
6

Sector highlights (cont.)
Other
— 9% of the allocated investment in Health is to be spent on the health procurement frameworks Procure 21 and 22. The remainder is allocated to the NHS.
— The majority of investment in Science and Research is allocated to pre 21/22 projects.
— Over £5.3bn of funding is allocated to the Ministry of Defence. Of this, more than 29% is allocated to the Army which also accounts for the second largest single project.
— Of the £3.8bn allocated to Flood investment, £2.5bn is allocated to capital spend in regions.
— 94% of the allocated investment on Justice is to be spent on HM prisons. All of the allocated funds are for projects between 17/18 and 21/22.
— The London Met police is allocated 63% of the £1bn Police Forces budget.
— Investment in the Home Office and the Crown Prosecution Service (CPS) accounts for only £89 million (0.02% of total allocated spend). All spending on these two sectors is expected t o occur before 21/22.
Figure 5: Allocated spend by sector (bottom 9 sectors), £m
Health
Science and Research
Ministry of Defence
Flood
Justice
Police Forces
Waste
Home Office
CPS
17/18 and 18/19 19/20 and 20/21 21/22 and beyond
Figure 6: Home office allocated spend Figure 7: Justice allocated spend
- 2,000 4,000 6,000 8,000
Home Office 73%
Detention 15%
Border Force 12%
£87m
HM Prisons 95%
HM Courts 4%
Justice <1% Probation
1%
£1.7bn
© 2017 KPMG LLP, a UK limited liability partnership and a member firm of the KPMG network of independent member firms affiliated with KPMG International Cooperative (“KPMG International”), a Swiss entity. All rights reserved.
Document Classification: KPMG Public
7
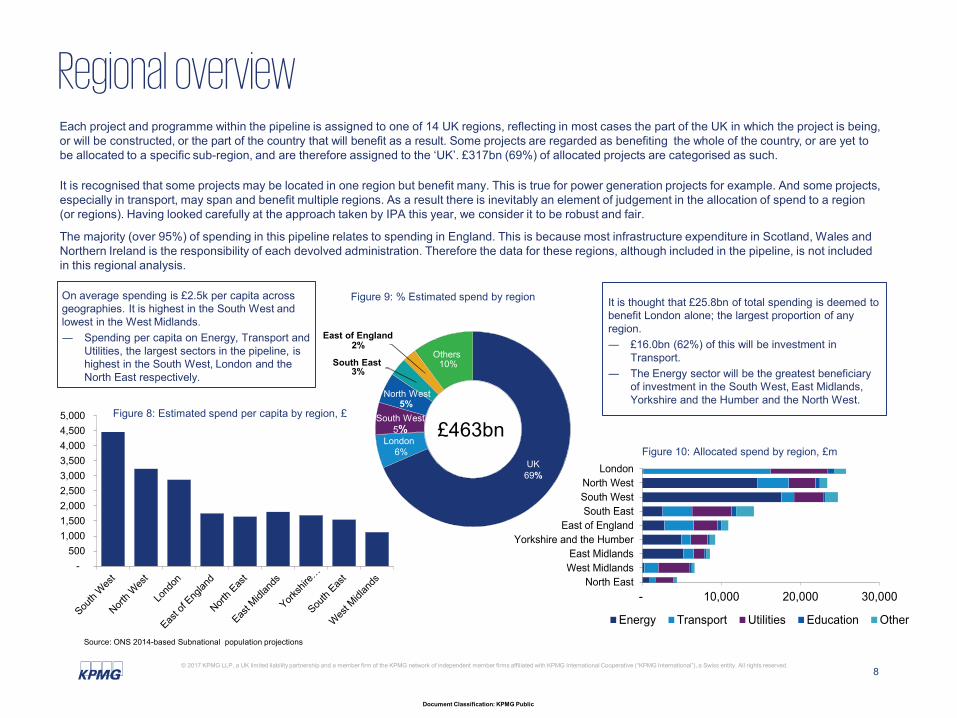
Regional overview Each project and programme within the pipeline is assigned to one of 14 UK regions, reflecting in most cases the part of the UK in which the project is being, or will be constructed, or the part of the country that will benefit as a result. Some projects are regarded as benefiting the whole of the country, or are yet to be allocated to a specific sub-region, and are therefore assigned to the ‘UK’. £317bn (69%) of allocated projects are categorised as such.
It is recognised that some projects may be located in one region but benefit many. This is true for power generation projects for example. And some projects, especially in transport, may span and benefit multiple regions. As a result there is inevitably an element of judgement in the allocation of spend to a region (or regions). Having looked carefully at the approach taken by IPA this year, we consider it to be robust and fair.
The majority (over 95%) of spending in this pipeline relates to spending in England. This is because most infrastructure expenditure in Scotland, Wales and Northern Ireland is the responsibility of each devolved administration. Therefore the data for these regions, although included in the pipeline, is not included in this regional analysis.
On average spending is £2.5k per capita across geographies. It is highest in the South West and lowest in the West Midlands. ― Spending per capita on Energy, Transport and
Utilities, the largest sectors in the pipeline, is highest in the South West, London and the North East respectively.
Figure 9: % Estimated spend by region
5,000 4,500 4,000 3,500 3,000 2,500 2,000 1,500
Figure 10: Allocated spend by region, £m London
North West South West South East
East of England 1,000
East Midlands - West Midlands
North East - 10,000 20,000 30,000
Energy Transport Utilities Education Other
Source: ONS 2014-based Subnational population projections
It is thought that £25.8bn of total spending is deemed tobenefit London alone; the largest proportion of any region. ― £16.0bn (62%) of this will be investment in
Transport. ― The Energy sector will be the greatest beneficiary
of investment in the South West, East Midlands, Yorkshire and the Humber and the North West.
Yorkshire and the Humber
Figure 8: Estimated spend per capita by region, £
UK 69%
London 6%
South West 5%
North West 5%
South East 3%
East of England2%
Others 10%
£463bn
© 2017 KPMG LLP, a UK limited liability partnership and a member firm of the KPMG network of independent member firms affiliated with KPMG International Cooperative (“KPMG International”), a Swiss entity. All rights reserved.
Document Classification: KPMG Public
500
8
Regional highlights
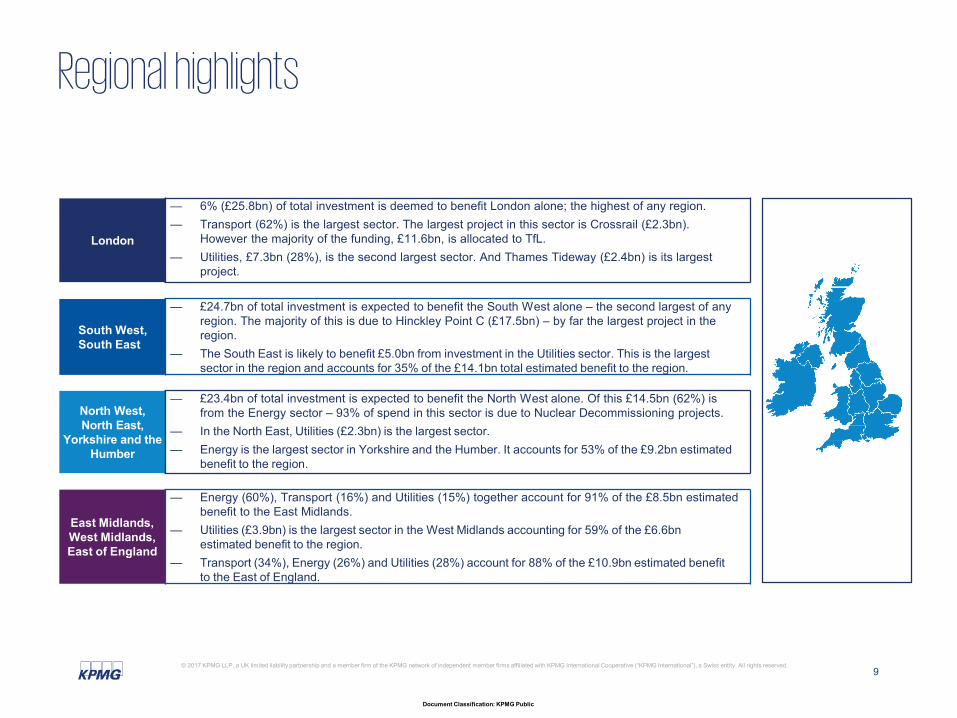
London
— 6% (£25.8bn) of total investment is deemed to benefit London alone; the highest of any region. — Transport (62%) is the largest sector. The largest project in this sector is Crossrail (£2.3bn).
However the majority of the funding, £11.6bn, is allocated to TfL. — Utilities, £7.3bn (28%), is the second largest sector. And Thames Tideway (£2.4bn) is its largest
project.
South West, South East
— £24.7bn of total investment is expected to benefit the South West alone – the second largest of any region. The majority of this is due to Hinckley Point C (£17.5bn) – by far the largest project in the region.
— The South East is likely to benefit £5.0bn from investment in the Utilities sector. This is the largest sector in the region and accounts for 35% of the £14.1bn total estimated benefit to the region.
North West, North East,
Yorkshire and the Humber
— £23.4bn of total investment is expected to benefit the North West alone. Of this £14.5bn (62%) is from the Energy sector – 93% of spend in this sector is due to Nuclear Decommissioning projects.
— In the North East, Utilities (£2.3bn) is the largest sector. — Energy is the largest sector in Yorkshire and the Humber. It accounts for 53% of the £9.2bn estimated
benefit to the region.
East Midlands, West Midlands, East of England
— Energy (60%), Transport (16%) and Utilities (15%) together account for 91% of the £8.5bn estimated benefit to the East Midlands.
— Utilities (£3.9bn) is the largest sector in the West Midlands accounting for 59% of the £6.6bn estimated benefit to the region.
— Transport (34%), Energy (26%) and Utilities (28%) account for 88% of the £10.9bn estimated benefit to the East of England.
© 2017 KPMG LLP, a UK limited liability partnership and a member firm of the KPMG network of independent member firms affiliated with KPMG International Cooperative (“KPMG International”), a Swiss entity. All rights reserved.
Document Classification: KPMG Public
9
Document Classification: KPMG Public
Richard Threlfall UK Head of Infrastructure, Building and Construction
T. +44 (0)11 3231 3437 M. +44 (0)7960 589814 E. [email protected]
Melvyn Oben Assistant Manager, Infrastructure Advisory Group
T. +44 (0)20 7311 6449 M. +44 (0)7585 986371 E. [email protected]
Shruti Jain Assistant Manager, T&R Infrastructure
T. +91 124 699 1657 M. +91 9582 469311 E. [email protected]
The information contained herein is of a general nature and is not intended to address the circumstances of any particular individual or entity. Although we endeavor to provide accurate and timely information, there can be no guarantee that such information is accurate as of the date it is received or that it will continue to be accurate in the future. No one should act on such information without appropriate professional advice after a thorough examination of the particular situation.
© 2017 KPMG LLP, a UK limited liability partnership and a member firm of the KPMG network of independent member firms affiliated with KPMG International Cooperative (“KPMG International”), a Swiss entity. All rights reserved.
KPMG LLP is multi-disciplinary practice authorised and regulated by the Solicitors Regulation Authority. For full details of our professional regulation please refer to ‘Regulatory Information’ at www.kpmg.com/uk
The KPMG name and logo are registered trademarks or trademarks of KPMG International.