Embed Size (px)
Citation preview

Providing consultancy and research in health economics for the
NHS, pharmaceutical and health care industries since 1986
Providing consultancy and research in health economics for the
NHS, pharmaceutical and health care industries since 1986
ALEXANDRA FILBY, Research Consultant
MATTHEW TAYLOR, Director
MICHELLE JENKS, Research Consultant
VICTORIA BURLEY, University of Leeds
JUNE 2015
All confidential data are redacted
Providing consultancy and research in health economics for the
NHS, pharmaceutical and health care industries since 1986
NATIONAL INSTITUTE FOR HEALTH
AND CARE EXCELLENCE
Examining the Cost-Effectiveness of Moving
the Healthy Start Vitamin Programme from a
Targeted To a Universal Offering
Final Report

All reasonable precautions have been taken by YHEC to verify the information
contained in this publication. However, the published material is being distributed
without warranty of any kind, either expressed or implied. The responsibility for the
interpretation and use of the material lies with the reader. In no event shall YHEC be
liable for damages arising from its use.
Contents
Page No.
Executive Summary
Acknowledgements
Abbreviations and Glossary
Section 1: Background 1
Section 2: Model Structure 3
2.1 Overview 3
2.2 Overview of Model Outcomes 5
2.3 Model Structure 7
Section 3: Methods and Data Sources 9
3.1 Data Sources 9
3.1.1 National Surveys 9
3.1.2 Primary Data Collection 9
3.1.3 Local Cost Data 10
3.1.4 Central Cost Data 10
Section 4: Inputs 12
4.1 Population Inputs 12
4.2 Uptake Inputs 13
4.2.1 Baseline Uptake Inputs 13
4.2.2 New Level of Uptake in Universal Scenario 15
4.3 Effectiveness Inputs 17
4.3.1 Folic Acid 18
4.3.2 Vitamin A 20
4.3.3 Vitamin C 21
4.3.4 Vitamin D 22
4.4 Cost Inputs 23
4.4.1 Intervention Cost Inputs 24
4.4.2 Treatment Cost Inputs 26
4.5 Utility Inputs 28
4.5.1 Spina Bifida 28
4.5.2 Terminations 29

All reasonable precautions have been taken by YHEC to verify the information
contained in this publication. However, the published material is being distributed
without warranty of any kind, either expressed or implied. The responsibility for the
interpretation and use of the material lies with the reader. In no event shall YHEC be
liable for damages arising from its use.
Section 5: Results 30
5.1 Basecase Results 30
5.1.1 Offering Healthy Start Supplements Universally to All of the Current Subgroups
(Scenario 1) 30
5.1.2 Results for Extended Subgroups Only 31
5.1.3 Results for Offering Healthy Start Supplements to the Extended Subgroups
and to the Currently Targeted Subgroups, on a Universal Basis (Scenario 2) 33
5.2 Sensitivity Analysis (Scenario 2) 35
5.2.1 Cost Sensitivity Analysis 41
5.3 Scenario Analysis 50
5.3.1 NHS Perspective 50
5.3.2 Societal Perspective 51
5.3.3 Discount Rate 54
5.3.4 Scenario Analysis of Adding QOL Benefits to Vitamin D 55
5.3.5 Consideration of Over Supplementation 57
5.3.6 Prescription Charges 57
5.3.7 QALY Loss for Unborn Children 59
5.3.8 Consideration of Born in Bradford Data 60
5.3.9 Scenario analysis of Bestwick et al. (2014) (36) folic acid uptake data 61
5.3.10 Source of uptake – New users versus substitution 62
5.3.11 Substitution Coefficient 100% - Maximum Substitution, All Healthy Start Uptake
is from Substitutes 63
5.3.12 Substitution Coefficient 50% - Healthy Start Uptake is Split Proportionally
between New Uptake and Substitutes 64
5.3.13 Substitution Coefficient Sensitivity Analysis 64
5.4 Two-Way Sensitivity Analysis 66
5.5 Three-way Sensitivity Analysis 69
Section 6: Discussion 72
References
Appendix A: Primary Data Collection – Survey Questions
Appendix B: Coefficient Technical Appendix
Appendix C: Detailed Results Breakdown
Appendix D: Tornado Diagrams User Guide

i
Executive Summary
1. INTRODUCTION
In 2012, the Annual Report of the Chief Medical Officer (“Our children deserve better – Prevention pays”) highlighted the importance of vitamin supplementation in mothers and young children and the growing concerns about vitamin D deficiency. Infants and children under age 5 and pregnant and breastfeeding women are advised to take a daily supplement of vitamin D. However, national surveys indicate that uptake of vitamin D supplements is low, particularly among low income groups. Healthy Start is a UK-wide, means tested, statutory scheme which aims to provide a nutritional safety net for low-income pregnant women, new mothers and for children under the age of 4 years. Those in receipt of qualifying income-related benefits or tax credits are eligible to receive the vitamin supplements. Pregnant women under the age of 18 are also eligible for the scheme, regardless of whether or not they receive benefits. Healthy Start children’s vitamin supplements contain the amount recommended by the COMA committee (1) of vitamins A, C and D for children aged six months to four years. Women’s vitamins contain the recommended amount of folic acid, vitamin C and vitamin D for pregnant and breastfeeding women. Uptake of Healthy Start vitamin supplements is very low (some studies suggest that less than 10% redeem their vitamin vouchers (2, 3). Key barriers to uptake include practical difficulties with obtaining supplies of the vitamins, their short shelf-life (of the children’s vitamins), the complex ordering and reimbursement system, complicated assessment of eligibility and difficulties in identifying a convenient and accessible location through which they could be distributed. Making the scheme universally available may overcome some of these issues. The National Institute for Health and Care Excellence (NICE) recently released guidance on increasing vitamin D supplement use among at risk groups (4). In response to a recommendation from the Chief Medical Officer, the Department of Health asked the National Institute for Health and Care Excellence (NICE) to examine the cost effectiveness of moving the Healthy Start vitamin programme from the current targeted offering, to a universal offering. Therefore, NICE has commissioned this research to investigate the differential cost-effectiveness between offering the scheme on the current targeted, versus a universal, basis. This report describes the economic model developed to answer this question and the results of this economic evaluation.
2. OBJECTIVES
To develop an economic model to inform answers to the following questions: “Would it be cost-effective to move the Healthy Start Vitamin Programme from the current targeted offering to a universal offering, according to the following two scenarios: a. Within the current parameters of the scheme (all pregnant women from 10 weeks;
women with a child under 12 months; and children over 6 months and under 4 years);
b. All women planning a pregnancy; pregnant women; women with a child aged under 12 months; infants aged from 0 to 6 months and children aged from 6 months to 5 years.”

ii
Subsidiary questions were as follows: 1. “Is universal provision of Healthy Start supplements to women seeking to become
pregnant cost-effective, compared with no provision under Healthy Start?” 2. “Is universal provision of Healthy Start vitamin supplements to women who are less
than 10 weeks pregnant cost-effective, compared with no provision under Healthy Start?”
3. “Is universal provision of Healthy Start supplements for infants aged 0 to 6 months cost-effective, compared with no provision under Healthy Start?”
4. “Is universal provision of Healthy Start supplements for children aged 4 to 5 years cost-effective, compared with no provision under Healthy Start?”
5. “Would universal provision of supplements create a ‘spill over’ effect by increasing uptake in the current target group and would this be cost-effective compared with the current targeted offering?”
6. “What is the incremental cost-effectiveness ratio of extending the eligibility for universally available vitamins to: i. Infants from birth to 6 months compared with providing them for those aged
over 6 months; ii. Children between their fourth and fifth birthday compared with providing them
until their fourth birthday; iii. Women less than 10 weeks pregnant compared with providing them to those
over 10 weeks pregnant (the current target); iv. Women intending to become pregnant?”
3. RESULTS
The model results focus on two scenarios. In scenario 1, the current Healthy Start offering is
extended to a universal offering for all the subgroups that currently receive the Healthy Start
supplements (Objective A). In scenario 2, the current Healthy Start offering is extended
universally as in Scenario 1 and also to the extended subgroups (as defined in Objective B).
The model estimates that where the universal offering is extended within the current
subgroups (scenario 1), the scheme would not be considered cost-effective with an
incremental cost-effectiveness ratio (ICER) of £620,898. The model estimates that a
universal scheme in scenario 2 is likely to be cost-effective, with an ICER of £6,528. In
scenario 2, the scheme is likely to be considered cost-effective for any subgroup
combinations that includes ‘women planning a pregnancy and before 10 weeks pregnant’.
The cost-effectiveness results are driven by the quality adjusted life year (QALY) gains from
reducing neural tube defect (NTD) pregnancies through the provision of folic acid.
However, it is important to note that these model results must be tempered by great
uncertainties in the model, all of which reduce the reliability of any conclusions which may be
drawn.

iii
4. DISCUSSION
There is a lot of uncertainty in the economic model, which impacts upon the reliability of the
conclusions. Many of the model inputs are uncertain due to a lack of data on the uptake of
vitamin supplements, intervention and treatment costs and utilities and a lack of experience
of how a universal scheme would be implemented.
It is also important to note that the model assigns QALYs only to pregnancies affected by a
NTD, which are reduced through the provision of folic acid. QALYs are not assigned to any
health benefits from supplementation with vitamins A, C or D. This does not mean that there
are no quality of life benefits, only that the data are not available to accurately populate the
model.
The scheme appears cost-effective where it is extended to women planning a pregnancy
and before 10 weeks pregnant. Within the model it has been assumed that Healthy Start
vitamin supplements will be distributed to this subgroup in the same manner as other
subgroups already included in the scheme. Should targeting these women prove more
costly than assumed, extension of the scheme will be less cost-effective.
The model report includes many sensitivity and scenario analyses to account for the
uncertainty in the model. It is not possible to say with certainty whether or not moving the
Healthy Start scheme from a targeted scheme to universal provision would be cost-effective.
However, the model results suggest that moving to a universal scheme could be cost-
effective for some subgroup combinations, specifically when women planning a pregnancy
and before 10 weeks pregnant is included.

i
Acknowledgements
The authors would like to thank the NICE Expert Reference Group for their input in the
model development phase. We are extremely grateful to Eleanor McGee, Tricia Morris
(Department of Health) and Gwenda Scott for their contribution to the model inputs. Finally,
the authors would also like to thank the Healthy Start project leads and all those who
provided data for consideration for the model.

i
Abbreviations and Glossary ABBREVIATIONS BMEG Black and Minority Ethnic Groups BSA Business Services Authority CPH Centre for Public Health DH Department of Health DNSIYC Diet and Nutrition Survey of Infants and Young Children ERG Expert Reference Group ICER Incremental cost-effectiveness ratio IFS Infant Feeding Survey LIDNS Low Income Diet and Nutrition Survey LRNI Lower reference nutrient intake NDNS National Diet and Nutrition Survey NHS National Health Service NICE National Institute for Health and Care Excellence NTD Neural tube defect QALY Quality-adjusted life year QOL Quality of life WHO World Health Organisation YHEC York Health Economics Consortium
GLOSSARY
Incremental cost-
effectiveness ratio (ICER):
The difference in mean costs in the population of interest divided by the differences in the mean outcomes in the population of interest1.
Folate:
Folate intake encompasses naturally occurring folates in foods plus synthetic folic acid added to fortified foods and supplements.
Folic acid: Folic acid is a water-soluble vitamin belonging to the B-complex group of vitamins.
Lower Reference Nutrient
Intake (LRNI):
The adequacy of vitamin or mineral intake can be expressed as the proportion of individuals with intakes below the LRNI. The LRNI for a vitamin or mineral is set at the level of intake considered likely to be sufficient to meet the needs of only 2.5% of the population2.
Quality-adjusted life year
(QALY):
A measure of the state of health of a person or group in which the benefits, in terms of length of life, are adjusted to reflect the quality of life. One QALY is equal to 1 year of life in perfect health.
1 From NICE glossary https://www.nice.org.uk/glossary?letter=q 2 Definition from NDNS report (2)

ii
QALYs are calculated by estimating the years of life remaining for a patient following a particular treatment or intervention and weighting each year with a quality of life score (on a zero to one scale). It is often measured in terms of the person's ability to perform the activities of daily life, freedom from pain and mental disturbance1.
Retinol equivalent: Retinol is the predominant circulating form of vitamin A in the blood3. Retinol equivalent is a unit used for quantifying the vitamin A value of sources of vitamin A. The risk of being below the Vitamin A lower reference nutrient intake used within the model is based upon retinol equivalents. Intakes are expressed as retinol equivalents to take account of the lower biological efficiency of carotenoids compared to retinol.
Symptomatic vitamin D
deficiency:
For the purposes of this report, symptomatic vitamin D deficiency is defined as a combination of clinical findings such as bow legs, rickety rosary, tetany, convulsions due to hypocalcaemia, radiological evidence, biochemistry results such as raised alkaline phosphatase (ALP) with or without high parathyroid hormone levels, or low levels (<25 nmol/l) of 25- hydroxycholecalciferol (25OHC) (Zipitis et al., 2006). This definition is based on the definition in the two papers from which effectiveness and cost data were obtained (5, 6).
Tornado diagrams: A method of presenting multiple univariate sensitivity analyses
on one graph. Tornado diagrams allow the reviewer to assess
which of the model’s parameters have the greatest influence
on the model’s results.
Univariate sensitivity
analysis:
Also known as ‘one-way sensitivity analysis’. It allows a
reviewer to assess the impact that changes in a certain
parameter will have on the model’s results. This is the
simplest form of sensitivity analysis since only one parameter
is changed at one time.
3 From WHO report http://www.who.int/vmnis/indicators/retinol.pdf

Section 1 1
Section 1: Background
The National Institute for Health and Care Excellence (NICE) Centre for Public Health (CPH)
commissioned York Health Economics Consortium (YHEC) to carry out a systematic cost-
effectiveness review and to develop an economic model. The purpose of the cost-
effectiveness review was to assess the available evidence of the cost-effectiveness of
supplementation with the vitamins contained within the Healthy Start vitamin supplements.
The aim of the cost-effectiveness modelling is outlined in more detail below. The
development of both the cost-effectiveness review and the cost-effectiveness modelling was
supported by input from the Expert Reference Group (ERG).
Healthy Start is a UK-wide, means tested, statutory scheme which aims to provide a
nutritional safety net for low-income pregnant women, new mothers and for children under
the age of 4 years. Those in receipt of qualifying income-related benefits or tax credits are
eligible to receive the vitamin supplements. Pregnant women under the age of 18 are also
eligible for the scheme, regardless of whether or not they receive benefits. Healthy Start
beneficiaries receive vouchers that can be spent on milk, fruit and vegetables and formula.
They also receive vitamin coupons for women’s tablets or children’s vitamin drops (7). The
current project focuses only on the vitamin component of the Healthy Start scheme.
The aim of the cost-effectiveness modelling element of the current project was to develop a
de novo economic model to examine the cost-effectiveness of moving the Healthy Start
vitamin programme from the current targeted offering to a universal offering. The purpose of
this exercise was not to determine whether supplementation with Healthy Start vitamin
supplements as currently offered is cost-effective, but to estimate the differential cost-
effectiveness between offering the scheme on the current targeted, versus a universal,
basis. The specific questions were:
“Would it be cost-effective to move the Healthy Start Vitamin Programme from the current
targeted offering to a universal offering, according to the following two scenarios:
a. Within the current parameters of the scheme (all pregnant women from 10 weeks;
women with a child under 12 months; and children over 6 months and under 4
years);
b. All women planning a pregnancy; pregnant women; women with a child aged under
12 months; infants aged from 0 to 6 months and children aged from 6 months to 5
years.”

Section 1 2
Subsidiary questions are as follows:
1. “Is universal provision of Healthy Start supplements to women seeking to become
pregnant cost-effective, compared with no provision under Healthy Start?”
2. “Is universal provision of Healthy Start supplements to women who are less than 10
weeks pregnant cost-effective, compared with no provision under Healthy Start?”
3. “Is universal provision of Healthy Start supplements for infants aged 0 to 6 months
cost-effective, compared with no provision under Healthy Start?”
4. “Is universal provision of Healthy Start supplements for children aged 4 to 5 years
cost-effective, compared with no provision under Healthy Start?”
5. “Would universal provision of supplements create a ‘spill over’ effect by increasing
uptake in the current target group and would this be cost-effective compared with
the current targeted offering?”
6. “What is the incremental cost-effectiveness ratio of extending the eligibility for
universally available vitamins to:
i. Infants from birth to 6 months compared with providing them for those aged
over 6 months;
ii. Children between their fourth and fifth birthday compared with providing them until their fourth birthday;
iii. Women less than 10 weeks pregnant compared with providing them to those over 10 weeks pregnant (the current target);
iv. Women intending to become pregnant?”
The following sections report on the model structure which has been developed with input
from the ERG. The model structure is described in Section 2. The evidence that has been
used to populate the model and the areas in which there are gaps in the data or uncertainty
in the inputs are outlined in Section 3 and 4. Section 5 reports the model results for the base
case values within the model. This section outlines the results for various scenarios in which
the universal offer of Healthy Start vitamin supplements is extended to the various different
subgroups within the model. This section also reports extensive scenario and sensitivity
analysis. Section 6 provides a summary and discussion.

Section 2 3
Section 2: Model Structure
2.1 OVERVIEW
The population subgroups that were included in the model are as follows. The model set-up
allows the user to select specific population groups:
Population subgroups included in the current Healthy Start offering:
o Pregnant women after 10 weeks;
o Women with a child up to 12 months;
o Infants and children over 6 months and under 4 years.
Extended subgroups:
o Women planning a pregnancy;
o Pregnant women before 10 weeks;
o Infants aged 0 to 6 months;
o Infants and children over 4 years and under 5 years.
The vitamins included in the model were those that are included in the Healthy Start vitamin
supplements. The Healthy Start maternal vitamin supplements contain the following within
one multivitamin tablet:
Folic acid;
Vitamin C;
Vitamin D.
Whilst, the Healthy Start children’s vitamin supplements contain the following:
Vitamin A;
Vitamin C;
Vitamin D.
Table 2.1 shows which vitamin supplements are supplied to each population group. For
example, in the subgroup ‘pregnant women after 10 weeks’ a tick is shown for folic acid,
vitamin C and vitamin D as these are included in the Healthy Start maternal vitamin
supplements. A cross is shown for vitamin A as this is not included in the Healthy Start
maternal vitamin supplement. The extended groups (considered to address the modelling
questions) show those subgroups that do not currently receive any supplement provision
from Healthy Start vitamin supplements. However, the extended subgroups still have a
baseline uptake as some of the people in these subgroups may purchase vitamin
supplements privately or get vitamins supplements on prescription. In each table, the
baseline level of uptake is the proportion of people taking any vitamin supplement (whether a
Healthy Start vitamin supplement or a vitamin supplement from some other source)
currently, with the Healthy Start scheme running with targeted provision (whether a Healthy
Start vitamin supplement or a vitamin supplement from some other source). The new level

Section 2 4
of uptake is the proportion of people taking any vitamin supplement in the scenarios where
the Healthy Start scheme is made universal.
Table 2.1: Population subgroups and vitamins included in the model
Folic acid
Vitamin A
Vitamin C
Vitamin D
Currently targeted groups
Pregnant women after 10 weeks x
Women with a child up to 12 months x
Infants and children over 6 months and under 4 years
x
Extended groups
Women planning a pregnancy x
Pregnant women before 10 weeks x
Infants aged 0 to 6 months x
Infants and children over 4 years and under 5 years x
The model is structured to allow a range of perspectives to be summarised in the model
results. This model takes three perspectives; NHS, public sector (which includes NHS and
local authority costs) and societal (which includes public sector costs and costs to
individuals). The cost perspective is used to define who a cost is borne by. For example,
the cost of Healthy Start vitamin supplements is borne by central government as the
Department of Health (DH) pay for the Healthy Start vitamin supplements. Some cost is also
borne by local authorities as they use staff time distributing the vitamins. These costs also
apply to the public sector which consists of local authority, central government and the NHS.
If a societal perspective is taken all of these costs would be included plus the costs to
individuals. To give another example, the cost of treating vitamin D deficiency will cost
money to the NHS when patients are hospitalised. However, these costs will not apply to
local or central government. Currently, local areas that provide universal supplementation
are paid for by the local authority.
The following perspectives can be included in the model:
NHS;
Public sector (i.e. local authority, central government and NHS);
Societal.
A public sector perspective has been taken in the base case, rather than local authority and
central government perspectives separately as costs are borne by a combination of the three
public sector bodies. Attempting to disentangle these costs and any health benefits
assigned would involve assumptions being made, rendering the results less meaningful.
Some individuals may already buy supplements but may not do so if the supplements are
made universally available, in these cases the costs to the public sector would increase for
no additional benefit. This is considered within the relevant perspectives.
Section 2 5
2.2 OVERVIEW OF MODEL OUTCOMES
Following discussion with the ERG, it was recommended that, where possible, the model
outcome measures would focus on:
Measures of nutrient intake, specifically, the number of people below the lower
reference nutrient intake (LRNI);
Accepted measures of nutritional status (e.g. for vitamin D a plasma concentration
of 25 hydroxyvitamin D (25[OH]D, of below 25 nmol/litre);
Functional measures to which the outcomes could be linked to (for example, neural
tube defects for folic acid).
It was agreed that, for vitamins A and C, there were no functional outcomes suitable for
inclusion in the economic model. While generally being unwell, having poor immunity or
faltering growth may be associated with poor nutritional status; these are not unique to
having a poor vitamin A or C status and are difficult to quantify. As such, it is difficult to
assign costs and utilities to these health states. Therefore, for these vitamins, the model
calculated only the number of people below the LRNI with no specific treatment cost or
QALYs assigned to this.
Members of the ERG commented that there are functional outcome measures for vitamin D,
such as rickets and ostemalacia, but these conditions are relatively rare. There are some
other functional outcomes for vitamin D relating to general health, but as for vitamins A and
C, these are currently hard to quantify. Data is available on symptomatic vitamin D
deficiency (5, 6) and as costs can be assigned to this, this was selected as the outcome
measure for vitamin D. However no quality of life data for this outcome could be identified.
For the purposes of this report, symptomatic vitamin D deficiency is defined based on the
definition in the two papers from which effectiveness and cost data were obtained (5, 6). It is
defined as a combination of clinical findings such as bow legs, rickety rosary, tetany,
convulsions due to hypocalcaemia, radiological evidence, biochemistry results such as
raised alkaline phosphatase (ALP) with or without high parathyroid hormone levels, or low
levels (<25 nmol/l) of 25- hydroxycholecalciferol (25OHC) (6). The ERG also considered
hypocalcaemic fits as an independent functional outcome. This discussion is documented in
Section 4.3.4. For folic acid the functional outcome of neural tube defect (NTD) pregnancies
was included in the model, with costs and QALYs applied.
The following measures were identified to model the number of people below the various
nutritional status markers. The information required was the probability of being below each
marker for those who take supplements and for those who do not:
Vitamin A – retinol (below 0.35 umol/l = severe deficiency) (0.35 to 0.70 umol/l =
marginal deficiency);
Vitamin C – plasma vitamin C (below 11 umol/L = deficiency) (11 to 28 umol/lL =
depletion);
Vitamin D – lower than 25 nmol/L = ‘low status’;
Folate – lower than 10nmol/l (serum) or lower than 340nmol/l (red blood cell folate)
= biochemical folate deficiency.

Section 2 6
Unfortunately, the information needed to populate the model with the number of supplement
takers and non-supplement takers below various nutritional status markers was not
identified.
The National Diet and Nutrition Survey (NDNS) reported nutritional status for vitamin C, D
and A4 and the Diet and Nutrition Survey of Infants and Young Children (DNSIYC) reported
nutritional status for vitamin D. Although the Low Income Diet and Nutrition survey (LIDNS)
reported nutritional status for all four vitamins, this survey did not report results for the
general population, as was required by the model. Further, although the NDNS and
DNSIYC reported nutritional status, this was not reported separately for those taking
supplements and those not taking supplements (which was the information needed to
calculate the probability input in the model). The NDNS raw data were analysed but
following discussions with the ERG it was concluded that the sample sizes of children
providing a valid blood sample when split into supplement taker and non-supplement taker
were too small to carry out any meaningful analysis.
This information was not crucial to modelling the cost-effectiveness of moving the Healthy
Start scheme from a targeted to a universal offering, although it would have provided
valuable additional information.
Table 2.2 summarises which outcome measures were included for each nutrient within the
model.
Table 2.2: Outcome measures used in the economic model
Outcome measure Folic acid Vitamin A Vitamin C Vitamin D
Nutrient intake xcd
x
Nutritional status xc x x x
Functional outcomes a x x
b
a Pregnancies affected by a NTD;
b Symptomatic vitamin D deficiency;
c. As folate;
d Folic acid is added to the HS supplements to reduce the risk of NTDs but the dose is far higher
than would be required to meet the usual Dietary Reference values for women in the general
population who are not planning a pregnancy or in the first trimester of pregnancy. For this reason
the ERG decided not to look at the LRNI as an outcome measure for folic acid but to focus on the
functional outcome of prevention of NTDs
4 The NDNS recently released nutritional status results for folate (20 March 2015). However, this was
not included in the current report as the data were not in the right format for use in the economic model and due to timing of the release it was not possible to carry out further analyses.

Section 2 7
2.3 MODEL STRUCTURE
The model structure is outlined in Figure 2.2. This structure has been applied to each
vitamin and subgroup included in the model (outlined in Section 2.1). The model structure
was based on the estimated number of people taking vitamin supplements in each
population group for the targeted and universal approach. Based on the estimated number
of people taking vitamin supplements and the probability of each outcome, a weighted
average probability for those taking supplements and not taking supplements was
calculated. Once the number of people that experience one of the outcomes was calculated,
the treatment cost (if applicable) and QALY loss (if applicable) was applied to those people.
The cost of the intervention was applied as the cost of the additional supplements for the
number of extra people that take Healthy Start vitamin supplements in the universal scenario
and any additional set up and running costs of the universal scheme. An incremental cost-
effectiveness ratio (ICER) was then calculated. The NICE threshold usually requires the
ICER to be below £20,000 to £30,000 for an intervention to be considered cost-effective.
Within this report, a cost-effectiveness threshold of £20,000 has been used unless otherwise
stated.
As explained in Section 2.2 above, the model did not include the number of people below
nutritional status markers for each vitamin by supplement user and non-supplement user as
the data have not been identified to populate this. This data is not crucial to the economic
modelling; however it would have provided additional information. The structure of the
model allows for the inclusion of this information if the data become available in the future.
The number of cases below the LRNI threshold for those vitamins which did not have a
defined functional outcome (vitamins A and C) are reported in the model.

Section 2 8
Figure 2.2: Model structure
Targeted Universal
% uptake of vitamin supplements % uptake of vitamin supplements
Cost of intervention
Cost of intervention

Section 3 9
Section 3: Methods and Data Sources
Various data sources have been used to populate the model. Often, the required data were
not available and assumptions had to be made. Feedback from the ERG was sought on
these assumptions and where assumptions were included the best available data was used.
In all cases of substantial uncertainty, extensive sensitivity analyses were undertaken to
explore the impact of different assumptions on the model’s results.
3.1 DATA SOURCES
Several data sources have been used to populate the model. These data sources are
referred to throughout the report; therefore, a brief summary of each is provided below.
Table 3.1 provides a summary outline of the type of information used from each data source,
the way these sources were used in the economic model is explained in more detail in
Section 4.
3.1.1 National Surveys
The national surveys that were reviewed for relevant information were the National Diet and
Nutrition Survey (NDNS (8)), Infant Feeding Survey, 2010 (IFS (9)), Diet and Nutrition
Survey of Infants and Young Children (DNSIYC (10)) and the LIDNS (11).
The NDNS, IFS and DNSIYC were used to populate the model (discussed in Section 4).
Although the LIDNS does report similar information to the national surveys that were used to
populate the model, such as the nutritional status for all four vitamins, it did not report results
for the general population as was required to populate the model. The ERG agreed there
were not adequate data to model by income level. However, it is important to note that there
may be variation in uptake of supplements by income level.
3.1.2 Primary Data Collection
Primary data collection was carried out through a survey commissioned specifically for this
research project. The aim of the survey was to identify the number of people that currently
pay for their own supplement and to identify the type, quantity and price paid for
supplementation that was taken by the population groups of interest. Three surveys were
developed, one for each of the following population groups: women planning a pregnancy;
pregnant women; and women with children aged 0 to 5 (the questions for this population
group asked about the women’s use of supplements as well as those they gave to their
children).
The survey was an online survey which was developed in consultation with the ERG. It was
run between 25/11/14 and 02/12/14 in England. The survey was sent to panels of the
general population which were then targeted to the population groups of interest. A copy of

Section 3 10
the survey questions are available in Appendix A. Responses were received from 180
women planning a pregnancy, 147 pregnant women and 405 women with children 0 to 5
years.
3.1.3 Local Cost Data
In order to obtain information about running the Healthy Start scheme at a local level, a
costing template was developed. As part of the cost-effectiveness review for this project a
mailing list of 539 Healthy Start leads (provided by the NHS Business Services Authority
(BSA) at the request of the DH) were sent an email asking if they would participate in the
completion of a costing template. Thirty-eight responses were received about the costing
template, all of whom were then sent the blank costing template. This resulted in four
partially completed templates from areas offering Healthy Start vitamin supplements on a
targeted basis and four partially completed templates being received from areas offering
Healthy Start vitamin supplementation on a universal basis.
Due to the partial completeness of the templates received and the large variation in
responses it was agreed with NICE and the ERG that taking an average of these values was
not appropriate. It was agreed YHEC would work closely with two areas delivering Healthy
Start vitamin supplements to determine a cost of running the scheme universally and the
uncertainty in this input explored in sensitivity and scenario analyses.
3.1.4 Central Cost Data
A telephone conference was held with the DH, NICE and YHEC to determine the central
cost to the DH of running the Healthy Start vitamin supplement scheme. The DH estimated
that the main cost of running the Healthy Start scheme was distributing the food vouchers
and that beyond the price paid to NHS Supply Chain for the vitamins, the cost of supplying
the vitamin coupons on top of the food vouchers was negligible.
In order to account for the additional applications in the universal scenario the DH provided
an estimate of the cost of each application and the cost of reissuing vitamin coupons for the
subsequent provision of coupons after the initial application. These costs are described in
the relevant inputs section of the report. It has been assumed in the base case that a
universal scheme would continue to require applications to be made and coupons to be
used. Sensitivity analysis has been undertaken to determine the impact of varying these
costs.

Section 3 11
Table 3.1: Summary of data sources
Data source* Model inputs
National surveys Uptake of supplements, effectiveness data**
Costing templates Local costs of running the HS vitamin scheme
YHEC survey To determine how many people pay privately for their vitamins and the average price paid
DH data Central cost of running the HS vitamin scheme to the DH
* Please note that some information was submitted from industry and although this was considered
it was not suitable for use in the economic model. This was because the information provided was
not generalisable or internal market research did not provide as many model inputs as the national
survey data.
** Effectiveness inputs in the model were used to calculate how many people had either a pregnancy
affected by a NTD, symptomatic vitamin D deficiency or were below the LRNI for vitamin A and C
in each subgroup.

Section 4 12
Section 4: Inputs
The following sections report in detail on the approach and inputs used for each vitamin.
Assumptions are described in the text. The inputs described in this section of the report are
those used in the base case and the effect of varying these inputs has been explored
through sensitivity and scenario analyses (reported in Section 5.2).
4.1 POPULATION INPUTS
The population inputs in the model provide the number of people in each population
subgroup annually. Table 4.1 below provides the population figures and data sources used.
Table 4.1: Population inputs and source
Population with the potential to benefit Universal Source
Pregnant women after 10 weeks 697,911a b
ONS, 2013 (12)
Women with a child up to 12 months 718,015a ONS, 2013 (12)
Women with a child up to 12 months, who have had another child within that 12 months
20,104a Chandra et al. (2005) (13)
Infants and children over 6 months and under 4 years 2,389,870 ONS, 2014 (14)
Women planning a pregnancy and become pregnant 393,472a Welling et al. (2013) (15)
Pregnant women before 10 weeks and have a baby 718,015a ONS, 2013 (12)
Infants aged 0 to 6 months 341,410 ONS, 2014 (14)
Infants and children over 4 years and under 5 years 682,820 ONS, 2014 (14)
a The number of births been adjusted (increased) to account for multiple births and includes live
births only;
b This figure excludes those who have another child within 12 months of a birth to avoid double
counting.
The number of pregnancies and the number of children were calculated from Office for
National Statistics (ONS) data (12, 14). The starting point was the number of births and the
number of pregnancies was calculated from that. The number of births was adjusted to
account for multiple births. The number of women who have had another child within 12
months was reported by a study in the USA which was used to calculate the number of
women who had a second child within 12 months. The paper reported that 2.8% of women
had a second birth in less than 12 months from the first to second birth (13).
A study in 2013 reported the proportion of unplanned pregnancies as 54.8% in the general
population (15). This was used as a basis for calculating the number of women who plan a
pregnancy. For women planning pregnancy and women before 10 weeks pregnant, the
population taking vitamins was then calculated. This included both those with the potential to
benefit from vitamins (i.e. having a live birth) and those who do not become pregnant or
those that become pregnant and miscarry. The NHS website (16) reports that 84% of
couples trying to conceive naturally will do so within one year. Therefore, the population
taking vitamins was higher than the population planning and successfully conceiving

Section 4 13
(population = 468,419). In addition, Gindler et al. (2001) (17) reported that 9.1% of women
with confirmed pregnancies miscarry during early pregnancy (this study was carried out in
China) and that supplement use did not differ between the two groups. Therefore, the
population of women planning a pregnancy and those pregnant before 10 weeks is higher
than just those who are pregnant before 10 weeks and who go on to have a baby
(population = 789,895).
4.2 UPTAKE INPUTS
This section discusses the inputs used to populate the baseline uptake of vitamin
supplements and the new level of uptake of vitamin supplements for each population group.
4.2.1 Baseline Uptake Inputs
Table 4.2 shows the inputs and sources used to populate the baseline levels of uptake of
vitamin supplements for each population group and vitamin.
Table 4.2: Baseline uptake inputs and sources
Folic
acid (%) Vitamin A (%)
Vitamin C (%)
Vitamin D (%)
Currently targeted groupsf
Pregnant women after 10 weeks 23.0a
39.0
a,e 42.3
a,e
Women with a child up to 12 months 36.8a,e
36.8a,e
36.8a,e
Infants and children over 6 months and under 4 years
7.8b,c,e
8.4b,c,e
7.8b,c,e
Extended groups
Women planning a pregnancy 37.0a
23.3
a,d,e 23.3
a,d,e
Pregnant women before 10 weeks 79.0a
39.0
a,e 42.3
a,e
Infants aged 0 to 6 months
8.3a,e
8.3a,e
8.3a,e
Infants and children over 4 years and under 5 years
12.0c,e
12.0c,e
11.0c,e
a IFS – Infant Feeding Survey, 2010 (9); b DNSIYC – Diet and Nutrition Survey of Infants and Young Children, 2011 (10); c NDNS – National Diet and Nutrition Survey, 2008/09 to 2011/12 (8); d YHEC survey; e The input has been calculated based on the YHEC survey data and assumptions (see subsequent
sections); f Assumptions have been made throughout this table that the national survey data apply to the
model subgroups.
The ERG discussed using uptake data for women planning a pregnancy from Bestwick et al.
(2014) (18). A scenario analysis (Section 5.3.9) has been carried out using the Bestwick
data which showed that this had a minimal impact on the ICER.
4.2.1.1 Pregnant women after 10 weeks
The source used to populate these inputs was the IFS (9), as shown in Table 4.2. For folic
acid, the IFS reported the proportion of mothers taking folic acid later on in pregnancy (after
3 months).

Section 4 14
The IFS (9) reported the type of supplements taken during pregnancy for some supplements
including folic acid. However, the IFS did not explicitly report use of vitamin C supplements.
But the proportion taking Healthy Start vitamin supplements; ‘multivitamins and iron’;
‘multivitamins only’ and the proportion taking ‘vitamins, iron and folic acid’ were included as
the assumption was made that these supplement types included vitamin C. Further, some
participants may report taking supplements in more than one category. Therefore, this input
in the model may be an over estimate of baseline uptake. The raw data of the IFS were
checked to ensure that there was no additional data specifically about vitamin C. No new
information was identified.
The IFS reported the uptake of vitamin D and Healthy Start vitamin supplements (which
contain vitamin D). The assumption was made that the other supplements (‘multivitamins
and iron’, ‘multivitamins only’ and ‘vitamins, iron and folic acid’) also contained vitamin D.
The assumption was made that vitamin D supplements contained the required dosage.
However, some vitamin D supplements may contain less than the required dosage.
The raw data of the IFS were also checked to ensure that there was no additional detail
specifically about vitamin D and again, no new information was identified. Therefore, the
input used may be a slight overestimate of the true baseline uptake.
The IFS did not report supplement intake according to whether the supplements were taken
earlier or later on in pregnancy. Therefore, for both vitamin C and vitamin D, the same
baseline uptake rate has been used for pregnant women before and after 10 weeks.
4.2.1.2 Women with a child up to 12 months
The source used to populate these inputs was the IFS (9), as shown in Table 4.2. The IFS
reported the proportion of breastfeeding mothers taking supplementary vitamins or iron from
4 weeks to 10 months postpartum. Although these data were not ideal, given that not all
women with a child up to 12 months will breastfeed (those women who do breastfeed may
have different supplement taking behaviour compared to those who do not breastfeed), it
was judged to be more applicable then using supplementation levels from the general
female population.
4.2.1.3 Infants and children over 6 months and under 4 years
The sources used to populate the uptake for infants and children over six months and under
four years were from the DNSIYC (10) and the NDNS (8), as shown in Table 4.2. The
DNSIYC reported the percentage of infants aged 7 months to 18 months consuming any
type of supplement. The NDNS reported the percentage of children aged 1.5 to 3 years
consuming supplements. A weighted average of the results from both surveys was
calculated.
In the main published reports, the DNSIYC and the NDNS did not state whether vitamin A
supplements specifically were taken. Neither do they report which vitamins are included in
‘multivitamins’ or ‘any type of supplement’. Therefore, the assumption was made that ‘any
type of supplement’ and ‘multivitamins’ contained vitamin A and D. The NDNS also reports

Section 4 15
‘calcium only or with vitamin D’ which was also included in the vitamin D uptake. Therefore,
this may overestimate the baseline uptake of vitamin A and D.
Similar assumptions were made with vitamin C although the NDNS also reported
participants that consumed vitamin C only.
4.2.1.4 Women planning a pregnancy
The IFS (9) and the YHEC survey were used to estimate the uptake for women planning a
pregnancy, as shown in Table 4.2. The IFS reported the proportion of mothers who took
folic acid before pregnancy.
The YHEC survey showed that of those women taking folic acid, 63% took it in a
multivitamin supplement. The assumption was made that this multivitamin supplement
would also contain vitamins C and D.
4.2.1.5 Pregnant women before 10 weeks
For women in the early stages of pregnancy (i.e. before 10 weeks), uptake was estimated
using the IFS (9), as shown in Table 4.2. The IFS reported the proportion of mothers who
took folic acid during the first three months of pregnancy.
For vitamin C and vitamin D, the same assumptions and inputs were used as those
described in Section 4.2.1. This is because the IFS reported information on the use of
supplements other than folic acid for pregnant women but not by stage of pregnancy and so
the same uptake inputs were applied to pregnant women before and after 10 weeks.
4.2.1.6 Infants aged 0 to 6 months
The IFS (9) was used to obtain the uptake rates for infants aged from birth to six months, as
shown in Table 4.2. The IFS reported the proportion of babies aged 4 weeks to 6 months
given vitamin drops. The assumption was made that the vitamin drops contain vitamins A, C
and D.
4.2.1.7 Infants and children over 4 years and under 5 years
Uptake for infants and children between the ages of four and five were estimated using the
NDNS (8), as shown in Table 4.2. The NDNS reported the percentage of participants
consuming supplements for children aged 4 to 10 years.
As with the other population subgroups using the NDNS, the NDNS did not specify each
vitamin in the main published report and therefore an assumption was applied that
multivitamins contain vitamins A, C and D.
4.2.2 New Level of Uptake in Universal Scenario
The model allows for varying uptake of the supplements in a universal scenario.

Section 4 16
A study carried out in Birmingham, Moy et al. (2012) (5) and McGee et al. (2013) (19)
identified the increase in uptake when Healthy Start vitamin supplements were given
universally5 compared to the targeted offering. The increase in uptake (20 percentage
points in women and 17 percentage points in children) observed in these studies was
applied to the national survey data to derive the estimated uptake with a universal offering.
The model includes a substitution coefficient that can be used to calculate different uptake
scenarios. The substitution coefficient determines how the extra uptake is applied.
The substitution coefficient allows for some of the Healthy Start uptake to replace those that
were previously privately purchasing their own supplements.
If the substitution coefficient is 0%, the model assumes that all additional Healthy Start
uptake is new uptake (i.e. none of these people were taking supplements before). This is
illustrated in Graph 4.1 in which the uptake of Healthy Start vitamins is an additional 20%
(the green bar). Because the entire Healthy Start uptake is from people who did not
previously take vitamin supplements, the overall uptake has increased by the same amount
(20%, the green bar). This is explained in more detail in the technical Appendix B.
Graph 4.1: Additional uptake with universal offering in the current subgroups
(scenario 1)*
* Numbers are illustrative.
5 The universal scheme in this study consisted of providing vitamins free of charge to pregnant and lactating
women and children aged under 5 years.

Section 4 17
If the substitution coefficient is 50%, the model assumes that the Healthy Start vitamin
supplement uptake is split proportionally between new uptake and substitutes (those that
were purchasing privately but have moved to the free Healthy Start vitamin supplements).
The proportion depends on the baseline uptake. All other substitution coefficients interpolate
between these assumptions. For example, a substitution coefficient of 25% is halfway
between 0% and 50% and a substitution coefficient of 75% is halfway between 50% and
100%. The application of the substitution coefficient when baseline uptake is either very low
or very high may be more complex. Details of this are provided in Appendix B.
4.3 EFFECTIVENESS INPUTS
The effectiveness inputs in the model were used to calculate how many people have either a
pregnancy affected by a NTD, symptomatic vitamin D deficiency or are below the LRNI for
vitamin A and C in each subgroup.
The number of people in each of the health states described above was calculated using the
following method:
𝑁𝑢𝑚𝑏𝑒𝑟 𝑜𝑓 𝑝𝑒𝑜𝑝𝑙𝑒 𝑡ℎ𝑎𝑡 ℎ𝑎𝑣𝑒 𝑎𝑛 𝑜𝑢𝑡𝑐𝑜𝑚𝑒
= (𝑛𝑢𝑚𝑏𝑒𝑟 𝑜𝑓 𝑝𝑒𝑜𝑝𝑙𝑒 𝑡𝑎𝑘𝑖𝑛𝑔 𝑣𝑖𝑡𝑎𝑚𝑖𝑛 𝑠𝑢𝑝𝑝𝑙𝑒𝑚𝑒𝑛𝑡𝑠
× 𝑝𝑟𝑜𝑏𝑎𝑏𝑖𝑙𝑖𝑡𝑦 𝑜𝑓 𝑎𝑛 𝑜𝑢𝑡𝑐𝑜𝑚𝑒 𝑖𝑓 𝑡𝑎𝑘𝑖𝑛𝑔 𝑣𝑖𝑡𝑎𝑚𝑖𝑛 𝑠𝑢𝑝𝑝𝑙𝑒𝑚𝑒𝑛𝑡𝑠)
+ (𝑛𝑢𝑚𝑏𝑒𝑟 𝑜𝑓 𝑝𝑒𝑜𝑝𝑙𝑒 𝑛𝑜𝑡 𝑡𝑎𝑘𝑖𝑛𝑔 𝑣𝑖𝑡𝑎𝑚𝑖𝑛 𝑠𝑢𝑝𝑝𝑙𝑒𝑚𝑒𝑛𝑡𝑠
× 𝑟𝑖𝑠𝑘 𝑜𝑓 𝑎𝑛 𝑜𝑢𝑡𝑐𝑜𝑚𝑒 𝑖𝑓 𝑛𝑜𝑡 𝑡𝑎𝑘𝑖𝑛𝑔 𝑣𝑖𝑡𝑎𝑚𝑖𝑛 𝑠𝑢𝑝𝑝𝑙𝑒𝑚𝑒𝑛𝑡𝑠)
Initially the ERG requested that, for mothers within the first 12 months postpartum, the health
outcomes for both the mother and the baby should be included within the model. However,
no evidence was identified demonstrating the effect of mothers’ supplementation on their
babies’ nutritional status or health outcomes at the doses provided by Healthy Start.
Therefore this could not be included in the model.
The ERG also discussed that the vitamin status of babies in the first month of life may be
determined by the mothers’ vitamin status during pregnancy. Data were not sought on this
issue as an extreme scenario was modelled and the effect on the ICER was negligible6.
Tables 4.4, 4.5, 4.6 and 4.7 outline the effectiveness inputs and the source of the inputs for
folic acid, vitamin A, vitamin C and vitamin D, respectively.
6 An extreme scenario was modelled in which none those aged 0 to 1 months had vitamin D
deficiency and none were provided with Healthy Start supplements in the universal scenario 2. This
represents the most extreme scenario in which all mothers take vitamin D supplements and all
breastfeed their babies and all of those babies then have sufficient supplementation in the first
month. Even with these extreme values, the ICER was reduced by only a small amount (less than £150).

Section 4 18
4.3.1 Folic Acid
Table 4.4 shows the inputs and sources for the folic acid probability inputs. Recent evidence
on the effectiveness of supplementation with folic acid for the prevention of NTDs is lacking.
This may be due to the previously established knowledge of the advantages of folic acid
supplementation when planning a pregnancy and during the first trimester of pregnancy. The
lack of recent data is unlikely to be a major issue, because the dietary supply of folate has
only increased slightly in that past three decades. The mean dietary supply of folate as
reported in the NDNS in the late 1980s shows only small differences over time as shown in
Table 4.3. Further, many studies examine pregnancies affected by a NTD in people who
have previously had a pregnancy affected by a NTD (reoccurrence). This may be due to the
relatively low prevalence of first occurrence NTDs, meaning that very large sample sizes are
needed to produce meaningful results.
Table 4.3: Mean intake of folate (from food sources only)
Age group Mean 1980s intake µg/da Mean 2008-2012 intake µg/d
b
16-24 198 189
25-34 206 218
35-49 220 225 a Dietary and Nutritional Survey of British Adults 1986/87
b NDNS (8)
A Cochrane review on the effect of periconceptional folic acid supplementation (20) identified
only one trial conducted in 1994 (Czeizel et al.) examining the first occurrence of a
pregnancy affected by a NTD. However, the identified study did not report folic acid
supplementation effectiveness in all of the groups required for the model (those planning a
pregnancy and during pregnancy and during pregnancy only compared to no
supplementation). The study (20) did not report on the effectiveness of folic acid
supplementation during pregnancy alone.
One study was identified that included the probability of NTDs for the groups needed in the
model (Milunsky et al., 1989 (21)). Although this study is not a recent study, it was the only
one identified that included the effectiveness data needed to model extending provision to
the subgroups defined in Section 2.1. Another drawback of the study is that it included
women taking a range of daily doses of folic acid; in a random sample of the study, doses
ranged from 100μg to 1000μg.
Milunsky et al. (21) reported the baseline prevalence of NTDs in the study population and
the prevalence of NTDs in those who did not take folic acid, those who took folic acid in the
first trimester only and those who took folic acid before conception and in the first trimester.
Due to the baseline prevalence of NTDs in the UK currently being lower than the prevalence
when this study was carried out (the study was also carried out in America), the prevalence
for pregnancies affected by a NTD in England and Wales was used (prevalence of
pregnancies affected by a NTD: 0.15% (22)) and the probability applied to the current
population. These calculations resulted in the figures shown in Table 4.4. A number of

Section 4 19
steps had to be taken to calculate the probability of pregnancy affected by a NTD occurring
in the UK which are outlined below.
𝑅𝑖𝑠𝑘𝑃𝑜𝑝𝑢𝑙𝑎𝑡𝑖𝑜𝑛 = (𝑃𝑟𝑜𝑝𝑜𝑟𝑡𝑖𝑜𝑛𝑁𝑒𝑣𝑒𝑟 𝑡𝑎𝑘𝑖𝑛𝑔 𝑣𝑖𝑡 × 𝑅𝑖𝑠𝑘𝑁𝑒𝑣𝑒𝑟 𝑡𝑎𝑘𝑖𝑛𝑔 𝑣𝑖𝑡)
+ (𝑃𝑟𝑜𝑝𝑜𝑟𝑡𝑖𝑜𝑛𝐹𝑖𝑟𝑠𝑡 𝑡𝑟𝑖𝑚𝑒𝑠𝑡𝑒𝑟 𝑜𝑛𝑙𝑦 × 𝑅𝑖𝑠𝑘𝐹𝑖𝑟𝑠𝑡 𝑡𝑟𝑖𝑚𝑒𝑠𝑡𝑒𝑟 𝑜𝑛𝑙𝑦)
+ (𝑃𝑟𝑜𝑝𝑜𝑟𝑡𝑖𝑜𝑛𝐵𝑒𝑓𝑜𝑟𝑒 𝑝𝑟𝑒𝑔 𝑎𝑛𝑑 𝑖𝑛 𝑓𝑖𝑟𝑠𝑡 𝑡𝑟𝑖𝑚 × 𝑅𝑖𝑠𝑘𝐵𝑒𝑓𝑜𝑟𝑒 𝑝𝑟𝑒𝑔 𝑎𝑛𝑑 𝑖𝑛 𝑓𝑖𝑟𝑠𝑡 𝑡𝑟𝑖𝑚)
Since we know the risk for the overall population, and also know the relative risks for each
subgroup compared to each other (denoting the risk for those never taking vitamins as ‘α’),
we can show the equation as:
0.15% = (0.21 × 𝛼) + (0.42 × 0.69𝛼) + (0.37 × 0.34𝛼) Rearranging, this allows us to estimate the value of α (i.e. the risk for those never taking
supplements) to be 0.24%. By application of the relative risk ratios, the risk for those taking
supplements in the first trimester only (0.16%) and those taking supplements before
pregnancy and during the first trimester (0.08%) can also be inferred.
The probability of pregnancies affected by a NTD in women taking folic acid in the first
trimester of pregnancy (reported in (21)) was applied to the model subgroup of those taking
folic acid before 10 weeks. For the model subgroup of those taking folic acid after 10 weeks
of pregnancy (the current Healthy Start offering) the same benefit as not taking folic acid was
applied. This assumption has been based on the World Health Organisation (WHO)
guideline 2012 which indicated that there was no preventative effect of supplementing with
folic acid on pregnancies affected by a NTD after 10 weeks:
“Folic acid requirements are increased in pregnancy because of the rapidly
dividing cells in the fetus and elevated urinary losses. As the neural tube
closes by day 28 of pregnancy, when pregnancy may not have been
detected, folic acid supplementation after the first month of pregnancy will
not prevent neural tube defects.” (WHO guideline, 2012 (23)).
However, it should be noted that in the UK it is recommended that folic acid supplements
should be taken from when a women begins to plan a pregnancy until the end of the 12th
week of pregnancy, although it is common within the literature for there to be disparities in
the definition of a trimester.
It was not possible to identify the probability associated with taking folic acid when planning
a pregnancy, but not taking folic acid during pregnancy. This is because the majority of
women would not supplement when planning a pregnancy and then stop when pregnant
(except perhaps in cases where women experience sickness, precluding their ability to take
tablets). Therefore, unsurprisingly, there were no studies identified that investigated this.
Instead the model includes women taking folic acid supplements when planning a pregnancy
and when pregnant up to 10 weeks and it also includes the subgroup women taking folic
acid supplements when pregnant before 10 weeks (and not when planning). Although it was
not possible to model the effects of women taking supplementation when planning a
pregnancy only, it is also unlikely that the Healthy Start scheme would be supplied in this
Section 4 20
way. As if it was, women would receive the Healthy Start vitamin supplements when they
were planning a pregnancy, then, once pregnant would not receive them for 10 weeks and
then would start receiving the supplements again after 10 weeks (as in the current targeted
offering).
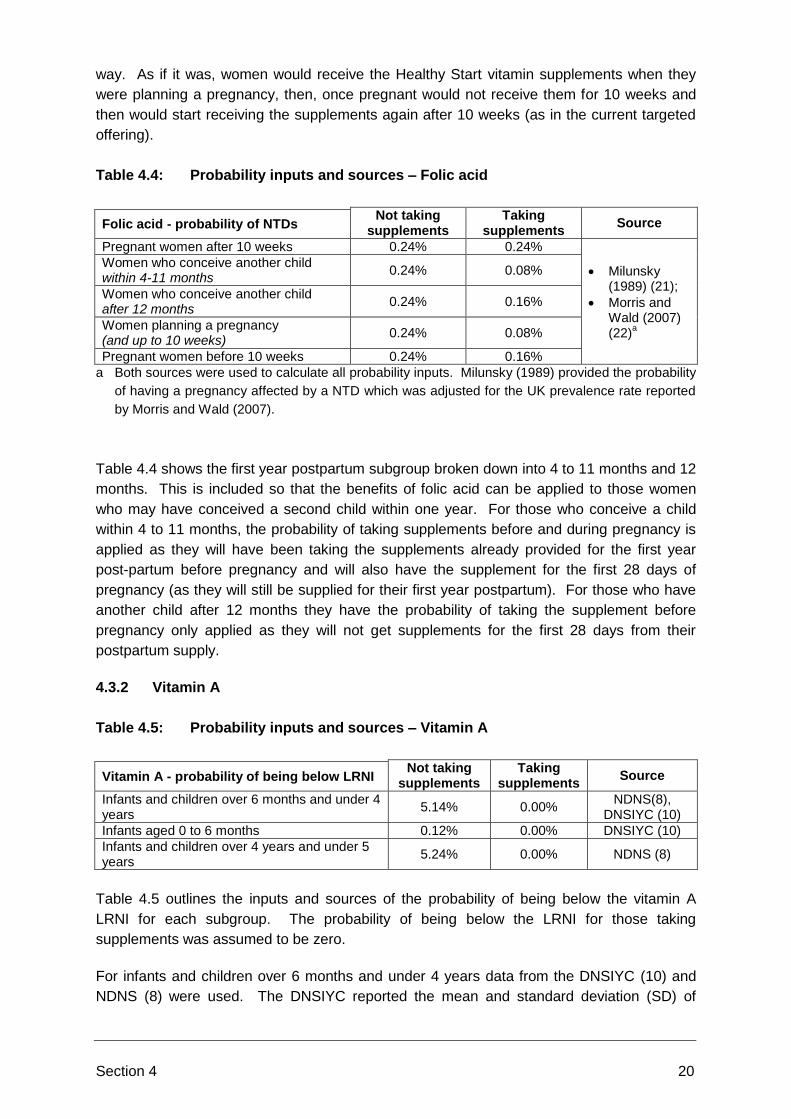
Table 4.4: Probability inputs and sources – Folic acid
Not taking supplements
Taking supplements
Source Folic acid - probability of NTDs
Pregnant women after 10 weeks 0.24% 0.24%
Milunsky (1989) (21);
Morris and Wald (2007) (22)
a
Women who conceive another child within 4-11 months
0.24% 0.08%
Women who conceive another child after 12 months
0.24% 0.16%
Women planning a pregnancy (and up to 10 weeks)
0.24% 0.08%
Pregnant women before 10 weeks 0.24% 0.16%
a Both sources were used to calculate all probability inputs. Milunsky (1989) provided the probability
of having a pregnancy affected by a NTD which was adjusted for the UK prevalence rate reported
by Morris and Wald (2007).
Table 4.4 shows the first year postpartum subgroup broken down into 4 to 11 months and 12
months. This is included so that the benefits of folic acid can be applied to those women
who may have conceived a second child within one year. For those who conceive a child
within 4 to 11 months, the probability of taking supplements before and during pregnancy is
applied as they will have been taking the supplements already provided for the first year
post-partum before pregnancy and will also have the supplement for the first 28 days of
pregnancy (as they will still be supplied for their first year postpartum). For those who have
another child after 12 months they have the probability of taking the supplement before
pregnancy only applied as they will not get supplements for the first 28 days from their
postpartum supply.
4.3.2 Vitamin A
Table 4.5: Probability inputs and sources – Vitamin A
Not taking supplements
Taking supplements
Source Vitamin A - probability of being below LRNI
Infants and children over 6 months and under 4 years
5.14% 0.00% NDNS(8),
DNSIYC (10)
Infants aged 0 to 6 months 0.12% 0.00% DNSIYC (10)
Infants and children over 4 years and under 5 years
5.24% 0.00% NDNS (8)
Table 4.5 outlines the inputs and sources of the probability of being below the vitamin A
LRNI for each subgroup. The probability of being below the LRNI for those taking
supplements was assumed to be zero.
For infants and children over 6 months and under 4 years data from the DNSIYC (10) and
NDNS (8) were used. The DNSIYC reported the mean and standard deviation (SD) of

Section 4 21
average daily intake from food sources only for vitamin A (as retinol equivalents) for those
aged 7 months to 18 months, which was used to impute the number of people below the
LRNI when not taking supplements. The NDNS reported the proportion of participants with
daily intakes lower than the LRNI from food sources only, for those aged 1.5 to 3 years. A
weighted average was calculated.
For infants and children aged 0 to 6 months, data from the DNSIYC was used for those aged
4 to 6 months. The DNSIYC reported the mean and SD of average daily intake from food
sources only for vitamin A for those aged 4 to 6 months only.
For children aged 4 to 5 years, the NDNS raw data set reported the proportion of participants
with daily intakes lower than the LRNI from food sources only for those aged 4 to 5 years.
4.3.3 Vitamin C
Table 4.6 outlines the inputs and sources of the probability of being below the vitamin C
LRNI for each subgroup. The probability of being below the LRNI for those taking
supplements was assumed to be zero.
For the infants and children subgroups the same data were used as that described in
Section 4.3.2 above, though specific to vitamin C.
For pregnant women, women up to 12 months postpartum and women planning a
pregnancy, data were used from the NDNS which reported the proportion of non-pregnant
women in the general population with daily intakes lower than the LRNI from food sources
only. The survey reported this for women aged 19 to 64 years. However, analysis of the
raw data provided this input for those aged 19 to 44 years. In the absence of any more
appropriate data, the assumption was applied that the probability of being below the LRNI if
not taking supplements was the same for pregnant women as for non-pregnant women.
Table 4.6: Probability inputs and sources – Vitamin C
Not taking supplements
Taking supplements
Source Vitamin C - probability of being below LRNI
Pregnant women after 10 weeks 1.55% 0.00% NDNS raw data (8)
Women with a child up to 12 months 1.55% 0.00% NDNS raw data (8)
Infants and children over 6 months and under 4 years
0.71% 0.00% NDNS (8), DNSIYC (10)
Women planning a pregnancy (and up to 10 weeks)
1.55% 0.00% NDNS raw data (8)
Pregnant women before 10 weeks 1.55% 0.00% NDNS raw data (8)
Infants aged 0 to 6 months 0.00% 0.00% DNSIYC (10)
Infants and children over 4 years and under 5 years
0.00% 0.00% NDNS (8)

Section 4 22
4.3.4 Vitamin D
The approach taken for vitamin A and C could not be adopted for vitamin D as there was no
defined LRNI.
In the absence of national survey data, data from Moy et al. (2012) (5) and McGee and
Shaw (2013) (19) were used. Both studies describe the same intervention of universal
supplementation rolled out in Birmingham. Moy et al. (2012) (5) reported a before-
intervention uptake (3%) and McGee and Shaw (2013) (19) reported an after intervention
uptake (20% for children under 5 and 23% for pregnant and breastfeeding women). The
studies also reported the incidence of symptomatic vitamin D deficiency.
Modelling of the consequences of increased uptake in these two subgroups was based on
the prevalence of presenting cases of symptomatic vitamin D deficiency, before and after the
intervention, and was taken from Moy et al. (2012) (5). The annual incidence of
symptomatic vitamin D deficiency was 0.12% before the intervention and 0.049% after the
intervention. These data were only available for children, so in the absence of any other
data, the assumption was made that the same effects applied to women. Based on these
two data points, both an exponential function and a linear function were applied (to allow the
model user to select which function to use) to the percentage of patients with symptomatic
vitamin D deficiency based on the percentage uptake of vitamin D selected earlier in the
model. Table 4.7 shows the probability of having symptomatic vitamin D deficiency using
the exponential function and the national survey data in the uptake inputs.
Vitamin D deficiency can be a cause of hypocalcaemic seizures or fits, particularly in new-
borns. Although these are one aspect of symptomatic vitamin D deficiency which is the
outcome measure included in the model, the ERG debated whether hypocalcaemic seizures
due to vitamin D deficiency should be separately modelled and requested information on the
incidence of this condition. A paper was identified which reported the incidence to be 3.49
per million children in UK and Ireland (Basatemur and Sutcliffe 2014). Of these, 95%
occurred in children aged from 0-2 years with a significantly higher incidence in males and in
children from South Asian or Black communities compared to white children.
ERG members were aware that if left untreated, hypocalcaemic fits can in extreme cases,
lead to permanent neurological damage with symptoms that could be considered similar to
those of cerebral palsy. They recognised the considerable lifetime implications for the
children and their families and noted the very large costs this would incur to public sector for
each case. However it was not possible to identify data on the proportion of children
suffering a hypocalcaemic fit due to vitamin D deficiency, that go on to develop permanent
neurological damage, or the costs associated with treating and caring for children who do so.
On the advice of the ERG, one of the authors of the above paper was contacted. He advised
that the number of cases of hypocalcaemic fits which result in severe neurological damage is
very small in comparison to the incidence of other conditions caused by a low vitamin D
status that affect bone health in later childhood and adulthood (Personal communication –
Professor Sutcliffe). As these conditions are already included in the model, specific data on
hypocalcaemic seizures have not been added to the analysis.

Section 4 23
Table 4.7: Probability inputs and sources – Vitamin D
Targeted Universal
No provision under Healthy
Start Source
Pregnant women after 10 weeks 0.021% 0.008% N/A
Moy et al. (2012) (5),
McGee and Shaw (2013) (19)
Women with a child up to 12 months
0.026% 0.011% N/A
Infants and children over 6 months and under 4 years
0.097% 0.045% N/A
Women planning a pregnancy (and up to 10 weeks)
N/A 0.020% 0.048%
Pregnant women before 10 weeks N/A 0.008% 0.021%
Infants aged 0 to 6 months N/A 0.044% 0.095%
Infants and children over 4 years and under 5 years
N/A 0.039% 0.084%
4.4 COST INPUTS
As outlined in Section 2.1, the model allows various cost perspectives to be taken.
As previously mentioned, two scenarios of universal supplementation were considered. For
the sake of clarity, this is re-capped below.
Scenario 1 – The current scheme is moved to a universal offering within the current parameters of the scheme (all pregnant women from 10 weeks; women with a child under 12 months; and children over 6 months and under 4 years);
Scenario 2 - The current scheme is moved to a universal offering for all current and extended subgroups (All women planning a pregnancy; pregnant women; women with a child aged under 12 months; infants aged from 0 to 6 months and children aged from 6 months to 5 years).
Table 4.8 below summarises the cost inputs and the sources of these inputs.

Section 4 24
Table 4.8: Cost inputs and sources
Input Source
Intervention cost
Cost of Healthy Start vitamin supplements Department of Health
One off set-up costs YHEC costing template interviews, DH data
Annual cost of distribution and running scheme locally
YHEC costing template interviews
Annual cost of distribution and running scheme centrally
DH data
Treatment cost inputs*
Cost of treating symptomatic vitamin D deficiency
Zipitis et al. (2006)
Cost of pregnancy affected by a NTD Morris and Wald (2007) (22), Bowles et al.
(2014) (24), Jentink et al. (2008) (25), Tilford et al. (2005) (26), NHS Reference Costs
Cost of a day of lost productivity ONS (2014) (27)
* All costs more than one year old have been converted to 2014 prices.
4.4.1 Intervention Cost Inputs
The intervention cost inputs included the price of purchasing the Healthy Start vitamin
supplements and the costs associated with distributing the vitamins and running the Healthy
Start vitamin supplements scheme.
4.4.1.1 Cost of Healthy Start vitamin supplements
The model includes an option to input the increase in the uptake of Healthy Start vitamin
supplements. The cost of Healthy Start vitamin supplements were assumed to be £0.74 per
pack of women’s tablets and £1.38 per pack of children’s drops’ based on communication
with DH. The cost of Healthy Start vitamin supplements was applied for one year’s supply.
4.4.1.2 One-off set-up costs
The set-up cost for the targeted scenario (as the scheme currently stands) was assumed to
be zero both nationally and locally as this scheme was already running. The DH reported
that there were unlikely to be any up-front set-up costs of moving to the universal scheme
(scenario 1 and 2). The model includes the incremental cost of setting up the universal
scheme (scenario 1 and 2). This was varied within sensitivity analysis. Therefore, scenarios
were considered whereby the cost of set-up of the targeted scheme (as the scheme
currently stands) was implied not to be equal to zero.

Section 4 25
4.4.1.3 Annual cost of distribution and running scheme
4.4.1.3.1 Targeted scenario (as the scheme currently stands)
Since we are looking at the additional cost of running the HSV scheme, we can disregard the
annual cost of the targeted scheme and consider only the incremental cost of the relevant
universal scheme each year. The DH reported that the cost of the vitamin supplement part
of the whole Healthy Start scheme is negligible. Although the cost to local government was
said to be zero as the vitamins are reimbursed, there will be some costs from staff time
spent running the scheme and through vitamin wastage and not claiming back the costs of
the scheme. Unfortunately, the costing templates that were returned were only partially
completed and this information was not provided.
4.4.1.3.2 Universal scenario (scenario 1 and 2)
The annual cost of running the scheme if a universal scenario was applied has been
provided by the DH. The DH gave a cost per extra application and a cost per extra vitamin
coupon re-issue. The ERG discussed that it is not yet clear how a universal scheme would
be run and how the vitamins would be distributed. It is possible that coupons would no
longer be issued by the DH. Graph 5.10 of the sensitivity analysis shows how the ICER
would be affected if the cost was £0 (i.e. if it was not necessary for the DH to issue
coupons).
As the costing templates were partially completed, YHEC have carried out detailed
interviews with staff in Public Health Lewisham and Birmingham Community Healthcare
NHS Trust to determine the costs of running a universal scheme. The costs from Public
Health Lewisham were used in the base case analysis because the data is more robust as it
is based on electronic issuing data. In Lewisham, a card scheme is in operation, whereby all
participants carry a chipped card which brings up their record at any participating outlet
distributing vitamin supplements. However, not all areas offering Healthy Start supplements
universally would use this approach and will have different cost structures.
The costs provided by Lewisham included pharmacy costs, ordering and distribution, card
readers and electronic cards including licence fee, training and promotion. The costs were
categorised into fixed and variable costs (fixed costs in this context are defined as the ones
that do not change depending on the number of people in the scheme, such as, annual
licensing fees). This gave a set-up cost for the first year when scaled up for England of over
£XXXX and a variable cost to local government of £XXXX per person (this does not include
the cost of vitamins as these will be reimbursed). Costs in subsequent years were £XXXX
(fixed) and £XXXX per person (variable). The effect of costs in subsequent years on the
ICER has been examined in sensitivity analyses graphs 5.7 and 5.8. The costs provided
from Birmingham included set-up costs, publicity, contract with a distribution centre, staff
time, vitamin wastage, licensing fees and consumables. The costs provided were a best
estimate based on the data that were available. The fixed costs for Birmingham were £113
per year in the first year and subsequent years (giving a cost across all CCGs of £23,843).
The variable costs (based on an estimate of the number of people that vitamin supplements
were provided to) were £12.72 per person in the first year and £10.08 in subsequent years.

Section 4 26
It is important to note that these costs are an estimate and they may vary by area. The two
schemes differ considerably, because Lewisham has instituted a smart-card scheme that
appears to have increased its fixed costs substantially but decreased its per-person.
Further, because cost inputs for ‘per person’ costs of running the current scheme were not
available, the incremental cost per person is likely to be an overestimate. This was a
conservative approach, because the differential cost was likely to be lower which would
make the universal scheme more cost-effective. Another unknown was how the vitamins
would be distributed to both women planning a pregnancy and those less than 10 weeks
pregnant, as this would require a new route to target women this early on. It is likely that
distribution costs might be different for women planning a pregnancy, but it is not known by
how much. Therefore, sensitivity analysis examines how varying this cost impacts upon on
the model result. In the model an assumption is applied that the costs of incorporating new
groups would be the same as for those in the existing scheme.
4.4.2 Treatment Cost Inputs
Treatment costs only apply to vitamin D and folic acid, since no functional outcomes have
been identified for vitamins A and C.
4.4.2.1 Cost of treating symptomatic vitamin D deficiency
The cost of treating a single case of symptomatic vitamin D deficiency was taken from Zipitis
et al. (2006) (6) and was converted to 2012/2013 costs using the Hospital and Community
Health Services Index from PSSRU’s Unit Costs of Health and Social Care 2014. This was
estimated to be £3,021.
4.4.2.2 Cost of a pregnancy affected by a NTD
The cost of a pregnancy affected by a NTD is shown in Table 4.9. The proportion of
pregnancies affected by a NTD that result in termination, anencephaly or spina bifida were
taken from Morris and Wald (2007) (22). The authors report the prevalence of pregnancies
affected by a NTD and the outcome of the pregnancy in England and Wales from 1964 to
2004 based on ONS data. More recent figures reporting the proportion of pregnancies
affected by a NTD that resulted in termination from the British Isles Network of Congenital
Anomaly Registers (BINOCAR) (28) were identified. These figures are similar to those in
Table 4.9. 77.98% of pregnancies affected by a NTD resulted in termination, 3.06% resulted
in still birth, 17.13% resulted in a live birth and 1.83% were classed as miscellaneous. These
data were only available for 36% of the population. Due to the similarity with Morris and
Wald (2007) and the potential problems with the data, these figures were not used in the
base case; however, sensitivity analysis explores the effect of varying the number of
pregnancies resulting in termination (Section 5.5).

Section 4 27
Table 4.9: Pregnancy affected by a NTD lifetime costs – healthcare system
Proportion Cost per case
Terminations 80.00% £890
Birth - anencephaly 6.67% £0
Spina bifida 13.33% £94,458
Total cost per case of pregnancy affected by a NTD 100.00% £13,306
The cost of a termination was taken from NHS Reference Costs 2012/13 as the cost of a
medical termination of a pregnancy at 14 to 20 weeks. No costs were applied to a birth of a
baby with anencephaly as many result in stillbirths and babies from live births are not given
any treatment, only comfort measures, with most dying within 24 hours.
The lifetime cost of spina bifida was calculated from Bowles (2014) (24) who reported the
direct healthcare costs per year for a person with spina bifida to be 4,532 Euros. Jentink et
al. (2008) (25) reported the average life expectancy for a person with spina bifida to be 63.74
years. This cost was converted into pounds using the exchange rate on 31 October 2014
resulting in a cost of £3,580 per year and was discounted at a rate of 3.5% over the lifetime,
resulting in a lifetime cost to the healthcare system of £94,458 (Table 4.9).
The extra societal cost of a pregnancy affected by a NTD has also been estimated (Table
4.10). This cost consists of the societal costs associated with sick days and caregiver time.
Tilford (2009) (26) (from Yi et al., 2011 (29)) reported that the caregiver of a child with spina
bifida works between 7.5 and 11.3 hours less per week in the paid workforce (US study).
Therefore, one day per week (52 days a year) has been assumed lost for children and young
adults aged 0-18 years.
Bowles (2014) (24) reported that 10.84 sick days are taken per year by a person with spina
bifida, assumed from age 18 until 60. Each lost day of work was assigned the cost of
median gross weekly earnings (ONS, 2014 (27)) at £103.40 per day. The costs included in
the societal perspective were discounted at a rate of 3.5% over the lifetime.
Table 4.10: Pregnancy affected by a NTD lifetime costs – Societal (additional to
healthcare system costs)
Proportion Cost
Terminations 80.00% £890
Birth - anencephaly 6.67% £0
Spina bifida 13.33% £87,180
Total cost per case of pregnancy affected by a NTD 100.00% £11,624

Section 4 28
4.5 UTILITY INPUTS
4.5.1 Spina Bifida
There were two sources for the QALYs lost per case of spina bifida, and the model user can
select the preferred source.
The first source of QALYs gained over a lifetime for a person with spina bifida was Jentink et
al. (2008) (25). Jentink reported the proportion of people with three types of spina bifida;
thoracic lesion, lumbar lesion or sacral lesion. For each of these the life expectancy and
utility values at ages 0-10, 11-21 and >21 years was reported. The QALYs for each type of
spina bifida were calculated, these were then discounted at a rate of 3.5% over the lifetime
and a weighted average of these was taken. These data are presented in Table 4.11.
Table 4.11: QALYs for people with spina bifida – Jentink et al. (2008)
Utility Total
discounted QALYs
Spina bifida type Proportion Life
expectancy 0-10 yrs 11-21 yrs >21 yrs
Thoracic lesion 28.00% 40 0.30 0.18 0.30 5.94
Lumbar lesion 62.00% 72 0.45 0.42 0.42 11.69
Sacral lesion 10.00% 79 0.83 0.73 0.79 21.86
Weighted average 11.10
The second source of QALYs for a person with spina bifida was reported by Grosse et al.
(2008) (30). Grosse carried out an economic evaluation and reported that the utility for
children and adolescents with spina bifida was 0.55; the paper reported that in combination
with life expectancy this gives an average QALY value of 13.7.
These two sources providing lifetime QALY estimates for people with spina bifida were
compared with the discounted lifetime QALYs of a person without spina bifida to determine
the difference (i.e. total QALYs lost).
The lifetime QALYs of a person without spina bifida were calculated using population norms
by age bracket (EuroQol UK Population norms (31)) adjusted by mortality rate (ONS
National life tables 2011-13 (32)) and discounted at a rate of 3.5% over the lifetime, giving
lifetime QALYs of 25.00.
Using the data from Jentink et al. (2008) (25) resulted in 13.91 lost QALYs per case of spina
bifida, using Grosse et al. (2008) resulted in lost QALYs per case of 11.25. The model was
run with utility values from Jentink et al. (2008) as this source provided more detail and this
was also the source used for average life expectancy in the model.
The model also included the societal value of lost QALYs from caregivers’ time for the
societal perspective. Tilford et al. (2005) (26) reported the utility for a caregiver of a child
with spina bifida as 0.760. This was assumed to apply for 18 years and results in 1.87
additional lost QALYs.

Section 4 29
4.5.2 Terminations
The utility loss, or reduction in quality of life, for the mother associated with termination was
also included in the model. As shown in Table 4.10, a paper by Jentink et al. (2008) reported
that 80% of pregnancies affected by a NTD result in a termination. The utility value
associated with elective termination was reported in Harris (2004) (33). Harris reported the
utility associated with testing a foetus during pregnancy with normal results and an
unaffected birth (0.923) and the utility associated with testing the foetus, elective abortion
and future births are unaffected (0.836). The disutility was calculated (0.087). The
assumption was made that the disutility applied for 6 months, gradually increasing to the
utility associated with normal results after testing a foetus. The assumption that the disutility
applies for 6 months was an arbitrary assumption made due to a lack of data. The amount
of time that QOL loss occurs due to a termination would vary person to person. This
assumption resulted in a QALY loss associated with elective termination of 0.022 which was
applied to each termination in the model.
There were no data identified that gave a disutility associated with having a baby with
anencephaly, therefore, the same disutility as that associated with a termination was applied
with the assumption that having a baby with anencephaly has at least the same utility loss as
having a termination over the same duration.

Section 5 30
Section 5: Results
5.1 BASECASE RESULTS
In order to make this section clearer, the definitions of current subgroups and extended
subgroups are reiterated below (these are also outlined in Section 2.1):
Population subgroups included in the current Healthy Start offering:
o Pregnant women after 10 weeks;
o Women with a child up to 12 months;
o Infant and children over 6 months and under 4 years.
Extended subgroups:
o Women planning a pregnancy (and before 10 weeks);
o Pregnant women before 10 weeks;
o Infants aged 0 to 6 months;
o Infants and children over 4 years and under 5 years.
As previously mentioned, two scenarios of universal supplementation were considered and
are reported in the results section.
Scenario 1 – The current scheme is moved to a universal offering within the current parameters of the scheme (all pregnant women from 10 weeks; women with a child under 12 months; and children over 6 months and under 4 years;
Scenario 2 - The current scheme is moved to a universal offering for all current and extended subgroups (All women planning a pregnancy; pregnant women; women with a child aged under 12 months; infants aged from 0 to 6 months and children aged from 6 months to 5 years.
5.1.1 Offering Healthy Start Supplements Universally to All of the Current
Subgroups (Scenario 1)
Key messages from Offering Healthy Start Supplements Universally to All of the
Current Subgroups (Scenario 1):
The model shows that offering Healthy Start supplements universally to all of the current subgroups is not cost-effective using the accepted £20,000 threshold for the ICER;
The ICER for this extension is £620,898 per QALY.
Table 5.1 shows the results if the offering were to be extended universally to the current
subgroups but to none of the extended subgroups.
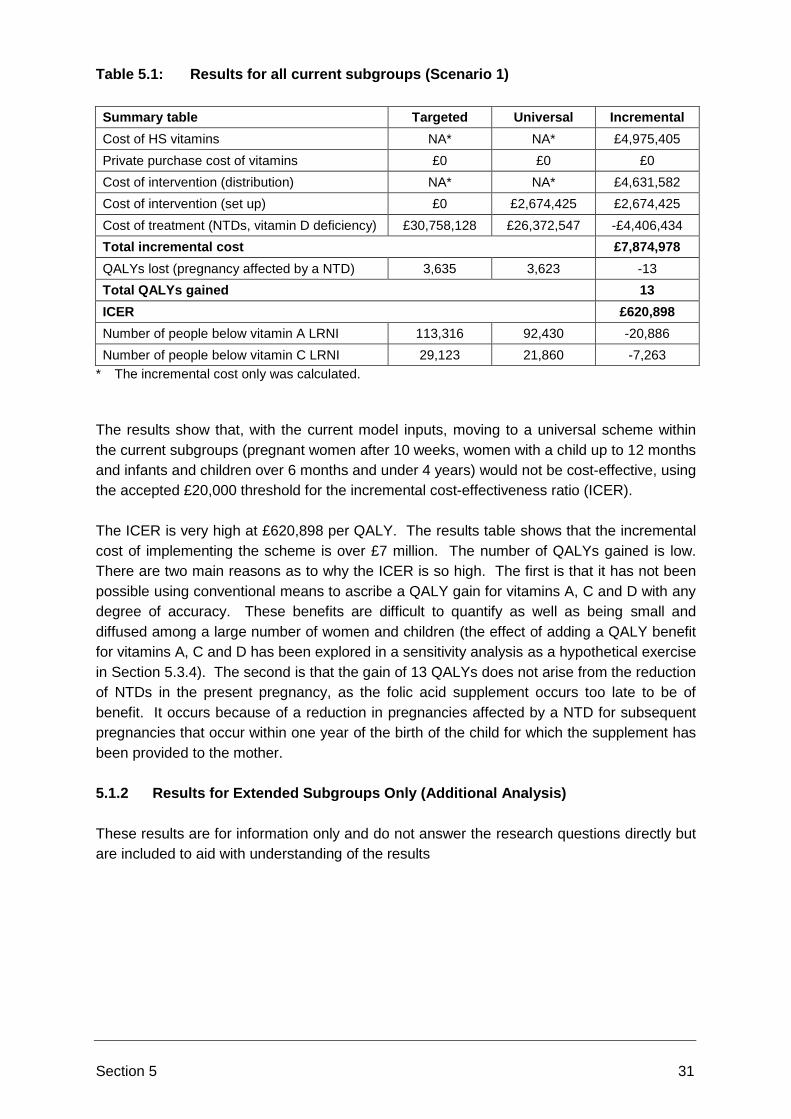
Section 5 31
Table 5.1: Results for all current subgroups (Scenario 1)
Summary table Targeted Universal Incremental
Cost of HS vitamins NA* NA* £4,975,405
Private purchase cost of vitamins £0 £0 £0
Cost of intervention (distribution) NA* NA* £4,631,582
Cost of intervention (set up) £0 £2,674,425 £2,674,425
Cost of treatment (NTDs, vitamin D deficiency) £30,758,128 £26,372,547 -£4,406,434
Total incremental cost £7,874,978
QALYs lost (pregnancy affected by a NTD) 3,635 3,623 -13
Total QALYs gained 13
ICER £620,898
Number of people below vitamin A LRNI 113,316 92,430 -20,886
Number of people below vitamin C LRNI 29,123 21,860 -7,263
* The incremental cost only was calculated.
The results show that, with the current model inputs, moving to a universal scheme within
the current subgroups (pregnant women after 10 weeks, women with a child up to 12 months
and infants and children over 6 months and under 4 years) would not be cost-effective, using
the accepted £20,000 threshold for the incremental cost-effectiveness ratio (ICER).
The ICER is very high at £620,898 per QALY. The results table shows that the incremental
cost of implementing the scheme is over £7 million. The number of QALYs gained is low.
There are two main reasons as to why the ICER is so high. The first is that it has not been
possible using conventional means to ascribe a QALY gain for vitamins A, C and D with any
degree of accuracy. These benefits are difficult to quantify as well as being small and
diffused among a large number of women and children (the effect of adding a QALY benefit
for vitamins A, C and D has been explored in a sensitivity analysis as a hypothetical exercise
in Section 5.3.4). The second is that the gain of 13 QALYs does not arise from the reduction
of NTDs in the present pregnancy, as the folic acid supplement occurs too late to be of
benefit. It occurs because of a reduction in pregnancies affected by a NTD for subsequent
pregnancies that occur within one year of the birth of the child for which the supplement has
been provided to the mother.
5.1.2 Results for Extended Subgroups Only (Additional Analysis)
These results are for information only and do not answer the research questions directly but
are included to aid with understanding of the results

Section 5 32
Key messages from the Results for Extended Subgroups Only:
The model shows that universal provision to only the extended subgroups is cost-
effective overall;
The model shows that two subgroups are cost-effective when assessed on their
own – Women planning a pregnancy (and before 10 weeks pregnant) and pregnant
women before 10 weeks;
Two subgroups are not cost-effective when assessed on their own – Infants aged 0
to 6 months and Children aged 4 to 5 years. These two subgroups are at extra cost
for no extra benefit under the assumption that the benefit of vitamin D cannot be
quantified.
Table 5.2: ICER for extended subgroups only
Subgroup combination. Universal offering is extended to*:
Incremental costs
Incremental QALYs
ICER
Women planning (and before 10 weeks pregnant)
-£989,352 737 Dominant
Pregnant women before 10 weeks £1,683,725 230 £7,126
Infants aged 0 to 6 months £2,668,015 0 Infinite**
Children aged 4 to 5 years £3,363,541 0 Infinite**
All extended subgroups -£306,646*** 737 Dominant
* Green (and bold) text indicates that the ICER is below £20,000. Red text indicates that the ICER is
over £20,000;
** Extra cost for no extra benefit.
*** The incremental costs of all extended subgroups is not the sum of the incremental cost for each
subgroup. This is because when the offering is extended to all subgroups, the set-up (or fixed) cost of
the intervention is only included once. Further, women planning (and before 10 weeks pregnant) is
inclusive of pregnant women before 10 weeks.
Table 5.2 shows the ICER when the universal offering is provided to the extended
subgroups only (without combining with the current subgroups). Similarly to the results
reported for the combined subgroups (Scenario 2), offered universally to the extended
subgroups without also being offered universally to the currently targeted groups is most
cost-effective when the subgroup ‘women planning a pregnancy and before 10 weeks
pregnancy’ is included. The table shows that the ICER is lower when this subgroup is
included due to the large number of QALYs gained from the prevention of pregnancies
affected by a NTD and due to the cost savings made from preventing pregnancies affected
by a NTD and symptomatic vitamin D deficiency. Although the model results do not report
QOL benefits for the other vitamins (vitamins A, C and D) there may still be some QALY
gains. However, suitable quantitative information was not available to include this in the
model. This is explored in more detail in Section 5.3.4. Further, in the absence of any
practical experience of such a scheme, it was assumed that the cost of distributing to the
extended groups was the same as for the current subgroups. This is explored in sensitivity
analyses Graphs 5.7 and 5.8. The detailed breakdown of each combination is shown in
Appendix C.

Section 5 33
5.1.3 Results for Offering Healthy Start Supplements to the Extended Subgroups
and to the Currently Targeted Subgroups, on a Universal Basis (Scenario 2)
Key messages from the Results for Offering Healthy Start Supplements to The
Extended Subgroups and to the Currently Targeted Subgroups, on a Universal Basis
(Scenario 2):
The model shows that offering Healthy Start supplements to the extended subgroups and to the currently targeted subgroups, on a universal basis is cost-effective;
These results are driven by the inclusion of women planning a pregnancy and less than 10 weeks pregnant;
When offering Healthy Start supplements on a universal basis, one extended subgroup when combined with current subgroups (scenario 1) is cost-effective when assessed on its own – Women planning (and before 10 weeks pregnant);
When offering Healthy start supplements on a universal basis, three extended subgroups are not cost-effective when assessed with current subgroups (scenario 1) – Pregnant women before 10 weeks, Infants aged 0 to 6 months and Children aged 4 to 5 years.
Table 5.3 shows the ICER when the offering is extended universally to various combinations
of the extended subgroup. The detailed breakdown of each combination is shown in
Appendix C.
Table 5.3: ICER for extended subgroups combined with current subgroups when
the Healthy Start scheme is offered on a universal basis (Scenario 2)
Subgroup combination. Universal offering is extended to:
Incremental costs
Incremental QALYs
ICER
Current subgroups £7,874,978 13 £620,898
Current subgroups + women planning (and before 10 weeks pregnant)
£4,211,201 750 £5,618
Current subgroups + pregnant women before 10 weeks
£6,839,279 243 £28,185
Current subgroups + infants aged 0 to 6 months
£7,868,568 13 £620,392
Current subgroups + children aged 4 to 5 years
£8,564,095 13 £675,230
Current subgroups + all extended subgroups
£4,893,907 750 £6,528
* Green (and bold) text and background indicates that the ICER is below £20,000. Red text (not
bold) and background indicates that the ICER is over £20,000. Amber text and background
indicates that the ICER is between £20,000 and £30,000.
The table shows that as long as women planning a pregnancy and before 10 weeks
pregnant are included it is cost-effective to move to a universal offering. The model shows
that moving to a universal offering is not cost-effective if supplementation is offered to the
current subgroups plus pregnant women before 10 weeks (without also including women

Section 5 34
planning a pregnancy) or the current subgroups plus infants aged 0 to 6 months or the
current subgroups plus children aged 4 to 5 years.
The infants and children subgroups do not gain QALYs through the prevention of NTD as
this outcome is not relevant to this group. In addition it was not possible to assign QALYs
associated with being below the LRNI (for vitamins A and C) and with having symptomatic
vitamin D deficiency. The ICER is lower for current subgroups plus pregnant women before
10 weeks as when this group take folic acid vitamin supplements this does prevent some
cases of pregnancies affected by a NTD (but not as many as when also taking it when
planning a pregnancy) in the economic model. However, combining this with the currently
targeted subgroups (but not the extended subgroups) is not enough to bring the ICER below
£20,000.
The model shows that it is cost-effective to offer supplementation universally to the currently
targeted groups plus all of the extended subgroups in combination. This is driven by the
inclusion of women planning a pregnancy (and before 10 weeks pregnant). Although it is not
cost-effective to extend the universal offering to the current subgroups alone or the current
subgroups combined with the extended groups of infants and children only or pregnant
women before 10 weeks only. As long as the subgroup ‘women planning a pregnancy (and
before 10 weeks pregnant)’ is included, offering supplementation to the other subgroups in
addition increases the ICER only slightly.
When the subgroup ‘women planning a pregnancy (and before 10 weeks pregnant)’ is
included, all the benefits of preventing NTDs are included, and these benefits outweigh the
incremental costs incurred in the other groups. (The precautionary principle applies here
which argues that the cost of supplying the additional tablets is small but may reduce some
significant harm and is unlikely to cause any harm). The incremental costs of including
vitamins C and D in the women’s supplement within the model is likely to be negligible and
the incremental cost of supplying children’s vitamins is low enough for the whole scheme to
remain cost-effective when the ‘women planning a pregnancy (and before 10 weeks
pregnant)’ subgroup is included. Further, the cost savings associated with preventing cases
of symptomatic vitamin D deficiency also contributes to making the intervention cost-
effective.
When all of the subgroups and extended subgroups are included, vitamin D supplementation
contributes around half of the total cost savings. Although adding the extended infants and
children subgroups does not give any QALY gain in the model, it does contribute added
savings from preventing cases of vitamin D deficiency. The cost-effectiveness is driven by a
combination of:
QALY gains from preventing pregnancies affected by a NTD;
The cost-savings associated with preventing pregnancies affected by a NTD;
Preventing cases of symptomatic vitamin D deficiency.
It is important to emphasise that supplementation with vitamins A, C and D may result in
some QOL benefits but as these could not be quantified, the model only includes QOL
measures for pregnancies affected by a NTD. Although adding the other subgroups

Section 5 35
increases the ICER, there is an added benefit of bringing many more people above the
vitamin A and C LRNI.
It was not possible to model a ‘spill-over’ effect in which supplementation use increases in
those in the currently targeted groups, perhaps as a result of increased awareness of the
Healthy Start vitamin supplements. Using the current model structure, it was not possible to
disentangle from which group (currently targeted or not) the new level of uptake was from.
5.2 SENSITIVITY ANALYSIS (SCENARIO 2)
Extensive univariate sensitivity analyses have been carried out, whereby one parameter
within the model is varied in isolation to assess its impact on the model’s results. Tornado
diagrams allow many univariate sensitivity analyses to be reported in one diagram.
Presenting the univariate sensitivity analyses in a tornado diagram allows the key drivers of
the model to be identified as many univariate sensitivity analyses are viewed alongside each
other. An explanation of how to read and interpret the tornado diagrams is given in
Appendix D which should be read first if the reader is not conversant with this notion.
Key messages from the Univariate Sensitivity Analysis of Uptake and Effectiveness Inputs on the Results for Universally offering HS supplements to the currently targeted groups plus the extended subgroups (Scenario 2; Base Case ICER = £6,528):
Where the probability of pregnant women after 10 weeks having a pregnancy affected by a NTD if not taking folic acid is below 0.15% (i.e. less than 1.5 in 1,000 pregnancies) the model shows that the intervention is no longer cost-effective;
Where the probability of vitamin D deficiency in the new (universal) level of uptake for infants and children over 6 months and under 4 years is above 0.2% the intervention is no longer cost-effective;
Where the uptake of folic acid in the new (universal) level of uptake for women planning a pregnancy and up to 10 weeks pregnant is below 30%, the intervention is no longer cost-effective;
In all other univariate sensitivity analyses conducted around uptake and effectiveness inputs, the universal offering remains cost-effective for the ranges considered.
Graphs 5.1 to 5.6 illustrate the univariate sensitivity analyses for uptake and effectiveness in
tornado diagrams. In each graph the parameters for one of the sub groups is varied and the
results shown are the impact on cost effectiveness for Scenario 2 overall. In each of these
graphs, the results displayed are for scenario 2 overall (all of the potential subgroups to
extend the universal offering to have been included). Each graph displays a dotted line
which shows a cost-effectiveness threshold of £20,000.
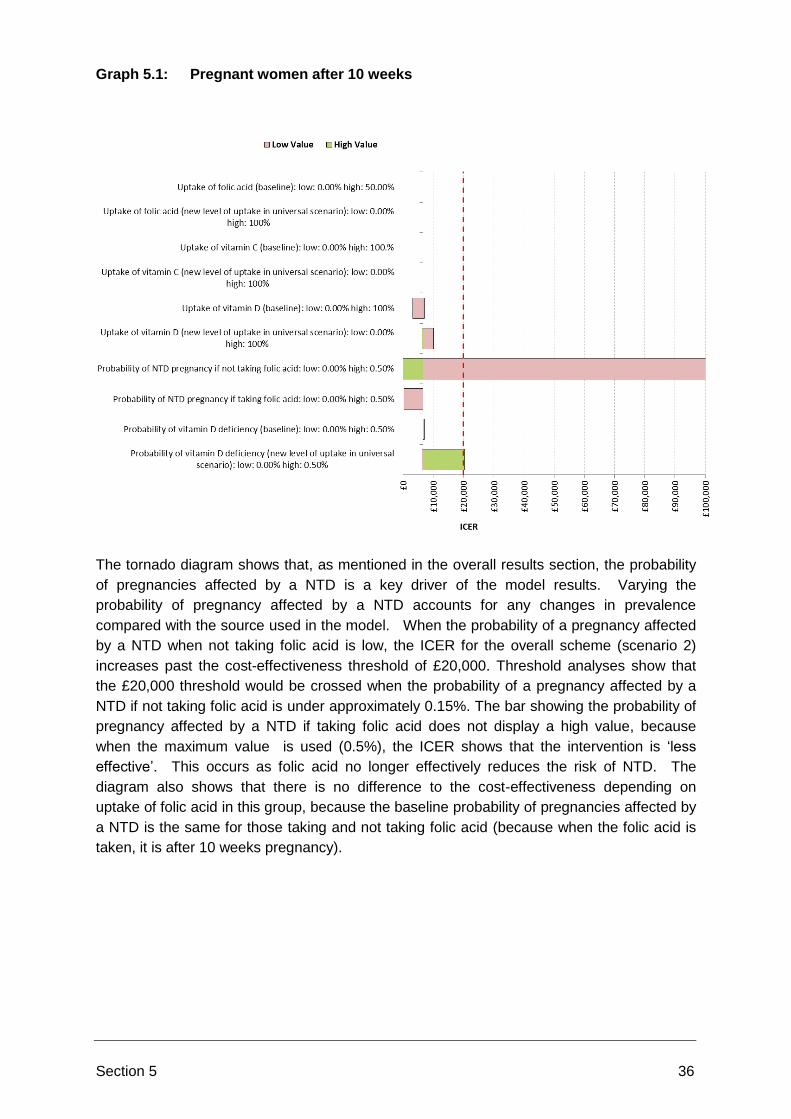
Section 5 36
Graph 5.1: Pregnant women after 10 weeks
The tornado diagram shows that, as mentioned in the overall results section, the probability
of pregnancies affected by a NTD is a key driver of the model results. Varying the
probability of pregnancy affected by a NTD accounts for any changes in prevalence
compared with the source used in the model. When the probability of a pregnancy affected
by a NTD when not taking folic acid is low, the ICER for the overall scheme (scenario 2)
increases past the cost-effectiveness threshold of £20,000. Threshold analyses show that
the £20,000 threshold would be crossed when the probability of a pregnancy affected by a
NTD if not taking folic acid is under approximately 0.15%. The bar showing the probability of
pregnancy affected by a NTD if taking folic acid does not display a high value, because
when the maximum value is used (0.5%), the ICER shows that the intervention is ‘less
effective’. This occurs as folic acid no longer effectively reduces the risk of NTD. The
diagram also shows that there is no difference to the cost-effectiveness depending on
uptake of folic acid in this group, because the baseline probability of pregnancies affected by
a NTD is the same for those taking and not taking folic acid (because when the folic acid is
taken, it is after 10 weeks pregnancy).

Section 5 37
Graph 5.2: Women with a child up to 12 months
In this population subgroup, the folic acid effectiveness rate has a much smaller effect on the
results for the overall scheme (scenario 2) because only a small proportion of this subgroup
would benefit from folic acid supplementation (those who have a further pregnancy within
one year of giving birth).
This tornado diagram shows that, for this subgroup, variation of most inputs does not change
the direction of the results and the intervention is considered cost-effective. The biggest
driver of change is the probability of vitamin D deficiency, if this was increased to the
maximum value the ICER would increase over £20,000. However, it is important to note
that, although it looks like a larger change, the ICER for the overall scheme (scenario 2) is
actually altered by a similar amount to that in Graph 5.1 above. It appears to be a larger
change on Graph 5.2 as it is being compared to other small changes, and therefore, the x-
axis displays a different scale. The highest probability of vitamin D deficiency for the
universal scenario does change the results to just over the £20,000 threshold meaning that
the intervention may be considered not cost-effective at the high value.

Section 5 38
Graph 5.3: Infants and children over 6 months and under 4 years
This graph shows that changing the uptake of vitamin C and vitamin A does not affect the
cost-effectiveness of the overall scheme (scenario 2). This is because no benefits in terms
of QALYs or cost-savings are quantified for vitamins C and A within the model. The biggest
driver of cost-effectiveness in this subgroup is the probability of symptomatic vitamin D
deficiency. Increasing or decreasing the uptake of vitamin D or the probability of
symptomatic vitamin D deficiency can change the results over the £20,000 threshold
meaning that the intervention may not be considered cost-effective. Threshold analyses
show that the £20,000 threshold would be crossed when the probability of vitamin D
deficiency (for the new level of uptake) is just under 0.2%.

Section 5 39
Graph 5.4: Women planning a pregnancy and up to 10 weeks
This graph illustrates that the uptake of folic acid is a key driver of cost-effectiveness of the
overall scheme (scenario 2) and the only input when varied that causes the intervention not
to be considered cost-effective is the uptake of folic acid in the new level of uptake.
Threshold analyses show that the £20,000 threshold would be crossed when the new level
of uptake of folic acid is under approximately 30%. The graph shows that the lower the level
of uptake in the universal scenario, the higher the ICER will be. Similarly to Graph 5.1, the
low value for the probability of pregnancies affected by a NTD if not taking folic acid and the
high value for the probability of a pregnancy affected by a NTD if taking folic acid are not
displayed as this results in universal supplementation being ‘less effective’. If the probability
of a pregnancy affected by a NTD when not taking folic acid is low there is little capacity to
benefit, the intervention would result in extra costs for no benefit. When the probability of a
pregnancy affected by a NTD when taking folic acid is high, this results in the intervention
being ‘less effective’ as there is still a high probability of having a pregnancy affected by a
NTD even when folic acid is taken, so there is no added benefit compared to not taking it.
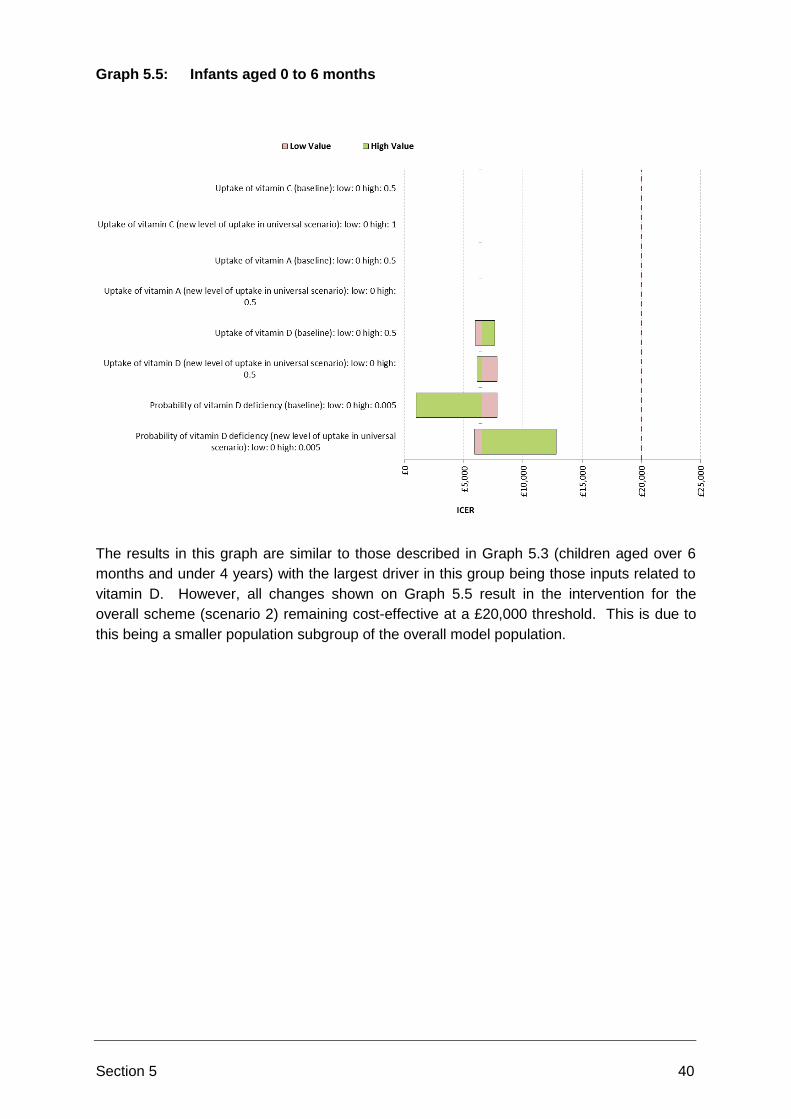
Section 5 40
Graph 5.5: Infants aged 0 to 6 months
The results in this graph are similar to those described in Graph 5.3 (children aged over 6
months and under 4 years) with the largest driver in this group being those inputs related to
vitamin D. However, all changes shown on Graph 5.5 result in the intervention for the
overall scheme (scenario 2) remaining cost-effective at a £20,000 threshold. This is due to
this being a smaller population subgroup of the overall model population.

Section 5 41
Graph 5.6: Infants aged 4 to 5 years
Similarly to Graphs 5.3 (children aged over 6 months and under 4 years) and 5.4 (children
aged 0 to 6 months), the largest driver in this group are those inputs related to vitamin D.
However, no variation of inputs causes the intervention for the overall scheme (scenario 2)
not to be cost-effective.
5.2.1 Cost Sensitivity Analysis
The following sensitivity analyses vary the cost inputs used in the model. These univariate
sensitivity analyses are run from the public perspective and include extending the offering
universally to all current subgroups and all extended subgroups. The substitution coefficient
is set at 0% meaning that all incremental Healthy Start uptake comes from new uptakers (as
far as possible).
The blue line on each graph shows how the ICER changes when an input is varied. The dot
on the line is the base case value (the value which is currently used in the model).

Section 5 42
5.2.1.1 Intervention costs
Key messages from Cost of Extended Universal Scheme sensitivity analysis (on
Scenario 2 results; Base Case ICER = £6,528):
Set-up cost of universal scheme
The ICER does not increase over £20,000 (cost-effectiveness threshold) even when fixed costs are as a high as approximately £14 million;
Cost estimates from Lewisham for running the scheme in subsequent years generate an ICER of around £4,000.
Annual cost to run scheme per person
The assumed annual cost of £XXXX per person to run universal scheme (for local government) is cost-effective;
This cost could be around £11.00 per person per year before crossing the £20,000 cost-effectiveness threshold, assuming that Lewisham’s fixed costs apply.
Annual cost to DH per new Healthy Start vitamin supplementation application
The cost per application can reach £ XXXX before the ICER is over a £20,000 per QALY threshold.
Cost per vitamin coupon issued
When the cost is £XXXX to issue each vitamin coupon the scheme is cost-effective;
If this cost was just over £XXXX then the intervention would no longer be cost-effective.
Price of vitamins
When the price of women’s and children’s vitamins increases, the ICER increases;
The price of children’s vitamins is more sensitive than the price of women’s vitamins.
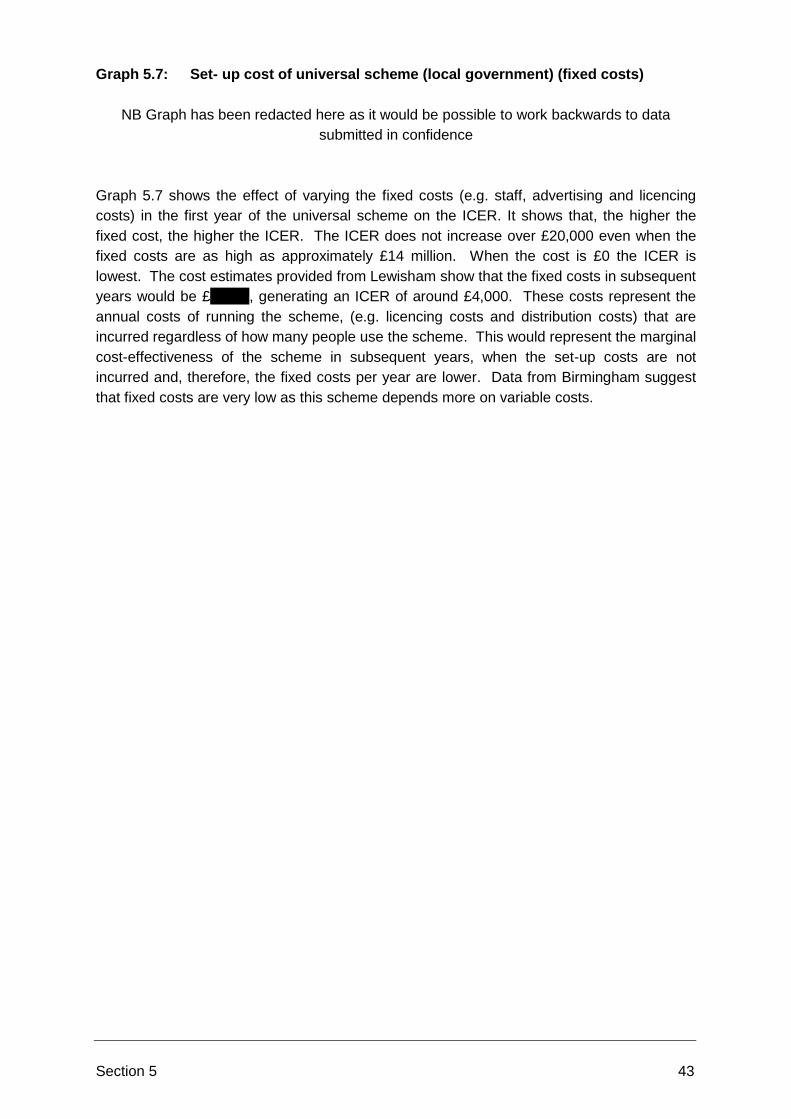
Section 5 43
Graph 5.7: Set- up cost of universal scheme (local government) (fixed costs)
NB Graph has been redacted here as it would be possible to work backwards to data
submitted in confidence
Graph 5.7 shows the effect of varying the fixed costs (e.g. staff, advertising and licencing
costs) in the first year of the universal scheme on the ICER. It shows that, the higher the
fixed cost, the higher the ICER. The ICER does not increase over £20,000 even when the
fixed costs are as high as approximately £14 million. When the cost is £0 the ICER is
lowest. The cost estimates provided from Lewisham show that the fixed costs in subsequent
years would be £XXXX, generating an ICER of around £4,000. These costs represent the
annual costs of running the scheme, (e.g. licencing costs and distribution costs) that are
incurred regardless of how many people use the scheme. This would represent the marginal
cost-effectiveness of the scheme in subsequent years, when the set-up costs are not
incurred and, therefore, the fixed costs per year are lower. Data from Birmingham suggest
that fixed costs are very low as this scheme depends more on variable costs.

Section 5 44
Graph 5.8: Annual cost to run the scheme per person (local government) (variable
costs) in the first year
NB Graph has been redacted here as it would be possible to work backwards to data
submitted in confidence
This graph shows how varying the cost of running the universal scheme (for local
government) per person affects the ICER. This is an important sensitivity analysis because,
due to a lack of data there is not an estimate of what the targeted scheme currently costs to
run per person for local government. A conservative approach has been taken, whereby it
has been assumed that this cost is £0 per person. Therefore, if indeed there is a cost per
person of running the current scheme, the incremental cost between the two schemes would
be reduced. Where the incremental cost per person per year reduces, the graph shows that
it becomes increasingly cost-effective to move the scheme to a universal offering.
Further, this input is very uncertain as it is an estimate of cost from only two local
government areas which provide very different values for variable costs per person in the
first year (£XXXX or £12.72). In subsequent years the cost per person is likely to be slightly
lower (£XXXX or £10.08). The cost could be around £11.00 per person per year before
crossing the £20,000 threshold, assuming that Lewisham’s fixed costs apply.

Section 5 45
Graph 5.9: Annual cost to DH per new Healthy Start vitamin supplementation
application
NB Graph has been redacted here as it would be possible to work backwards to data
submitted in confidence
Graph 5.9 shows that as the cost per new application to join the scheme is increased, the
ICER also increases. The cost per application would have to reach around £XXXX before
the ICER is over £20,000. This analysis assumes that application to the scheme is required.
In reality, a universal scheme may be run in a different manner.

Section 5 46
Graph 5.10: Cost per vitamin coupon issued (DH)
NB Graph has been redacted here as it would be possible to work backwards to data
submitted in confidence
Graph 5.10 shows that the results are sensitive to varying the cost per vitamin coupon
issued. The DH estimated that it would cost around £XXXX to send out each vitamin
coupon (when not issued with a food voucher in which case the cost is negligible); if this cost
was increased to just over £XXXX then the intervention would no longer be cost-effective.
As it is not clear how vitamins would be distributed in a universal scheme, it is possible that
coupons would no longer be issued, in which case there would be no cost for issuing
coupons. However, other unknown costs may be incurred instead.
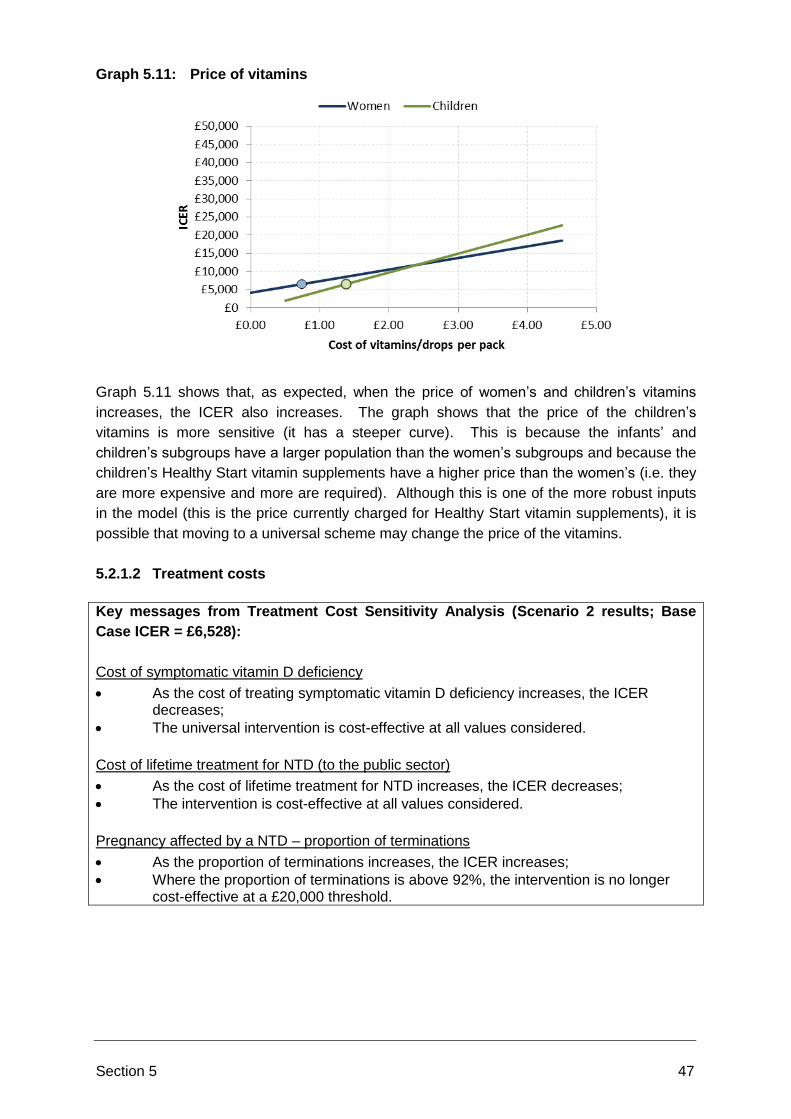
Section 5 47
Graph 5.11: Price of vitamins
Graph 5.11 shows that, as expected, when the price of women’s and children’s vitamins
increases, the ICER also increases. The graph shows that the price of the children’s
vitamins is more sensitive (it has a steeper curve). This is because the infants’ and
children’s subgroups have a larger population than the women’s subgroups and because the
children’s Healthy Start vitamin supplements have a higher price than the women’s (i.e. they
are more expensive and more are required). Although this is one of the more robust inputs
in the model (this is the price currently charged for Healthy Start vitamin supplements), it is
possible that moving to a universal scheme may change the price of the vitamins.
5.2.1.2 Treatment costs
Key messages from Treatment Cost Sensitivity Analysis (Scenario 2 results; Base
Case ICER = £6,528):
Cost of symptomatic vitamin D deficiency
As the cost of treating symptomatic vitamin D deficiency increases, the ICER decreases;
The universal intervention is cost-effective at all values considered.
Cost of lifetime treatment for NTD (to the public sector)
As the cost of lifetime treatment for NTD increases, the ICER decreases;
The intervention is cost-effective at all values considered.
Pregnancy affected by a NTD – proportion of terminations
As the proportion of terminations increases, the ICER increases;
Where the proportion of terminations is above 92%, the intervention is no longer cost-effective at a £20,000 threshold.
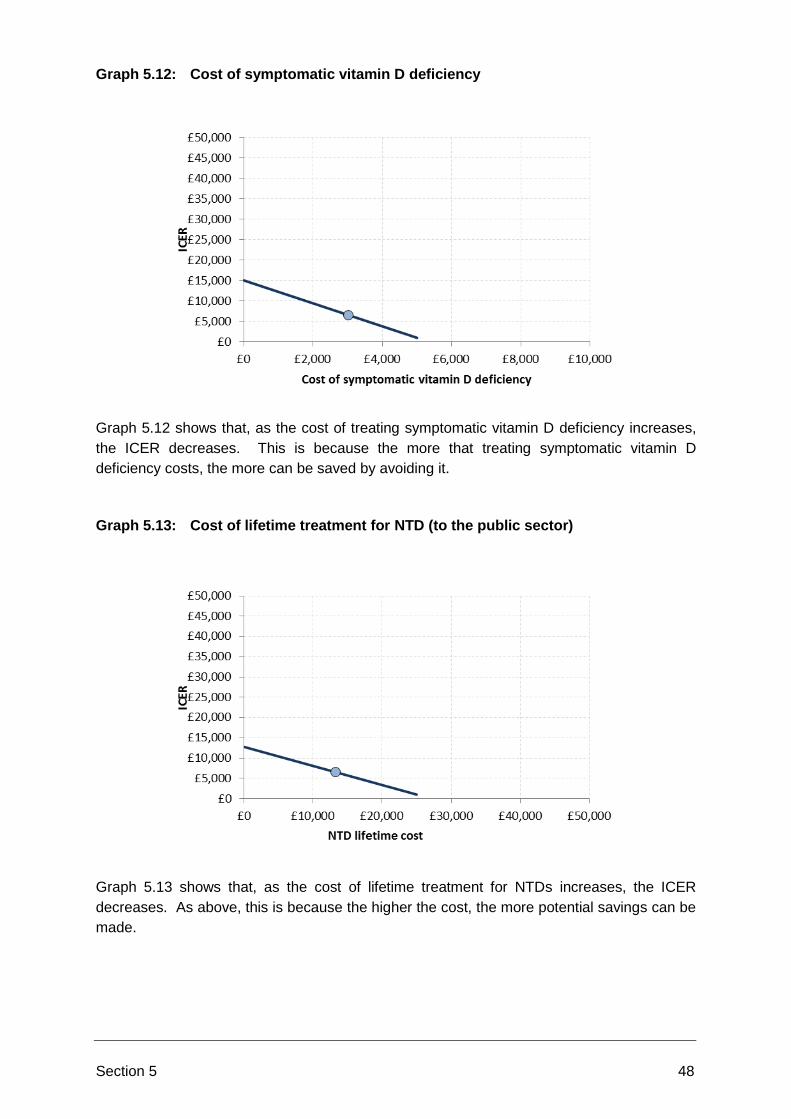
Section 5 48
Graph 5.12: Cost of symptomatic vitamin D deficiency
Graph 5.12 shows that, as the cost of treating symptomatic vitamin D deficiency increases,
the ICER decreases. This is because the more that treating symptomatic vitamin D
deficiency costs, the more can be saved by avoiding it.
Graph 5.13: Cost of lifetime treatment for NTD (to the public sector)
Graph 5.13 shows that, as the cost of lifetime treatment for NTDs increases, the ICER
decreases. As above, this is because the higher the cost, the more potential savings can be
made.

Section 5 49
Graph 5.14: Pregnancy affected by a NTD – number of terminations
Graph 5.14 shows how the ICER would change if the proportion of pregnancies affected by
a NTD that result in termination is varied. It shows that, as the proportion of terminations
increases, the ICER also increases. As the proportion of pregnancies affected by a NTD
resulting in termination is increased, the proportion of NTD births is decreased. This means
that the number of people incurring the average cost of treating someone with NTD over
their lifetime is reduced and there is less capacity to benefit. Where the proportion of
terminations is above 92%, the intervention is no longer cost-effective at a £20,000
threshold.

Section 5 50
5.3 SCENARIO ANALYSIS
5.3.1 NHS Perspective
Key messages of results from NHS perspective:
Scenario 1: The ICER is ‘dominant’ (lower or equal costs and increased effectiveness) from the NHS perspective;
Scenario 2: Extension on a universal basis to the current and extended subgroups generates a ‘dominant’ ICER from the NHS perspective.
Table 5.4: Results from NHS perspective – universal offer extended to current
subgroups (Scenario 1)
Summary table Targeted Universal Incremental
Cost of HS vitamins NA* NA* £0
Private purchase cost of vitamins £0 £0 £0
Cost of intervention (distribution) NA* NA* £0
Cost of intervention (set up) £0 £0 £0
Cost of treatment (NTDs, vitamin D deficiency) £30,758,128 £26,372,547 -£4,406,434
Total incremental cost -£4,406,434
QALYs lost (pregnancy affected by a NTD) 3,635 3,623 -13
Vitamin A 0 0 0
Vitamin C 0 0 0
Vitamin D deficiency 0 0 0
Total QALYs gained 13
ICER Dominant
* The incremental cost only was calculated.
Table 5.4 shows the model results from the NHS costs perspective when the offer is
extended on a universal basis to the current subgroups, only. This option has an extremely
high ICER from the public sector perspective but from the NHS perspective the ICER is
‘dominant’ (this means that there are lower (or equal) costs and increased effectiveness).
The reason for this being that local government and central government pay most if not all
the costs of the scheme, but the NHS benefits because its treatment costs fall with
supplementation.

Section 5 51
Table 5.5: Result from NHS perspective – universal offer extended to current
subgroups and all extended subgroups (Scenario 2)
Summary table Targeted Universal Incremental
Cost of HS vitamins NA* NA* £0
Private purchase cost of vitamins £0 £0 £0
Cost of intervention (distribution) NA* NA* £0
Cost of intervention (set up) £0 £0 £0
Cost of treatment (NTDs, vitamin D deficiency) £54,730,291 £43,695,433 -£11,065,538
Total incremental cost -£11,065,538
QALYs lost (pregnancy affected by a NTD) 6,870 6,120 -750
Vitamin A 0 0 0
Vitamin C 0 0 0
Vitamin D deficiency 0 0 0
Total QALYs gained 750
ICER Dominant
* The incremental cost only was calculated.
Table 5.5 shows that the ICER is also dominant when the scheme is extended to all the
current and extended subgroups on a universal basis. The reasons for this are explained
above. The cost savings are even higher when the scheme is rolled out to more people, as
the NHS does not incur the costs, while the more people that take supplements, the less
people will need NHS funded treatment.
It is not clear if there may be some small costs to the NHS. However, it is unlikely that these
costs would be as high as they are for the public sector (which includes costs to the DH and
local government).
5.3.2 Societal Perspective
Key message of results from Societal perspective:
Scenario 2: Extension on a universal basis to the current and extended subgroups generates a ‘dominant’ ICER from the societal perspective;
This assumes a 50% substitution coefficient. Interpreting this coefficient is difficult, a full description is provided in Appendix B.
Primary data collection was undertaken to identify inputs for the societal perspective, as
discussed in Section 3.1.2.
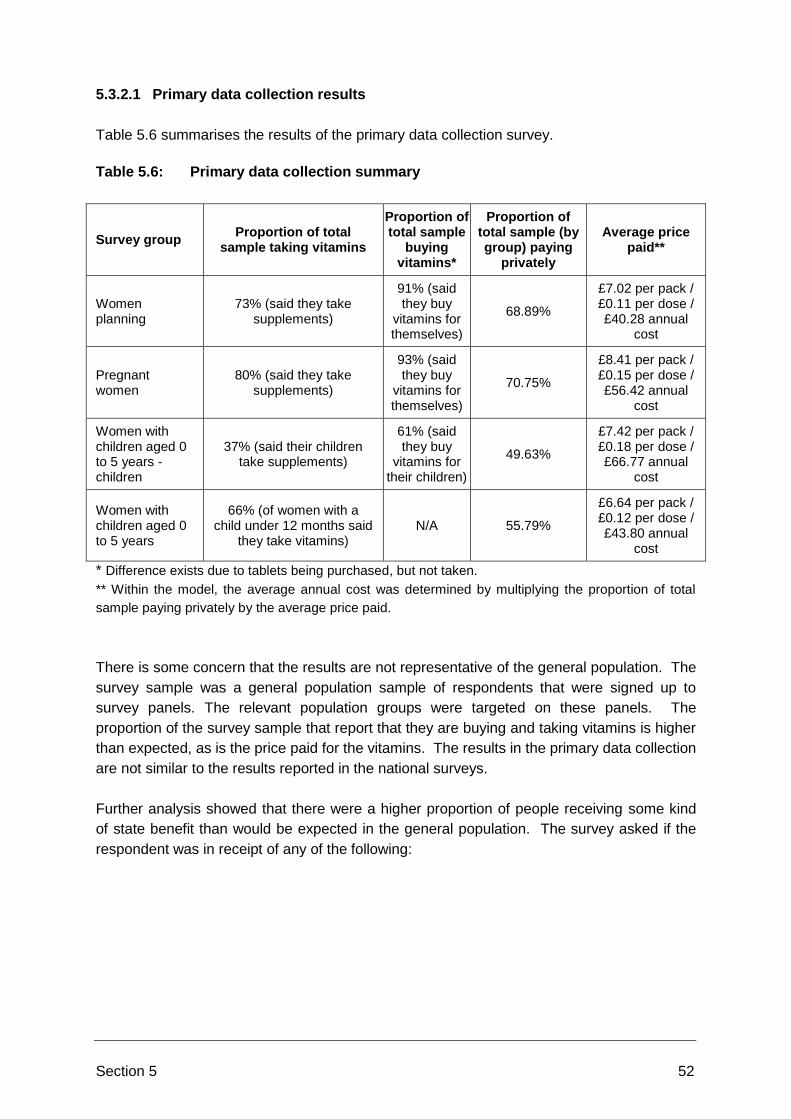
Section 5 52
5.3.2.1 Primary data collection results
Table 5.6 summarises the results of the primary data collection survey.
Table 5.6: Primary data collection summary
Survey group Proportion of total
sample taking vitamins
Proportion of total sample
buying vitamins*
Proportion of total sample (by group) paying
privately
Average price paid**
Women planning
73% (said they take supplements)
91% (said they buy
vitamins for themselves)
68.89%
£7.02 per pack / £0.11 per dose / £40.28 annual
cost
Pregnant women
80% (said they take supplements)
93% (said they buy
vitamins for themselves)
70.75%
£8.41 per pack / £0.15 per dose / £56.42 annual
cost
Women with children aged 0 to 5 years - children
37% (said their children take supplements)
61% (said they buy
vitamins for their children)
49.63%
£7.42 per pack / £0.18 per dose / £66.77 annual
cost
Women with children aged 0 to 5 years
66% (of women with a child under 12 months said
they take vitamins) N/A 55.79%
£6.64 per pack / £0.12 per dose / £43.80 annual
cost
* Difference exists due to tablets being purchased, but not taken.
** Within the model, the average annual cost was determined by multiplying the proportion of total
sample paying privately by the average price paid.
There is some concern that the results are not representative of the general population. The
survey sample was a general population sample of respondents that were signed up to
survey panels. The relevant population groups were targeted on these panels. The
proportion of the survey sample that report that they are buying and taking vitamins is higher
than expected, as is the price paid for the vitamins. The results in the primary data collection
are not similar to the results reported in the national surveys.
Further analysis showed that there were a higher proportion of people receiving some kind
of state benefit than would be expected in the general population. The survey asked if the
respondent was in receipt of any of the following:

Section 5 53
a) Income-based jobseeker’s allowance;
b) Income-related employment and support allowance;
c) Income support;
d) Working tax credits;
e) Working tax credit run-on;
f) Child tax credit and with an annual family income of over £16,190;
g) Child tax credit and with an annual family income of £16,190 or less;
h) Housing benefit;
i) Universal credit.
The number of people reporting that they were receiving benefits was as follows: 51.67% of
women planning a pregnancy; 45.58% of pregnant women and 70.37% of women with
children up to five years old. National data from the Department of Work and Pensions
reports (34) that there were 5.3 million working age benefit claimants in 2014 (which equates
to approximately 8.11% of the UK population). As previous surveys have shown, those in a
lower income bracket tend to be less likely to take vitamin supplements and be those most at
risk, making the findings of this survey counterintuitive.
5.3.2.2 Approach taken to societal perspective
Due to the survey sample being unrepresentative and due to the information gathered in the
survey not being consistent with the national surveys, there were some concerns about
applying the primary data collection data in the economic model (which uses national survey
uptake and effectiveness inputs).
The approach taken was to apply the cost that respondents reported paying, adjusted for the
proportion of the population that reported paying privately. Due to concerns about the uptake
data from the survey being unrepresentative, it was agreed with the ERG this would not be
used in the model. Instead data previously used in the model from the national surveys
were used. However, in the absence of any other data regarding the prices paid for
vitamins, data from the primary data collection survey were used. The analysis is limited by
the use of two data sources. Table 5.7 illustrates the results when applying the societal
perspective. However, the results of this table should be read as an illustrative example,
bearing in mind all of the uncertainties in the model and the limitations of the primary data
collection survey.
The results are reported with a 50% substitution coefficient as the results of the societal
perspective are dependent on the proportion of the population that substitute. Some of the
people that previously purchased the vitamins would receive the vitamins free in the
universal scenario.

Section 5 54
Table 5.7: Results from a societal perspective – universal offer extended to all
current subgroups plus all extended subgroups – 50% substitution
coefficient (Scenario 2)
Summary table Targeted Universal Incremental
Cost of HS vitamins NA* NA* £7,136,203
Private purchase cost of vitamins £188,520,435 £173,798,802 -£14,721,634
Cost of intervention (distribution) NA* NA* £6,148,818
Cost of intervention (set up) £0 £2,674,425 £2,674,425
Cost of treatment (NTDs, vitamin D deficiency)
£92,405,633 £83,445,366 -£8,931,513
Total incremental cost -£7,693,701
QALYs lost (pregnancy affected by a NTD)
6,870 6,599 -270
Vitamin A 0 0 0
Vitamin C 0 0 0
Vitamin D deficiency 0 0 0
Total QALYs gained 270
ICER Dominant
* The incremental cost only was calculated.
The table shows that when the societal perspective is taken, the ICER is dominant (extra
benefits for less, or equal, cost). The societal perspective will always improve the ICER as
the price paid for vitamins reported in the primary data collection survey is very much higher
than the cost of Healthy Start vitamin supplements. Applying the societal perspective means
that for those people who substitute, they will have the same health benefits for lower cost.
Further, the cost of a pregnancy affected by a NTD is higher in the societal perspective, as it
includes lost productivity to the caregiver and increased sick days to the person with spina
bifida, therefore, more savings can be made by avoiding pregnancies affected by a NTD
(26).
5.3.3 Discount Rate
Key Messages from the Scenario Analysis of Discount Rate:
As the discount rate decreases, the ICER decreases;
The ICER for Scenario 2 is lowered to £1,885 when the discount rate is lowered to 1.5%.
The model is run with a discount rate for costs and benefits of 3.5% per year. In the past,
economic models of public health interventions have often used a discount rate of 1.5%.
Table 5.8 below, shows the results when the model is run with a discount rate of 1.5% when
extending the universal offering to all current subgroups and extended subgroups from the
societal perspective.

Section 5 55
Table 5.8 shows that, as the discount rate is lowered the ICER is also lowered. In order to
allow easy comparability, the incremental column of the results table when the model is run
with a 3.5% discount rate is shown in the table. Compared to the results when run with a
discount rate of 3.5%, the ICER is much lower. This is due to the lifetime cost and benefits
of spina bifida being included in the model. Because these have a long time horizon,
discounting at a lower rate increases the present value of costs and benefits incurred further
into the future. The table shows that the differences in costs result from differences in the
treatment costs (which includes spina bifida) and in the QALYs lost from pregnancies
affected by a NTD.
Table 5.8: Results - discounting at 1.5% and 3.5% (Scenario 2)
Discounted at 1.5% Discounted at 3.5%
Summary table Targeted Universal Incremental Incremental
Cost of HS vitamins NA* NA* £7,136,203 £7,136,203
Private purchase cost of vitamins
£0 £0 £0 £0
Cost of intervention (distribution)
NA* NA* £6,148,818 £6,148,818
Cost of intervention (set up) £0 £2,674,425 £2,674,425 £2,674,425
Cost of treatment (NTDs, vitamin D deficiency)
£78,695,674 £65,021,001 -£13,674,672 -£11,065,538
Total incremental cost £2,284,773 £4,893,907
QALYs lost (pregnancy affected by a NTD)
11,284 10,053 -1,231 -750
Total QALYs gained 1,230 750
ICER £1,855 £6,528
* The incremental cost only was calculated.
5.3.4 Scenario Analysis of Adding QOL Benefits to Vitamin D
Key messages from the scenario analysis of Adding QOL Benefits to Vitamin D:
Applying a QALY loss for people that have symptomatic vitamin D deficiency reduces the ICER in scenario 1 and 2.
In scenario 1, when the QALY loss associated with symptomatic vitamin D deficiency is above approximately 0.27 then the ICER will be below £20,000.

Section 5 56
An exploratory sensitivity analysis to model the effects of assigning QOL benefits to vitamin
D has been carried out, in the absence of any data to indicate what the QALY loss might be.
The QOL is applied to those with symptomatic vitamin D deficiency, not the whole
population. The ERG felt that it was not plausible that there would be a significant impact on
QOL from vitamin A and C deficiency. Therefore, QOL benefits for vitamins A and C were
assumed to be zero in this analysis. A recent systematic review (35) with the aim of
reviewing the literature regarding QOL outcomes from vitamin D supplementation concluded
that most articles reviewed were of poor methodological quality and that vitamin D
supplementation was not associated with significant changes in QOL. However, vitamin D
supplementation may have a small to moderate effect on QOL when used on a short-term
basis in a diseased population. Although the review states that supplements do not provide a
significant improvement in quality of life, this is almost certainly because a huge proportion of
those people receiving supplements would not have symptomatic deficiency anyway. The
disutility applied in the model is specifically for those people that do have symptoms.
One-way sensitivity analyses have been carried out which illustrate the threshold at which
the QALY loss associated with symptomatic vitamin D deficiency would be to cross the cost-
effectiveness threshold.
Graph 5.15: QALY loss associated with symptomatic vitamin D deficiency –
Scenario 1
Graph 5.15 illustrates that, in scenario 1, when the QALY loss associated with symptomatic
vitamin D deficiency increases, the scheme is more likely to be cost-effective. If a QALY loss
of 0.1 is assumed, the scheme would still not be cost-effective, with an ICER of £50,513.
This threshold analysis shows that if the QALY loss associated with symptomatic vitamin D
deficiency is above approximately 0.27 then the ICER will be below the £20,000 threshold
shown on the graph.

Section 5 57
Graph 5.16: QALY loss associated with symptomatic vitamin D deficiency –
Scenario 2
Graph 5.16 shows that including QALY loss associated with symptomatic vitamin D
deficiency results in a lower ICER in scenario 2.
5.3.5 Consideration of Over Supplementation
The ERG members queried the possibility of unintended effects through over
supplementation but were aware this issue has been considered by the Committee on
Toxicology. Therefore, this was not modelled as part of this analysis. This issue is
considered further in the report to the CMO.
5.3.6 Prescription Charges
Key messages from Prescription Charges (Scenario 2):
From a public sector perspective when Healthy Start supplements are provided universally in the current and extended subgroups, including prescription charges improves cost-effectiveness. However, the ICER of £30,855 is still not cost-effective at a £20,000 threshold;
From a societal perspective when Healthy Start supplements are provided universally in the current and extended subgroups including prescription charges results in a ‘dominant’ ICER.
Prescription charges to the CCG and to the person paying for the prescription have been
included as a scenario analysis. This is not included in the base case model inputs as there
is too much uncertainty surrounding the inputs. The actual cost for a prescription charge in
Birmingham CCGs was obtained. A weighted average was calculated, resulting in a cost
per prescription to the CCG of £2.09. The cost to the person paying for a prescription is
£8.05. This cost was only applied to women planning pregnancy because pregnant women,
women 12 months post-partum and children are eligible for free prescriptions.

Section 5 58
There is little information available about the number of people that receive prescriptions for
vitamins currently. The IFS reports that between 15% and 30% of mothers that give vitamin
supplements to their babies aged 4 weeks to 10 months get vitamin supplements on
prescription, with the proportion decreasing as the infant’s age increases. However, this is
not enough information to populate the inputs for all subgroups. Further, there is no
information about how the proportion might change if the Healthy Start vitamin scheme
moved to a universal offering.
The approach taken to model this scenario used the number of people substituting vitamins
obtained on prescription or purchased privately for Healthy Start vitamin supplements. The
substitute coefficient was set at 50%. Then, a proportion of those substitutes are assumed
to have previously received a prescription, the rest of the substitutes are assumed to have
previously paid privately for vitamins. The proportion of substitutes that previously received
prescriptions was set at 22.5% for women and babies (the mid–point of the proportions given
in the IFS).
Results are reported below for all current and extended subgroups from the public sector
and societal perspectives.
Table 5.9: Results from public sector perspective (Scenario 2)
Summary table Targeted Universal Incremental
Cost of HS vitamins NA* NA* £7,136,203
Private purchase cost of vitamins £0 £0 £0
CCG cost of prescriptions NA* NA* -£166,735
Private cost of prescriptions NA* NA* £0
Cost of intervention (distribution) NA* NA* £6,148,818
Cost of intervention (set up) £0 £2,674,425 £2,674,425
Cost of treatment (NTDs, vitamin D deficiency) £54,786,787 £47,355,778 -£7,451,009
Total incremental cost £8,341,702
QALYs lost (pregnancy affected by a NTD) 6,870 6,599 -270
Vitamin A 0 0 0
Vitamin C 0 0 0
Vitamin D deficiency 0 0 0
Total QALYs gained 270
ICER £30,855
* The incremental cost only was calculated.
Including prescription charges in the public sector perspective, results in additional savings
to the CCG through not having to provide prescriptions, thereby making the intervention
more cost-effective. This accounts for people who now take Healthy Start vitamin
supplements who previously obtained their vitamins by prescription.
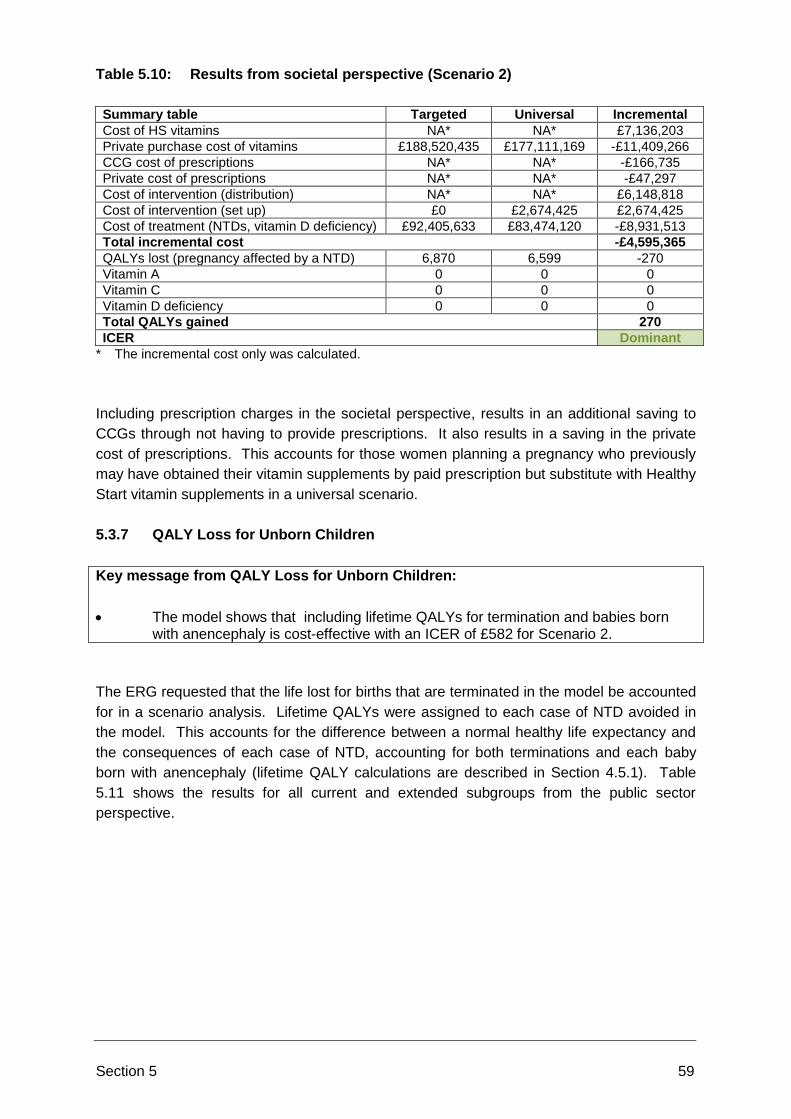
Section 5 59
Table 5.10: Results from societal perspective (Scenario 2)
Summary table Targeted Universal Incremental
Cost of HS vitamins NA* NA* £7,136,203
Private purchase cost of vitamins £188,520,435 £177,111,169 -£11,409,266
CCG cost of prescriptions NA* NA* -£166,735
Private cost of prescriptions NA* NA* -£47,297
Cost of intervention (distribution) NA* NA* £6,148,818
Cost of intervention (set up) £0 £2,674,425 £2,674,425
Cost of treatment (NTDs, vitamin D deficiency) £92,405,633 £83,474,120 -£8,931,513
Total incremental cost -£4,595,365
QALYs lost (pregnancy affected by a NTD) 6,870 6,599 -270
Vitamin A 0 0 0
Vitamin C 0 0 0
Vitamin D deficiency 0 0 0
Total QALYs gained 270
ICER Dominant
* The incremental cost only was calculated.
Including prescription charges in the societal perspective, results in an additional saving to
CCGs through not having to provide prescriptions. It also results in a saving in the private
cost of prescriptions. This accounts for those women planning a pregnancy who previously
may have obtained their vitamin supplements by paid prescription but substitute with Healthy
Start vitamin supplements in a universal scenario.
5.3.7 QALY Loss for Unborn Children
Key message from QALY Loss for Unborn Children:
The model shows that including lifetime QALYs for termination and babies born with anencephaly is cost-effective with an ICER of £582 for Scenario 2.
The ERG requested that the life lost for births that are terminated in the model be accounted
for in a scenario analysis. Lifetime QALYs were assigned to each case of NTD avoided in
the model. This accounts for the difference between a normal healthy life expectancy and
the consequences of each case of NTD, accounting for both terminations and each baby
born with anencephaly (lifetime QALY calculations are described in Section 4.5.1). Table
5.11 shows the results for all current and extended subgroups from the public sector
perspective.
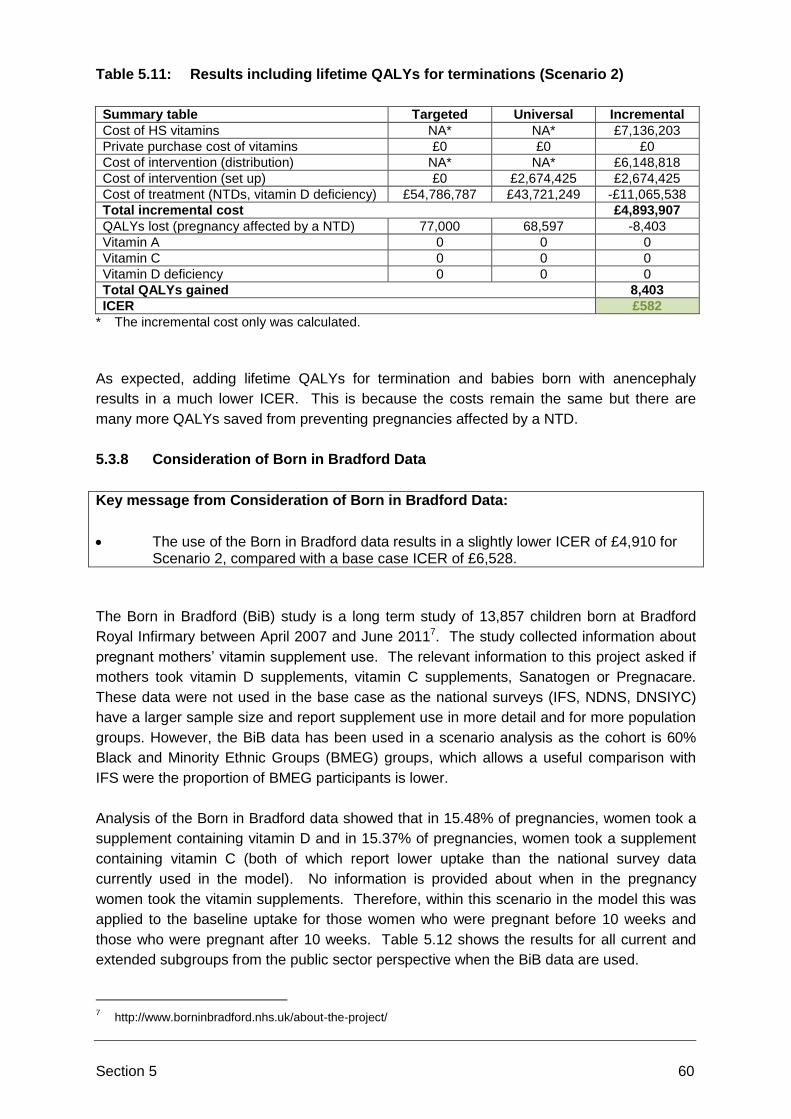
Section 5 60
Table 5.11: Results including lifetime QALYs for terminations (Scenario 2)
Summary table Targeted Universal Incremental
Cost of HS vitamins NA* NA* £7,136,203
Private purchase cost of vitamins £0 £0 £0
Cost of intervention (distribution) NA* NA* £6,148,818
Cost of intervention (set up) £0 £2,674,425 £2,674,425
Cost of treatment (NTDs, vitamin D deficiency) £54,786,787 £43,721,249 -£11,065,538
Total incremental cost £4,893,907
QALYs lost (pregnancy affected by a NTD) 77,000 68,597 -8,403
Vitamin A 0 0 0
Vitamin C 0 0 0
Vitamin D deficiency 0 0 0
Total QALYs gained 8,403
ICER £582
* The incremental cost only was calculated.
As expected, adding lifetime QALYs for termination and babies born with anencephaly
results in a much lower ICER. This is because the costs remain the same but there are
many more QALYs saved from preventing pregnancies affected by a NTD.
5.3.8 Consideration of Born in Bradford Data
Key message from Consideration of Born in Bradford Data:
The use of the Born in Bradford data results in a slightly lower ICER of £4,910 for Scenario 2, compared with a base case ICER of £6,528.
The Born in Bradford (BiB) study is a long term study of 13,857 children born at Bradford
Royal Infirmary between April 2007 and June 20117. The study collected information about
pregnant mothers’ vitamin supplement use. The relevant information to this project asked if
mothers took vitamin D supplements, vitamin C supplements, Sanatogen or Pregnacare.
These data were not used in the base case as the national surveys (IFS, NDNS, DNSIYC)
have a larger sample size and report supplement use in more detail and for more population
groups. However, the BiB data has been used in a scenario analysis as the cohort is 60%
Black and Minority Ethnic Groups (BMEG) groups, which allows a useful comparison with
IFS were the proportion of BMEG participants is lower.
Analysis of the Born in Bradford data showed that in 15.48% of pregnancies, women took a
supplement containing vitamin D and in 15.37% of pregnancies, women took a supplement
containing vitamin C (both of which report lower uptake than the national survey data
currently used in the model). No information is provided about when in the pregnancy
women took the vitamin supplements. Therefore, within this scenario in the model this was
applied to the baseline uptake for those women who were pregnant before 10 weeks and
those who were pregnant after 10 weeks. Table 5.12 shows the results for all current and
extended subgroups from the public sector perspective when the BiB data are used.
7 http://www.borninbradford.nhs.uk/about-the-project/

Section 5 61
Table 5.12: Results using BiB data (Scenario 2)
Summary table Targeted Universal Incremental
Cost of HS vitamins NA* NA* £7,136,203
Private purchase cost of vitamins £0 £0 £0
Cost of intervention (distribution) NA* NA* £6,148,818
Cost of intervention (set up) £0 £2,674,425 £2,674,425
Cost of treatment (NTDs, vitamin D deficiency) £56,837,488 £44,558,618 -£12,287,870
Total incremental cost £3,680,576
QALYs lost (pregnancy affected by a NTD) 6,870 6,120 -750
Vitamin A 0 0 0
Vitamin C 0 0 0
Vitamin D deficiency 0 0 0
Total QALYs gained 750
ICER £4,910
* The incremental cost only was calculated.
The results table shows that the ICER is slightly lower than when the base case values are
used. The reason that the ICER is lower is that there are more costs saved from treating
vitamin D deficiency. The costs saved from preventing pregnancies affected by a NTD does
not change from the base case, as the incremental number of people taking vitamin
supplements remains the same. However, the vitamin D costs do change because, as
explained in Section 4.3.4, the vitamin D effectiveness inputs use the levels of uptake to
calculate the number of people with vitamin D deficiency. As an exponential function is
applied, if the baseline uptake is lower there will be more of a reduction in symptomatic
vitamin D deficiency. This is because the curve is steeper at first meaning that more benefit
is gained for the first people to take supplements.
5.3.9 Scenario analysis of Bestwick et al. (2014) (18) folic acid uptake data
Key message from Scenario Analysis – Bestwick et al. (Scenario 2):
Using data from Bestwick et al. to populate the baseline uptake of folic acid supplements in women planning a pregnancy has a minimal impact on the ICER.
Bestwick et al. (18) report the uptake of folic acid for women. This was based on a survey of
466,860 women planning a pregnancy who had attended an antenatal screening clinic in
London between 1999 and 2012.
The paper reports that in 2011-12, 28% (adjusted figure8) of women planning pregnancy
took folic acid supplements. The IFS reported that 37% of mothers said that they took folic
acid supplements when they were planning a pregnancy (this is the number used in the base
case). The Bestwick paper is based on a larger sample than the IFS and is based on a
sample of pregnant women, rather than new mothers. However, it is not a nationally
representative sample.
8 Adjusted for maternal age, maternal weight, ethnicity, previous pregnancy affected by a NTD,
previous Down’s syndrome pregnancy, IVF, diabetes, smoking, Down’s syndrome screening test and region of England.

Section 5 62
As reported in the base case results for scenario 2 (Section 5.1.3) the ICER is £6,528.
Results are not reported in this scenario analysis for scenario 1 as this scenario does not
include the subgroup of women planning pregnancy. The impact of using the Bestwick et al.
data is minimal, resulting in a slightly lower ICER of £6,401.
5.3.10 Source of uptake – New users versus substitution
Key message from Source of Uptake – New Users Versus Substitution (Scenario 2):
Interpretation of the substitution coefficient is difficult as the relationship is non-linear. Appendix B provides a full description of the coefficient;
Where the substitution coefficient is 100%, all additional Healthy Start uptake is from substitutes as far as possible. The ICER is infinite (extra cost with no additional health benefits);
Where the substitution coefficient is 50%, uptake is split proportionally between substitutes and new uptakes. The ICER is £31,472 and is not cost-effective in a £20,000 threshold;
The overall results are highly sensitive to variations in the substitution coefficient.
As described in Section 4.2.2 the model includes a substitution coefficient that can be used
to calculate different uptake scenarios. As explained in Section 4.2.2, the substitution
coefficient determines the breakdown of the increase in Healthy Start vitamin supplements
between the proportion that are new ‘uptakers’ (they did not take any supplements before)
and the proportion that are substituting (they previously paid for their supplements but now
they get them free).
The results reported in the base case include a substitution coefficient of 0% which assumes
that all additional Healthy Start uptake is from people who were not previously taking vitamin
supplements. When the substitution coefficient is 100%, this means that all additional
Healthy Start uptake is from substitutes (except when the baseline uptake is too low). When
the substitution coefficient is 50% it assumes that Healthy Start vitamin supplements uptake
is proportionally split between new uptake and substitutes. More detail is given in Section
4.2.2 or the technical appendix (Appendix B).
The following sections report the results when Healthy Start vitamin supplements are offered
universally to the current and extended subgroups when the substitution coefficient is 100%
and 50% from the public sector perspective (a substitution coefficient of 0% is used in the
base case results reported above).

Section 5 63
5.3.11 Substitution Coefficient 100% - Maximum Substitution, All Healthy Start
Uptake is from Substitutes
When the substitution coefficient is 100% this means that the entire additional Healthy Start
uptake comes from those already taking supplements (for which they have privately paid for
or got on prescription). In this scenario, Healthy Start vitamin supplement uptake is from
people substituting the vitamins they previously took with Healthy Start vitamin supplements,
with no additional uptake of vitamins overall. However, if the uptake of Healthy Start vitamin
supplements is higher than the baseline uptake, then some additional uptake will be added
on as it cannot all come from substitutes. Table 5.13 shows the results when the
substitution coefficient is 100%
Table 5.13: Results when substitution coefficient 100% (Scenario 2)
Summary table Targeted Universal Incremental
Cost of HS vitamins NA* NA* £7,136,203
Private purchase cost of vitamins £0 £0 £0
Cost of intervention (distribution) NA* NA* £6,148,818
Cost of intervention (set up) £0 £2,674,425 £2,674,425
Cost of treatment (NTDs, vitamin D deficiency) £56,786,787 £51,692,046 -£3,094,741
Total incremental cost £12,864,705
QALYs lost (pregnancy affected by a NTD) 6,870 6,870 0
Vitamin A 0 0 0
Vitamin C 0 0 0
Vitamin D deficiency 0 0 0
Total QALYs gained 0
ICER Infinite**
* The incremental cost only was calculated; ** There is an incremental cost for no additional benefit.
The results table shows that there is equal efficacy because all uptake is substituted. So
although more Healthy Start vitamin supplements are taken, there are no extra health
benefits because these people were already taking vitamin supplements.

Section 5 64
5.3.12 Substitution Coefficient 50% - Healthy Start Uptake is Split Proportionally
between New Uptake and Substitutes
The substitution coefficient in this scenario is 50%. In this scenario it is assumed that the
Healthy Start uptake is split proportionally between new uptake and substituted uptake. The
proportion depends on the baseline uptake.
Table 5.14: Results when substitution coefficient is 50% (Scenario 2)
Summary table Targeted Universal Incremental
Cost of HS vitamins NA* NA* £7,136,203
Private purchase cost of vitamins £0 £0 £0
Cost of intervention (distribution) NA* NA* £6,148,818
Cost of intervention (set up) £0 £2,674,425 £2,674,425
Cost of treatment (NTDs, vitamin D deficiency) £56,786,787 £47,335,778 -£7,451,009
Total incremental cost £8,508,437
QALYs lost (pregnancy affected by a NTD) 6,870 6,599 -270
Vitamin A 0 0 0
Vitamin C 0 0 0
Vitamin D deficiency 0 0 0
Total QALYs gained 270
ICER £31,472
* The incremental cost only was calculated.
The results table shows that when the substitution coefficient is 50%, there are still not
enough new people taking vitamins for the intervention to be cost-effective.
5.3.13 Substitution Coefficient Sensitivity Analysis
The scenarios above show that when the substitution coefficient is 100% and 50% moving
the Healthy Start scheme to a universal scheme for all the current subgroups and extended
subgroups is not cost-effective. Univariate sensitivity analysis was carried out in order to
test how sensitive the substitution coefficient is to the cost-effectiveness.

Section 5 65
Graph 5.17: Sensitivity analysis of substitution coefficient (Scenario 2)
Graph 5.17 shows that the results are very sensitive to the substitution coefficient. Moving
Healthy Start to a universal scenario is only cost-effective when the coefficient is below
around 40%. When the coefficient is below 40% this suggests that the majority of the
Healthy Start uptake must come from new uptake, rather than substitutes. Interpretation of
the coefficient is very difficult given that the uptake relationship is not always linear (this is
fully described in technical Appendix B).
Table 5.15 shows what an uptake coefficient of 40% translates to in terms of the additional
uptake for each subgroup. This table is based on the base case inputs in the model and the
reader should note that the baseline uptake is different for each vitamin and subgroup,
meaning that the coefficient has a different impact for each vitamin and subgroup.
Table 5.15: Increase in uptake for a substitution coefficient of 40%
Folic acid Vitamin A Vitamin C Vitamin D
Pregnant women after 10 weeks 16.32% NA 13.76% 13.24%
Women with a child up to 12 months 14.11% NA 14.11% 14.11%
Infants and children over 6 months and under 4 years
NA 15.9% 15.9% 15.9%
Women planning a pregnancy 14.1% NA 16.3% 16.3%
Pregnant women before 10 weeks 7.4% NA 13.8% 13.2%
Infants aged 0 to 6 months NA 15.9% 15.9% 15.9%
Infants and children over 4 years and under 5 years
NA 15.4% 15.4% 15.5%

Section 5 66
5.4 TWO-WAY SENSITIVITY ANALYSIS
Key messages from Two-Way Sensitivity Analysis of Healthy Start Uptake and
Substitution Coefficient (Scenario 2):
Women: the ICER is highly sensitive to both the substitution coefficient and uptake of Healthy Start vitamin supplements;
Children: the ICER is sensitive to uptake. As uptake increases, the ICER increases. This is because the higher the uptake is for children, the higher the costs of supplementation are, without any benefits to QOL.
Two-way sensitivity analysis allows for two input parameters to be varied at one time.
Table 5.16 and 5.17 show the model results when the Healthy Start substitution coefficient is
varied between 0% (all Healthy Start uptake is from new uptakers) and 100% (all Healthy
Start uptake is from substitutes). The second parameter that is varied is the change in
Healthy Start uptake. The ERG requested that the model reports the minimum uptake
required in order for the results to be cost-effective. As the report has set out, there is a lot
of uncertainty in the model and the results presented depend on these uncertain input
parameters. However, the model results are extremely sensitive to varying the substitution
coefficient. Each table shows ICERs over £30,000 in red (unlikely to be considered cost-
effective), ICERs between £20,000 and £30,000 in orange (may be considered cost-
effective) and those under £20,000 in green (likely to be considered cost-effective).

Section 5 67
Table 5.16: Healthy Start uptake and substitution coefficient – Women
Table 5.16 shows that, with a 0% substitution coefficient (maximum new uptakers), the ICER falls, the greater the increase in Healthy Start
uptake. This is true up to 40% Healthy Start uptake, at which point the ICER starts to increase. The reason that the ICER starts to increase as
the change in Healthy Start uptake increases is that at a higher Healthy Start uptake there is no longer any capacity to benefit in some cases.
For example, the uptake of folic acid in pregnant women before 10 weeks is already 79%, so an increase in Healthy Start uptake of 60% (when
the substitution coefficient is 0%, meaning all Healthy Start uptake is new uptake) only allows for 21% of that uptake to be new uptake, all other
uptake must be from substitutes to avoid having more than 100% uptake. Another example is the vitamin D uptake in pregnant women (before
and after 10 weeks); this baseline uptake is 42.3%, so an increase of 50% Healthy Start uptake (with a substitution coefficient of 0%) still has
capacity to benefit. However, when the uptake reaches 60%, some of these supplement takers must be substitutes to avoid the uptake
increasing over 100%.
The table also shows that, the lower the substitution coefficient (i.e. the more new uptakers there are), the more cost-effective the intervention.
This applies up to 90% Healthy Start uptake, at which point the ICER stays the same because there is no more capacity to benefit. A decrease
in the substitution coefficient cannot have a negative effect on the cost-effectiveness, it can only decrease the ICER, or the ICER stays the same.
0% 10% 20% 30% 40% 50% 60% 70% 80% 90% 100%
0% Equal efficacy £15,717 £6,528 £5,969 £5,953 £5,998 £6,073 £7,034 £8,374 £9,718 £11,062
10% Equal efficacy £19,068 £8,487 £6,445 £6,483 £6,572 £6,679 £7,037 £8,374 £9,718 £11,062
20% Equal efficacy £23,576 £11,126 £7,143 £7,064 £7,205 £7,357 £7,505 £8,376 £9,718 £11,062
30% Equal efficacy £29,960 £14,869 £10,019 £7,703 £7,908 £8,113 £8,308 £8,492 £9,718 £11,062
40% Equal efficacy £39,694 £20,582 £14,412 £11,436 £9,713 £8,962 £9,215 £9,448 £9,720 £11,062
50% Equal efficacy £56,343 £30,364 £21,939 £17,858 £15,487 £13,956 £12,893 £12,116 £11,526 £11,062
60% Equal efficacy £72,824 £40,160 £29,439 £23,635 £19,425 £16,884 £15,204 £13,919 £12,260 £11,062
70% Equal efficacy £100,359 £56,591 £42,039 £32,887 £25,056 £20,789 £18,144 £16,111 £13,057 £11,062
80% Equal efficacy £155,535 £89,630 £67,420 £49,978 £33,746 £26,247 £22,005 £18,835 £13,926 £11,062
90% Equal efficacy £321,287 £189,147 £143,981 £91,707 £48,853 £34,405 £27,300 £22,308 £14,877 £11,062
100% Equal efficacyEqual efficacyEqual efficacyEqual efficacy £341,160 £81,432 £47,895 £35,004 £26,889 £15,920 £11,062
Change in HS uptake - womenS
ub
sti
tute
co
eff
icie
nt

Section 5 68
The ERG requested that an estimate of how much the uptake needs to increase by and how many of these need to be new users was made.
Table 5.16 above demonstrates that the uptake and the number that are new users have a large impact on the cost-effectiveness. It is also
important to note that this two-way sensitivity analysis is dependent on many other uncertain parameters in the model.
Table 5.17: Healthy Start uptake and substitution coefficient – Infants and children
Table 5.17 shows the effect of varying the change in Healthy Start uptake and the substitution coefficient in the subgroups with infants and
children. Similarly to Table 5.16, a decrease in the substitution coefficient (that is an increase in the number of new uptakers) either decreases
the ICER, or it remains the same. Table 5.17 shows that, as the Healthy Start uptake in children increases, moving the Healthy Start scheme to
universal provision is less likely to be cost-effective. The reason for this is that the subgroups with infants and children do not receive any QALY
gain from supplementation in the model, as folic acid is the only vitamin to which a QOL benefit could be assigned. So in the model, the higher
the uptake is for children, the higher the costs of supplementation are, without any benefits to QOL.
0% 10% 20% 30% 40% 50% 60% 70% 80% 90% 100%
0% £556 £3,454 £8,040 £13,703 £20,056 £26,849 £33,923 £41,177 £48,546 £55,990 £63,545
10% £556 £3,517 £8,120 £13,780 £20,122 £26,902 £33,964 £41,208 £48,568 £56,005 £63,545
20% £556 £3,580 £8,201 £13,859 £20,190 £26,957 £34,006 £41,240 £48,592 £56,022 £63,545
30% £556 £3,643 £8,284 £13,940 £20,260 £27,014 £34,051 £41,274 £48,617 £56,040 £63,545
40% £556 £3,707 £8,368 £14,022 £20,332 £27,073 £34,098 £41,309 £48,644 £56,060 £63,545
50% £556 £3,771 £8,453 £14,107 £20,407 £27,135 £34,147 £41,347 £48,673 £56,081 £63,545
60% £556 £4,358 £8,807 £14,312 £20,523 £27,199 £34,181 £41,364 £48,680 £56,084 £63,545
70% £556 £4,986 £9,184 £14,528 £20,645 £27,265 £34,216 £41,381 £48,688 £56,086 £63,545
80% £556 £5,657 £9,584 £14,757 £20,772 £27,335 £34,252 £41,399 £48,695 £56,089 £63,545
90% £556 £6,375 £10,010 £14,998 £20,906 £27,407 £34,289 £41,417 £48,703 £56,091 £63,545
100% £556 £7,142 £10,464 £15,252 £21,046 £27,481 £34,327 £41,435 £48,711 £56,094 £63,545
Su
bsti
tute
co
eff
icie
nt
Change in HS uptake - children

Section 5 69
5.5 THREE-WAY SENSITIVITY ANALYSIS
Key messages from Three-Way Sensitivity Analysis (Scenario 2):
Three-way analyses were undertaken around the three key drivers of the analysis – substitution coefficient, QALY loss associated with vitamin D and proportion of pregnancies affected by a NTD resulting in termination;
The model results are highly sensitive to these three parameters. Threshold values for cost-effectiveness are provided in Table 5.18.
There are many uncertainties in the economic model and this has been addressed with
sensitivity and scenario analyses. Due to the number of sensitivity analyses that it is
necessary to carry out, three of the most important drivers of the model have been selected
and presented in a three-way sensitivity analysis. This three-way sensitivity analysis
provides a diagram summarising the effect of three key drivers in the model. The sensitivity
analysis was run with all current and extended subgroups included and all the base case
values described earlier in the report from the public sector perspective.
The three parameters that have been varied in the three-way sensitivity analysis are:
The substitution coefficient (whether Healthy Start vitamin supplement takers are
newly taking vitamins, or were taking privately purchased vitamins previously);
The QALY loss associated with vitamin D;
The proportion of pregnancies affected by a NTD that result in a termination.
The substitution coefficient is varied between 0% and 100% in each graph (base case value:
0%). This is shown by the blue line on each graph. The QALY loss for vitamin D is varied
between no QALY loss and 0.2 QALY loss for symptomatic vitamin D deficiency (base case
value: QALY loss not included). Threshold analysis of the QALY loss for symptomatic
vitamin D is in Section 5.3.4. The QALY loss can be read along the graphs from left to right.
The proportion of pregnancies affected by a NTD that result in a termination was varied from
80% to 100% (base case value 80%. When the number of terminations increases, an
adjustment is automatically made to reduce the number of spina bifida births. The
proportion of pregnancies affected by a NTD that result in termination can be read from top
to bottom in Diagram 5.1.

Section 5 70
Diagram 5.1: Three-way sensitivity analysis
80%
90%
100%
QALY loss if sympt. vitamin
D deficiency
QALY loss if sympt. vitamin
D deficiency
Proportion of NTD
pregnancies that result in
termination
Proportion of NTD
pregnancies that result in
termination
Proportion of NTD
pregnancies that result in
termination
QALY loss if sympt. vitamin
D deficiency
Vitamin D
0
Vitamin D
0.1
Vitamin D
0.2
£0
£20,000
£40,000
£60,000
£80,000
£100,000
0% 20% 40% 60% 80% 100%
ICER
Substitute coefficient
£0
£20,000
£40,000
£60,000
£80,000
£100,000
0% 20% 40% 60% 80% 100%
ICER
Substitute coefficient
£0
£20,000
£40,000
£60,000
£80,000
£100,000
0% 20% 40% 60% 80% 100%
ICER
Substitute coefficient
£0
£20,000
£40,000
£60,000
£80,000
£100,000
0% 20% 40% 60% 80% 100%IC
ER
Substitute coefficient
£0
£20,000
£40,000
£60,000
£80,000
£100,000
0% 20% 40% 60% 80% 100%
ICER
Substitute coefficient
£0
£20,000
£40,000
£60,000
£80,000
£100,000
0% 20% 40% 60% 80% 100%
ICER
Substitute coefficient
£0
£20,000
£40,000
£60,000
£80,000
£100,000
0% 20% 40% 60% 80% 100%
ICER
Substitute coefficient
£0
£20,000
£40,000
£60,000
£80,000
£100,000
0% 20% 40% 60% 80% 100%
ICER
Substitute coefficient
£0
£20,000
£40,000
£60,000
£80,000
£100,000
0% 20% 40% 60% 80% 100%
ICER
Substitute coefficient

Section 5 71
Diagram 5.1 illustrates the effects that varying the three parameters has on the ICER. Table
5.18 shows the (approximate) highest substitution coefficient for which the intervention is
likely to be cost-effective in each scenario. The diagram shows that the greater the QALY
loss is for symptomatic vitamin D deficiency, the lower the ICER is. It also shows that the
higher the proportion of pregnancies affected by a NTD that result in termination, the higher
the ICER will be. In the bottom left-hand graph, even when the substitution coefficient is 0%
(that is, all incremental Healthy Start uptake comes from new uptakers), moving to a
universal scheme is unlikely to be cost-effective. This graph does not display a line because
the y-axis is set at £100,000. In this scenario, the ICER is always above £100,000. In the
top right-hand graph, moving to a universal scheme is likely to be cost-effective even if the
substitute coefficient is as high as around 95%. This diagram shows that the effect of
varying the proportion of terminations and the substitution coefficient has less of an influence
in the scenario where QALY loss is assigned to symptomatic vitamin D deficiency. This is
because when the QALYs for vitamins other than folic acid are included, the number of
terminations (which is affected by the folic acid intake) and the substitution coefficient have
less weight in the model. A paucity of data means QALY losses were not assigned to
vitamin D deficiency, except in an exploratory analysis in Section 5.3.4.
Table 5.18: Highest substitution coefficient to remain cost-effective
QALY loss if below LRNI or if vitamin D deficient
Proportion of pregnancies
affected by a NTD that result in termination
Vitamin D 0
Vitamin D 0.1
Vitamin D 0.2
80% 40% 55% 70%
90% 10% 30% 60%
100% NA NA NA

Section 6 72
Section 6: Discussion
The results of the model estimate that if the Healthy Start scheme were to be implemented
universally compared to current provision it would be cost-effective if it was extended to any
combination of current or additional subgroups as long as that combination includes ‘women
planning a pregnancy and before 10 weeks pregnant’. Therefore, it is estimated that it is not
cost-effective in scenario 1 and it would be cost-effective in scenario 2 where ‘women
planning a pregnancy and before 10 weeks pregnant’ are included. There is a lot of
uncertainty in the economic model. Many of the model inputs are uncertain due to a lack of
data and a lack of information on how a universal scheme would be implemented.
Therefore, arbitrary data have been used for some inputs as described previously. These
results are particularly limited in that the distribution route of the scheme for women planning
a pregnancy and those less than 10 weeks pregnant is unknown. It has been assumed
within the model that Healthy Start vitamin supplements are delivered to these women in the
same way as the current scheme with no additional costs incurred. Should reaching these
women incur costs above and beyond those of the current subgroups, the universal scheme
will be less cost-effective.
The results of the model estimate that it is not cost-effective to extend the scheme
universally within the current subgroups (all pregnant women from 10 weeks; women with a
child under 12 months; and children over 6 months and under 4 years) (scenario 1). These
results are driven by the lack of QALY loss averted by the scheme. Providing folic acid to
women who are at least 10 weeks pregnant is too late to reduce pregnancies affected by a
NTD successfully. It is important to note that the model only assigns a QALY change due to
supplementation of women via the proportion of pregnancies affected by a NTD. This is also
dependent on their termination rate. QALYs are not assigned to any health benefits from
supplementation with vitamins A, C or D. This does not mean that there are no QOL
benefits, only that the data are not available to describe the health benefits in a quantitative
fashion.
Three key drivers of the model results have been identified. Firstly, the number of
pregnancies affected by a NTD that result in termination. When the number of terminations
decreases, the number of spina bifida births increases, making the cost per pregnancy
affected by a NTD higher. Therefore, the higher the proportion of terminations, the less cost-
effective the scheme becomes. Secondly, a key driver is whether a QALY loss can be
assumed and assigned to those with symptomatic vitamin D deficiency. The higher the
QALY loss assumed per person, the more cost-effective the scheme becomes. Thirdly, the
substitution coefficient. This accounts for the number of people that take Healthy Start
vitamin supplements in place of vitamins they previously purchased privately. The higher
the substitution coefficient, the less likely the scheme is to be cost-effective because more
people are substituting (extra cost to the public sector for no extra benefit). Finally, these
three uncertainties (and all the other uncertainties in the model) interact. It is not possible to
show every permutation of the results. However, the sensitivity analyses do show that if it is

Section 6 73
reasonable to assume there is an impact on QALYs for vitamin D, the effect of varying the
substitution coefficient and the proportion of pregnancies affected by a NTD that result in a
termination becomes much less pronounced. A threshold analysis was carried out to
examine the effect of adding QALY loss to symptomatic vitamin D deficiency alone (without
any QALY loss assigned to vitamins A and C). In scenario 1, with the base case inputs, this
analysis estimated that the QALY loss would need to be over approximately 0.27 per case of
symptomatic vitamin D deficiency to make the scheme cost-effective at a £20,000 threshold.
The model report includes many sensitivity and scenario analyses to account for the
uncertainty in the model, the most important of which have been discussed above. Based on
the model results it is not possible to say with certainty if moving the Healthy Start scheme
from a targeted scheme to universal provision would be cost-effective. However, the model
results suggest that moving to a universal scheme could be cost-effective for some subgroup
combinations, specifically, for women planning a pregnancy and less than 10 weeks
pregnant.
R:\Projects\AF\AF100 - NICE Healthy Start\Reports\Model\Model report\YHEC Final report - March 2015.docx
AF/CH//30.03.15

References 74
References
1. Committee on Medical Aspects of F, Nutrition P, Panel on C, Maternal Nutrition of the Committee on Medical Aspects of F, Nutrition P. Scientific review of the Welfare Food Scheme. Reports on health and social subjects. 2002(51):i-xxi, 1-147. 2. Jessimen T, Cameron A, Wiggins M. A qualitative study of uptake of free vitamins in England. Archives of disease in childhood. 2013;98(8):587–91. 3. Moonan M, Hanratty B, Whitehead M. Which is more effective, a universal or targeted approach, to implementing the National Healthy Start Programme? A mixed methods study. Journal of Epidemiology and Community Health. 2012;66:A44-5. 4. NICE. Vitamin D: increasing supplement use among at-risk groups. 2014. Available from: https://www.nice.org.uk/guidance/ph56 5. Moy RJ, McGee E, Debelle GD, Mather I, Shaw NJ. Successful public health action to reduce the incidence of symptomatic vitamin D deficiency. Archives of disease in childhood. 2012;97(11):952-4. DOI: 10.1136/archdischild-2012-302287. 6. Zipitis CS, Markides GA, Swann IL. Vitamin D deficiency: prevention or treatment? Archives of disease in childhood. 2006;91(12):1011-4. DOI: 10.1136/adc.2006.098467. 7. Healthy Start: For health professionals. Available from: http://www.healthystart.nhs.uk/for-health-professionals/ 8. Bates B, Lennox A, Prentice A, (Eds) ea. National diet and nutrition survey Results from years 1, 2, 3 and 4 (combined) of the rolling programme (2008/9 and 2011/2012). . Department of Health and the Food Standards Agency; 2014. Available from: National Diet and Nutrition Survey: results from Years 1 to 4 (combined) of the rolling programme for 2008 and 2009 to 2011 and 2012 - Publications - GOV.UK 9. McAndrew F TJ, Fellows L, Large A, Speed M, Renfrew MJ. Infant Feeding Survey 2010. NHS Information Centre for Health and Social Care; 2012. Available from: http://www.hscic.gov.uk/catalogue/PUB08694/Infant-Feeding-Survey-2010-Consolidated-Report.pdf 10. Lennox A, Sommerville J, Ong K, Henderson H, R. A. Diet and Nutrition Survey of Infants and Young Children. 2011. Available from: https://www.gov.uk/government/uploads/system/uploads/attachment_data/file/139572/DNSIYC_UK_report_ALL_chapters_DH_V10.0.pdf 11. Nelson M, Erens B, Bates B, Church S, Boshier T. Low income diet and nutrition survey: Volume 2: Food consumption: Nurtrient intake. The Stationary Office 2007. Available from: http://tna.europarchive.org/20110116113217/http://www.food.gov.uk/multimedia/pdfs/lidnsvol02 12. ONS. Births in England and Wales by Characteristics of Birth 2, 2012. 2013. Available from: http://www.ons.gov.uk/ons/rel/vsob1/characteristics-of-birth-2--england-and-wales/2012/sb-characteristics-of-birth-2.html. 13. Chandra A, Martinez GM, Mosher WD, Abma JC, Jones J. Fertility, family planning, and reproductive health of U.S. women: data from the 2002 National Survey of Family Growth. Vital and health statistics. Series 23, Data from the National Survey of Family Growth. 2005(25):1-160. 14. ONS. Population Estimates for UK, England and Wales, Scotland and Northern Ireland, Mid-2013. 2014. Available from: http://www.ons.gov.uk/ons/rel/pop-estimate/population-estimates-for-uk--england-and-wales--scotland-and-northern-ireland/2013/index.html. 15. Wellings K, Jones KG, Mercer CH, Tanton C, Clifton S, Datta J, et al. The prevalence of unplanned pregnancy and associated factors in Britain: findings from the third National Survey of Sexual Attitudes and Lifestyles (Natsal-3). Lancet. 2013;382(9907):1807-16. DOI: 10.1016/S0140-6736(13)62071-1. 16. NHS C. How long does it usually take to get pregnant? 2013. Available from: http://www.nhs.uk/chq/Pages/2295.aspx?CategoryID=54.

References 75
17. Gindler J, Li Z, Berry RJ, Zheng J, Correa A, Sun X, et al. Folic acid supplements during pregnancy and risk of miscarriage. Lancet. 2001;358(9284):796-800. 18. Bestwick JP, Huttly WJ, Morris JK, Wald NJ. Prevention of Neural Tube Defects: A Cross-Sectional Study of the Uptake of Folic Acid Supplementation in Nearly Half a Million Women. PLOS ONE. 2014;9(2). 19. McGee E, Shaw D. Vitamin D supplementation: Putting recommendations into practice. Journal of Health Visiting. 2013;1(3):2-7. 20. De-Regil LM, Fernandez-Gaxiola AC, Dowswell T, Pena-Rosas JP. Effects and safety of periconceptional folate supplementation for preventing birth defects. The Cochrane database of systematic reviews. 2010(10):CD007950. DOI: 10.1002/14651858.CD007950.pub2. 21. Milunsky A, Jick H, Jick SS, Bruell CL, MacLaughlin DS, Rothman KJ, et al. Multivitamin/folic acid supplementation in early pregnancy reduces theprevalenc of neural tube defects. JAMA. 1989;262(20):2847-52. 22. Morris JK, Wald NJ. Prevalence of neural tube defect pregnancies in England and Wales from 1964 to 2004. Journal of medical screening. 2007;14(2):55-9. DOI: 10.1258/096914107781261945. 23. WHO. Daily iron and folic acid supplementation in pregnant women. 2012. 24. Bowles D, Wasiak R, Kissner M, van Nooten F, Engel S, Linder R, et al. Economic burden of neural tube defects in Germany. Public health. 2014;128(3):274-81. DOI: 10.1016/j.puhe.2013.12.001. 25. Jentink J, van de Vrie-Hoekstra NW, de Jong-van den Berg LT, Postma MJ. Economic evaluation of folic acid food fortification in The Netherlands. European journal of public health. 2008;18(3):270-4. DOI: 10.1093/eurpub/ckm129. 26. Tilford JM, Grosse SD, Robbins JM, Pyne JM, Cleves MA, Hobbs CA. Health state preference scores of children with spina bifida and their caregivers. Quality of life research : an international journal of quality of life aspects of treatment, care and rehabilitation. 2005;14(4):1087-98. 27. ONS. Annual Survey of Hours and Earnings, 2013 Provisional Results. 2014. Available from: http://www.ons.gov.uk/ons/rel/ashe/annual-survey-of-hours-and-earnings/2013-provisional-results/stb-ashe-statistical-bulletin-2013.html#tab-Weekly-earnings. 28. British Isles Network of Congenital Anomaly Registers. Congenital Anomaly Statistics 2012: England and Wales. 2014. Available from: http://www.binocar.org/content/Annual%20report%202012_FINAL_nologo.pdf 29. Yi Y, Lindemann M, Colligs A, Snowball C. Economic burden of neural tube defects and impact of prevention with folic acid: a literature review. European journal of pediatrics. 2011;170(11):1391-400. DOI: 10.1007/s00431-011-1492-8. 30. Grosse SD, Ouyang L, Collins JS, Green D, Dean JH, Stevenson RE. Economic evaluation of a neural tube defect recurrence-prevention program. American journal of preventive medicine. 2008;35(6):572-7. DOI: 10.1016/j.amepre.2008.07.008. 31. Szende A, Janssen B, (Eds.) CJ. Self-reported population health: A international persective based on EQ-5D. EuroQol. 2014. 32. ONS. National Life Tables, United Kingdom, 2011-2013. 2014. 33. Harris RA, Washington AE, Nease RF, Jr., Kuppermann M. Cost utility of prenatal diagnosis and the risk-based threshold. Lancet. 2004;363(9405):276-82. DOI: 10.1016/S0140-6736(03)15385-8. 34. Pensions DfWa. DWP QUARTERLY STATISTICAL SUMMARY. 2014. 35. Hoffmann MR, Senior PA, Mager DR. Vitamin D Supplementation and Health-Related Quality of Life: A Systematic Review of the Literature. Journal of the Academy of Nutrition and Dietetics. 2015. DOI: 10.1016/j.jand.2014.10.023.

APPENDIX A
Primary Data Collection – Example survey Questions

Appendix A i
Example survey Questions
Note that where question filtering applies, (such as, if the participant answers X to question
X), the participants will not see this text, they will automatically be directed to the correct
question based on their answer.
Screening question: Are you planning a pregnancy?
Questions for women planning a pregnancy
1. Are you eligible for free Healthy Start vitamin supplements?
a) Yes - because I qualify for the Healthy Start scheme
b) Yes – because free Healthy Start vitamins are made available to all women
planning a pregnancy in the area where I live
c) Yes – but I am not sure why I qualify for free Healthy Start vitamins
d) No
e) I don’t know
If yes (a, b or c), continue to question 2. Otherwise, go to question 3.
2. Do you take up on the offer of free Healthy Start vitamin supplements?
- Always
- Most of the time
- Occasionally
- Never
3. Do you qualify for any other type of free vitamin scheme (other than Healthy Start)?
Yes (Please give details of the scheme – text box)
No
If yes, go to next question. If no, go to question 5.
4. Do you take up on this offer? - Always
- Most of the time
- Occasionally
- Never
5. Do you ever buy vitamin supplements for yourself?
- Always
- Most of the time
- Occasionally
- Never
If never, go to question 15. Otherwise continue to question 6.

Appendix A ii
6. Please tick which (if any) of the following benefits you are in receipt of.
a) Income-based jobseeker’s allowance
b) Income-related employment and support allowance
c) Income support
d) Working tax credits
e) Working tax credit run-on
f) Child tax credit and you have an annual family income of over £16,190
g) Child tax credit and you have an annual family income of £16,190 or less
h) Housing benefit
i) Universal credit
7. Did you take vitamin supplements before you were planning a pregnancy?
Yes / No
8. Do you take vitamin supplements now that you are planning a pregnancy?
Yes / No / I don’t know
If yes, continue with survey, if no question 15.
9. If yes to Q8: Which of the following best describes the vitamin supplement you are
currently taking:
- A single supplement, for example tablets containing folic acid only
- A multivitamin supplement
- I don’t know
10. If yes to Q8, do the vitamin supplements that you are currently taking contain:
a) Folic acid? Yes/ No/ I don’t know
b) Vitamin C? Yes/No /I don’t know
c) Vitamin D? Yes/No/I don’t know
11. If yes to Q8, which of the following best describes how frequently you take the
vitamin supplements?
a) I always take them as recommended on the pack
b) Most of the time, I take them as recommended on the pack
c) I occasionally take them as recommended on the pack
d) I don’t take them.
12. If yes to Q8: If you know the brand name of the vitamin supplement(s) you are
taking, please write it in the text box below.
13. If yes to Q8: Where do you get your vitamin supplement from?
- I buy it;
- Someone buys it for me;

Appendix A iii
- I receive a free prescription for it;
- I pay for it on prescription.
14. If respondents select private purchase (i.e. they choose option 1, 2 or 4 to question
13) they will answer the following question: Please state approximately how much
you pay per pack for your supplements and approximately how many tablets are in
a pack. If you do not know the price or number of tablets, please leave this question
blank.
Text box to enter price
Text box to enter number of tablets.
15. Is there anything else you would like to tell us about your current vitamin
supplementation?

Appendix A iv
Questions for pregnant women
1. Are you eligible for free Healthy Start vitamin supplements?
f) Yes - because I qualify for the Healthy Start scheme
g) Yes – because free Healthy Start vitamins are made available to all pregnant
women in the area where I live
h) Yes – but I am not sure why I qualify for free Healthy Start vitamins
i) No
j) I don’t know
If yes, continue to question 2. Otherwise, go to question 3.
2. Do you take up on the offer of free Healthy Start vitamin supplements?
- Always
- Most of the time
- Occasionally
- Never
3. Do you qualify for any other type of free vitamin scheme (other than Healthy Start)? Yes (Please give details of the scheme – text box)
No
If yes, go to next question. If no, go to question 5.
4. Do you take up on this offer? - Always
- Most of the time
- Occasionally
- Never
5. Do you ever buy vitamin supplements for yourself?
- Always
- Most of the time
- Occasionally
- Never
If never, go to question 16. Otherwise continue to question 6.
6. Please tick which (if any) of the following benefits you are in receipt of.
j) Income-based jobseeker’s allowance
k) Income-related employment and support allowance
l) Income support
m) Working tax credits
n) Working tax credit run-on
o) Child tax credit and you have an annual family income of over £16,190
p) Child tax credit and you have an annual family income of £16,190 or less
q) Housing benefit

Appendix A v
r) Universal credit
7. Did you take vitamin supplements before you were planning a pregnancy?
Yes / No
8. Did you take vitamin supplements when you were planning a pregnancy?
Yes / No
9. Do you take any vitamin supplements now that you are pregnant?
Yes / No
If yes, continue with survey, if no question 16.
10. If yes to Q9: Do the vitamin supplements that you are currently taking contain:
a) Folic acid? Yes / No / I don’t know
b) Vitamin C? Yes / No / I don’t know
c) Vitamin D? Yes / No / I don’t know
11. If yes to Q9: which of the following best describes how frequently you take the
vitamin supplements?
a. I always take them as recommended on the pack
b. Most of the time, I take them as recommended on the pack
c. I occasionally take them as recommended on the pack
d. I don’t take them.
12. If yes to Q9: Which of the following best describes the vitamins you are currently
taking:
- Single supplements (for example a tablet containing folic acid or vitamin D
only );
- A multivitamin supplement
- I don’t know
13. If yes to Q9: If you know the brand name of the vitamin supplement(s) you are
taking, please write it in the text box below.
14. If yes to Q9: Where do you get your vitamin supplement from?
- I buy it;
- Someone buys it for me;
- I receive a free prescription for it;
- I pay for it on prescription.
15. If respondents select private purchase ( i.e. they choose option 1, 2 or 4 to question
14) they will answer the following question: Please state approximately how much
you pay per pack for your supplements and approximately how many tablets are in

Appendix A vi
a pack. If you do not know the price or number of tablets, please leave this question
blank.
Text box to enter price
Text box to enter number of tablets.
16. Is there anything else you would like to tell us about your current vitamin
supplementation?

Appendix A vii
Questions for women with children aged 0-5
1. Screening question: Do you have any children aged under five years in your
household?
Yes / No
If no, survey ends. If yes, continue to question 2.
2. Are you or the children in your household eligible for free Healthy Start vitamin
supplements? (please tick all that apply)
a) Yes - because I/we qualify for the Healthy Start scheme
b) Yes – because Healthy Start vitamins are made available for free in the area
where I live
c) Yes – but I am not sure why I/we qualify for free Healthy Start vitamins
d) No
e) I don’t know
2a. (If yes) Please select who qualifies for free Healthy Start supplements (tick all that
apply)
You
Your children
If yes, continue to question 3. Otherwise, go to question 4.
3. Do you take up on the offer of free Healthy Start vitamin supplements?
- Always
- Most of the time
- Occasionally
- Never
4. Do you/your child qualify for any other type of free vitamin scheme (other than Healthy Start)? Yes (Please give details of the scheme including who qualifies – text box)
No
If yes, go to next question. If no, go to question 6.
5. Do you take up on this offer? - Always
- Most of the time
- Occasionally
- Never
6. Do you ever buy vitamin supplements for:
Yourself - Always / most of the time / occasionally / never
Your children - Always / most of the time / occasionally / never

Appendix A viii
If never on both, go to question 25. Otherwise continue to question 7. If never on ‘yourself’ is
selected, skip ‘Women’s supplementation’ section. If never on ‘your child’ is selected skip
‘Children’s supplementation’.
7. Please tick which (if any) of the following benefits you are in receipt of.
a) Income-based jobseeker’s allowance
b) Income-related employment and support allowance
c) Income support
d) Working tax credits
e) Working tax credit run-on
f) Child tax credit and you have an annual family income of over £16,190
g) Child tax credit and you have an annual family income of £16,190 or less
h) Housing benefit
i) Universal credit
8. Is your youngest child under 12 months old?
Yes/No
If no, go to question 16 (children), if yes continue to question 9.
Women’s supplementation
9. Do you currently take any vitamin supplements?
Yes / No
If yes, carry onto question 10, if no go to question 16.
10. If yes to Q9: Do the vitamin supplements that you are currently taking contain:
a) folic acid? Yes / No / I don’t know
b) vitamin C? Yes / No / I don’t know
c) vitamin D? Yes / No / I don’t know
11. If yes to Q9: which of the following best describes how frequently you take the
vitamin supplements?
a. I always take them as recommended on the pack
b. Most of the time, I take them as recommended on the pack
c. I occasionally take them as recommended on the pack
d. I don’t take them.
12. If yes to Q9: Which of the following best describes the vitamins you are currently
taking:
- Single supplements (for example a tablet containing vitamin D only);
- A multivitamin supplement
- I don’t know

Appendix A ix
13. If yes to Q9: If you know the brand name of the vitamin supplement you are taking,
please write it in the text box below.
14. If yes to Q9: Where do you get your vitamin supplement from?
- I buy it;
- Someone buys it for me;
- I receive a free prescription for it;
- I pay for it on prescription.
15. If respondents select private purchase (i.e. they choose option 1, 2 or 4 to question
13) they will answer the following question: Please state approximately how much
you pay per pack for your supplements and approximately how many tablets are in
a pack. If you do not know the price or number of tablets, please leave this question
blank.
Text box to enter price
Text box to enter number of tablets.
Children’s supplementation
16. Do your children currently take any vitamin supplements?
Yes / No
If no go to question 25, if yes continue to question 17.
17. What are the ages of any infants or children you have who are under 5 years old
who are currently taking vitamin supplements?
Child 1
- 0 to 6 months;
- Over 6 months to 12 months
- Over 1 year to under 4 years
- Over 4 years and under 5 years.
Child 2 – Age etc.
When answering questions 18 to 24 if respondents have indicated they give vitamin
supplementation to more than one child they will be asked to think about each of their
children in turn.
18. If option 1 or 2 was selected for question 17. Please tick all the options that
currently apply to your baby:
My baby is breastfed
My baby receives formula
My baby is given vitamin supplements

Appendix A x
19. Do the vitamin supplements that you are currently giving to your child contain:
a) vitamin A? Yes / No / I don’t know
b) vitamin C? Yes / No / I don’t know
c) vitamin D? Yes / No / I don’t know
20. Which of the following best describes how frequently your child takes the vitamin
supplements?
a. They always take them as recommended on the pack
b. Most of the time, they take them as recommended on the pack
c. They occasionally take them as recommended on the pack
d. They don’t take them.
21. Which of the following best describes the vitamins you are currently giving to your
child:
- Single supplements (for example drops or a tablet containing vitamin D only);
- A multivitamin supplement
- I don’t know
22. If you know the brand name of the vitamin supplement your child is taking, please
write it in the text box below.
23. Where do you get your child’s vitamin supplement from?
- I buy it
- Someone buys it for me
- I receive a free prescription for it
24. If private purchase (option 1 or 2) to question 23: Please state approximately how
much you pay per pack for your child’s supplements and approximately how many
tablets or doses are in a pack. If you do not know the price or number of tablets,
please leave this question blank.
Text box to enter price
Text box to enter number of tablets.
25. Is there anything else you would like to tell us about your or your child/children’s
current vitamin supplementation?

APPENDIX B
Coefficient Technical Appendix

Appendix B i
Technical Appendix – Substitution coefficient Background Even without Healthy Start provision, some people already take vitamin supplements. In some cases, a relatively high proportion of people take vitamin supplements (e.g. folic acid when pregnant), as evidenced by the baseline uptake of vitamin supplements. Due to this, when the increase in uptake of Healthy Start vitamin supplements is modelled, it is important to take into account where this extra uptake comes from. The uptake of Healthy Start vitamin supplements might come from people who previously did not take vitamin supplements at all, or it might come from people who are already taking vitamin supplements (i.e. they were purchasing them privately or receiving them on prescription). When the extra Healthy Start uptake comes from those who already take vitamins this means that there is an extra cost to the public sector of providing the Healthy Start vitamin supplements but no actual health benefit (the person taking the vitamin supplement is simply substituting privately purchased vitamin supplements for the free Healthy Start vitamin supplements). The substitution coefficient described below allows for this scenario to be modelled. The following examples and graphs show how the coefficient is applied. The numbers in the graphs are illustrative for easier interpretation and do not represent the baseline uptake in the economic model. Substitution coefficient To allow a number of different scenarios to be modelled, a substitution ‘coefficient’ is used in the model. The coefficient can be varied between 0% and 100%, with each value offering a specific assumption about the source of Healthy Start uptake. Please note that the coefficient value does not represent the actual level of uptake. In short, the interpretation of each coefficient value is as follows: Substitution = 0%: Uptake of Healthy Start is from new uptakers wherever possible; Substitution = 50%: Uptake of Healthy Start is derived proportionally9 from substitutes and
new uptakers; Substitution = 100%: Uptake of Healthy Start comes from substitutes wherever possible. For instance, suppose the current level of uptake is 70% and the Healthy Start uptake is 20%. If a substitution coefficient of 100% is selected, then the ‘new’ uptake will be 70% (this suggests that all of the new Healthy Start users were drawn from people who already paid privately). If a substitution coefficient of 0% is selected, then the ‘new’ uptake will be 90%. If a substitution coefficient of 50% is selected, then the ‘new’ uptake will be 76% (this is because the 20% was split proportionally, i.e. 70%-30% between substituters and new uptakers). The substitution coefficient approach was used since the baseline level of uptake is likely to be very different for each vitamin. The following examples illustrate how the different coefficients would work in practice.
9 Meaning that the new Healthy Start users will be assumed to come proportionally from those
already taking vitamins and new uptakers. If, for instance, the current uptake was high, then the Healthy Start uptakers would be more likely to come from those already taking supplements.

Appendix B ii
Substitution coefficient of 0% When the substitution coefficient is 0% this means that 100% of the increase in Healthy Start uptake is from new uptakers. Graph A.1 below shows the change in the uptake of all vitamin supplements from the current targeted offering to the universal offering with:
An increase in Healthy Start uptake of 20%;
A substitution coefficient of 0%. Graph A.1: Substitution coefficient of 0%
Substitution coefficient of 100% When the substitution coefficient is 100%, this means that all extra Healthy Start uptake is from substitutes. Graph A.2 shows how the overall vitamin supplement uptake changes when there is:
An increase in Healthy Start uptake of 20%;
A substitution coefficient of 100%.
The uptake was
20%, this
increased by the
full 20% as the
substitution
coefficient is 0%
The full 20% uptake
could not be added
here as a limit of
100% uptake is
applied. In this
example, the
maximum Healthy
Start uptake was
applied (15%) and the
extra 5% must be
uptake from
substitutes

Appendix B iii
Graph A.2: Substitution coefficient of 100%
Substitution coefficient of 50% When the substitution coefficient is 50%, the model assumes that Healthy Start uptake is split proportionally between new uptake and substitutes. Graph A.3 shows the baseline uptake and new level of uptake when there is:
An increase in Healthy Start uptake of 20%;
A substitution coefficient of 50%.
The overall uptake has
not increased.
Although there was a
20% increase in
Healthy Start uptake, it
was all from people
who previously took
supplements anyway.
The vitamin C uptake has increased by
10%. There is a 20% uptake of Healthy
Start vitamin supplements, so the overall
uptake must be at least 20%. Where
possible, the uptake is taken from
substitutes.

Appendix B iv
Graph A.3: Substitution coefficient of 50%
All other substitution coefficients All other numbers interpolate between the assumptions outlined above. For example:
A substitution coefficient of 25% is hallway between a substitution coefficient of 0% and 50%;
A substitution coefficient of 75% is halfway between a substitution coefficient of 50% and 100%.
The Healthy Start uptake is split
proportionally (not equally) based on the
baseline uptake. This means that the new
uptake will be greater for those vitamins with
a low baseline uptake.

APPENDIX C
Detailed Results Breakdown
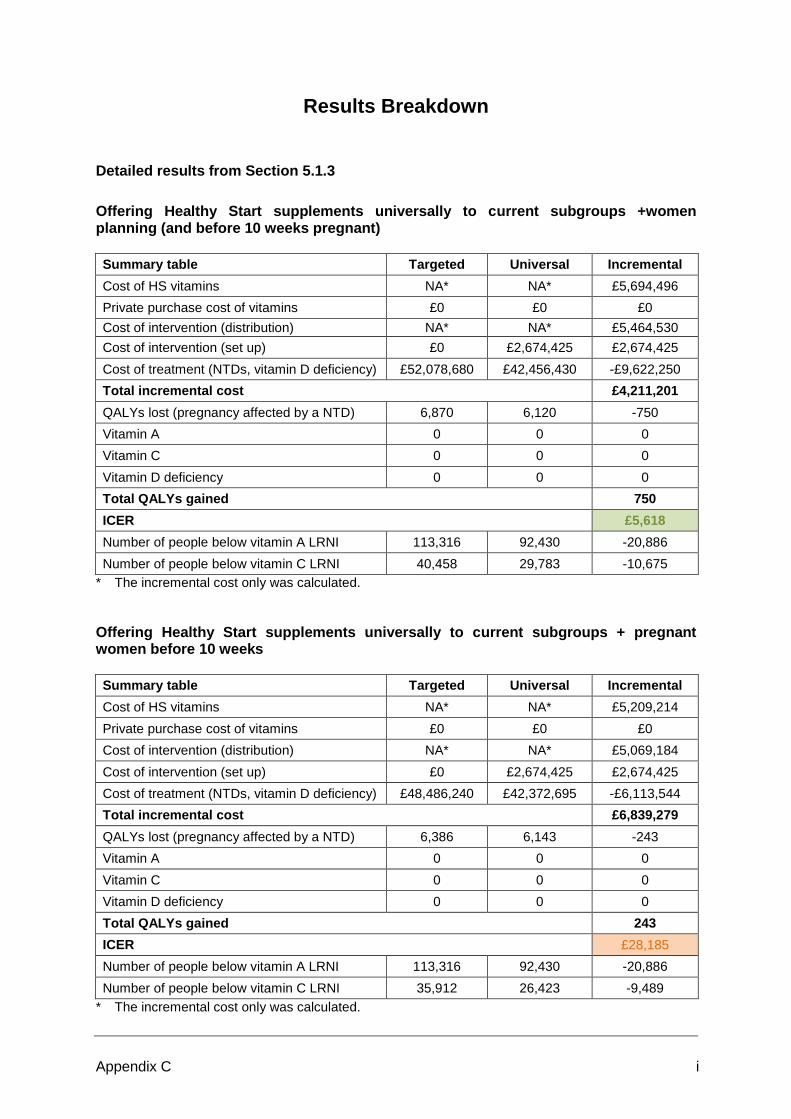
Appendix C i
Results Breakdown
Detailed results from Section 5.1.3
Offering Healthy Start supplements universally to current subgroups +women planning (and before 10 weeks pregnant)
Summary table Targeted Universal Incremental
Cost of HS vitamins NA* NA* £5,694,496
Private purchase cost of vitamins £0 £0 £0
Cost of intervention (distribution) NA* NA* £5,464,530
Cost of intervention (set up) £0 £2,674,425 £2,674,425
Cost of treatment (NTDs, vitamin D deficiency) £52,078,680 £42,456,430 -£9,622,250
Total incremental cost £4,211,201
QALYs lost (pregnancy affected by a NTD) 6,870 6,120 -750
Vitamin A 0 0 0
Vitamin C 0 0 0
Vitamin D deficiency 0 0 0
Total QALYs gained 750
ICER £5,618
Number of people below vitamin A LRNI 113,316 92,430 -20,886
Number of people below vitamin C LRNI 40,458 29,783 -10,675
* The incremental cost only was calculated.
Offering Healthy Start supplements universally to current subgroups + pregnant women before 10 weeks
Summary table Targeted Universal Incremental
Cost of HS vitamins NA* NA* £5,209,214
Private purchase cost of vitamins £0 £0 £0
Cost of intervention (distribution) NA* NA* £5,069,184
Cost of intervention (set up) £0 £2,674,425 £2,674,425
Cost of treatment (NTDs, vitamin D deficiency) £48,486,240 £42,372,695 -£6,113,544
Total incremental cost £6,839,279
QALYs lost (pregnancy affected by a NTD) 6,386 6,143 -243
Vitamin A 0 0 0
Vitamin C 0 0 0
Vitamin D deficiency 0 0 0
Total QALYs gained 243
ICER £28,185
Number of people below vitamin A LRNI 113,316 92,430 -20,886
Number of people below vitamin C LRNI 35,912 26,423 -9,489
* The incremental cost only was calculated.

Appendix C ii
Offering Healthy Start supplements universally to current subgroups + infants aged 0 to 6 months
Summary table Targeted Universal Incremental
Cost of HS vitamins NA* NA* £5,295,784
Private purchase cost of vitamins £0 £0 £0
Cost of intervention (distribution) NA* NA* £4,826,015
Cost of intervention (set up) £0 £2,674,425 £2,674,425
Cost of treatment (NTDs, vitamin D deficiency) £31,774,712 £26,847,056 -£4,927,656
Total incremental cost £7,868,568
QALYs lost (pregnancy affected by a NTD) 3,635 3,623 -13
Vitamin A 0 0 0
Vitamin C 0 0 0
Vitamin D deficiency 0 0 0
Total QALYs gained 13
ICER £620,392
Number of people below vitamin A LRNI 113,706 92,748 -20,958
Number of people below vitamin C LRNI 29,123 21,860 -7,263
* The incremental cost only was calculated.
Offering Healthy Start supplements universally to current subgroups + children aged 4 to 5 years
Summary table Targeted Universal Incremental
Cost of HS vitamins NA* NA* £6,096,732
Private purchase cost of vitamins £0 £0 £0
Cost of intervention (distribution) NA* NA* £5,121,437
Cost of intervention (set up) £0 £2,674,425 £2,674,425
Cost of treatment (NTDs, vitamin D deficiency) £32,526,833 £27,198,334 -£5,328,499
Total incremental cost £8,564,095
QALYs lost (pregnancy affected by a NTD) 3,635 3,623 -13
Vitamin A 0 0 0
Vitamin C 0 0 0
Vitamin D deficiency 0 0 0
Total QALYs gained 13
ICER £675,230
Number of people below vitamin A LRNI 144,802 117,833 -26,968
Number of people below vitamin C LRNI 29,123 21,860 -7,263
* The incremental cost only was calculated.

Appendix C iii
Offering Healthy Start supplements universally to current subgroups + all extended subgroups (Scenario 2)
Summary table Targeted Universal Incremental
Cost of HS vitamins NA* NA* £7,136,203
Private purchase cost of vitamins £0 £0 £0
Cost of intervention (distribution) NA* NA* £6,148,818
Cost of intervention (set up) £0 £2,674,425 £2,674,425
Cost of treatment (NTDs, vitamin D deficiency) £54,786,787 £43,721,249 -£11,065,538
Total incremental cost £4,893,907
QALYs lost (pregnancy affected by a NTD) 6,870 6,120 -750
Vitamin A 0 0 0
Vitamin C 0 0 0
Vitamin D deficiency 0 0 0
Total QALYs gained 750
ICER £6,528
Number of people below vitamin A LRNI 145,193 118,152 -27,041
Number of people below vitamin C LRNI 40,458 29,783 -10,675
* The incremental cost only was calculated.
Detailed results from Section 5.1.2 Offering Healthy Start supplements universally to women planning (and before 10 weeks pregnant) only
Summary table Targeted Universal Incremental
Cost of HS vitamins NA* NA* £719,091
Private purchase cost of vitamins £0 £0 £0
Cost of intervention (distribution) NA* NA* £832,948
Cost of intervention (set up) £0 £2,674,425 £2,674,425
Cost of treatment (NTDs, vitamin D deficiency) £21,281,961 £16,066,144 -£5,215,817
Total incremental cost -£989,352
QALYs lost (pregnancy affected by a NTD) 3,234 2,497 -737
Vitamin A 0 0 0
Vitamin C 0 0 0
Vitamin D deficiency 0 0 0
Total QALYs gained 737
ICER Dominant
Number of people below vitamin A LRNI 0 0 0
Number of people below vitamin C LRNI 11,335 7,924 -3,411
* The incremental cost only was calculated.
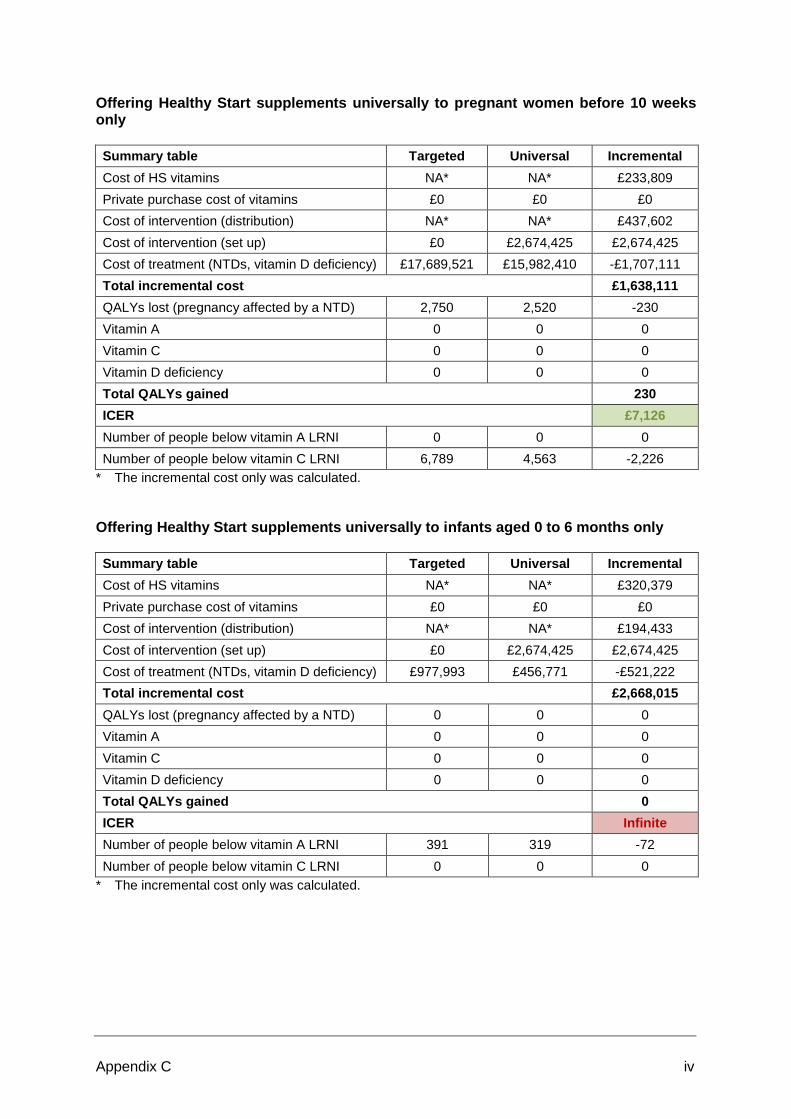
Appendix C iv
Offering Healthy Start supplements universally to pregnant women before 10 weeks only
Summary table Targeted Universal Incremental
Cost of HS vitamins NA* NA* £233,809
Private purchase cost of vitamins £0 £0 £0
Cost of intervention (distribution) NA* NA* £437,602
Cost of intervention (set up) £0 £2,674,425 £2,674,425
Cost of treatment (NTDs, vitamin D deficiency) £17,689,521 £15,982,410 -£1,707,111
Total incremental cost £1,638,111
QALYs lost (pregnancy affected by a NTD) 2,750 2,520 -230
Vitamin A 0 0 0
Vitamin C 0 0 0
Vitamin D deficiency 0 0 0
Total QALYs gained 230
ICER £7,126
Number of people below vitamin A LRNI 0 0 0
Number of people below vitamin C LRNI 6,789 4,563 -2,226
* The incremental cost only was calculated.
Offering Healthy Start supplements universally to infants aged 0 to 6 months only
Summary table Targeted Universal Incremental
Cost of HS vitamins NA* NA* £320,379
Private purchase cost of vitamins £0 £0 £0
Cost of intervention (distribution) NA* NA* £194,433
Cost of intervention (set up) £0 £2,674,425 £2,674,425
Cost of treatment (NTDs, vitamin D deficiency) £977,993 £456,771 -£521,222
Total incremental cost £2,668,015
QALYs lost (pregnancy affected by a NTD) 0 0 0
Vitamin A 0 0 0
Vitamin C 0 0 0
Vitamin D deficiency 0 0 0
Total QALYs gained 0
ICER Infinite
Number of people below vitamin A LRNI 391 319 -72
Number of people below vitamin C LRNI 0 0 0
* The incremental cost only was calculated.

Appendix C v
Offering Healthy Start supplements universally to children aged 4 to 5 years only
Summary table Targeted Universal Incremental
Cost of HS vitamins NA* NA* £1,121,327
Private purchase cost of vitamins £0 £0 £0
Cost of intervention (distribution) NA* NA* £489,855
Cost of intervention (set up) £0 £2,674,425 £2,674,425
Cost of treatment (NTDs, vitamin D deficiency) £1,730,114 £808,048 -£922,066
Total incremental cost £3,363,541
QALYs lost (pregnancy affected by a NTD) 0 0 0
Vitamin A 0 0 0
Vitamin C 0 0 0
Vitamin D deficiency 0 0 0
Total QALYs gained 0
ICER Infinite
Number of people below vitamin A LRNI 31,486 25,404 -6,083
Number of people below vitamin C LRNI 0 0 0
* The incremental cost only was calculated.
Offering Healthy Start supplements universally to all extended subgroups only
Summary table Targeted Universal Incremental
Cost of HS vitamins NA* NA* £2,160,798
Private purchase cost of vitamins £0 £0 £0
Cost of intervention (distribution) NA* NA* £1,517,236
Cost of intervention (set up) £0 £2,674,425 £2,674,425
Cost of treatment (NTDs, vitamin D deficiency) £23,990,068 £17,330,963 -£6,659,105
Total incremental cost -£306,646
QALYs lost (pregnancy affected by a NTD) 3,234 2,497 -737
Vitamin A 0 0 0
Vitamin C 0 0 0
Vitamin D deficiency 0 0 0
Total QALYs gained 737
ICER Dominant
Number of people below vitamin A LRNI 31,877 25,722 -6,155
Number of people below vitamin C LRNI 11,335 7,924 -3,411
* The incremental cost only was calculated.

APPENDIX D
Tornado Diagrams User Guide

Appendix D i
Tornado Diagrams Tornado diagrams are a useful tool for presenting the results of univariate sensitivity analyses around multiple model input parameters on one graph. This can allow the reviewer to assess which of the model input parameters have the greatest influence on the model’s results. A step-by-step guide to interpreting a tornado diagram is now presented using the pregnant women after 10 weeks subgroup as an example. Within a tornado diagram, each model input parameter under consideration is varied between two plausible values, referred to as a ‘high value’ and a ‘low value’. The ‘high value’ is the highest plausible value each input parameter can take, whilst the ‘low value’ is the smallest plausible value each input parameter can take. Figure C.1 shows how high and low values are displayed on a tornado diagram. Figure C.1: High and low input values
The model is run using the high input parameter and an ICER generated. This is depicted on the tornado diagram with a green bar. The model is then run using the low input parameter and again an ICER is generated (shown with a pink bar). The green and pink bar combined represents the range of results that are generated using an input with two plausible, but extreme, values. This is displayed on Figure C.2.
The baseline probability of
NTD if taking folic acid is
varied between a low value
of 0.00% and a high value
of 0.50%.

Appendix D ii
Figure C.2: Results of univariate sensitivity analysis
Considering specifically “probability if not taking folic acid” in Figure C.2, shows that where this input is set to its highest plausible value, of 0.5%, the ICER is close to £0 per QALY (green bar). That is, where pregnant women who are not taking folic acid have a probability of a pregnancy affected by a NTD of 0.5% the universal scheme is cost-effective compared with the targeted scheme. This is because the increase in uptake of Healthy Start vitamin supplements resulting from the universal scheme has a relatively high scope for benefit, in that, pregnancies affected by a NTD can potentially be avoided in 0.5% of pregnancies. Conversely, the pink bar for “probability if not taking folic acid” on Figure C.2, shows that where the probability of NTD when not taking folic acid is 0%, the ICER is around £600,000 and thus the universal scheme would not be considered cost-effective compared with the targeted scheme. Where the baseline probability of NTD is at 0%, there is no scope for benefit from an increased uptake of Healthy Start vitamin supplements, i.e. the incidence of NTD cannot be reduced.
The grey vertical line represents
the ICER where all values are
set to their base case value,
whilst the red vertical line
represents a threshold value of
£20,000 per QALY.
Where the probability of NTD for those not
taking folic acid is 0% (at its low value), the
ICER of the universal scheme compared with
the targeted scheme is close to £600,000 per
QALY (shown using the pink bar). This is
because you cannot have a NTD regardless
of whether you are taking folic acid, or not.

Appendix D iii
The change in ICER where the probability if not taking folic is varied is large, with ICERs generated of £0 per QALY to £600,000 per QALY. Therefore, this input has a large impact on the results of the model. Figure C.3 shows a full tornado diagram and can be used to show which inputs are driving the results, that is, which inputs when varied affect the model’s results the most. Figure C.3: Full tornado diagram
Figure C.3 can be interpreted in that those inputs with wider pink and green bars have a larger impact on results than those inputs with less wide bars. Therefore, it is apparent that the probability (of a pregnancy affected by a NTD) if not taking folic acid is clearly the key driver of the results for pregnant women after 10 weeks.
These inputs have a limited
impact on the ICER.
This input has a
large impact on
the ICER


![Technical Note - HPLC · Technical Note Vitamins are trace ... Excellent High Performance Liquid Chromatography (HPLC) ... Folic Acid (0.26@Ûg) 9; D-Biotin [Vitamin H] (2.02@Ûg)](https://img.pdfslide.net/doc/110x75/5ad475c17f8b9a6d708ba707/technical-note-note-vitamins-are-trace-excellent-high-performance-liquid-chromatography.jpg)


![VITAMINS-WATER SOLUBLE [LIPPINCOTT S 373-381] · o Water-soluble vitamins : Folic acid, cobalamin, ascorbic acid, pyridoxine, thiamine, niacin, riboflavin, biotin, and pantothenic](https://img.pdfslide.net/doc/110x75/5f04a2037e708231d40eefe1/vitamins-water-soluble-lippincott-s-373-381-o-water-soluble-vitamins-folic-acid.jpg)