Embed Size (px)
Citation preview
Copyright: Department of Water & Sanitation
NATIONAL INTEGRATED WATER INFORMATION SYSTEM (NIWIS) USER
MANUAL
Information Document for NIWIS Dashboards Version 2.0
March 2018
Copyright: Department of Water & Sanitation
i
Copyright and Disclaimer
Copyright:
The copyright of the data/information remains with the Department of Water and Sanitation. This
approval to use the data/information cannot be construed as a transfer of copyright.
Usage:
All data is supplied free of charge and may not be sold to third parties. The use of information data
is restricted to use for academic, research or personal purposes.
Quality:
All data is supplied with no expressed or implied warranty as to its suitability for purpose, accuracy
or completeness.
Status:
Meanwhile data is continuously updated; the data set(s) supplied are already historical on the day
of supply.
Acknowledgement:
Whenever used in publications or the electronic media, the Department Water and Sanitation is to
be mentioned as the proprietor of the relevant copyright.
Copyright: Department of Water & Sanitation
ii
Table of Contents
1. SECTION A ........................................................................................................................................... 1
1.1 Introduction .................................................................................................................................... 1
1.2 Who can I contact if I need help?.................................................................................................... 1
1.3 When I logon to NIWIS my username and password are requested as seen in Figure 2 below: ..... 2
1.4 How do I access a dashboard from the Home page? ..................................................................... 4
1.5 How do I access the dashboard from each category? .................................................................... 5
1.6 Where can I find more information about the dashboard, map legend and filter option? ................. 5
1.7 How can I print, download data/information from the dashboards? ................................................. 8
1.8 How do I select a province/area on the map? ............................................................................... 10
1.9 The NIWIS demonstration is also available in the video as shown in Figure 15 below. ................. 12
2. SECTION B ......................................................................................................................................... 12
2.1 The use of mobile devices ............................................................................................................... 12
3 SECTION C ......................................................................................................................................... 14
3.1 Introduction .................................................................................................................................. 14
3.2 The Health Risk Related To Using Untreated Water From Rivers And Dams Dashboard: ............ 14
3.3 Surface water storage dashboard: ................................................................................................ 16
3.4 River flows dashboard: ................................................................................................................. 18
3.5 Groundwater reserve dashboard: ................................................................................................. 20
3.6 Water Supply Reliability Dashboard: ............................................................................................ 22
3.7 Drought Status Dashbpoard: ........................................................................................................ 24
4 Conclusion .......................................................................................................................................... 27
Copyright: Department of Water & Sanitation
1
1. SECTION A
1.1 Introduction
This document is the National Integrated Water Information System (NIWIS) User Manual; it
serves as a guide to enable the users to easily interact with the system. This manual focuses on
access, navigation, and use of the system. The NIWIS System consists of a set of dashboards to
enable to swiftly navigate through various information products (Dashboards). All information
products have been designed based on the same framework, therefore the navigation point
applies to all products.
This user manual will evolve as and when a new version of NIWIS is introduced and when new
features are introduced in the existing dashboard.
Please Note: NIWIS can also be accessed via mobile devices using the internet, i.e. cell phones
and tablets (follow the link http://niwis.dws.gov.za/ ), see Figure 16 to 18.
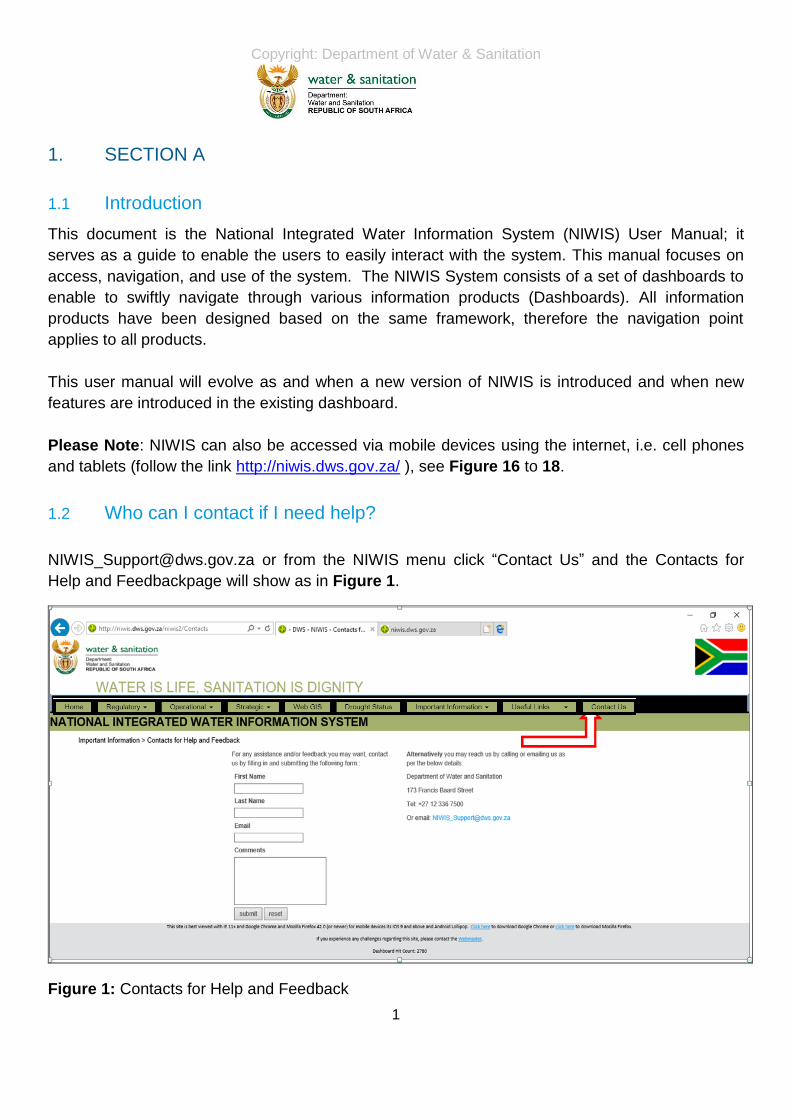
1.2 Who can I contact if I need help?
[email protected] or from the NIWIS menu click “Contact Us” and the Contacts for
Help and Feedbackpage will show as in Figure 1.
Figure 1: Contacts for Help and Feedback

Copyright: Department of Water & Sanitation
2
1.3 When I logon to NIWIS my username and password are requested as seen in
Figure 2 below:
Figure 2: Logging into NIWIS
No login is required. If the system asks you to login as in Figure 2 select Cancel and make sure
your proxy settings are correct. To check the proxy settings do the following:
For Internet Explorer click on Tools then the Internet options window will open, as in Figure 3
below
Figure 3: NIWIS on Intranet
Click on the Connections tab and then click on LAN settings. The Local Area Network Settings
window will open. Click on Advanced button. The Proxy Settings window will open. Your proxy
settings should be as in Figure 4 below.
Tools
NIWIS

Copyright: Department of Water & Sanitation
3
Figure 4: Internet Properties
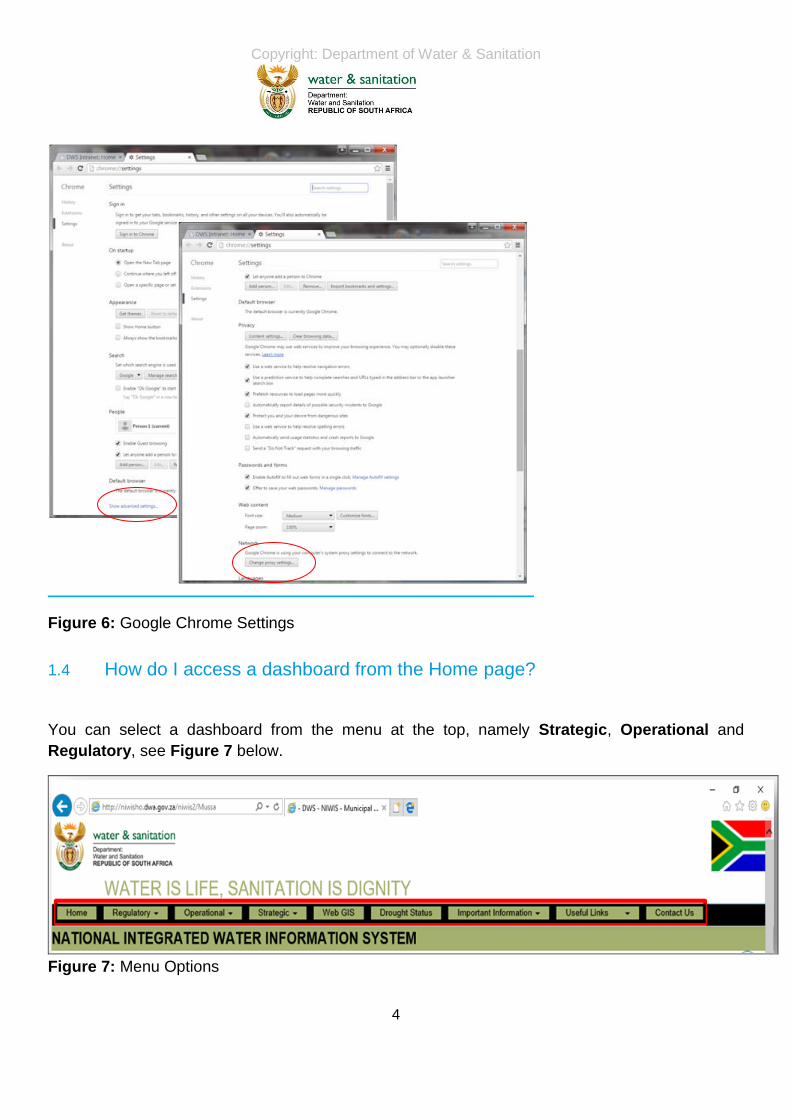
For Google Chrome click on Customize and control Google Chrome as in Figure 5 then select
Settings. Click on Show advanced settings to open more options – see Figure 6. Go down the
list till you find Change proxy settings and click on it. The Internet Properties window will open as
in Figure 4. Click on LAN settings then Click on Advanced. Your proxy settings should be the
same as in Figure 4 above.
Figure 5: Google Chrome
Customize and Control Google
Chrome
Copyright: Department of Water & Sanitation
4
Figure 6: Google Chrome Settings
1.4 How do I access a dashboard from the Home page?
You can select a dashboard from the menu at the top, namely Strategic, Operational and
Regulatory, see Figure 7 below.
Figure 7: Menu Options
Copyright: Department of Water & Sanitation
5
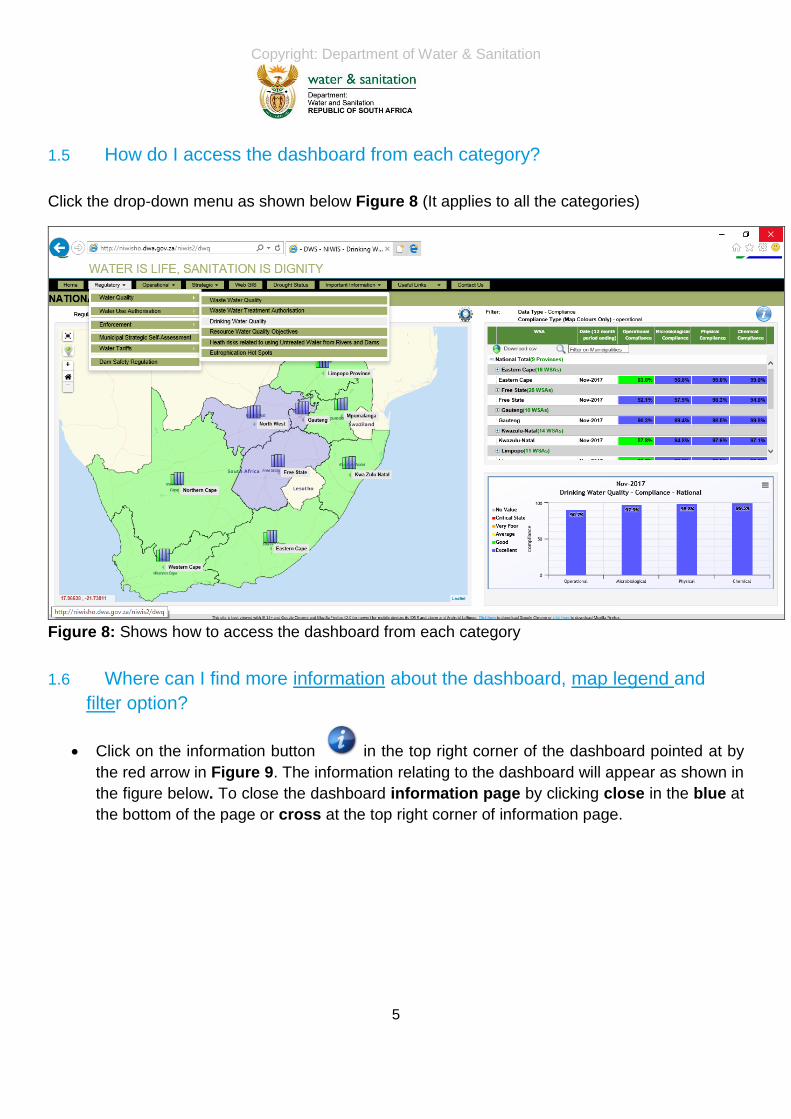
1.5 How do I access the dashboard from each category?
Click the drop-down menu as shown below Figure 8 (It applies to all the categories)
Figure 8: Shows how to access the dashboard from each category
1.6 Where can I find more information about the dashboard, map legend and
filter option?
Click on the information button in the top right corner of the dashboard pointed at by
the red arrow in Figure 9. The information relating to the dashboard will appear as shown in
the figure below. To close the dashboard information page by clicking close in the blue at
the bottom of the page or cross at the top right corner of information page.

Copyright: Department of Water & Sanitation
6
Figure 9: Dashboard information button
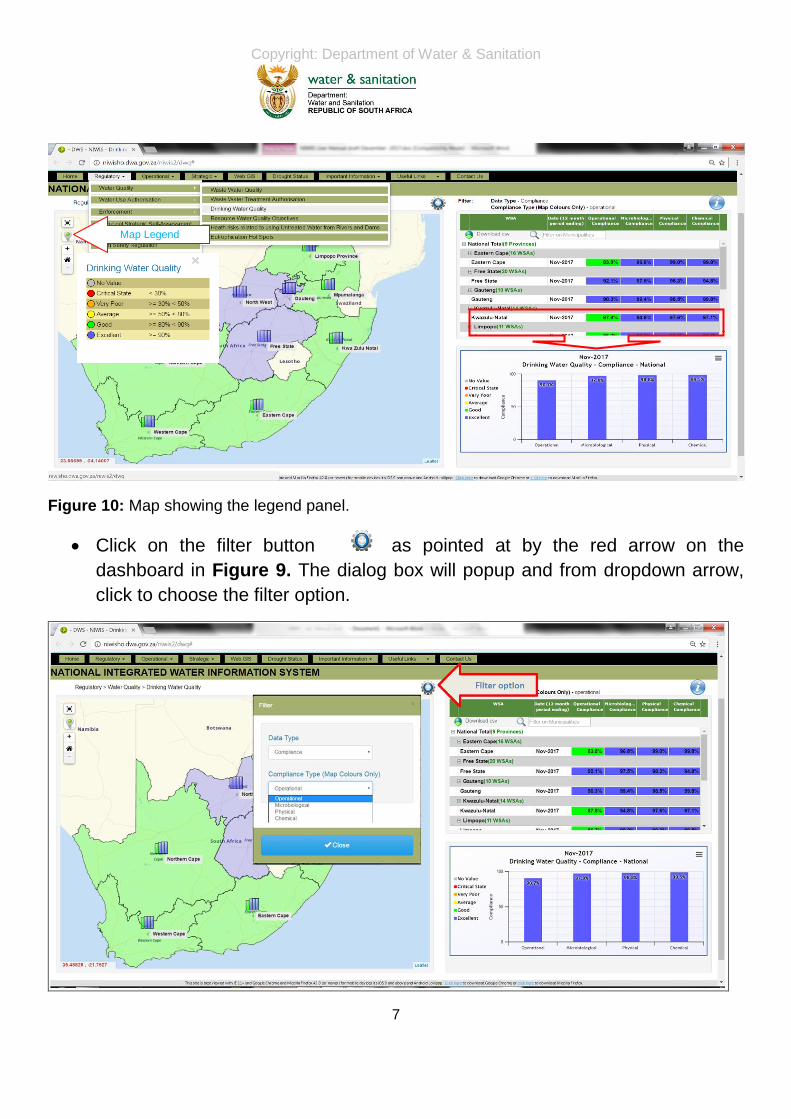
Click on the map legend button in the left panel of the dashboard pointed at by the
red arrow in Figure 10. The map legend will popup as shown below. You zoom in and
zoom out using positive and negative signs and can revert to the original map by clicking
the home sign. Above the legend icon there is a full screen icon, you can click it for full
screen view and click it again for original view.
Click Information button
Information Background
Copyright: Department of Water & Sanitation
7
Figure 10: Map showing the legend panel.
Click on the filter button as pointed at by the red arrow on the
dashboard in Figure 9. The dialog box will popup and from dropdown arrow,
click to choose the filter option.
Map Legend

Copyright: Department of Water & Sanitation
8
Figure 9: Map showing the filter option
1.7 How can I print, download data/information from the dashboards?
Click the chart context menu, the print or download options will appear as indicated in Figure 10.
Then you can select either print or download option from the menu below.
Figure 10: Map Shows the print and graph download options
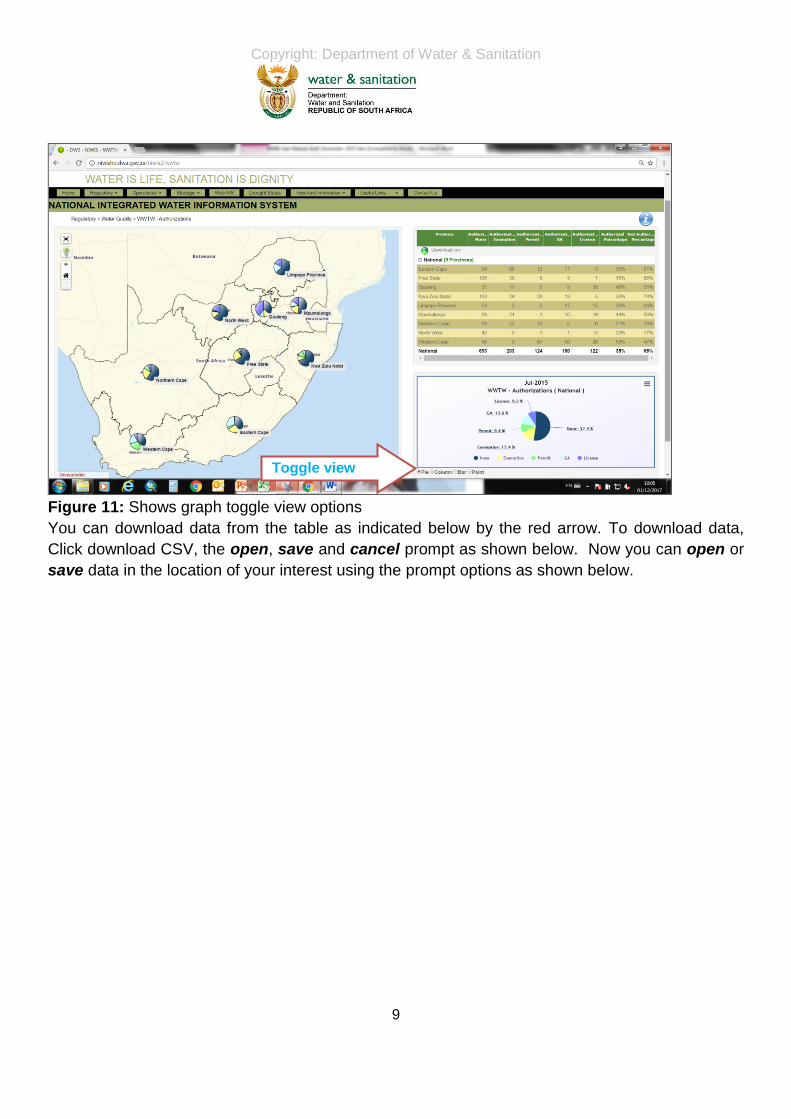
The arrow in Figure 11 below shows the graph options on the pie chart, but this is available in
some of the dashboards.
Print and graph download options
Copyright: Department of Water & Sanitation
9
Figure 11: Shows graph toggle view options
You can download data from the table as indicated below by the red arrow. To download data,
Click download CSV, the open, save and cancel prompt as shown below. Now you can open or
save data in the location of your interest using the prompt options as shown below.
Toggle view

Copyright: Department of Water & Sanitation
10
Figure 12: Shows the data download option and how to open or save the file
1.8 How do I select a province/area on the map?
You can select by hovering on the map as show below in Figure 13. Hover the mouse around the
map or area of your interest, the popup message will appear as shown in the map below (Figure
13). Click on the map or area selected, and automatically the table will be highlighted showing the
selected area. This can also be done by selecting on the table as shown in Figure 14.

Copyright: Department of Water & Sanitation
11
Figure 13: Area selection using the map
Or you can select a province/area by clicking on the table as shown in Figure 14 below.
Figure 14: Area selection using the table
Area selection using Map
Area selection using table
Copyright: Department of Water & Sanitation
12
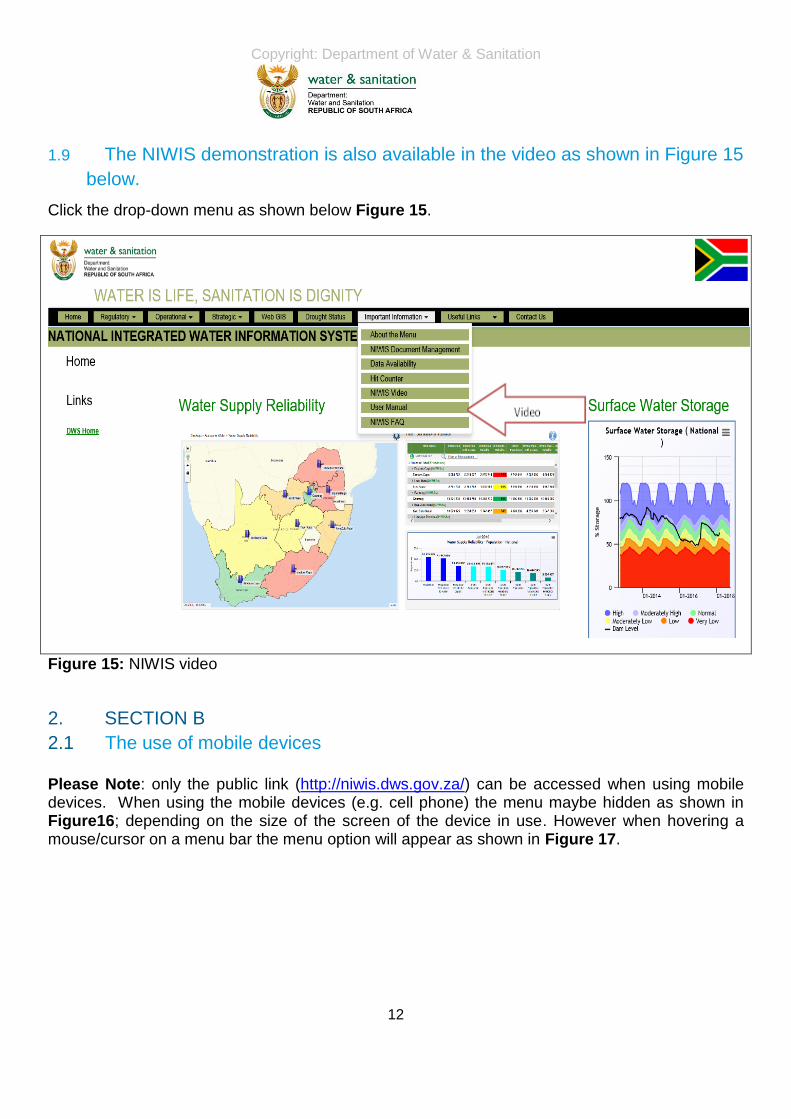
1.9 The NIWIS demonstration is also available in the video as shown in Figure 15
below.
Click the drop-down menu as shown below Figure 15.
Figure 15: NIWIS video
2. SECTION B
2.1 The use of mobile devices
Please Note: only the public link (http://niwis.dws.gov.za/) can be accessed when using mobile devices. When using the mobile devices (e.g. cell phone) the menu maybe hidden as shown in Figure16; depending on the size of the screen of the device in use. However when hovering a mouse/cursor on a menu bar the menu option will appear as shown in Figure 17.

Copyright: Department of Water & Sanitation
13
Figure 16: The hidden menu option
Figure 17: Hovering a mouse on the menu
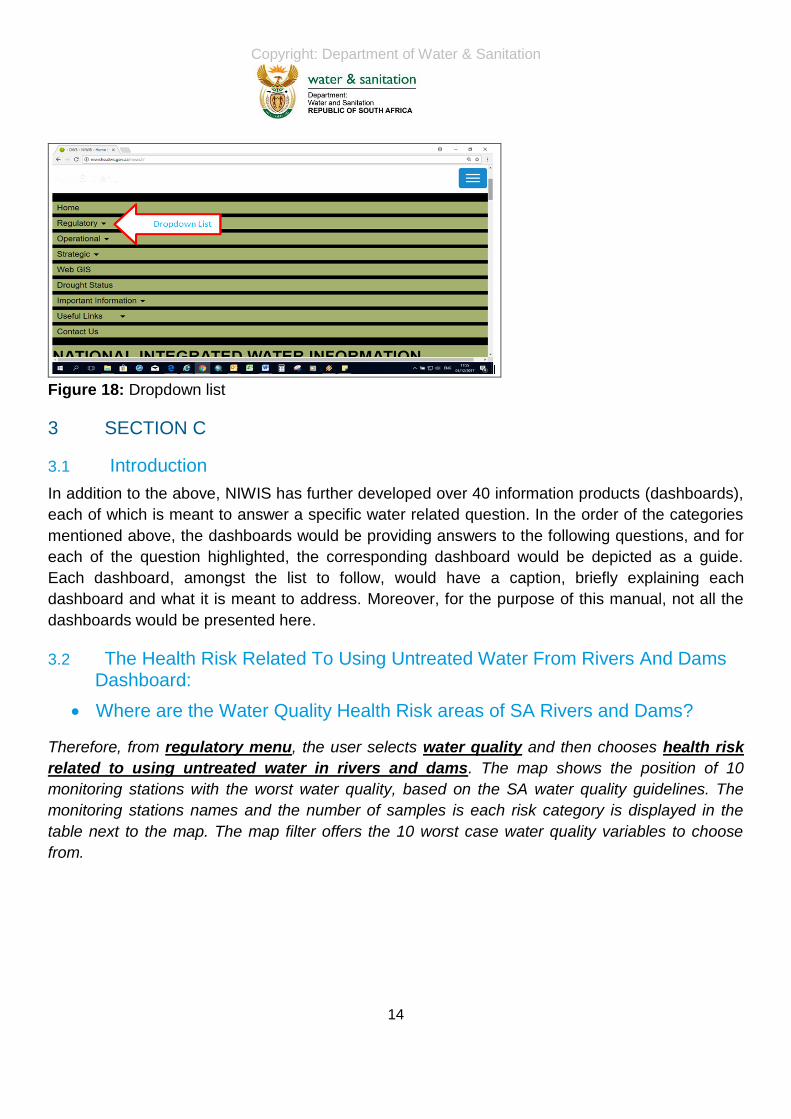
When clicking on the menu options, the list of categories of dashboards will appear as shown in
Figure 18. Please note that the information will remain the same as when using a computer, only
the view may change. Similarly to a computer view, the categories can be expanded by clicking
the dropdown arrows as shown in Figure 18.
Copyright: Department of Water & Sanitation
14
Figure 18: Dropdown list
3 SECTION C
3.1 Introduction
In addition to the above, NIWIS has further developed over 40 information products (dashboards),
each of which is meant to answer a specific water related question. In the order of the categories
mentioned above, the dashboards would be providing answers to the following questions, and for
each of the question highlighted, the corresponding dashboard would be depicted as a guide.
Each dashboard, amongst the list to follow, would have a caption, briefly explaining each
dashboard and what it is meant to address. Moreover, for the purpose of this manual, not all the
dashboards would be presented here.
3.2 The Health Risk Related To Using Untreated Water From Rivers And Dams Dashboard:
Where are the Water Quality Health Risk areas of SA Rivers and Dams?
Therefore, from regulatory menu, the user selects water quality and then chooses health risk
related to using untreated water in rivers and dams. The map shows the position of 10
monitoring stations with the worst water quality, based on the SA water quality guidelines. The
monitoring stations names and the number of samples is each risk category is displayed in the
table next to the map. The map filter offers the 10 worst case water quality variables to choose
from.

Copyright: Department of Water & Sanitation
15
Figure 19: Health risks related to using untreated water from rivers and dams
The user can also zoom into the area with worst water quality and select one of the points on the
map to highlight it in the table. The monitoring point at Orkney (188132) shows 100% high risk for
Total Coliforms (99%) as shown in Figure 17 below.

Copyright: Department of Water & Sanitation
16
Figure 20: Zooming into the specific area/point in the dashboard
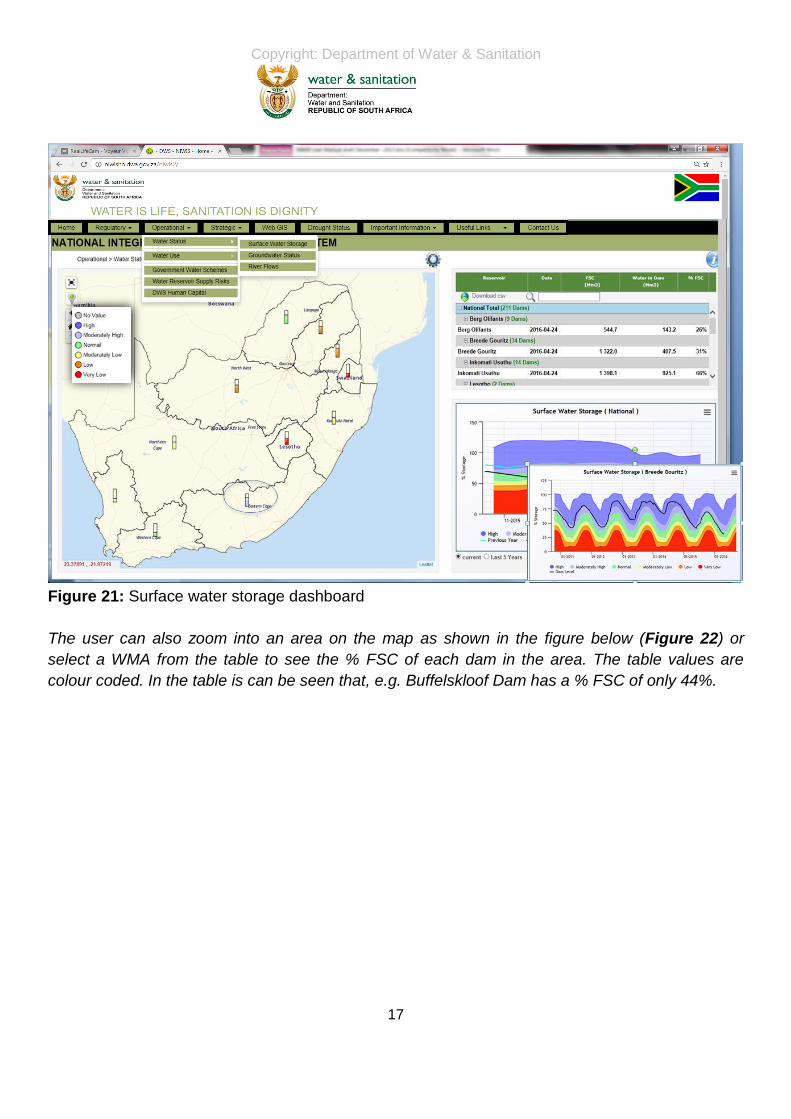
3.3 Surface water storage dashboard:
Which WMA has the lowest % Full Supply Capacity and where are the
problem areas?
From the Operational menu the user can select Water Status and then choose Surface Water
Storage. The map displays the % Full Supply Capacity (FSC) in each Water Management Area. It
can be seen that only one WMA still has a % FSC that is Moderately High.
On the graph the user can see the current and previous years values or select to see the trend
over 5 years.
Copyright: Department of Water & Sanitation
17
Figure 21: Surface water storage dashboard
The user can also zoom into an area on the map as shown in the figure below (Figure 22) or
select a WMA from the table to see the % FSC of each dam in the area. The table values are
colour coded. In the table is can be seen that, e.g. Buffelskloof Dam has a % FSC of only 44%.

Copyright: Department of Water & Sanitation
18
Figure 22: Zooming into the specific area/point in the dashboard
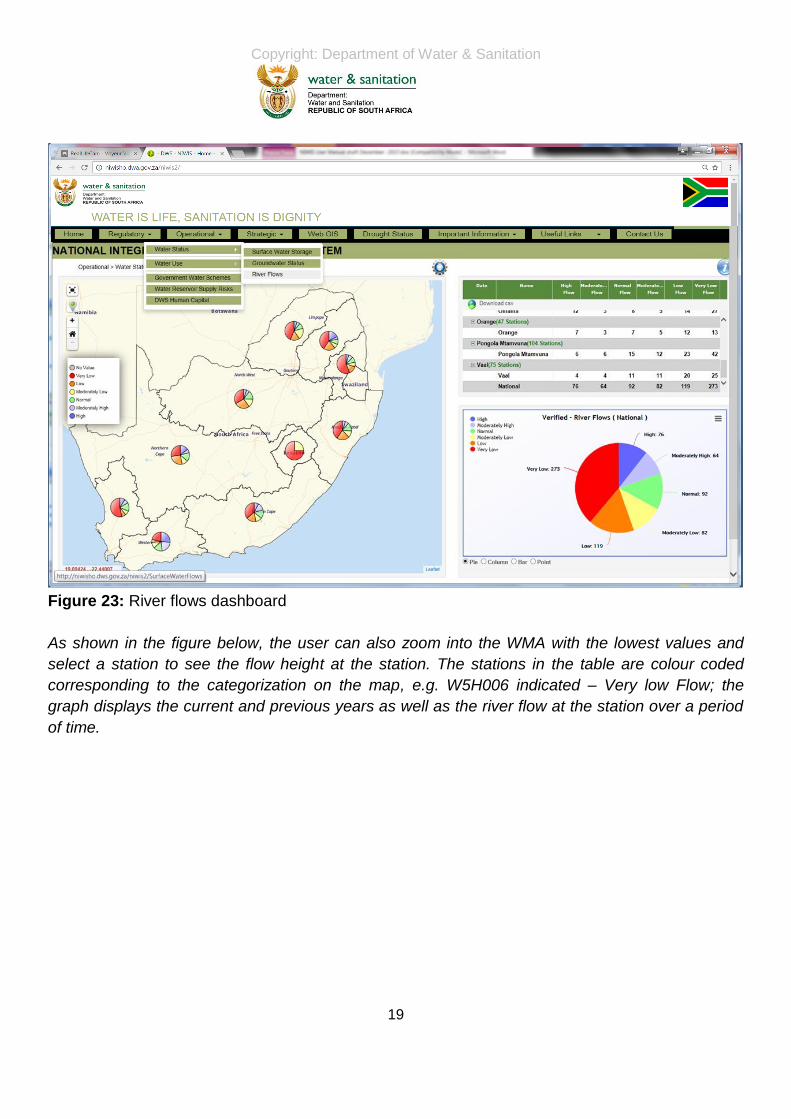
3.4 River flows dashboard:
What is the Status of River Flows in SA and where are areas of concern?
From the Operational menu, the user can select Water Status and then choose River Flows.
The dashboard displays the status of River Flows in each WMA as well as a National summary in
the table and chart. From the figure below, the pie chart indicated that nationally the majority of
stations fall in the Very Low flow category.
Copyright: Department of Water & Sanitation
19
Figure 23: River flows dashboard
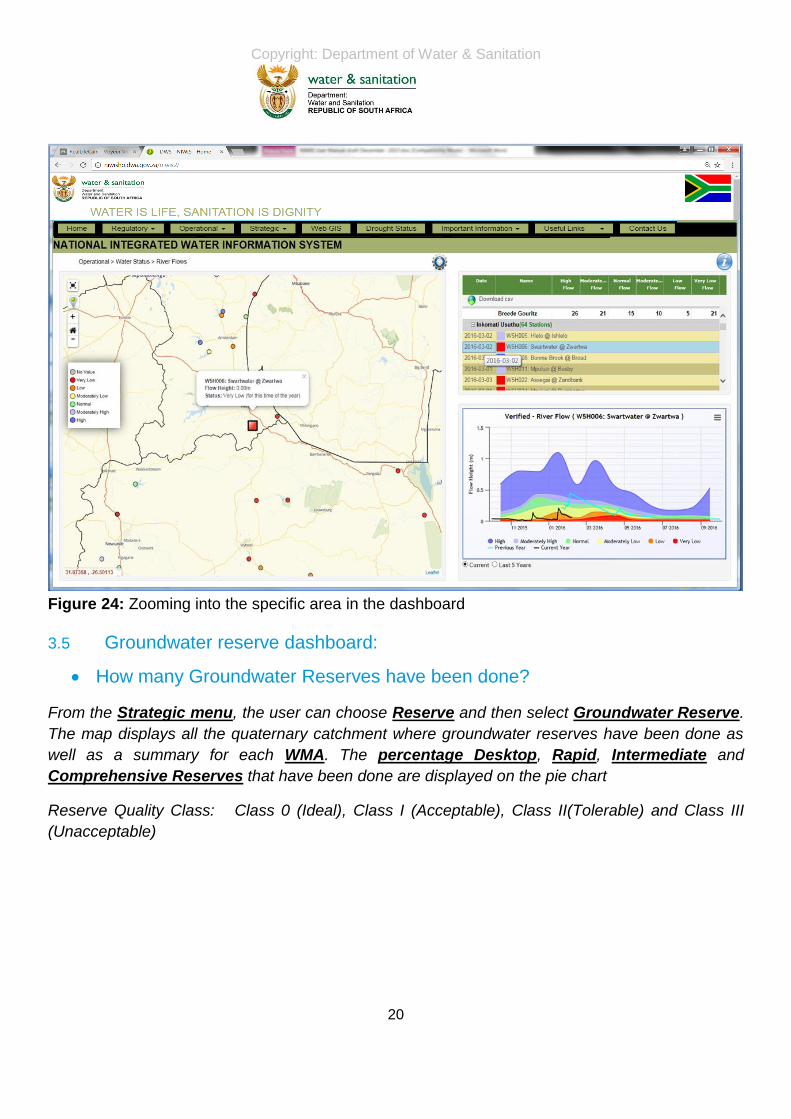
As shown in the figure below, the user can also zoom into the WMA with the lowest values and
select a station to see the flow height at the station. The stations in the table are colour coded
corresponding to the categorization on the map, e.g. W5H006 indicated – Very low Flow; the
graph displays the current and previous years as well as the river flow at the station over a period
of time.
Copyright: Department of Water & Sanitation
20
Figure 24: Zooming into the specific area in the dashboard
3.5 Groundwater reserve dashboard:
How many Groundwater Reserves have been done?
From the Strategic menu, the user can choose Reserve and then select Groundwater Reserve.
The map displays all the quaternary catchment where groundwater reserves have been done as
well as a summary for each WMA. The percentage Desktop, Rapid, Intermediate and
Comprehensive Reserves that have been done are displayed on the pie chart
Reserve Quality Class: Class 0 (Ideal), Class I (Acceptable), Class II(Tolerable) and Class III
(Unacceptable)

Copyright: Department of Water & Sanitation
21
Figure 25: Groundwater reserve dashboard
Figure 26 shows that when the user zoom into an area the reserves that have been done in each
quaternary catchment and the level can be seen; Reserve Quality Class: Class 0 (Ideal) Class I
(Acceptable) Class II (Tolerable) Class III (Unacceptable).
Copyright: Department of Water & Sanitation
22
Figure 26: Groundwater reserve dashboard
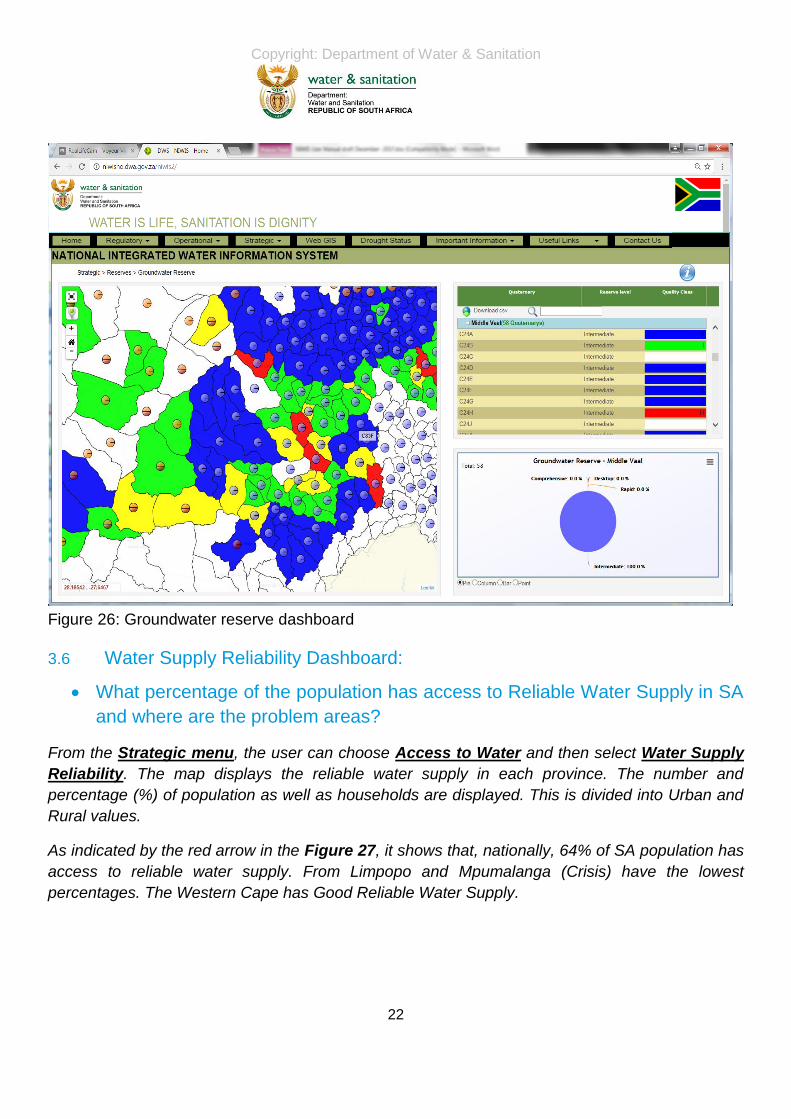
3.6 Water Supply Reliability Dashboard:
What percentage of the population has access to Reliable Water Supply in SA
and where are the problem areas?
From the Strategic menu, the user can choose Access to Water and then select Water Supply
Reliability. The map displays the reliable water supply in each province. The number and
percentage (%) of population as well as households are displayed. This is divided into Urban and
Rural values.
As indicated by the red arrow in the Figure 27, it shows that, nationally, 64% of SA population has
access to reliable water supply. From Limpopo and Mpumalanga (Crisis) have the lowest
percentages. The Western Cape has Good Reliable Water Supply.

Copyright: Department of Water & Sanitation
23
Figure 27: Water supply reliability
The user can also zoom into a province (Figure 28) with lowest percentages and view the
population and households numbers with access to reliable water supply values for each Local
Municipality. In this case, the Greater Sekhukhune District only 27% of the population has access
to reliable water supply.

Copyright: Department of Water & Sanitation
24
Figure 28: Water supply reliability
3.7 Drought Status Dashbpoard:
What is the Status of Drought in SA?
From the Menu, click drought status, the Dam Levels and Trends can be accessed by choosing
“access to current dam levels” which will navigate to the surface water status dashboard to look
at current dam level information. A chart showing monthly rainfall and dam storage levels can be
viewed as well as a chart showing dam storage levels.

Copyright: Department of Water & Sanitation
25
Figure 29: Drought dashboard

Copyright: Department of Water & Sanitation
26
Figure 30 shows that from the Rainfall Trend links, the National Annual Rainfall levels and
National Monthly cumulative Annual Rainfall chart can be viewed.
Figure 30: Drought dashboard

Copyright: Department of Water & Sanitation
27
4 Conclusion
This document aims to achieve the following; interaction of the system (Chapter One) and
the key questions that these information products aimed to answer (Chapter Two). However
the users should note that this manual will change as new information products are added
or when new feature are added in the existing dashis.