Embed Size (px)
Citation preview
National Legal Needs & Strategic
Planning Project:
Queensland
((((FINALFINALFINALFINAL))))
February 2012February 2012February 2012February 2012
This report has been prepared for
National Association of Community Legal Centres Inc. by
The Old Post Office 231 Princes Hwy, Bulli NSW 2516
Ph: 02 4283 7300
Fax: 02 4283 7399
www.judithstubbs.com.au
This Report has been prepared by:
Dr Judith Stubbs BSW UNSW PhD RMIT
Ms Colleen Lux BA MSc (Environmental Studies)
Mr Lewis Wilson BSc (Human Geography)
Disclaimer
© Judith Stubbs & Associates
All Rights Reserved. No part of this document may be reproduced, transmitted, stored in a retrieval system, or translated into any language in any form by any means without the written permission of Judith Stubbs & Associates.
Intellectual Property Rights
All Rights Reserved. All methods, processes, commercial proposals and other contents described in this document are the confidential intellectual property of Judith Stubbs & Associates and may not be used or disclosed to any party without the written permission of Judith Stubbs & Associates.
NACLC Legal Needs: Queensland i
Table of Contents
Executive Summary ............................................................................................. 1
QLD: Key Findings by Indicator of Legal Need .................................................................... 1
QLD: Key Findings by Calculated Legal Need & Probability of Legal Need........................... 3
QLD: Key Findings by Comparative Gap Analysis ............................................................... 3
1 Introduction ................................................................................................. 5
2 QLD: Key Indicators of Legal Need & Disadvantage ............................................. 6
2.1 LNAF Maps: QLD in the national context ................................................................. 6
2.2 LNAF Tables: QLD in the state context ..................................................................... 7
2.2.1 Queensland LGAs in 2010 .......................................................................................................... 8
2.3 Lone Parent .............................................................................................................. 9
2.3.1 Queensland: State Context .......................................................................................................... 9
2.3.2 Queensland & Brisbane: National Context .................................................................................. 9
2.4 Victim of Crime ...................................................................................................... 12
2.4.1 Queensland & Brisbane: State Context ...................................................................................... 12
2.5 Cohabiting with Children ........................................................................................ 15
2.5.1 Queensland: State Context ........................................................................................................ 15
2.5.2 Queensland & Brisbane: National Context ................................................................................ 15
2.6 Disability / Chronic Ill Health ................................................................................. 19
2.6.1 Queensland: State Context ........................................................................................................ 19
2.6.2 Queensland & Brisbane: National Context ................................................................................ 19
2.7 Indigenous .............................................................................................................. 22
2.7.1 Queensland: State Context ........................................................................................................ 22
2.7.2 Queensland & Brisbane: National Context ................................................................................ 22
2.8 On Benefits ............................................................................................................. 25
2.8.1 Queensland: State Context ........................................................................................................ 25
2.8.2 Queensland & Brisbane: National Context ................................................................................ 25
2.9 Social Renters ......................................................................................................... 28
2.9.1 Queensland: State Context ........................................................................................................ 28
2.9.2 Queensland & Brisbane: National Context ................................................................................ 28
2.10 Private Renters ........................................................................................................ 31
2.10.1 Queensland: State Context ........................................................................................................ 31
2.10.2 Queensland & Brisbane: National Context ................................................................................ 31
2.11 Age: 35-44 years ...................................................................................................... 34
2.11.1 Queensland: State Context ........................................................................................................ 34 2.11.2 Queensland & Brisbane: National Context ................................................................................ 34
2.12 Age: 25-34 years ...................................................................................................... 37
2.12.1 Queensland: State Context ........................................................................................................ 37
2.12.2 Queensland & Brisbane: National Context ................................................................................ 37
2.13 Age: 15-24 years ...................................................................................................... 40
2.13.1 Queensland: State Context ........................................................................................................ 40
2.13.2 Queensland & Brisbane: National Context ................................................................................ 40
2.14 Age: 45-54 years ...................................................................................................... 43
2.14.1 Queensland: State Context ........................................................................................................ 43
2.14.2 Queensland & Brisbane: National Context ................................................................................ 43
2.15 Ethnicity (born in a non-English speaking country) ................................................... 46
2.15.1 Queensland: State Context ........................................................................................................ 46
ii NACLC Legal Needs: Queensland
2.15.2 Queensland & Brisbane: National Context ................................................................................ 46
2.16 SEIFA Index of Disadvantage: national context ....................................................... 49
3 QLD: Calculated Legal Need & Disadvantage .....................................................52
3.1 QLD: Most Disadvantaged 40% of LGAs ................................................................ 55
3.2 QLD: Calculated Legal Need, National Context....................................................... 56
3.3 QLD: Probability of Legal Need, National Context .................................................. 59
4 QLD: National Need Ratio & Geographic Gap Analysis ........................................61
4.1 National CLC Need Ratio ....................................................................................... 61
4.2 Potential gaps in CLC coverage (catchment analysis) ................................................ 62
4.2.1 Need ratio – all Queensland LGAs ............................................................................................ 64
4.2.2 Need ratio in the context of high calculated legal need ............................................................... 68
Tables
Table 1: SEIFA Disadvantage State/Territory Decile Colour-Coding ........................................ 7
Table 2: Lone Parent, Top 20 LGAs in Queensland .................................................................. 9
Table 3: Crime Rate per 1,000 Population, Top 20 LGAs in Queensland ................................. 12
Table 4: Cohabiting with Children, Top 20 LGAs in Queensland ............................................ 15
Table 5: Rate DSP Recipients per 1,000 Adults, Top 20 LGAs in Queensland .......................... 19
Table 6: Indigenous, Top 20 LGAs in Queensland .................................................................. 22
Table 7: Rate On Benefits Recipients per 1,000 Adults, Top 20 LGAs in Queensland ............... 25
Table 8: Social Renters, Top 20 LGAs in Queensland ............................................................. 28
Table 9: Private Renters, Top 20 LGAs in Queensland ............................................................ 31
Table 10: Age 35-44 Years, Top 20 LGAs in Queensland ........................................................ 34
Table 11: Age 25-34 Years, Top 20 LGAs in Queensland ........................................................ 37
Table 12: Age 15-24 Years, Top 20 LGAs in Queensland ........................................................ 40
Table 13: Age 45-54 Years, Top 20 LGAs in Queensland ........................................................ 43
Table 14: Born in Non-English Speaking Country, Top 20 LGAs in Queensland ...................... 46
Table 15: Calculated Legal Need, Top 50 LGAs in Queensland ............................................... 53
Table 16: Probability of Legal Need, Top 50 LGAs in Queensland .......................................... 54
Table 17: Calculated Legal Need, Most Disadvantaged 40% of LGAs in Queensland ............... 55
Table 18: Probability of Legal Need, Most Disadvantaged 40% of LGAs in Queensland ........... 56
Table 4-1: Queensland legal need ratio gap analysis - summary table ........................................ 62
Table 4-2: Queensland LGAs with higher than average need ratio, by SEIFA Disadvantage ..... 64
NACLC Legal Needs: Queensland iii
Table 4-3: Queensland LGAs with lower than average need ratio, by SEIFA Disadvantage ...... 65
Table 4-4: Queensland LGAs, high calculated legal need, all need ratios .................................. 69
Figures
Figure 1: Representation of States/Territories among Disadvantaged LGAs in Australia ......... 49
Maps
Map 1: Lone Parent - Queensland .......................................................................................... 10
Map 2: Lone Parent – Brisbane SD ........................................................................................ 11
Map 3: Victim of Crime - Queensland ................................................................................... 13
Map 4: Victim of Crime – Brisbane SD ................................................................................... 14
Map 5: Cohabiting with Children - Queensland ...................................................................... 17
Map 6: Cohabiting with Children – Brisbane SD ..................................................................... 18
Map 7: Disability / Chronic Ill Health - Queensland ............................................................... 20
Map 8: Disability / Chronic Ill Health – Brisbane SD ............................................................. 21
Map 9: Indigenous - Queensland ............................................................................................ 23
Map 10: Indigenous – Brisbane SD ........................................................................................ 24
Map 11: On Benefits - Queensland ......................................................................................... 26
Map 12: On Benefits – Brisbane SD ........................................................................................ 27
Map 13: Social Renters - Queensland ..................................................................................... 29
Map 14: Social Renters – Brisbane SD .................................................................................... 30
Map 15: Private Renters - Queensland .................................................................................... 32
Map 16: Private Renters – Brisbane SD .................................................................................. 33
Map 17: Age 35-44 years - Queensland ................................................................................... 35
Map 18: Age 35-44 years – Brisbane SD ................................................................................. 36
Map 19: Age 25-34 years - Queensland ................................................................................... 38
Map 20: Age 25-34 years – Brisbane SD ................................................................................ 39
Map 21: Age 15-24 years - Queensland ................................................................................... 41
Map 22: Age 15-24 years, Brisbane SD ................................................................................... 42
Map 23: Age 45-54 years - Queensland ................................................................................... 44
Map 24: Age 45-54 years – Brisbane SD ................................................................................. 45
iv NACLC Legal Needs: Queensland
Map 25: Ethnicity - Queensland ............................................................................................. 47
Map 26: Ethnicity – Brisbane SD ........................................................................................... 48
Map 27: SEIFA Disadvantage - Queensland ........................................................................... 50
Map 28: SEIFA Disadvantage – Brisbane SD ......................................................................... 51
Map 29: Calculated Legal Need, National Context - Queensland ............................................. 57
Map 30: Calculated Legal Need, National Context – Brisbane SD ........................................... 58
Map 31: Probability of Legal Need, National Context - Queensland ........................................ 59
Map 32: Probability of Legal Need, National Context – Brisbane SD ....................................... 60
NACLC Legal Needs: Queensland 1
Executive Summary
In 2010, the National Association of Community Legal Centres Inc. (NACLC) engaged Judith
Stubbs and Associates (JSA) to provide a comprehensive evidence-based understanding of the
distribution of legal need across Australia and for each state and territory in the context of
disadvantage by applying elements of the Legal Needs and Strategic Planning Project, developed for
Community Legal Centres NSW by JSA in 2009.
This supplementary report focuses on Queensland (QLD) in order to provide useful and
applicable information for audiences who may be particularly interested in or focused on this
state. Readers are advised to refer to the Australia report for additional background information
about the study that is not repeated in this report.
This report provides a detailed presentation of the findings by Local Government Area (LGA)
across QLD for key analysis terms including the 13 key indicators of legal need, disadvantage,
calculated legal need and national CLC need ratio.
QLD: Key Findings by Indicator of Legal Need
This study explores legal need in the context of disadvantage across QLD using the Legal Needs
Assessment Framework (LNAF) developed by CLCNSW and JSA in 2009.1 The LNAF is a set
of indicators or characteristics of those most likely to experience legal need and the areas or
communities most likely to have a disproportionate level of people with these characteristics. The
LNAF highlights communities or areas most likely to experience both ‘met’ and ‘unmet’ legal
need. The following are the key findings when exploring the indicators of the LNAF and
disadvantage across the 74 LGAs in Queensland.
• Lone Parent: Queensland and Brisbane SD have rates of lone parent households that are
only slightly higher than the national average. However, there are many LGAs in the
state, particularly remote communities, with much higher rates than Australia.
• Victim of Crime: There are many rural and remote LGAs with crime rates that are many
times higher than the state average. Many of these communities are also highly
disadvantaged. Interestingly, the capital city of Brisbane LGA does not feature in the top
20 LGAs for the state.
• Cohabiting with Children: Queensland and Brisbane SD have slightly higher rates of
cohabiting with children than Australia. Many disadvantaged and remote Indigenous
communities have rates of cohabiting with children five to six times the national average.
1 In 2009, Community Legal Centres NSW (CLCNSW) and JSA conducted the Legal Needs and Strategic Planning
Project, which aimed to develop a model strategic planning process and tool to assist CLCs in NSW to better meet
legal needs within their communities.
2 NACLC Legal Needs: Queensland
• Disability / Chronic Ill Health: Compared to Australia, Queensland has a similar rate
of DSP recipients while Brisbane SD has a slightly lower rate. However, many of the
LGAs in the state with the highest rates of DSP recipients are small, remote Indigenous
communities. Other regional areas such as Fraser Coast, Gympie and South Burnett have
rates nearly twice the national average.
• Indigenous: Queensland is home to 28% of Australia’s Indigenous residents. The state
has a larger proportion of Indigenous residents than Australia, while Brisbane SD is
lower. Many LGAs in the state are small, remote Aboriginal communities – particularly
in the far north and far west of the state. Many of these areas are also among the most
disadvantaged LGAs in the state and nation.
• On Benefits: Both the Queensland and Brisbane SD rates for on benefits recipients are
lower than the national average. However, there are many LGAs in the state with rates
well above the national and more local benchmarks. There are many small, remote and
highly disadvantaged LGAs, but also larger LGAs with much lower levels of
disadvantage, that report high rates of on benefits recipients.
• Social Renters: Queensland and Brisbane SD have lower rates of social renters than
Australia. However, in many small Aboriginal Shires nearly all of the dwellings are social
rentals.
• Private Renters: Queensland and Brisbane SD have higher rates of private renters than
Australia. Many of the LGAs with the highest rates of private renters are along the coast,
with the state private renters map almost a mirror opposite to the social renters map.
• Age 35-44 years: Queensland and Brisbane SD have similar proportions of residents
aged 35 to 44 years to Australia.
• Age 25-34 years: Compared to Australia, Queensland has a similar proportion of
resident aged 25 to 34 while Brisbane SD has a slightly larger proportion. Gulf of
Carpentaria communities on the west coast of the Cape York Peninsula have the largest
proportions of resident in this age group.
• Age 15-24 years: In terms of proportion of residents aged 15 to 24 years, Queensland is
very similar to Australia while Brisbane SD has a slightly larger proportion likely due to
greater opportunities for young people to study and work. Many of the LGAs with high
proportions of young people are small, remote Aboriginal communities with a much
younger age profile than many other parts of the state.
• Age 45-54 years: Queensland and Brisbane SD have very similar proportions of residents
aged 45 to 54 as Australia.
• Ethnicity: Brisbane SD and particularly Queensland have much smaller proportions of
residents who were born in a non-English speaking country compared to Australia. Only
Brisbane LGA has a proportion slightly above the national average.
• Disadvantage: Compared with its proportion of total LGAs in Australia, Queensland
LGAs are overrepresented among the most disadvantaged 20% and 40% of LGAs in

NACLC Legal Needs: Queensland 3
Australia. The far north and far west of the state are some of the most disadvantaged
areas in the country.
QLD: Key Findings by Calculated Legal Need &
Probability of Legal Need
Calculated Legal Need refers to the total number of adults in a LGA likely to experience a legal
problem of any type over a three year period based on the results of a probability model that
combines and weights key indicators of legal need and other indicators. Probability of Legal
Need refers to the proportion of adults in an LGA likely to experience a legal problem of any type
in a three year period. It is important to remember that both Calculated Legal Need and
Probability of Legal Need reflect either the number or proportion of adults in an LGA likely to
experience any legal problem (including for example legal issues associated with buying and
selling property) and do not necessarily solely the types of legal problems that CLCs and other
community legal assistance services focus on. The following are the key findings when exploring
Calculated Legal Need and Probability of Legal Need across the 74 LGAs in Queensland.
• LGAs with the largest populations also have the highest numbers of adults likely to
experience a legal problem. Many of the large urban and regional LGAs (also some of the
least disadvantaged in the state) have the highest calculated legal need.
• Many of the LGAs with the highest probability of legal need, or proportion of adults
likely to experience a legal problem, are some of the most disadvantaged in the state and
nation, often with very small populations and low calculated legal need numbers
compared to the larger metropolitan and coastal areas.
• However, some of the larger LGAs such as Gold Coast, Cairns, Logan and Fraser Coast
have both high calculated and probability of legal need.
QLD: Key Findings by Comparative Gap Analysis
The comparative gap analysis employed in this study uses a National CLC Need Ratio in order
to determine the level of CLC servicing received by each LGA, relative to calculated legal need.
In developing this need ratio, the proportion of total national Calculated Legal Need was
compared with the proportion of actual CLC matters generated for each area over the three year
period 2008-2010. A detailed explanation of the methodology is provided at section 4-1 below,
and also at Appendix 1.
Three levels of analysis were conducted. The first stage of the analysis investigated the data for
comparative legal need and CLC servicing at the state level such that:

4 NACLC Legal Needs: Queensland
• LGAs with above average need ratios (receiving high levels of CLC servicing relative to
calculated legal need), representing 46.3% of the state’s likely legal need, received 61.9%
of the CLC services between 2008 and 2010.
• LGAs with below average need ratios (receiving low levels of CLC servicing relative to
calculated legal need), representing 34.2% of the state’s likely legal need, received 20.1%
of the CLC legal assistance over the same time period.
The second part of the analysis ranked each LGA high to low in terms of the CLC Need Ratio, in
order to determine which areas were receiving the highest and lowest levels of actual CLC
servicing relative to calculated legal need, irrespective of calculated legal need or socio-economic
disadvantage. This analysis yielded a number of key findings:
• Areas with the highest levels of CLC servicing relative to likely need were regional LGAs
in the state’s southeast including Maranoa, Rockhampton and Fraser Coast.
• Regions with the lowest levels of CLC servicing relative to likely legal need were northern
and far northern LGAs including Northern Peninsula Area, Torres Strait Island, Torres,
Doomadgee, Burke and McKinlay.
The third level of analysis involved identifying LGAs in receipt of relatively high or low levels of
CLC servicing in the context of high calculated legal need and SEIFA Socioeconomic
Disadvantage. Areas with a calculated legal need in excess of 5,000 adults likely to experience a
legal problem in a three year period were deemed to have high legal need. Particular areas
identified in this part of the analysis were as follows:
• The data suggests that LGAs with the highest levels of legal need are among the least
disadvantaged in Queensland.
• Gympie and South Burnett, both located in the state’s south east, were areas with high
calculated legal need that were also relatively disadvantaged (2nd SEIFA quintile).
• It is important to remember that many LGAs in Queensland (particularly the more
populated areas of the coast) are very large geographically and have large populations.
The relatively low level of disadvantage reported for many of these LGAs in comparison
to other parts of the state does not mean there are not ‘pockets’, suburbs or
neighbourhoods that are considerably disadvantaged within the LGA.
• There were a number of LGAs with a high calculated legal need and relatively low levels
of CLC servicing (based on matters generated to likely need), despite having direct access
to legal services through a CLC office located within the boundaries of the LGA. These
LGAs included: are Gold Coast, Sunshine Coast, Mackay and Southern Downs.
NACLC Legal Needs: Queensland 5
1 Introduction
In 2010, the National Association of Community Legal Centres Inc. (NACLC) engaged Judith
Stubbs and Associates (JSA) to apply elements of the Legal Needs and Strategic Planning Project,
developed for Community Legal Centres NSW by JSA in 2009, to the nation and to each state
and territory in Australia.
The application of this research at the national and state/territory levels will provide NACLC
with an evidence-based approach to understanding the distribution of legal need in the context of
disadvantage across the country for use in strategic planning for service delivery by individual
centres and the sector more generally.
This report focuses on Queensland (QLD) in order to provide useful and applicable information
for audiences who may be particularly interested in or focused on this state. Readers are advised
to refer to the Australia report for additional background information about the study that is not
repeated in this supplementary report.
This report provides a detailed presentation of the findings by Local Government Area (LGA)
across Queensland for key analysis terms including the 13 key indicators of legal need,
disadvantage, calculated legal need and national CLC need ratio:
• 13 key indicators of legal need are the socio-demographic groups with the greatest likelihood
of experiencing legal needs relevant to community legal assistance services.
• Disadvantage refers to the Australia Bureau of Statistics (ABS) Socio-Economic Index for
Areas (SEIFA) Index of Relative Disadvantage.
• Calculated legal need refers to results of a probability model that combines and weights key
indicators of legal need in order to calculate the total number of adults in a LGA likely to
experience a legal problem of any type over a three year period.
• National CLC need ratio refers to a method for comparing relative need for each LGA using
‘expressed need’ based on legal matters reported by CLCs from 2008-2010 compared with
calculated legal need (or the number of adults in a LGA likely to experience a legal
problem of any type over a three year period).
This report includes detailed mapping at the Queensland and Brisbane Statistical Division by
LGA. Readers are directed to Appendix 1 for a detailed description of the methodology used to
calculate each of the key indicators of legal need, calculated legal need and the national CLC
need ratio.
6 NACLC Legal Needs: Queensland
2 QLD: Key Indicators of Legal Need &
Disadvantage
This report provides detailed findings across the 74 Local Government Areas in Queensland
(based on 2010 ABS Geographic classification) for each of the key indicators of legal need in the
LNAF including:
• Lone parent*
• Victim of Crime
• Cohabiting with Children*
• Disability/Chronic Ill Health
• Indigenous*
• On Benefits
• Social Renter*
• Private Renter*
• Age: 35-44 years*
• Age: 25-34 years*
• Age: 15-24 years*
• Age: 45-54 years*
• Ethnicity/NESB*
Readers are referred to Appendices 6, 7 and 8 for electronic Microsoft Excel files with a series of
worksheets for Queensland for the key indicators of legal need, disadvantage, calculated legal
need, probability of legal need and national CLC need ratio by LGA based on 2010 geographic
boundaries and a selection of the key indicators of legal need by suburb based on 2006 geographic
boundaries.
*Data for these indicators is available at the finer geography of the suburb level in Appendix 7.
Readers interested in more detailed and localised planning and information are encouraged to
refer to this data. Suburb data is likely to be particularly useful for centres with catchment areas
that include LGAs that have very large populations and/or are the product of Council area
amalgamations.
2.1 LNAF Maps: QLD in the national context
Maps for each indicator show the state and capital city zoom in the national context. Colour
shading is by each ‘quintile’ or 20% of LGAs in Australia, with the darkest shading indicating the
20% of LGAs in Australia with the highest values of the respective indicator. Values for
NACLC Legal Needs: Queensland 7
neighbouring states are displayed in lighter shading for comparative context. Community legal
assistance services including Community Legal Centres (CLCs), Legal Aid, Aboriginal and
Torres Strait Islander Legal Services (ATSILS) and Family Violence Prevention Legal Services
(FVPLS) have also been identified. Refer to Appendices 2, 3, 4 and 5 for tables and maps
detailing the location of these services.
2.2 LNAF Tables: QLD in the state context
A table for each indicator of legal need is provided showing the top 20 LGAs in Queensland
sorted high to low. The full list of results for each indicator across the 74 LGAs in Queensland
and 564 LGAs in Australia is provided electronically in order to contain the size of this report, as
well as focus this discussion on those areas of the state with the highest levels of likely legal need.
Results have been further grouped by Socio-Economic Index for Areas: Index of Relative Socio-
Economic Disadvantage (SEIFA Disadvantage) to maintain a focus on the priority target group
for community legal assistance services.
The SEIFA Index of Relative Socio-Economic Disadvantage is derived from Australian Bureau of
Statistics (ABS) Census variables related to disadvantage, such as low income, low educational
attainment, unemployment, and dwellings without motor vehicles. SEIFA uses a broad definition
of relative socio-economic disadvantage in terms people's access to material and social resources,
and their ability to participate in society. Although disadvantage is not solely an indicator of legal
need, it is included in this study for reasons of access and equity, as residents of disadvantaged
areas are less likely to be able to pay for legal services, and are therefore target groups for CLCs.
The results tables for each indicator of legal need include the SEIFA score for each LGA as well
as its state decile 1 through 10 (SEIFA Decile STE) and national decile 1 through 10 (SEIFA
Decile AUS). Deciles are 10 bands, with 10% of all LGAs in the State or Australia in each band.
The most disadvantaged 10% of LGAs are in decile 1 and the least disadvantaged 10% of LGAs
are in decile 10. We are further colour-coded the SEIFA state deciles as follows:
Table 1: SEIFA Disadvantage State/Territory Decile Colour-Coding
Deciles 1 and 2, most disadvantaged 20% of LGAs
Deciles 3 and 4
Deciles 5 and 6
Deciles 7 and 8
Deciles 9 and 10, least disadvantaged 20% of LGAs
Source: JSA 2011
8 NACLC Legal Needs: Queensland
2.2.1 Queensland LGAs in 2010
It is important to point out prior to the presentation of results that Queensland includes a wide
variety of LGAs in terms of geographic and population size. In 2008, the Queensland
government amalgamated many Councils into much larger Regional Council areas. For
example, the Moreton Bay Regional Council is the amalgamation of three local government
areas while the Western Downs Regional Council based at Dalby is the amalgamation of six
different local government areas.
The change from 2006 to 2010 LGA boundaries means that there is a smaller number of LGAs,
some of which have very large populations (such as Moreton Bay at around 370,000 people). In
contrast, there remain many Council areas in rural and remote parts of the state (often Aboriginal
Shires) that have very small populations and geographic areas (such as Hope Vale at around 750
people). As a result, it is likely that many of large regional councils have areas of disadvantage or
legal need within them that may be masked by being a part of a much larger population – while
at the same time many of the small and remote LGAs stand out for their comparatively high
levels of disadvantage and legal need. Particularly, there is a level of detail lost at the Brisbane SD
level that is apparent when compared with the findings from other capital cities in some of the
other state reports. This is an unfortunately shortcoming for those readers interested in better
understanding the likely pockets of legal need and disadvantage in the wider Brisbane area.
NACLC Legal Needs: Queensland 9
2.3 Lone Parent
The concentration of ‘Lone Parent Households’ is one of the most important indicators of
experiencing legal need of any type as well as multiple legal problems in the UK studies.2
This group is more likely to experience a very high rate of legal problems associated with
Money/Debt, Welfare Payments, Housing (Tenancy, Homelessness), Family (all types) and
Domestic Violence compared with the population as a whole.
2.3.1 Queensland: State Context
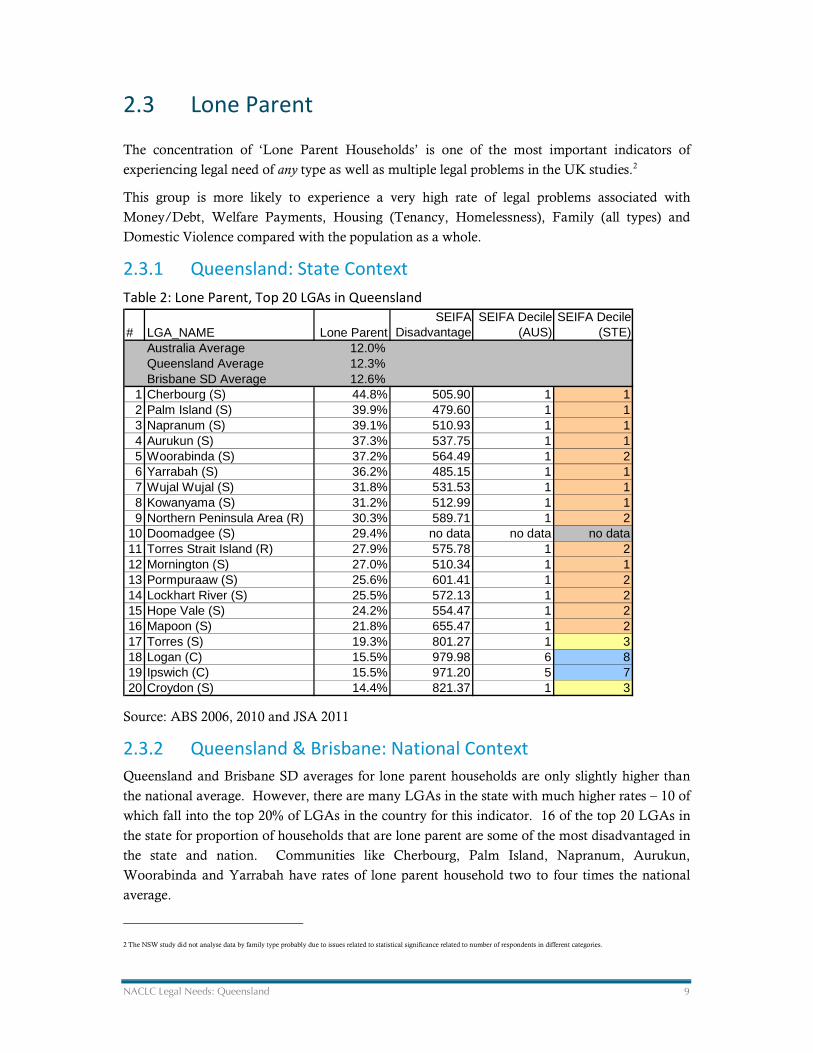
Table 2: Lone Parent, Top 20 LGAs in Queensland
Source: ABS 2006, 2010 and JSA 2011
2.3.2 Queensland & Brisbane: National Context
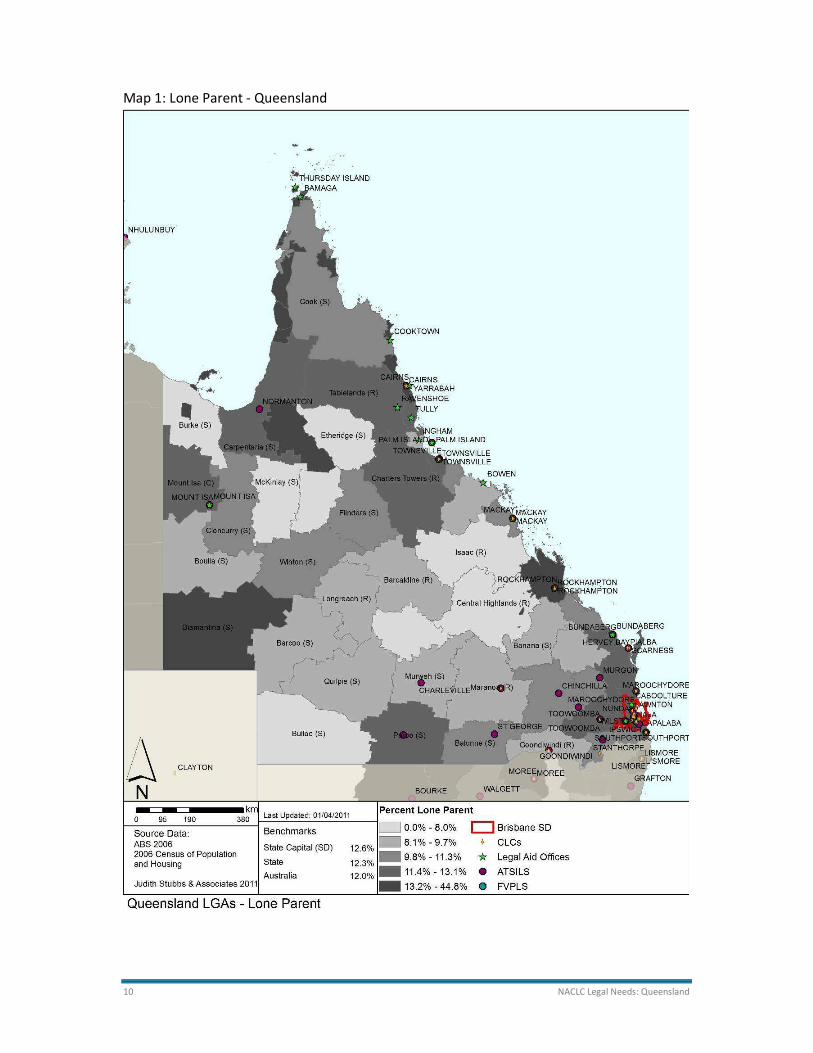
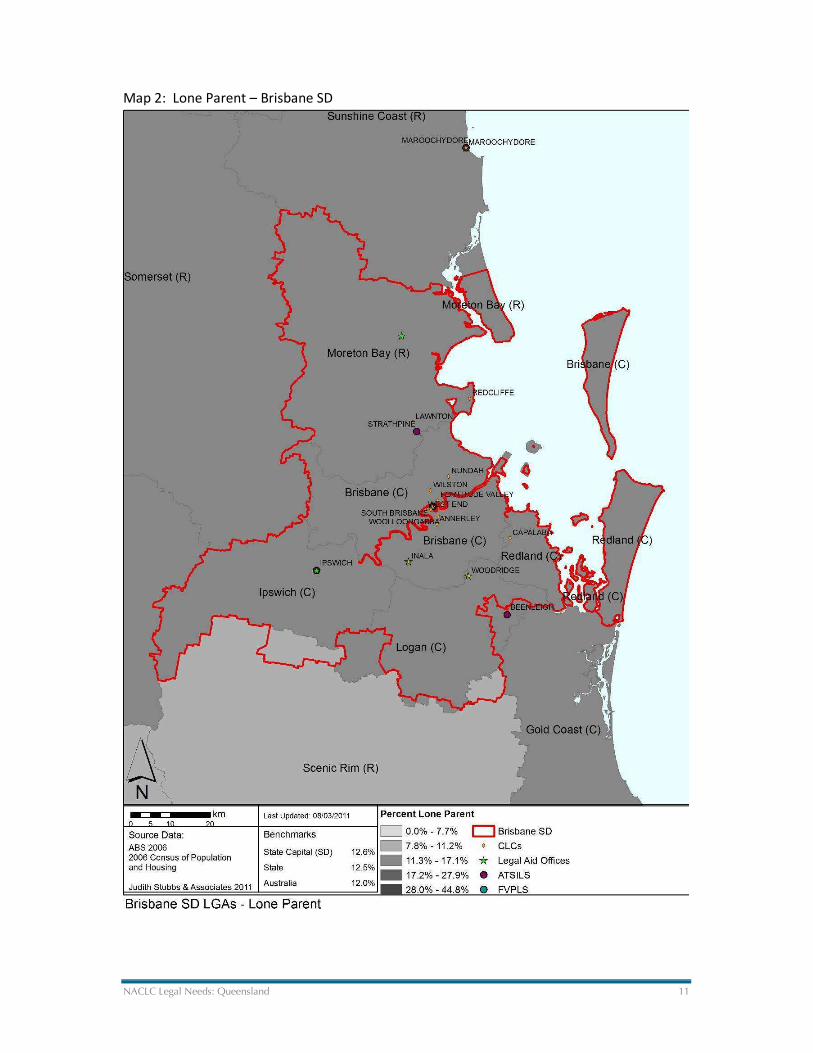
Queensland and Brisbane SD averages for lone parent households are only slightly higher than
the national average. However, there are many LGAs in the state with much higher rates – 10 of
which fall into the top 20% of LGAs in the country for this indicator. 16 of the top 20 LGAs in
the state for proportion of households that are lone parent are some of the most disadvantaged in
the state and nation. Communities like Cherbourg, Palm Island, Napranum, Aurukun,
Woorabinda and Yarrabah have rates of lone parent household two to four times the national
average.
2 The NSW study did not analyse data by family type probably due to issues related to statistical significance related to number of respondents in different categories.
# LGA_NAME Lone ParentSEIFA
DisadvantageSEIFA Decile
(AUS)SEIFA Decile
(STE)Australia Average 12.0%Queensland Average 12.3%Brisbane SD Average 12.6%
1 Cherbourg (S) 44.8% 505.90 1 12 Palm Island (S) 39.9% 479.60 1 13 Napranum (S) 39.1% 510.93 1 14 Aurukun (S) 37.3% 537.75 1 15 Woorabinda (S) 37.2% 564.49 1 26 Yarrabah (S) 36.2% 485.15 1 17 Wujal Wujal (S) 31.8% 531.53 1 18 Kowanyama (S) 31.2% 512.99 1 19 Northern Peninsula Area (R) 30.3% 589.71 1 2
10 Doomadgee (S) 29.4% no data no data no data11 Torres Strait Island (R) 27.9% 575.78 1 212 Mornington (S) 27.0% 510.34 1 113 Pormpuraaw (S) 25.6% 601.41 1 214 Lockhart River (S) 25.5% 572.13 1 215 Hope Vale (S) 24.2% 554.47 1 216 Mapoon (S) 21.8% 655.47 1 217 Torres (S) 19.3% 801.27 1 318 Logan (C) 15.5% 979.98 6 819 Ipswich (C) 15.5% 971.20 5 720 Croydon (S) 14.4% 821.37 1 3
10 NACLC Legal Needs: Queensland
Map 1: Lone Parent - Queensland
NACLC Legal Needs: Queensland 11
Map 2: Lone Parent – Brisbane SD
12 NACLC Legal Needs: Queensland
2.4 Victim of Crime
Being a ‘Victim of Crime’ is a strong predictor of legal problems generally, including multiple
problems. Victims of crime are also more likely to experience specific problems related to
Neighbours, Money/Debt, Housing (Tenancy), Unfair Police Treatment, Family Law
(Relationship Breakdown, Children Problems) and Domestic Violence.
2.4.1 Queensland & Brisbane: State Context
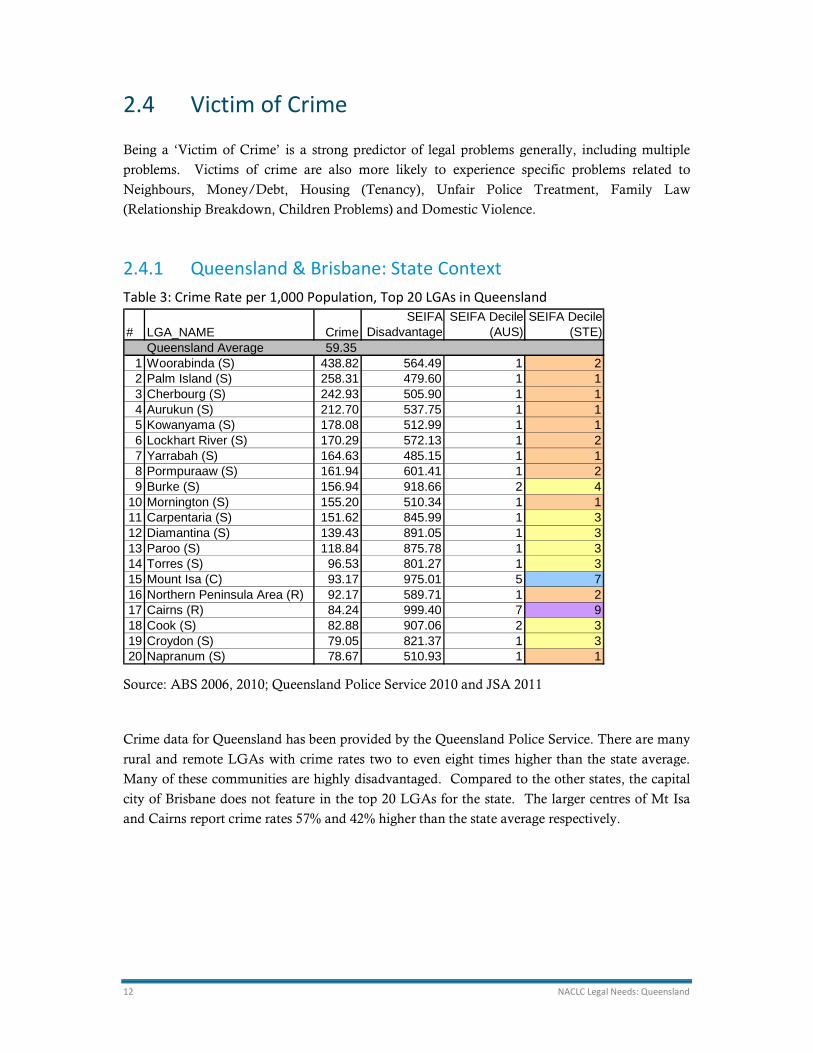
Table 3: Crime Rate per 1,000 Population, Top 20 LGAs in Queensland
Source: ABS 2006, 2010; Queensland Police Service 2010 and JSA 2011
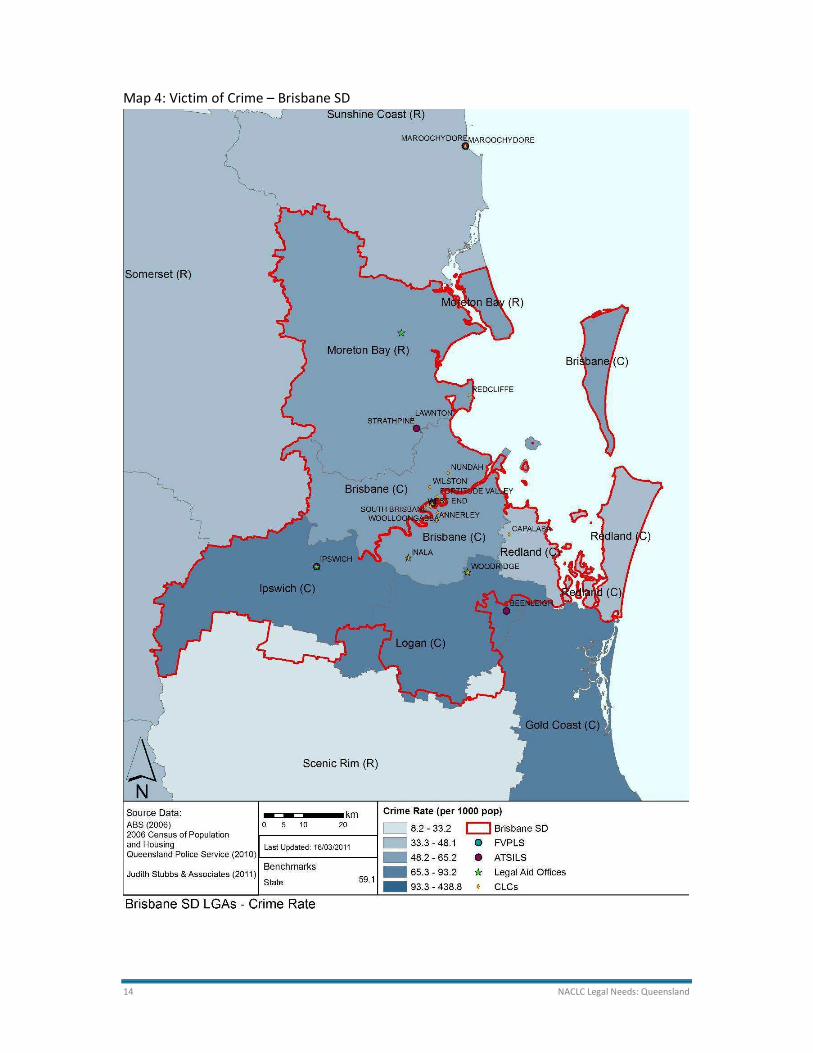
Crime data for Queensland has been provided by the Queensland Police Service. There are many
rural and remote LGAs with crime rates two to even eight times higher than the state average.
Many of these communities are highly disadvantaged. Compared to the other states, the capital
city of Brisbane does not feature in the top 20 LGAs for the state. The larger centres of Mt Isa
and Cairns report crime rates 57% and 42% higher than the state average respectively.
# LGA_NAME CrimeSEIFA
DisadvantageSEIFA Decile
(AUS)SEIFA Decile
(STE)Queensland Average 59.35
1 Woorabinda (S) 438.82 564.49 1 22 Palm Island (S) 258.31 479.60 1 13 Cherbourg (S) 242.93 505.90 1 14 Aurukun (S) 212.70 537.75 1 15 Kowanyama (S) 178.08 512.99 1 16 Lockhart River (S) 170.29 572.13 1 27 Yarrabah (S) 164.63 485.15 1 18 Pormpuraaw (S) 161.94 601.41 1 29 Burke (S) 156.94 918.66 2 4
10 Mornington (S) 155.20 510.34 1 111 Carpentaria (S) 151.62 845.99 1 312 Diamantina (S) 139.43 891.05 1 313 Paroo (S) 118.84 875.78 1 314 Torres (S) 96.53 801.27 1 315 Mount Isa (C) 93.17 975.01 5 716 Northern Peninsula Area (R) 92.17 589.71 1 217 Cairns (R) 84.24 999.40 7 918 Cook (S) 82.88 907.06 2 319 Croydon (S) 79.05 821.37 1 320 Napranum (S) 78.67 510.93 1 1

NACLC Legal Needs: Queensland 13
Map 3: Victim of Crime - Queensland
14 NACLC Legal Needs: Queensland
Map 4: Victim of Crime – Brisbane SD

NACLC Legal Needs: Queensland 15
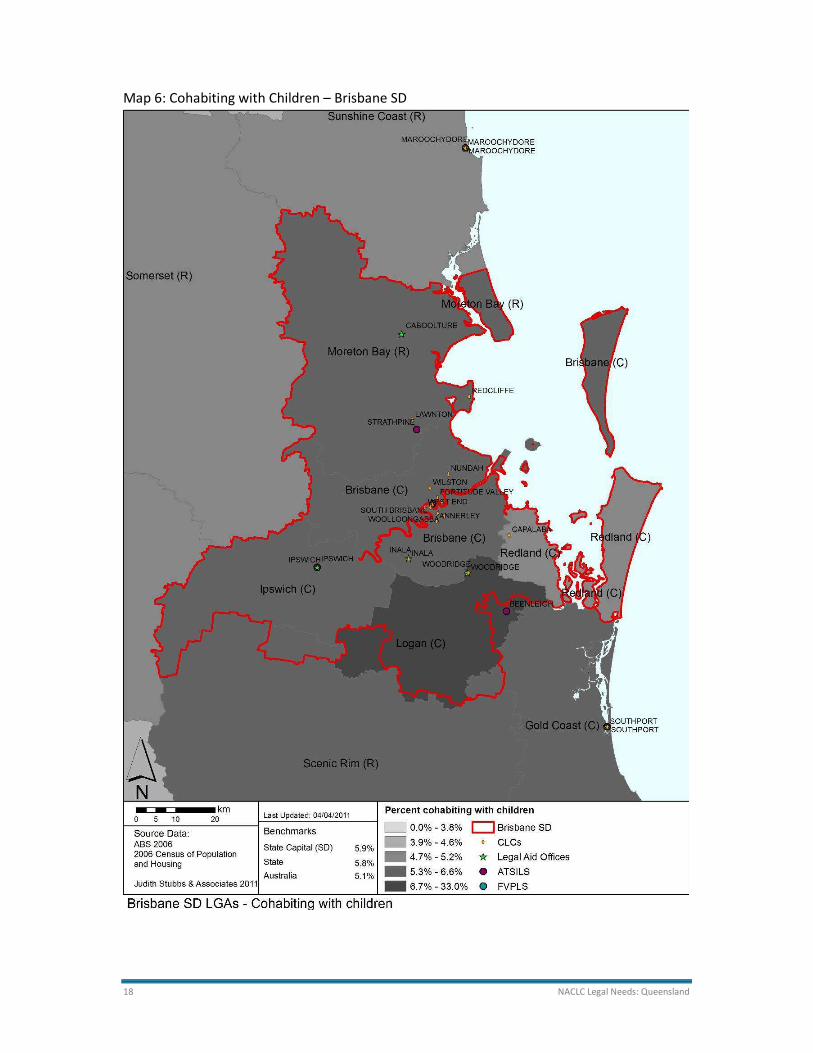
2.5 Cohabiting with Children
The concentration of those living in de facto relationships with children is an important indicator
of legal need from the UK studies for reporting any or multiple legal problems.3 The studies
indicate that those co-habiting with children may experience higher than average rates of legal
problems associated with Neighbours, Employment, Welfare Payments, Tenancy and Family
Law (all types).
2.5.1 Queensland: State Context
Table 4: Cohabiting with Children, Top 20 LGAs in Queensland
Source: ABS 2006, 2010 and JSA 2011
2.5.2 Queensland & Brisbane: National Context
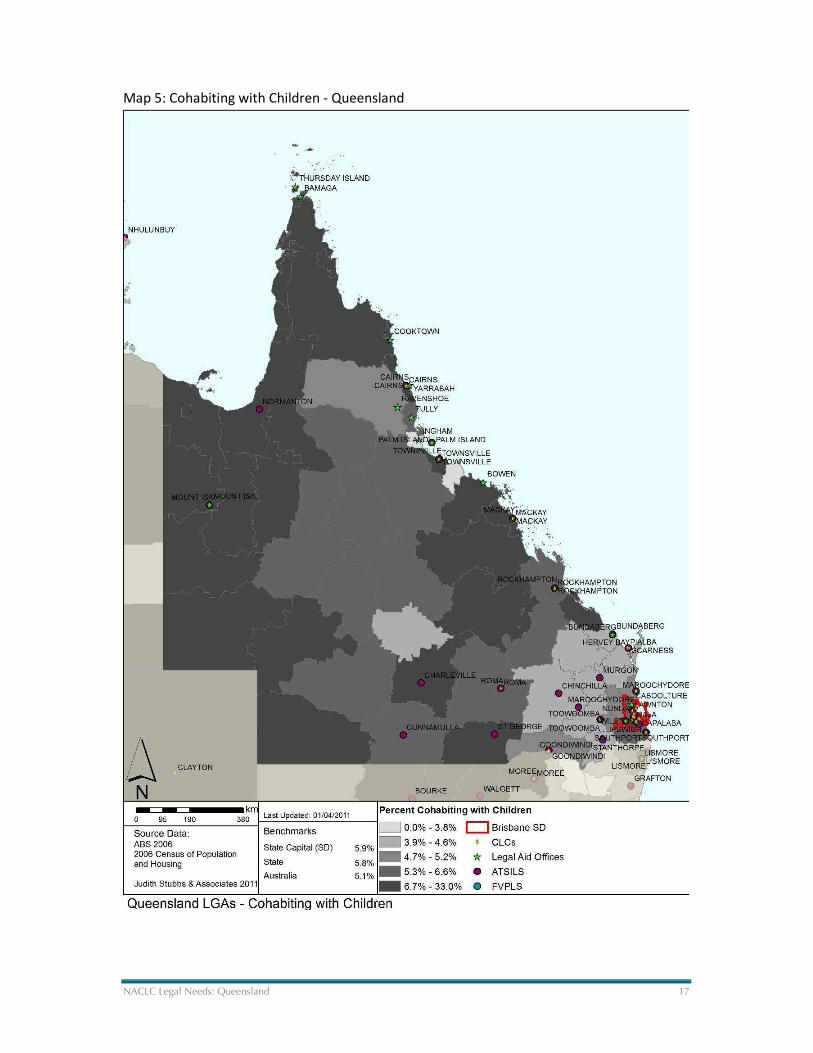
Queensland and Brisbane SD have slightly higher rates of cohabiting with children than
Australia. 58 out of the 74 LGAs in Queensland have a rate higher than the Australian average
for this indicator. Many disadvantaged and remote Indigenous communities such as Palm
Island, Aurukun and Lockhart River have rates of cohabiting with children five to six times the
national average. Based on ABS Census statistics for Australia, non-Indigenous people are much
more likely to report being in a registered marriage than Aboriginal and Torres Strait Islander
3 ‘Family type’ was not reported against in the NSW study, probably due to issues related to statistical significance related to number of respondents in different categories.
# LGA_NAMECohabiting
with ChildrenSEIFA
DisadvantageSEIFA Decile
(AUS)SEIFA Decile
(STE)Australia Average 5.1%Queensland Average 5.8%Brisbane SD Average 5.9%
1 Palm Island (S) 33.0% 479.60 1 12 Aurukun (S) 32.8% 537.75 1 13 Lockhart River (S) 31.2% 572.13 1 24 Wujal Wujal (S) 29.1% 531.53 1 15 Pormpuraaw (S) 28.9% 601.41 1 26 Mornington (S) 27.4% 510.34 1 17 Kowanyama (S) 27.3% 512.99 1 18 Doomadgee (S) 26.0% no data no data no data9 Hope Vale (S) 25.1% 554.47 1 2
10 Napranum (S) 24.9% 510.93 1 111 Woorabinda (S) 22.9% 564.49 1 212 Yarrabah (S) 22.2% 485.15 1 113 Northern Peninsula Area (R) 22.1% 589.71 1 214 Cherbourg (S) 20.7% 505.90 1 115 Torres Strait Island (R) 20.0% 575.78 1 216 Mapoon (S) 18.6% 655.47 1 217 Torres (S) 17.0% 801.27 1 318 Croydon (S) 16.0% 821.37 1 319 Weipa (T) 14.3% 1048.88 9 1020 Boulia (S) 12.0% 871.43 1 3

16 NACLC Legal Needs: Queensland
people (38% compared to 13%). However, the rate of reporting being in a De Facto relationship
is only slightly higher for Indigenous people compared to non-Indigenous people (8.6% compared
to 6.5%). It would appear that this type of living arrangement is very common amongst families
in rural/remote communities in Queensland.
NACLC Legal Needs: Queensland 17
Map 5: Cohabiting with Children - Queensland
18 NACLC Legal Needs: Queensland
Map 6: Cohabiting with Children – Brisbane SD

NACLC Legal Needs: Queensland 19
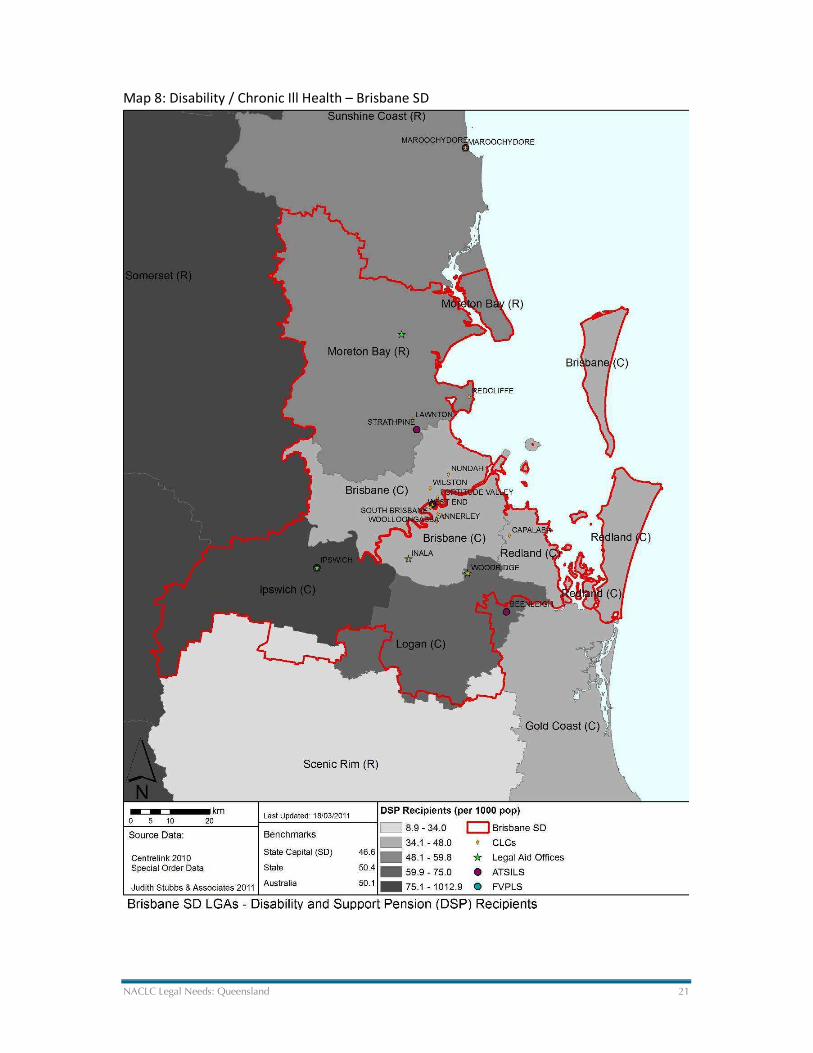
2.6 Disability / Chronic Ill Health
‘Disability’ is strongly aligned with areas that have a high level of overall disadvantage, when
measured as concentration of Centrelink Disability Support Pension (DSP) recipients. The types
of legal problems most associated with this indicator are Money/Debt, Employment,
Discrimination/Human Rights and General Crime.
2.6.1 Queensland: State Context
Table 5: Rate DSP Recipients per 1,000 Adults, Top 20 LGAs in Queensland
Source: ABS 2006, 2010; Centrelink 2010 and JSA 2011
2.6.2 Queensland & Brisbane: National Context
Queensland has approximately the same rate of DSP recipients per 1,000 population while
Brisbane SD has a slightly lower rate. However, 36 of the 74 LGAs in Queensland have rates of
DSP recipients above the national average. In addition, 15 out of the top 20 LGAs in
Queensland for this indicator are in the top 20% of all LGAs in Australia.
There are many small, remote Indigenous communities such as Wujal Wujal, Hope Vale and
Cherbourg with very high rates of DSP recipients – two to three times the national average.
There are also many regional areas such as Fraser Coast, Gympie and South Burnett (main town
Kingaroy) that have rates of DSP recipients at nearly twice the national average.
# LGA_NAME DSPSEIFA
DisadvantageSEIFA Decile
(AUS)SEIFA Decile
(STE)Australia Average 50.10Queensland Average 50.40Brisbane SD Average 46.60
1 Wujal Wujal (S) 120.64 531.53 1 12 Hope Vale (S) 107.64 554.47 1 23 Cherbourg (S) 104.59 505.90 1 14 Fraser Coast (R) 100.83 942.41 3 45 Gympie (R) 98.55 943.02 3 46 South Burnett (R) 95.78 940.32 3 47 Cook (S) 94.22 907.06 2 38 Woorabinda (S) 92.18 564.49 1 29 Somerset (R) 91.40 954.80 4 5
10 Bundaberg (R) 89.44 944.41 3 511 Ipswich (C) 85.18 971.20 5 712 Lockyer Valley (R) 83.33 961.55 4 613 Southern Downs (R) 78.30 949.53 3 514 Palm Island (S) 76.70 479.60 1 115 Yarrabah (S) 76.47 485.15 1 116 Aurukun (S) 74.66 537.75 1 117 Lockhart River (S) 74.52 572.13 1 218 Western Downs (R) 69.99 967.30 5 719 Logan (C) 69.88 979.98 6 820 North Burnett (R) 69.55 930.64 2 4

20 NACLC Legal Needs: Queensland
Map 7: Disability / Chronic Ill Health - Queensland
NACLC Legal Needs: Queensland 21
Map 8: Disability / Chronic Ill Health – Brisbane SD
22 NACLC Legal Needs: Queensland
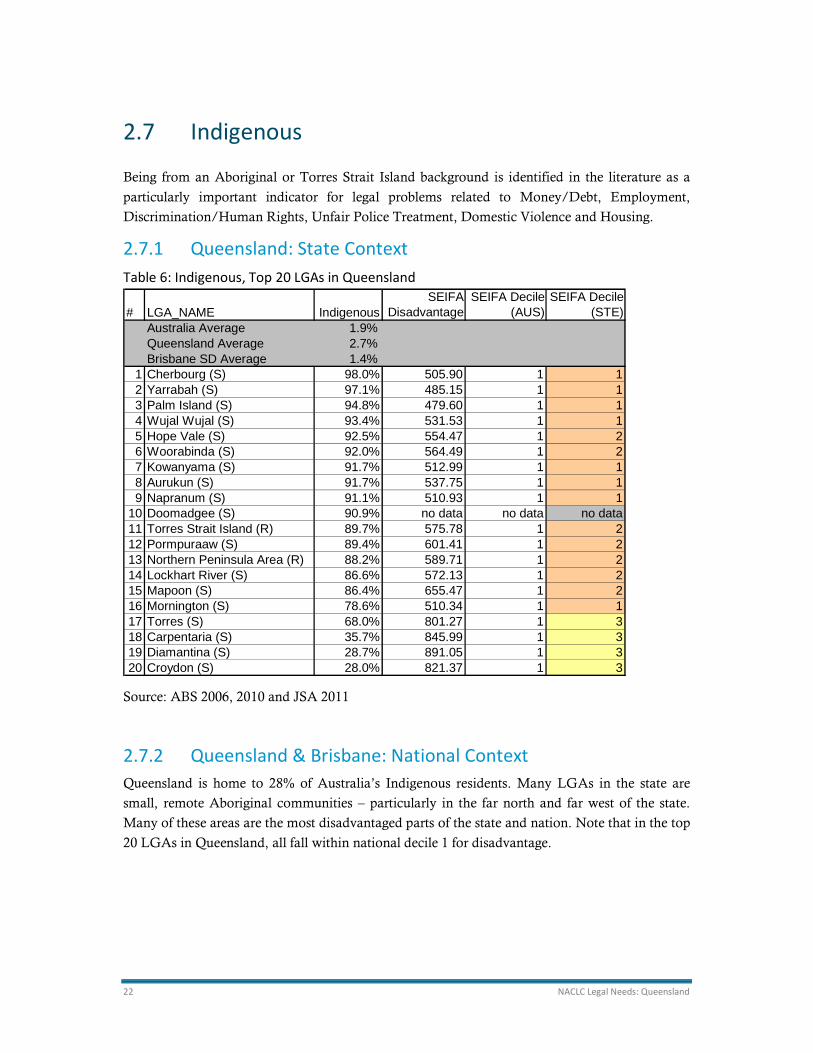
2.7 Indigenous
Being from an Aboriginal or Torres Strait Island background is identified in the literature as a
particularly important indicator for legal problems related to Money/Debt, Employment,
Discrimination/Human Rights, Unfair Police Treatment, Domestic Violence and Housing.
2.7.1 Queensland: State Context
Table 6: Indigenous, Top 20 LGAs in Queensland
Source: ABS 2006, 2010 and JSA 2011
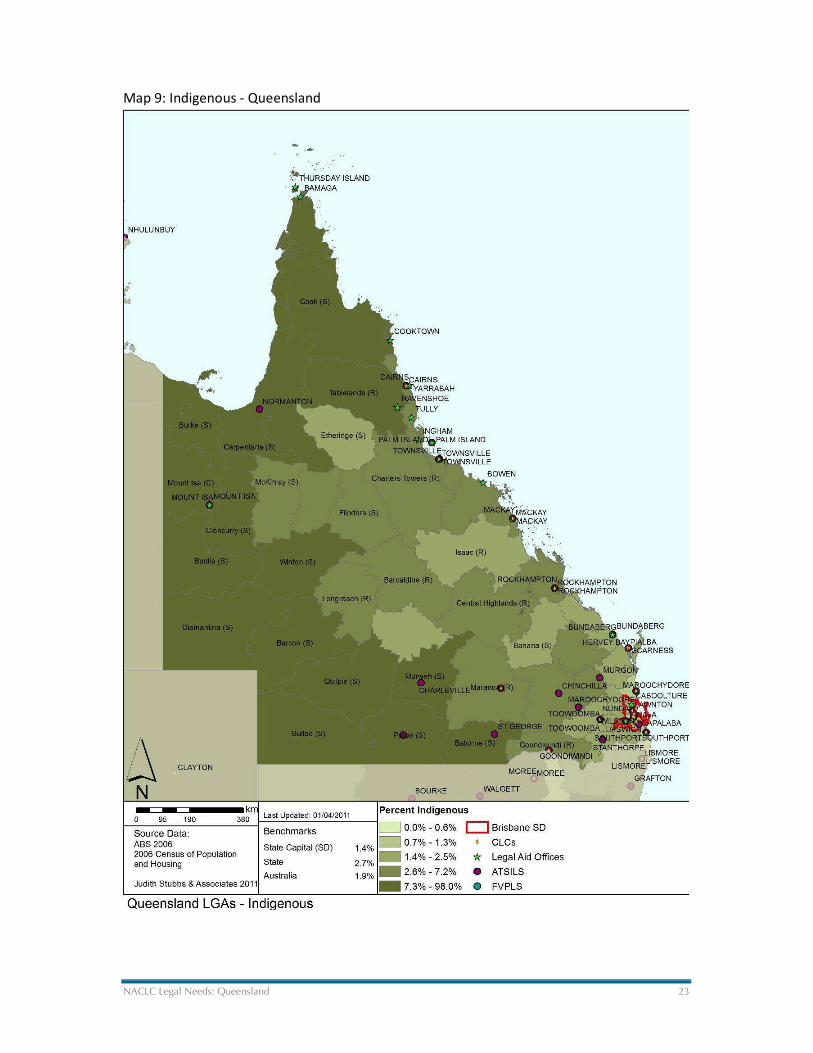
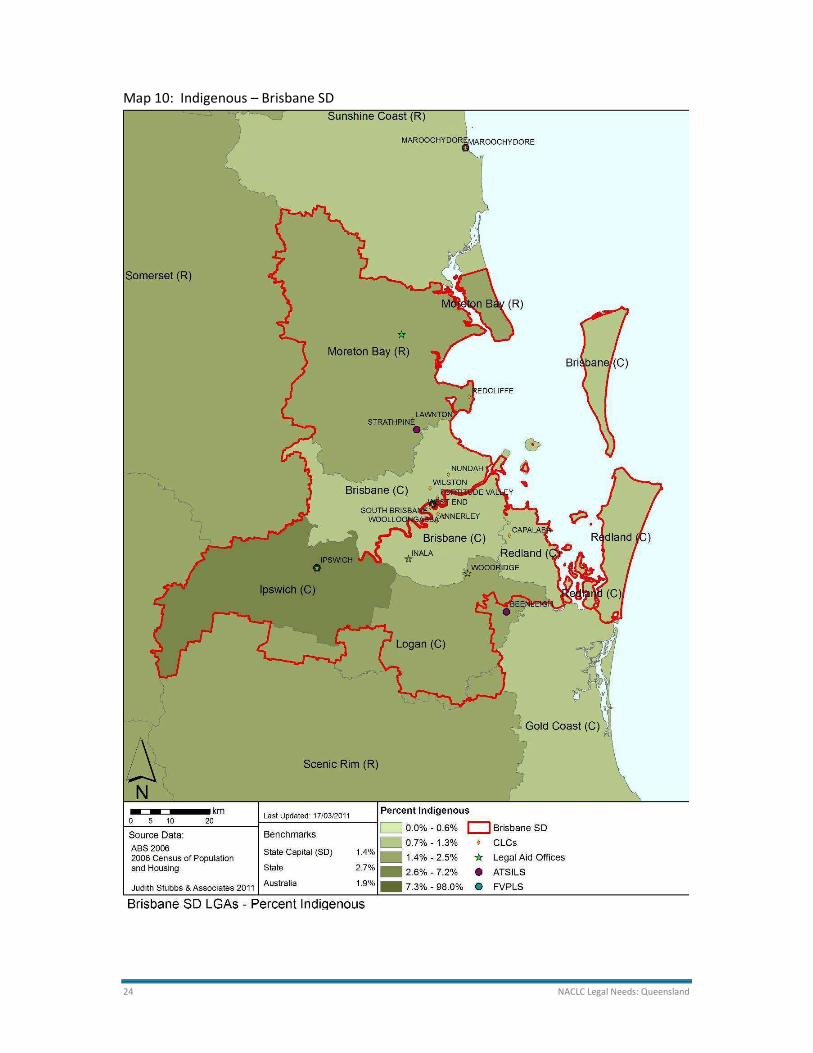
2.7.2 Queensland & Brisbane: National Context
Queensland is home to 28% of Australia’s Indigenous residents. Many LGAs in the state are
small, remote Aboriginal communities – particularly in the far north and far west of the state.
Many of these areas are the most disadvantaged parts of the state and nation. Note that in the top
20 LGAs in Queensland, all fall within national decile 1 for disadvantage.
# LGA_NAME IndigenousSEIFA
DisadvantageSEIFA Decile
(AUS)SEIFA Decile
(STE)Australia Average 1.9%Queensland Average 2.7%Brisbane SD Average 1.4%
1 Cherbourg (S) 98.0% 505.90 1 12 Yarrabah (S) 97.1% 485.15 1 13 Palm Island (S) 94.8% 479.60 1 14 Wujal Wujal (S) 93.4% 531.53 1 15 Hope Vale (S) 92.5% 554.47 1 26 Woorabinda (S) 92.0% 564.49 1 27 Kowanyama (S) 91.7% 512.99 1 18 Aurukun (S) 91.7% 537.75 1 19 Napranum (S) 91.1% 510.93 1 1
10 Doomadgee (S) 90.9% no data no data no data11 Torres Strait Island (R) 89.7% 575.78 1 212 Pormpuraaw (S) 89.4% 601.41 1 213 Northern Peninsula Area (R) 88.2% 589.71 1 214 Lockhart River (S) 86.6% 572.13 1 215 Mapoon (S) 86.4% 655.47 1 216 Mornington (S) 78.6% 510.34 1 117 Torres (S) 68.0% 801.27 1 318 Carpentaria (S) 35.7% 845.99 1 319 Diamantina (S) 28.7% 891.05 1 320 Croydon (S) 28.0% 821.37 1 3
NACLC Legal Needs: Queensland 23
Map 9: Indigenous - Queensland
24 NACLC Legal Needs: Queensland
Map 10: Indigenous – Brisbane SD
NACLC Legal Needs: Queensland 25
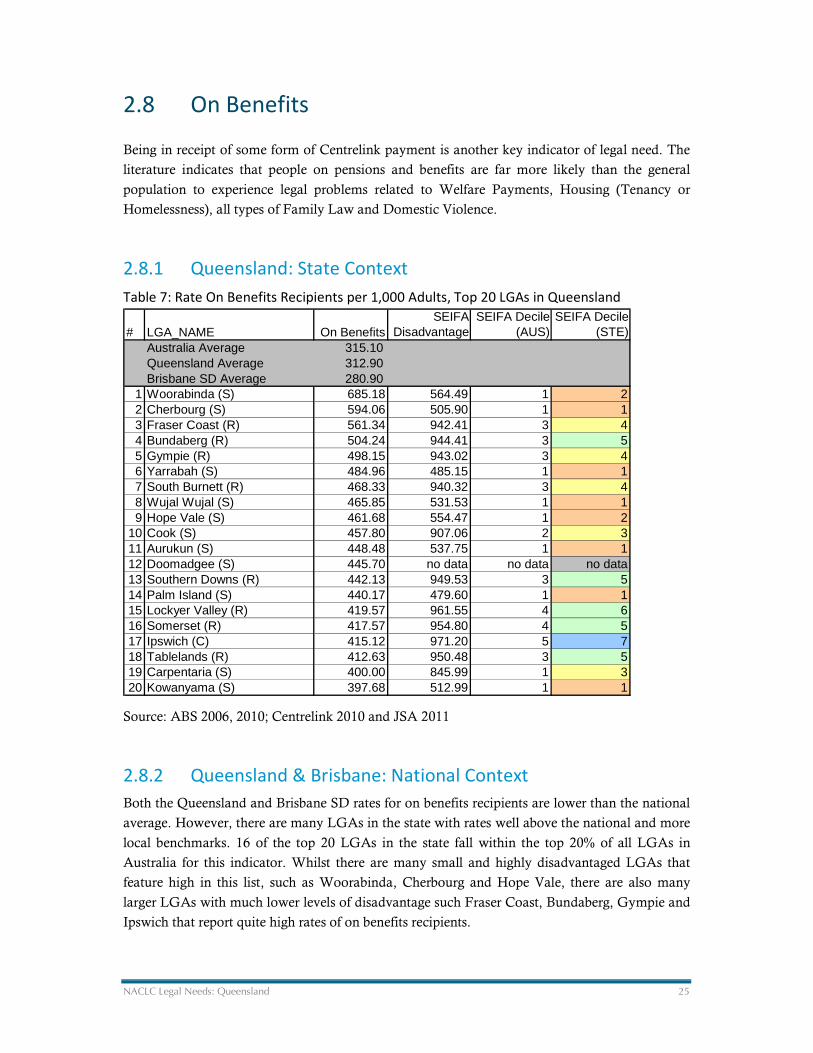
2.8 On Benefits
Being in receipt of some form of Centrelink payment is another key indicator of legal need. The
literature indicates that people on pensions and benefits are far more likely than the general
population to experience legal problems related to Welfare Payments, Housing (Tenancy or
Homelessness), all types of Family Law and Domestic Violence.
2.8.1 Queensland: State Context
Table 7: Rate On Benefits Recipients per 1,000 Adults, Top 20 LGAs in Queensland
Source: ABS 2006, 2010; Centrelink 2010 and JSA 2011
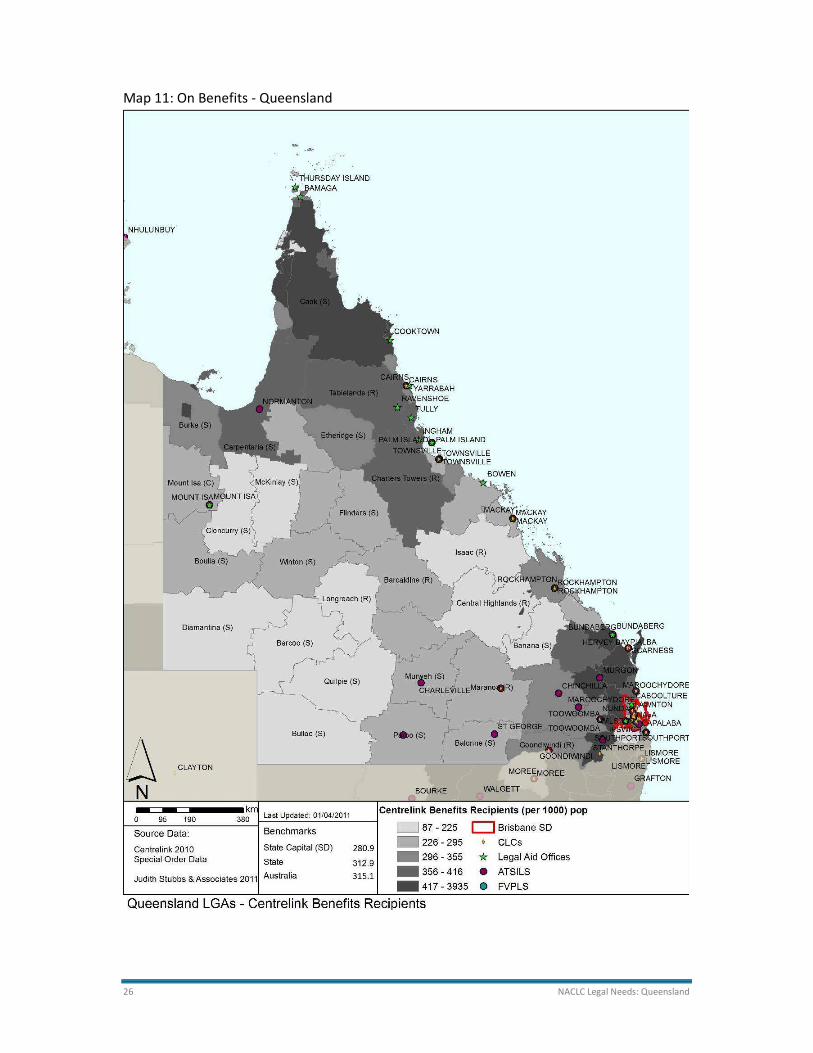
2.8.2 Queensland & Brisbane: National Context
Both the Queensland and Brisbane SD rates for on benefits recipients are lower than the national
average. However, there are many LGAs in the state with rates well above the national and more
local benchmarks. 16 of the top 20 LGAs in the state fall within the top 20% of all LGAs in
Australia for this indicator. Whilst there are many small and highly disadvantaged LGAs that
feature high in this list, such as Woorabinda, Cherbourg and Hope Vale, there are also many
larger LGAs with much lower levels of disadvantage such Fraser Coast, Bundaberg, Gympie and
Ipswich that report quite high rates of on benefits recipients.
# LGA_NAME On BenefitsSEIFA
DisadvantageSEIFA Decile
(AUS)SEIFA Decile
(STE)Australia Average 315.10Queensland Average 312.90Brisbane SD Average 280.90
1 Woorabinda (S) 685.18 564.49 1 22 Cherbourg (S) 594.06 505.90 1 13 Fraser Coast (R) 561.34 942.41 3 44 Bundaberg (R) 504.24 944.41 3 55 Gympie (R) 498.15 943.02 3 46 Yarrabah (S) 484.96 485.15 1 17 South Burnett (R) 468.33 940.32 3 48 Wujal Wujal (S) 465.85 531.53 1 19 Hope Vale (S) 461.68 554.47 1 2
10 Cook (S) 457.80 907.06 2 311 Aurukun (S) 448.48 537.75 1 112 Doomadgee (S) 445.70 no data no data no data13 Southern Downs (R) 442.13 949.53 3 514 Palm Island (S) 440.17 479.60 1 115 Lockyer Valley (R) 419.57 961.55 4 616 Somerset (R) 417.57 954.80 4 517 Ipswich (C) 415.12 971.20 5 718 Tablelands (R) 412.63 950.48 3 519 Carpentaria (S) 400.00 845.99 1 320 Kowanyama (S) 397.68 512.99 1 1
26 NACLC Legal Needs: Queensland
Map 11: On Benefits - Queensland

NACLC Legal Needs: Queensland 27
Map 12: On Benefits – Brisbane SD
28 NACLC Legal Needs: Queensland
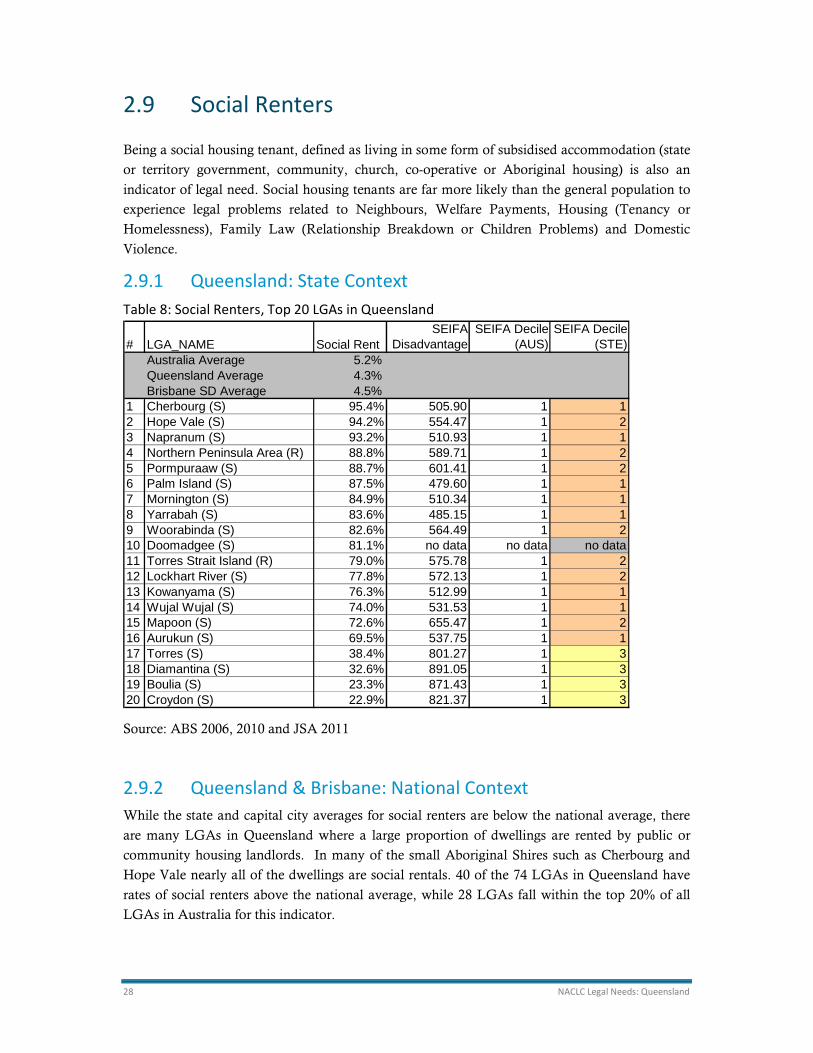
2.9 Social Renters
Being a social housing tenant, defined as living in some form of subsidised accommodation (state
or territory government, community, church, co-operative or Aboriginal housing) is also an
indicator of legal need. Social housing tenants are far more likely than the general population to
experience legal problems related to Neighbours, Welfare Payments, Housing (Tenancy or
Homelessness), Family Law (Relationship Breakdown or Children Problems) and Domestic
Violence.
2.9.1 Queensland: State Context
Table 8: Social Renters, Top 20 LGAs in Queensland
Source: ABS 2006, 2010 and JSA 2011
2.9.2 Queensland & Brisbane: National Context
While the state and capital city averages for social renters are below the national average, there
are many LGAs in Queensland where a large proportion of dwellings are rented by public or
community housing landlords. In many of the small Aboriginal Shires such as Cherbourg and
Hope Vale nearly all of the dwellings are social rentals. 40 of the 74 LGAs in Queensland have
rates of social renters above the national average, while 28 LGAs fall within the top 20% of all
LGAs in Australia for this indicator.
# LGA_NAME Social RentSEIFA
DisadvantageSEIFA Decile
(AUS)SEIFA Decile
(STE)Australia Average 5.2%Queensland Average 4.3%Brisbane SD Average 4.5%
1 Cherbourg (S) 95.4% 505.90 1 12 Hope Vale (S) 94.2% 554.47 1 23 Napranum (S) 93.2% 510.93 1 14 Northern Peninsula Area (R) 88.8% 589.71 1 25 Pormpuraaw (S) 88.7% 601.41 1 26 Palm Island (S) 87.5% 479.60 1 17 Mornington (S) 84.9% 510.34 1 18 Yarrabah (S) 83.6% 485.15 1 19 Woorabinda (S) 82.6% 564.49 1 210 Doomadgee (S) 81.1% no data no data no data11 Torres Strait Island (R) 79.0% 575.78 1 212 Lockhart River (S) 77.8% 572.13 1 213 Kowanyama (S) 76.3% 512.99 1 114 Wujal Wujal (S) 74.0% 531.53 1 115 Mapoon (S) 72.6% 655.47 1 216 Aurukun (S) 69.5% 537.75 1 117 Torres (S) 38.4% 801.27 1 318 Diamantina (S) 32.6% 891.05 1 319 Boulia (S) 23.3% 871.43 1 320 Croydon (S) 22.9% 821.37 1 3

NACLC Legal Needs: Queensland 29
Map 13: Social Renters - Queensland
30 NACLC Legal Needs: Queensland
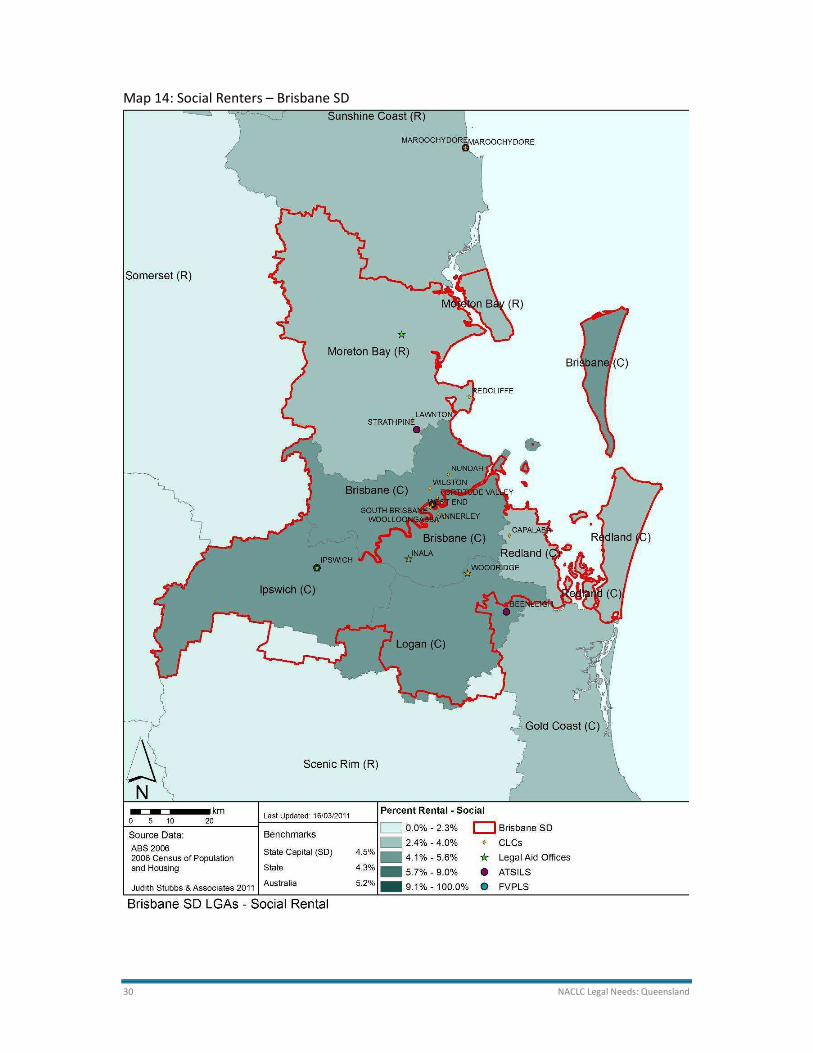
Map 14: Social Renters – Brisbane SD
NACLC Legal Needs: Queensland 31
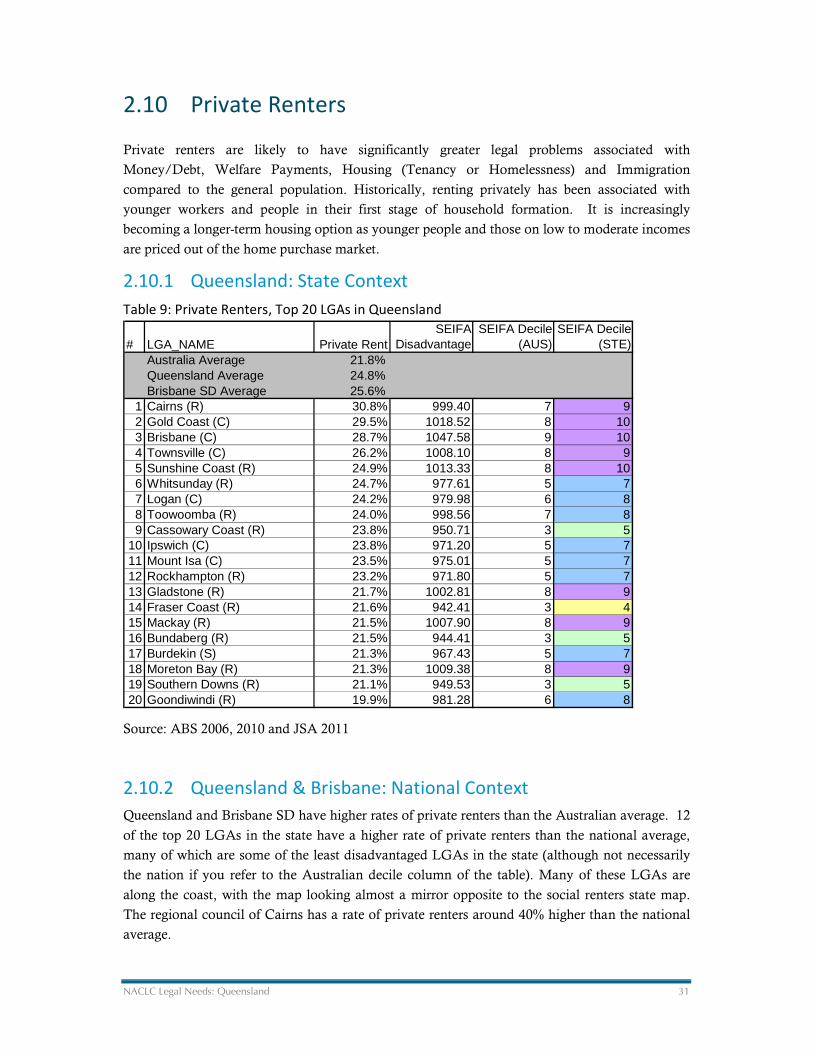
2.10 Private Renters
Private renters are likely to have significantly greater legal problems associated with
Money/Debt, Welfare Payments, Housing (Tenancy or Homelessness) and Immigration
compared to the general population. Historically, renting privately has been associated with
younger workers and people in their first stage of household formation. It is increasingly
becoming a longer-term housing option as younger people and those on low to moderate incomes
are priced out of the home purchase market.
2.10.1 Queensland: State Context
Table 9: Private Renters, Top 20 LGAs in Queensland
Source: ABS 2006, 2010 and JSA 2011
2.10.2 Queensland & Brisbane: National Context
Queensland and Brisbane SD have higher rates of private renters than the Australian average. 12
of the top 20 LGAs in the state have a higher rate of private renters than the national average,
many of which are some of the least disadvantaged LGAs in the state (although not necessarily
the nation if you refer to the Australian decile column of the table). Many of these LGAs are
along the coast, with the map looking almost a mirror opposite to the social renters state map.
The regional council of Cairns has a rate of private renters around 40% higher than the national
average.
# LGA_NAME Private RentSEIFA
DisadvantageSEIFA Decile
(AUS)SEIFA Decile
(STE)Australia Average 21.8%Queensland Average 24.8%Brisbane SD Average 25.6%
1 Cairns (R) 30.8% 999.40 7 92 Gold Coast (C) 29.5% 1018.52 8 103 Brisbane (C) 28.7% 1047.58 9 104 Townsville (C) 26.2% 1008.10 8 95 Sunshine Coast (R) 24.9% 1013.33 8 106 Whitsunday (R) 24.7% 977.61 5 77 Logan (C) 24.2% 979.98 6 88 Toowoomba (R) 24.0% 998.56 7 89 Cassowary Coast (R) 23.8% 950.71 3 5
10 Ipswich (C) 23.8% 971.20 5 711 Mount Isa (C) 23.5% 975.01 5 712 Rockhampton (R) 23.2% 971.80 5 713 Gladstone (R) 21.7% 1002.81 8 914 Fraser Coast (R) 21.6% 942.41 3 415 Mackay (R) 21.5% 1007.90 8 916 Bundaberg (R) 21.5% 944.41 3 517 Burdekin (S) 21.3% 967.43 5 718 Moreton Bay (R) 21.3% 1009.38 8 919 Southern Downs (R) 21.1% 949.53 3 520 Goondiwindi (R) 19.9% 981.28 6 8

32 NACLC Legal Needs: Queensland
Map 15: Private Renters - Queensland

NACLC Legal Needs: Queensland 33
Map 16: Private Renters – Brisbane SD
34 NACLC Legal Needs: Queensland
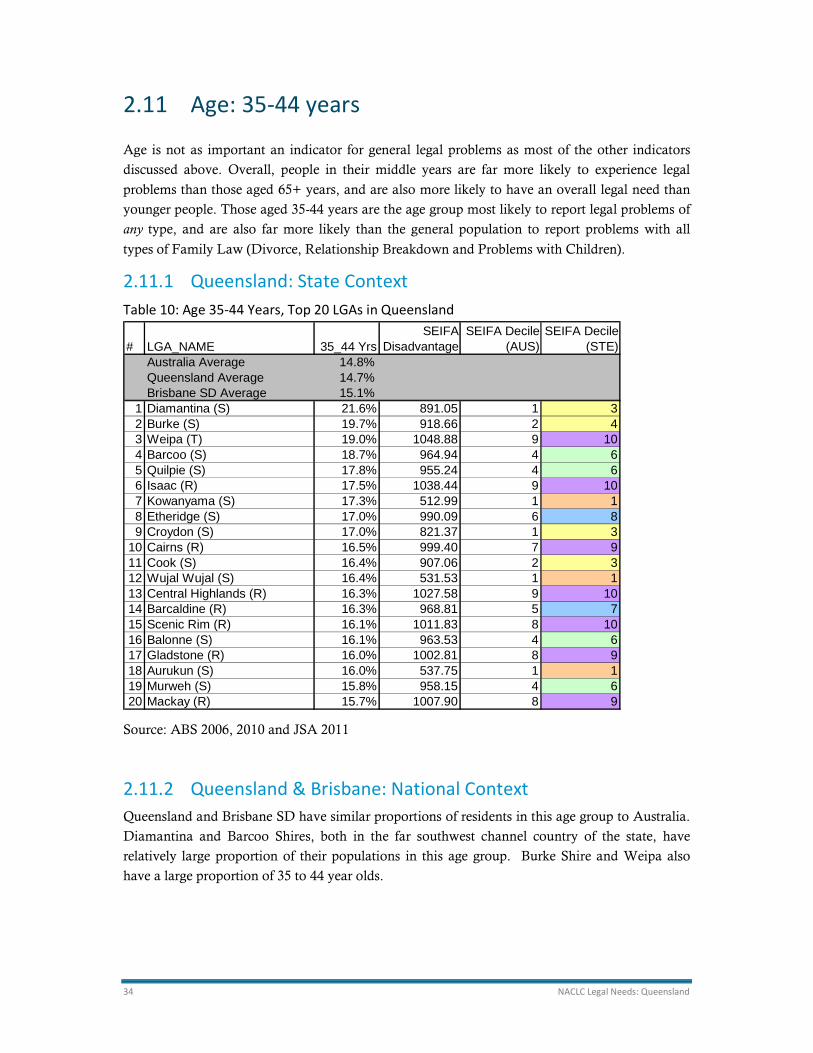
2.11 Age: 35-44 years
Age is not as important an indicator for general legal problems as most of the other indicators
discussed above. Overall, people in their middle years are far more likely to experience legal
problems than those aged 65+ years, and are also more likely to have an overall legal need than
younger people. Those aged 35-44 years are the age group most likely to report legal problems of
any type, and are also far more likely than the general population to report problems with all
types of Family Law (Divorce, Relationship Breakdown and Problems with Children).
2.11.1 Queensland: State Context
Table 10: Age 35-44 Years, Top 20 LGAs in Queensland
Source: ABS 2006, 2010 and JSA 2011
2.11.2 Queensland & Brisbane: National Context
Queensland and Brisbane SD have similar proportions of residents in this age group to Australia.
Diamantina and Barcoo Shires, both in the far southwest channel country of the state, have
relatively large proportion of their populations in this age group. Burke Shire and Weipa also
have a large proportion of 35 to 44 year olds.
# LGA_NAME 35_44 YrsSEIFA
DisadvantageSEIFA Decile
(AUS)SEIFA Decile
(STE)Australia Average 14.8%Queensland Average 14.7%Brisbane SD Average 15.1%
1 Diamantina (S) 21.6% 891.05 1 32 Burke (S) 19.7% 918.66 2 43 Weipa (T) 19.0% 1048.88 9 104 Barcoo (S) 18.7% 964.94 4 65 Quilpie (S) 17.8% 955.24 4 66 Isaac (R) 17.5% 1038.44 9 107 Kowanyama (S) 17.3% 512.99 1 18 Etheridge (S) 17.0% 990.09 6 89 Croydon (S) 17.0% 821.37 1 3
10 Cairns (R) 16.5% 999.40 7 911 Cook (S) 16.4% 907.06 2 312 Wujal Wujal (S) 16.4% 531.53 1 113 Central Highlands (R) 16.3% 1027.58 9 1014 Barcaldine (R) 16.3% 968.81 5 715 Scenic Rim (R) 16.1% 1011.83 8 1016 Balonne (S) 16.1% 963.53 4 617 Gladstone (R) 16.0% 1002.81 8 918 Aurukun (S) 16.0% 537.75 1 119 Murweh (S) 15.8% 958.15 4 620 Mackay (R) 15.7% 1007.90 8 9

NACLC Legal Needs: Queensland 35
Map 17: Age 35-44 years - Queensland

36 NACLC Legal Needs: Queensland
Map 18: Age 35-44 years – Brisbane SD
NACLC Legal Needs: Queensland 37
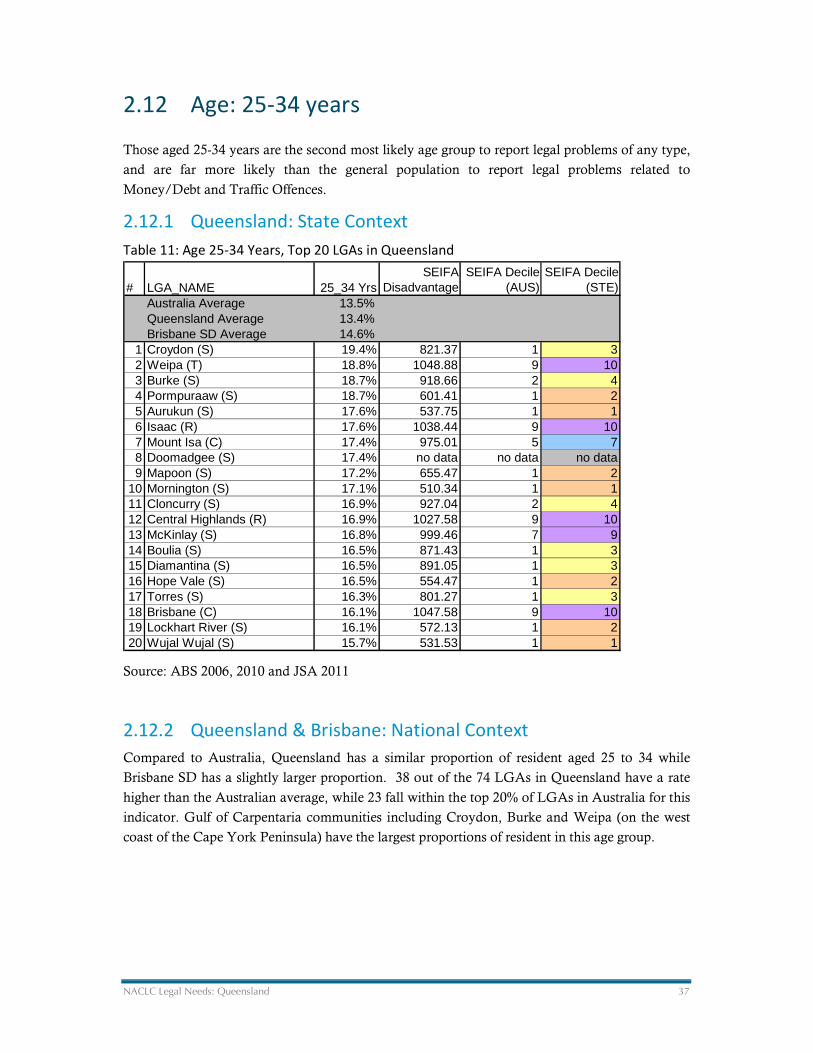
2.12 Age: 25-34 years
Those aged 25-34 years are the second most likely age group to report legal problems of any type,
and are far more likely than the general population to report legal problems related to
Money/Debt and Traffic Offences.
2.12.1 Queensland: State Context
Table 11: Age 25-34 Years, Top 20 LGAs in Queensland
Source: ABS 2006, 2010 and JSA 2011
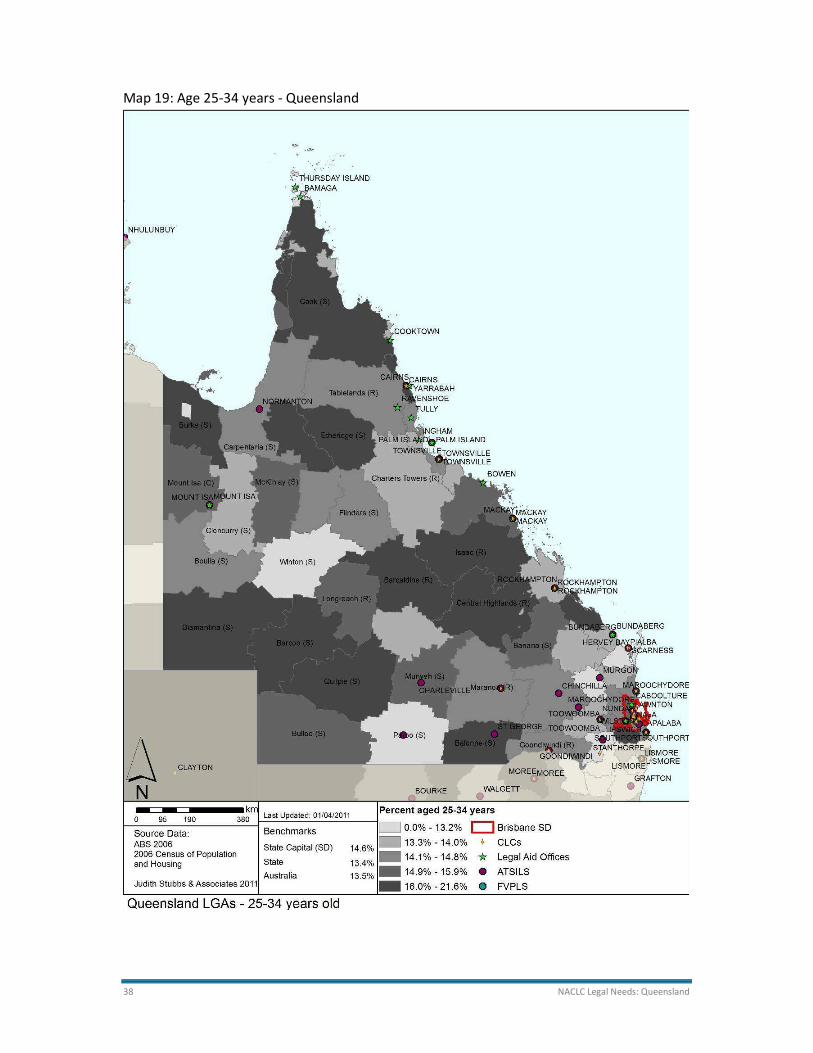
2.12.2 Queensland & Brisbane: National Context
Compared to Australia, Queensland has a similar proportion of resident aged 25 to 34 while
Brisbane SD has a slightly larger proportion. 38 out of the 74 LGAs in Queensland have a rate
higher than the Australian average, while 23 fall within the top 20% of LGAs in Australia for this
indicator. Gulf of Carpentaria communities including Croydon, Burke and Weipa (on the west
coast of the Cape York Peninsula) have the largest proportions of resident in this age group.
# LGA_NAME 25_34 YrsSEIFA
DisadvantageSEIFA Decile
(AUS)SEIFA Decile
(STE)Australia Average 13.5%Queensland Average 13.4%Brisbane SD Average 14.6%
1 Croydon (S) 19.4% 821.37 1 32 Weipa (T) 18.8% 1048.88 9 103 Burke (S) 18.7% 918.66 2 44 Pormpuraaw (S) 18.7% 601.41 1 25 Aurukun (S) 17.6% 537.75 1 16 Isaac (R) 17.6% 1038.44 9 107 Mount Isa (C) 17.4% 975.01 5 78 Doomadgee (S) 17.4% no data no data no data9 Mapoon (S) 17.2% 655.47 1 2
10 Mornington (S) 17.1% 510.34 1 111 Cloncurry (S) 16.9% 927.04 2 412 Central Highlands (R) 16.9% 1027.58 9 1013 McKinlay (S) 16.8% 999.46 7 914 Boulia (S) 16.5% 871.43 1 315 Diamantina (S) 16.5% 891.05 1 316 Hope Vale (S) 16.5% 554.47 1 217 Torres (S) 16.3% 801.27 1 318 Brisbane (C) 16.1% 1047.58 9 1019 Lockhart River (S) 16.1% 572.13 1 220 Wujal Wujal (S) 15.7% 531.53 1 1
38 NACLC Legal Needs: Queensland
Map 19: Age 25-34 years - Queensland

NACLC Legal Needs: Queensland 39
Map 20: Age 25-34 years – Brisbane SD
40 NACLC Legal Needs: Queensland
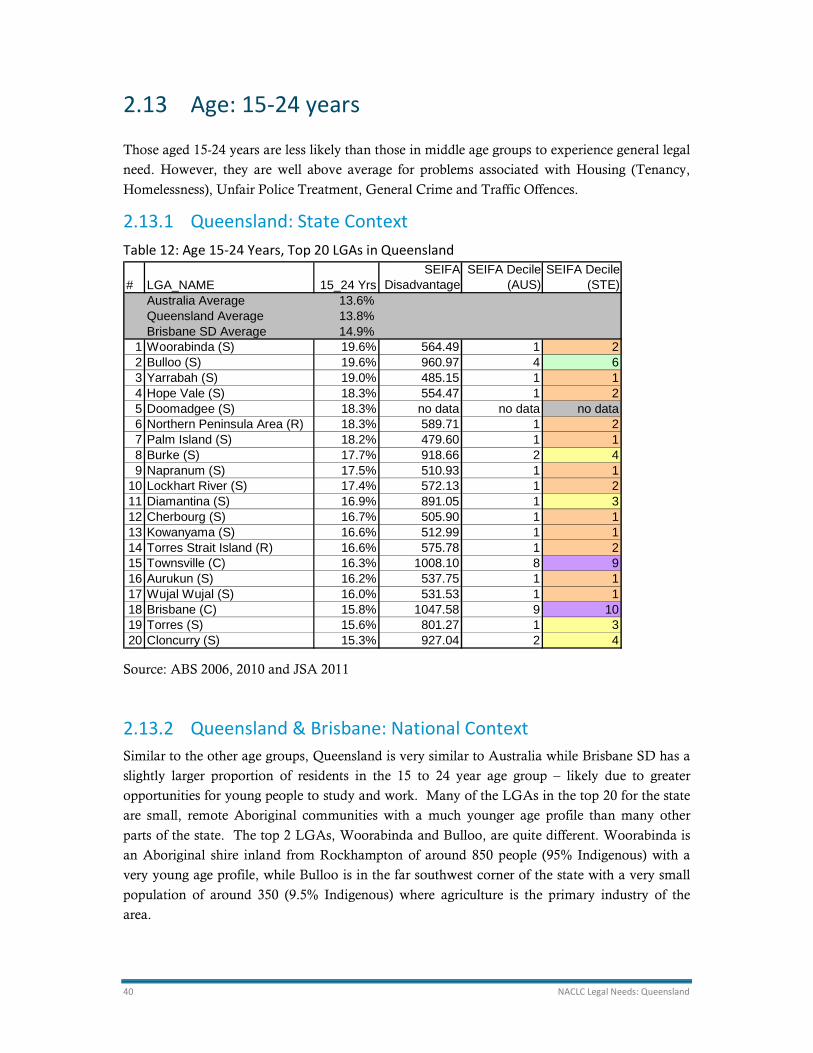
2.13 Age: 15-24 years
Those aged 15-24 years are less likely than those in middle age groups to experience general legal
need. However, they are well above average for problems associated with Housing (Tenancy,
Homelessness), Unfair Police Treatment, General Crime and Traffic Offences.
2.13.1 Queensland: State Context
Table 12: Age 15-24 Years, Top 20 LGAs in Queensland
Source: ABS 2006, 2010 and JSA 2011
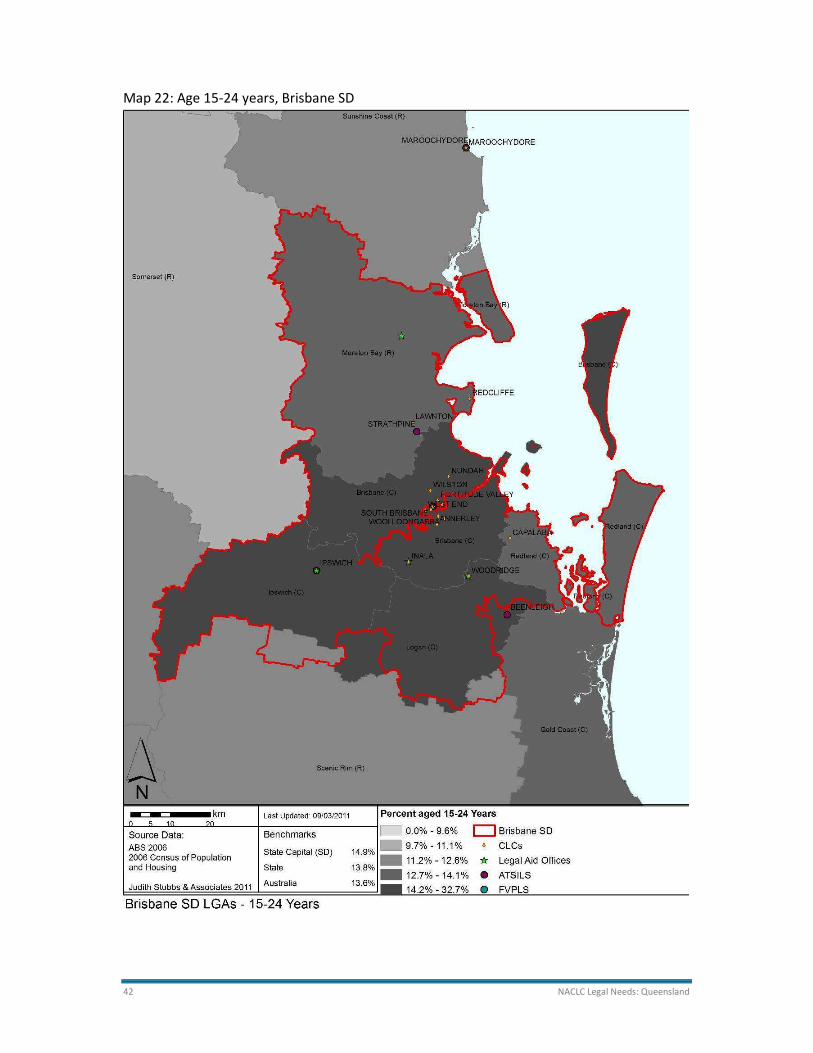
2.13.2 Queensland & Brisbane: National Context
Similar to the other age groups, Queensland is very similar to Australia while Brisbane SD has a
slightly larger proportion of residents in the 15 to 24 year age group – likely due to greater
opportunities for young people to study and work. Many of the LGAs in the top 20 for the state
are small, remote Aboriginal communities with a much younger age profile than many other
parts of the state. The top 2 LGAs, Woorabinda and Bulloo, are quite different. Woorabinda is
an Aboriginal shire inland from Rockhampton of around 850 people (95% Indigenous) with a
very young age profile, while Bulloo is in the far southwest corner of the state with a very small
population of around 350 (9.5% Indigenous) where agriculture is the primary industry of the
area.
# LGA_NAME 15_24 YrsSEIFA
DisadvantageSEIFA Decile
(AUS)SEIFA Decile
(STE)Australia Average 13.6%Queensland Average 13.8%Brisbane SD Average 14.9%
1 Woorabinda (S) 19.6% 564.49 1 22 Bulloo (S) 19.6% 960.97 4 63 Yarrabah (S) 19.0% 485.15 1 14 Hope Vale (S) 18.3% 554.47 1 25 Doomadgee (S) 18.3% no data no data no data6 Northern Peninsula Area (R) 18.3% 589.71 1 27 Palm Island (S) 18.2% 479.60 1 18 Burke (S) 17.7% 918.66 2 49 Napranum (S) 17.5% 510.93 1 1
10 Lockhart River (S) 17.4% 572.13 1 211 Diamantina (S) 16.9% 891.05 1 312 Cherbourg (S) 16.7% 505.90 1 113 Kowanyama (S) 16.6% 512.99 1 114 Torres Strait Island (R) 16.6% 575.78 1 215 Townsville (C) 16.3% 1008.10 8 916 Aurukun (S) 16.2% 537.75 1 117 Wujal Wujal (S) 16.0% 531.53 1 118 Brisbane (C) 15.8% 1047.58 9 1019 Torres (S) 15.6% 801.27 1 320 Cloncurry (S) 15.3% 927.04 2 4

NACLC Legal Needs: Queensland 41
Map 21: Age 15-24 years - Queensland
42 NACLC Legal Needs: Queensland
Map 22: Age 15-24 years, Brisbane SD
NACLC Legal Needs: Queensland 43
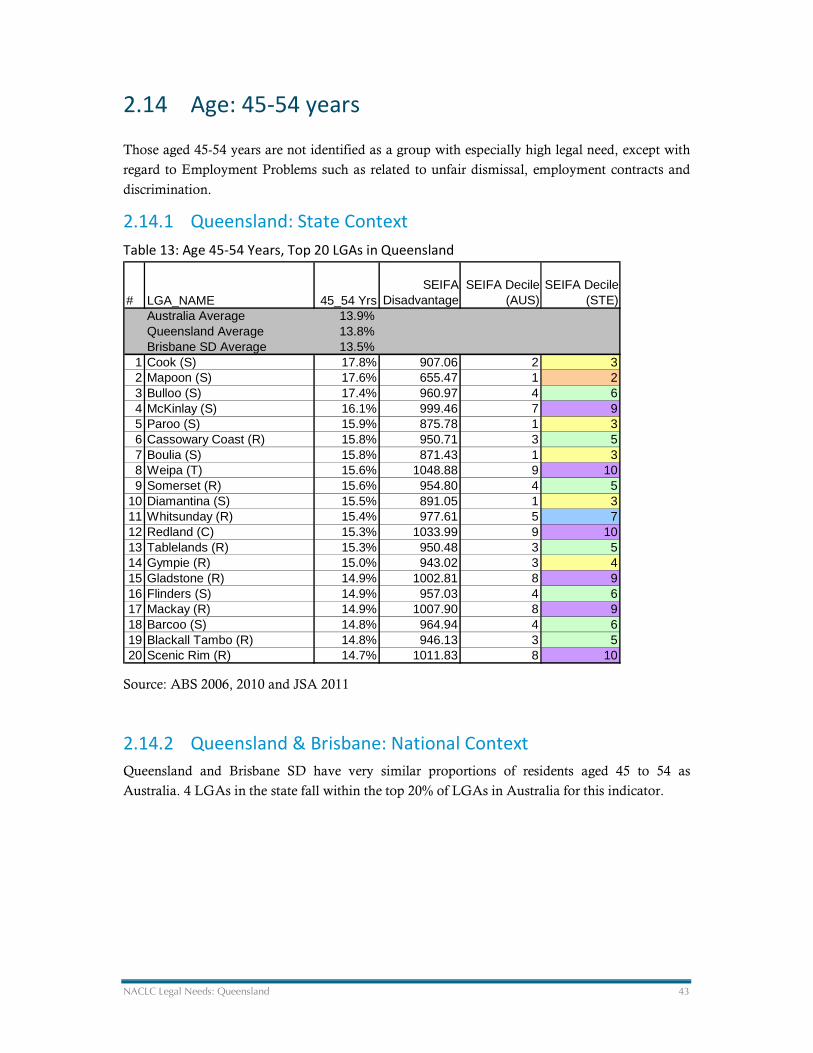
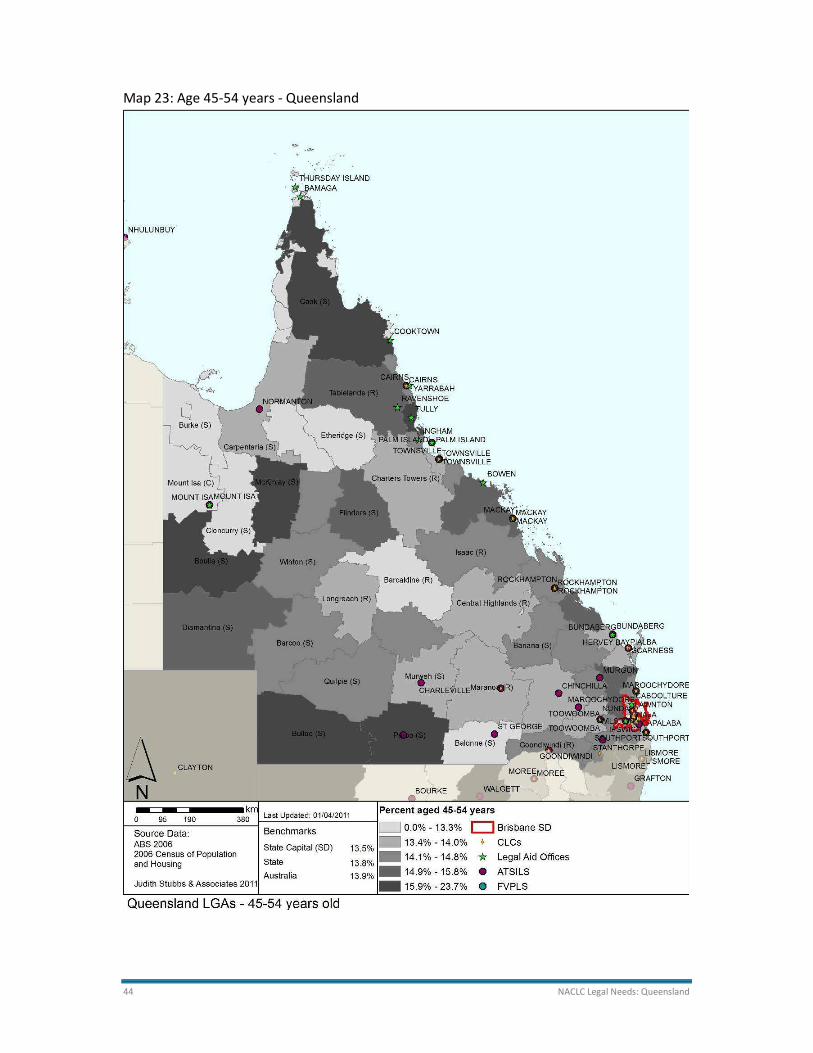
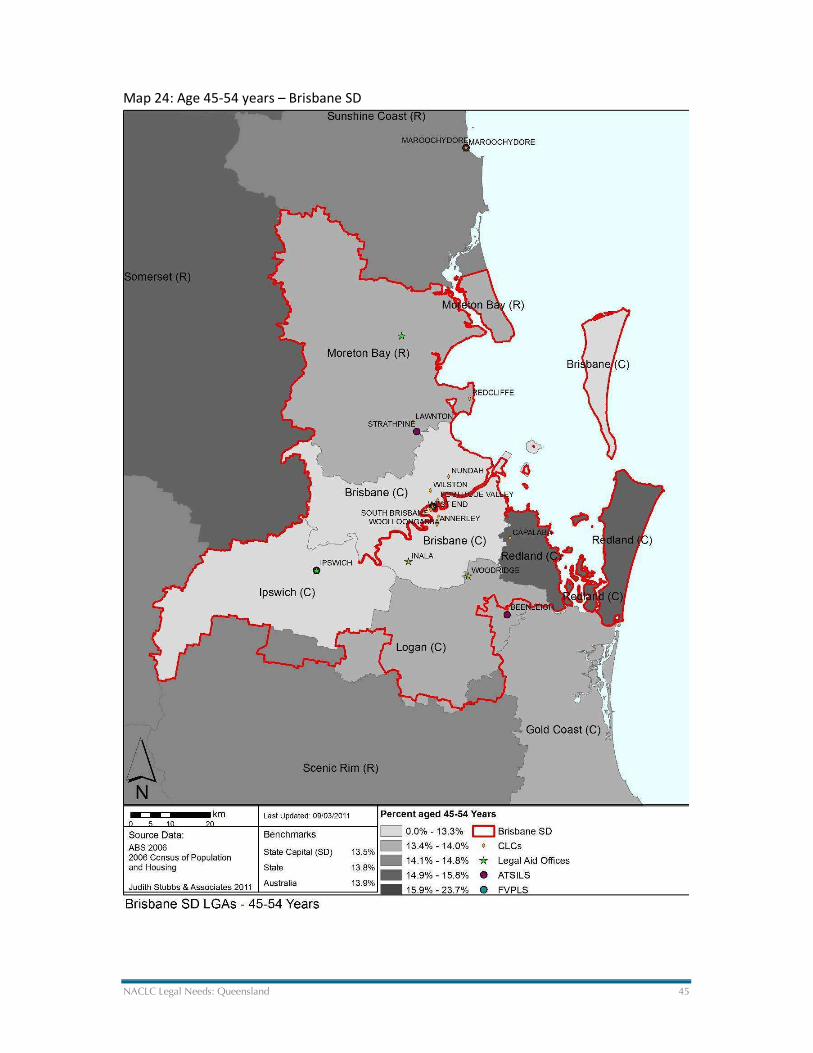
2.14 Age: 45-54 years
Those aged 45-54 years are not identified as a group with especially high legal need, except with
regard to Employment Problems such as related to unfair dismissal, employment contracts and
discrimination.
2.14.1 Queensland: State Context
Table 13: Age 45-54 Years, Top 20 LGAs in Queensland
Source: ABS 2006, 2010 and JSA 2011
2.14.2 Queensland & Brisbane: National Context
Queensland and Brisbane SD have very similar proportions of residents aged 45 to 54 as
Australia. 4 LGAs in the state fall within the top 20% of LGAs in Australia for this indicator.
# LGA_NAME 45_54 YrsSEIFA
DisadvantageSEIFA Decile
(AUS)SEIFA Decile
(STE)Australia Average 13.9%Queensland Average 13.8%Brisbane SD Average 13.5%
1 Cook (S) 17.8% 907.06 2 32 Mapoon (S) 17.6% 655.47 1 23 Bulloo (S) 17.4% 960.97 4 64 McKinlay (S) 16.1% 999.46 7 95 Paroo (S) 15.9% 875.78 1 36 Cassowary Coast (R) 15.8% 950.71 3 57 Boulia (S) 15.8% 871.43 1 38 Weipa (T) 15.6% 1048.88 9 109 Somerset (R) 15.6% 954.80 4 5
10 Diamantina (S) 15.5% 891.05 1 311 Whitsunday (R) 15.4% 977.61 5 712 Redland (C) 15.3% 1033.99 9 1013 Tablelands (R) 15.3% 950.48 3 514 Gympie (R) 15.0% 943.02 3 415 Gladstone (R) 14.9% 1002.81 8 916 Flinders (S) 14.9% 957.03 4 617 Mackay (R) 14.9% 1007.90 8 918 Barcoo (S) 14.8% 964.94 4 619 Blackall Tambo (R) 14.8% 946.13 3 520 Scenic Rim (R) 14.7% 1011.83 8 10
44 NACLC Legal Needs: Queensland
Map 23: Age 45-54 years - Queensland
NACLC Legal Needs: Queensland 45
Map 24: Age 45-54 years – Brisbane SD
46 NACLC Legal Needs: Queensland
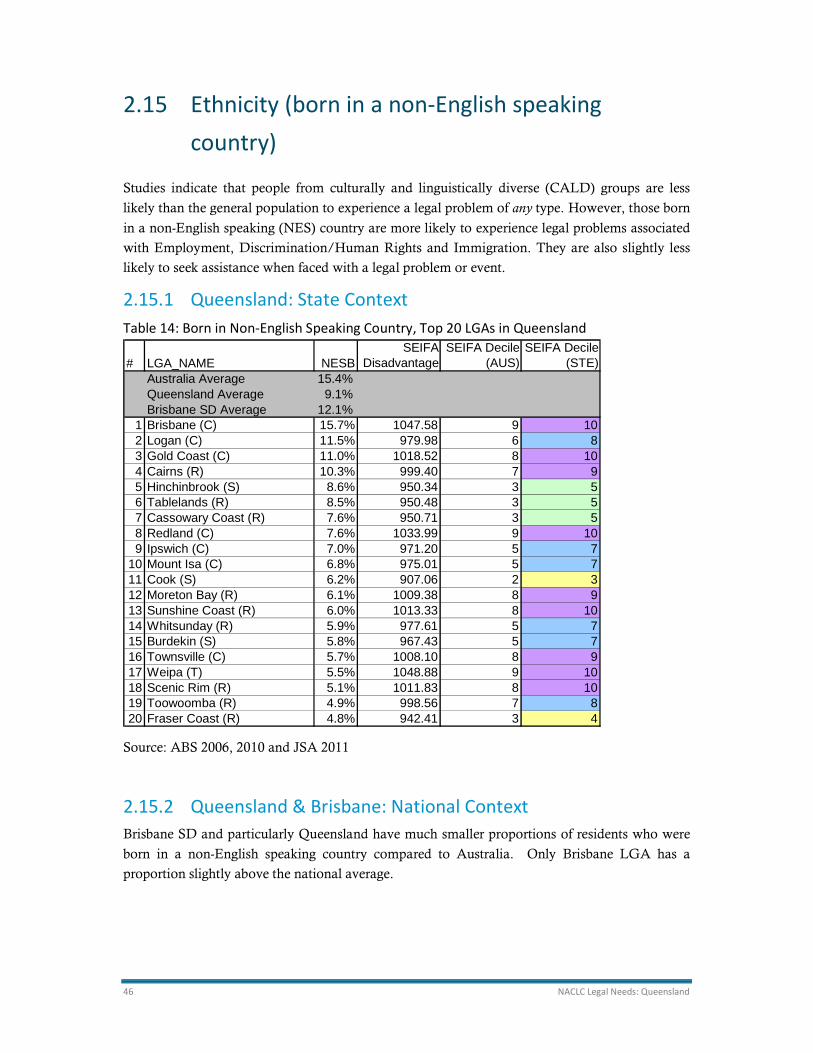
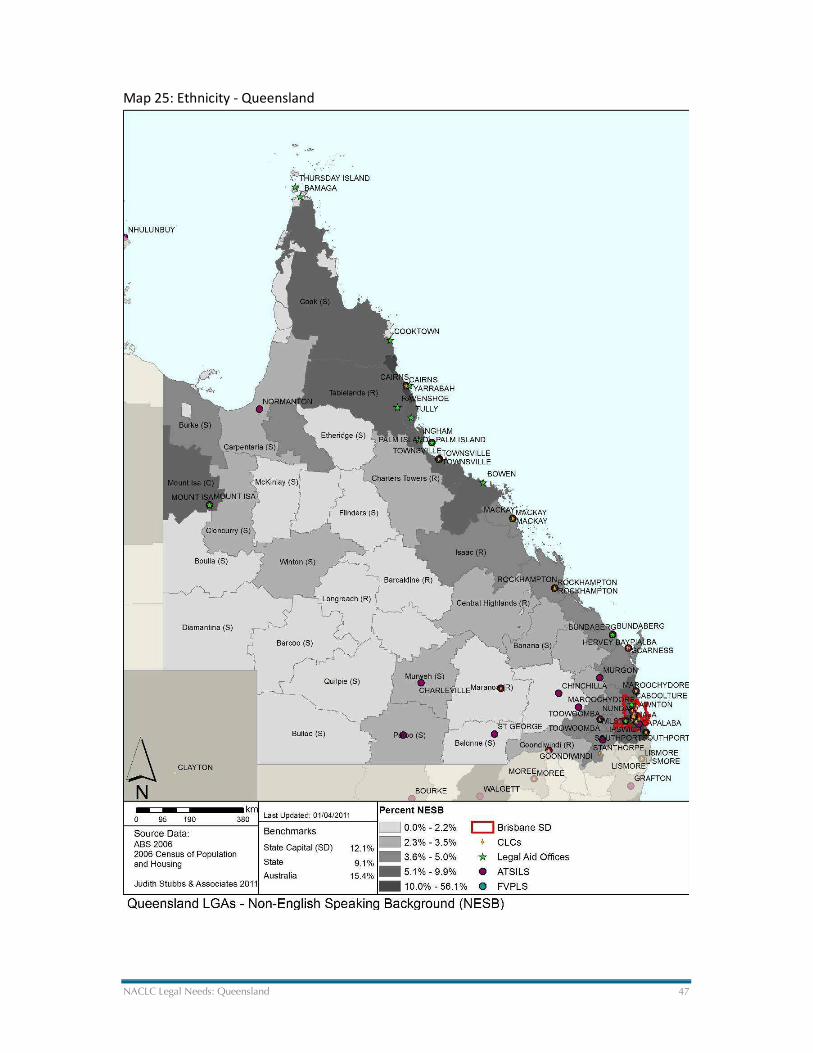
2.15 Ethnicity (born in a non-English speaking
country)
Studies indicate that people from culturally and linguistically diverse (CALD) groups are less
likely than the general population to experience a legal problem of any type. However, those born
in a non-English speaking (NES) country are more likely to experience legal problems associated
with Employment, Discrimination/Human Rights and Immigration. They are also slightly less
likely to seek assistance when faced with a legal problem or event.
2.15.1 Queensland: State Context
Table 14: Born in Non-English Speaking Country, Top 20 LGAs in Queensland
Source: ABS 2006, 2010 and JSA 2011
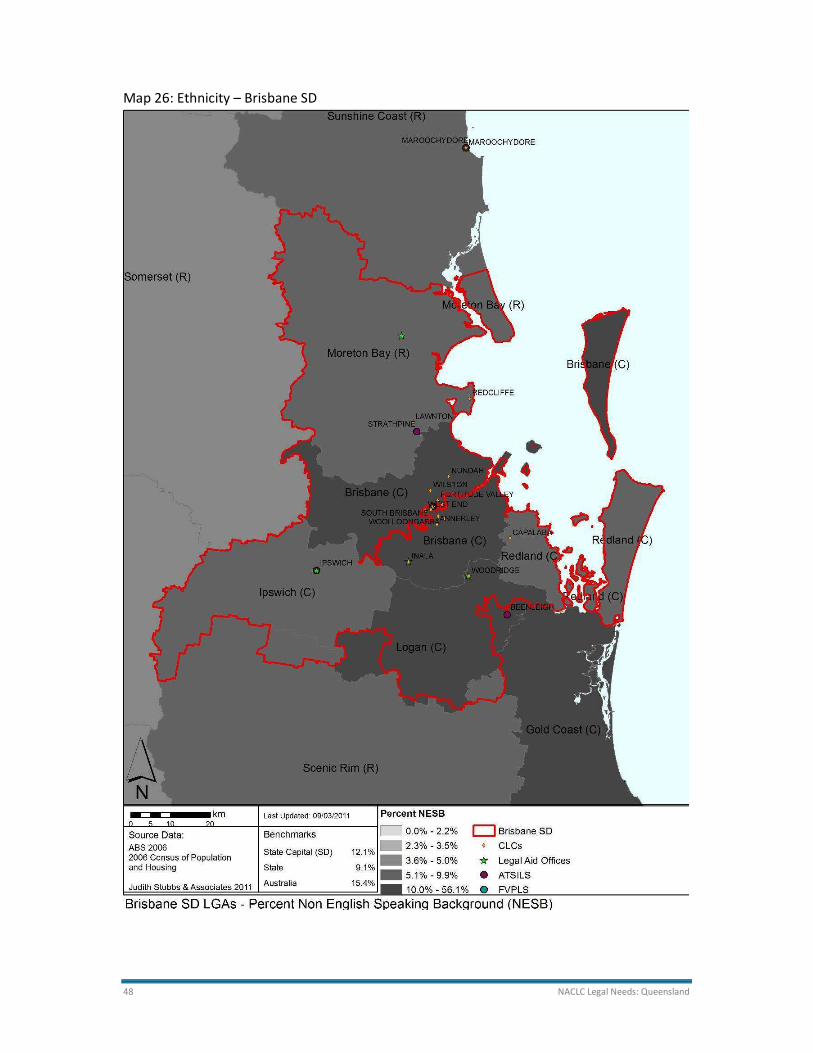
2.15.2 Queensland & Brisbane: National Context
Brisbane SD and particularly Queensland have much smaller proportions of residents who were
born in a non-English speaking country compared to Australia. Only Brisbane LGA has a
proportion slightly above the national average.
# LGA_NAME NESBSEIFA
DisadvantageSEIFA Decile
(AUS)SEIFA Decile
(STE)Australia Average 15.4%Queensland Average 9.1%Brisbane SD Average 12.1%
1 Brisbane (C) 15.7% 1047.58 9 102 Logan (C) 11.5% 979.98 6 83 Gold Coast (C) 11.0% 1018.52 8 104 Cairns (R) 10.3% 999.40 7 95 Hinchinbrook (S) 8.6% 950.34 3 56 Tablelands (R) 8.5% 950.48 3 57 Cassowary Coast (R) 7.6% 950.71 3 58 Redland (C) 7.6% 1033.99 9 109 Ipswich (C) 7.0% 971.20 5 7
10 Mount Isa (C) 6.8% 975.01 5 711 Cook (S) 6.2% 907.06 2 312 Moreton Bay (R) 6.1% 1009.38 8 913 Sunshine Coast (R) 6.0% 1013.33 8 1014 Whitsunday (R) 5.9% 977.61 5 715 Burdekin (S) 5.8% 967.43 5 716 Townsville (C) 5.7% 1008.10 8 917 Weipa (T) 5.5% 1048.88 9 1018 Scenic Rim (R) 5.1% 1011.83 8 1019 Toowoomba (R) 4.9% 998.56 7 820 Fraser Coast (R) 4.8% 942.41 3 4
NACLC Legal Needs: Queensland 47
Map 25: Ethnicity - Queensland
48 NACLC Legal Needs: Queensland
Map 26: Ethnicity – Brisbane SD
NACLC Legal Needs: Queensland 49
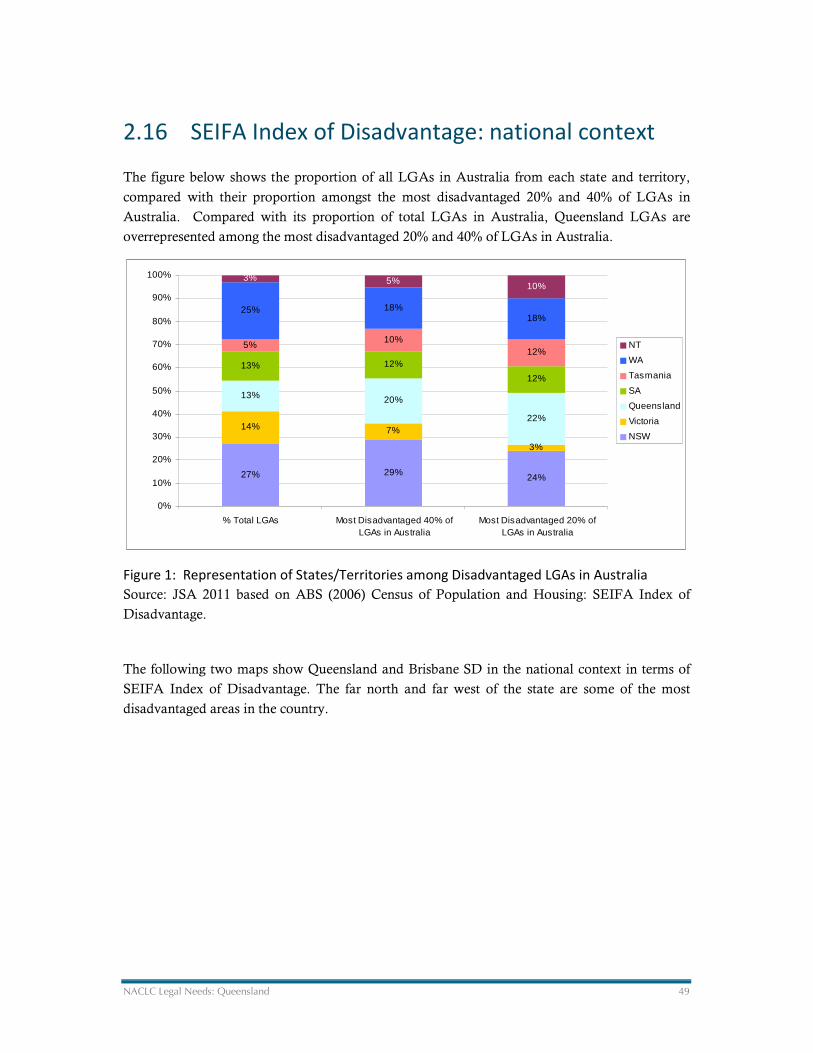
2.16 SEIFA Index of Disadvantage: national context
The figure below shows the proportion of all LGAs in Australia from each state and territory,
compared with their proportion amongst the most disadvantaged 20% and 40% of LGAs in
Australia. Compared with its proportion of total LGAs in Australia, Queensland LGAs are
overrepresented among the most disadvantaged 20% and 40% of LGAs in Australia.
Figure 1: Representation of States/Territories among Disadvantaged LGAs in Australia
Source: JSA 2011 based on ABS (2006) Census of Population and Housing: SEIFA Index of
Disadvantage.
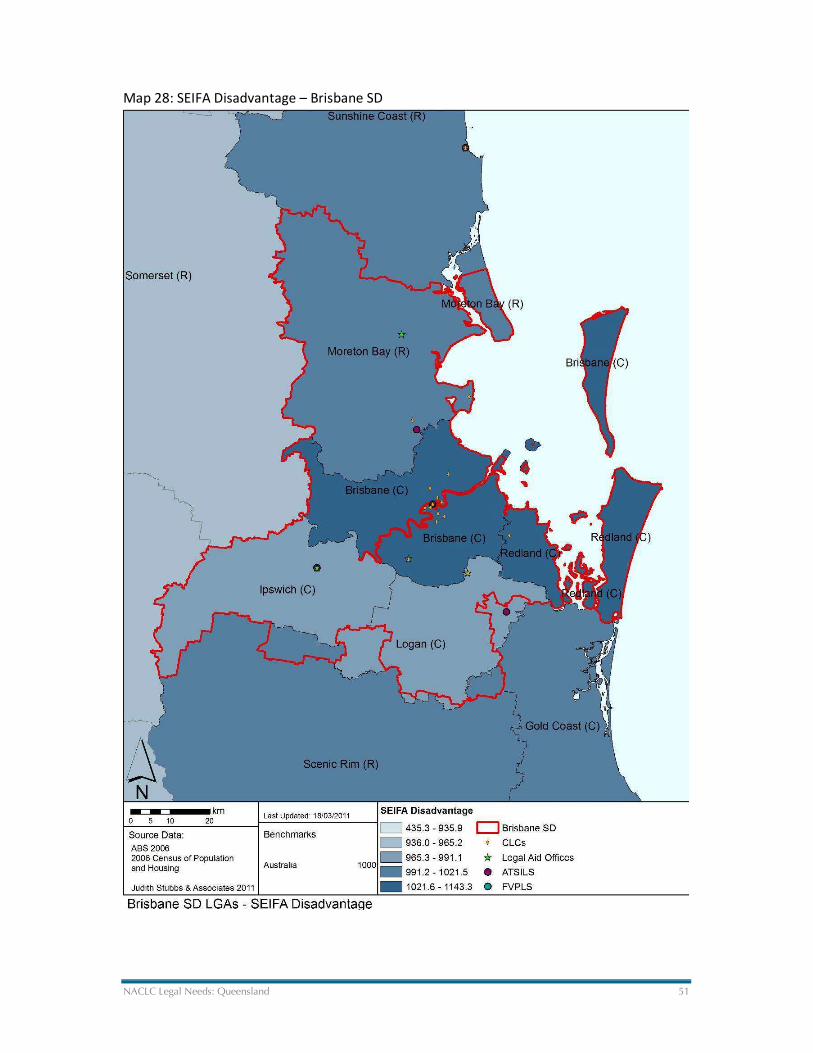
The following two maps show Queensland and Brisbane SD in the national context in terms of
SEIFA Index of Disadvantage. The far north and far west of the state are some of the most
disadvantaged areas in the country.
27% 29% 24%
14% 7%
3%
13% 20%
22%
13% 12%
12%
5%10%
12%
25% 18%18%
3% 5%10%
0%
10%
20%
30%
40%
50%
60%
70%
80%
90%
100%
% Total LGAs Most Disadvantaged 40% ofLGAs in Australia
Most Disadvantaged 20% ofLGAs in Australia
NT
WA
Tasmania
SA
Queensland
Victoria
NSW

50 NACLC Legal Needs: Queensland
Map 27: SEIFA Disadvantage - Queensland
NACLC Legal Needs: Queensland 51
Map 28: SEIFA Disadvantage – Brisbane SD
52 NACLC Legal Needs: Queensland
3 QLD: Calculated Legal Need &
Disadvantage
Examining each individual socio-demographic indicator of legal need does not provide a complete
picture of the areas or communities experiencing high levels of overall legal need, nor a way of
accounting for the relationship between the various indicators, particularly where there may be
collinearity.4 The key indicators of legal need provide valuable but limited assistance in
understanding where generalist or multi-focus services should be strengthened or additional
resources for community legal assistance services best directed as part of a strategic planning
process.
JSA has developed a model adapted from Pleasance et al (2006) that combines and appropriately
weights key indicators of legal need in order to look at priority communities for community legal
assistance services. When compared with demand-side data, this highlights areas most likely to
be experiencing unexpressed or unmet legal needs.
We have applied this approach to Queensland to determine which LGAs are more likely to have
legal problems and, based on population and probability, how many adults in each LGA are
likely to experience a legal problem and the proportion of adults likely to experience a legal
problem. Results have been further grouped by SEIFA (Index of Relative Socio-Economic
Disadvantage) to maintain a focus on the priority target group for community legal assistance
services. The advantage of this approach is that it makes allowance for multiple indicators that
may in fact be different ways of predicting the same legal problem.
It is important to consider the difference between Probability of Legal Need (or concentration of
legal need in terms of proportion of adults in an area with particular characteristics) and
Calculated Legal Need (or absolute number of adults facing such need). Some areas may have a
high concentration or probability of legal need but a very small population, whilst other areas
may have a high calculated legal need or number of adults likely to experience a legal problem
but a lower overall concentration or probability of legal need. The application of SEIFA
Disadvantage to both probability and calculated legal need is necessary in order for community
legal assistance services to focus scarce resources on areas with high legal need and disadvantage.
The following two tables show the top 50 LGAs in Queensland sorted high to low in terms of
Calculated Legal Need (number of adults likely to experience a legal problem of any type in a
three-year period) and Probability of Legal Need (the proportion of adults likely to experience a
legal problem of any type in a three-year period).
In terms of Calculated Legal Need, those areas of the state with the highest numbers of adults
likely to experience a legal problem are almost directly related to population size with many of
the large regional LGAs (also some of the least disadvantaged in the state) at the top of the list.
4 Where two seemingly independent variables are related to each other, so that considering each separately will overstate the dependent variable, for example there may be 5,000 single parents
and 5,000 divorced people suggesting 10,000 people with a possible need based on these indicators, however many of the single parents and divorced households are likely to be the same so that
there may be only 5,000 people with a possible legal need.
NACLC Legal Needs: Queensland 53
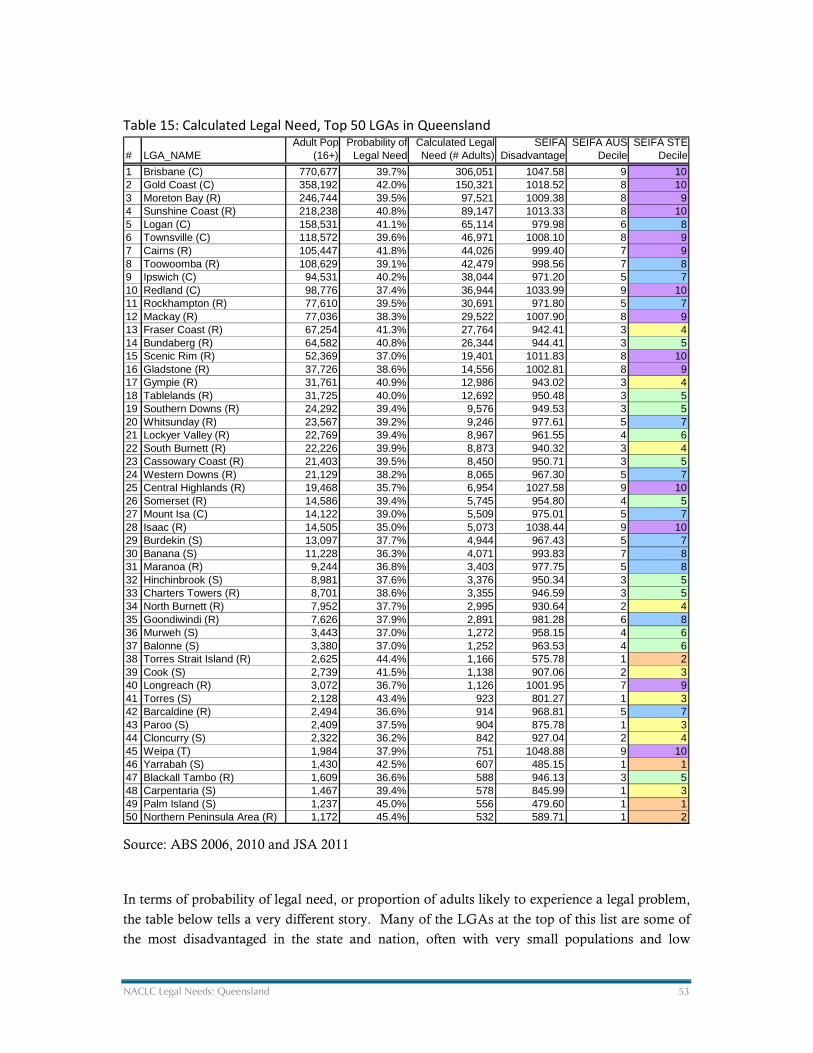
Table 15: Calculated Legal Need, Top 50 LGAs in Queensland
Source: ABS 2006, 2010 and JSA 2011
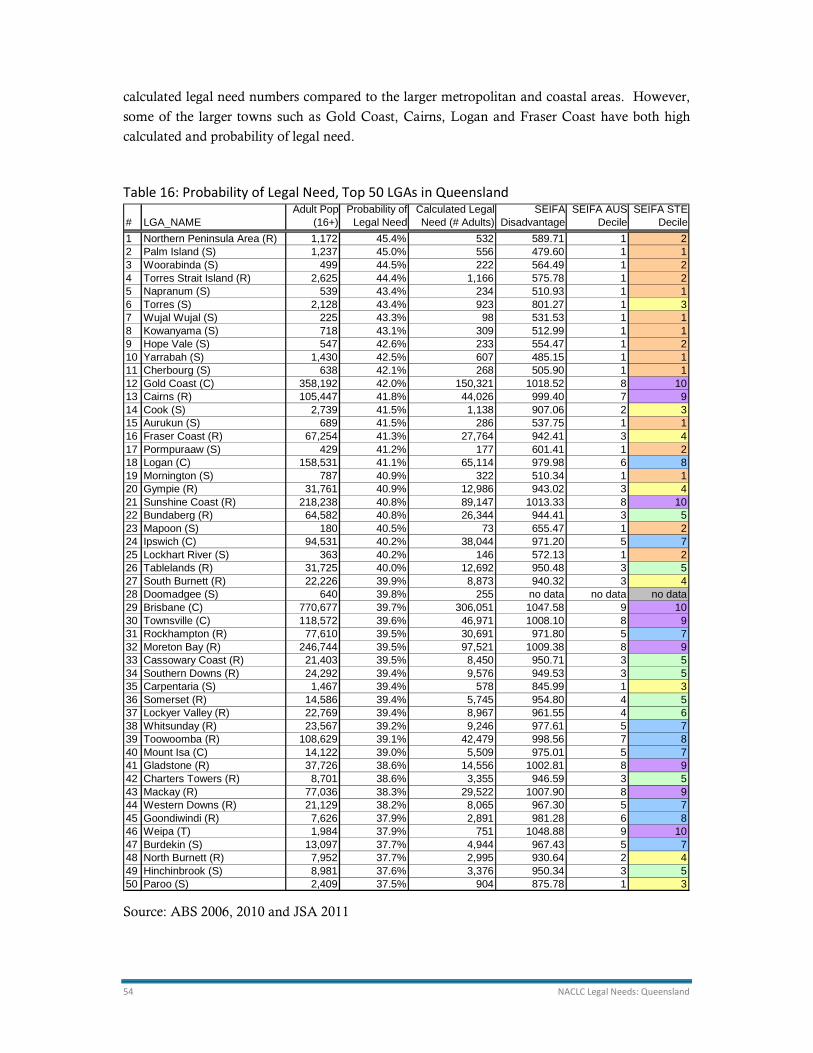
In terms of probability of legal need, or proportion of adults likely to experience a legal problem,
the table below tells a very different story. Many of the LGAs at the top of this list are some of
the most disadvantaged in the state and nation, often with very small populations and low
# LGA_NAMEAdult Pop
(16+)Probability of
Legal NeedCalculated Legal Need (# Adults)
SEIFA Disadvantage
SEIFA AUS Decile
SEIFA STE Decile
1 Brisbane (C) 770,677 39.7% 306,051 1047.58 9 102 Gold Coast (C) 358,192 42.0% 150,321 1018.52 8 103 Moreton Bay (R) 246,744 39.5% 97,521 1009.38 8 94 Sunshine Coast (R) 218,238 40.8% 89,147 1013.33 8 105 Logan (C) 158,531 41.1% 65,114 979.98 6 86 Townsville (C) 118,572 39.6% 46,971 1008.10 8 97 Cairns (R) 105,447 41.8% 44,026 999.40 7 98 Toowoomba (R) 108,629 39.1% 42,479 998.56 7 89 Ipswich (C) 94,531 40.2% 38,044 971.20 5 710 Redland (C) 98,776 37.4% 36,944 1033.99 9 1011 Rockhampton (R) 77,610 39.5% 30,691 971.80 5 712 Mackay (R) 77,036 38.3% 29,522 1007.90 8 913 Fraser Coast (R) 67,254 41.3% 27,764 942.41 3 414 Bundaberg (R) 64,582 40.8% 26,344 944.41 3 515 Scenic Rim (R) 52,369 37.0% 19,401 1011.83 8 1016 Gladstone (R) 37,726 38.6% 14,556 1002.81 8 917 Gympie (R) 31,761 40.9% 12,986 943.02 3 418 Tablelands (R) 31,725 40.0% 12,692 950.48 3 519 Southern Downs (R) 24,292 39.4% 9,576 949.53 3 520 Whitsunday (R) 23,567 39.2% 9,246 977.61 5 721 Lockyer Valley (R) 22,769 39.4% 8,967 961.55 4 622 South Burnett (R) 22,226 39.9% 8,873 940.32 3 423 Cassowary Coast (R) 21,403 39.5% 8,450 950.71 3 524 Western Downs (R) 21,129 38.2% 8,065 967.30 5 725 Central Highlands (R) 19,468 35.7% 6,954 1027.58 9 1026 Somerset (R) 14,586 39.4% 5,745 954.80 4 527 Mount Isa (C) 14,122 39.0% 5,509 975.01 5 728 Isaac (R) 14,505 35.0% 5,073 1038.44 9 1029 Burdekin (S) 13,097 37.7% 4,944 967.43 5 730 Banana (S) 11,228 36.3% 4,071 993.83 7 831 Maranoa (R) 9,244 36.8% 3,403 977.75 5 832 Hinchinbrook (S) 8,981 37.6% 3,376 950.34 3 533 Charters Towers (R) 8,701 38.6% 3,355 946.59 3 534 North Burnett (R) 7,952 37.7% 2,995 930.64 2 435 Goondiwindi (R) 7,626 37.9% 2,891 981.28 6 836 Murweh (S) 3,443 37.0% 1,272 958.15 4 637 Balonne (S) 3,380 37.0% 1,252 963.53 4 638 Torres Strait Island (R) 2,625 44.4% 1,166 575.78 1 239 Cook (S) 2,739 41.5% 1,138 907.06 2 340 Longreach (R) 3,072 36.7% 1,126 1001.95 7 941 Torres (S) 2,128 43.4% 923 801.27 1 342 Barcaldine (R) 2,494 36.6% 914 968.81 5 743 Paroo (S) 2,409 37.5% 904 875.78 1 344 Cloncurry (S) 2,322 36.2% 842 927.04 2 445 Weipa (T) 1,984 37.9% 751 1048.88 9 1046 Yarrabah (S) 1,430 42.5% 607 485.15 1 147 Blackall Tambo (R) 1,609 36.6% 588 946.13 3 548 Carpentaria (S) 1,467 39.4% 578 845.99 1 349 Palm Island (S) 1,237 45.0% 556 479.60 1 150 Northern Peninsula Area (R) 1,172 45.4% 532 589.71 1 2
54 NACLC Legal Needs: Queensland
calculated legal need numbers compared to the larger metropolitan and coastal areas. However,
some of the larger towns such as Gold Coast, Cairns, Logan and Fraser Coast have both high
calculated and probability of legal need.
Table 16: Probability of Legal Need, Top 50 LGAs in Queensland
Source: ABS 2006, 2010 and JSA 2011
# LGA_NAMEAdult Pop
(16+)Probability of
Legal NeedCalculated Legal Need (# Adults)
SEIFA Disadvantage
SEIFA AUS Decile
SEIFA STE Decile
1 Northern Peninsula Area (R) 1,172 45.4% 532 589.71 1 22 Palm Island (S) 1,237 45.0% 556 479.60 1 13 Woorabinda (S) 499 44.5% 222 564.49 1 24 Torres Strait Island (R) 2,625 44.4% 1,166 575.78 1 25 Napranum (S) 539 43.4% 234 510.93 1 16 Torres (S) 2,128 43.4% 923 801.27 1 37 Wujal Wujal (S) 225 43.3% 98 531.53 1 18 Kowanyama (S) 718 43.1% 309 512.99 1 19 Hope Vale (S) 547 42.6% 233 554.47 1 210 Yarrabah (S) 1,430 42.5% 607 485.15 1 111 Cherbourg (S) 638 42.1% 268 505.90 1 112 Gold Coast (C) 358,192 42.0% 150,321 1018.52 8 1013 Cairns (R) 105,447 41.8% 44,026 999.40 7 914 Cook (S) 2,739 41.5% 1,138 907.06 2 315 Aurukun (S) 689 41.5% 286 537.75 1 116 Fraser Coast (R) 67,254 41.3% 27,764 942.41 3 417 Pormpuraaw (S) 429 41.2% 177 601.41 1 218 Logan (C) 158,531 41.1% 65,114 979.98 6 819 Mornington (S) 787 40.9% 322 510.34 1 120 Gympie (R) 31,761 40.9% 12,986 943.02 3 421 Sunshine Coast (R) 218,238 40.8% 89,147 1013.33 8 1022 Bundaberg (R) 64,582 40.8% 26,344 944.41 3 523 Mapoon (S) 180 40.5% 73 655.47 1 224 Ipswich (C) 94,531 40.2% 38,044 971.20 5 725 Lockhart River (S) 363 40.2% 146 572.13 1 226 Tablelands (R) 31,725 40.0% 12,692 950.48 3 527 South Burnett (R) 22,226 39.9% 8,873 940.32 3 428 Doomadgee (S) 640 39.8% 255 no data no data no data29 Brisbane (C) 770,677 39.7% 306,051 1047.58 9 1030 Townsville (C) 118,572 39.6% 46,971 1008.10 8 931 Rockhampton (R) 77,610 39.5% 30,691 971.80 5 732 Moreton Bay (R) 246,744 39.5% 97,521 1009.38 8 933 Cassowary Coast (R) 21,403 39.5% 8,450 950.71 3 534 Southern Downs (R) 24,292 39.4% 9,576 949.53 3 535 Carpentaria (S) 1,467 39.4% 578 845.99 1 336 Somerset (R) 14,586 39.4% 5,745 954.80 4 537 Lockyer Valley (R) 22,769 39.4% 8,967 961.55 4 638 Whitsunday (R) 23,567 39.2% 9,246 977.61 5 739 Toowoomba (R) 108,629 39.1% 42,479 998.56 7 840 Mount Isa (C) 14,122 39.0% 5,509 975.01 5 741 Gladstone (R) 37,726 38.6% 14,556 1002.81 8 942 Charters Towers (R) 8,701 38.6% 3,355 946.59 3 543 Mackay (R) 77,036 38.3% 29,522 1007.90 8 944 Western Downs (R) 21,129 38.2% 8,065 967.30 5 745 Goondiwindi (R) 7,626 37.9% 2,891 981.28 6 846 Weipa (T) 1,984 37.9% 751 1048.88 9 1047 Burdekin (S) 13,097 37.7% 4,944 967.43 5 748 North Burnett (R) 7,952 37.7% 2,995 930.64 2 449 Hinchinbrook (S) 8,981 37.6% 3,376 950.34 3 550 Paroo (S) 2,409 37.5% 904 875.78 1 3
NACLC Legal Needs: Queensland 55
3.1 QLD: Most Disadvantaged 40% of LGAs
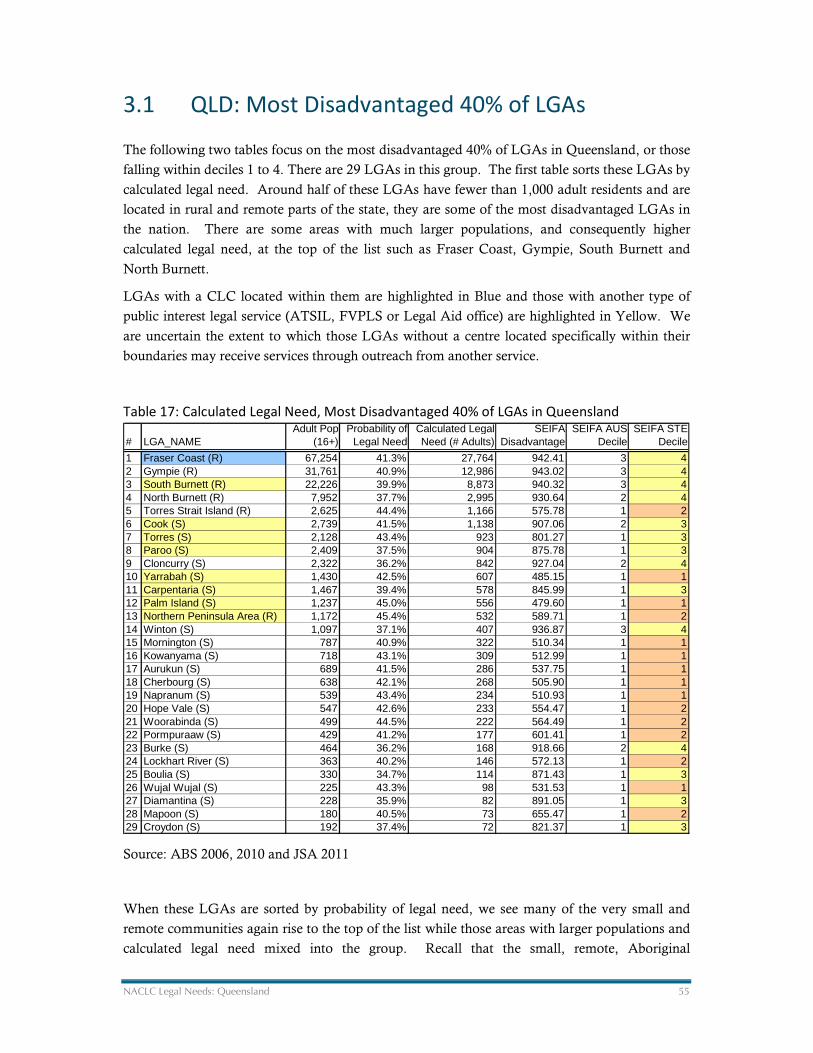
The following two tables focus on the most disadvantaged 40% of LGAs in Queensland, or those
falling within deciles 1 to 4. There are 29 LGAs in this group. The first table sorts these LGAs by
calculated legal need. Around half of these LGAs have fewer than 1,000 adult residents and are
located in rural and remote parts of the state, they are some of the most disadvantaged LGAs in
the nation. There are some areas with much larger populations, and consequently higher
calculated legal need, at the top of the list such as Fraser Coast, Gympie, South Burnett and
North Burnett.
LGAs with a CLC located within them are highlighted in Blue and those with another type of
public interest legal service (ATSIL, FVPLS or Legal Aid office) are highlighted in Yellow. We
are uncertain the extent to which those LGAs without a centre located specifically within their
boundaries may receive services through outreach from another service.
Table 17: Calculated Legal Need, Most Disadvantaged 40% of LGAs in Queensland
Source: ABS 2006, 2010 and JSA 2011
When these LGAs are sorted by probability of legal need, we see many of the very small and
remote communities again rise to the top of the list while those areas with larger populations and
calculated legal need mixed into the group. Recall that the small, remote, Aboriginal
# LGA_NAMEAdult Pop
(16+)Probability of
Legal NeedCalculated Legal Need (# Adults)
SEIFA Disadvantage
SEIFA AUS Decile
SEIFA STE Decile
1 Fraser Coast (R) 67,254 41.3% 27,764 942.41 3 42 Gympie (R) 31,761 40.9% 12,986 943.02 3 43 South Burnett (R) 22,226 39.9% 8,873 940.32 3 44 North Burnett (R) 7,952 37.7% 2,995 930.64 2 45 Torres Strait Island (R) 2,625 44.4% 1,166 575.78 1 26 Cook (S) 2,739 41.5% 1,138 907.06 2 37 Torres (S) 2,128 43.4% 923 801.27 1 38 Paroo (S) 2,409 37.5% 904 875.78 1 39 Cloncurry (S) 2,322 36.2% 842 927.04 2 410 Yarrabah (S) 1,430 42.5% 607 485.15 1 111 Carpentaria (S) 1,467 39.4% 578 845.99 1 312 Palm Island (S) 1,237 45.0% 556 479.60 1 113 Northern Peninsula Area (R) 1,172 45.4% 532 589.71 1 214 Winton (S) 1,097 37.1% 407 936.87 3 415 Mornington (S) 787 40.9% 322 510.34 1 116 Kowanyama (S) 718 43.1% 309 512.99 1 117 Aurukun (S) 689 41.5% 286 537.75 1 118 Cherbourg (S) 638 42.1% 268 505.90 1 119 Napranum (S) 539 43.4% 234 510.93 1 120 Hope Vale (S) 547 42.6% 233 554.47 1 221 Woorabinda (S) 499 44.5% 222 564.49 1 222 Pormpuraaw (S) 429 41.2% 177 601.41 1 223 Burke (S) 464 36.2% 168 918.66 2 424 Lockhart River (S) 363 40.2% 146 572.13 1 225 Boulia (S) 330 34.7% 114 871.43 1 326 Wujal Wujal (S) 225 43.3% 98 531.53 1 127 Diamantina (S) 228 35.9% 82 891.05 1 328 Mapoon (S) 180 40.5% 73 655.47 1 229 Croydon (S) 192 37.4% 72 821.37 1 3

56 NACLC Legal Needs: Queensland
communities with the high probability of legal need levels are communities with very high levels
of social renters, people in receipt of the DSP or other benefits, high rates of lone parent and/or
cohabiting with children households and other key indicators of legal need. As such, these high
probabilities of legal need should be expected based on the outcome of the indicators.
Table 18: Probability of Legal Need, Most Disadvantaged 40% of LGAs in Queensland
Source: ABS 2006, 2010 and JSA 2011
3.2 QLD: Calculated Legal Need, National Context
# LGA_NAMEAdult Pop
(16+)Probability of
Legal NeedCalculated Legal Need (# Adults)
SEIFA Disadvantage
SEIFA AUS Decile
SEIFA STE Decile
1 Northern Peninsula Area (R) 1,172 45.4% 532 589.71 1 22 Palm Island (S) 1,237 45.0% 556 479.60 1 13 Woorabinda (S) 499 44.5% 222 564.49 1 24 Torres Strait Island (R) 2,625 44.4% 1,166 575.78 1 25 Napranum (S) 539 43.4% 234 510.93 1 16 Torres (S) 2,128 43.4% 923 801.27 1 37 Wujal Wujal (S) 225 43.3% 98 531.53 1 18 Kowanyama (S) 718 43.1% 309 512.99 1 19 Hope Vale (S) 547 42.6% 233 554.47 1 210 Yarrabah (S) 1,430 42.5% 607 485.15 1 111 Cherbourg (S) 638 42.1% 268 505.90 1 112 Cook (S) 2,739 41.5% 1,138 907.06 2 313 Aurukun (S) 689 41.5% 286 537.75 1 114 Fraser Coast (R) 67,254 41.3% 27,764 942.41 3 415 Pormpuraaw (S) 429 41.2% 177 601.41 1 216 Mornington (S) 787 40.9% 322 510.34 1 117 Gympie (R) 31,761 40.9% 12,986 943.02 3 418 Mapoon (S) 180 40.5% 73 655.47 1 219 Lockhart River (S) 363 40.2% 146 572.13 1 220 South Burnett (R) 22,226 39.9% 8,873 940.32 3 421 Carpentaria (S) 1,467 39.4% 578 845.99 1 322 North Burnett (R) 7,952 37.7% 2,995 930.64 2 423 Paroo (S) 2,409 37.5% 904 875.78 1 324 Croydon (S) 192 37.4% 72 821.37 1 325 Winton (S) 1,097 37.1% 407 936.87 3 426 Cloncurry (S) 2,322 36.2% 842 927.04 2 427 Burke (S) 464 36.2% 168 918.66 2 428 Diamantina (S) 228 35.9% 82 891.05 1 329 Boulia (S) 330 34.7% 114 871.43 1 3
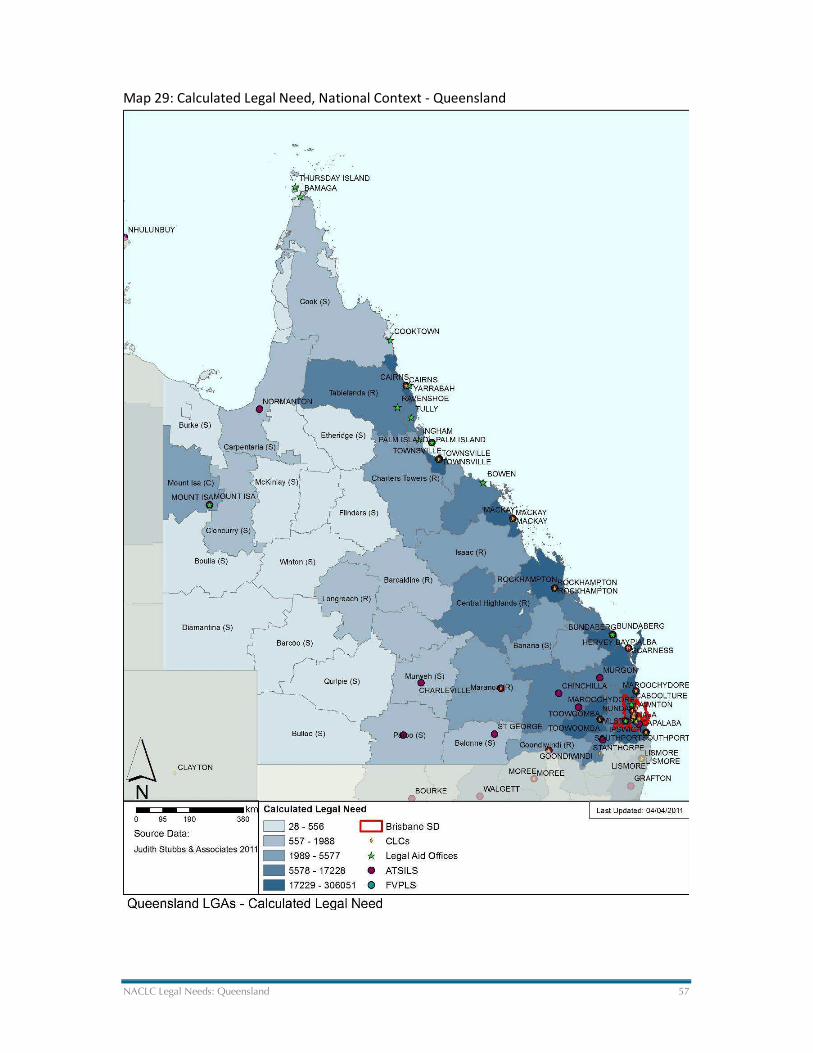
NACLC Legal Needs: Queensland 57
Map 29: Calculated Legal Need, National Context - Queensland
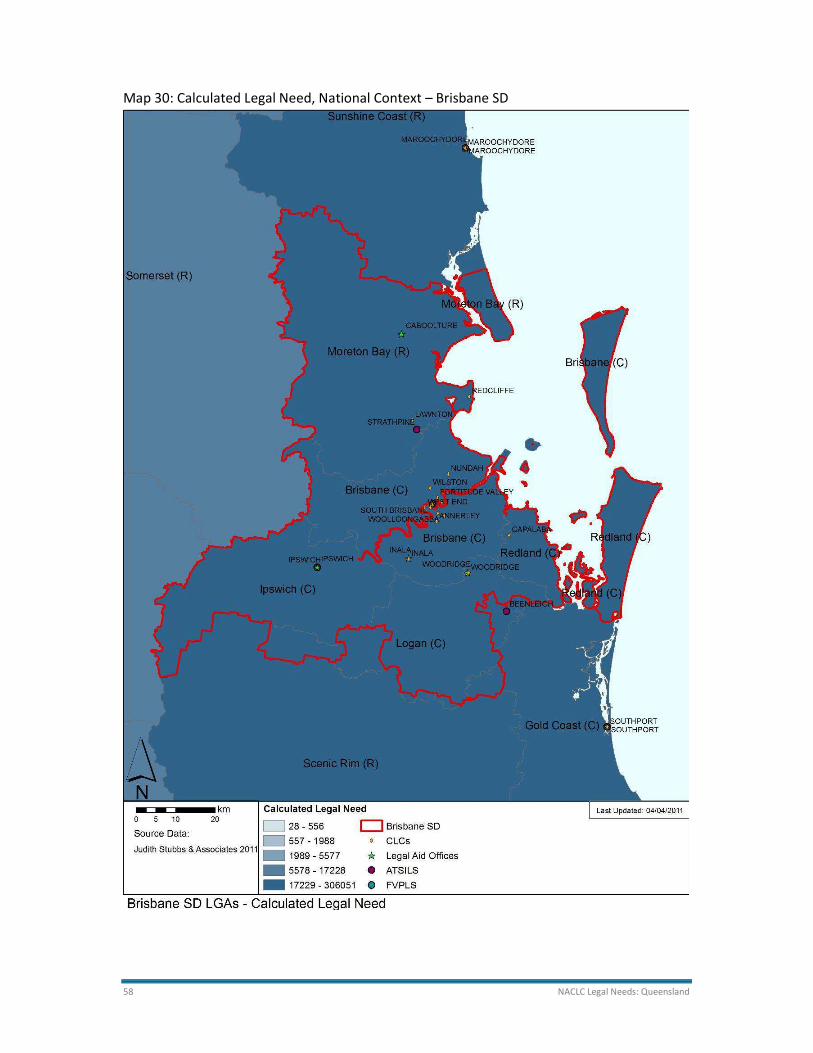
58 NACLC Legal Needs: Queensland
Map 30: Calculated Legal Need, National Context – Brisbane SD
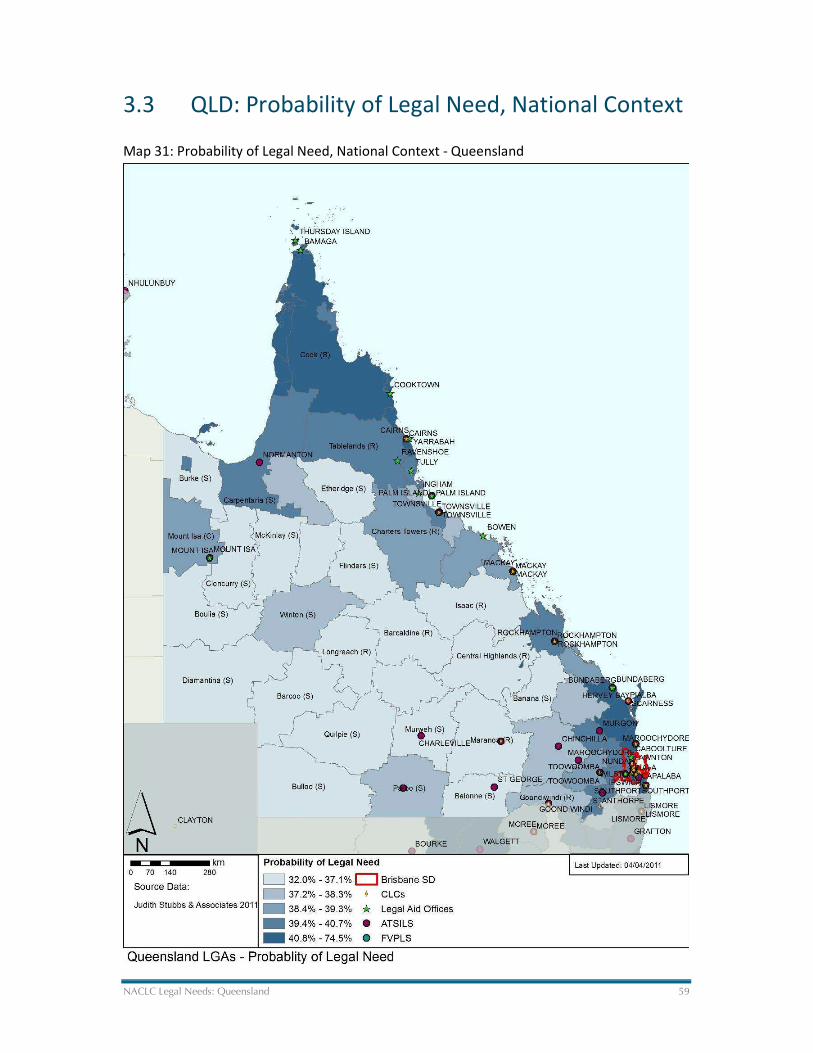
NACLC Legal Needs: Queensland 59
3.3 QLD: Probability of Legal Need, National Context
Map 31: Probability of Legal Need, National Context - Queensland
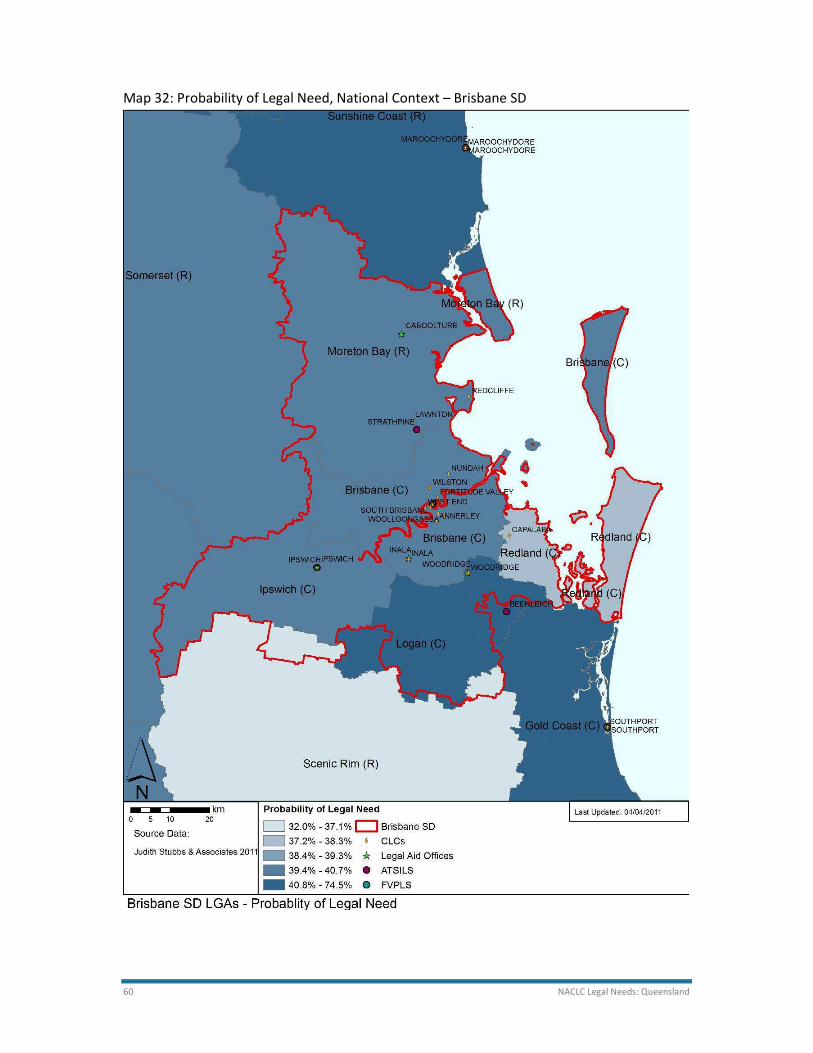
60 NACLC Legal Needs: Queensland
Map 32: Probability of Legal Need, National Context – Brisbane SD
NACLC Legal Needs: Queensland 61
4 QLD: National Need Ratio & Geographic
Gap Analysis
An analysis of potential ‘gaps’ in community legal assistance service coverage of relevance to
CLCs was carried out for this study through a comparison of relative need for each LGA by using
a ‘National CLC Need Ratio’. ‘Expressed need’ (or legal matters reported by CLCs from 2008-
2010) compared with ‘calculated legal need’ (or the number of adults in each LGA likely to have
a legal problem in a three year period).
An assessment of CLC service delivery, with a particular focus on LGAs with a high calculated
legal need (>5,000 adults likely to experience a legal problem) to understand which areas have
limited or no coverage and may be areas for expanded service provision as well as those which
may be over serviced.
4.1 National CLC Need Ratio
In 2009, JSA developed a ‘need ratio’ tool for comparing relative servicing from one LGA to
another using data on ‘expressed need’ compared with ‘calculated legal need’ or the number of
adults likely to have a legal problem.
For this national legal needs project, we have created a similar ‘need ratio’ for Australia and each
state/territory using legal matter data for CLCs provided by the Attorney-General’s Department
and the calculated legal need values described above. The ‘national need ratio’ compares across
all LGAs in Australia. The ‘need ratio’ applied in this project can be described as:
Expressed Need
(LGA matters reported by CLCs 2008-2010
as a % of all such matters for the nation)
‘Need Ratio’ = _________________________________________________________________
Calculated Legal Need
(Adults in an LGA likely to have a legal problem as a % of all adults in
the nation likely to have a legal problem)
Readers are directed to Appendix 1 for a more detailed explanation of methodology and
limitations associated with the need ratios developed for this study.
This section looks at how well calculated legal need is being met relative to levels of reported
matters by CLCs in each LGA (Need Ratio). Need ratios have been classified as very high
(greater than 2.0), high (1.21-2.0), average (0.8-1.2), low (0.4-0.79) and very low (less than 0.4).
Areas with ‘low’ or ‘very low’ need ratio values are generating virtually no matters from CLCs.
Note that the method of analysis is not sufficiently precise to discriminate between areas with
similar Need Ratios, other than in these general terms. For example, a CLC would generally be
more concerned about trying to increase service provision to an area with a ‘low’ or ‘very low’

62 NACLC Legal Needs: Queensland
Need Ratio, rather than redistributing services within the ‘average band’ (0.8 to 1.2) unless of
course it were to provide for more services to ‘average’ LGAs of high disadvantage (low SEIFA
score in the first or second quintile for example). Again, this data is reported in full at Appendix
8.
SEIFA quintiles are represented via colour-coding as follows.
First quintile Second quintile Third quintile Fourth quintile Fifth quintile
A series of tables and maps analysing the distribution of legal matters relative to calculated need
are presented below. Tables show those LGAs with higher than average and lower than average
need ratios, as well as high and low need ratios in the context of high calculated absolute legal
need. Maps are used to present this distribution geographically, aiding the reader to visual spatial
trends evident in the data presented in the tables. Only selected LGAs have been presented in the
subsequent tables, for full analysis of all states readers are directed to the state tables available in
Appendix 8.
4.2 Potential gaps in CLC coverage (catchment
analysis)
It is evident that the distribution of CLC resources is not even across Queensland LGAs. LGAs
with above average need ratios, representing 46.3% of the state’s calculated legal need received
61.9% of available CLC resources (based on matters generated), whilst LGAs with below average
need ratios, expressing 34.2% of the state’s calculated legal need received 20.1% of CLC
resources (based on matters generated). A summary is provided at table 4.1 below.
Table 4-1: Queensland legal need ratio gap analysis - summary table
Legal Need Demand
(Calculated Legal Need) Share
Legal Assistance Supply
(Actual Matters 2008- 2010) Share
Above average need
ratio 559,908 46.3% 110,709 61.9%
Below average need
ratio 413,671 34.2% 35,939 20.1%
Source: Attorney-General’s Department; ABS 2006, 2010; JSA 2011
The uneven distribution of CLC services across Queensland does not reflect socioeconomic
disadvantage (‘disadvantage’), or disadvantage in the context of large populations.
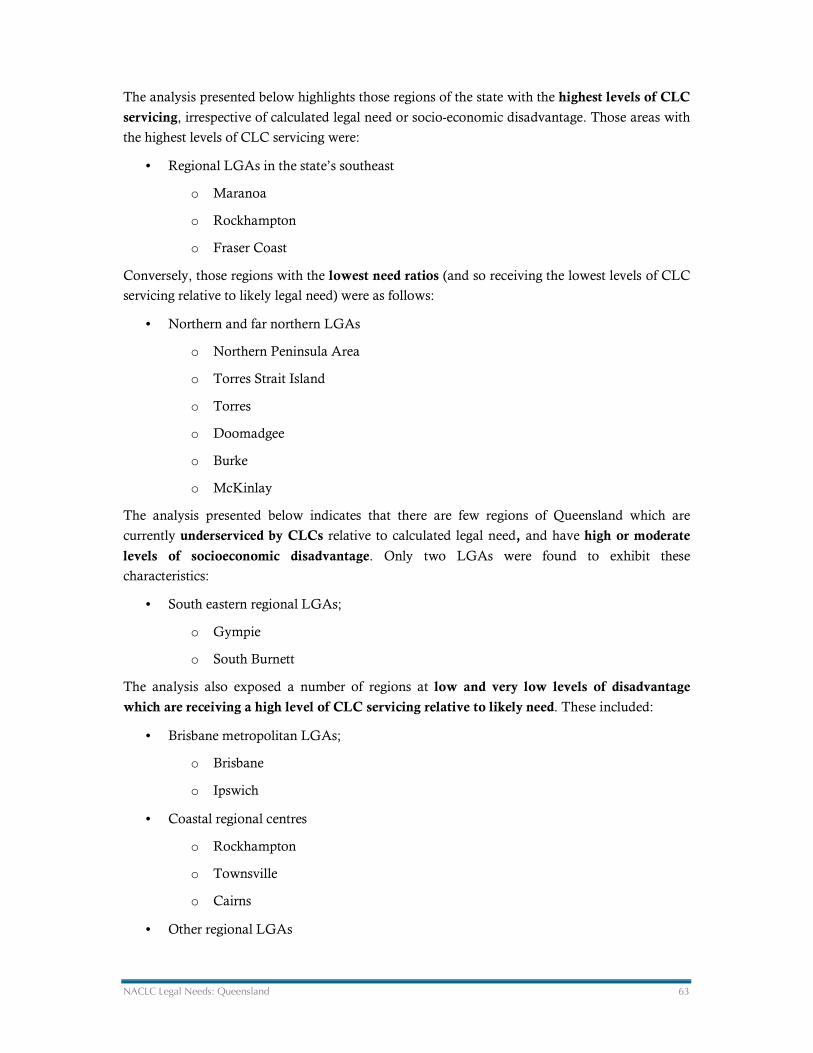
NACLC Legal Needs: Queensland 63
The analysis presented below highlights those regions of the state with the highest levels of CLC
servicing, irrespective of calculated legal need or socio-economic disadvantage. Those areas with
the highest levels of CLC servicing were:
• Regional LGAs in the state’s southeast
o Maranoa
o Rockhampton
o Fraser Coast
Conversely, those regions with the lowest need ratios (and so receiving the lowest levels of CLC
servicing relative to likely legal need) were as follows:
• Northern and far northern LGAs
o Northern Peninsula Area
o Torres Strait Island
o Torres
o Doomadgee
o Burke
o McKinlay
The analysis presented below indicates that there are few regions of Queensland which are
currently underserviced by CLCs relative to calculated legal need, and have high or moderate
levels of socioeconomic disadvantage. Only two LGAs were found to exhibit these
characteristics:
• South eastern regional LGAs;
o Gympie
o South Burnett
The analysis also exposed a number of regions at low and very low levels of disadvantage
which are receiving a high level of CLC servicing relative to likely need. These included:
• Brisbane metropolitan LGAs;
o Brisbane
o Ipswich
• Coastal regional centres
o Rockhampton
o Townsville
o Cairns
• Other regional LGAs
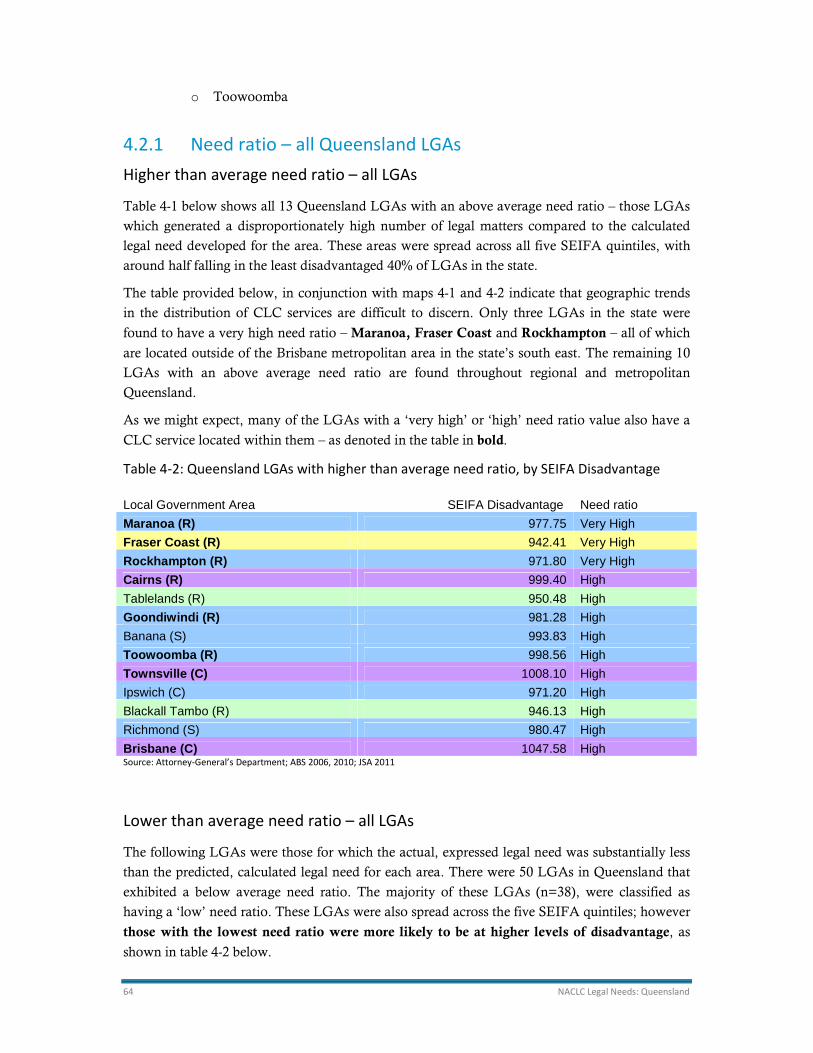
64 NACLC Legal Needs: Queensland
o Toowoomba
4.2.1 Need ratio – all Queensland LGAs
Higher than average need ratio – all LGAs
Table 4-1 below shows all 13 Queensland LGAs with an above average need ratio – those LGAs
which generated a disproportionately high number of legal matters compared to the calculated
legal need developed for the area. These areas were spread across all five SEIFA quintiles, with
around half falling in the least disadvantaged 40% of LGAs in the state.
The table provided below, in conjunction with maps 4-1 and 4-2 indicate that geographic trends
in the distribution of CLC services are difficult to discern. Only three LGAs in the state were
found to have a very high need ratio – Maranoa, Fraser Coast and Rockhampton – all of which
are located outside of the Brisbane metropolitan area in the state’s south east. The remaining 10
LGAs with an above average need ratio are found throughout regional and metropolitan
Queensland.
As we might expect, many of the LGAs with a ‘very high’ or ‘high’ need ratio value also have a
CLC service located within them – as denoted in the table in bold.
Table 4-2: Queensland LGAs with higher than average need ratio, by SEIFA Disadvantage
Local Government Area SEIFA Disadvantage Need ratio
Maranoa (R) 977.75 Very High
Fraser Coast (R) 942.41 Very High
Rockhampton (R) 971.80 Very High
Cairns (R) 999.40 High
Tablelands (R) 950.48 High
Goondiwindi (R) 981.28 High
Banana (S) 993.83 High
Toowoomba (R) 998.56 High
Townsville (C) 1008.10 High
Ipswich (C) 971.20 High
Blackall Tambo (R) 946.13 High
Richmond (S) 980.47 High
Brisbane (C) 1047.58 High Source: Attorney-General’s Department; ABS 2006, 2010; JSA 2011
Lower than average need ratio – all LGAs
The following LGAs were those for which the actual, expressed legal need was substantially less
than the predicted, calculated legal need for each area. There were 50 LGAs in Queensland that
exhibited a below average need ratio. The majority of these LGAs (n=38), were classified as
having a ‘low’ need ratio. These LGAs were also spread across the five SEIFA quintiles; however
those with the lowest need ratio were more likely to be at higher levels of disadvantage, as
shown in table 4-2 below.
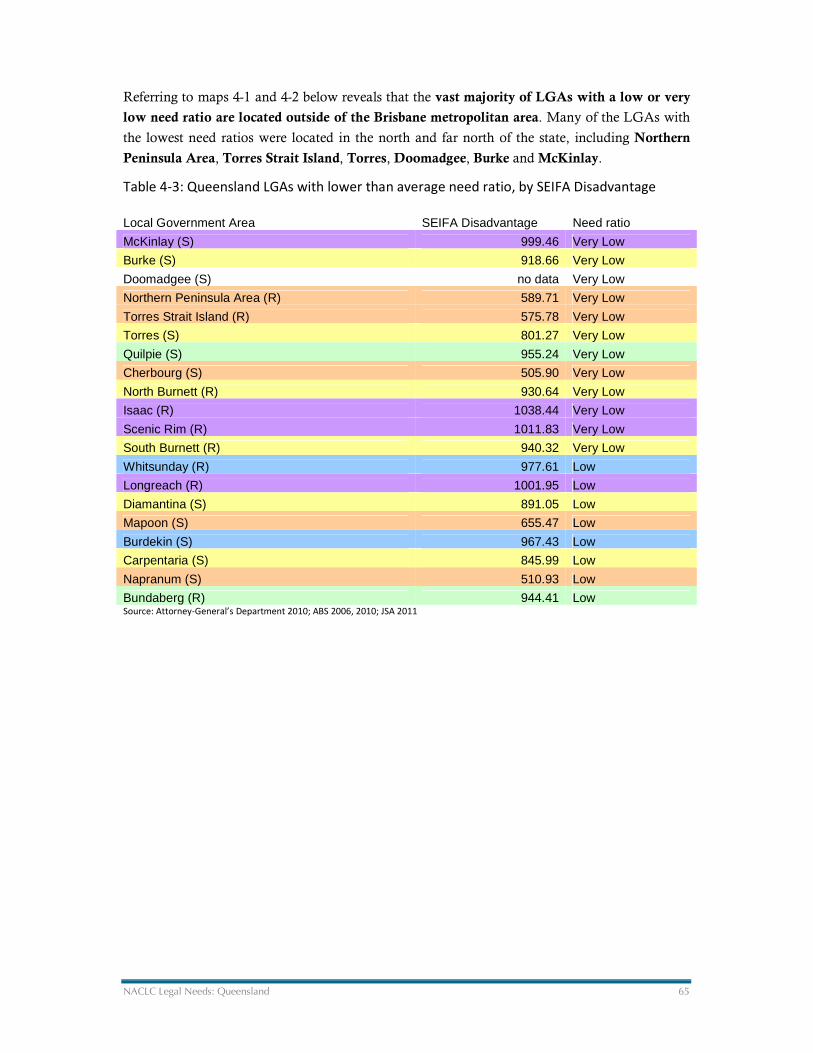
NACLC Legal Needs: Queensland 65
Referring to maps 4-1 and 4-2 below reveals that the vast majority of LGAs with a low or very
low need ratio are located outside of the Brisbane metropolitan area. Many of the LGAs with
the lowest need ratios were located in the north and far north of the state, including Northern
Peninsula Area, Torres Strait Island, Torres, Doomadgee, Burke and McKinlay.
Table 4-3: Queensland LGAs with lower than average need ratio, by SEIFA Disadvantage
Local Government Area SEIFA Disadvantage Need ratio
McKinlay (S) 999.46 Very Low
Burke (S) 918.66 Very Low
Doomadgee (S) no data Very Low
Northern Peninsula Area (R) 589.71 Very Low
Torres Strait Island (R) 575.78 Very Low
Torres (S) 801.27 Very Low
Quilpie (S) 955.24 Very Low
Cherbourg (S) 505.90 Very Low
North Burnett (R) 930.64 Very Low
Isaac (R) 1038.44 Very Low
Scenic Rim (R) 1011.83 Very Low
South Burnett (R) 940.32 Very Low
Whitsunday (R) 977.61 Low
Longreach (R) 1001.95 Low
Diamantina (S) 891.05 Low
Mapoon (S) 655.47 Low
Burdekin (S) 967.43 Low
Carpentaria (S) 845.99 Low
Napranum (S) 510.93 Low
Bundaberg (R) 944.41 Low Source: Attorney-General’s Department 2010; ABS 2006, 2010; JSA 2011
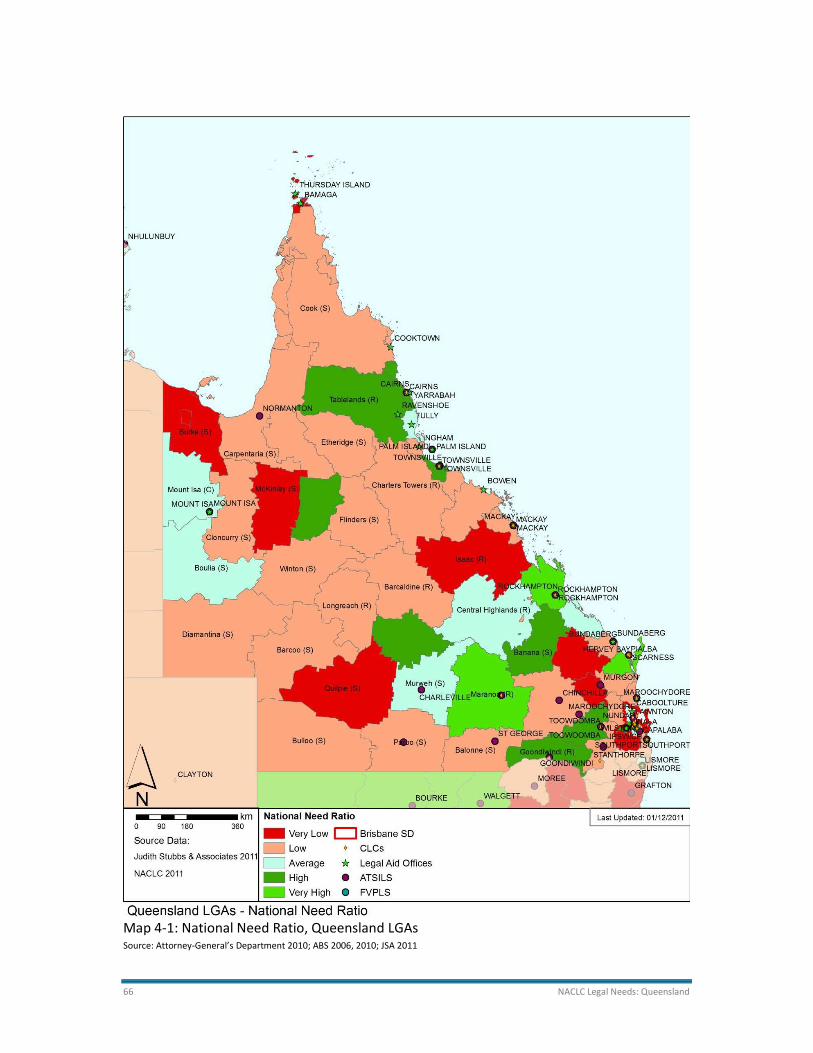
66 NACLC Legal Needs: Queensland
Map 4-1: National Need Ratio, Queensland LGAs Source: Attorney-General’s Department 2010; ABS 2006, 2010; JSA 2011
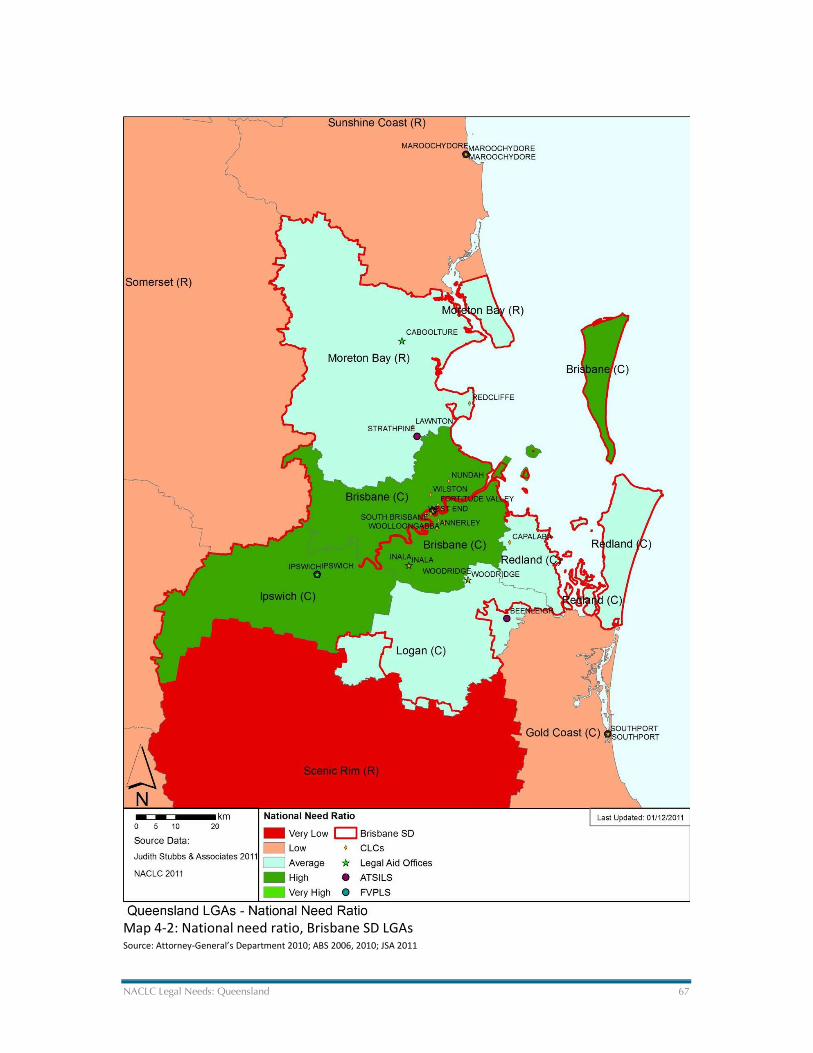
NACLC Legal Needs: Queensland 67
Map 4-2: National need ratio, Brisbane SD LGAs Source: Attorney-General’s Department 2010; ABS 2006, 2010; JSA 2011
68 NACLC Legal Needs: Queensland
4.2.2 Need ratio in the context of high calculated legal need
While some LGAs may generate a proportionally high or low number of matters (per ‘relative
need’ described above), the actual number of matters may not be that ‘large’ or ‘small’, as many
of these LGAs have small resident populations and calculated legal need. An additional analysis
was therefore carried out giving consideration to areas with ‘high calculated legal need’ –
typically those LGAs with more than 5,000 adults likely to have a justiciable problem.
‘Relative Need’ (discussed above) is likely to highlight small remote LGAs that have relatively
poor access to or usage of services, as well as some highly populated areas with high levels of
likely unmet need. However, ‘high calculated legal need’ is important in identifying where the
majority of people live with a legal need live, and identifying those areas which are generating
relatively low matters. Both are valuable measures for planning purposes, depending on what
criteria are used for resource allocation (e.g. remoteness and inaccessibility or high absolute levels
of unmet legal need). Each has different servicing implications, and services generally aim to
balance these types of factors.
For the purposes of analysis, again an ‘average’ Need Ratio of 0.8 to 1.2 was taken as indicating
that the matters generated in an LGA were proportional to need, with higher values indicating
more matters generated proportional to need, and lower values indicating fewer matter generated
proportional to need.
Maps 4-3 and 4-4 below display the national need ratio of all Queensland LGAs deemed to have
a high calculated legal need (>5000 adults).
For more in-depth analysis, readers are directed to a series of Queensland and Brisbane SD maps
provided in the toolkit. These maps have been provided so the reader may visualise legal need
ratios and level of socioeconomic disadvantage for Queensland LGAs. Additionally, maps have
been produced to show only those LGAs with a high calculated legal need (>5000 adults) in
terms of need ratio and SEIFA disadvantage.
Table 4-3 below displays the all 28 Queensland LGAs with a high calculated legal need. LGAs in
the top section of the table are those with a high calculated legal need and an above average need
ratio (and are receiving a relatively high level of CLC servicing), whilst those in the lower section
of the table exhibit a low need ratio (hence receiving a low level of CLC servicing relative to
likely need).
Areas with High Calculated Legal Need and Low Need Ratios
There were 13 Queensland LGAs with a calculated legal need in excess of 5,000 adults that also
have ‘low’ or ‘very low’ need ratio values. These LGAs accounted for 24.5% of the state’s
calculated legal need, yet they were only generating 18.9% of Queensland’s CLC matters.
The majority of these LGAs (n=7) were relatively less disadvantaged areas (SEIFA 4th or 5th
quintiles), whilst only two LGAs (Gympie and South Burnett) had a high level of disadvantage
(SEIFA 2nd quintile).
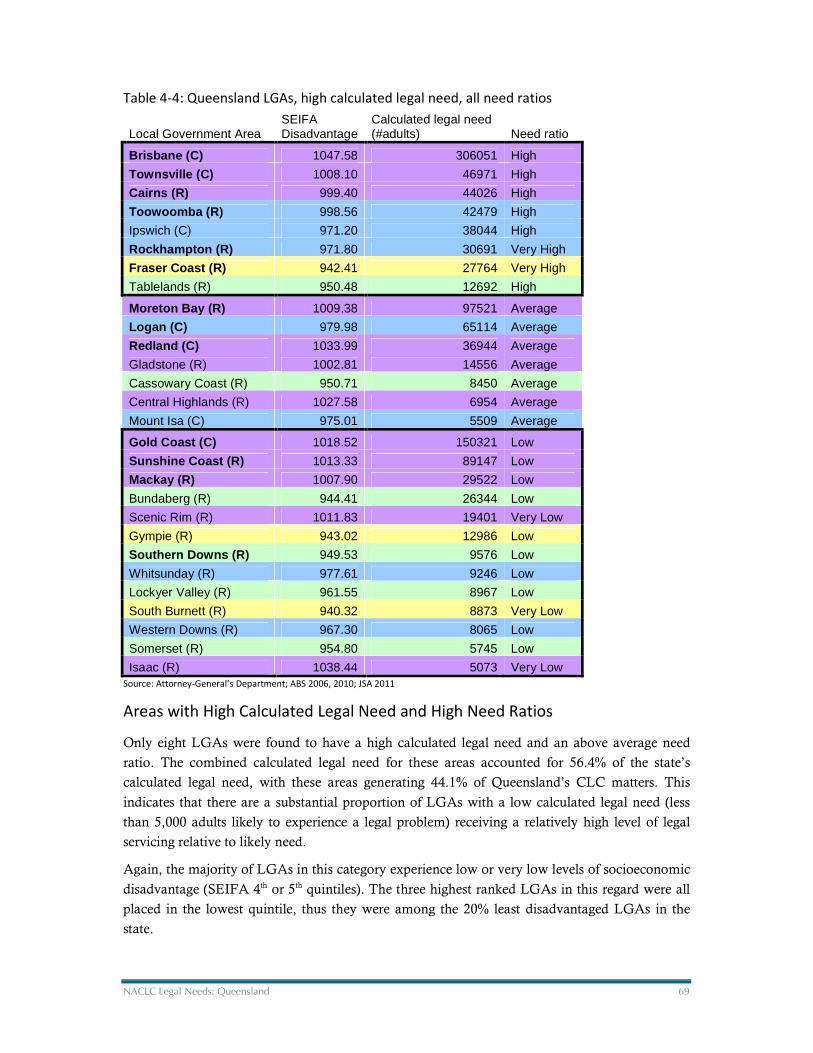
NACLC Legal Needs: Queensland 69
Table 4-4: Queensland LGAs, high calculated legal need, all need ratios
Local Government Area SEIFA Disadvantage
Calculated legal need (#adults) Need ratio
Brisbane (C) 1047.58 306051 High
Townsville (C) 1008.10 46971 High
Cairns (R) 999.40 44026 High
Toowoomba (R) 998.56 42479 High
Ipswich (C) 971.20 38044 High
Rockhampton (R) 971.80 30691 Very High
Fraser Coast (R) 942.41 27764 Very High
Tablelands (R) 950.48 12692 High
Moreton Bay (R) 1009.38 97521 Average
Logan (C) 979.98 65114 Average
Redland (C) 1033.99 36944 Average
Gladstone (R) 1002.81 14556 Average
Cassowary Coast (R) 950.71 8450 Average
Central Highlands (R) 1027.58 6954 Average
Mount Isa (C) 975.01 5509 Average
Gold Coast (C) 1018.52 150321 Low
Sunshine Coast (R) 1013.33 89147 Low
Mackay (R) 1007.90 29522 Low
Bundaberg (R) 944.41 26344 Low
Scenic Rim (R) 1011.83 19401 Very Low
Gympie (R) 943.02 12986 Low
Southern Downs (R) 949.53 9576 Low
Whitsunday (R) 977.61 9246 Low
Lockyer Valley (R) 961.55 8967 Low
South Burnett (R) 940.32 8873 Very Low
Western Downs (R) 967.30 8065 Low
Somerset (R) 954.80 5745 Low
Isaac (R) 1038.44 5073 Very Low Source: Attorney-General’s Department; ABS 2006, 2010; JSA 2011
Areas with High Calculated Legal Need and High Need Ratios
Only eight LGAs were found to have a high calculated legal need and an above average need
ratio. The combined calculated legal need for these areas accounted for 56.4% of the state’s
calculated legal need, with these areas generating 44.1% of Queensland’s CLC matters. This
indicates that there are a substantial proportion of LGAs with a low calculated legal need (less
than 5,000 adults likely to experience a legal problem) receiving a relatively high level of legal
servicing relative to likely need.
Again, the majority of LGAs in this category experience low or very low levels of socioeconomic
disadvantage (SEIFA 4th or 5th quintiles). The three highest ranked LGAs in this regard were all
placed in the lowest quintile, thus they were among the 20% least disadvantaged LGAs in the
state.
70 NACLC Legal Needs: Queensland
Summary of findings on gaps for LGAs with high levels of legal need
The data above suggests that LGAs with the highest levels of legal need are among the least
disadvantaged in Queensland. Many of the LGAs with a high need ratio and high calculated
legal need were ranked in either the 4th or 5th quintile for SEIFA disadvantage. There were three
LGAs with a high calculated legal need which were found to experience some level of SEIFA
socioeconomic disadvantage, all being ranked in the 2nd SEIFA quintile. In this regard, the only
LGAs of particular note (moderate-high levels of socioeconomic disadvantage, high calculated
legal need and low or very low need ratio) were Gympie and South Burnett, both located in the
state’s south east. Again, it is important to remember that many LGAs in Queensland
(particularly the more populated areas of the coast) are very large geographically and have large
populations. The relatively low level of disadvantage reported for many of these LGAs in
comparison to other parts of the state does not mean there are not ‘pockets’, suburbs or
neighbourhoods that are considerably disadvantaged within the LGA.
Interestingly, there were a number of LGAs with a high calculated legal need which had
relatively low levels of CLC servicing, despite having direct access to legal services through a
CLC office located within the boundaries of the LGA. These LGAs are highlighted in bold in
table 4-4 above: Gold Coast (Gold Coast Legal Service), Sunshine Coast (Suncoast Community
Legal Service), Mackay (Mackay Regional Community Legal Centre) and Southern Downs
(Stanthorpe Community Legal Service).
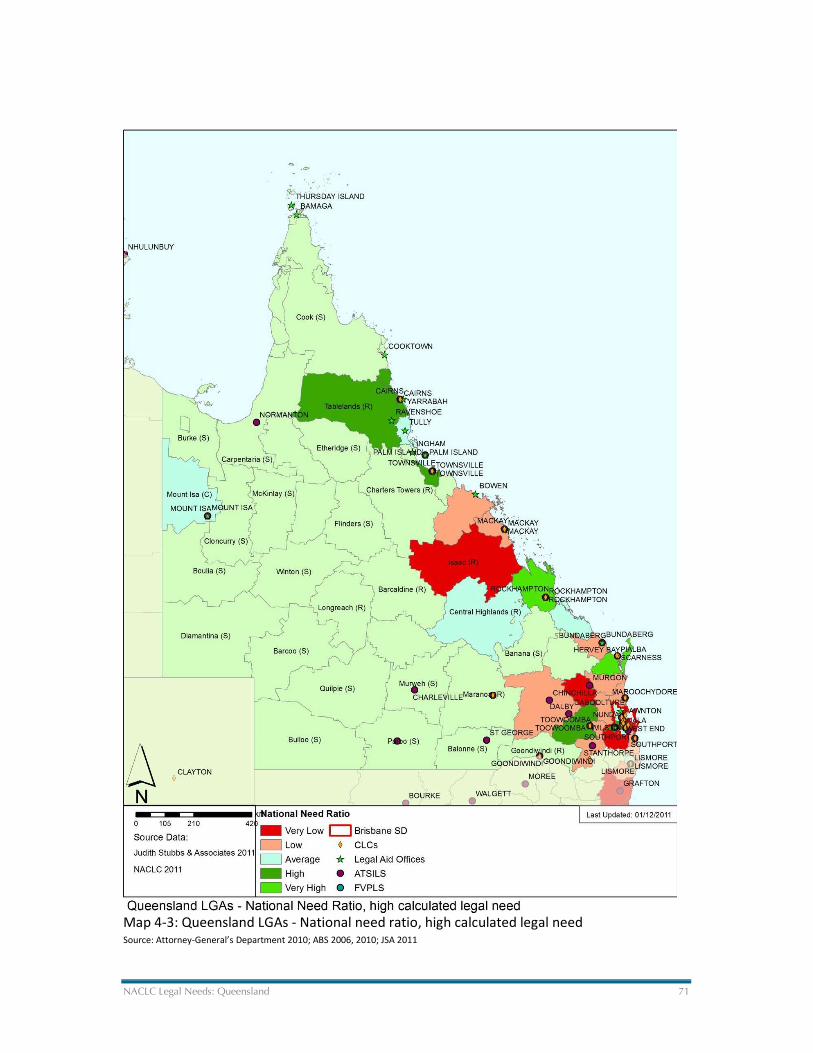
NACLC Legal Needs: Queensland 71
Map 4-3: Queensland LGAs - National need ratio, high calculated legal need Source: Attorney-General’s Department 2010; ABS 2006, 2010; JSA 2011
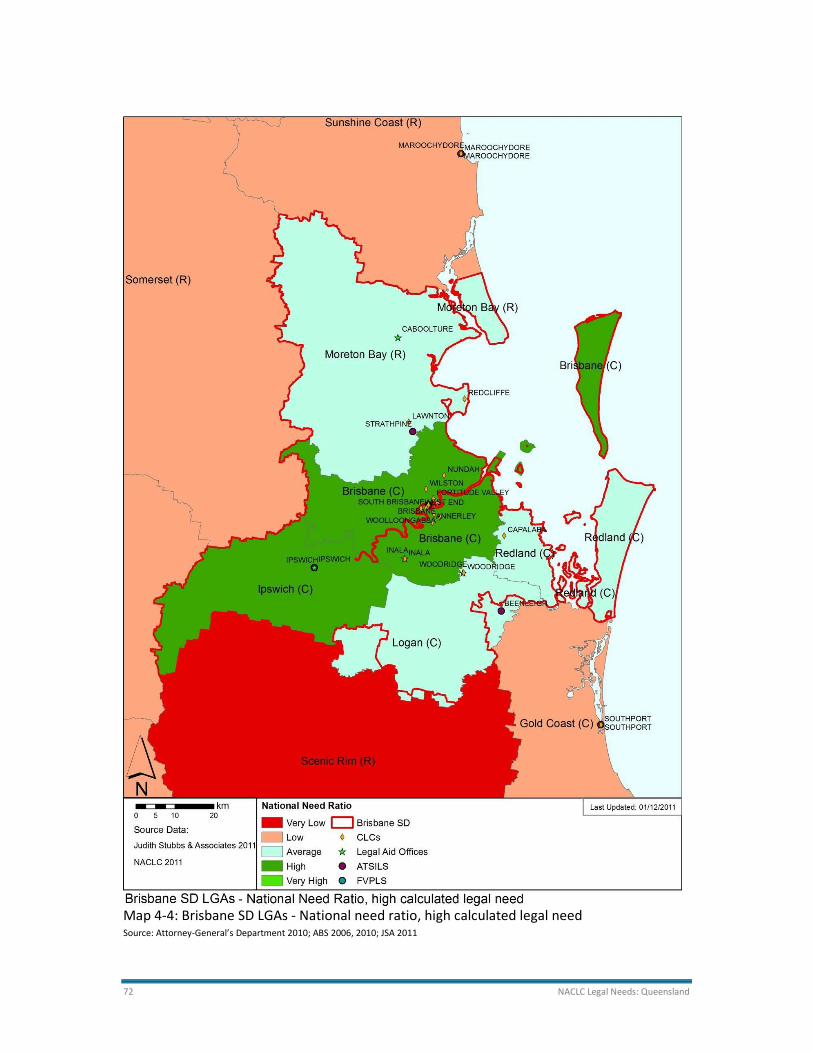
72 NACLC Legal Needs: Queensland
Map 4-4: Brisbane SD LGAs - National need ratio, high calculated legal need Source: Attorney-General’s Department 2010; ABS 2006, 2010; JSA 2011