Embed Size (px)
DESCRIPTION
National Medicines Policies & Monitoring Implementation. Richard Laing EMP/MIE. Department of Medicines Policy and Standards. Objectives. Review the history of NDPs Discuss the background to NDP’s List the Components of a NDP Review actors involved in the NDP process - PowerPoint PPT Presentation
Citation preview
National Medicines Policies& Monitoring Implementation
Richard Laing EMP/MIE
Department of Medicines Policy and Standards
Department of Essential Medicines & Pharmaceutical Policy
2 |
Objectives
Review the history of NDPsDiscuss the background to NDP’sList the Components of a NDPReview actors involved in the NDP processDebate characteristics of an NDPDiscuss the Global Pharmaceutical MarketDiscuss Monitoring Implementation of
NMPs
Department of Essential Medicines & Pharmaceutical Policy
3 |
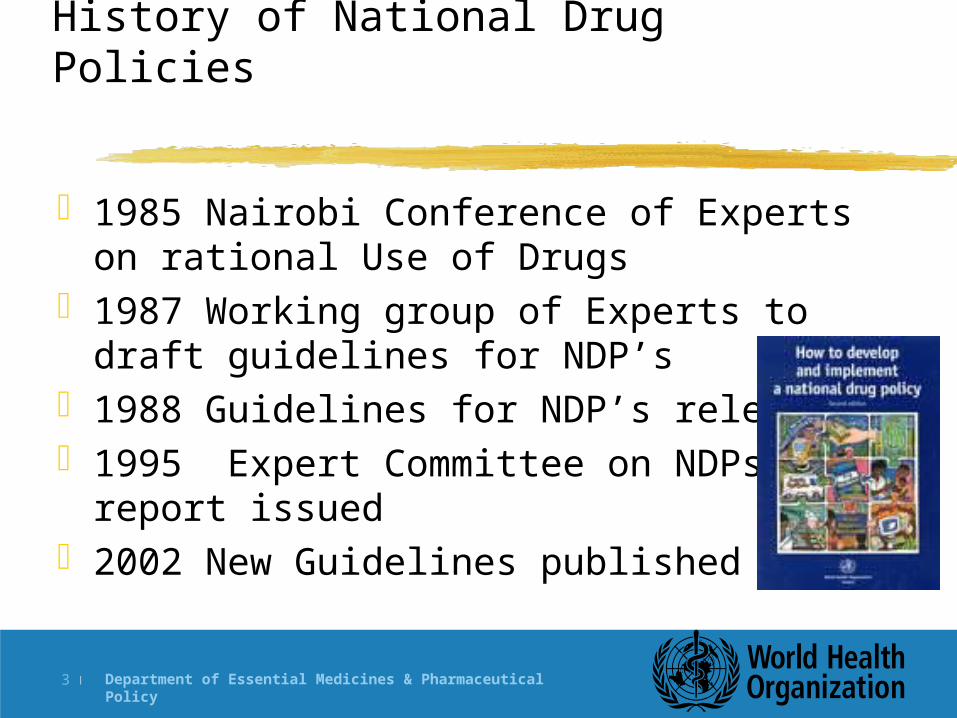
History of National Drug Policies
1985 Nairobi Conference of Experts on rational Use of Drugs
1987 Working group of Experts to draft guidelines for NDP’s
1988 Guidelines for NDP’s released1995 Expert Committee on NDPs met
report issued2002 New Guidelines published
Department of Essential Medicines & Pharmaceutical Policy
4 |
Background to NDP’s
Need for common framework to coordinate many different actors in the pharmaceutical field:
These include regulators (quality, safety and efficacy), producers (local & international), users (prescribers & consumers), health planners & managers, health finance authorities and researchers.
Each have valid interests in the field which may be contradictory or supportive
Involves both public & private sectors
Department of Essential Medicines & Pharmaceutical Policy
5 |
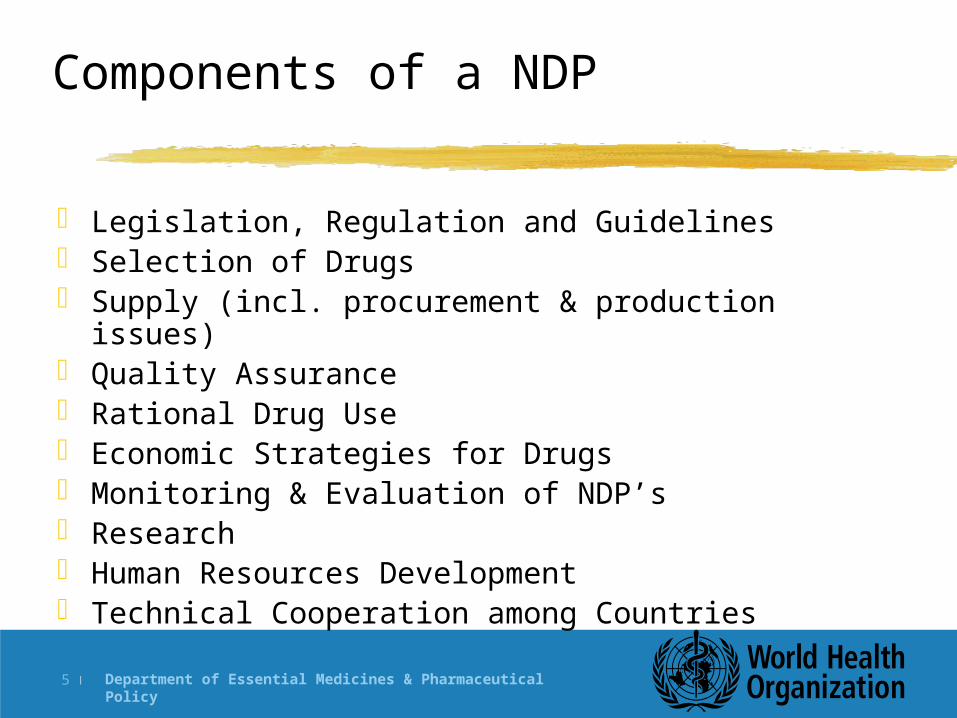
Components of a NDP
Legislation, Regulation and Guidelines Selection of Drugs Supply (incl. procurement & production issues) Quality Assurance Rational Drug Use Economic Strategies for Drugs Monitoring & Evaluation of NDP’s Research Human Resources Development Technical Cooperation among Countries
Department of Essential Medicines & Pharmaceutical Policy
6 |
Overview of Components
Each component has a crucial part in the overall policy!
Emphasizing one component at the expense of others, weakens the entire policy
Many different actors are involved. Some are outside MoH, some outside government, some outside country
Means that NDP planners need to be aware, though not expert, in all areas!
Department of Essential Medicines & Pharmaceutical Policy
7 |
Many Actors Involved! Some pro, some against!
Doctors, specialists, public/privatePharmacists retail and manufacturingLocal and international producers, importersConsumers/PatientsMediaRegulators Insurance CompaniesEtc, Etc,
Department of Essential Medicines & Pharmaceutical Policy
8 |
Characteristics of a National Medicines Policy
Essential part of health policy, must fit within the framework of a particular health care system.
Goals should be consistent with broader health objectives
Health policy and the level of service provision in a particular country are important determinants of drug policy and define the range of choices and options.
Implementation of an effective drug policy promotes confidence in and use of health services.
Department of Essential Medicines & Pharmaceutical Policy
9 |
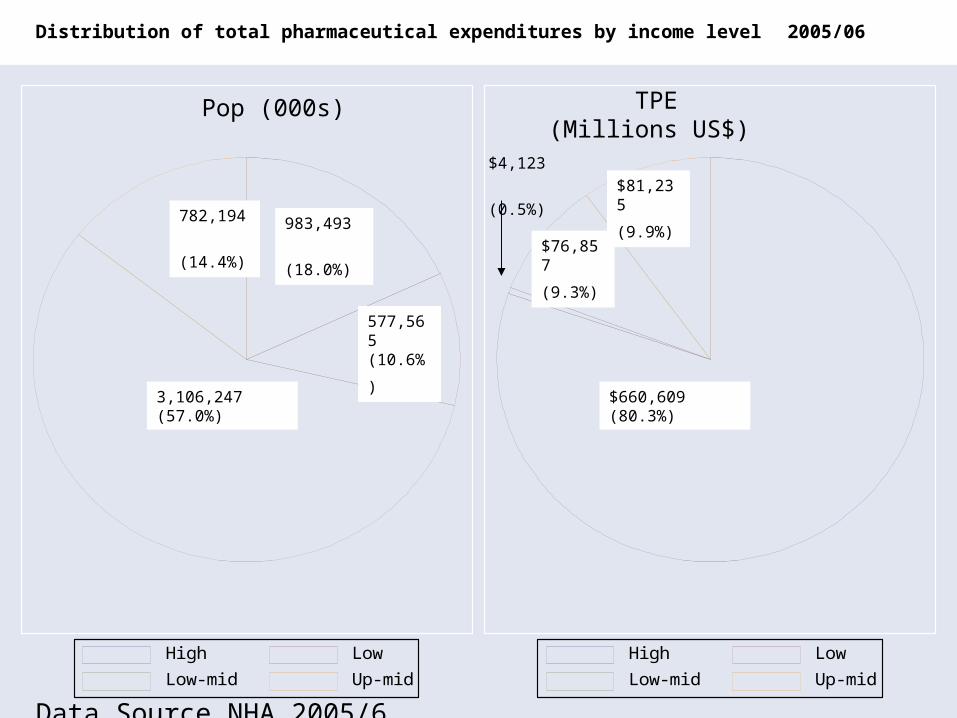
High Low
Low-mid Up-mid
High Low
Low-mid Up-mid
3,106,247 (57.0%)
983,493
(18.0%)
782,194
(14.4%)
577,565
(10.6%)
Pop (000s) TPE (Millions US$)
$660,609 (80.3%)
$81,235
(9.9%) $76,857
(9.3%)
$4,123
(0.5%)
Distribution of total pharmaceutical expenditures by income level 2005/06
Data Source NHA 2005/6
Department of Essential Medicines & Pharmaceutical Policy
10 |
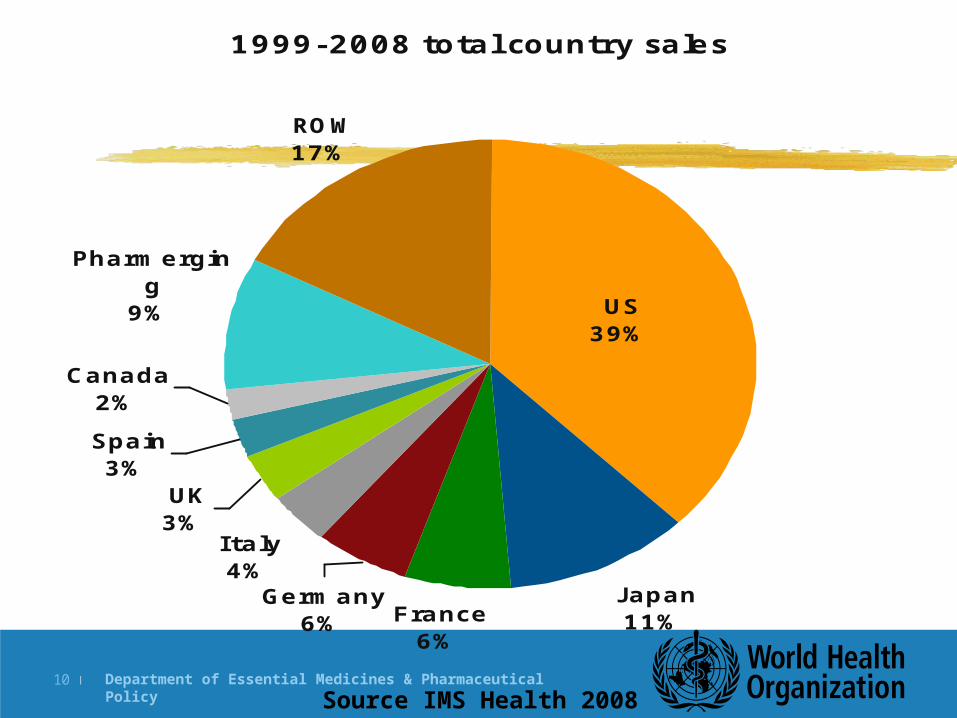
1999-2008 total country sales
J apan11%France
6%
Germany6%
US39%
Pharmerging
9%
ROW17%
Spain3%
Canada2%
UK3%
Italy4%
Source IMS Health 2008
Department of Essential Medicines & Pharmaceutical Policy
11 |
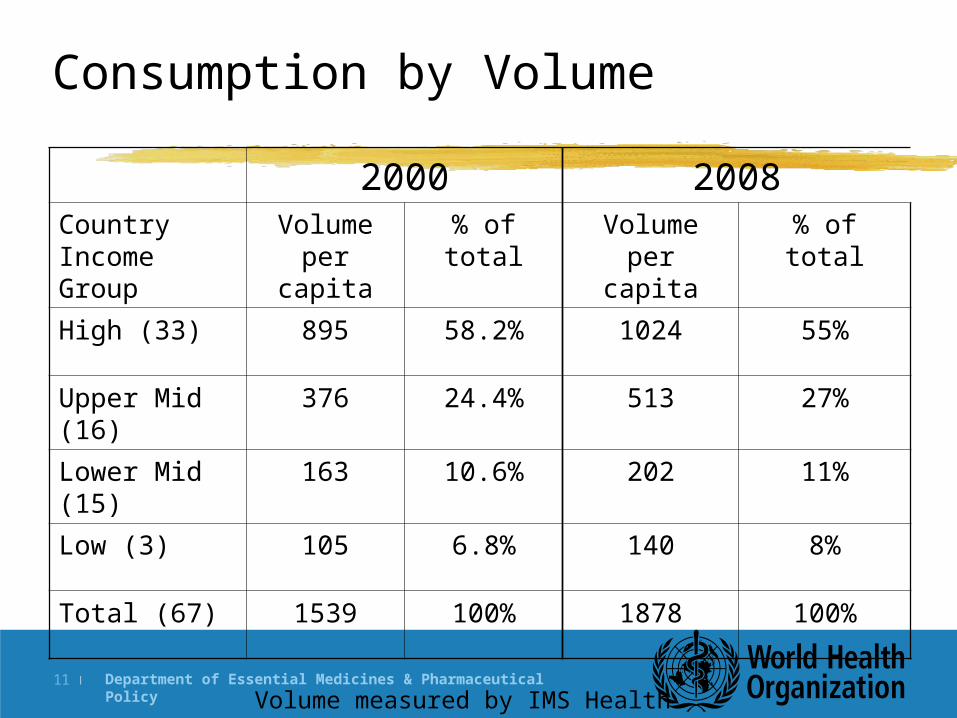
Consumption by Volume
2000 2008Country Income Group
Volume per capita
% of total Volume per capita
% of total
High (33) 895 58.2% 1024 55%
Upper Mid (16)
376 24.4% 513 27%
Lower Mid (15)
163 10.6% 202 11%
Low (3) 105 6.8% 140 8%
Total (67) 1539 100% 1878 100%
Volume measured by IMS Health Standard Units
Department of Essential Medicines & Pharmaceutical Policy
12 |
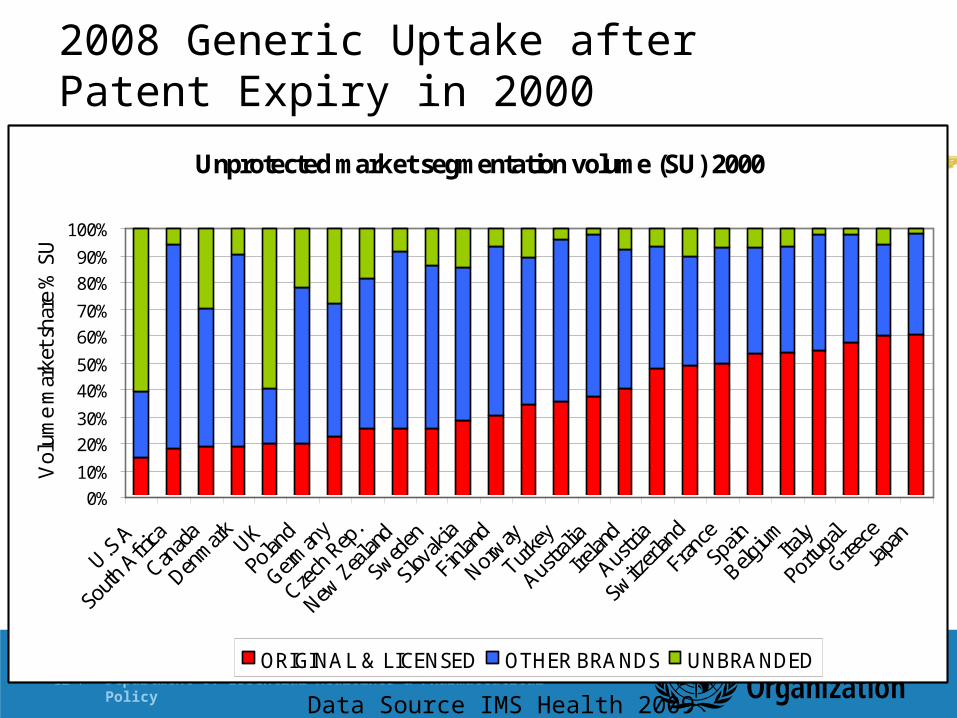
2008 Generic Uptake after Patent Expiry in 2000
Unprotected market segmentation volume (SU) 2000
0%
10%
20%
30%
40%
50%
60%
70%
80%
90%
100%
U.S.A
South A
frica
Canad
a
Denmark UK
Poland
German
y
Czech
Rep
.
New Z
ealan
d
Sweden
Slovak
ia
Finlan
d
Norway
Turke
y
Australi
a
Irelan
d
Austria
Switzerl
and
France
Spain
Belgium
Italy
Portugal
Greece
Japa
n
Vol
ume
mar
ket s
hare
% S
U
ORIGINAL & LICENSED OTHER BRANDS UNBRANDED
Data Source IMS Health 2009
Department of Essential Medicines & Pharmaceutical Policy
13 |
THANK YOU