Embed Size (px)
Citation preview
NATIONAL MILK DRUG RESIDUE DATA BASE
FISCAL YEAR 2016 ANNUAL REPORT
October 1, 2015 - September 30, 2016
Submitted by:
GLH, Incorporated 958 Steamboat Lane
Heathsville, VA 22473 804-580-2166
Contract Number: HHSF 223 2013 10019C
February 14, 2017
i
TABLE OF CONTENTS SECTION PAGE
INTRODUCTION ............................................................................................................ 1
BACKGROUND ............................................................................................................. 1
SUMMARY ..................................................................................................................... 2
SAMPLE RESULTS ....................................................................................................... 2
TABLE 1 Sample Results ............................................................................................... 3
TABLE 2 Industry and Regulatory Samples ................................................................... 5
TESTS CONDUCTED TABLE 3 Tests Conducted by Sample Sources ....................................................... 6 TABLE 3A Validated Tests Conducted ....................................................................... 7 TABLE 3B Non-Validated Tests Conducted ............................................................... 7 TABLE 4 Tests Conducted by Industry and Regulatory Agencies ............................ 8 TABLE 4A Validated Tests Conducted by Industry and Regulatory Agencies ............ 9 TABLE 4B Non-Validated Tests Conducted by Industry and Regulatory Agencies ... 10 TABLE 5 Number of Tests Conducted by Family/Drug ........................................... 11 TABLE 5A Number of Validated Tests Conducted by Family/Drug ........................... 11 TABLE 5B Number of Non-Validated Tests Conducted by Family/Drug ................... 11 TABLE 6 Number of Tests by Method by Family/Drug ........................................... 12 TABLE 6A Comparison of Validated and Non-Validated Tests ................................. 14 TABLE 7-1 Grade “A” Bulk Milk Pickup Tanker Testing ............................................. 15 TABLE 7-2 Grade “A” Pasteurized Fluid Milk and Milk Products Testing ................... 15 TABLE 7-3 Grade “A” Producer Testing .................................................................... 15 TABLE 7-4 Grade “A” Other Testing (Milk from milk plant tanks/silos, milk transport tankers, etc.) ..................................................................... 16 TABLE 7-5 Non-Grade “A” Bulk Milk Pickup Tanker Testing ..................................... 16
ii
TABLE OF CONTENTS
SECTION PAGE
TABLE 7-6 Non-Grade “A” Pasteurized Fluid Milk and Milk Products Testing ........... 16 TABLE 7-7 Non-Grade “A” Producer Testing ............................................................ 17 TABLE 7-8 Non-Grade “A” Other Testing (Milk from milk plant tanks/silos, milk transport tankers, etc.) ..................................................................... 17 TABLE 8-1 Number of Tests by Method by Family/Drug for Grade “A” Bulk Milk Pickup Tanker Testing ............................................. 18 TABLE 8-2 Number of Tests by Method by Family/Drug for Grade “A” Pasteurized Fluid Milk and Milk Products Testing ................... 20 TABLE 8-3 Number of Tests by Method by Family/Drug for Grade “A” Producer Testing .................................................................... 21 TABLE 8-4 Number of Tests by Method by Family/Drug for Grade “A” Other Testing (Milk from milk plant tanks/silos, milk transport tankers, etc.) ..................................................................... 22 TABLE 8-5 Number of Tests by Method by Family/Drug for Non-Grade “A” Bulk Milk Pickup Tanker Testing ..................................... 23 TABLE 8-6 Number of Tests by Method by Family/Drug for Non-Grade “A” Pasteurized Fluid Milk and Milk Products Testing ........... 24 TABLE 8-7 Number of Tests by Method by Family/Drug for Non-Grade “A” Producer Testing ............................................................ 24 TABLE 8-8 Number of Tests by Method by Family/Drug for Non-Grade “A” Other Testing (Milk from milk plant tanks/silos, milk transport tankers, etc.) ..................................................................... 25
NMDRD FY 2016 Page 1
NATIONAL MILK DRUG RESIDUE DATA BASE FISCAL YEAR 2016 ANNUAL REPORT
October 1, 2015 - September 30, 2016 INTRODUCTION The National Milk Drug Residue Data Base (NMDRD) is a voluntary industry reporting program. Mandatory reporting is required by State Regulatory Agencies under the National Conference on Interstate Milk Shipments (NCIMS). Data are reported on the extent of the national testing activities, the analytical methods used, the kind and extent of the animal drug residues identified, and the amount of contaminated milk that was removed from the human food supply. The system includes all milk, Grade “A” and non-Grade “A”, commonly known as manufacturing grade. Grade “A” milk represents approximately 99% of the milk supply in the United States and is regulated through the NCIMS by the State Regulatory Agencies. Manufacturing grade milk is under the direction of the Regulatory Agencies in the States where it is produced and may be subject to the standards recommended by the United States Department of Agriculture (USDA). Data reported to the NMDRD are for educational and analytical purposes and are not intended or suitable for regulatory action or follow up. BACKGROUND The NCIMS is a voluntary organization directed and controlled by member States to promote the availability of a high quality milk supply. The Food and Drug Administration (FDA) and the NCIMS through their collaborative efforts have developed a cooperative, federal-state program (the Grade “A” Interstate Milk Shippers Program) to ensure the sanitary quality of Grade “A” milk and milk products shipped in interstate commerce. During the 1991 meeting of the NCIMS, the Conference authorized a national program to compile the results of milk drug residue testing by industry and State Regulatory Agencies. Subsequently, FDA awarded a contract to develop a NMDRD. The data base is operated by an independent third party, under contract to the FDA. The data base design was developed in consultation with a project advisory group with members from the FDA and a NCIMS committee representing dairy producers, dairy processors, USDA, State Regulatory Agencies, and academia. The data base was designed to promote maximum participation by the dairy industry to report on a voluntary basis all of their testing results, without compromising any confidential data. Information regarding individual firm's data is not submitted to the data base contractor. It is important to recognize that the samples and tests reported do not necessarily represent one hundred percent (100%) of the milk supply from every State. However, as State and industry participation in the data base increased, reporting of the number of samples and tests similarly increased. Continuing efforts are being made to ensure that there is uniform reporting among all the States and the industry and to ensure that the drugs and test methods reported are correct. Through collaboration with test kit manufacturers and FDA, the contractor is attempting to update the drug code list utilized with the reporting application at least every six months to assure that outdated codes are removed and new test codes have been created for new test kits. The most recent drug code list can be found on the data base contractor’s web site at: https://www.kandc-sbcc.com/nmdrd/.
NMDRD FY 2016 Page 2
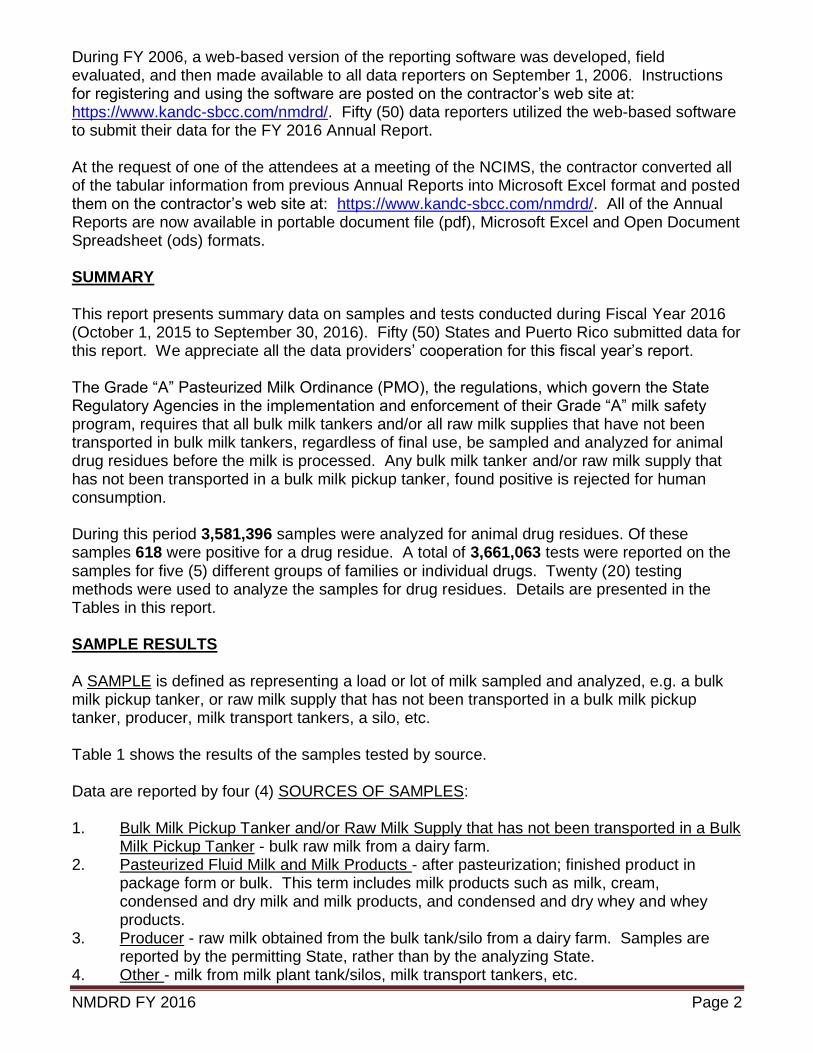
During FY 2006, a web-based version of the reporting software was developed, field evaluated, and then made available to all data reporters on September 1, 2006. Instructions for registering and using the software are posted on the contractor’s web site at: https://www.kandc-sbcc.com/nmdrd/. Fifty (50) data reporters utilized the web-based software to submit their data for the FY 2016 Annual Report. At the request of one of the attendees at a meeting of the NCIMS, the contractor converted all of the tabular information from previous Annual Reports into Microsoft Excel format and posted them on the contractor’s web site at: https://www.kandc-sbcc.com/nmdrd/. All of the Annual Reports are now available in portable document file (pdf), Microsoft Excel and Open Document Spreadsheet (ods) formats. SUMMARY This report presents summary data on samples and tests conducted during Fiscal Year 2016 (October 1, 2015 to September 30, 2016). Fifty (50) States and Puerto Rico submitted data for this report. We appreciate all the data providers’ cooperation for this fiscal year’s report. The Grade “A” Pasteurized Milk Ordinance (PMO), the regulations, which govern the State Regulatory Agencies in the implementation and enforcement of their Grade “A” milk safety program, requires that all bulk milk tankers and/or all raw milk supplies that have not been transported in bulk milk tankers, regardless of final use, be sampled and analyzed for animal drug residues before the milk is processed. Any bulk milk tanker and/or raw milk supply that has not been transported in a bulk milk pickup tanker, found positive is rejected for human consumption. During this period 3,581,396 samples were analyzed for animal drug residues. Of these samples 618 were positive for a drug residue. A total of 3,661,063 tests were reported on the samples for five (5) different groups of families or individual drugs. Twenty (20) testing methods were used to analyze the samples for drug residues. Details are presented in the Tables in this report. SAMPLE RESULTS A SAMPLE is defined as representing a load or lot of milk sampled and analyzed, e.g. a bulk milk pickup tanker, or raw milk supply that has not been transported in a bulk milk pickup tanker, producer, milk transport tankers, a silo, etc. Table 1 shows the results of the samples tested by source. Data are reported by four (4) SOURCES OF SAMPLES: 1. Bulk Milk Pickup Tanker and/or Raw Milk Supply that has not been transported in a Bulk
Milk Pickup Tanker - bulk raw milk from a dairy farm. 2. Pasteurized Fluid Milk and Milk Products - after pasteurization; finished product in
package form or bulk. This term includes milk products such as milk, cream, condensed and dry milk and milk products, and condensed and dry whey and whey products.
3. Producer - raw milk obtained from the bulk tank/silo from a dairy farm. Samples are reported by the permitting State, rather than by the analyzing State. 4. Other - milk from milk plant tank/silos, milk transport tankers, etc.
NMDRD FY 2016 Page 3
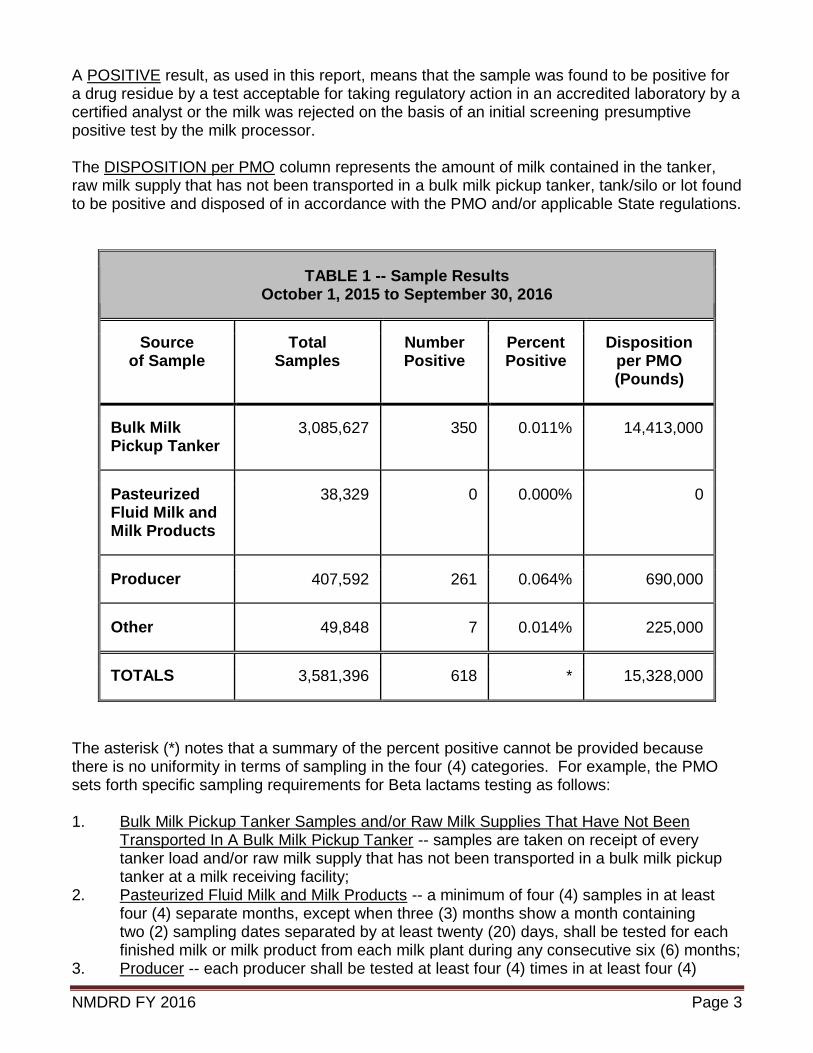
A POSITIVE result, as used in this report, means that the sample was found to be positive for a drug residue by a test acceptable for taking regulatory action in an accredited laboratory by a certified analyst or the milk was rejected on the basis of an initial screening presumptive positive test by the milk processor. The DISPOSITION per PMO column represents the amount of milk contained in the tanker, raw milk supply that has not been transported in a bulk milk pickup tanker, tank/silo or lot found to be positive and disposed of in accordance with the PMO and/or applicable State regulations.
TABLE 1 -- Sample Results October 1, 2015 to September 30, 2016
Source of Sample
Total Samples
Number Positive
Percent Positive
Disposition per PMO (Pounds)
Bulk Milk Pickup Tanker
3,085,627 350 0.011% 14,413,000
Pasteurized Fluid Milk and Milk Products
38,329 0 0.000% 0
Producer 407,592 261 0.064% 690,000
Other 49,848 7 0.014% 225,000
TOTALS 3,581,396 618 * 15,328,000
The asterisk (*) notes that a summary of the percent positive cannot be provided because there is no uniformity in terms of sampling in the four (4) categories. For example, the PMO sets forth specific sampling requirements for Beta lactams testing as follows: 1. Bulk Milk Pickup Tanker Samples and/or Raw Milk Supplies That Have Not Been
Transported In A Bulk Milk Pickup Tanker -- samples are taken on receipt of every tanker load and/or raw milk supply that has not been transported in a bulk milk pickup tanker at a milk receiving facility;
2. Pasteurized Fluid Milk and Milk Products -- a minimum of four (4) samples in at least four (4) separate months, except when three (3) months show a month containing two (2) sampling dates separated by at least twenty (20) days, shall be tested for each finished milk or milk product from each milk plant during any consecutive six (6) months;
3. Producer -- each producer shall be tested at least four (4) times in at least four (4)
NMDRD FY 2016 Page 4
separate months, except when three (3) months show a month containing two (2) sampling dates separated by at least twenty (20) days, during any consecutive six (6) months; and
4. Other -- samples are conducted on a random basis. Table 2 presents these results in greater detail and indicates the number of samples conducted by industry and by State Regulatory Agencies. Industry samples are taken by milk plants, receiving and transfer stations, and marketing groups or cooperatives. Industry sampling and testing may be conducted to meet the industry requirements of Appendix N of the PMO, which sets forth testing and reporting requirements for animal drug residues or for quality control purposes. Regulatory samples are taken by State and Local Regulatory Agencies.
NMDRD FY 2016 Page 5
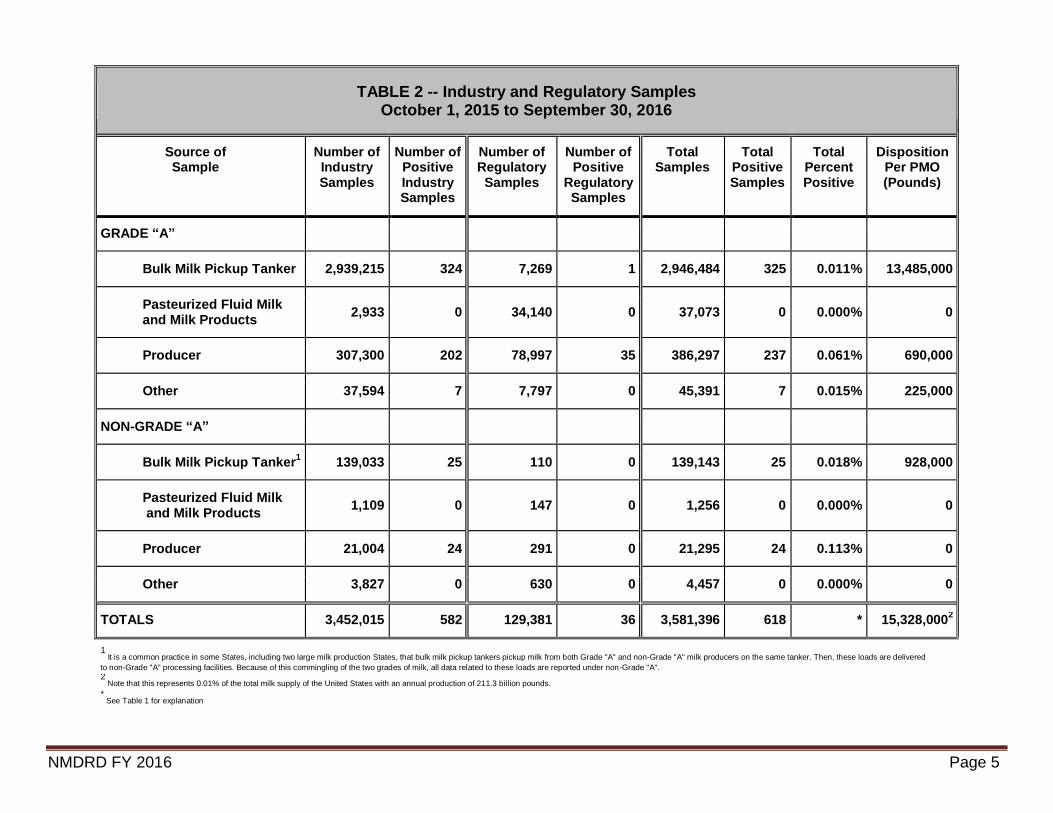
TABLE 2 -- Industry and Regulatory Samples October 1, 2015 to September 30, 2016
Source of Sample
Number of Industry Samples
Number of Positive Industry Samples
Number of Regulatory
Samples
Number of Positive
Regulatory Samples
Total Samples
Total Positive Samples
Total Percent Positive
Disposition Per PMO (Pounds)
GRADE “A”
Bulk Milk Pickup Tanker 2,939,215 324 7,269 1 2,946,484 325 0.011% 13,485,000
Pasteurized Fluid Milk and Milk Products
2,933 0 34,140 0 37,073 0 0.000% 0
Producer 307,300 202 78,997 35 386,297 237 0.061% 690,000
Other 37,594 7 7,797 0 45,391 7 0.015% 225,000
NON-GRADE “A”
Bulk Milk Pickup Tanker1 139,033 25 110 0 139,143 25 0.018% 928,000
Pasteurized Fluid Milk and Milk Products
1,109 0 147 0 1,256 0 0.000% 0
Producer 21,004 24 291 0 21,295 24 0.113% 0
Other 3,827 0 630 0 4,457 0 0.000% 0
TOTALS 3,452,015 582 129,381 36 3,581,396 618 * 15,328,0002
1 It is a common practice in some States, including two large milk production States, that bulk milk pickup tankers pickup milk from both Grade "A" and non-Grade "A" milk producers on the same tanker. Then, these loads are delivered
to non-Grade "A" processing facilities. Because of this commingling of the two grades of milk, all data related to these loads are reported under non-Grade "A". 2
Note that this represents 0.01% of the total milk supply of the United States with an annual production of 211.3 billion pounds.
* See Table 1 for explanation
NMDRD FY 2016 Page 6
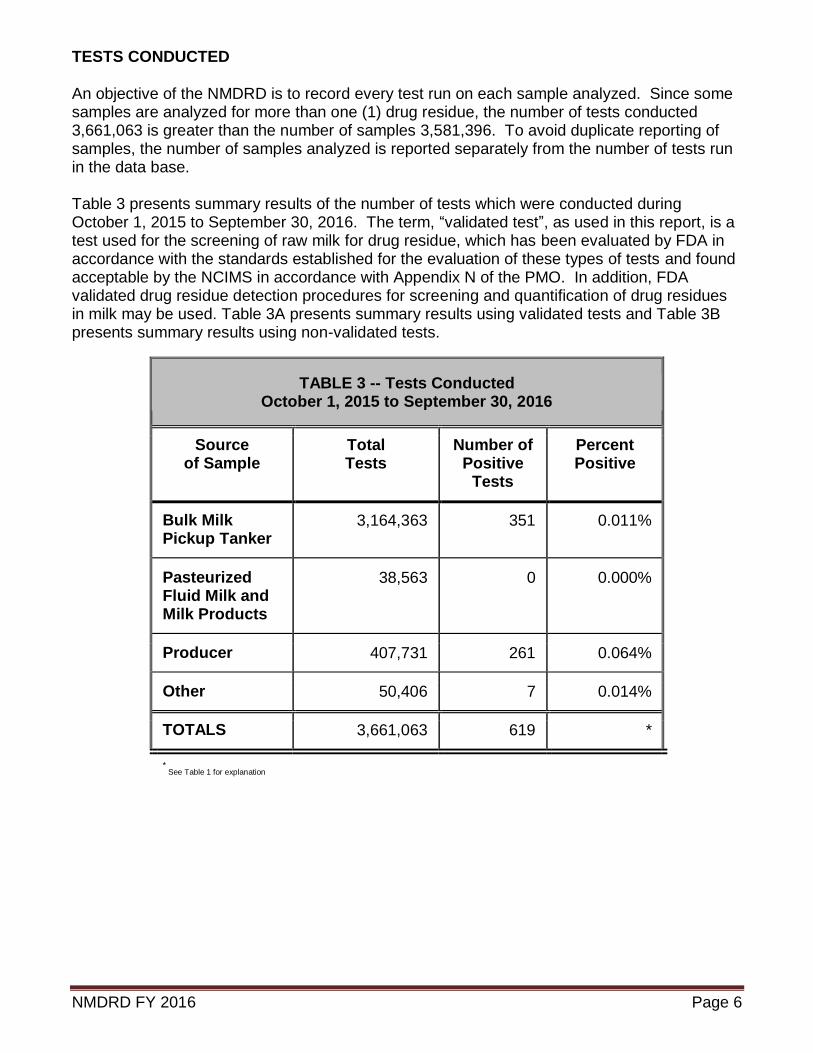
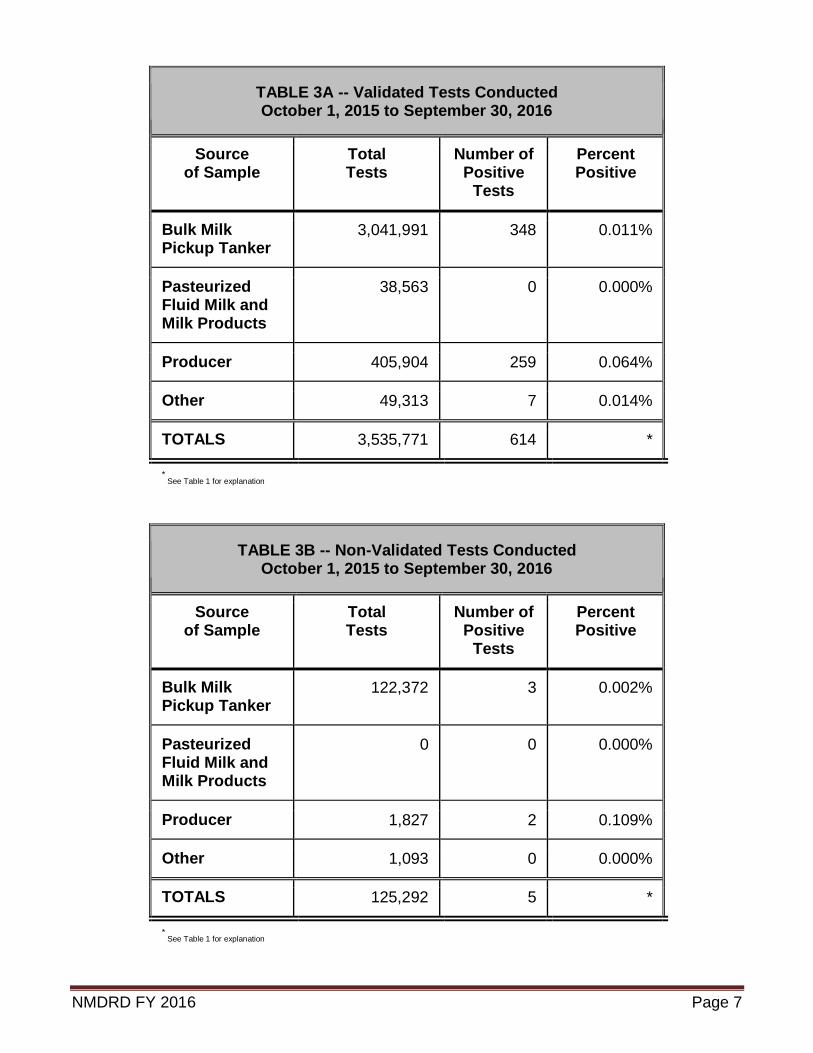
TESTS CONDUCTED An objective of the NMDRD is to record every test run on each sample analyzed. Since some samples are analyzed for more than one (1) drug residue, the number of tests conducted 3,661,063 is greater than the number of samples 3,581,396. To avoid duplicate reporting of samples, the number of samples analyzed is reported separately from the number of tests run in the data base. Table 3 presents summary results of the number of tests which were conducted during October 1, 2015 to September 30, 2016. The term, “validated test”, as used in this report, is a test used for the screening of raw milk for drug residue, which has been evaluated by FDA in accordance with the standards established for the evaluation of these types of tests and found acceptable by the NCIMS in accordance with Appendix N of the PMO. In addition, FDA validated drug residue detection procedures for screening and quantification of drug residues in milk may be used. Table 3A presents summary results using validated tests and Table 3B presents summary results using non-validated tests.
TABLE 3 -- Tests Conducted October 1, 2015 to September 30, 2016
Source of Sample
Total Tests
Number of Positive
Tests
Percent Positive
Bulk Milk Pickup Tanker
3,164,363 351 0.011%
Pasteurized Fluid Milk and Milk Products
38,563 0 0.000%
Producer 407,731 261 0.064%
Other 50,406 7 0.014%
TOTALS 3,661,063 619 *
* See Table 1 for explanation
NMDRD FY 2016 Page 7
TABLE 3A -- Validated Tests Conducted October 1, 2015 to September 30, 2016
Source of Sample
Total Tests
Number of Positive
Tests
Percent Positive
Bulk Milk Pickup Tanker
3,041,991 348 0.011%
Pasteurized Fluid Milk and Milk Products
38,563 0 0.000%
Producer 405,904 259 0.064%
Other 49,313 7 0.014%
TOTALS 3,535,771 614 *
* See Table 1 for explanation
TABLE 3B -- Non-Validated Tests Conducted October 1, 2015 to September 30, 2016
Source of Sample
Total Tests
Number of Positive
Tests
Percent Positive
Bulk Milk Pickup Tanker
122,372 3 0.002%
Pasteurized Fluid Milk and Milk Products
0 0 0.000%
Producer 1,827 2 0.109%
Other 1,093 0 0.000%
TOTALS 125,292 5 *
* See Table 1 for explanation
NMDRD FY 2016 Page 8
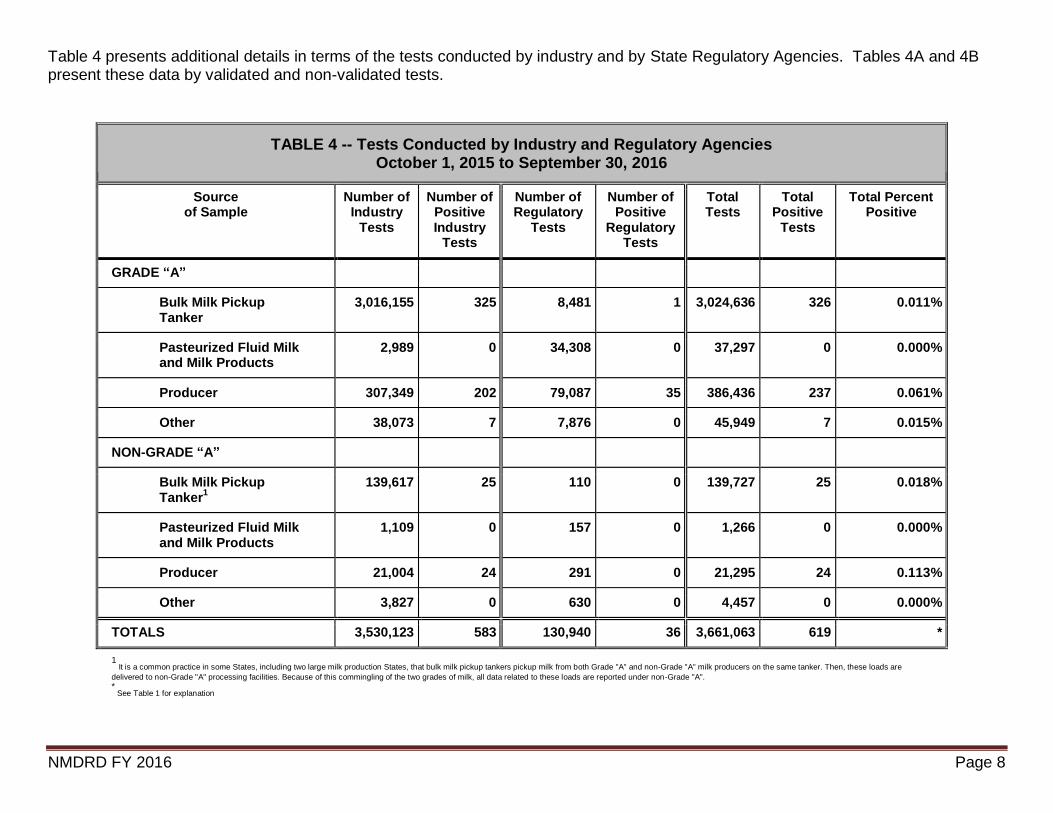
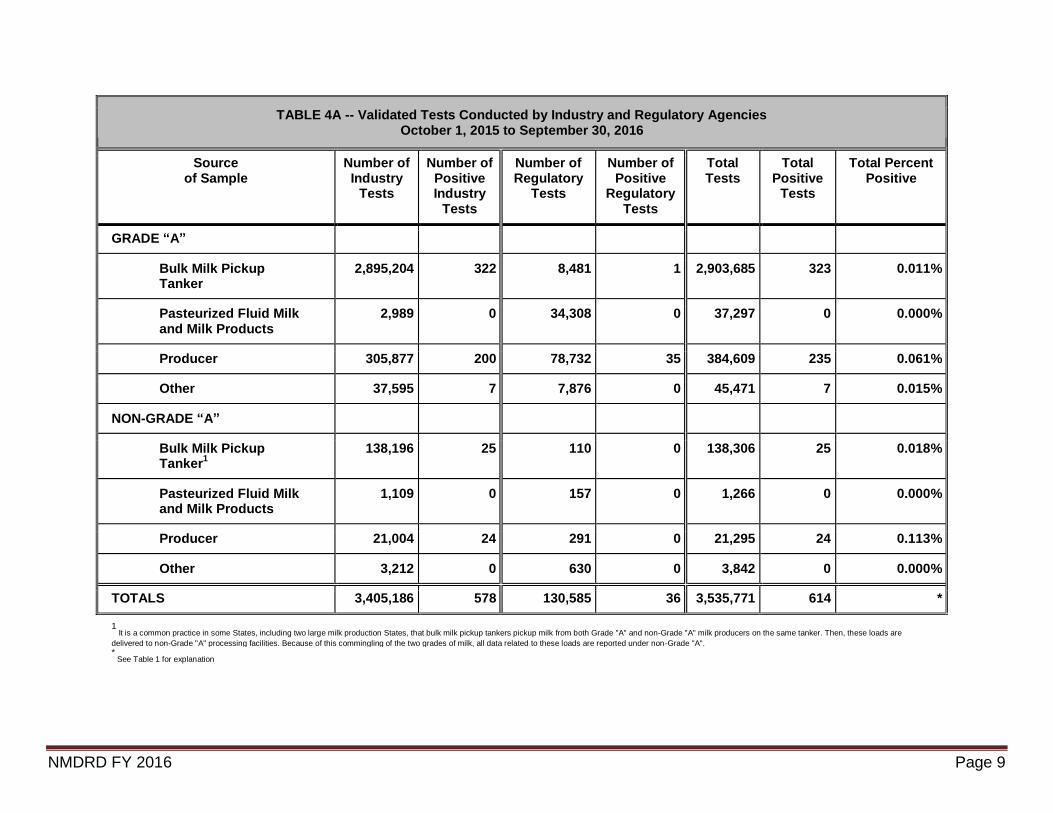
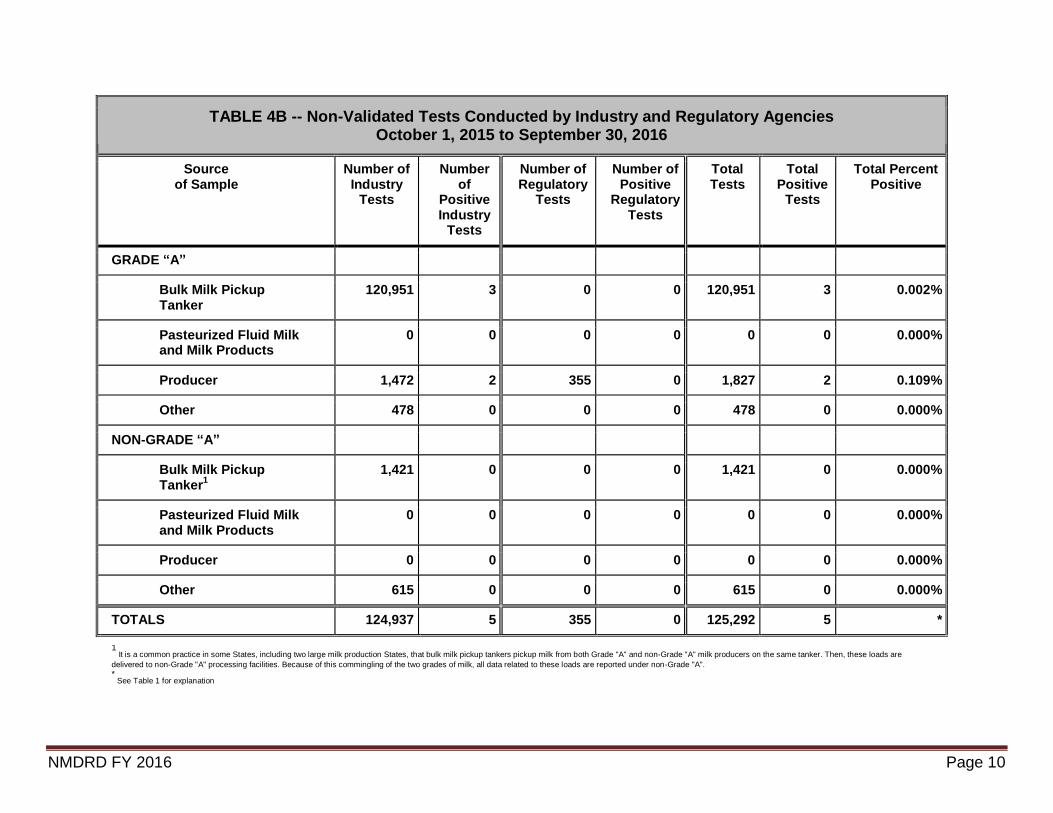
Table 4 presents additional details in terms of the tests conducted by industry and by State Regulatory Agencies. Tables 4A and 4B present these data by validated and non-validated tests.
TABLE 4 -- Tests Conducted by Industry and Regulatory Agencies October 1, 2015 to September 30, 2016
Source of Sample
Number of Industry
Tests
Number of Positive Industry
Tests
Number of Regulatory
Tests
Number of Positive
Regulatory Tests
Total Tests
Total Positive
Tests
Total Percent Positive
GRADE “A”
Bulk Milk Pickup Tanker
3,016,155 325 8,481 1 3,024,636 326 0.011%
Pasteurized Fluid Milk and Milk Products
2,989 0 34,308 0 37,297 0 0.000%
Producer 307,349 202 79,087 35 386,436 237 0.061%
Other 38,073 7 7,876 0 45,949 7 0.015%
NON-GRADE “A”
Bulk Milk Pickup Tanker
1
139,617 25 110 0 139,727 25 0.018%
Pasteurized Fluid Milk and Milk Products
1,109 0 157 0 1,266 0 0.000%
Producer 21,004 24 291 0 21,295 24 0.113%
Other 3,827 0 630 0 4,457 0 0.000%
TOTALS 3,530,123 583 130,940 36 3,661,063 619 *
1 It is a common practice in some States, including two large milk production States, that bulk milk pickup tankers pickup milk from both Grade "A" and non-Grade "A" milk producers on the same tanker. Then, these loads are
delivered to non-Grade "A" processing facilities. Because of this commingling of the two grades of milk, all data related to these loads are reported under non-Grade "A".
* See Table 1 for explanation
NMDRD FY 2016 Page 9
TABLE 4A -- Validated Tests Conducted by Industry and Regulatory Agencies October 1, 2015 to September 30, 2016
Source of Sample
Number of Industry
Tests
Number of Positive Industry
Tests
Number of Regulatory
Tests
Number of Positive
Regulatory Tests
Total Tests
Total Positive
Tests
Total Percent Positive
GRADE “A”
Bulk Milk Pickup Tanker
2,895,204 322 8,481 1 2,903,685 323 0.011%
Pasteurized Fluid Milk and Milk Products
2,989 0 34,308 0 37,297 0 0.000%
Producer 305,877 200 78,732 35 384,609 235 0.061%
Other 37,595 7 7,876 0 45,471 7 0.015%
NON-GRADE “A”
Bulk Milk Pickup Tanker
1
138,196 25 110 0 138,306 25 0.018%
Pasteurized Fluid Milk and Milk Products
1,109 0 157 0 1,266 0 0.000%
Producer 21,004 24 291 0 21,295 24 0.113%
Other 3,212 0 630 0 3,842 0 0.000%
TOTALS 3,405,186 578 130,585 36 3,535,771 614 *
1 It is a common practice in some States, including two large milk production States, that bulk milk pickup tankers pickup milk from both Grade "A" and non-Grade "A" milk producers on the same tanker. Then, these loads are
delivered to non-Grade "A" processing facilities. Because of this commingling of the two grades of milk, all data related to these loads are reported under non-Grade "A". * See Table 1 for explanation
NMDRD FY 2016 Page 10
TABLE 4B -- Non-Validated Tests Conducted by Industry and Regulatory Agencies October 1, 2015 to September 30, 2016
Source of Sample
Number of Industry
Tests
Number of
Positive Industry
Tests
Number of Regulatory
Tests
Number of Positive
Regulatory Tests
Total Tests
Total Positive
Tests
Total Percent Positive
GRADE “A”
Bulk Milk Pickup Tanker
120,951 3 0 0 120,951 3 0.002%
Pasteurized Fluid Milk and Milk Products
0 0 0 0 0 0 0.000%
Producer 1,472 2 355 0 1,827 2 0.109%
Other 478 0 0 0 478 0 0.000%
NON-GRADE “A”
Bulk Milk Pickup Tanker
1
1,421 0 0 0 1,421 0 0.000%
Pasteurized Fluid Milk and Milk Products
0 0 0 0 0 0 0.000%
Producer 0 0 0 0 0 0 0.000%
Other 615 0 0 0 615 0 0.000%
TOTALS 124,937 5 355 0 125,292 5 *
1 It is a common practice in some States, including two large milk production States, that bulk milk pickup tankers pickup milk from both Grade "A" and non-Grade "A" milk producers on the same tanker. Then, these loads are
delivered to non-Grade "A" processing facilities. Because of this commingling of the two grades of milk, all data related to these loads are reported under non-Grade "A".
* See Table 1 for explanation
NMDRD FY 2016 Page 11
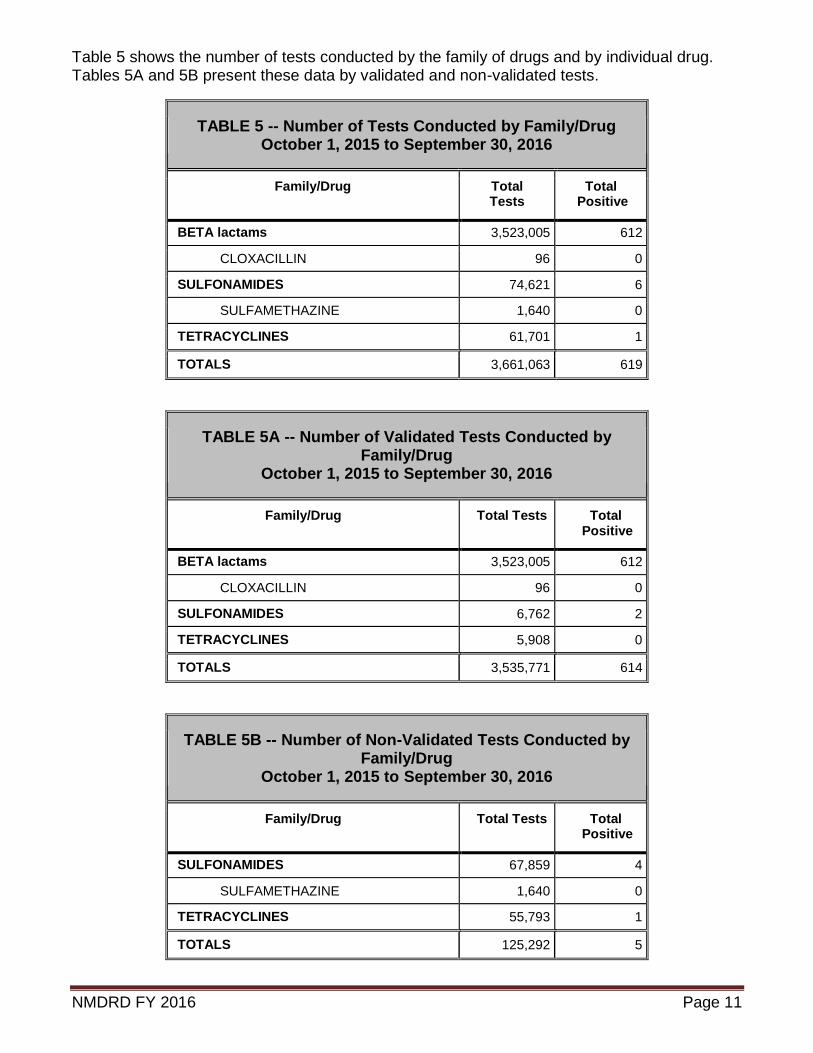
Table 5 shows the number of tests conducted by the family of drugs and by individual drug. Tables 5A and 5B present these data by validated and non-validated tests.
TABLE 5 -- Number of Tests Conducted by Family/Drug October 1, 2015 to September 30, 2016
Family/Drug Total Tests
Total Positive
BETA lactams 3,523,005 612
CLOXACILLIN 96 0
SULFONAMIDES 74,621 6
SULFAMETHAZINE 1,640 0
TETRACYCLINES 61,701 1
TOTALS 3,661,063 619
TABLE 5A -- Number of Validated Tests Conducted by Family/Drug
October 1, 2015 to September 30, 2016
Family/Drug Total Tests Total Positive
BETA lactams 3,523,005 612
CLOXACILLIN 96 0
SULFONAMIDES 6,762 2
TETRACYCLINES 5,908 0
TOTALS 3,535,771 614
TABLE 5B -- Number of Non-Validated Tests Conducted by Family/Drug
October 1, 2015 to September 30, 2016
Family/Drug Total Tests Total Positive
SULFONAMIDES 67,859 4
SULFAMETHAZINE 1,640 0
TETRACYCLINES 55,793 1
TOTALS 125,292 5
NMDRD FY 2016 Page 12
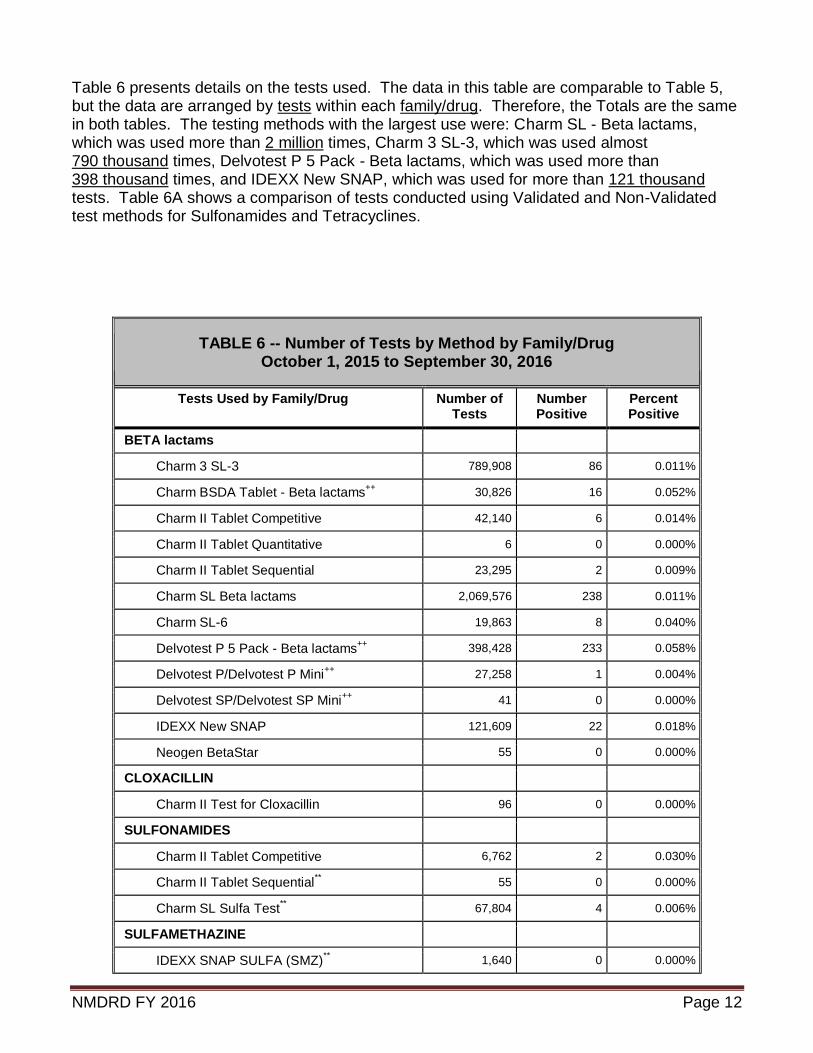
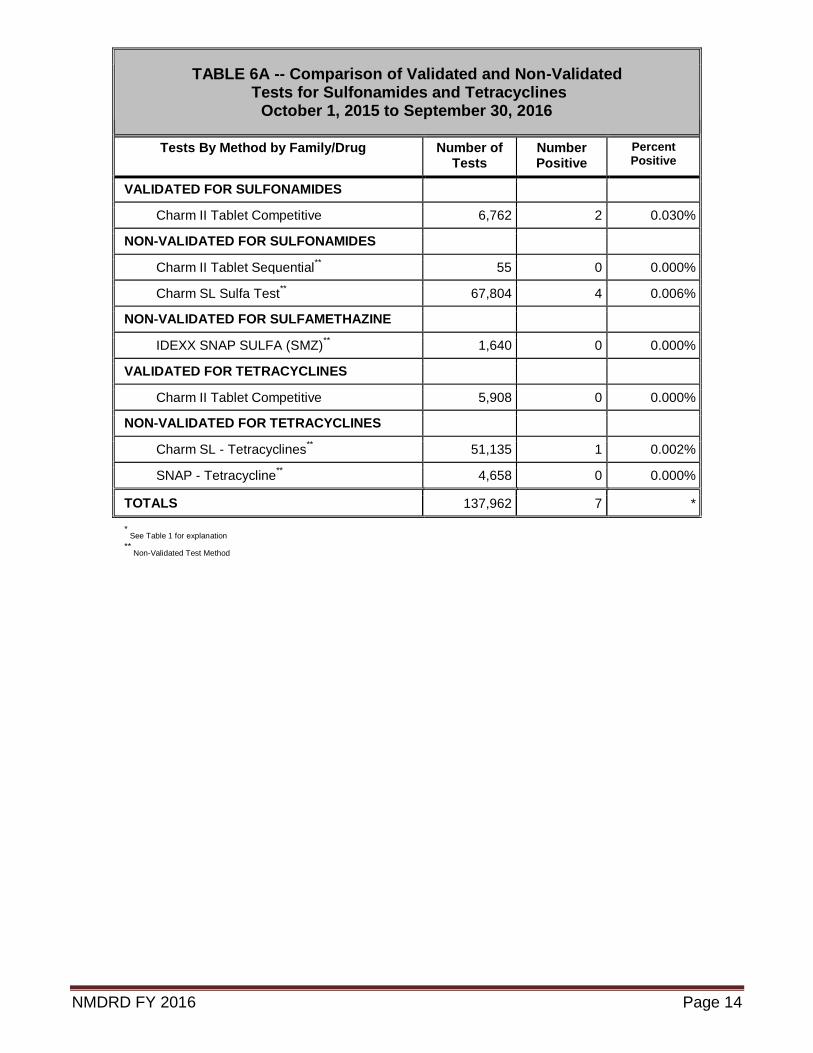
Table 6 presents details on the tests used. The data in this table are comparable to Table 5, but the data are arranged by tests within each family/drug. Therefore, the Totals are the same in both tables. The testing methods with the largest use were: Charm SL - Beta lactams, which was used more than 2 million times, Charm 3 SL-3, which was used almost 790 thousand times, Delvotest P 5 Pack - Beta lactams, which was used more than 398 thousand times, and IDEXX New SNAP, which was used for more than 121 thousand tests. Table 6A shows a comparison of tests conducted using Validated and Non-Validated test methods for Sulfonamides and Tetracyclines.
TABLE 6 -- Number of Tests by Method by Family/Drug October 1, 2015 to September 30, 2016
Tests Used by Family/Drug Number of Tests
Number Positive
Percent Positive
BETA lactams
Charm 3 SL-3 789,908 86 0.011%
Charm BSDA Tablet - Beta lactams++
30,826 16 0.052%
Charm II Tablet Competitive 42,140 6 0.014%
Charm II Tablet Quantitative 6 0 0.000%
Charm II Tablet Sequential 23,295 2 0.009%
Charm SL Beta lactams 2,069,576 238 0.011%
Charm SL-6 19,863 8 0.040%
Delvotest P 5 Pack - Beta lactams++
398,428 233 0.058%
Delvotest P/Delvotest P Mini++
27,258 1 0.004%
Delvotest SP/Delvotest SP Mini++
41 0 0.000%
IDEXX New SNAP 121,609 22 0.018%
Neogen BetaStar 55 0 0.000%
CLOXACILLIN
Charm II Test for Cloxacillin 96 0 0.000%
SULFONAMIDES
Charm II Tablet Competitive 6,762 2 0.030%
Charm II Tablet Sequential** 55 0 0.000%
Charm SL Sulfa Test** 67,804 4 0.006%
SULFAMETHAZINE
IDEXX SNAP SULFA (SMZ)** 1,640 0 0.000%
NMDRD FY 2016 Page 13
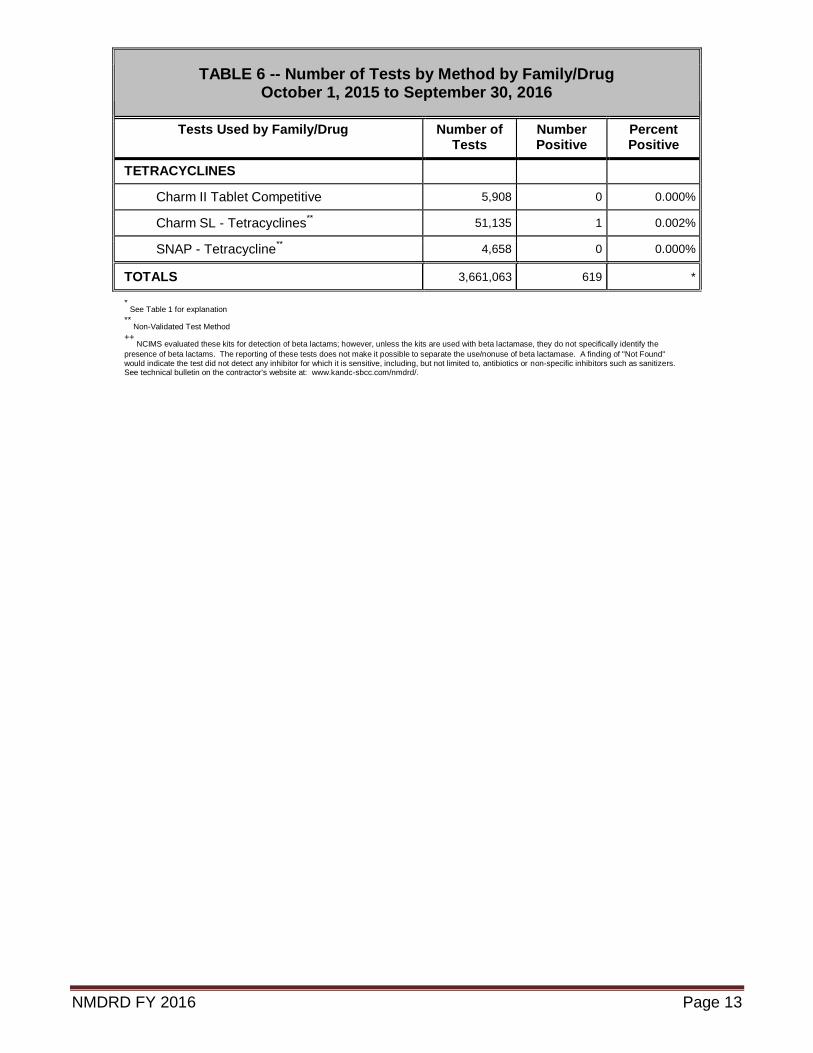
TABLE 6 -- Number of Tests by Method by Family/Drug October 1, 2015 to September 30, 2016
Tests Used by Family/Drug Number of Tests
Number Positive
Percent Positive
TETRACYCLINES
Charm II Tablet Competitive 5,908 0 0.000%
Charm SL - Tetracyclines** 51,135 1 0.002%
SNAP - Tetracycline** 4,658 0 0.000%
TOTALS 3,661,063 619 *
* See Table 1 for explanation
** Non-Validated Test Method
++ NCIMS evaluated these kits for detection of beta lactams; however, unless the kits are used with beta lactamase, they do not specifically identify the
presence of beta lactams. The reporting of these tests does not make it possible to separate the use/nonuse of beta lactamase. A finding of "Not Found" would indicate the test did not detect any inhibitor for which it is sensitive, including, but not limited to, antibiotics or non-specific inhibitors such as sanitizers. See technical bulletin on the contractor's website at: www.kandc-sbcc.com/nmdrd/.
NMDRD FY 2016 Page 14
TABLE 6A -- Comparison of Validated and Non-Validated Tests for Sulfonamides and Tetracyclines
October 1, 2015 to September 30, 2016
Tests By Method by Family/Drug Number of Tests
Number Positive
Percent Positive
VALIDATED FOR SULFONAMIDES
Charm II Tablet Competitive 6,762 2 0.030%
NON-VALIDATED FOR SULFONAMIDES
Charm II Tablet Sequential** 55 0 0.000%
Charm SL Sulfa Test** 67,804 4 0.006%
NON-VALIDATED FOR SULFAMETHAZINE
IDEXX SNAP SULFA (SMZ)** 1,640 0 0.000%
VALIDATED FOR TETRACYCLINES
Charm II Tablet Competitive 5,908 0 0.000%
NON-VALIDATED FOR TETRACYCLINES
Charm SL - Tetracyclines** 51,135 1 0.002%
SNAP - Tetracycline** 4,658 0 0.000%
TOTALS 137,962 7 *
* See Table 1 for explanation
** Non-Validated Test Method
NMDRD FY 2016 Page 15
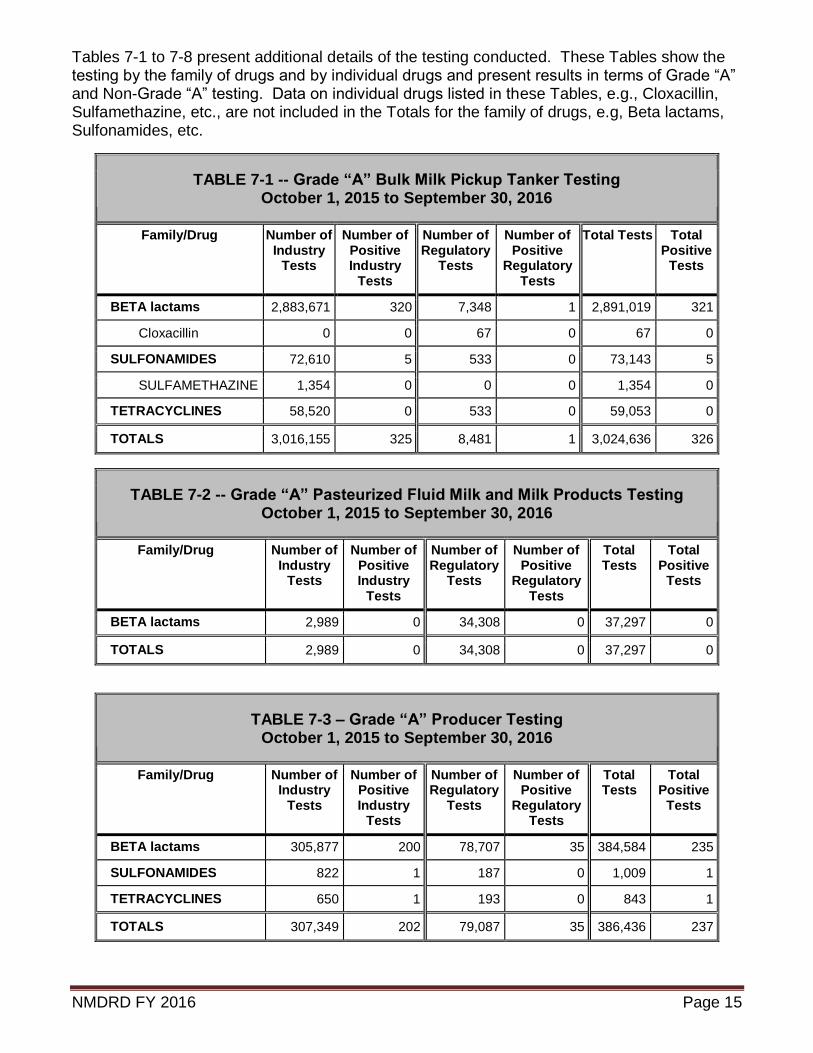
Tables 7-1 to 7-8 present additional details of the testing conducted. These Tables show the testing by the family of drugs and by individual drugs and present results in terms of Grade “A” and Non-Grade “A” testing. Data on individual drugs listed in these Tables, e.g., Cloxacillin, Sulfamethazine, etc., are not included in the Totals for the family of drugs, e.g, Beta lactams, Sulfonamides, etc.
TABLE 7-1 -- Grade “A” Bulk Milk Pickup Tanker Testing October 1, 2015 to September 30, 2016
Family/Drug Number of Industry
Tests
Number of Positive Industry
Tests
Number of Regulatory
Tests
Number of Positive
Regulatory Tests
Total Tests Total Positive
Tests
BETA lactams 2,883,671 320 7,348 1 2,891,019 321
Cloxacillin 0 0 67 0 67 0
SULFONAMIDES 72,610 5 533 0 73,143 5
SULFAMETHAZINE 1,354 0 0 0 1,354 0
TETRACYCLINES 58,520 0 533 0 59,053 0
TOTALS 3,016,155 325 8,481 1 3,024,636 326
TABLE 7-2 -- Grade “A” Pasteurized Fluid Milk and Milk Products Testing October 1, 2015 to September 30, 2016
Family/Drug Number of Industry
Tests
Number of Positive Industry
Tests
Number of Regulatory
Tests
Number of Positive
Regulatory Tests
Total Tests
Total Positive
Tests
BETA lactams 2,989 0 34,308 0 37,297 0
TOTALS 2,989 0 34,308 0 37,297 0
TABLE 7-3 – Grade “A” Producer Testing October 1, 2015 to September 30, 2016
Family/Drug Number of Industry
Tests
Number of Positive Industry
Tests
Number of Regulatory
Tests
Number of Positive
Regulatory Tests
Total Tests
Total Positive
Tests
BETA lactams 305,877 200 78,707 35 384,584 235
SULFONAMIDES 822 1 187 0 1,009 1
TETRACYCLINES 650 1 193 0 843 1
TOTALS 307,349 202 79,087 35 386,436 237
NMDRD FY 2016 Page 16
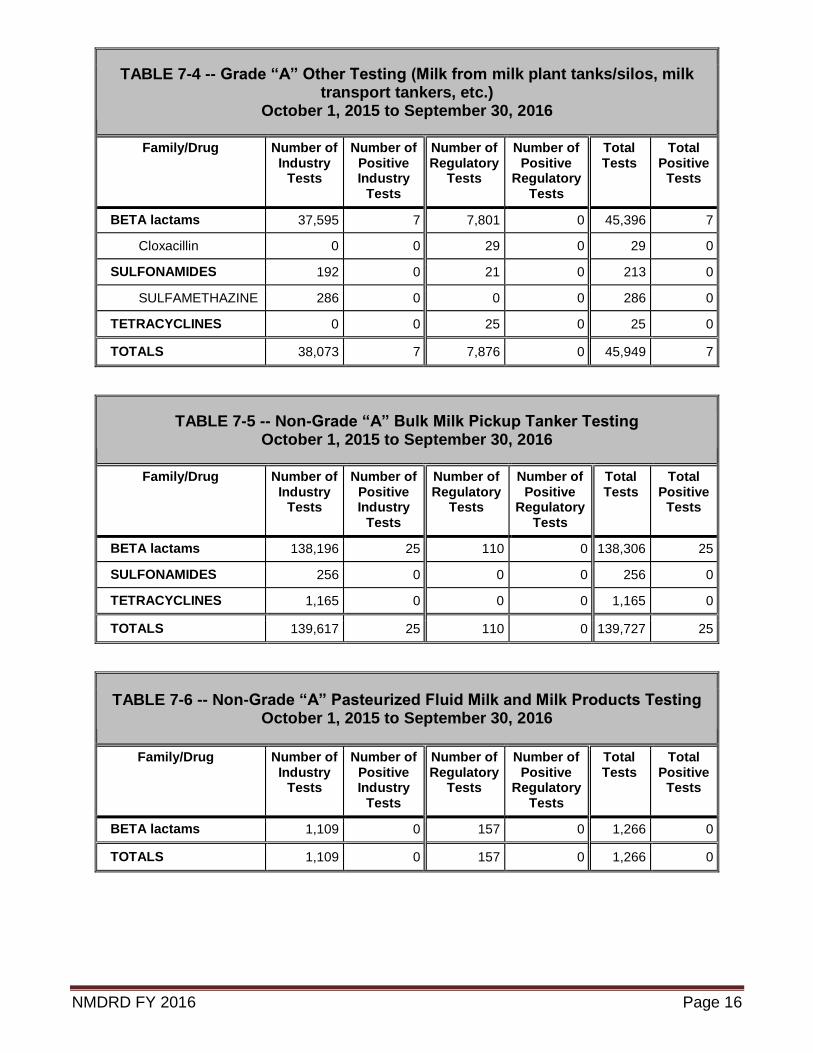
TABLE 7-4 -- Grade “A” Other Testing (Milk from milk plant tanks/silos, milk transport tankers, etc.)
October 1, 2015 to September 30, 2016
Family/Drug Number of Industry
Tests
Number of Positive Industry
Tests
Number of Regulatory
Tests
Number of Positive
Regulatory Tests
Total Tests
Total Positive
Tests
BETA lactams 37,595 7 7,801 0 45,396 7
Cloxacillin 0 0 29 0 29 0
SULFONAMIDES 192 0 21 0 213 0
SULFAMETHAZINE 286 0 0 0 286 0
TETRACYCLINES 0 0 25 0 25 0
TOTALS 38,073 7 7,876 0 45,949 7
TABLE 7-5 -- Non-Grade “A” Bulk Milk Pickup Tanker Testing October 1, 2015 to September 30, 2016
Family/Drug Number of Industry
Tests
Number of Positive Industry
Tests
Number of Regulatory
Tests
Number of Positive
Regulatory Tests
Total Tests
Total Positive
Tests
BETA lactams 138,196 25 110 0 138,306 25
SULFONAMIDES 256 0 0 0 256 0
TETRACYCLINES 1,165 0 0 0 1,165 0
TOTALS 139,617 25 110 0 139,727 25
TABLE 7-6 -- Non-Grade “A” Pasteurized Fluid Milk and Milk Products Testing October 1, 2015 to September 30, 2016
Family/Drug Number of Industry
Tests
Number of Positive Industry
Tests
Number of Regulatory
Tests
Number of Positive
Regulatory Tests
Total Tests
Total Positive
Tests
BETA lactams 1,109 0 157 0 1,266 0
TOTALS 1,109 0 157 0 1,266 0
NMDRD FY 2016 Page 17
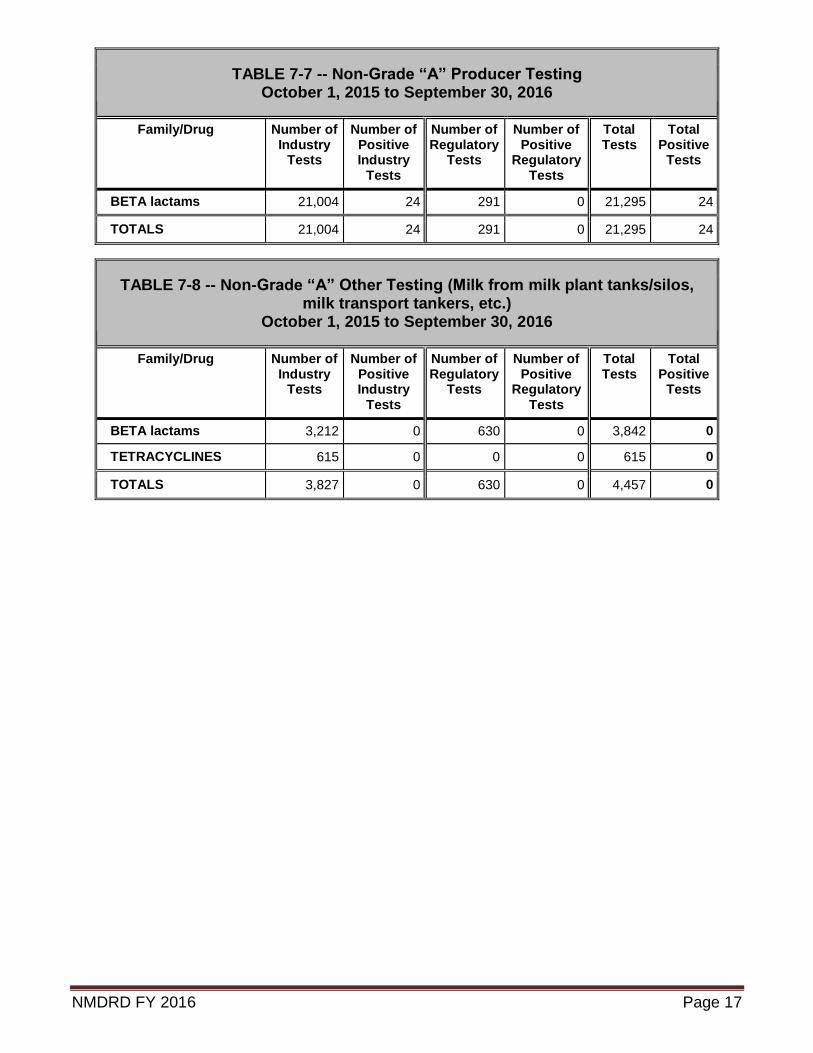
TABLE 7-7 -- Non-Grade “A” Producer Testing October 1, 2015 to September 30, 2016
Family/Drug Number of Industry
Tests
Number of Positive Industry
Tests
Number of Regulatory
Tests
Number of Positive
Regulatory Tests
Total Tests
Total Positive
Tests
BETA lactams 21,004 24 291 0 21,295 24
TOTALS 21,004 24 291 0 21,295 24
TABLE 7-8 -- Non-Grade “A” Other Testing (Milk from milk plant tanks/silos, milk transport tankers, etc.)
October 1, 2015 to September 30, 2016
Family/Drug Number of Industry
Tests
Number of Positive Industry
Tests
Number of Regulatory
Tests
Number of Positive
Regulatory Tests
Total Tests
Total Positive
Tests
BETA lactams 3,212 0 630 0 3,842 0
TETRACYCLINES 615 0 0 0 615 0
TOTALS 3,827 0 630 0 4,457 0
NMDRD FY 2016 Page 18
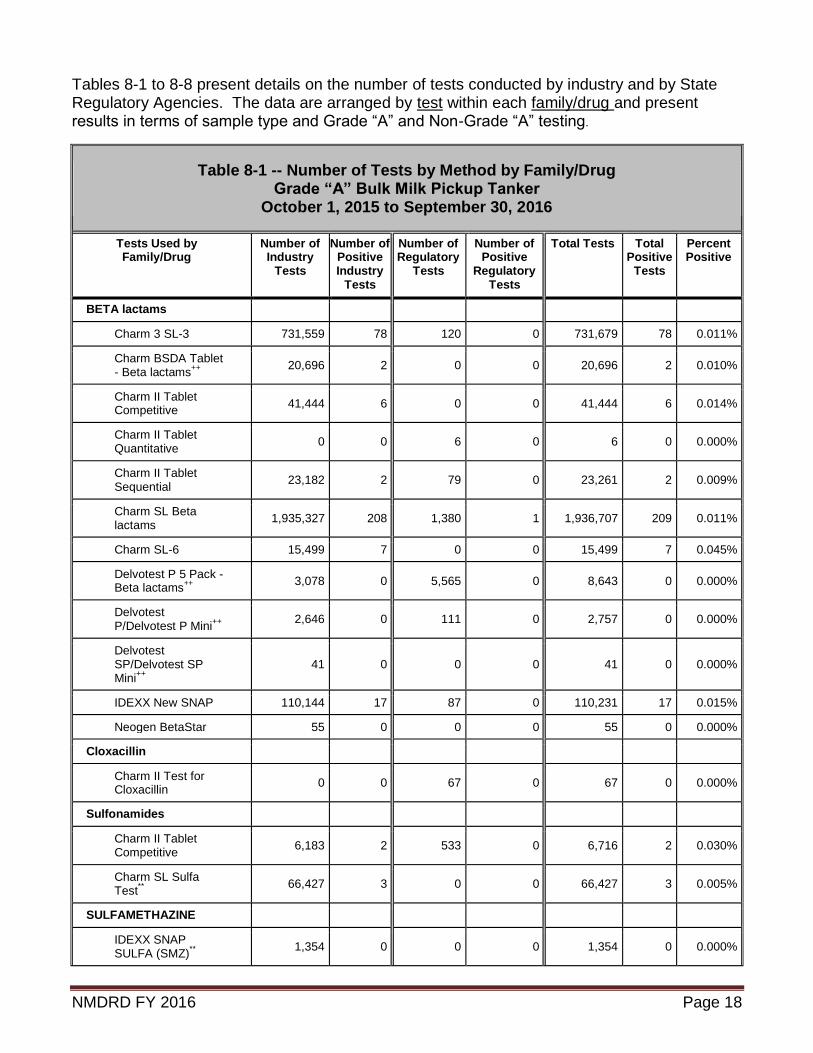
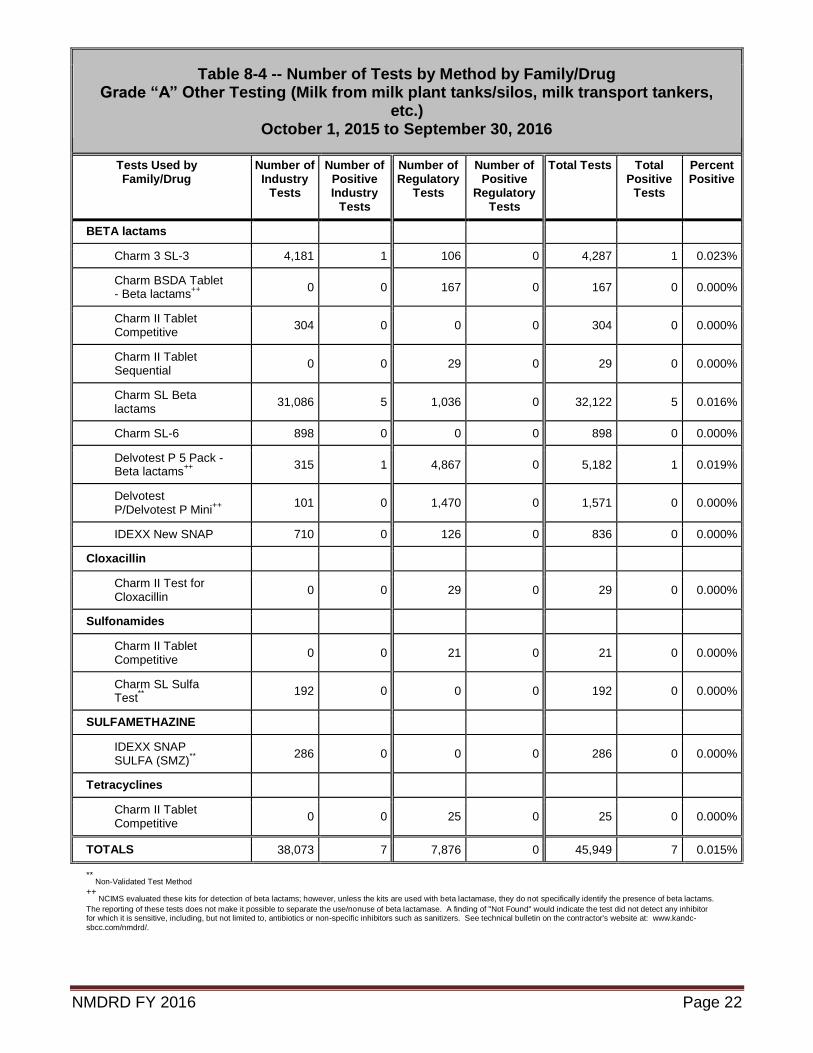
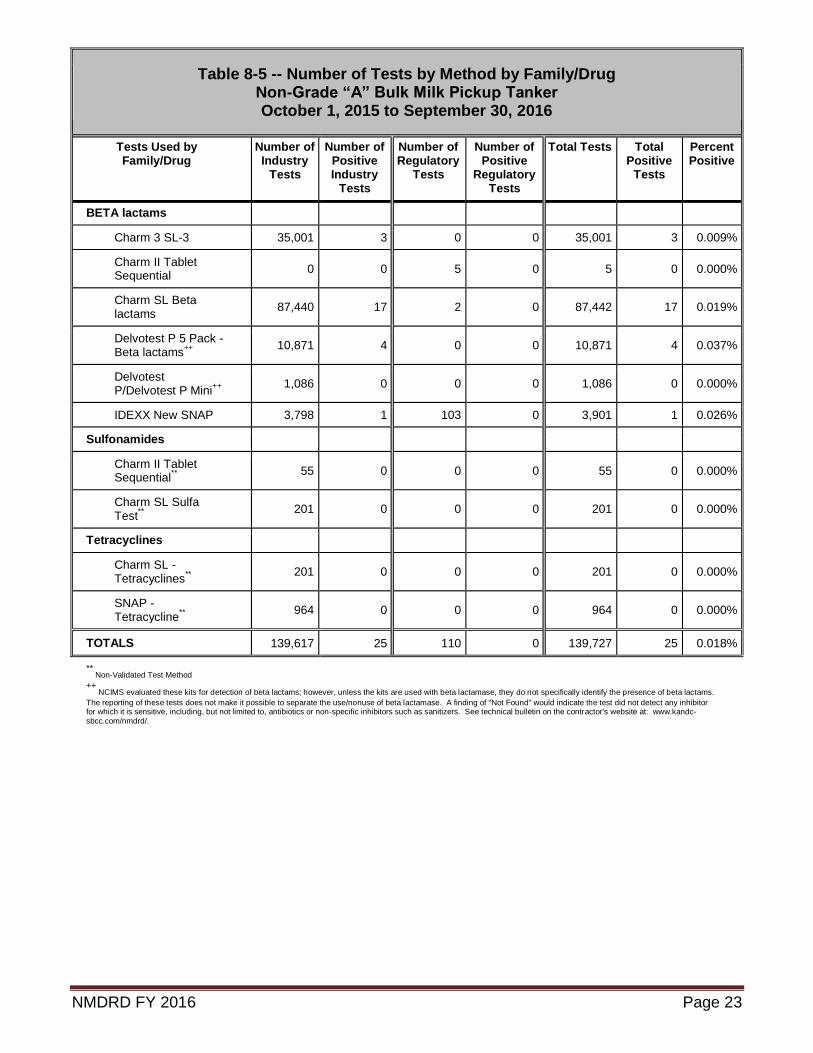
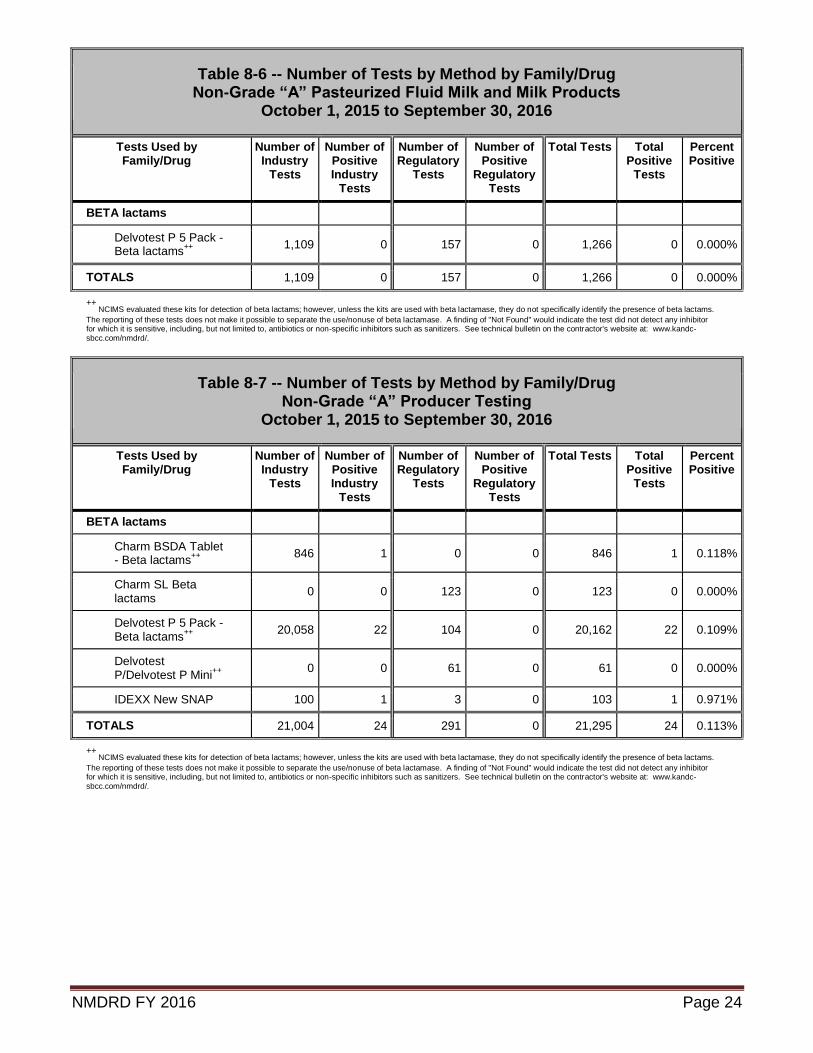
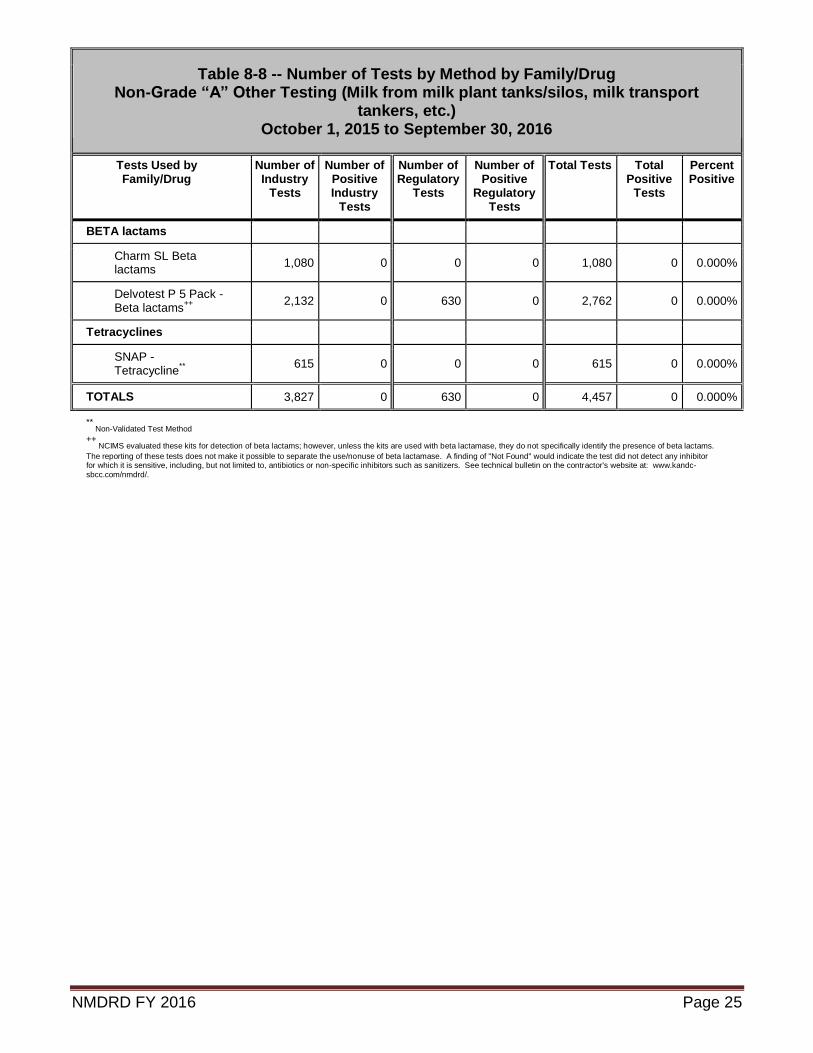
Tables 8-1 to 8-8 present details on the number of tests conducted by industry and by State Regulatory Agencies. The data are arranged by test within each family/drug and present results in terms of sample type and Grade “A” and Non-Grade “A” testing.
Table 8-1 -- Number of Tests by Method by Family/Drug Grade “A” Bulk Milk Pickup Tanker
October 1, 2015 to September 30, 2016
Tests Used by Family/Drug
Number of Industry
Tests
Number of Positive Industry
Tests
Number of Regulatory
Tests
Number of Positive
Regulatory Tests
Total Tests Total Positive
Tests
Percent Positive
BETA lactams
Charm 3 SL-3 731,559 78 120 0 731,679 78 0.011%
Charm BSDA Tablet - Beta lactams
++
20,696 2 0 0 20,696 2 0.010%
Charm II Tablet Competitive
41,444 6 0 0 41,444 6 0.014%
Charm II Tablet Quantitative
0 0 6 0 6 0 0.000%
Charm II Tablet Sequential
23,182 2 79 0 23,261 2 0.009%
Charm SL Beta lactams
1,935,327 208 1,380 1 1,936,707 209 0.011%
Charm SL-6 15,499 7 0 0 15,499 7 0.045%
Delvotest P 5 Pack - Beta lactams
++
3,078 0 5,565 0 8,643 0 0.000%
Delvotest P/Delvotest P Mini
++
2,646 0 111 0 2,757 0 0.000%
Delvotest SP/Delvotest SP Mini
++
41 0 0 0 41 0 0.000%
IDEXX New SNAP 110,144 17 87 0 110,231 17 0.015%
Neogen BetaStar 55 0 0 0 55 0 0.000%
Cloxacillin
Charm II Test for Cloxacillin
0 0 67 0 67 0 0.000%
Sulfonamides
Charm II Tablet Competitive
6,183 2 533 0 6,716 2 0.030%
Charm SL Sulfa Test
**
66,427 3 0 0 66,427 3 0.005%
SULFAMETHAZINE
IDEXX SNAP SULFA (SMZ)
**
1,354 0 0 0 1,354 0 0.000%
NMDRD FY 2016 Page 19
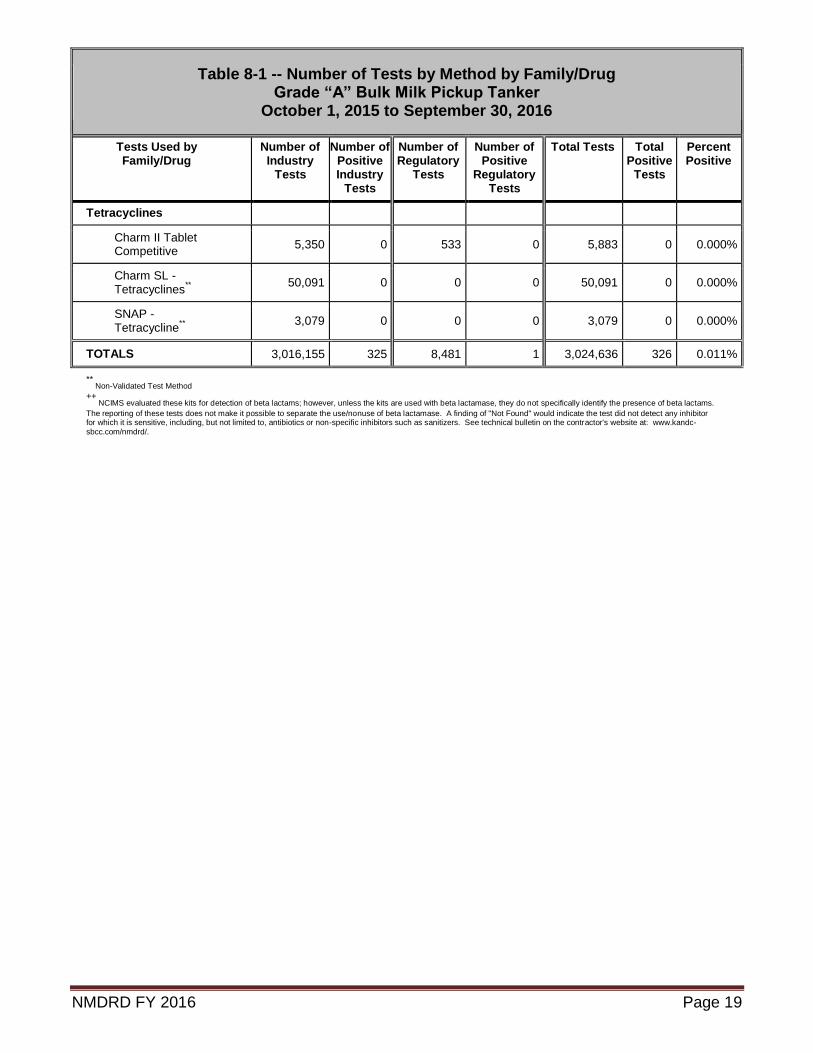
Table 8-1 -- Number of Tests by Method by Family/Drug Grade “A” Bulk Milk Pickup Tanker
October 1, 2015 to September 30, 2016
Tests Used by Family/Drug
Number of Industry
Tests
Number of Positive Industry
Tests
Number of Regulatory
Tests
Number of Positive
Regulatory Tests
Total Tests Total Positive
Tests
Percent Positive
Tetracyclines
Charm II Tablet Competitive
5,350 0 533 0 5,883 0 0.000%
Charm SL - Tetracyclines
**
50,091 0 0 0 50,091 0 0.000%
SNAP - Tetracycline
**
3,079 0 0 0 3,079 0 0.000%
TOTALS 3,016,155 325 8,481 1 3,024,636 326 0.011%
** Non-Validated Test Method
++ NCIMS evaluated these kits for detection of beta lactams; however, unless the kits are used with beta lactamase, they do not specifically identify the presence of beta lactams.
The reporting of these tests does not make it possible to separate the use/nonuse of beta lactamase. A finding of "Not Found" would indicate the test did not detect any inhibitor for which it is sensitive, including, but not limited to, antibiotics or non-specific inhibitors such as sanitizers. See technical bulletin on the contractor's website at: www.kandc-sbcc.com/nmdrd/.
NMDRD FY 2016 Page 20
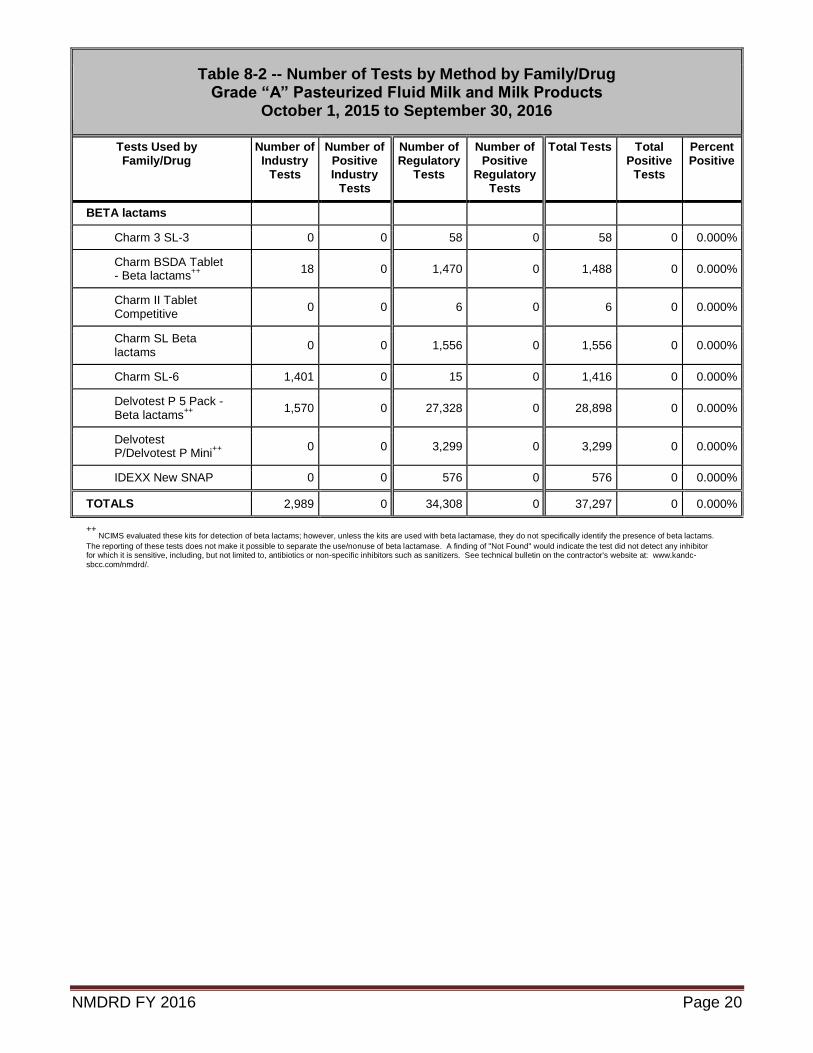
Table 8-2 -- Number of Tests by Method by Family/Drug Grade “A” Pasteurized Fluid Milk and Milk Products
October 1, 2015 to September 30, 2016
Tests Used by Family/Drug
Number of Industry
Tests
Number of Positive Industry
Tests
Number of Regulatory
Tests
Number of Positive
Regulatory Tests
Total Tests Total Positive
Tests
Percent Positive
BETA lactams
Charm 3 SL-3 0 0 58 0 58 0 0.000%
Charm BSDA Tablet - Beta lactams
++
18 0 1,470 0 1,488 0 0.000%
Charm II Tablet Competitive
0 0 6 0 6 0 0.000%
Charm SL Beta lactams
0 0 1,556 0 1,556 0 0.000%
Charm SL-6 1,401 0 15 0 1,416 0 0.000%
Delvotest P 5 Pack - Beta lactams
++
1,570 0 27,328 0 28,898 0 0.000%
Delvotest P/Delvotest P Mini
++
0 0 3,299 0 3,299 0 0.000%
IDEXX New SNAP 0 0 576 0 576 0 0.000%
TOTALS 2,989 0 34,308 0 37,297 0 0.000%
++ NCIMS evaluated these kits for detection of beta lactams; however, unless the kits are used with beta lactamase, they do not specifically identify the presence of beta lactams.
The reporting of these tests does not make it possible to separate the use/nonuse of beta lactamase. A finding of "Not Found" would indicate the test did not detect any inhibitor for which it is sensitive, including, but not limited to, antibiotics or non-specific inhibitors such as sanitizers. See technical bulletin on the contractor's website at: www.kandc-sbcc.com/nmdrd/.
NMDRD FY 2016 Page 21
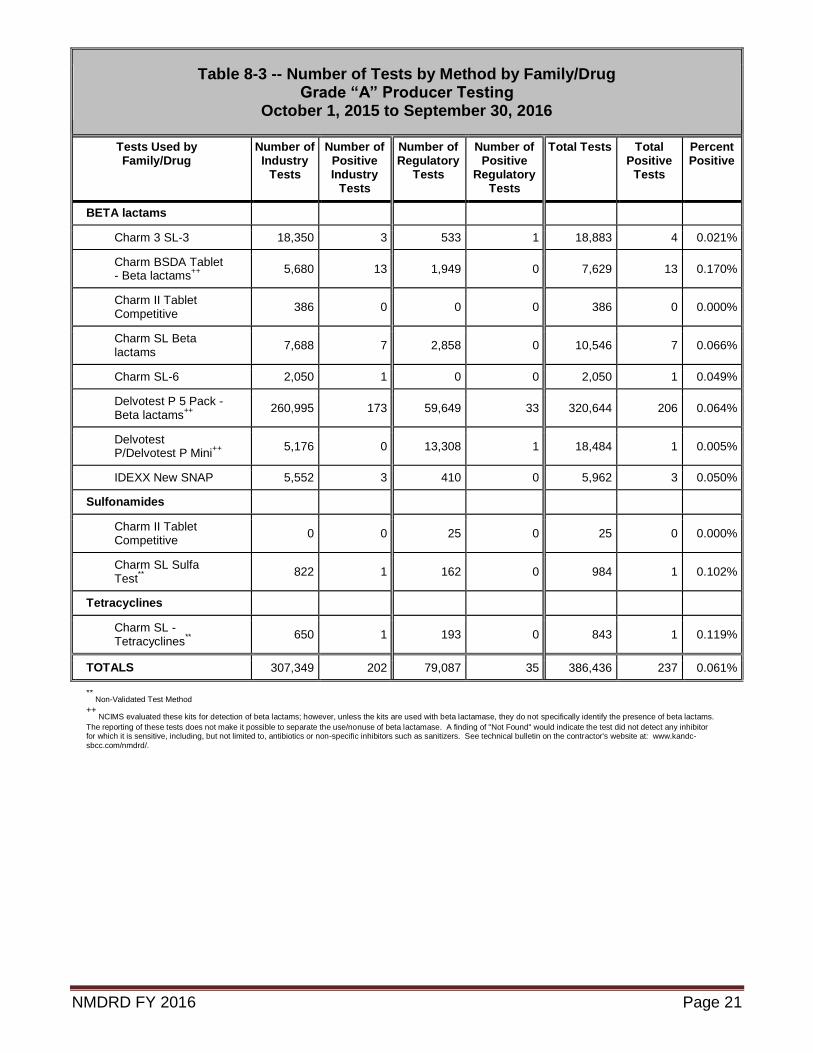
Table 8-3 -- Number of Tests by Method by Family/Drug Grade “A” Producer Testing
October 1, 2015 to September 30, 2016
Tests Used by Family/Drug
Number of Industry
Tests
Number of Positive Industry
Tests
Number of Regulatory
Tests
Number of Positive
Regulatory Tests
Total Tests Total Positive
Tests
Percent Positive
BETA lactams
Charm 3 SL-3 18,350 3 533 1 18,883 4 0.021%
Charm BSDA Tablet - Beta lactams
++
5,680 13 1,949 0 7,629 13 0.170%
Charm II Tablet Competitive
386 0 0 0 386 0 0.000%
Charm SL Beta lactams
7,688 7 2,858 0 10,546 7 0.066%
Charm SL-6 2,050 1 0 0 2,050 1 0.049%
Delvotest P 5 Pack - Beta lactams
++
260,995 173 59,649 33 320,644 206 0.064%
Delvotest P/Delvotest P Mini
++
5,176 0 13,308 1 18,484 1 0.005%
IDEXX New SNAP 5,552 3 410 0 5,962 3 0.050%
Sulfonamides
Charm II Tablet Competitive
0 0 25 0 25 0 0.000%
Charm SL Sulfa Test
**
822 1 162 0 984 1 0.102%
Tetracyclines
Charm SL - Tetracyclines
**
650 1 193 0 843 1 0.119%
TOTALS 307,349 202 79,087 35 386,436 237 0.061%
** Non-Validated Test Method
++ NCIMS evaluated these kits for detection of beta lactams; however, unless the kits are used with beta lactamase, they do not specifically identify the presence of beta lactams.
The reporting of these tests does not make it possible to separate the use/nonuse of beta lactamase. A finding of "Not Found" would indicate the test did not detect any inhibitor for which it is sensitive, including, but not limited to, antibiotics or non-specific inhibitors such as sanitizers. See technical bulletin on the contractor's website at: www.kandc-sbcc.com/nmdrd/.
NMDRD FY 2016 Page 22
Table 8-4 -- Number of Tests by Method by Family/Drug Grade “A” Other Testing (Milk from milk plant tanks/silos, milk transport tankers,
etc.) October 1, 2015 to September 30, 2016
Tests Used by Family/Drug
Number of Industry
Tests
Number of Positive Industry
Tests
Number of Regulatory
Tests
Number of Positive
Regulatory Tests
Total Tests Total Positive
Tests
Percent Positive
BETA lactams
Charm 3 SL-3 4,181 1 106 0 4,287 1 0.023%
Charm BSDA Tablet - Beta lactams
++
0 0 167 0 167 0 0.000%
Charm II Tablet Competitive
304 0 0 0 304 0 0.000%
Charm II Tablet Sequential
0 0 29 0 29 0 0.000%
Charm SL Beta lactams
31,086 5 1,036 0 32,122 5 0.016%
Charm SL-6 898 0 0 0 898 0 0.000%
Delvotest P 5 Pack - Beta lactams
++
315 1 4,867 0 5,182 1 0.019%
Delvotest P/Delvotest P Mini
++
101 0 1,470 0 1,571 0 0.000%
IDEXX New SNAP 710 0 126 0 836 0 0.000%
Cloxacillin
Charm II Test for Cloxacillin
0 0 29 0 29 0 0.000%
Sulfonamides
Charm II Tablet Competitive
0 0 21 0 21 0 0.000%
Charm SL Sulfa Test
**
192 0 0 0 192 0 0.000%
SULFAMETHAZINE
IDEXX SNAP SULFA (SMZ)
**
286 0 0 0 286 0 0.000%
Tetracyclines
Charm II Tablet Competitive
0 0 25 0 25 0 0.000%
TOTALS 38,073 7 7,876 0 45,949 7 0.015%
** Non-Validated Test Method
++ NCIMS evaluated these kits for detection of beta lactams; however, unless the kits are used with beta lactamase, they do not specifically identify the presence of beta lactams.
The reporting of these tests does not make it possible to separate the use/nonuse of beta lactamase. A finding of "Not Found" would indicate the test did not detect any inhibitor for which it is sensitive, including, but not limited to, antibiotics or non-specific inhibitors such as sanitizers. See technical bulletin on the contractor's website at: www.kandc-sbcc.com/nmdrd/.
NMDRD FY 2016 Page 23
Table 8-5 -- Number of Tests by Method by Family/Drug Non-Grade “A” Bulk Milk Pickup Tanker October 1, 2015 to September 30, 2016
Tests Used by Family/Drug
Number of Industry
Tests
Number of Positive Industry
Tests
Number of Regulatory
Tests
Number of Positive
Regulatory Tests
Total Tests Total Positive
Tests
Percent Positive
BETA lactams
Charm 3 SL-3 35,001 3 0 0 35,001 3 0.009%
Charm II Tablet Sequential
0 0 5 0 5 0 0.000%
Charm SL Beta lactams
87,440 17 2 0 87,442 17 0.019%
Delvotest P 5 Pack - Beta lactams
++
10,871 4 0 0 10,871 4 0.037%
Delvotest P/Delvotest P Mini
++
1,086 0 0 0 1,086 0 0.000%
IDEXX New SNAP 3,798 1 103 0 3,901 1 0.026%
Sulfonamides
Charm II Tablet Sequential
**
55 0 0 0 55 0 0.000%
Charm SL Sulfa Test
**
201 0 0 0 201 0 0.000%
Tetracyclines
Charm SL - Tetracyclines
**
201 0 0 0 201 0 0.000%
SNAP - Tetracycline
**
964 0 0 0 964 0 0.000%
TOTALS 139,617 25 110 0 139,727 25 0.018%
** Non-Validated Test Method
++ NCIMS evaluated these kits for detection of beta lactams; however, unless the kits are used with beta lactamase, they do not specifically identify the presence of beta lactams.
The reporting of these tests does not make it possible to separate the use/nonuse of beta lactamase. A finding of "Not Found" would indicate the test did not detect any inhibitor for which it is sensitive, including, but not limited to, antibiotics or non-specific inhibitors such as sanitizers. See technical bulletin on the contractor's website at: www.kandc-sbcc.com/nmdrd/.
NMDRD FY 2016 Page 24
Table 8-6 -- Number of Tests by Method by Family/Drug Non-Grade “A” Pasteurized Fluid Milk and Milk Products
October 1, 2015 to September 30, 2016
Tests Used by Family/Drug
Number of Industry
Tests
Number of Positive Industry
Tests
Number of Regulatory
Tests
Number of Positive
Regulatory Tests
Total Tests Total Positive
Tests
Percent Positive
BETA lactams
Delvotest P 5 Pack - Beta lactams
++
1,109 0 157 0 1,266 0 0.000%
TOTALS 1,109 0 157 0 1,266 0 0.000%
++ NCIMS evaluated these kits for detection of beta lactams; however, unless the kits are used with beta lactamase, they do not specifically identify the presence of beta lactams.
The reporting of these tests does not make it possible to separate the use/nonuse of beta lactamase. A finding of "Not Found" would indicate the test did not detect any inhibitor for which it is sensitive, including, but not limited to, antibiotics or non-specific inhibitors such as sanitizers. See technical bulletin on the contractor's website at: www.kandc-sbcc.com/nmdrd/.
Table 8-7 -- Number of Tests by Method by Family/Drug Non-Grade “A” Producer Testing
October 1, 2015 to September 30, 2016
Tests Used by Family/Drug
Number of Industry
Tests
Number of Positive Industry
Tests
Number of Regulatory
Tests
Number of Positive
Regulatory Tests
Total Tests Total Positive
Tests
Percent Positive
BETA lactams
Charm BSDA Tablet - Beta lactams
++
846 1 0 0 846 1 0.118%
Charm SL Beta lactams
0 0 123 0 123 0 0.000%
Delvotest P 5 Pack - Beta lactams
++
20,058 22 104 0 20,162 22 0.109%
Delvotest P/Delvotest P Mini
++
0 0 61 0 61 0 0.000%
IDEXX New SNAP 100 1 3 0 103 1 0.971%
TOTALS 21,004 24 291 0 21,295 24 0.113%
++ NCIMS evaluated these kits for detection of beta lactams; however, unless the kits are used with beta lactamase, they do not specifically identify the presence of beta lactams.
The reporting of these tests does not make it possible to separate the use/nonuse of beta lactamase. A finding of "Not Found" would indicate the test did not detect any inhibitor for which it is sensitive, including, but not limited to, antibiotics or non-specific inhibitors such as sanitizers. See technical bulletin on the contractor's website at: www.kandc-sbcc.com/nmdrd/.
NMDRD FY 2016 Page 25
Table 8-8 -- Number of Tests by Method by Family/Drug Non-Grade “A” Other Testing (Milk from milk plant tanks/silos, milk transport
tankers, etc.) October 1, 2015 to September 30, 2016
Tests Used by Family/Drug
Number of Industry
Tests
Number of Positive Industry
Tests
Number of Regulatory
Tests
Number of Positive
Regulatory Tests
Total Tests Total Positive
Tests
Percent Positive
BETA lactams
Charm SL Beta lactams
1,080 0 0 0 1,080 0 0.000%
Delvotest P 5 Pack - Beta lactams
++
2,132 0 630 0 2,762 0 0.000%
Tetracyclines
SNAP - Tetracycline
**
615 0 0 0 615 0 0.000%
TOTALS 3,827 0 630 0 4,457 0 0.000%
** Non-Validated Test Method
++ NCIMS evaluated these kits for detection of beta lactams; however, unless the kits are used with beta lactamase, they do not specifically identify the presence of beta lactams.
The reporting of these tests does not make it possible to separate the use/nonuse of beta lactamase. A finding of "Not Found" would indicate the test did not detect any inhibitor for which it is sensitive, including, but not limited to, antibiotics or non-specific inhibitors such as sanitizers. See technical bulletin on the contractor's website at: www.kandc-sbcc.com/nmdrd/.