Embed Size (px)
Citation preview

National Monitoring Network Work Group Breakout Session
Nutrient flux model linkage to estuarine waters and eutrophication
Suzanne Bricker National Estuarine Eutrophication Assessment
NOAA National Centers for Coastal Ocean Science
U.S. Environmental Protection Agency One Potomac Yard , 2777 S. Crystal Drive
Arlington, VA 22202
November 29, 2012

Pressure State
Response – Future Outlook
National Estuarine Eutrophication Assessment

Key Aspects of NEEA/ASSETS approach The NEEA approach may be divided into three parts: Division of estuaries into homogeneous areas Evaluation of data completeness and reliability Application of indices
Tidal freshwater (<0.5 psu) Mixing zone (0.5-25 psu) Seawater zone (>25 psu)
Spatial and temporal quality of datasets (completeness) Confidence in results (sampling and analytical reliability)
State: Eutrophic Condition index (Chl, macroalgae, HABs, DO, SAV loss)
Pressure: Influencing Factors index (susceptibility + nutrient load)
Response: Future Outlook index (susceptibility + future nutrient load)
Guide for management, research, monitoring
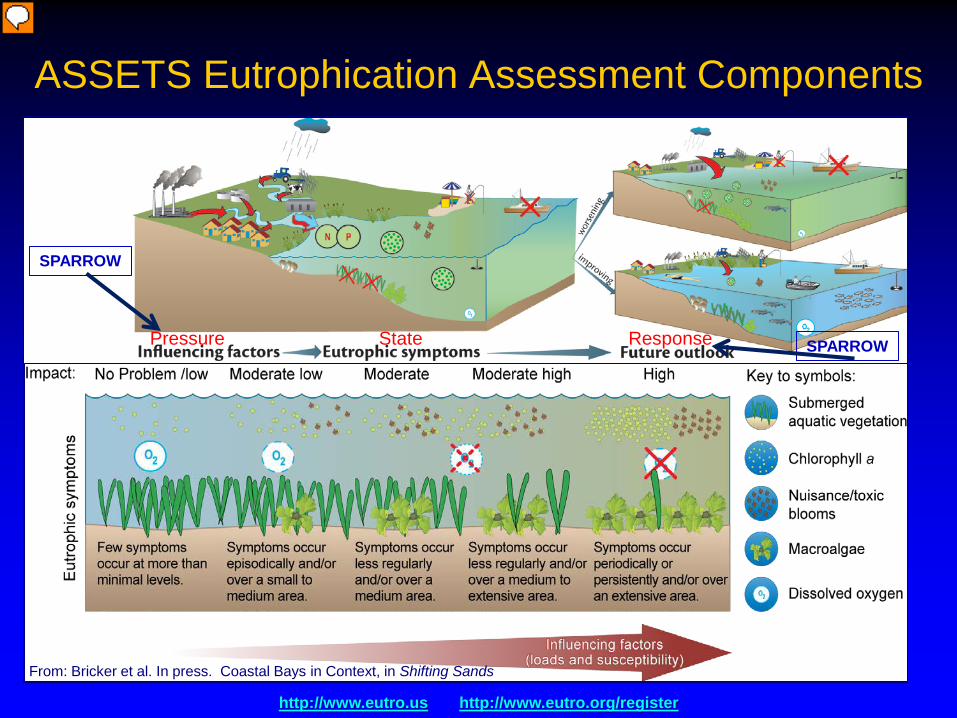
ASSETS Eutrophication Assessment Components
http://www.eutro.us http://www.eutro.org/register
From: Bricker et al. In press. Coastal Bays in Context, in Shifting Sands
Pressure State Response
SPARROW
SPARROW

Pressure - State - Response: Influencing Factors + Eutrophic Condition + Future Outlook ASSETS
Moderate
Moderate Low
Low
Moderate High
Moderate
Low
High
Moderate High
Moderate Low
Influencing Factors (IF)
Nutrient Pressures Low Moderate High
Low
M
oder
ate
Hig
h Su
scep
tibili
ty Moderate
Moderate Low
Low
Moderate High
Moderate
Moderate Low
High
High
Moderate High
Eutrophic Condition (EC)
Secondary Symptoms Low Moderate High
Low
M
oder
ate
Hig
h Pr
imar
y Sy
mpt
oms Improve
High
Improve Low
Improve Low
No Change
No Change
No Change
Worsen Low
Worsen Low
Worsen High
Future Outlook (FO)
Future Nutrient Pressures Decrease No Change Increase
Hig
h M
oder
ate
Low
Su
scep
tibili
ty
Susceptibility natural processing Nutrient pressure expected changes in load
Susceptibility dilution & flushing
+ Nutrient Inputs
land based or oceanic
Primary Symptoms Chloropyll a Macroalgae
+ Secondary Symptoms Dissolved Oxygen Nuisance/toxic blooms SAV change in spatial coverage
IF + EC + FO = ASSETS SPARROW
SPARROW?

Roadblocks for a national network? • Funding - monitoring is not sexy but there is no substitute
• Human vision i.e. new monitoring systems should leverage/link to existing systems.
• Interagency collaboration – NOAA, EPA, USGS should work together, joint funding.
• The political will to ensure that adequate water quality and load monitoring is funded, conducted and reported.
Answers to other questions follow the ability to support
long-term monitoring
A few questions about nutrient load data - Answers from NEEA group

Data gaps? • Resolving human vs. natural loads of nutrients, also requires physics of the
system, temporal dynamics, and source fluxes
• Uninterrupted high-resolution (sensor) timeseries that reveal temporal variation to help determine system perturbations
• Understanding of all sources, all pathways of delivery and delivery efficiency needed to develop criteria and set cost effective management goals/plans that can withstand scrutiny ,including regulatory mechanisms such as trading programs.
• Linkage of nutrient loading to biological impact so criteria and management goals can be set (e.g. Is eelgrass the right indicator? The most sensitive indicator? what load is truly protective of not only eelgrass, but ecosystem integrity as a whole)
• The role of multiple stressors on the selected endpoint, or the suite of ecosystem services desired. Think climate change and how that affects nutrient impacts.

What kind of data are need for better nutrient assessment in coastal environments? Sources and amounts, efficiencies of delivery, physics of the system, temporal dynamics. This requires not only intensive monitoring, but good modeling of hydrology, hydrodynamics, water chemistry, and biological effects.
What data quality is need? Has to be appropriate and high quality but, not much problem meeting data quality objectives (DQO) with today's technologies, so there's much promise and a lot of good things with ocean observing, and probes.
Data availability? Accessibility is getting better with online data servers, but there are few systems that have adequate chemical, physical and biological monitoring in a multimedia source context (air-land-water).
There is no substitute for long-term monitoring

Additional comments: • Monitoring - tells us what a natural system looked like, used to develop
management goal end points and to negotiate management compromises with a realistic look at recovery potential.
• Management - should include consideration of environment, society, and economics.
• Indicator development – what is the ‘right’ indicator? The most sensitive indicator? How to be truly protective of the indicator, (e.g. seagrass) and ecosystem integrity as a whole.
• Intensive monitoring required - also modeling (hydrology, hydrodynamics, water chemistry, and biological effects) to evaluate the role of multiple stressors on endpoints, or desired ecosystem services E.g. climate change and how that affects nutrient impacts.
• Single number criteria - worked well for toxic chemicals, is poor model for nutrients.
• IOOS can help - there are 11 national regional associations all have data serving capacity. Investment in this system is efficient since the data will be added to current capacity / capability, and once so, it is available nationally.

From: Anne Hoos and Craig Johnston Coastline segments in National Hydrography Dataset Plus are manually selected (highlighted yellow below) to best represent the estuary delineation from the NOAA summary PDF map. SPARROW: riverine load from watershed to estuary
NOAA - USGS Collaboration