Embed Size (px)
Citation preview
NATIONAL NUTRITION & PUBLIC HEALTH POLICIES:
Issues Related to Bioavailability of Nutrients When Developing & Using
Dietary Reference Intakes
Allison A. Yates, PhD, RDFood and Nutrition Board
Institute of MedicineThe National Academies
120-02
Examples of Applications of Reference IntakesUSERS:
• Government - Industry - Academia - Health Services
USES:• Guide for procuring food supplies for groups of
healthy persons• Basis for planning meals for groups• Reference point for evaluating the dietary intake of
population subgroups• Basis for food and nutrition education programs• Reference point for the nutrition labeling of food and
dietary supplements
261-01
Nutrition and Public Health Policy Formulation: Outline
DRI Framework/Process Development of DRIs Examples of Impact of Changes in
Bioavailability on Reference Values and Evaluation of Diets
144-01
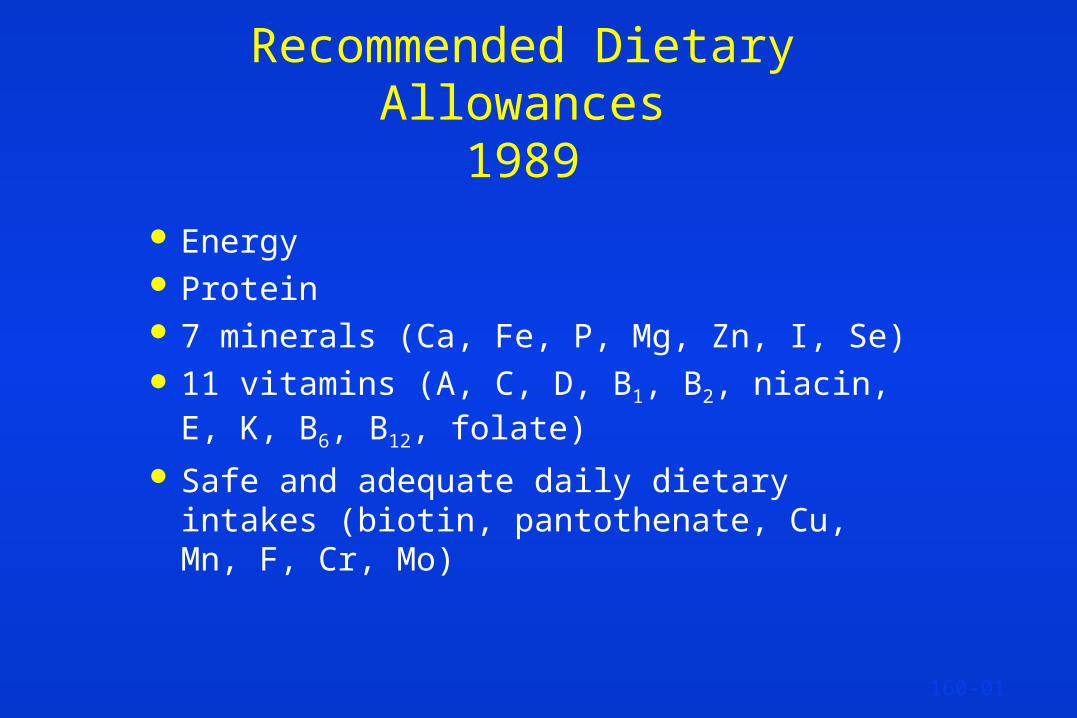
Recommended Dietary Allowances1989
Energy Protein 7 minerals (Ca, Fe, P, Mg, Zn, I, Se) 11 vitamins (A, C, D, B1, B2, niacin, E, K, B6,
B12, folate) Safe and adequate daily dietary intakes
(biotin, pantothenate, Cu, Mn, F, Cr, Mo)
160-01
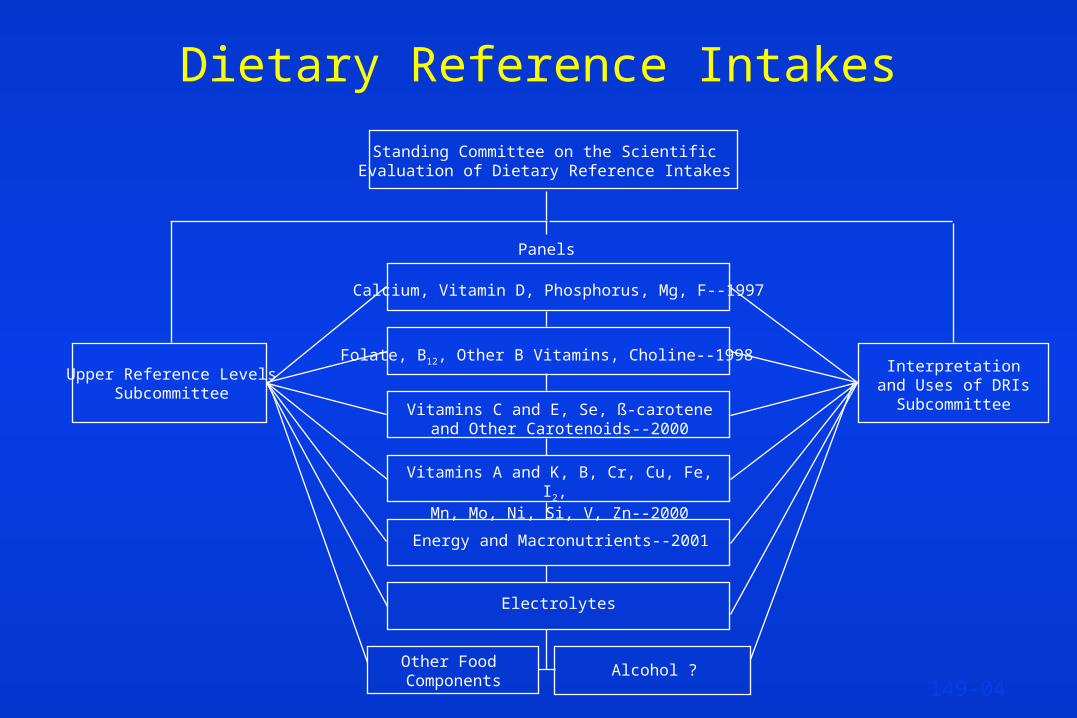
Dietary Reference Intakes
Upper Reference LevelsSubcommittee
Interpretation and Uses of DRIs
Subcommittee
Standing Committee on the ScientificEvaluation of Dietary Reference Intakes
Panels
Calcium, Vitamin D, Phosphorus, Mg, F--1997
Folate, B12, Other B Vitamins, Choline--1998
Vitamins A and K, B, Cr, Cu, Fe, I2, Mn, Mo, Ni, Si, V, Zn--2000
Energy and Macronutrients--2001
Electrolytes
149-04Other Food Components
Alcohol ?
Vitamins C and E, Se, ß-carotene and Other Carotenoids--2000
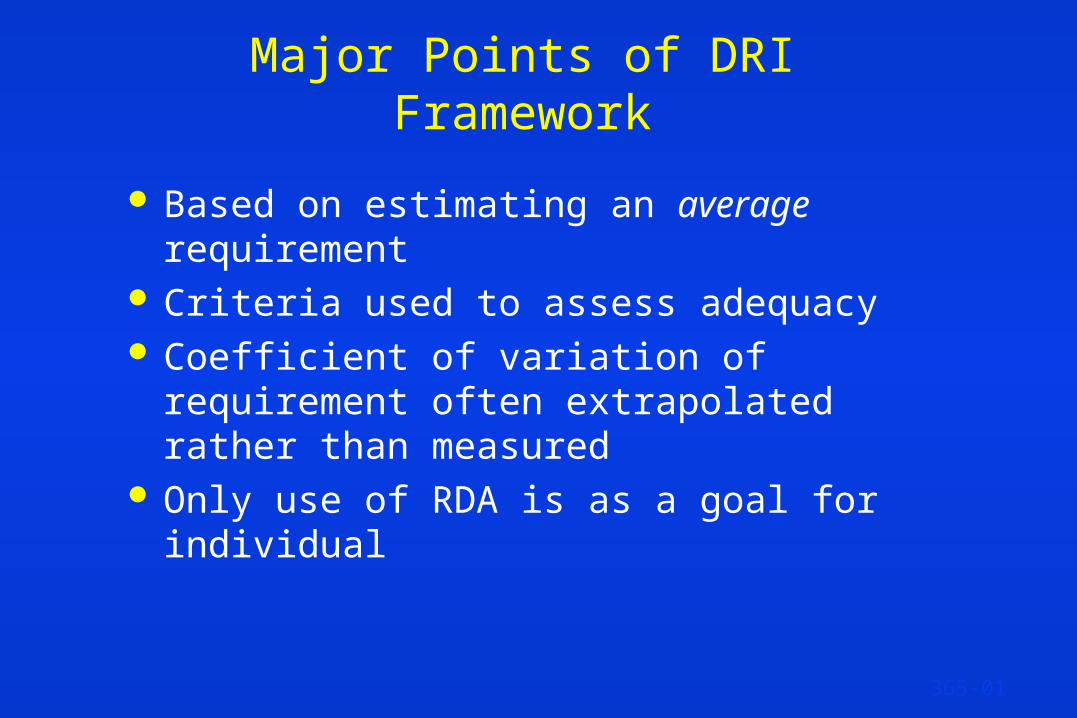
Major Points of DRI Framework
Based on estimating an average requirement Criteria used to assess adequacy Coefficient of variation of requirement often
extrapolated rather than measured Only use of RDA is as a goal for individual
365-01
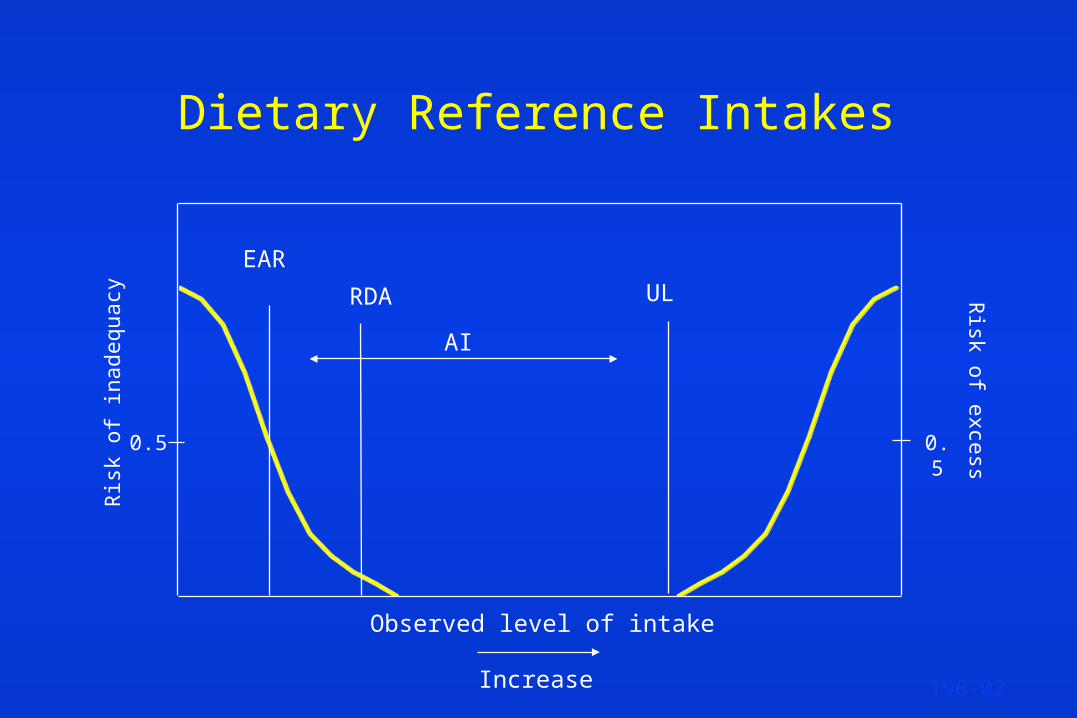
Dietary Reference Intakes
Observed level of intake
UL
Ris
k of
inad
equa
cy Risk of excess0.5 0.5
RDA
AI
EAR
Increase 196-02
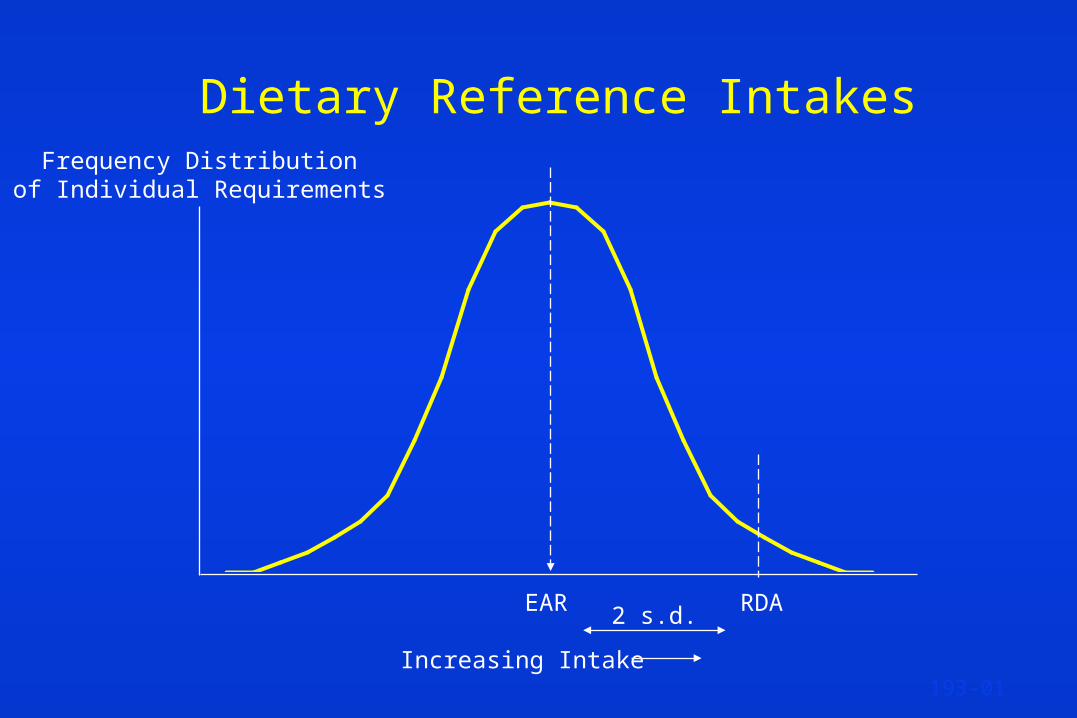
Dietary Reference Intakes
2 s.d.
Frequency Distributionof Individual Requirements
EAR
Increasing Intake
RDA
193-01

Dietary Reference Intakes
Observed level of intake
UL
Ris
k of
inad
equa
cy Risk of excess0.5 0.5
RDA
AI
EAR
Increase 196-02
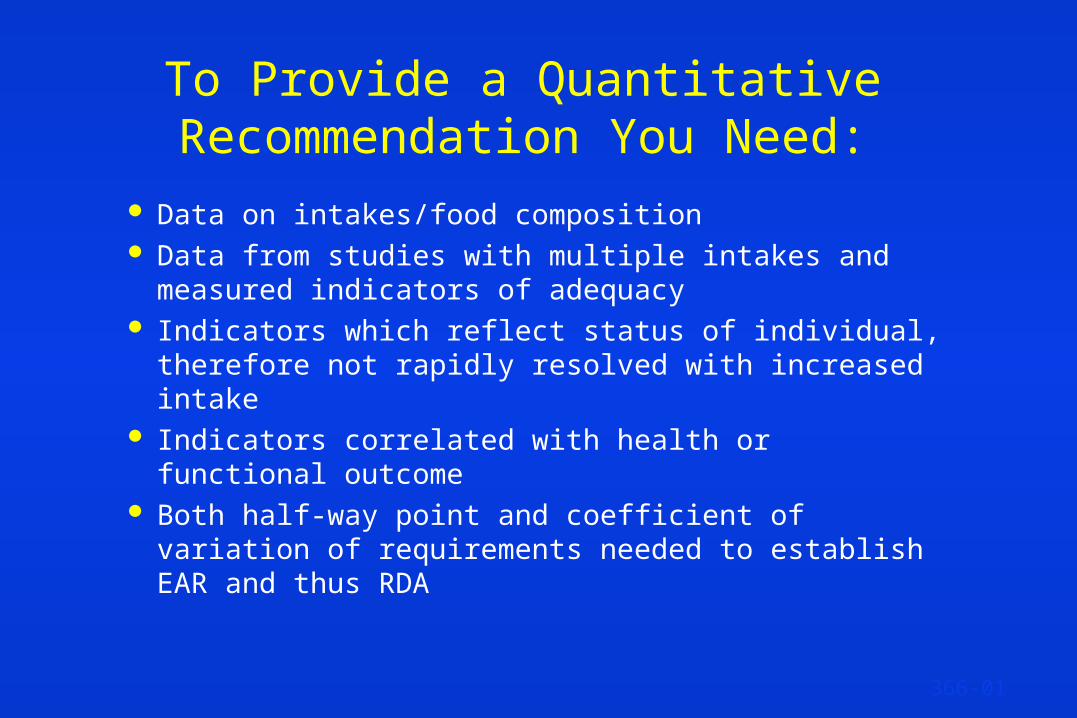
To Provide a Quantitative Recommendation You Need:
Data on intakes/food composition Data from studies with multiple intakes and measured
indicators of adequacy Indicators which reflect status of individual, therefore
not rapidly resolved with increased intake Indicators correlated with health or functional outcome Both half-way point and coefficient of variation of
requirements needed to establish EAR and thus RDA
366-01
Bioavailability
Form of nutrient or food component Factors that affect absorption/utilization Assumptions for “typical” diet Special considerations
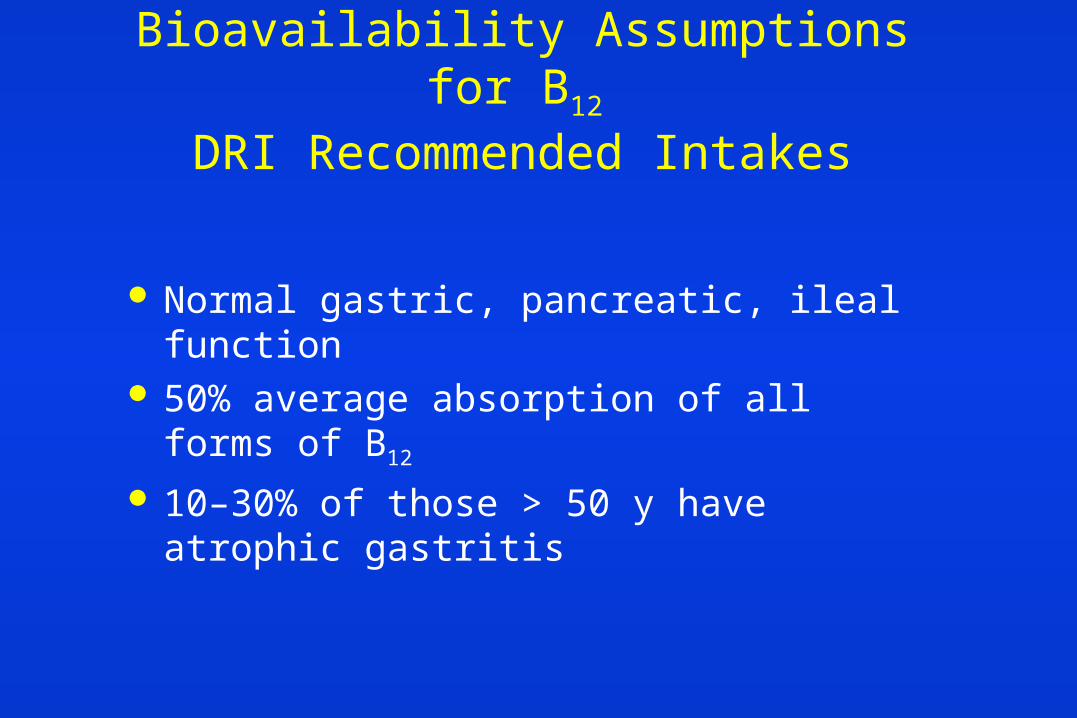
Bioavailability Assumptions for B12
DRI Recommended Intakes
Normal gastric, pancreatic, ileal function 50% average absorption of all forms of B12
10–30% of those > 50 y have atrophic gastritis
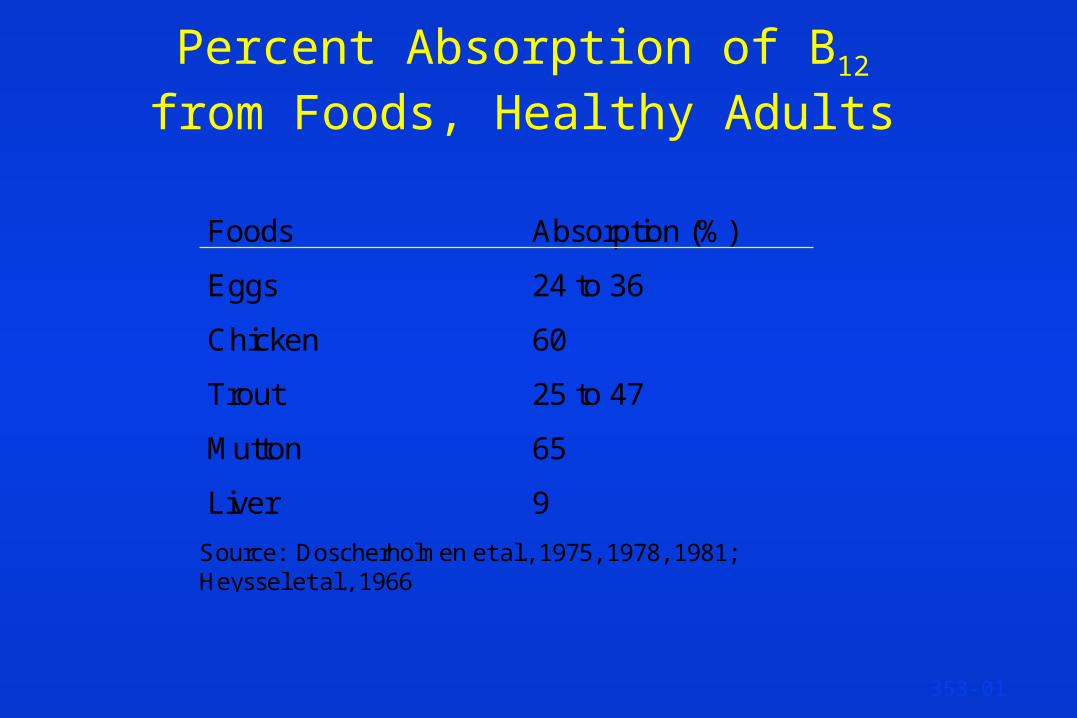
Percent Absorption of B12 from Foods, Healthy Adults
Foods Absorption (%)
Eggs 24 to 36
Chicken 60
Trout 25 to 47
Mutton 65
Liver 9
Source: Doscherholmen et al., 1975, 1978, 1981;Heyssel et al., 1966
353-01
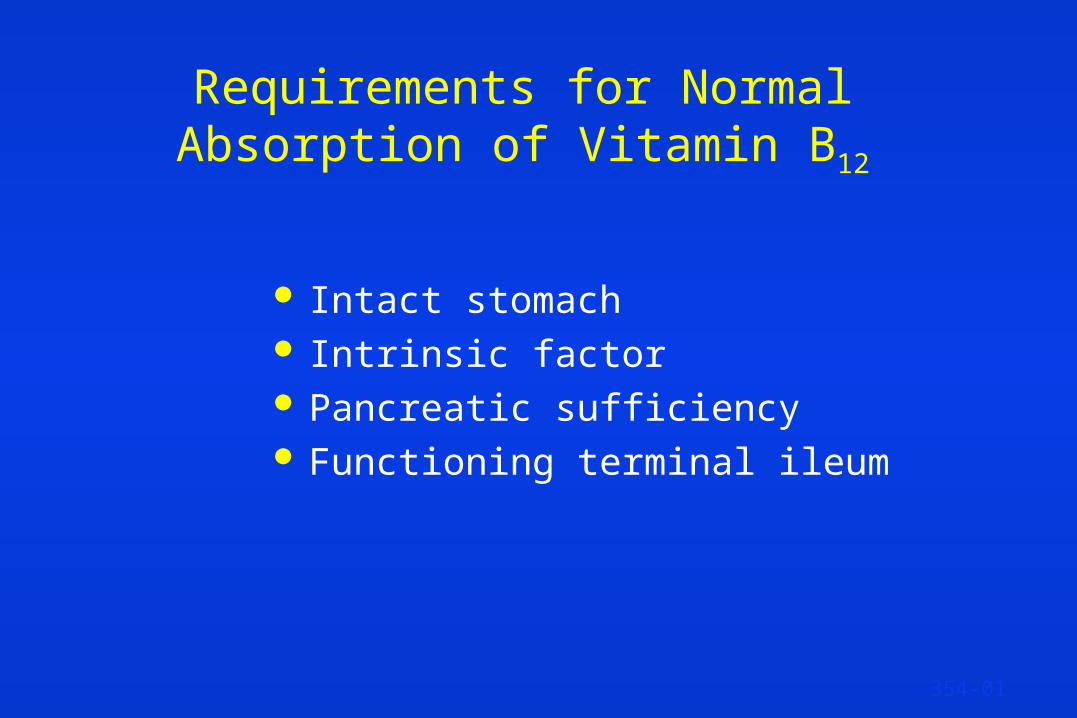
Requirements for Normal Absorption of Vitamin B12
Intact stomach Intrinsic factor Pancreatic sufficiency Functioning terminal ileum
354-01
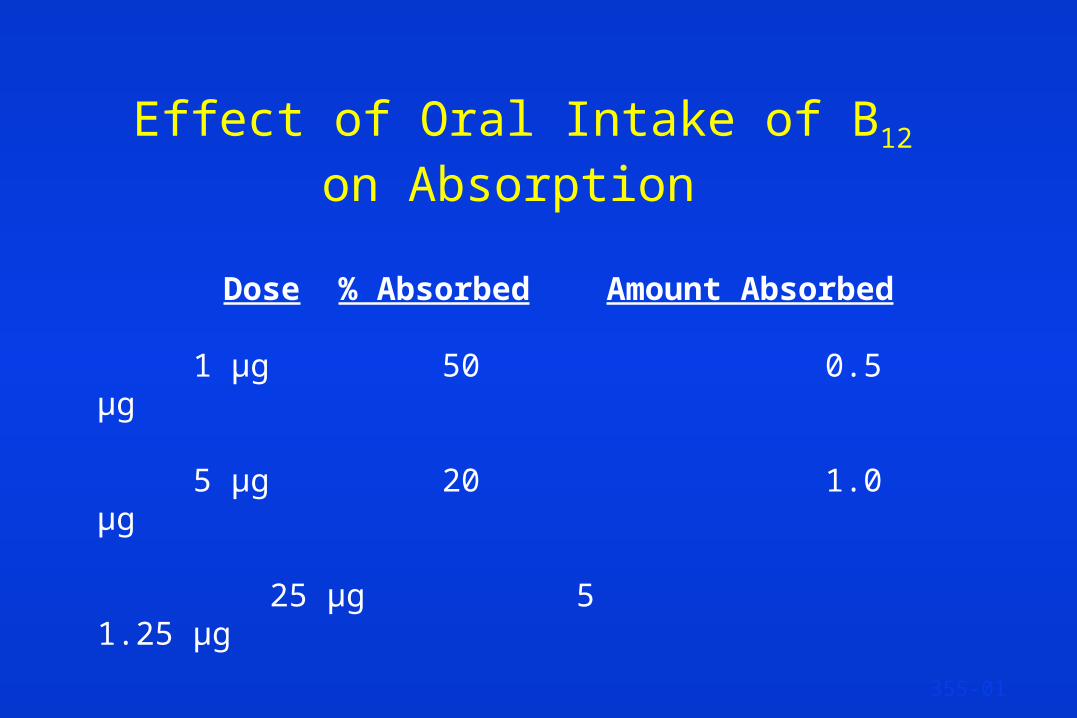
Effect of Oral Intake of B12 on Absorption
355-01
Dose % Absorbed Amount Absorbed
1 µg 50 0.5 µg
5 µg 20 1.0 µg
25 µg 5 1.25 µg
Adams et al., Scand. J. Gastroenterol 6:249-252, 1971.

Derivation of EAR for B12
Requirement normal person for absorbed B12 = 1.0 µg/day
Correct for bioavailability 0.50 = 2.0µg/day
EAR: Average requirement for normal person for B12 from food - 2 µg/day
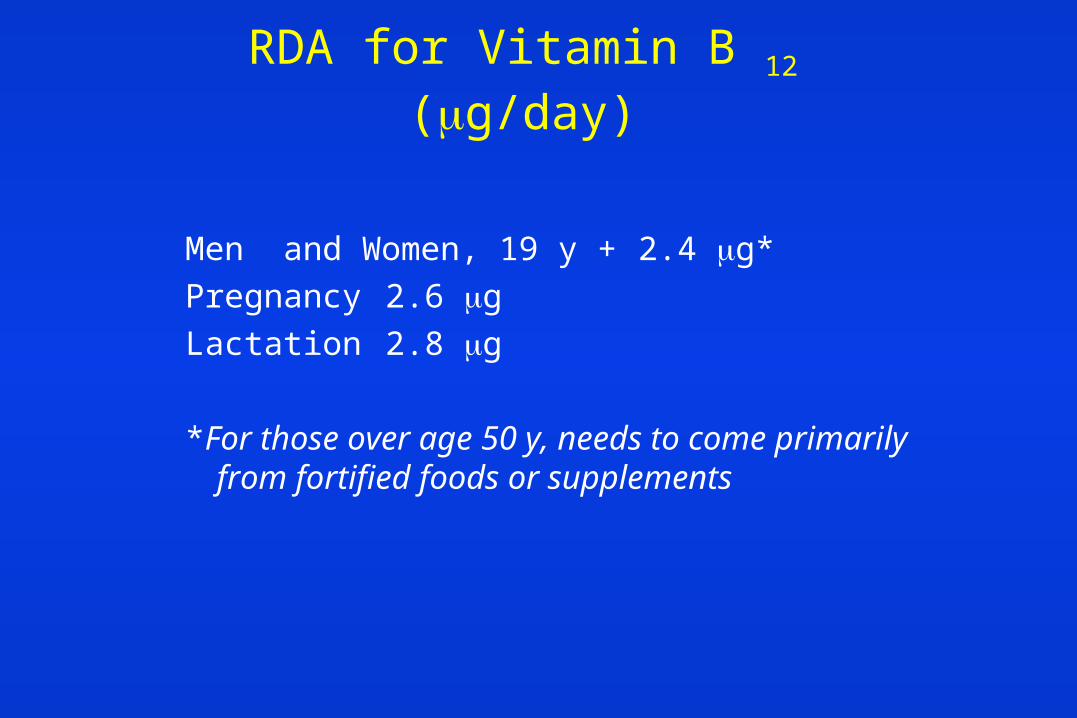
RDA for Vitamin B 12 (g/day)
Men and Women, 19 y + 2.4 g*
Pregnancy 2.6 g
Lactation 2.8 g
*For those over age 50 y, needs to come primarily from fortified foods or supplements
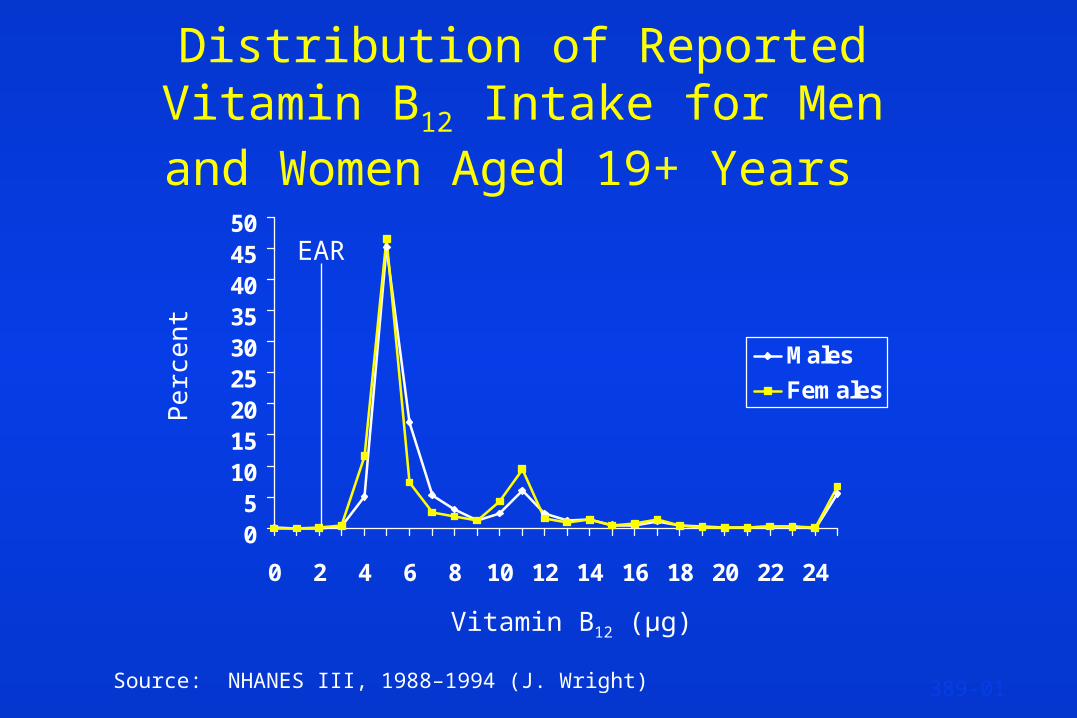
Distribution of Reported Vitamin B12 Intake for Men and Women Aged
19+ Years
05
101520253035404550
0 2 4 6 8 10 12 14 16 18 20 22 24
Males
FemalesPe
rce
nt
Vitamin B12 (µg)
EAR
Source: NHANES III, 1988–1994 (J. Wright) 389-01
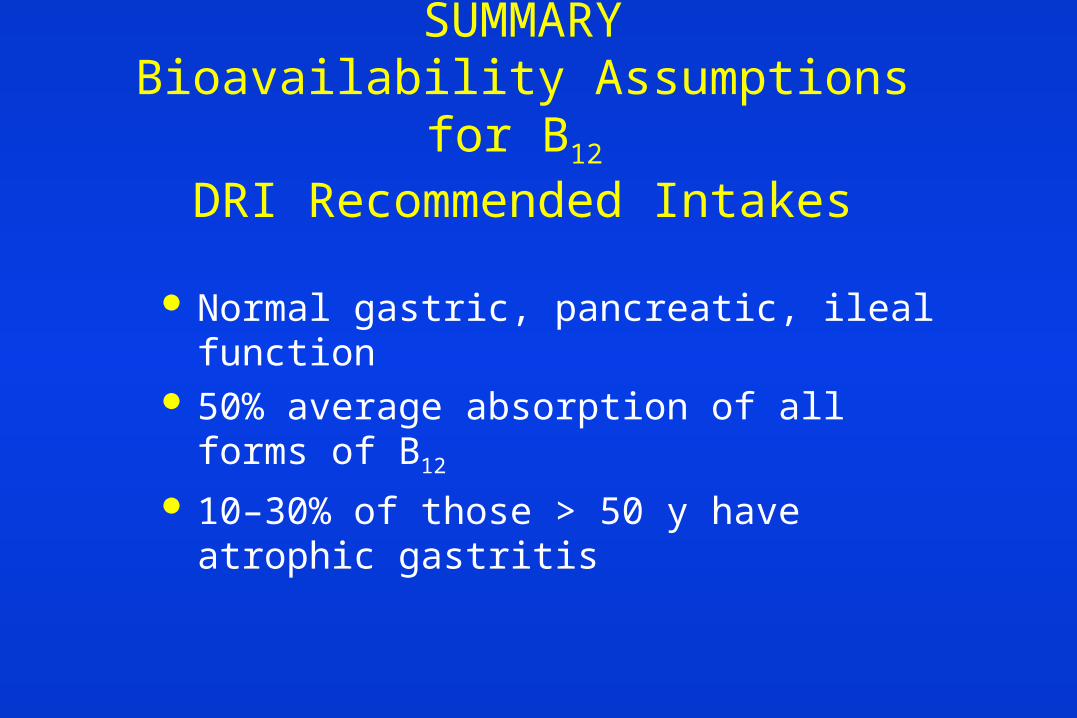
SUMMARYBioavailability Assumptions for B12
DRI Recommended Intakes
Normal gastric, pancreatic, ileal function 50% average absorption of all forms of B12
10–30% of those > 50 y have atrophic gastritis
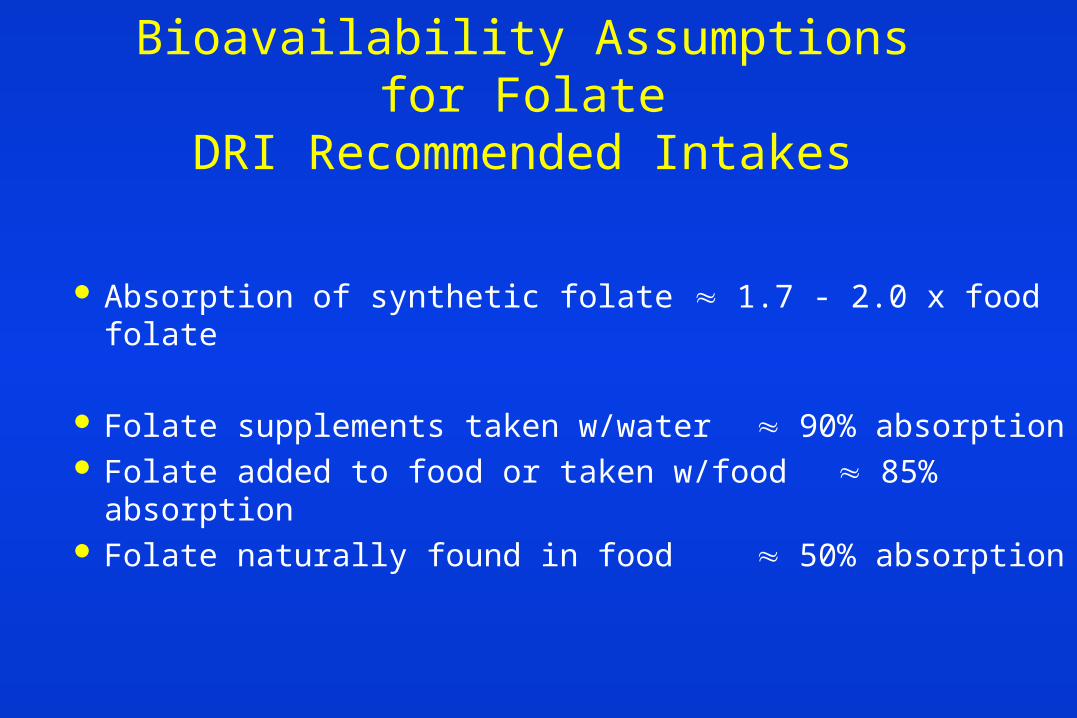
Bioavailability Assumptions for FolateDRI Recommended Intakes
Absorption of synthetic folate 1.7 - 2.0 x food folate
Folate supplements taken w/water 90% absorption Folate added to food or taken w/food 85% absorption Folate naturally found in food 50% absorption
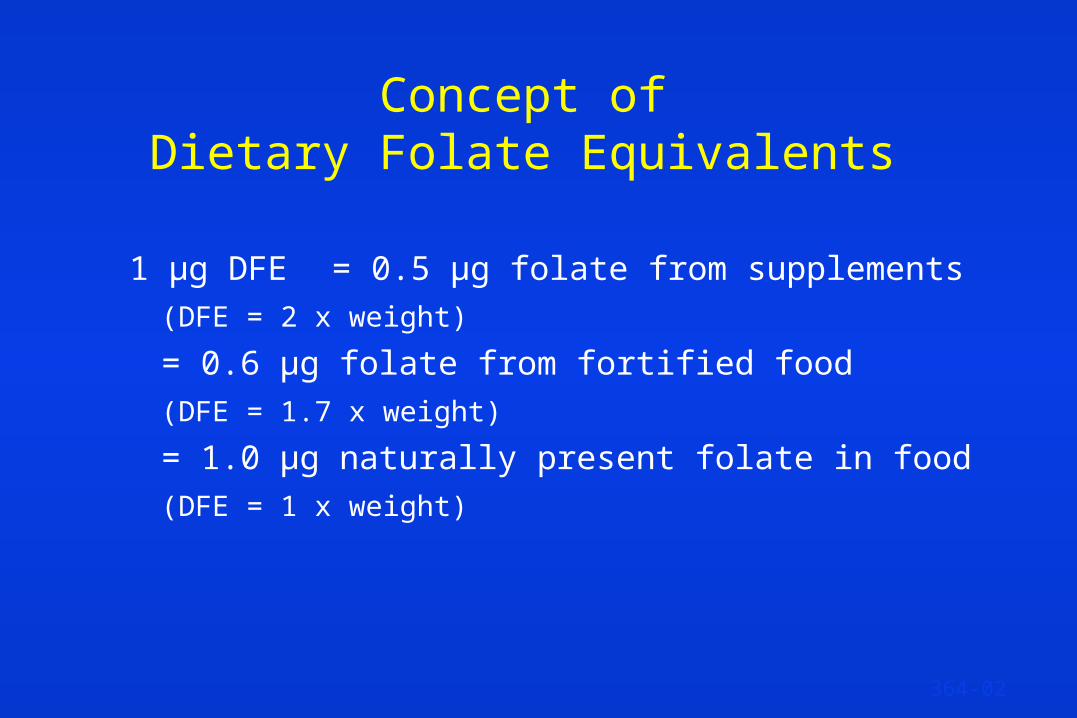
Concept ofDietary Folate Equivalents
1 µg DFE = 0.5 µg folate from supplements
(DFE = 2 x weight)
= 0.6 µg folate from fortified food
(DFE = 1.7 x weight)
= 1.0 µg naturally present folate in food
(DFE = 1 x weight)
364-02
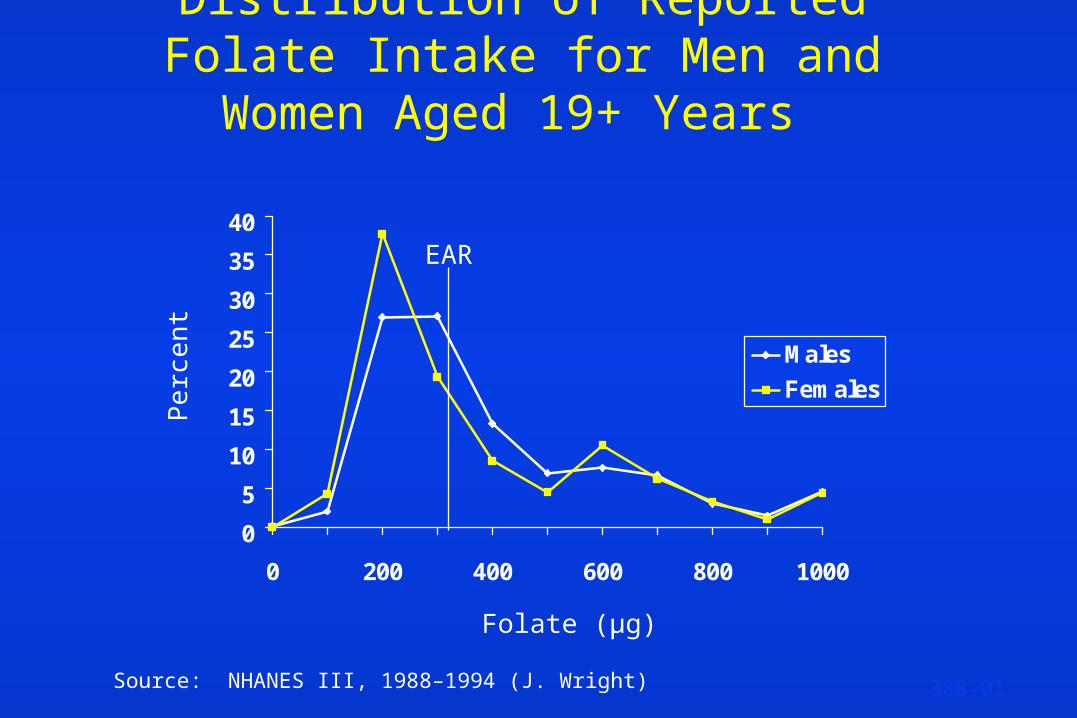
Distribution of Reported Folate Intake for Men and Women Aged 19+ Years
0
5
10
15
20
25
30
35
40
0 200 400 600 800 1000
Males
FemalesPe
rce
nt
Folate (µg)
EAR
Source: NHANES III, 1988–1994 (J. Wright) 388-01
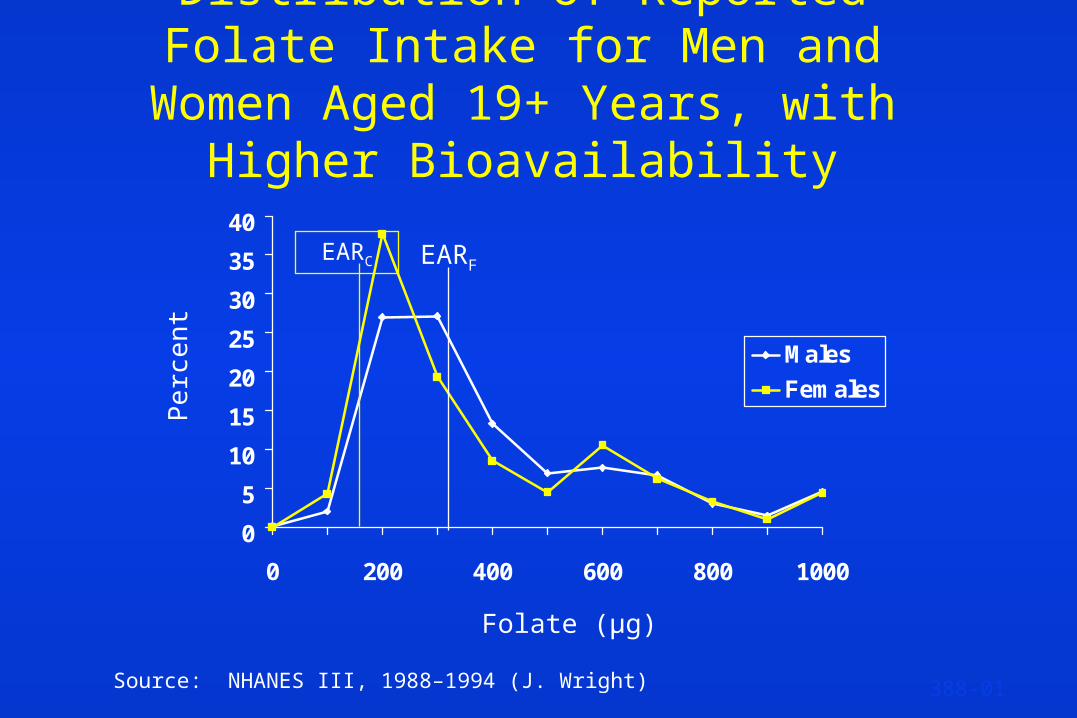
Distribution of Reported Folate Intake for Men and Women Aged 19+
Years, with Higher Bioavailability
0
5
10
15
20
25
30
35
40
0 200 400 600 800 1000
Males
FemalesPe
rce
nt
Folate (µg)
EARF
Source: NHANES III, 1988–1994 (J. Wright) 388-01
EARC
Importance of Data on Food Composition and Dietary Intake
Folate intakes in surveys underestimated due to:
Inadequate enzymatic digestion of food folate when determining food folate content
Data on intake based on prefortification values for folate content in foods consumed
Folate content of foods not available in DFEs Underreporting errors
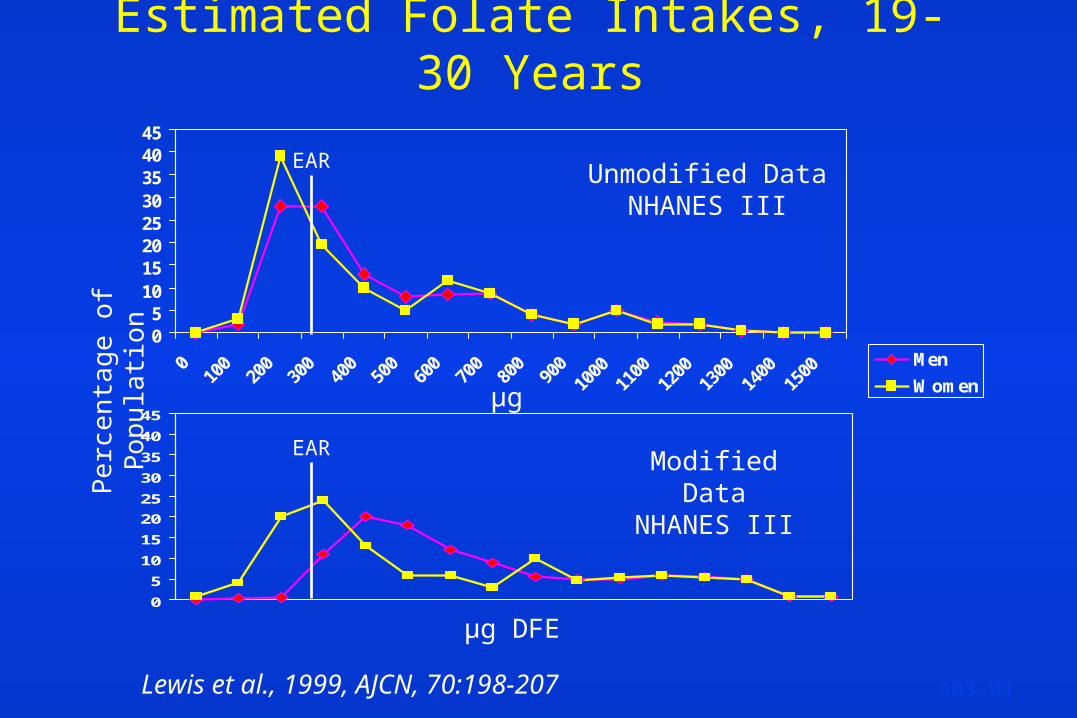
Estimated Folate Intakes, 19-30 Years
05
1015202530354045
Men
Women
0
5
10
15
20
25
30
35
40
45
Unmodified DataNHANES III
Modified DataNHANES III
Pe
rce
nta
ge
of P
op
u la
ti on
µg DFE
403-01Lewis et al., 1999, AJCN, 70:198-207
µg
EAR
EAR
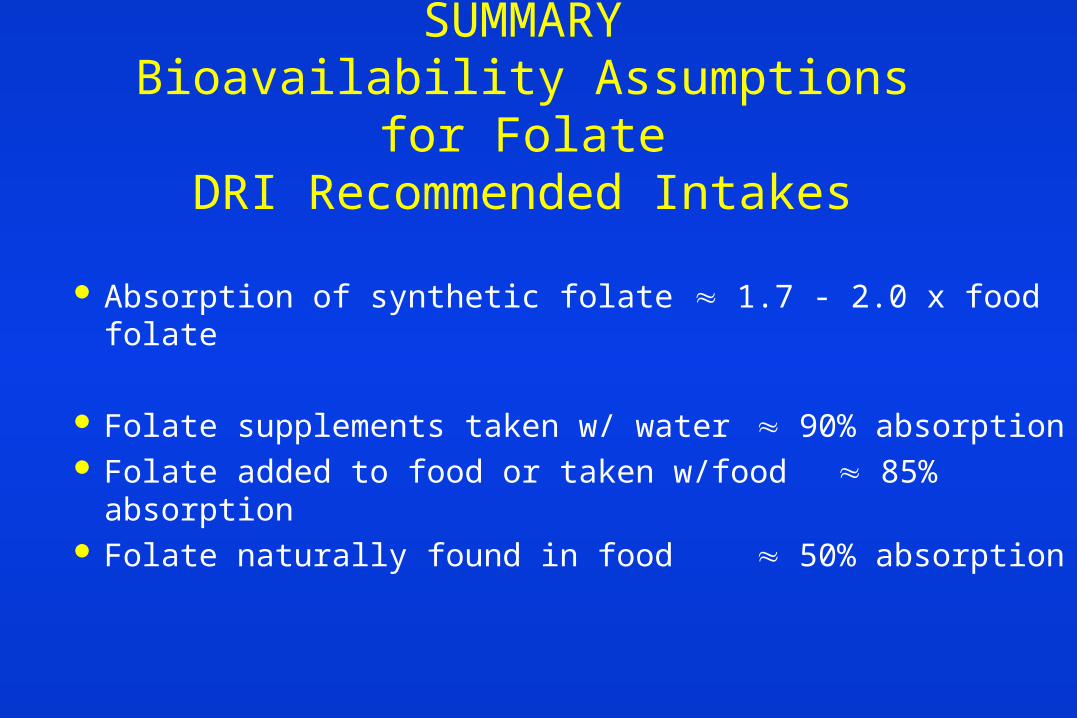
SUMMARYBioavailability Assumptions for Folate
DRI Recommended Intakes
Absorption of synthetic folate 1.7 - 2.0 x food folate
Folate supplements taken w/ water 90% absorption Folate added to food or taken w/food 85% absorption Folate naturally found in food 50% absorption
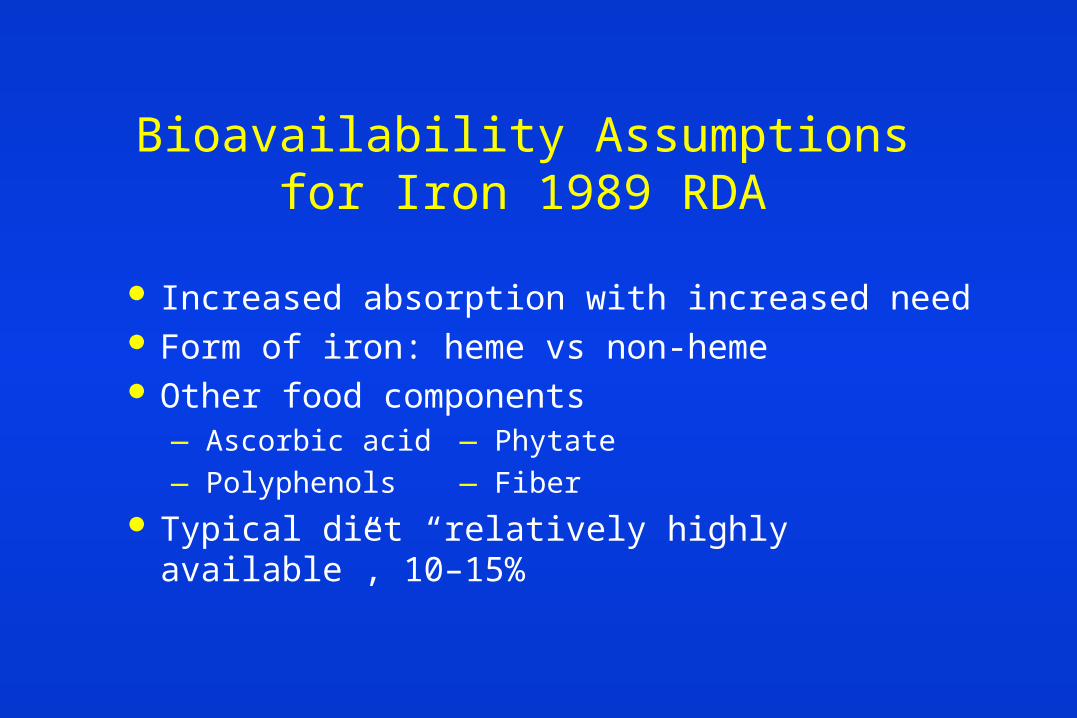
Bioavailability Assumptions for Iron 1989 RDA
Increased absorption with increased need Form of iron: heme vs non-heme Other food components
— Ascorbic acid — Phytate
— Polyphenols — Fiber
Typical diet “relatively highly available”, 10–15%
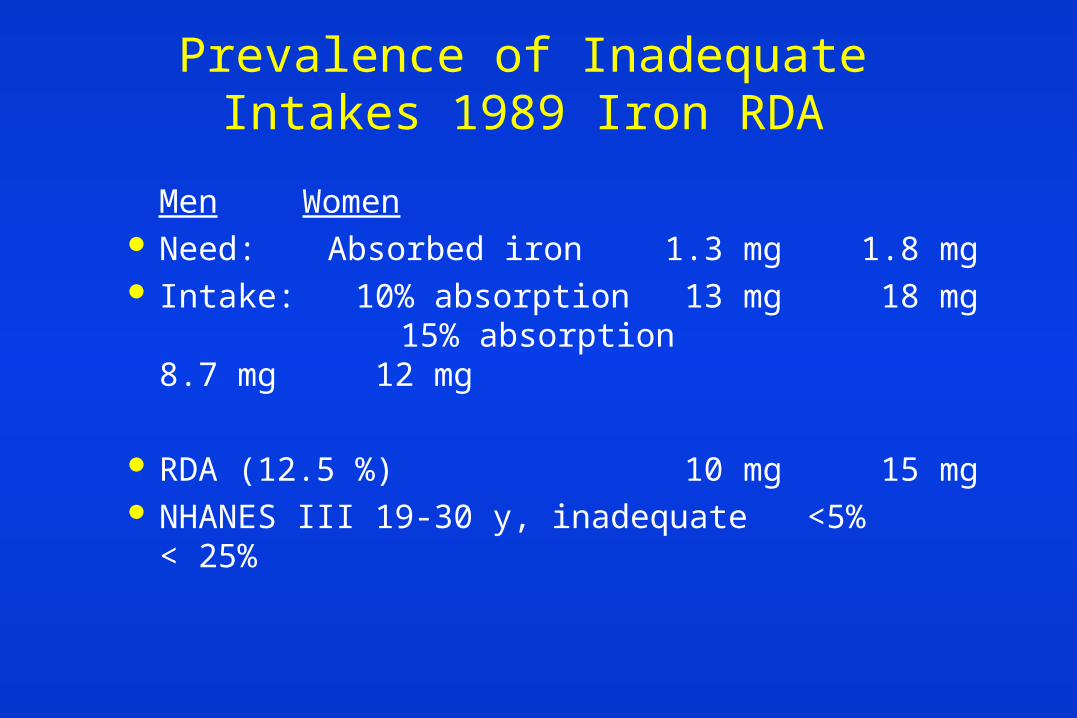
Prevalence of Inadequate Intakes 1989 Iron RDA
Men Women Need: Absorbed iron 1.3 mg 1.8 mg Intake: 10% absorption 13 mg 18 mg
15% absorption 8.7 mg 12 mg
RDA (12.5 %) 10 mg 15 mg NHANES III 19-30 y, inadequate <5% < 25%
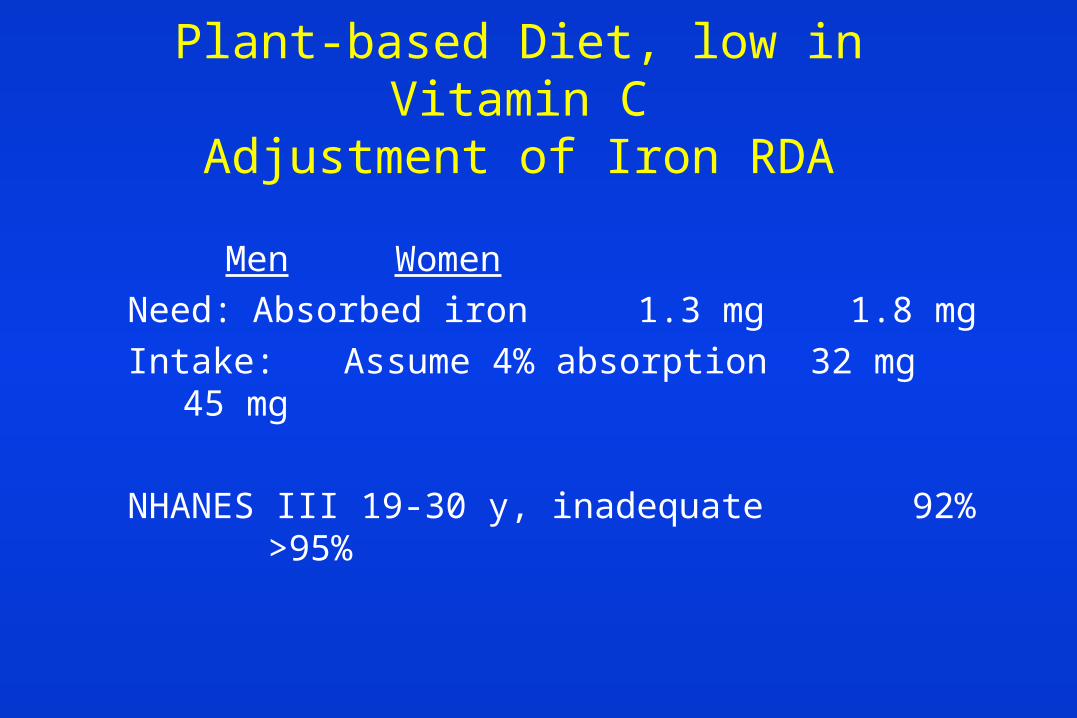
Plant-based Diet, low in Vitamin CAdjustment of Iron RDA
Men Women
Need: Absorbed iron 1.3 mg 1.8 mg
Intake: Assume 4% absorption 32 mg 45 mg
NHANES III 19-30 y, inadequate 92% >95%
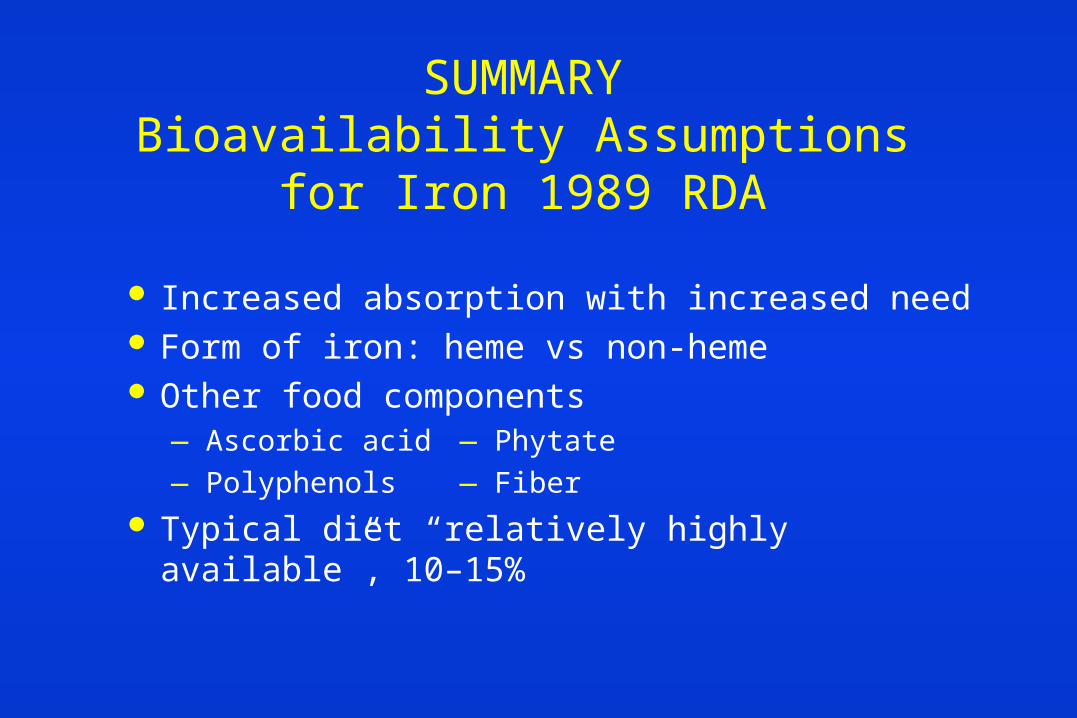
SUMMARYBioavailability Assumptions for Iron
1989 RDA
Increased absorption with increased need Form of iron: heme vs non-heme Other food components
— Ascorbic acid — Phytate
— Polyphenols — Fiber
Typical diet “relatively highly available”, 10–15%
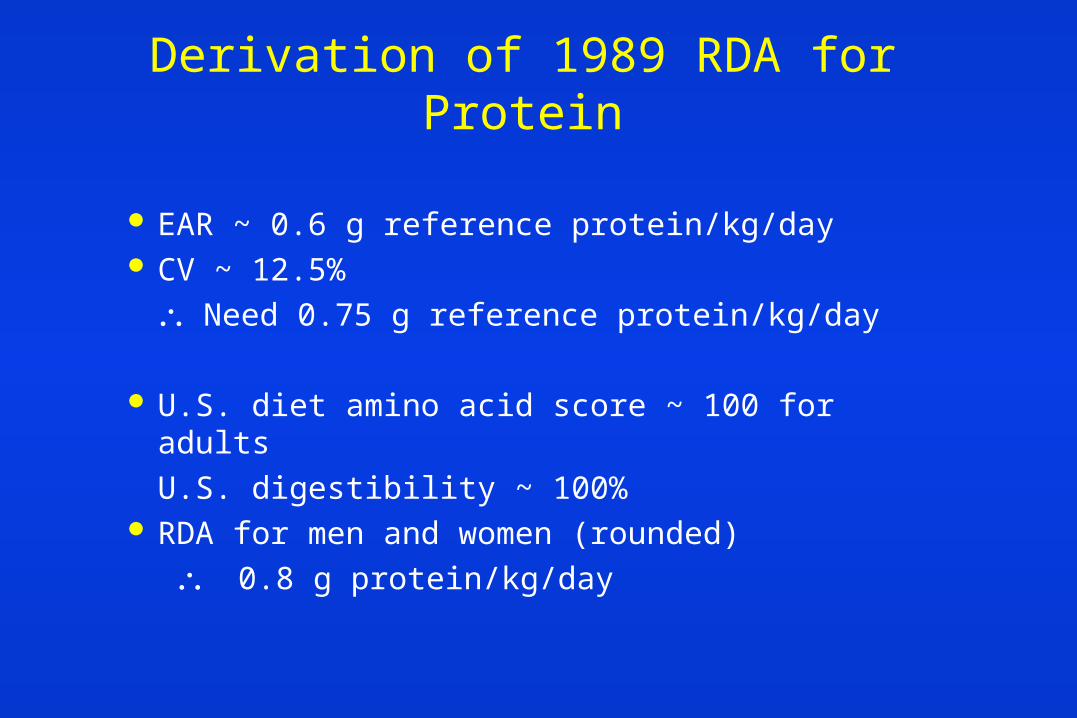
Derivation of 1989 RDA for Protein
EAR ~ 0.6 g reference protein/kg/day CV ~ 12.5%
Need 0.75 g reference protein/kg/day
U.S. diet amino acid score ~ 100 for adults
U.S. digestibility ~ 100% RDA for men and women (rounded)
0.8 g protein/kg/day
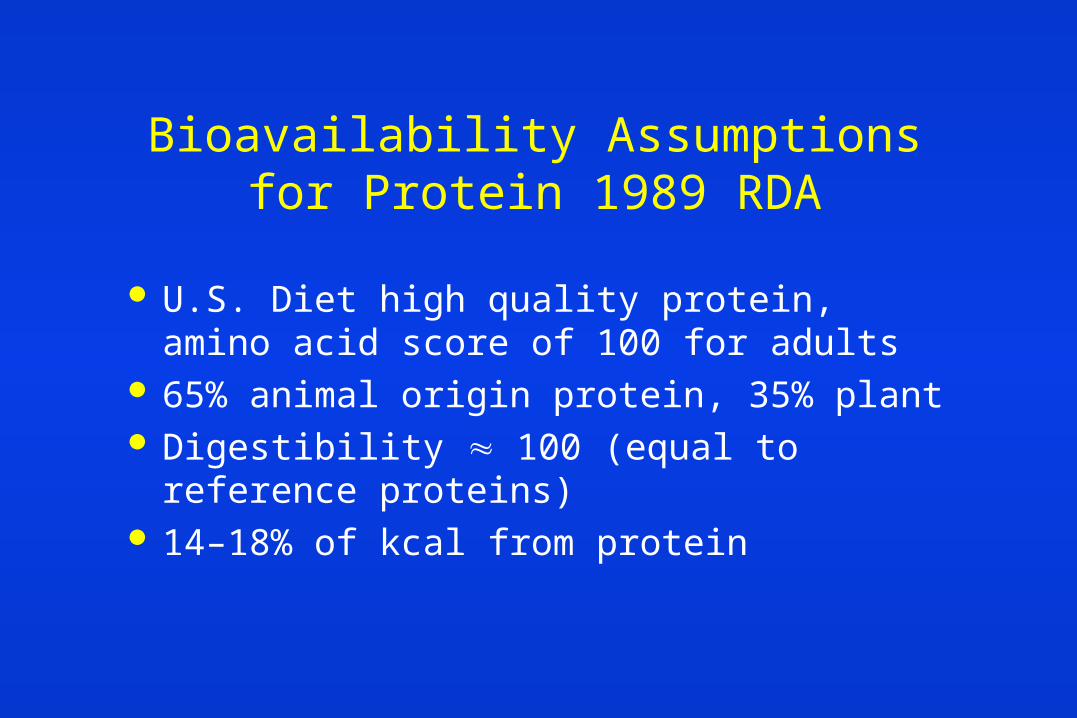
Bioavailability Assumptions for Protein 1989 RDA
U.S. Diet high quality protein, amino acid score of 100 for adults
65% animal origin protein, 35% plant Digestibility 100 (equal to reference proteins) 14–18% of kcal from protein
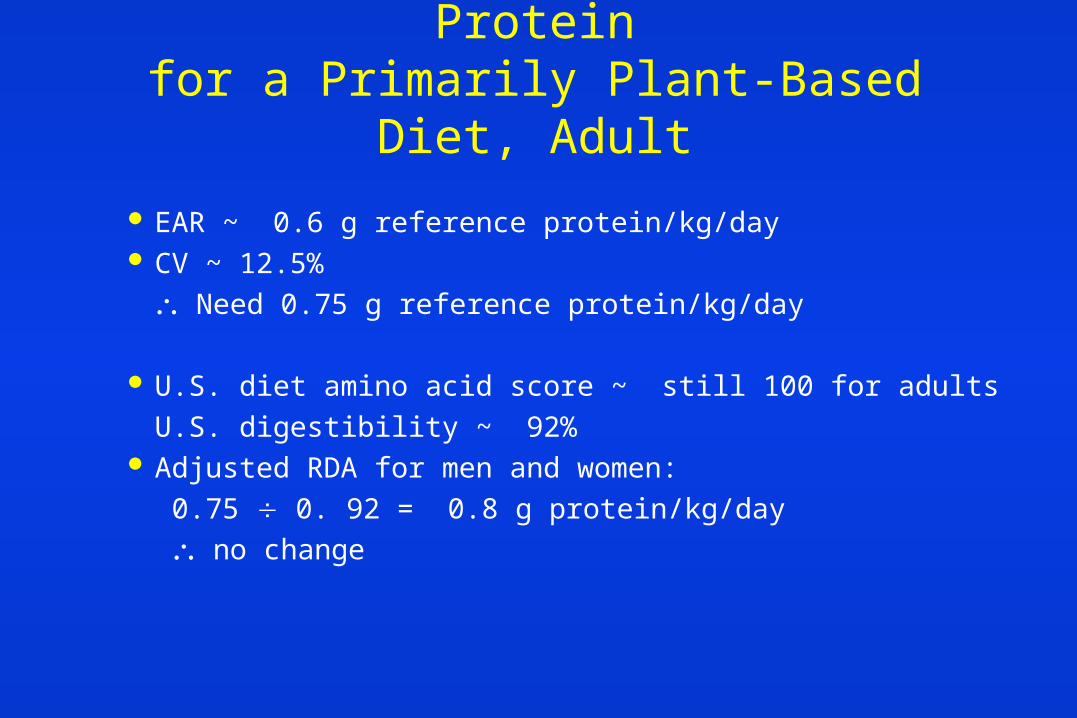
Adjusting the 1989 RDA for Proteinfor a Primarily Plant-Based Diet, Adult
EAR ~ 0.6 g reference protein/kg/day CV ~ 12.5%
Need 0.75 g reference protein/kg/day
U.S. diet amino acid score ~ still 100 for adults
U.S. digestibility ~ 92% Adjusted RDA for men and women:
0.75 0. 92 = 0.8 g protein/kg/day
no change
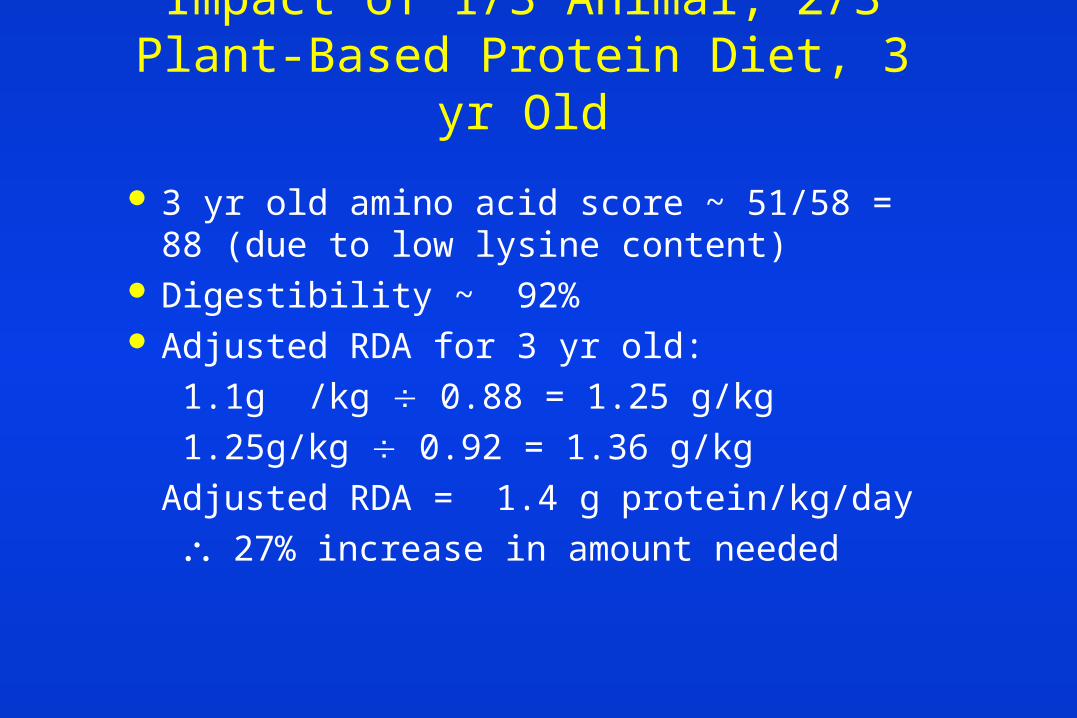
Impact of 1/3 Animal, 2/3 Plant-Based Protein Diet, 3 yr Old
3 yr old amino acid score ~ 51/58 = 88 (due to low lysine content)
Digestibility ~ 92% Adjusted RDA for 3 yr old:
1.1g /kg 0.88 = 1.25 g/kg
1.25g/kg 0.92 = 1.36 g/kg
Adjusted RDA = 1.4 g protein/kg/day
27% increase in amount needed
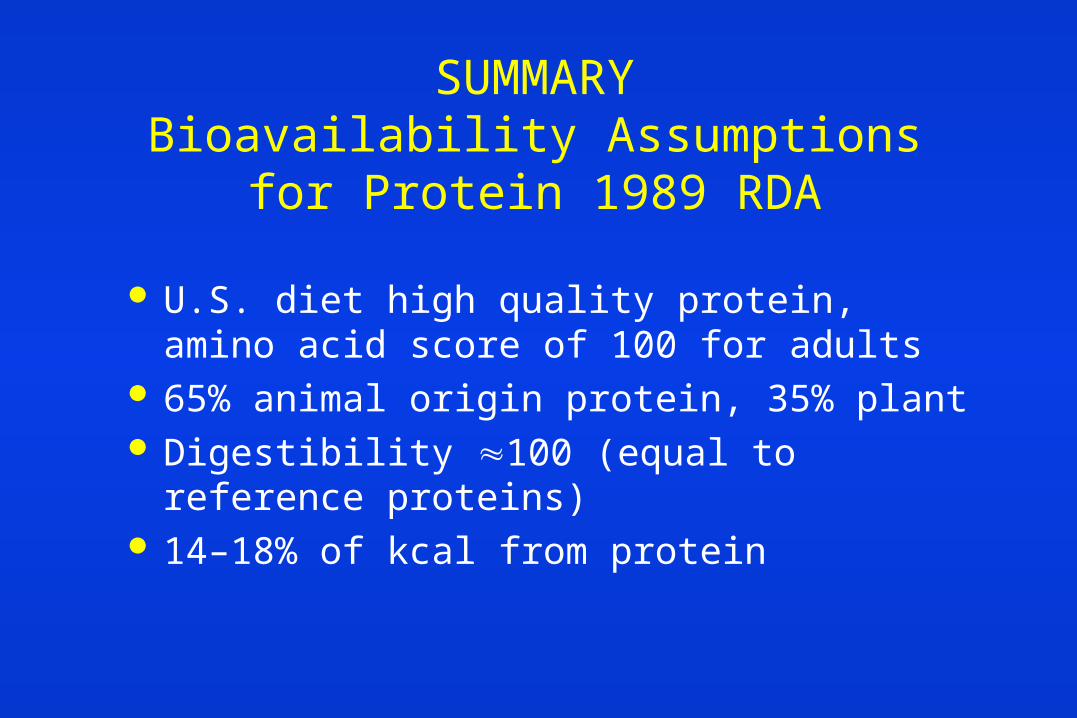
SUMMARYBioavailability Assumptions for Protein
1989 RDA
U.S. diet high quality protein, amino acid score of 100 for adults
65% animal origin protein, 35% plant Digestibility 100 (equal to reference proteins) 14–18% of kcal from protein
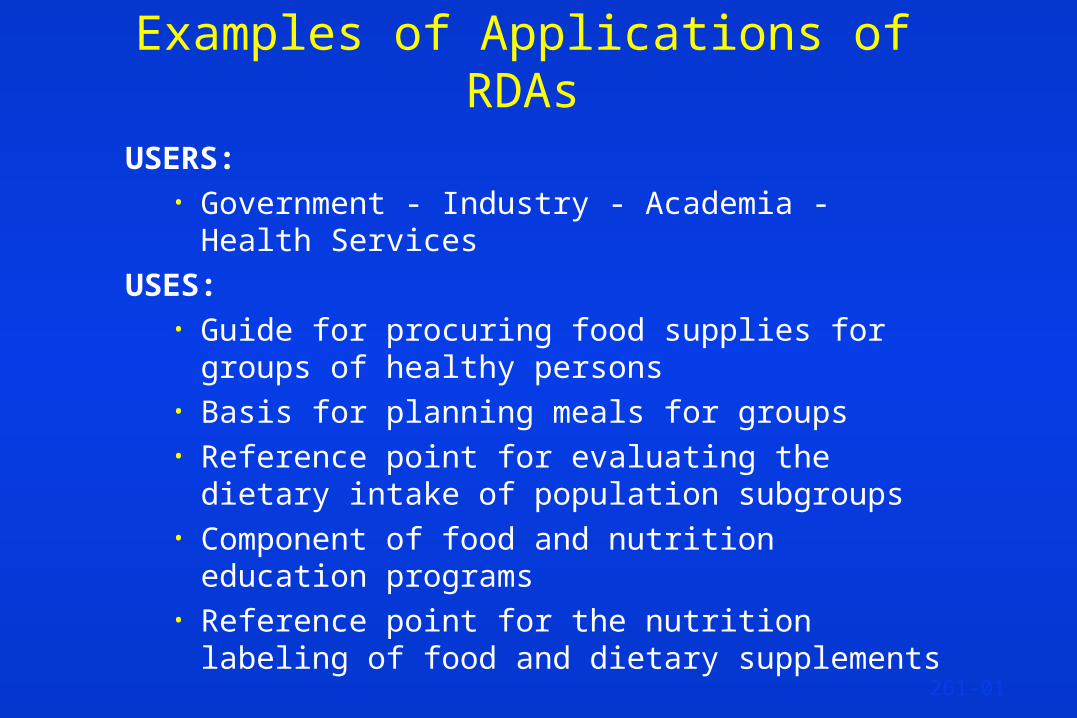
Examples of Applications of RDAsUSERS:
• Government - Industry - Academia - Health Services
USES:• Guide for procuring food supplies for groups of
healthy persons• Basis for planning meals for groups• Reference point for evaluating the dietary intake of
population subgroups• Component of food and nutrition education
programs• Reference point for the nutrition labeling of food and
dietary supplements
261-01
Food and Nutrition Boardhttp://www.nas.edu/iom/fnb
Publications: http://www.nap.edu
111-02