Embed Size (px)
Citation preview
National Oilwell Varco
Barclays CEO Energy-Power Conference
Clay WilliamsPresident, Chairman, and Chief Executive Officer
September 10, 2015
Statements made in the course of this presentation that state theCompany’s or management’s intentions, hopes, beliefs, expectations orpredictions of the future are forward-looking statements. It is importantto note that the Company’s actual results could differ materially fromthose projected in such forward-looking statements. Additionalinformation concerning factors that could cause actual results to differmaterially from those in the forward-looking statements, including riskfactors, is contained from time-to-time in the Company’s filings with theU.S. Securities and Exchange Commission. Any decision regarding theCompany or its securities should be made upon careful consideration ofnot only the information here presented, but also other availableinformation, including the information filed by the Company with theSEC. Copies of these filings may be obtained by contacting the Companyor the SEC or through the Company’s website.
©2015 NOV NOV Q2’15 Investor Presentation | 2
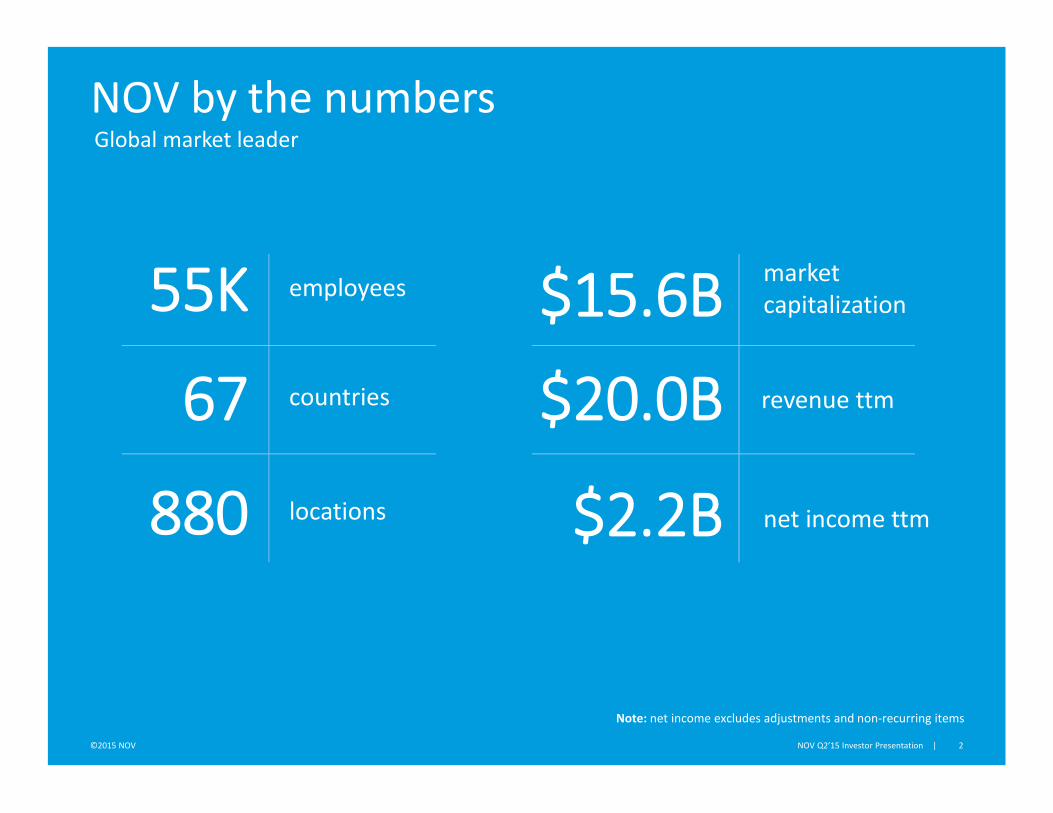
NOV by the numbers
55K employees
67 countries
880 locations
$20.0B revenue ttm
$2.2B net income ttm
$15.6Bmarketcapitalization
Global market leader
Note: net income excludes adjustments and non-recurring items
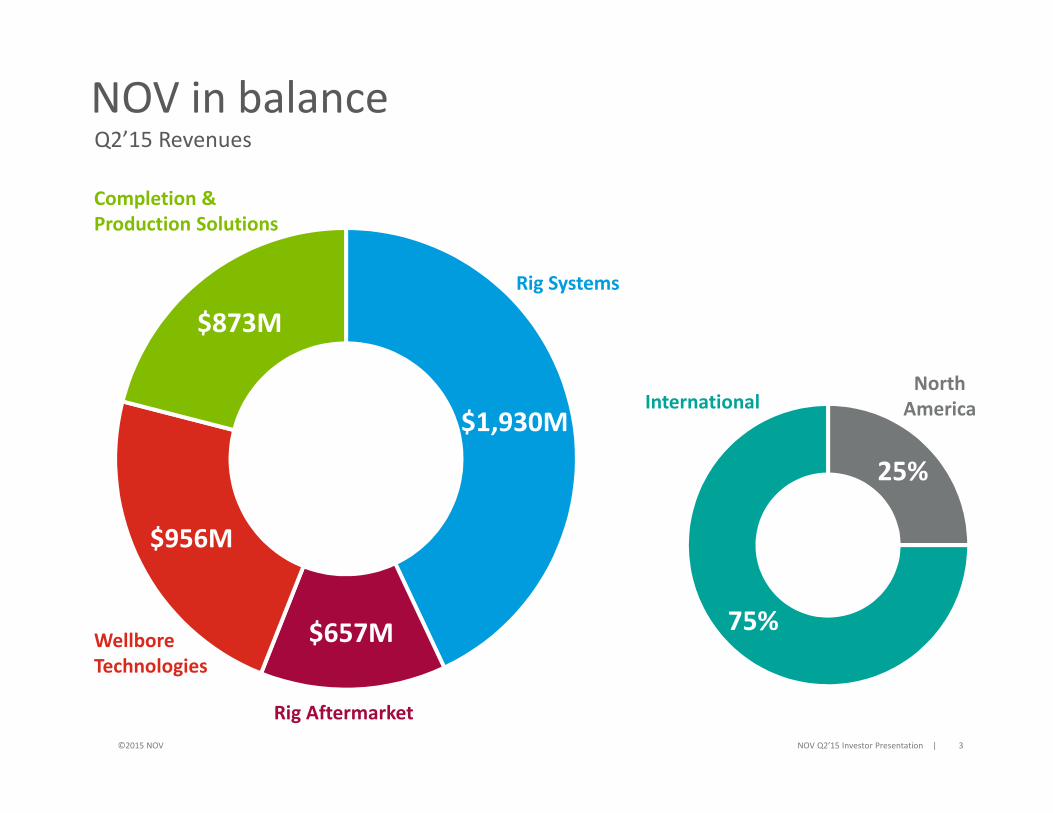
$1,930M
$657M
$956M
$873M
25%
75%
Rig Systems
Rig Aftermarket
WellboreTechnologies
Completion &Production Solutions
InternationalNorth
America
NOV in balanceQ2’15 Revenues
©2015 NOV NOV Q2’15 Investor Presentation | 3
©2015 NOV NOV Q2’15 Investor Presentation | 4
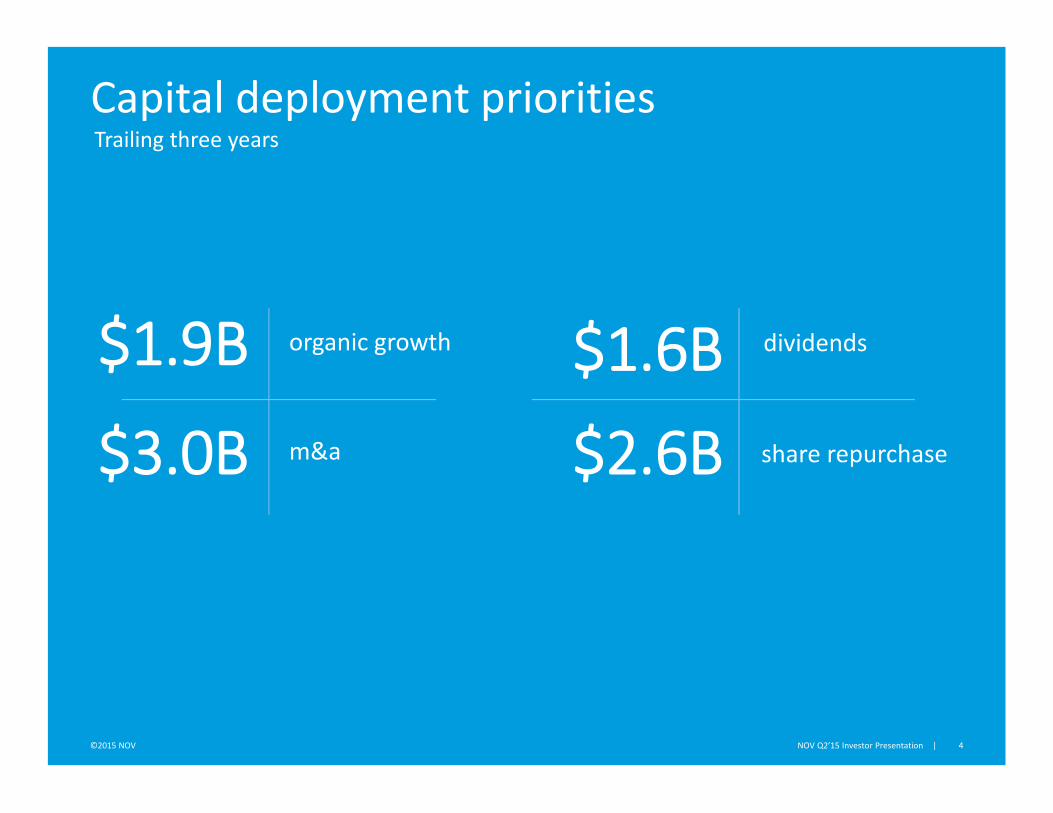
Capital deployment priorities
$1.9B organic growth
$3.0B m&a $2.6B share repurchase
$1.6B dividends
Trailing three years
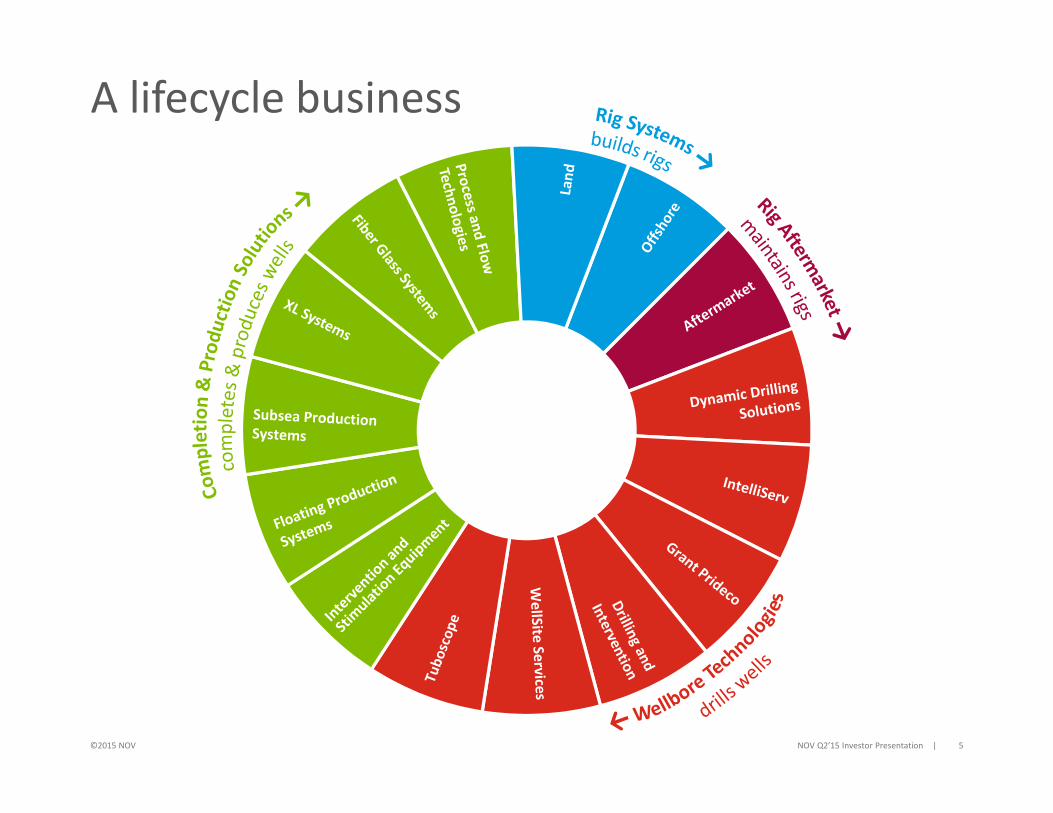
A lifecycle business
©2015 NOV NOV Q2’15 Investor Presentation | 5
Market leadership in all we do
Dependable partner in high-risk high-cost world
Sustainable competitive advantage
Attractive reinvestment opportunities
Entrepreneurial culture
National Oilwell VarcoThe oilfield’s leading technology and equipment provider
6©2015 NOV NOV Q2’15 Investor Presentation |
“The great energy challenge of thefuture, which will test all sources, ismeeting the demand growth of agrowing world.”
-- Daniel YerginVice Chairman, IHS
©2015 NOV NOV Q2’15 Investor Presentation | 7
Source: “ExxonMobil The Outlook for Energy: A View to 2040”
©2015 NOV NOV Q2’15 Investor Presentation | 8
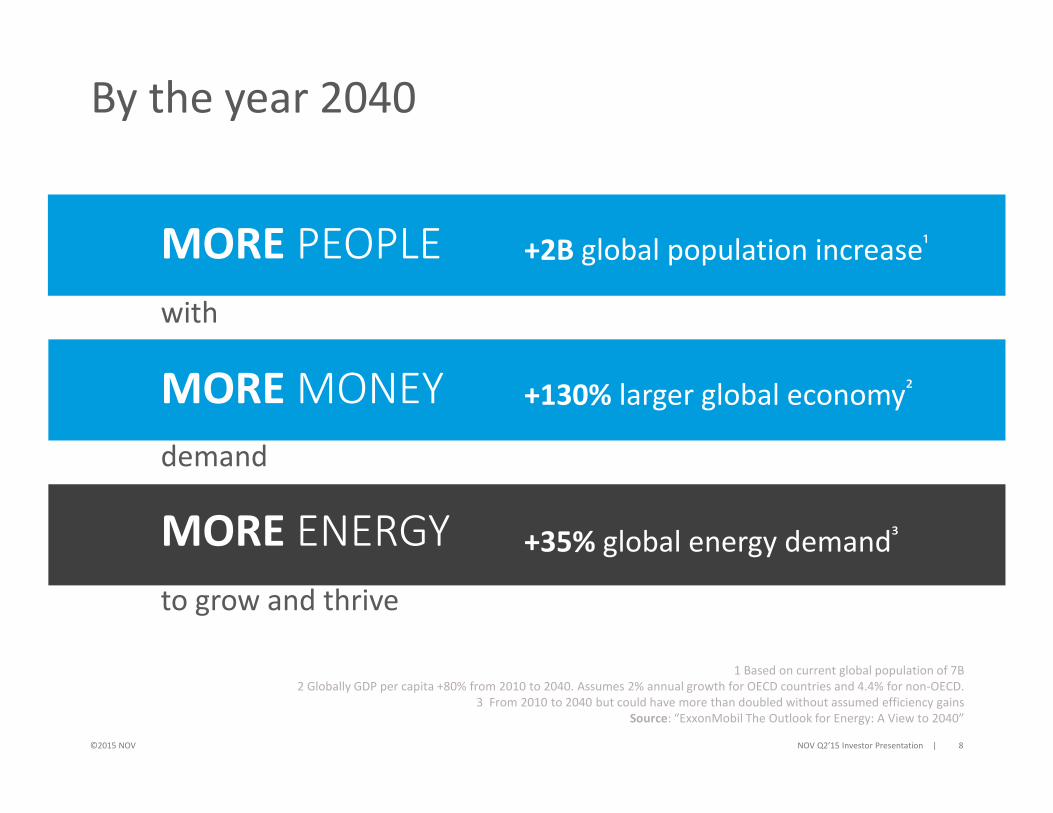
1 Based on current global population of 7B2 Globally GDP per capita +80% from 2010 to 2040. Assumes 2% annual growth for OECD countries and 4.4% for non-OECD.
3 From 2010 to 2040 but could have more than doubled without assumed efficiency gainsSource: “ExxonMobil The Outlook for Energy: A View to 2040”
+2B global population increase¹
+130% larger global economy²
+35% global energy demand³
MORE PEOPLE
MORE MONEY
MORE ENERGY
with
demand
to grow and thrive
By the year 2040
©2015 NOV NOV Q2’15 Investor Presentation | 9
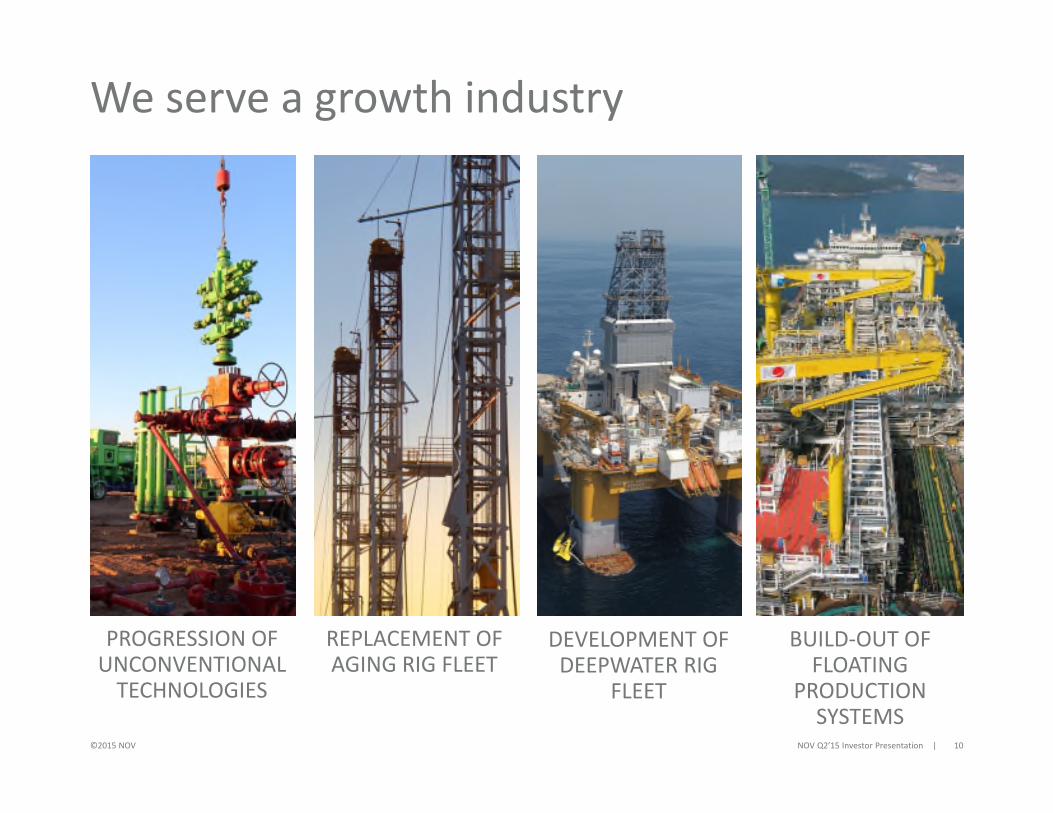
We serve a growth industry
PROGRESSION OFUNCONVENTIONAL
TECHNOLOGIES
REPLACEMENT OFAGING RIG FLEET
DEVELOPMENT OFDEEPWATER RIG
FLEET
BUILD-OUT OFFLOATING
PRODUCTIONSYSTEMS
©2015 NOV NOV Q2’15 Investor Presentation | 10
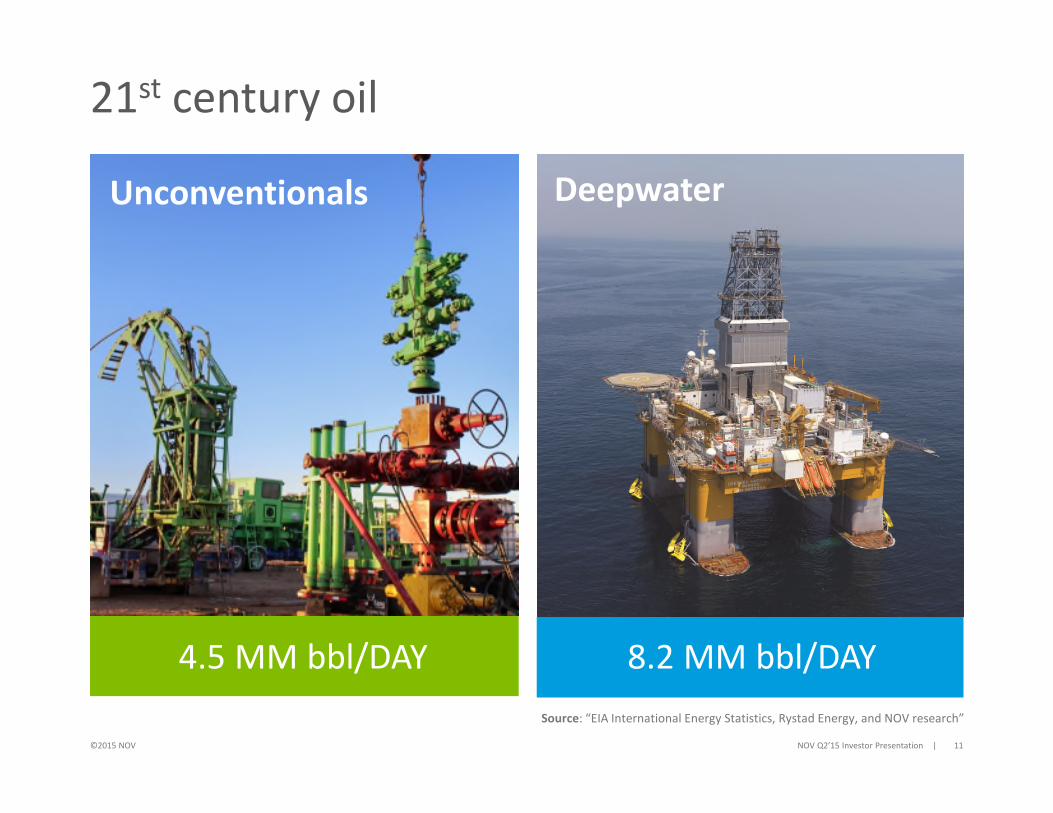
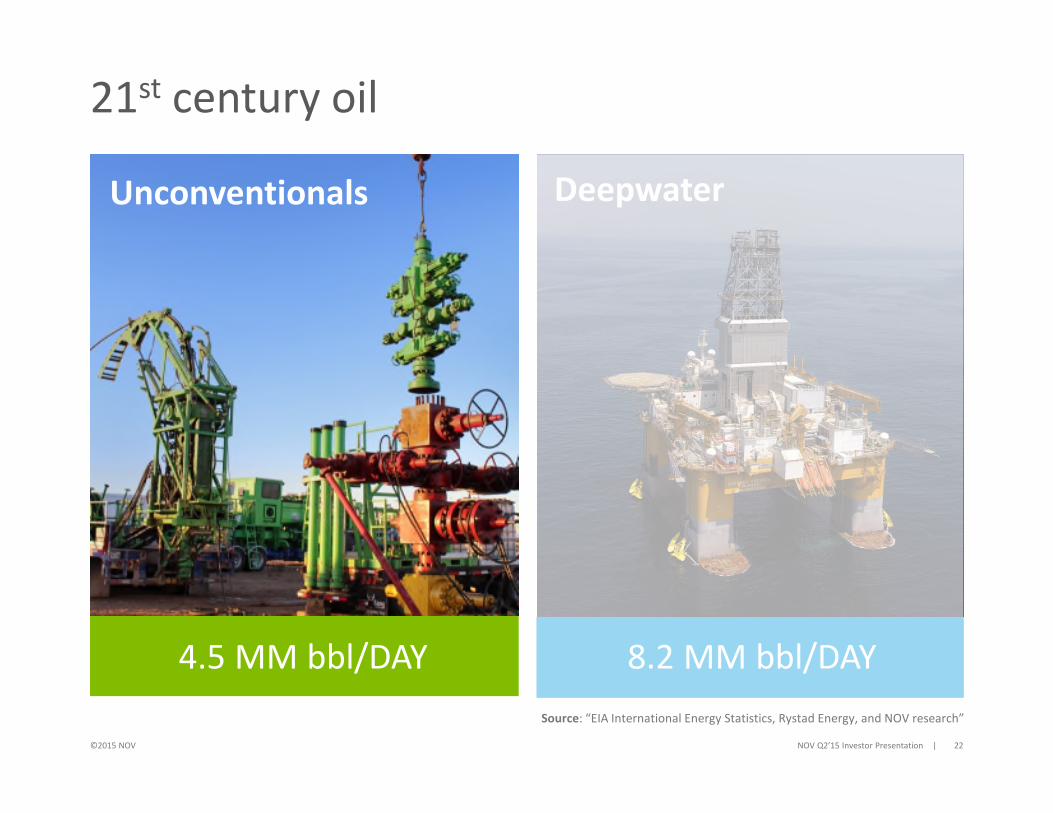
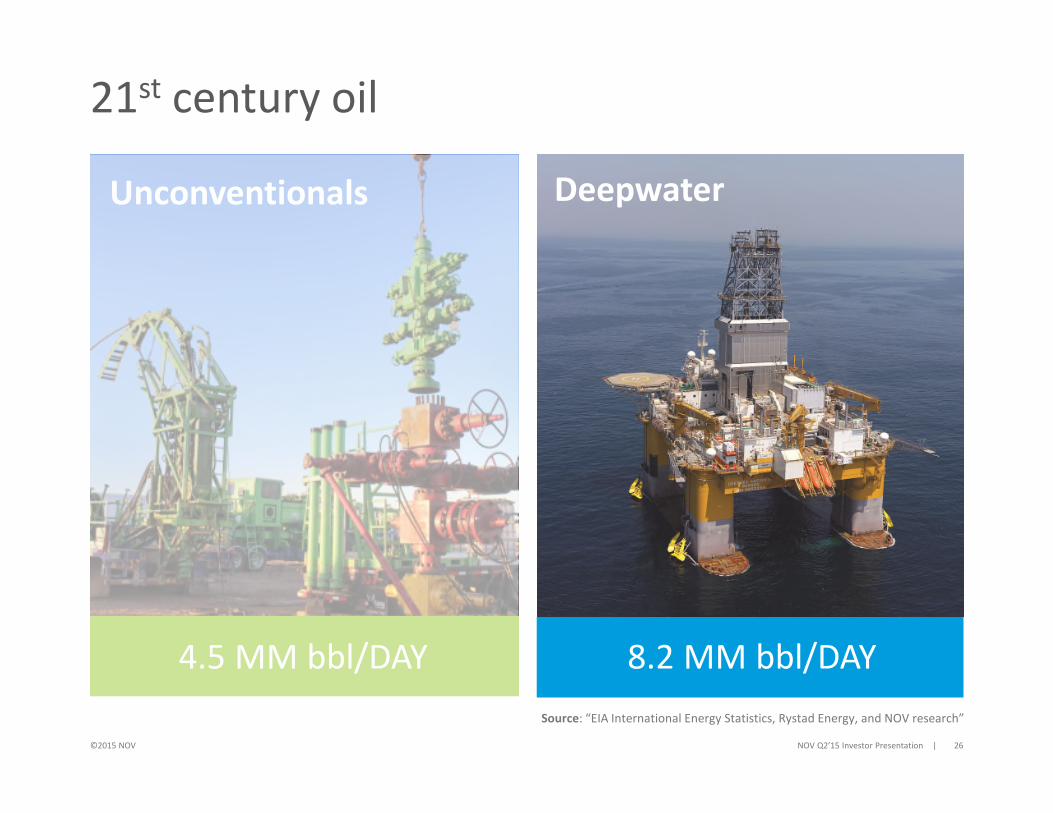
21st century oil
4.5 MM bbl/DAY
©2015 NOV NOV Q2’15 Investor Presentation | 11
Unconventionals Deepwater
8.2 MM bbl/DAY
Source: “EIA International Energy Statistics, Rystad Energy, and NOV research”
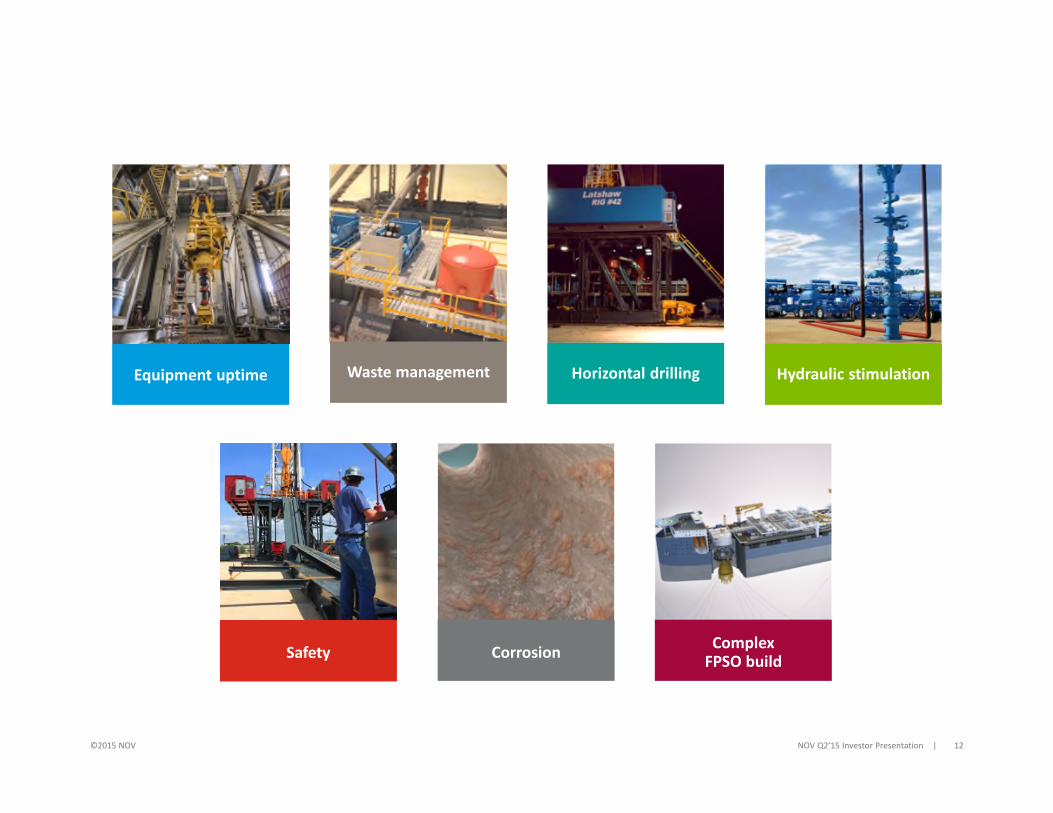
Horizontal drilling
Safety
©2015 NOV NOV Q2’15 Investor Presentation | 12
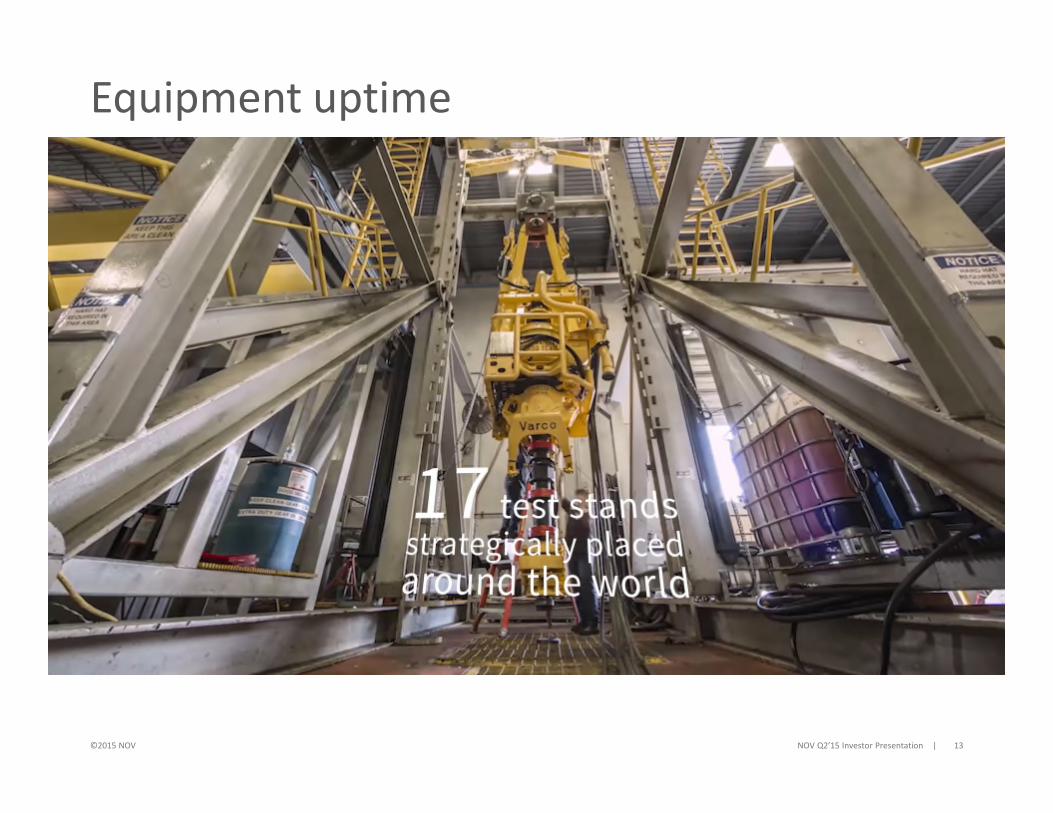
Equipment uptime
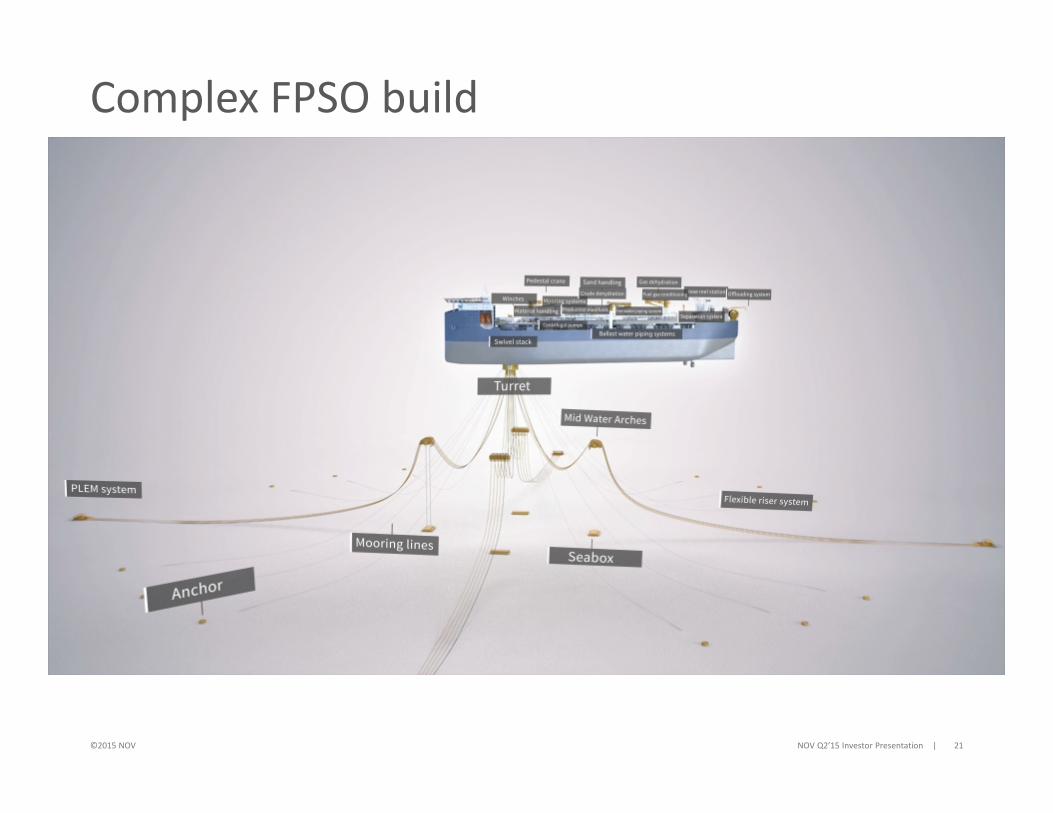
ComplexFPSO build
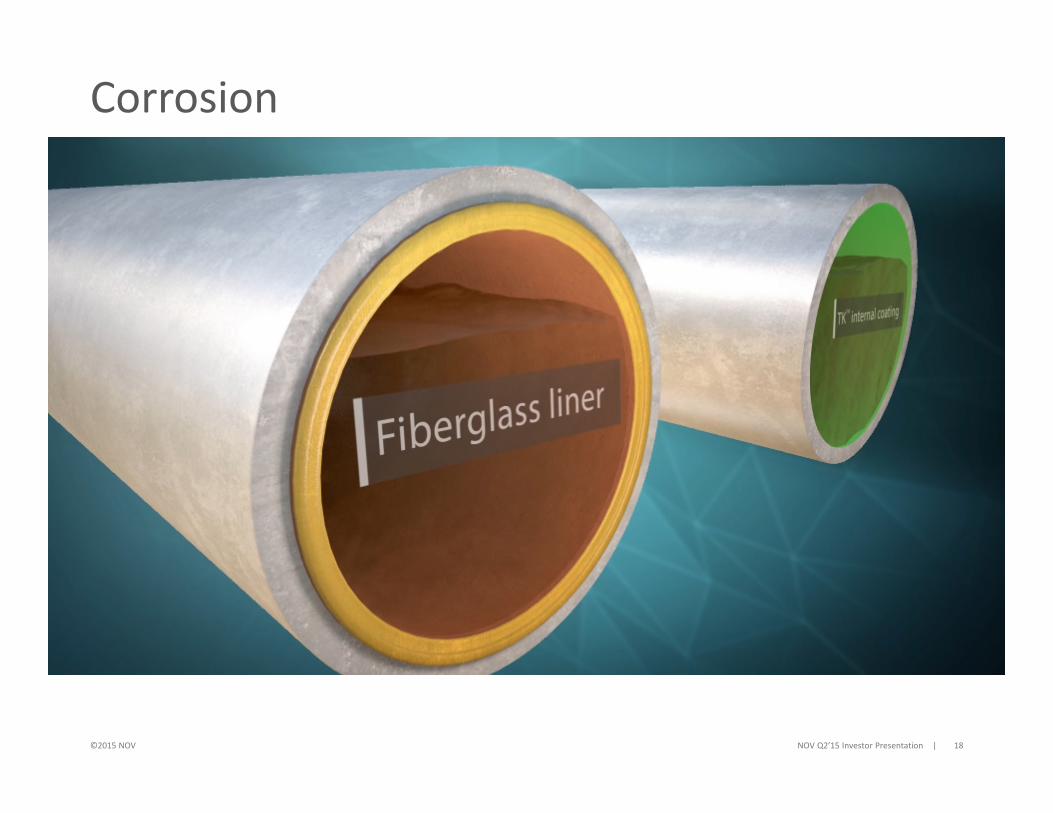
Corrosion
Waste management Hydraulic stimulation
©2015 NOV NOV Q2’15 Investor Presentation | 13
Equipment uptime
©2015 NOV NOV Q2’15 Investor Presentation | 14
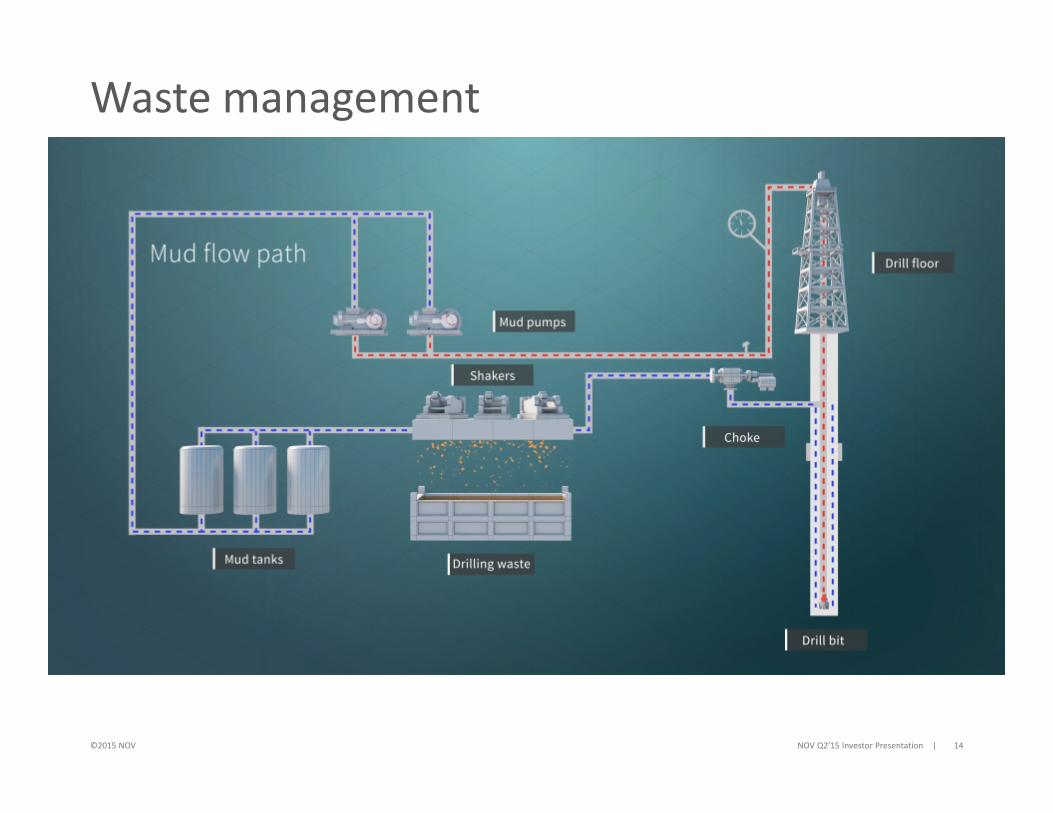
Waste management
©2015 NOV NOV Q2’15 Investor Presentation | 15
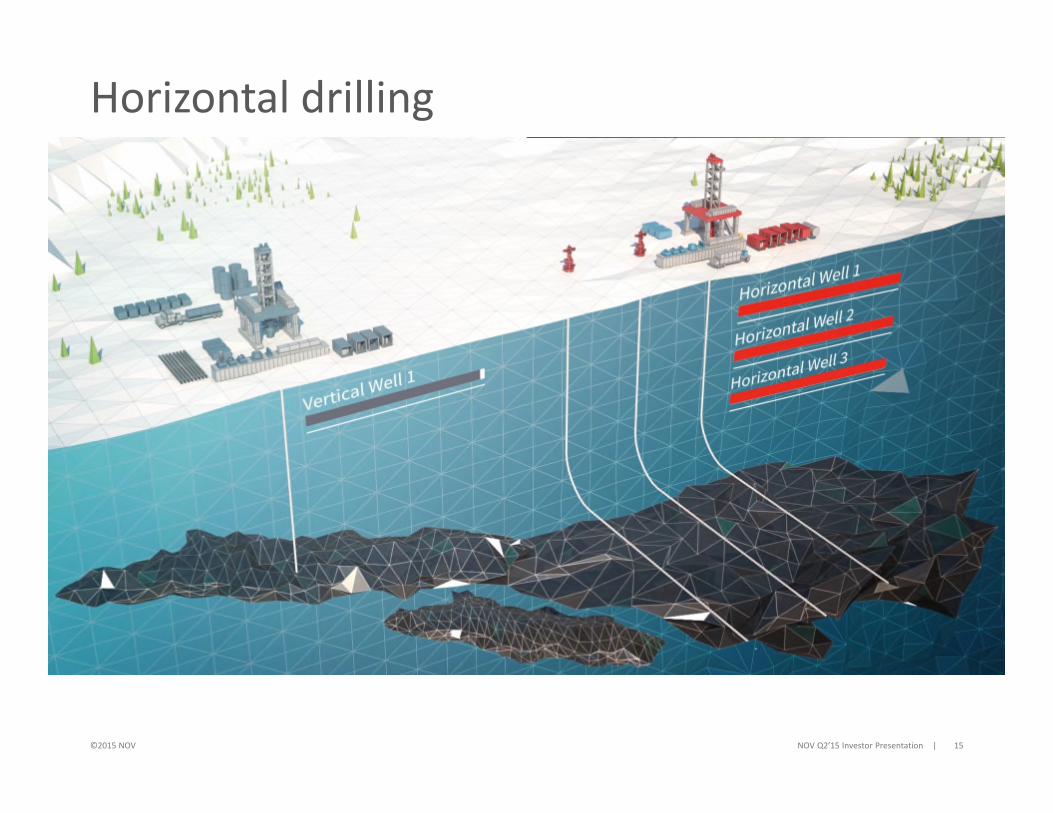
Horizontal drilling
©2015 NOV NOV Q2’15 Investor Presentation | 16
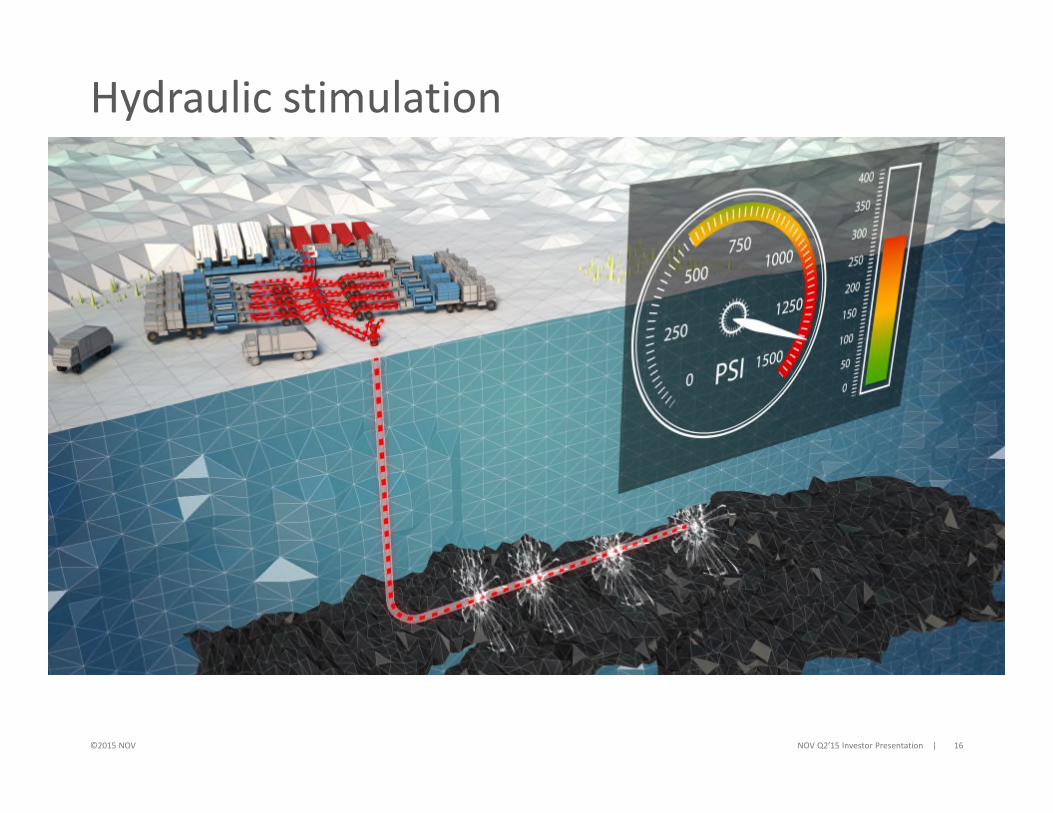
Hydraulic stimulation
©2015 NOV NOV Q2’15 Investor Presentation | 17
Safety
©2015 NOV NOV Q2’15 Investor Presentation | 18
Corrosion
©2015 NOV NOV Q2’15 Investor Presentation | 19
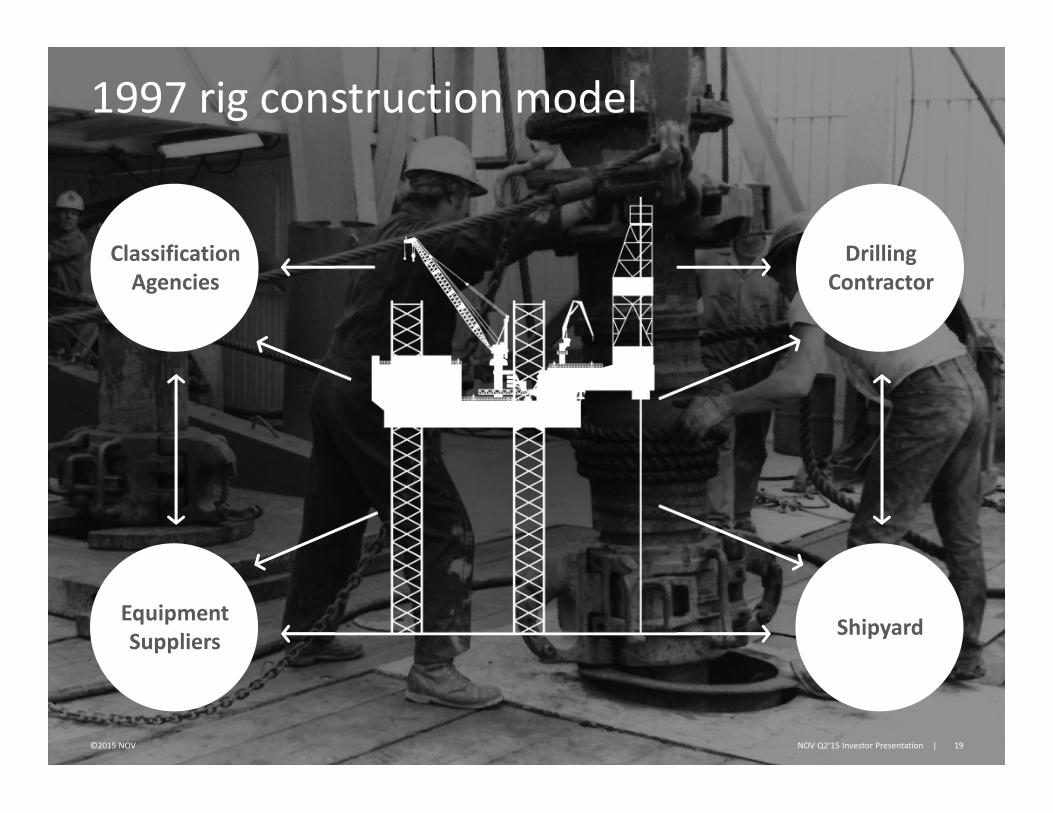
1997 rig construction model
ClassificationAgencies
EquipmentSuppliers
DrillingContractor
Shipyard
©2015 NOV NOV Q2’15 Investor Presentation | 20
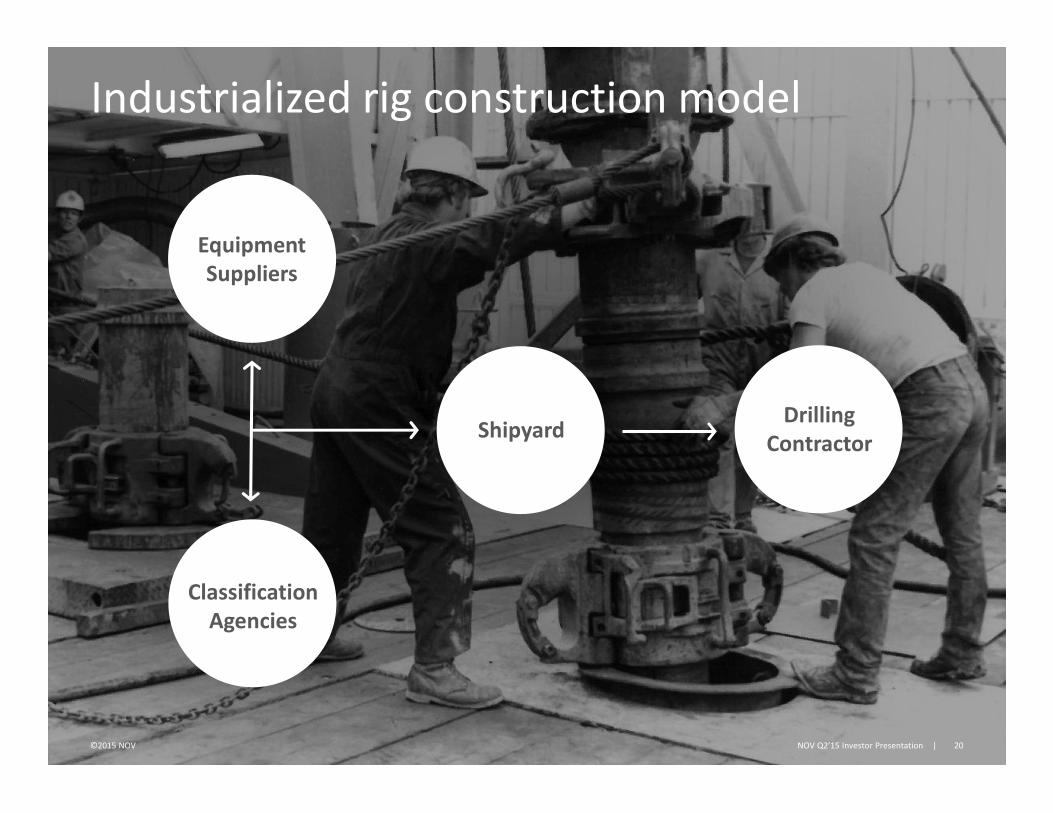
Industrialized rig construction model
EquipmentSuppliers
ShipyardDrilling
Contractor
ClassificationAgencies
©2015 NOV NOV Q2’15 Investor Presentation | 21
Complex FPSO build
21st century oil
4.5 MM bbl/DAY
©2015 NOV NOV Q2’15 Investor Presentation | 22
Unconventionals Deepwater
8.2 MM bbl/DAY
Source: “EIA International Energy Statistics, Rystad Energy, and NOV research”
©2015 NOV NOV Q2’15 Investor Presentation | 23
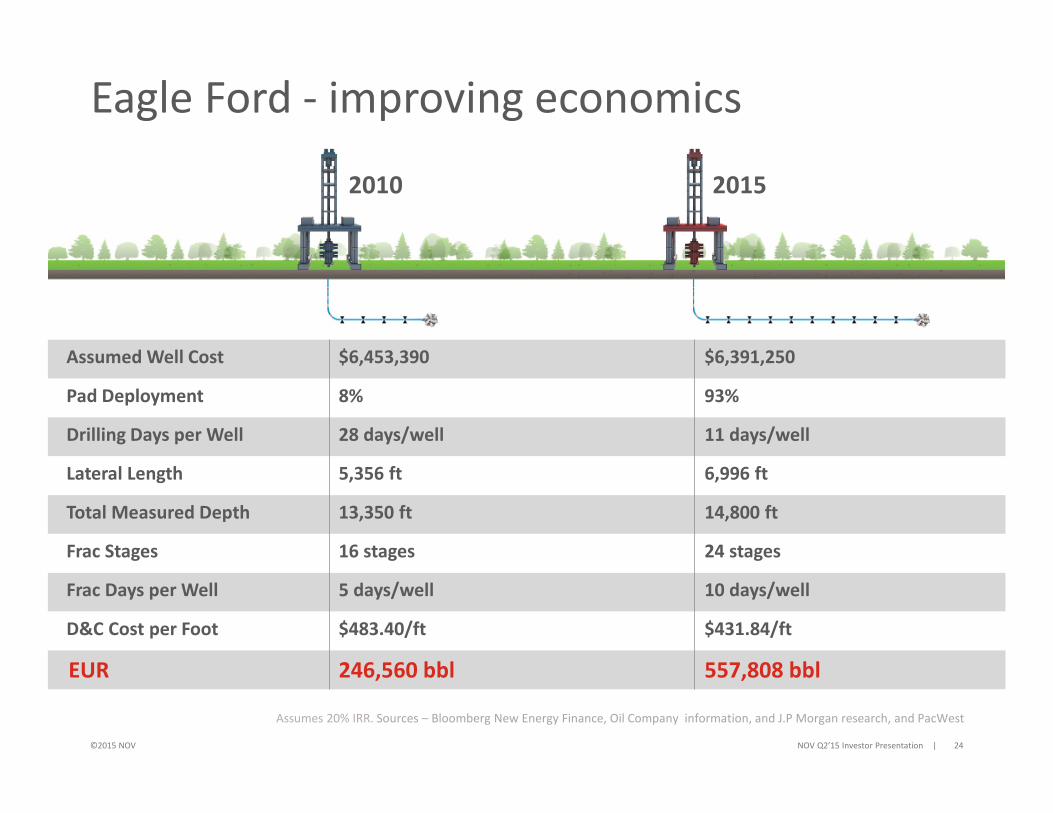
Assumed Well Cost $6,453,390 $6,391,250
Pad Deployment 8% 93%
Drilling Days per Well 28 days/well 11 days/well
Lateral Length 5,356 ft 6,996 ft
Total Measured Depth 13,350 ft 14,800 ft
Frac Stages 16 stages 24 stages
Frac Days per Well 5 days/well 10 days/well
D&C Cost per Foot $483.40/ft $431.84/ft
EUR 246,560 bbl 557,808 bbl
©2015 NOV NOV Q2’15 Investor Presentation | 24
Eagle Ford - improving economics
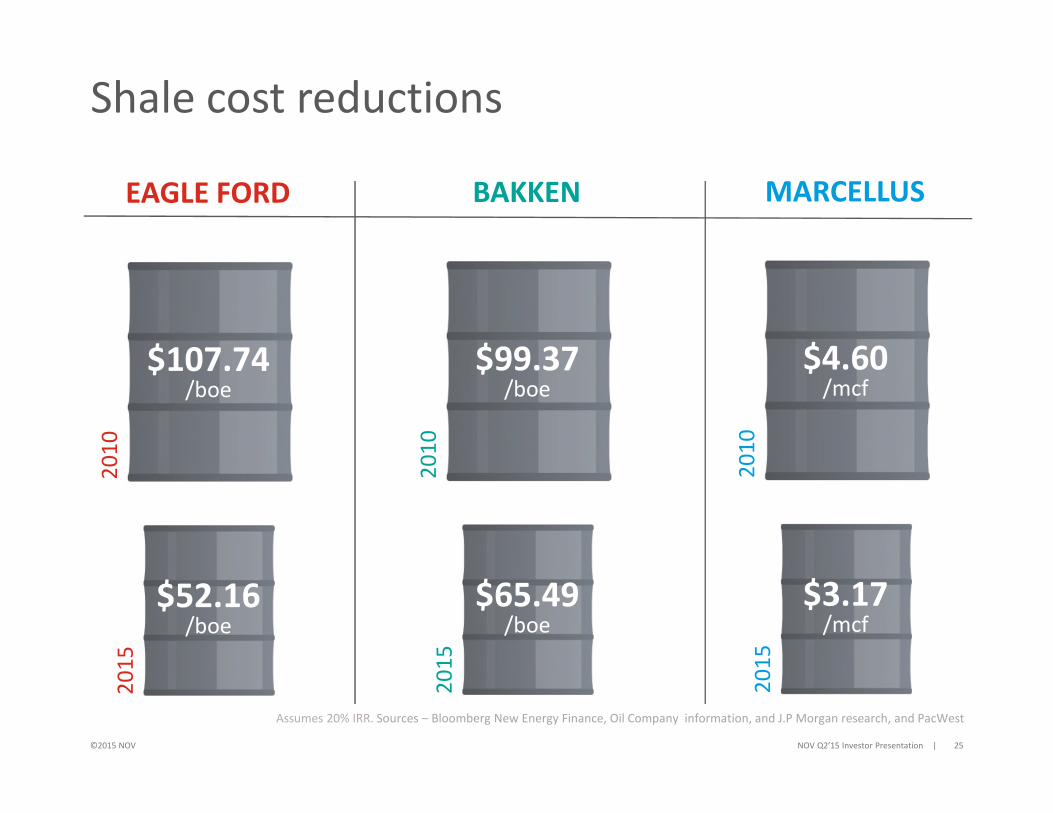
Assumes 20% IRR. Sources – Bloomberg New Energy Finance, Oil Company information, and J.P Morgan research, and PacWest
2010 2015
©2015 NOV
$107.74/boe
Shale cost reductions
NOV Q2’15 Investor Presentation | 25
EAGLE FORD
Assumes 20% IRR. Sources – Bloomberg New Energy Finance, Oil Company information, and J.P Morgan research, and PacWest
20
10
20
15
$52.16/boe
$99.37/boe
BAKKEN
20
10
20
15
$65.49/boe
$4.60/mcf
MARCELLUS
20
10
20
15
$3.17/mcf
21st century oil
©2015 NOV NOV Q2’15 Investor Presentation | 26
Unconventionals Deepwater
4.5 MM bbl/DAY 8.2 MM bbl/DAY
Source: “EIA International Energy Statistics, Rystad Energy, and NOV research”
©2015 NOV
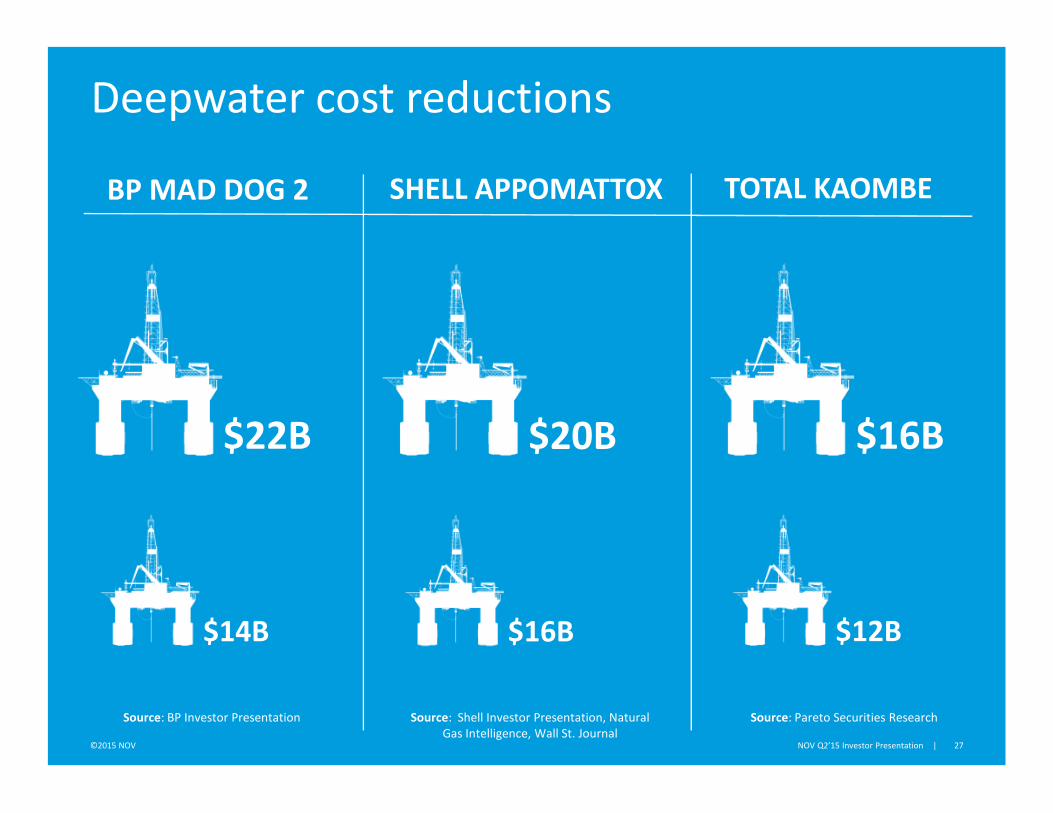
Deepwater cost reductions
NOV Q2’15 Investor Presentation | 27
BP MAD DOG 2
$14B
SHELL APPOMATTOX TOTAL KAOMBE
$22B
$16B
$20B
$12B
$16B
Source: Shell Investor Presentation, NaturalGas Intelligence, Wall St. Journal
Source: Pareto Securities ResearchSource: BP Investor Presentation
©2015 NOV NOV Q2’15 Investor Presentation | 28
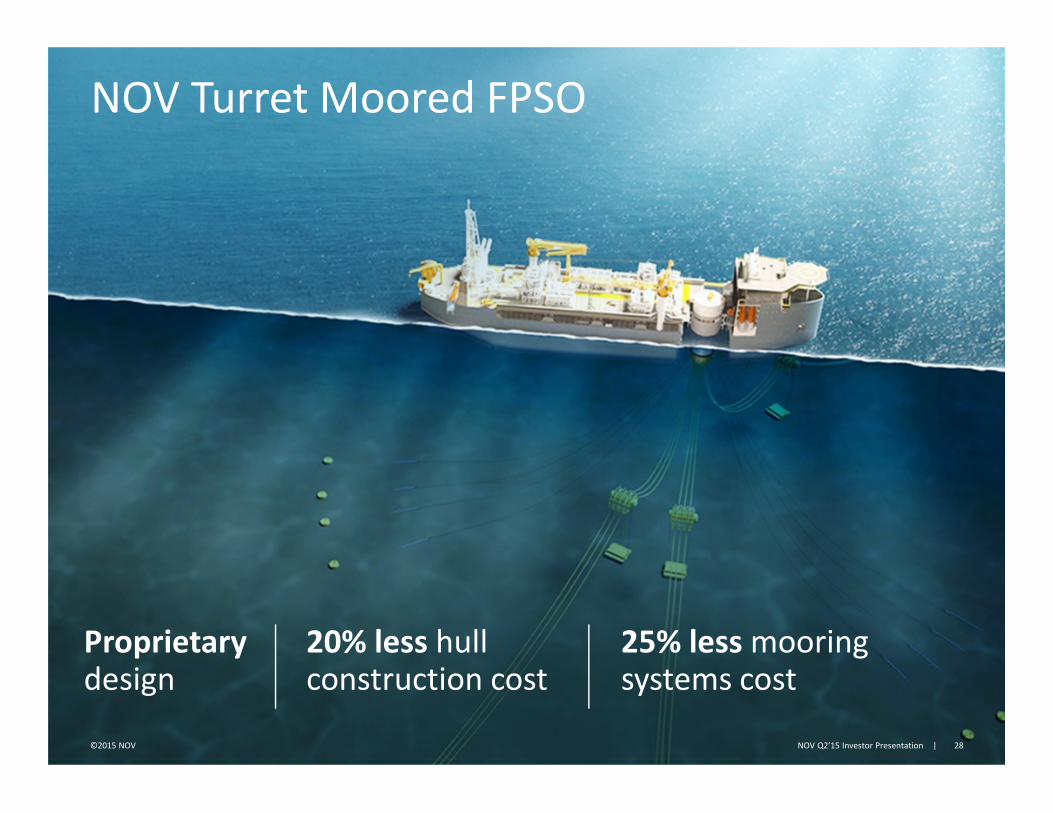
NOV Turret Moored FPSO
Proprietarydesign
20% less hullconstruction cost
25% less mooringsystems cost
Experienced leadership team
Full-cycle business model
Commitment to operational excellence
Acute focus on cost reduction and efficiency gains
Strong balance sheet enabling opportunistic capital allocation
= Stronger, more resilient, more dependable partner
Focus on what we can controlManaging NOV to market, reducing cost while advancing long-term strategy
29©2015 NOV NOV Q2’15 Investor Presentation |

National Oilwell Varco
30©2015 NOV NOV Q2’15 Investor Presentation |
Market leadership in all we do
Dependable partner in high-risk high-cost world
Sustainable competitive advantage
Attractive reinvestment opportunities
Entrepreneurial culture
The oilfield’s leading technology and equipment provider
We power the industrythat powers the world.
©2015 NOV NOV Q2’15 Investor Presentation | 31
©2015 NOV NOV Q2’15 Investor Presentation | 32