Embed Size (px)
Citation preview

National Open House Two-Lift Concrete Paving
October 15 – 16, 2008 Salina/Abilene, KS – Interstate 70

1
Introduction Construction of a two-lift pavement in the United States was the highest priority implementation recommendation of the team that participated in the Long-Life Concrete Pavement Scan conducted in May 2006. Working together, the Kansas Department of Transportation (KDOT), Koss Construction Company and the Federal Highway Administration (FHWA) have successfully fulfilled this objective. In June 2008, a pilot two-lift test section was constructed on a section line road near Pleasanton, Kansas; this was followed in September, 2008 by the construction of multiple two-lift sections on Interstate 70 in Saline County, Kansas (Figure 1).
Figure 1 Location of Two-Lift Pavement Construction 2008
The purpose of the pilot demonstration was to allow Koss Construction and KDOT to become comfortable with both the construction of a two-lift pavement and an exposed aggregate surface treatment before embarking on construction of a full scale section of I-70 in central Kansas. Lessons learned from construction of the pilot section included:
Width and alignment of the two pavers placing the two lifts requires special attention. While important for all slipform paving operations, consistent delivery of uniform concrete is
even more critical for the construction of two-lift pavements. Curing compound applied over the surface retardant appeared to interfere with the
effectiveness of sweeping operations for exposing the aggregate. Based on these observations, the following adjustments were made by Koss Construction for the I-70 two-lift sections:
The paver placing the bottom lift was set approximately 1” narrower than the paver for the top lift.
A central mix plant and end dump haul units were utilized for the batching, mixing and delivery of the top lift as opposed to the pilot project where a dry batch plant and transit mix trucks were used.
Initial curing was accomplished with polyethylene sheeting placed after the surface retardant instead of a liquid membrane curing compound.
Pleasanton Two-Lift Pilot Location
I-70 Full Scale Two-Lift Location

2
A comprehensive report of the two-lift pavements will be available in December, 2008; after all materials testing can be completed. The final report will be available for download from the National Concrete Pavement Technology Center’s web site at: http://www.cptechcenter.org/.

3
Typical Sections Figures 2 through 4 represent the existing typical section, as-built typical section and the as-designed typical section.
Figure 2 Existing Typical Section
Figure 3 As-Built Typical Section

4
Figure 4 As-Designed Typical Section

5
Layout of Test Sections Multiple two-lift sections were constructed on the eastbound lanes of I-70. The primary difference between these sections is the surface texture. A layout of the various surface textures constructed is shown in Figure 5.
Figure 5 Two-Lift Surface Texture Variables
6
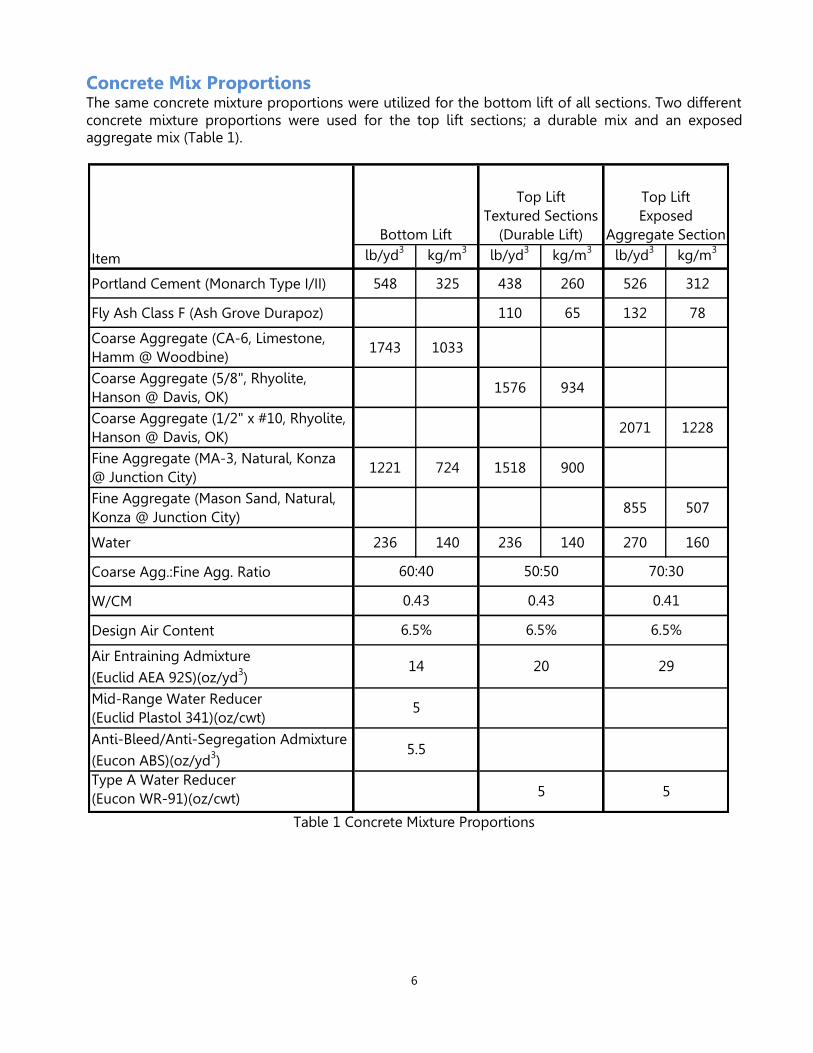
Concrete Mix Proportions The same concrete mixture proportions were utilized for the bottom lift of all sections. Two different concrete mixture proportions were used for the top lift sections; a durable mix and an exposed aggregate mix (Table 1).
Table 1 Concrete Mixture Proportions
lb/yd3 kg/m3 lb/yd3 kg/m3 lb/yd3 kg/m3
Portland Cement (Monarch Type I/II) 548 325 438 260 526 312
Fly Ash Class F (Ash Grove Durapoz) 110 65 132 78
Coarse Aggregate (CA-6, Limestone, Hamm @ Woodbine)
1743 1033
Coarse Aggregate (5/8", Rhyolite, Hanson @ Davis, OK)
1576 934
Coarse Aggregate (1/2" x #10, Rhyolite, Hanson @ Davis, OK)
2071 1228
Fine Aggregate (MA-3, Natural, Konza @ Junction City)
1221 724 1518 900
Fine Aggregate (Mason Sand, Natural, Konza @ Junction City)
855 507
Water 236 140 236 140 270 160
Coarse Agg.:Fine Agg. Ratio
W/CM
Design Air Content
Air Entraining Admixture (Euclid AEA 92S)(oz/yd3)Mid-Range Water Reducer (Euclid Plastol 341)(oz/cwt)Anti-Bleed/Anti-Segregation Admixture (Eucon ABS)(oz/yd3)Type A Water Reducer (Eucon WR-91)(oz/cwt)
Top Lift Exposed
Aggregate Section
6.5% 6.5% 6.5%
0.43 0.43 0.41
60:40
Item
20
Bottom Lift
Top Lift Textured Sections
(Durable Lift)
29
50:50 70:30
14
5
5 5
5.5

7
Combined Gradation of Concrete Mixtures (Figures 6 and 7):
Figure 6 Combined Percent Retained
Figure 7 Workability and Coarseness Factors
0%
5%
10%
15%
20%
25%
30%
35%
40%
45%
50%
2 ½
" 2"
1 ½
" 1" ¾"
½"
⅜"
#4 #8 #16
#30
#50
#100
#200
Perc
ent R
etai
ned
Sieve Size
I-70 2-Lift Project Combined Gradation Percent Retained
Bottom Lift - Average of Lots 28, 29 & 30 Durable Lift - Average of Stockpile Samples Exposed Aggregate Lift - Average of Stockpile Samples
20
25
30
35
40
45
0 10 20 30 40 50 60 70 80 90 100
Wor
kabi
lity
(per
cent
)
Coarseness Factor(percent)
I-70 2-Lift Project Workability Factors & Coarseness Factors
Bottom Lift - Average of Lots 28, 29 & 30
Durable Lift - Average of Stockpile Samples
Exposed Aggregate Lift - Average of Stockpile Samples
Well Graded 1 1/2" to 3/4
Well Graded
Minus 3/4"
Rocky
Sandy
Control Line

8
Fresh Concrete Properties Bottom Lift (Table 2 and Figures 8 through 13):
Table 2 Summary of Bottom Lift Fresh Concrete Test Results
Figure 8 Bottom Lift Pressure Air Content
Figure 9 Bottom Lift AVA Spacing Factor
air content
(%)slump
(in)
unit weight (lb/ft3)
concrete temp.
(°F)microwave
w/cm
ava spacing
factor (mm)
n 79 79 79 57 6 61minimum 4.2 0.5 134.1 65.7 0.44 0.180maximum 9.0 3.5 143.5 82.6 0.47 0.442
average 7.0 1.3 139.0 75.6 0.45 0.285standard deviation
0.9 0.5 1.7 3.4 0.01 0.062
4.0
5.0
6.0
7.0
8.0
9.0
10.0
20+500 21+500 22+500 23+500 24+500 25+500 26+500
air c
onte
nt (%
)
Roadway Sta.
Bottom LiftAir Content
air content average
0.150
0.200
0.250
0.300
0.350
0.400
0.450
20+500 21+500 22+500 23+500 24+500 25+500 26+500av
a sp
acin
g fa
ctor
(mm
)Roadway Sta.
Bottom Lift Spacing Factor
spacing factor average

9
Figure 10 Bottom Lift Unit Weight
Figure 12 Bottom Lift Unit Weight and Air Content
Figure 11 Bottom Lift Microwave W/CM
Figure 13 Bottom Lift Slump
132.0
134.0
136.0
138.0
140.0
142.0
144.0
20+500 21+500 22+500 23+500 24+500 25+500 26+500
unit
wei
ght
(lb/
ft3)
Roadway Sta.
Bottom Lift Unit Weight
unit weight average
4.0
5.0
6.0
7.0
8.0
9.0
10.0132.0
134.0
136.0
138.0
140.0
142.0
144.0
20+500 21+500 22+500 23+500 24+500 25+500 26+500
air c
onte
nt (%
)
unit
wei
ght
(lb/
ft3)
Roadway Sta.
Bottom Lift Unit Weight & Air Content
unit weight air content
0.43
0.44
0.45
0.46
0.47
0.48
20+500 21+500 22+500 23+500 24+500 25+500 26+500
mic
row
ave
w/c
m
Roadway Sta.
Bottom Lift Microwave W/CM
microwave w/cm average
0.0
0.5
1.0
1.5
2.0
2.5
3.0
3.5
4.0
20+500 21+500 22+500 23+500 24+500 25+500 26+500
slum
p (i
n)
Roadway Sta.
Bottom LiftSlump
slump average

10
Durable Lift (Table 3 and Figures 14 through 19):
Table 3 Summary of Durable Lift Fresh Concrete Test Results
Figure 14 Durable Lift Pressure Air Content
Figure 15 Durable Lift AVA Spacing Factor
air content
(%)slump
(in)
unit weight (lb/ft3)
concrete temp.
(°F)microwave
w/cm
ava spacing
factor (mm)
n 62 62 60 42 6 55minimum 5.4 0.5 136.7 65.1 0.41 0.137maximum 11.8 3.3 148.8 81.0 0.48 0.507
average 7.5 1.9 142.4 75.9 0.44 0.234standard deviation
1.4 0.7 2.4 3.8 0.03 0.079
4.0
5.0
6.0
7.0
8.0
9.0
10.0
11.0
12.0
20+500 21+500 22+500 23+500 24+500 25+500 26+500
air c
onte
nt (%
)
Roadway Sta.
Top Lift DurableAir Content
air content average
0.100
0.150
0.200
0.250
0.300
0.350
0.400
0.450
0.500
0.550
20+500 21+500 22+500 23+500 24+500 25+500 26+500
ava
spac
ing
fact
or (m
m)
Roadway Sta.
Top Lift DurableSpacing Factor
spacing factor average

11
Figure 16 Durable Lift Unit Weight
Figure 18 Durable Lift Unit Weight and Air Content
Figure 17 Durable Lift Microwave W/CM
Figure 19 Durable Lift Slump
136.0
138.0
140.0
142.0
144.0
146.0
148.0
150.0
20+500 21+500 22+500 23+500 24+500 25+500 26+500
unit
wei
ght
(lb/
ft3)
Roadway Sta.
Top Lift DurableUnit Weight
unit weight average
5.0
6.0
7.0
8.0
9.0
10.0
11.0
12.0136.0
138.0
140.0
142.0
144.0
146.0
148.0
150.0
20+500 21+500 22+500 23+500 24+500 25+500 26+500
air c
onte
nt (%
)
unit
wei
ght
(lb/
ft3)
Roadway Sta.
Top Lift Durable Unit Weight & Air Content
unit weight air content
0.40
0.41
0.42
0.43
0.44
0.45
0.46
0.47
0.48
0.49
20+500 21+500 22+500 23+500 24+500 25+500 26+500
mic
row
ave
w/c
m
Roadway Sta.
Top Lift DurableMicrowave W/CM
microwave w/cm average
0.0
0.5
1.0
1.5
2.0
2.5
3.0
3.5
20+500 21+500 22+500 23+500 24+500 25+500 26+500
slum
p (i
n)
Roadway Sta.
Top Lift DurableSlump
slump average
12
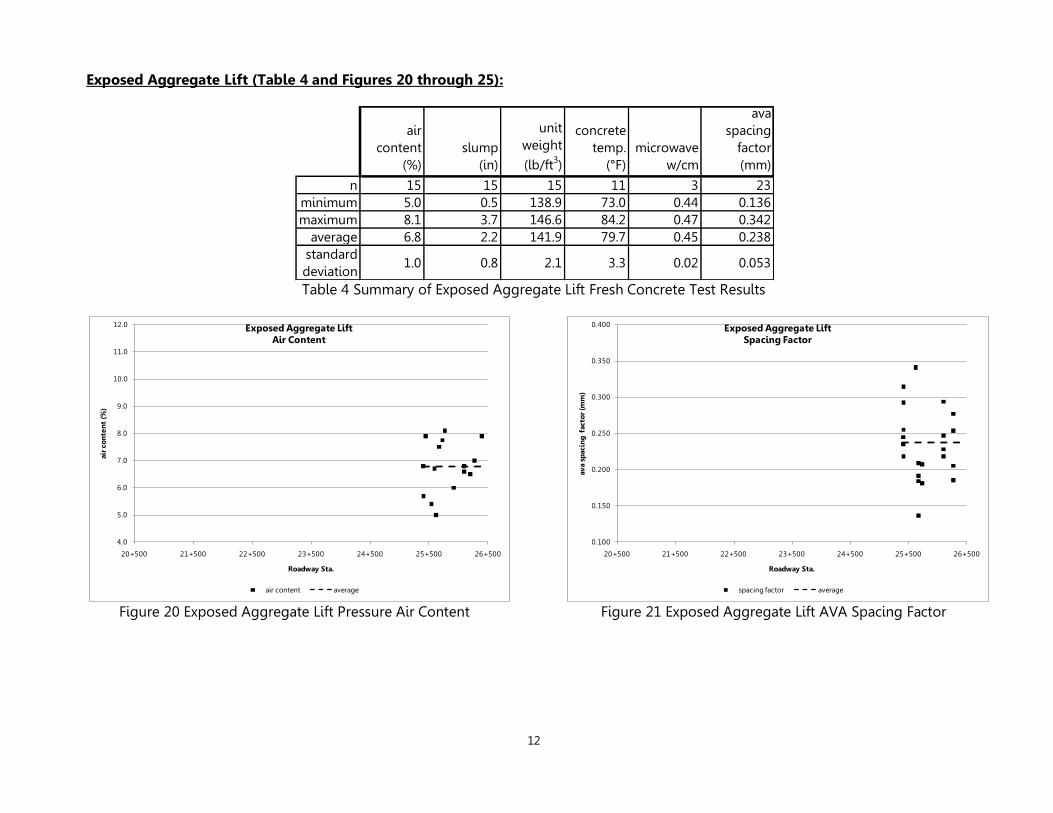
Exposed Aggregate Lift (Table 4 and Figures 20 through 25):
Table 4 Summary of Exposed Aggregate Lift Fresh Concrete Test Results
Figure 20 Exposed Aggregate Lift Pressure Air Content
Figure 21 Exposed Aggregate Lift AVA Spacing Factor
air content
(%)slump
(in)
unit weight (lb/ft3)
concrete temp.
(°F)microwave
w/cm
ava spacing
factor (mm)
n 15 15 15 11 3 23minimum 5.0 0.5 138.9 73.0 0.44 0.136maximum 8.1 3.7 146.6 84.2 0.47 0.342
average 6.8 2.2 141.9 79.7 0.45 0.238standard deviation
1.0 0.8 2.1 3.3 0.02 0.053
4.0
5.0
6.0
7.0
8.0
9.0
10.0
11.0
12.0
20+500 21+500 22+500 23+500 24+500 25+500 26+500
air c
onte
nt (%
)
Roadway Sta.
Exposed Aggregate Lift Air Content
air content average
0.100
0.150
0.200
0.250
0.300
0.350
0.400
20+500 21+500 22+500 23+500 24+500 25+500 26+500
ava
spac
ing
fact
or (m
m)
Roadway Sta.
Exposed Aggregate LiftSpacing Factor
spacing factor average

13
Figure 22 Exposed Aggregate Lift Unit Weight
Figure 24 Exposed Aggregate Lift Unit Weight and Air Content
Figure 23 Exposed Aggregate Lift Microwave W/CM
Figure 25 Exposed Aggregate Lift Slump
138.0
139.0
140.0
141.0
142.0
143.0
144.0
145.0
146.0
147.0
20+500 21+500 22+500 23+500 24+500 25+500 26+500
unit
wei
ght
(lb/
ft3)
Roadway Sta.
Exposed Aggregate Lift Unit Weight
unit weight average
0.0
1.0
2.0
3.0
4.0
5.0
6.0
7.0
8.0
9.0138.0
139.0
140.0
141.0
142.0
143.0
144.0
145.0
146.0
147.0
20+500 21+500 22+500 23+500 24+500 25+500 26+500
air c
onte
nt (%
)
unit
wei
ght
(lb/
ft3)
Roadway Sta.
Exposed Aggregate Lift Unit Weight & Air Content
unit weight air content
0.43
0.44
0.45
0.46
0.47
0.48
20+500 21+500 22+500 23+500 24+500 25+500 26+500
mic
row
ave
w/c
m
Roadway Sta.
Exposed Aggregate LiftMicrowave W/CM
microwave w/cm average
0.0
0.5
1.0
1.5
2.0
2.5
3.0
3.5
4.0
20+500 21+500 22+500 23+500 24+500 25+500 26+500
slum
p (i
n)
Roadway Sta.
Exposed Aggregate Lift Slump
slump average

14
Set Time, Heat Signature and Pavement Temperature: A series of tests was performed in an attempt to relate the time when sweeping for the exposed aggregate surface treatment commenced to the time of final set. The most widely used method for determining set time is penetration resistance of a mortar specimen (ASTM C 403) (Figure 26). Test results for the durable lift are included for information only.
Figure 26 Set Time Test Results (ASTM C 403)
240
240
300
300
360
360
420
420
480
480
100
1,000
10,000
100 1,000
Pene
trat
ion
Res
ista
nce
(psi
)
Elapsed Time (min)
KDOT I-70 2-Lift Set Time Testing (ASTM C 403)
bottom lift durable lift exposed lift
FS
ISInitial Set
Final Set
Final Set (hr): 5.5 8.0 5.5

15
Calorimeters were used to estimate set times using the fractions method (Figure 27).
Figure 27 Concrete Mixture Heat Signature Curves and Estimated Final Set Times (Fractions Method)
5.4
7.3
6.50
5
10
15
20
25
30
35
40
0 2 4 6 8 10 12 14 16 18 20
Te
mpe
ratu
re (º
F)
elapsed time (hr)
KDOT I-70 2-LiftCalorimetry
bottom lift 9-04, 20+796 durable lift, 20+752 exposed lift 9-19-08, 25+408 exposed lift, 25+627
estimated final set by fractions method

16
Temperature loggers placed in the pavement approximately one hour after paving show the relationship between estimated final set times in the field (fractions method) and when sweeping occurred (Figure 28).
Figure 28 Slab Temperatures, Estimated Final Set and Sweeping Window
3.3
4.0
0
5
10
15
20
25
30
35
40
0 2 4 6 8 10 12 14 16 18 20
Te
mpe
ratu
re (º
F)
elapsed time (hr)
KDOT I-70 2-LiftSlab Temperatures
bottom lift 9-19, 24+425 top lift 9-19, 24+425 bottom lift 9-19, 25+587 top lift 9-19, 25+587
bottom lift 9-19,25+862 top lift 9-19, 25+862 sweeping window
estimated final set window by fractions method

17
Hardened Concrete Properties At the time of printing for the open house, limited data from hardened concrete testing was available. All test data will be presented in the final report which will be available in December 2008. The following tests performed on cores or cylinders for each lift are scheduled:
Coefficient of Thermal Expansion (AASHTO TP 60) Permeable Voids (boil test) (ASTM C 642) Rapid Chloride Penetration (ASTM C 1202) Entrained Air Properties (ASTM C 457 by RapidAir apparatus) Modulus of Elasticity (ASTM C 469) Compressive Strength (ASTM C 39)
Pull-Off Testing (ACI 503-30): Bond strength between the top lift and bottom lift was tested in the field at approximately seven days after placement using a Dyna Z series pull-off tester. Average pull-off strength was 320 psi; a summary of test results is shown below (Table 5):
Table 5 Pull-Off Test Results
Date Time Sta.Distance Off EB Edge (ft)
Gauge Readout (N/mm2)
Diameter (mm)
Pull Off Strength
(psi) Comments
29-Sep-08 4:35 PM 21+283 1.00 0.830 48.00 130.62 epoxy break
29-Sep-08 4:40 PM 21+283 1.00 1.380 48.00 217.18 surface fail 1 mm
29-Sep-08 4:45 PM 21+283 1.00 2.220 48.00 349.38 surface fail 1 mm
29-Sep-08 4:50 PM 21+365 1.00 2.850 48.00 448.52 bottom fail 75 mm
29-Sep-08 4:55 PM 21+365 1.00 1.940 48.00 305.31 bottom fail 75 mm
29-Sep-08 5:00 PM 21+365 1.00 1.980 48.00 311.61 bottom fail 38 mm
29-Sep-08 5:15 PM 25+408 1.00 1.890 48.00 297.44 surface fail 4 mm
29-Sep-08 5:20 PM 25+408 1.00 1.960 48.00 308.46 surface fail 2 mm
29-Sep-08 5:25 PM 25+408 1.00 2.360 48.00 371.41 surface fail 4 mm
29-Sep-08 5:45 PM 25+627 1.00 1.990 48.00 313.18 surface fail 2 mm
29-Sep-08 5:50 PM 25+627 1.00 1.730 48.00 272.26 surface fail 3 mm
29-Sep-08 5:55 PM 25+627 1.00 2.140 48.00 336.79 bottom fail 75 mm
Kansas: I-70 2-Lift Pavement
Bond Strength - Pull Off Test Worksheet

18
Construction Process and Observations Construction of the pilot and I-70 two-lift pavements was accomplished with standard paving equipment and methods. Without a doubt, there were some details that required special attention by the contractor. The following items provide discussion of those details as well as an illustrated description of the two-lift paving process used on the I-70 project.
Logistics: Delivering the appropriate concrete mixture to the appropriate belt placer/spreader was a detail that needed to be addressed. Both concrete mixtures were batched and mixed at the same central mix concrete plant. Batch plant personnel would identify to the driver which mixture they were transporting through the use of a green card for the bottom lift or a red card for the top lift. Truck drivers then displayed a card of the appropriate color in the windshield of their truck. The belt placers/spreaders were identified with green and red paint as an additional safeguard against improper delivery of the two concrete mixtures. Paving Train: The paving train consisted of the following equipment (Figures 29 through 33):
Belt placer/spreader for the bottom lift. Slipform paver for the bottom lift. Paver width was set approximately 1” to 1½” narrower than
the second paver width. Belt placer/spreader for the top lift. This spreader was modified slightly with the addition of a
grid fabricated from square steel tubing that was placed under the discharge end of the belt to reduce the potential for deformation of the bottom lift while concrete was being unloaded from the belt on to the bottom lift.
Slipform paver for the top lift. Vibrators were raised above the elevation of the extrusion pan to avoid co-mingling of the two concrete mixtures during consolidation. Maintaining consistent horizontal alignment between the two pavers was also a detail that required extra attention. If the steering would drift slightly to one side or the other, edge problems were observed behind the second paver.
Burlap drag, astro-turf drag and cure/texture equipment and processes were identical to single lift paving procedures.

19
Figure 29 I-70 Two-Lift Paving Equipment Train
Belt placer/spreader for bottom lift
Belt placer/spreader for bottom lift
Slipform paver for bottom lift
Slipform paver for top lift

20
Figure 30 Bottom Lift Belt Placer/Spreader and Paver
Figure 32 Initial Burlap Drag Following Top Lift Paver
Figure 31 Top Lift Belt Placer/Spreader and Paver
Figure 33 Texture/Cure Machine Following Final Finishing
21
Paving Process: In general, the two-lift paving process was executed in the following sequence:
Batching, mixing and transporting – a dual drum central mix plant was used for batching and mixing both concrete mixtures. Concrete was transported in tractor-trailer end dumps and tandem axle dump trucks.
Start of day header – bottom lift was pulled out approximately 150’ and put on hold until the top lift header could be finished to the point where both lifts could be consistently placed in unison.
Spreading of bottom lift. Paving of bottom lift – centerline tie-bars were inserted in front of the bottom lift paver. Spreading of top lift. Paving of top lift – keyway was formed in the edges and bent tie-bars were inserted. Finishing – a burlap drag was attached to the float pan of the top lift paver. Normal finishing
procedures were used for the tined and astro-turf drag sections. Minimal finishing (primarily edging and transverse mop) was performed on the ground and exposed aggregate sections.
Final burlap drag attached to the texture cure machine. Curing compound applied by a texture/cure machine, except for the exposed aggregate
section which was sprayed with retarder and initially cured with polyethylene sheeting then final cured with curing compound after sweeping.
Exposed aggregate surface treatment section – sweeping was accomplished with two power brooms equipped with wire bristles. The initial broom was a front mounted sweeper and the second broom was a mid-mounted sweeper. Approximately 5 to 6 hours elapsed between the finishing operations and the start of the sweeping process.
Final curing for exposed aggregate section. Sawing – normal operations.
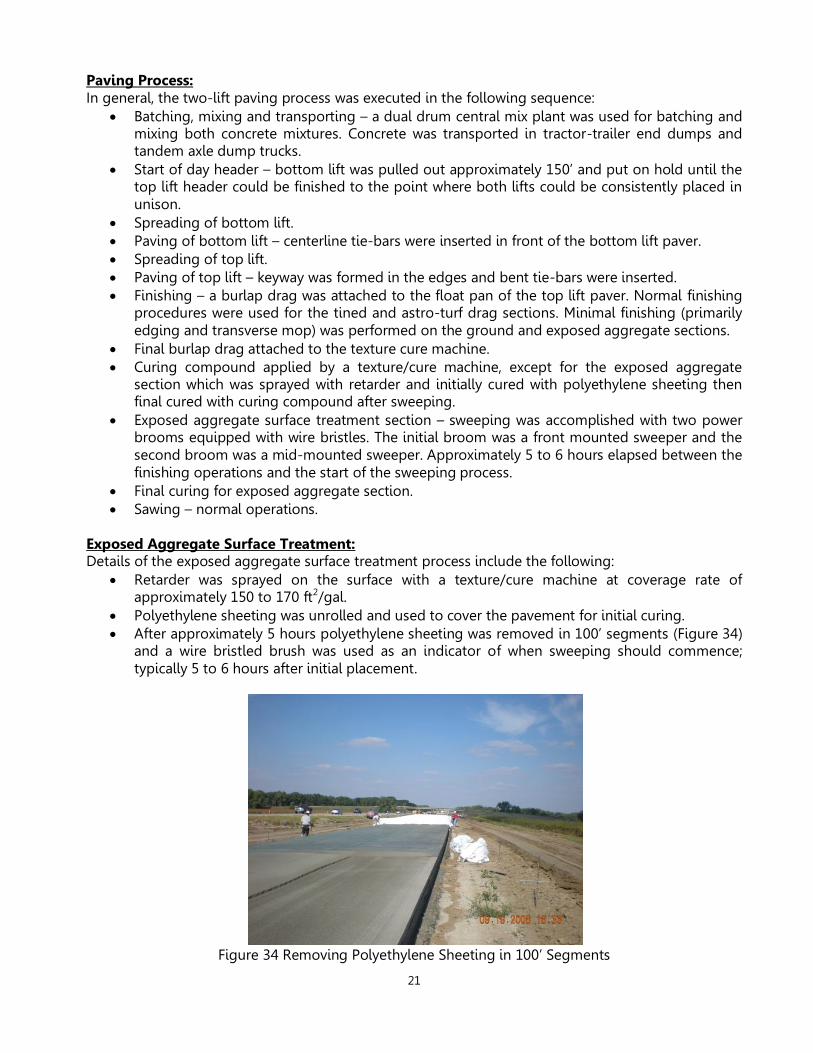
Exposed Aggregate Surface Treatment: Details of the exposed aggregate surface treatment process include the following:
Retarder was sprayed on the surface with a texture/cure machine at coverage rate of approximately 150 to 170 ft2/gal.
Polyethylene sheeting was unrolled and used to cover the pavement for initial curing. After approximately 5 hours polyethylene sheeting was removed in 100’ segments (Figure 34)
and a wire bristled brush was used as an indicator of when sweeping should commence; typically 5 to 6 hours after initial placement.
Figure 34 Removing Polyethylene Sheeting in 100’ Segments

22
Sweeping was accomplished in approximately 100’ segments with two power brooms (Figures 35 through 37).
Figure 35 Sweeping Operations
Figure 36 Nighttime Sweeping Operations
Figure 37 Exposed Aggregate Surface

23
Observations, Questions and Discussion: From an independent observer’s perspective, the construction of the two-lift pavement sections on I-70 was a success. Time will tell if the two-lift system as constructed on I-70 achieves the desired durability. Some of the items that should be addressed through continued monitoring of the I-70 pavement and future research activities include the following:
Additional admixtures were utilized to create a bottom lift that was very stiff, so that it would not deform when the top lift was placed. How stiff is stiff enough? Are alternative spreading methods available that would eliminate this requirement?
Is there a method for determining the minimum and/or optimum thickness of the top lift? What is the minimum thickness of top lift that can practically be constructed?
Deltas for labor and equipment costs between two-lift pavements and traditional single lift pavements need to be quantified to effectively determine if material and/or life-cycle costs can offset the cost deltas on a project specific basis.
Both concrete mixtures used for the top lift were susceptible to segregation. Further research should identify combinations of materials and pavement vibrator systems that will minimize the potential for segregation (decreased durability) yet still yield the desired surface characteristics.
Additional effort should be directed at refining the mixture proportions for both lifts with the ultimate goal of a durable and economical system; this includes reduced cementitious content, increased use of supplementary cementitious materials, identification of admixtures necessary for construction of two-lift pavements and incorporating recycled materials in the bottom lift when economically beneficial.
Modeling should be performed to characterize the relationship between varying coefficients of thermal expansion between the two lifts and the minimum bond strength required to overcome differential expansion and contraction between the two lifts.
Best practices should be developed for controlling the thickness of both lifts through superelevation transitions.

24
Summary of Surface Characteristics Sand patch tests of the astro-turf drag and exposed aggregate sections were performed by the CP Tech Center (Table 6). Comprehensive surface characteristic testing was performed by Transtec and will be available in the final report.
Table 6 Mean Texture Depth Test Results
Date Time Sta. Lane
Distance Off Edge (ft)
Volume of Glass Spheres
(mm3)
Mass of Glass
Spheres (g) d1 d2 d3 d4
Average Diameter
(mm)
Mean Texture Depth (mm)
11-Sep-08 12:00 PM 22+637 EB 5.00 24600 37.000 205 200 200 190 198.8 0.8
3.00 24600 37.000 210 255 215 180 215.0 0.7
6.67 24600 37.000 220 205 185 190 200.0 0.8
0.8
18-Sep-08 1:30 PM 23+140 EB 2.33 24600 37.000 180 170 155 160 166.3 1.1
4.50 24600 37.000 180 165 150 180 168.8 1.1
7.33 24600 37.000 170 170 165 165 167.5 1.1
10.50 24600 37.000 170 170 150 165 163.8 1.2
1.1
18-Sep-08 1:45 PM 23+172 EB 2.42 24600 37.000 180 165 160 150 163.8 1.2
4.58 24600 37.000 170 160 190 170 172.5 1.1
6.67 24600 37.000 150 135 150 135 142.5 1.5
8.17 24600 37.000 155 160 155 170 160.0 1.2
1.2
18-Sep-08 2:00 PM 23+215 EB 2.00 24600 37.000 195 225 205 205 207.5 0.7
3.33 24600 37.000 200 210 190 200 200.0 0.8
5.00 24600 37.000 195 165 165 150 168.8 1.1
6.50 24600 37.000 150 200 180 165 173.8 1.0
0.9
29-Sep-08 12:00 PM 25+408 1.00 24600 37.000 150 140 145 160 148.8 1.4
2.00 24600 37.000 140 140 130 140 137.5 1.7
4.00 24600 37.000 150 170 140 145 151.3 1.4
6.00 24600 37.000 150 145 140 160 148.8 1.4
1.5
29-Sep-08 12:10 PM 25+600 1.00 24600 37.000 220 240 210 210 220.0 0.6
2.00 24600 37.000 190 170 150 160 167.5 1.1
5.00 24600 37.000 185 170 175 190 180.0 1.0
8.00 24600 37.000 175 190 180 165 177.5 1.0
0.9
29-Sep-08 12:20 PM 25+627 2.00 24600 37.000 180 195 180 170 181.3 1.0
4.00 24600 37.000 155 140 130 150 143.8 1.5
5.00 24600 37.000 170 150 160 165 161.3 1.2
8.00 24600 37.000 160 165 170 157 163.0 1.2
1.2
Turf Drag
Turf Draf
Turf Drag
Average Mean Texture Depth
Kansas: I-70 2-Lift
Sand Patch Worksheet
Average Mean Texture Depth
Average Mean Texture Depth
Average Mean Texture Depth
Average Mean Texture Depth
Turf Drag
Exposed Aggregate
Average Mean Texture Depth
Exposed Aggregate
Average Mean Texture Depth
Exposed Aggregate