Embed Size (px)
Citation preview

NATIONAL OPEN UNIVERSITY OF NIGERIA
SCHOOL OF SCIENCE AND TECHNLOGY
COURSE CODE: NSS 241
COURSE TITLE: INTRODUCTION TO BIOSTATISTICS

COURSE GUIDE NSS 241
ii
NSS 241
INTRODUCTION TO BIOSTATISTICS
Course Developer Solomon S. Yissa JP National Open University of Nigeria Ilorin Study Centre. Course Writer Solomon S. Yissa JP National Open University of Nigeria Ilorin Study Centre. Programme Leader Prof. Afolabi Adebanjo National Open University of Nigeria Lagos. Course Co-ordinator Kayode S. Olubiyi National Open University of Nigeria Lagos. NATIONAL OPEN UNIVERSITY OF NIGERIA
COURSE GUIDE

COURSE GUIDE NSS 241
iii
National Open University of Nigeria Headquarters 14/16 Ahmadu Bello Way Victoria Island Lagos Abuja Office No. 5 Dar es Salaam Street Off Aminu Kano Crescent Wuse II, Abuja Nigeria e-mail: [email protected] URL: www.nou.edu.ng Published by: National Open University of Nigeria 2008 First Printed 2008 ISBN: 978-058-448-X All Rights Reserved
COURSE GUIDE NSS 241
iv
TABLE OF CONTENTS PAGE Introduction.............................................................................. 1- 2
What you will learn in this Course............................................ 2 Course Aims............................................................................... 3 Course Objectives...................................................................... 3 Working through this Course.................................................... 3 Course Materials........................................................................ 4 Study Units ............................................................................... 4- 5 Textbooks and References........................................................ 6
Assessment................................................................................ 6 Tutor Marked Assignments (TMAs) ....................................... 6 Summary …………………….................................................. 6 - 7

Introduction Statistics means different things to different people. To some, it is synonymous with Mathematics. In his inaugural lecture Oyejola (2006) said that Statistics i.e. (figures). A statistician is therefore a collector and compiler of data. However, to a Statistician it is the science of collecting, analyzing and interpreting numerical information. According to Torrie, Statistics is the science of creating, developing and applying techniques such that uncertainty of inductive inferences may be evaluated. The use of statistical methods allows one to put a level of confidence in to conclusions made from available data. Statistics therefore is a branch of mathematics which enable us to draw valid conclusion from available data.. It has a unique definition which is well known to almost everyone as he or she comes across its use in one way or the other. Biostatistics on the other hand is a branch of Statistics that pays more attention to Medicine and Human quality of life. Jolayemi (2005) In Medical and Health sciences very many measurements are taken which are aggregated to assess the individuals, positive or negative, state of health, healthy or sick requiring some kind of medical attention or not. Statistics is described as the key to technology. It is the language through which man reads the Universe. It is a language having numerical vocabulary, a mathematical grammar which has its own view of shaping individual’s view of the world. Summary of uses of Statistics: - to evaluate the existing conditions - to provide information that can be useful in formulating plan for
development programme - to measure progress. - to guide research. - for decision making and forecasting. As you read through this course you will learn that a lot of data are generated from experiments and practically all areas of human endeavour. For instance, results of political, economic and social surveys as well as increasing emphasis on drug and product testing are evidence of need for intelligent evaluation of data. Statistics has also been shown to be relevant to a wide range of subject areas including biology and agriculture (biometrics) medicine, health sciences and epidemiology (biostatistics) (the focus of this course) economics (econometrics) education and psychology (psychometrics) physical,

NSS 241 INTRODUCTION TO BIOSTATISTICS
ii
chemical and engineering sciences (technometrics) and business (quality control). Variability and dispersions are basic phenomena in statistics. You will learn that Statistics deal with a lot of measurements. And that variability is always present in measurements especially medical, biological and health sciences. This is because of the natural differences in the biological, social or even environmental makeup of individuals. No two people are exactly the same. Even identical twins have their differences. Two people subjected to the same experience would react differently. No two people have identical finger prints etc. Variability is even greater in biological measurements due to the ways in which the various genetic systems of inheritance act to maintain variability. This variation is usually referred to as natural or random variation. Examples include differences in the following: - Weights, heights or intelligence of identical twins. - Heights of plants of the same variety of a crop on the same heap. - Life length of electric bulbs from the same batch. You will also learn the Laws of probability in the course of this study. Probability as a statistical concept teaches you to gamble as it were. Descarets said that “when it is not in our power to determine what is true, we ought to follow what is most probable”. Probability is therefore the degree of possibility of an event. If the event is certain to happen it has a probability of 1, if it is impossible to happen then, it has probability of 0. The unit on the presentation of data introduces you to various ways through which data are displayed. This may be in graphic or non-graphic form. The aim is to have a precise and accurate demonstration of the data, summarized to simplify and draw attention to salient features. Common methods employed include numerical and graphic. You will learn different types of presentation of data under the two methods mentioned above. Sampling teaches you what sampling is all about and its uses in statistics. It is hoped that you will enjoy the section and appreciate the value of sampling in making inferences to large populations e.t.c. What You Will Learn in This Course This course guide tells you briefly what to expect from reading this material. The study of Statistics/Biostatistics will help you to understand and appreciate large volumes of facts and figures around us from different spheres of life endeavour and particularly in the area of your

NSS 241 INTRODUCTION TO BIOSTATISTICS
iii
professional work. Policy decisions on health services are greatly dependent on data and meaningful data for that matter. At every level of health management, you would need good knowledge of biostatistics. You need facts and figures to guide you in your planning process. This course will help you to know among other things how large numerical data can be summarized and made to provide desired information. Course Aims The course aims at providing good understanding and appreciation of the statistical processes and methods which are employed in making volume of available health data meaningful. Course Objectives In addition to the aims above, this course sets to achieve the following objectives. After going through this course learners should be able to: - define statistics generally, - state the meaning of Biostatistics and its application to health
planning and delivery services - describe statistical processes and methods, - describe statistical tools in common use, - identify and appreciate the variability of statistical attributes or
characteristics, - carry out statistical analysis of health data.
Working Thorough This course Although mere mention of statistics or biostatistics to some students connotes a kind of mathematics, you need not be scared. You are however expected to be focused and determined in the study of the units. This implies that you have to spend good time to study and understand the subject. This accounts for the great effort put into its development avoiding complicated areas and emphasizing simple and easy –to- understand areas. You are therefore strongly advised to avail yourself the opportunity of attending the tutorials where you would have the opportunity to work out exercises and share knowledge and experience with your colleagues.

NSS 241 INTRODUCTION TO BIOSTATISTICS
iv
The Course Material You will be provided with 1. Course guide and 2. Study units In addition the course comes with list of references and useful text books which though are not compulsory for you to acquire but are necessary as supplements to the course material and to further widen your horizon in the subject. Study Units The following are the Study Units contained in this course: Module 1 Unit 1 Definition of Statistics and Biostatistics. Unit 2 Scales of Measurements for Numerical Data. Unit 3 Frequency Distribution, Range and Application of
Biostatistics to Healthcare Delivery Services. Unit 4 Presentation of Data, Tables Graphs etc. Unit 5 The Law of probability or Learning to Gamble? Module 2 Unit 1 Sample and Sampling. Unit 2 Biostatistics in Health Planning Unit 3 Biostatistics in Health Planning Process Unit 4 Biostatistics and Planning of Health Institution Unit 5 Biostatistics and Health Manpower Planning. Module 3 Unit 1 History of Health development plans in Nigeria. Unit 2 Immunization statistic and Trend of diseases Unit 3 Management of Health Information (Statistics) Unit 4 Guinea Worm infection Statistics Module 1, first unit introduces you to the study of statistics generally. You are given the definition and led to how Biostatistics as an entity is derived. The main types of statistics are discussed as well as common terms encountered in the course of studying the subject, such as variables and their types, population, samples etc.

NSS 241 INTRODUCTION TO BIOSTATISTICS
v
The second unit introduces scales of measurement of numerical data which will help you to understand how data could be classified for easy and meaningful presentations. Scales as nominal, ordinal, interval and ratio are introduced in this unit. The unit also introduced common tools of statistical analyses such as mean, (Arithmetic mean) or average, median, mode and zigma sign Σ . In the third unit, the basic step in organizing data known as ‘ordered array’ is introduced. You learn about the need to arrange data according to their magnitude in ascending or descending order as the case may be. (i.e. from the lowest to the highest or vice versa). You will also learn about frequency distribution to help you understand how frequent certain variables occur in a given series. This unit also introduces the concept of range and practical application of Biostatistics to health care delivery. Unit five deals with the Laws of Probability or Game of Chance. When a Doctor says that a particular patient has 50-50 chance of surviving a particular surgery, what does he mean? You will learn about probability scale ranging from 0-------------------------1, if an event is likely to take place its probability is skewed towards 1 if not then it’s towards 0. Module 2, Unit 1 introduces the subject of Sample and Sampling. You are interested in a variable in the universe or the world. It is not possible to study the entire world. Therefore a good portion of it is selected for study in order to identify the attributes of the universe from that small portion called sample. Unit 2 deals with application of statistics to health care planning. Unit 3 introduces various steps in health planning process leading to the study of processes involved in the planning for the establishment of health institution which is the subject of unit nine. Unit 5 examines the application of statistics to health manpower planning stressing the importance of human resource which controls other factors of production. Module 3, Unit 1 introduces the history of health development plans in Nigeria within the framework of National Development plans. The unit highlights previous attempts pre- and post independence. Unit 2 introduces immunization statistics while Unit 3 takes us through management of Health information and Unit 4 applies statistics to Guinea Worm infection.
NSS 241 INTRODUCTION TO BIOSTATISTICS
vi
Text Books and Readings More recent editions of the following books and bulletins are recommended for further reading: Wayne W. Daniel (1974): Biostatistics: A Foundation for Analysis in
the Health Sciences New York. John Wiley & Sons, Inc., Ministry of Health: Annual Statistical Bulletin Nigerian Bulletin of Epidemiology. B.A. Oyejola (2006): Reasoning in the Realm of Uncertainty, Inaugural
Lecture, University of Ilorin, August. John Edward s et al, (1980) Manpower Planning, John Wiley & Sons. Hornby P. et al (1980) Guidelines for Health Manpower Planning, WHO
FMOH(1986) Handbook for the planning and managerial process.
Assessment There are self assessment exercises embedded in each course unit. Tutor marked assignments are presented at the end of each unit. There will also be the final end of course examination. Tutor Marked Assignment The TMA is the continuous assessment component of the course. It accounts for 40% of the total score. You will be given TMAs to answer. Three of these must be answered before you are allowed to sit for the end of course examination. The TMAs would be given to you by your facilitator and should be returned after you must have done the assignment. End of course Examination. This examination concluded the assessment for the course. It constitutes 60% of the whole course. You will be informed of the time for the examination. Summary This course intends to provide you with basic knowledge of Biostatistics in not too complicated form. But sufficient enough to help you appreciate the role and importance of Biostatistics in planning and management of health care services. By the time you are through with

NSS 241 INTRODUCTION TO BIOSTATISTICS
vii
this course, you should be able to answer the following types of questions: ● What is Statistics? ● What is Biostatistics? ● How many types of Statistics are commonly studied? ● How are data organized? ● What are vital statistics, variables, and samples? ● What are mean, median, mode and range? ● Describe ordered Array. ● What is nominal scale of measurement? ● Describe the role of statistics in health planning and
delivery of health care services. ● Presentation of data in tabular and graphic forms ● State the laws of probability and game of chance ● What is a Sample. How is it different from sampling ? ● Discuss the application of biostatistics in planning process ● Give a brief History of health development plans in
Nigeria. We wish you success in this course

NSS 241 INTRODUCTION TO BIOSTATISTICS
viii
Course Code NSS 241 Course Title Introduction to Biostatics Course Developer Solomon S. Yissa JP National Open University of Nigeria Ilorin Study Centre. Course Writer Solomon S. Yissa JP National Open University of Nigeria Ilorin Study Centre. Programme Leader Prof. Afolabi Adebanjo National Open University of Nigeria Lagos. Course Co-ordinator Kayode S. Olubiyi National Open University of Nigeria Lagos. NATIONAL OPEN UNIVERSITY OF NIGERIA

NSS 241 INTRODUCTION TO BIOSTATISTICS
ix
National Open University of Nigeria Headquarters 14/16 Ahmadu Bello Way Victoria Island Lagos Abuja Office No. 5 Dar es Salaam Street Off Aminu Kano Crescent Wuse II, Abuja Nigeria e-mail: [email protected] URL: www.nou.edu.ng Published by: National Open University of Nigeria 2008 First Printed 2008 ISBN: 978-058-448-X All Rights Reserved

NSS 241 INTRODUCTION TO BIOSTATISTICS
x
TABLE OF CONTENTS PAGE Module 1 ……………………………………………......... 1 Unit 1 Introduction to Biostatistics - Definitions ….… 1 - 5 Unit 2 Scale of Measurement for Numerical Data ….... 6 - 10 Unit 3 Frequency Distribution, Range and Application
of Biostatistics to Health Care Delivery……….. 11 - 16 Unit 4 Presentation of Data ……...…………………… 17 - 23 Unit 5 Laws of Probability or Teaching Yourself How
to Gamble …………………………………...… 24 - 29 Module 2 ………………………………………………....... 30 Unit 1 Sample and Sampling ………………..……...… 30 - 34 Unit 2 Biostatistics and Health Care Planning ……….. 35 - 39 Unit 3 Biostatistics in Health Planning Process ……… 40 - 48 Unit 4 Biostatistics and Planning of Health
Institution ……………………………………… 49 - 53 Unit 5 Biostatistics and Health Manpower Planning … 54 - 62 Module 3 ………………………………………………........... 63 Unit 1 History of Health Development Plans in
Nigeria ……………………………………………63- 68 Unit 2 Immunization Statistics and Trend of
Diseases………………………………………….. 69 - 75 Unit 3 Management of Health Information
(Statistics)………………………………………... 76 - 83 Unit 4 Guinea Worm infection Statistics……………….. 84 - 88

NSS 241 INTRODUCTION TO BIOSTATISTICS
1
MODULE 1 Unit 1 Introduction to Biostatistics - Definitions Unit 2 Scale of Measurement for Numerical Data Unit 3 Frequency Distribution, Range and Application of
Biostatistics to Health Care Delivery Unit 4 Presentation of Data Unit 5 Laws of Probability or Teaching Yourself How to Gamble UNIT 1 INTRODUCTION TO BIOSTATISTICS -
DEFINITIONS CONTENTS 1.0 Introduction 2.0 Objectives 3.0 Main Content
3.1 Types of statistics 3.2 Biostatistics 3.3 Common Terms
3.3.1 Vital Statistics 3.3.2 Statistical Methods 3.3.3 Variables 3.3.4 Common types of variables
3.3.4.1 Discrete variables 3.3.4.2 Continuous variables 3.3.4.3 Population 3.3.4.4 Sample
4.0 Conclusion 5.0 Summary 6.0 Tutor-Marked Assignment 7.0 References/Further Reading 1.0 INTRODUCTION Statistics is a field of study that means different thing to different people. To some it connotes mathematics, or arithmetic to others it has to do with figures or numbers that may not be easily comprehensible. There are still a few who perceive statistics as abstract subject and are scared on hearing the name mentioned. However statistics is part of us and has application in our daily activities. For instance how many people reside in your household especially in polygamous setting? How many are male and how many are females? How many are educated beyond secondary school level?

NSS 241 INTRODUCTION TO BIOSTATISTICS
2
Who is the oldest and who is the youngest? How many are below the age of five or above the age 50 etc? Your child comes back from school and you ask him how many are in his /her class. How many are females and how many are males? Who is the tallest and who is the shortest in the class e.t.c Answer to all the above questions will help you to make reasonable conclusion about the household and the class as the case may be. In all the observations therefore you are wittingly or unwittingly applying principles of statistics to some extent. Volumes of data and events surround us on daily basis. These have to be reduced to manageable size so as to guide us in taking rational as well as informed decisions. This unit will help you to find out what statistics and Biostatistics are all about.
Definition Statistics may be defined as a field of study which deals with the organization and summarization of data and drawing inferences about large volumes of data after a part of it is observed. In its modern setting, statistics refers to the science of collecting, analyzing, and presenting numerical data which are used in making decisions. It is also defined as an aspect or branch of mathematics that deals with collection, collation, analyzing, keeping and interpreting diverse facts or data. Statistical tools are used in many fields such as business, education, psychology, agriculture and economics just to mention a few. However when the data being analyzed come from biological sciences, medicine and health sciences, they are referred to as Biostatistics. The term is used to distinguish this application of statistical tools and concepts which is the concern of this course. 2.0 OBJECTIVES At the end of this unit, students should be able to: ● Define statistics and Biostatistics ● Identify two main types of statistics ● Identify sources and appreciate the value of health statistics ● Organize and analyse health statistics ● Understand basic concepts of statistics
3.0 MAIN CONTENT 3.1 Type of Statistics After studying the introductory part of this unit, you can now examine the two basic types of statistics. They are descriptive and inferential statistics. Descriptive statistics on the one hand is used to describe how

NSS 241 INTRODUCTION TO BIOSTATISTICS
3
things are and involves tabulating, use of tables, charts, graphs, modes and median in presenting data. Inferential statistics on the other hand enables us to make generalization and prediction about the whole population based on the sample chosen. 3.2 Biostatistics and Health Statistics In the course of this unit the two terms will be used interchangeably from time to time. You have learnt earlier that the application of science of statistics to solve various health problems is referred to as Biostatistics. The subject therefore helps you to collect, collate, organize, analyze, summarize and interpret and present health data in a meaningful way so as to make inferences and predictions on morbidity, mortality and endemic trends of certain diseases. Knowledge of health statistics helps us to read and understand health reports, and literature often presented in tables and graphs thereby facilitating inductive reasoning. Facts and figures are usually presented in a definite form simplifying some otherwise large mass of data. SELF-ASSESSMENT EXERCISE Distinguish between Statistics and Biostatistics. 3.3 Common Terms There are terms /words that you will come across frequently in the course of this study. We shall examine some of them.
3.3.1 Vital Statistics Records of deaths, births and other vital information /data 3.3.2 Statistical Methods Methods of computation and analysis of numerical data are meant to serve two purposes as earlier mentioned i.e. (1) summarization and presentation of data and (II) inference
3.3.3 Variables This is derived from variation in living and non-living things. When a characteristic feature is observed, one would find that it takes on different values in different persons, places or things, such attribute is called a variable e.g. heights of adult males, the height of pre-school children, ages of patients seen in a dental clinic, weight of pregnant women etc.

NSS 241 INTRODUCTION TO BIOSTATISTICS
4
3.3.4 Common Types of Variables 3.3.4.1 Discrete Variables These are those variables that assume whole numbers such as 0,1,2,3, 4 but not 2.6 or 3.415etc e.g.: ● the number of seeds in a pod ● the number of students in a class ● the number of children in a family 3.3.4.2 Continuous Variables These are those variables that can assume values other than whole numbers e.g. the height of an individual: - The weight of a motor car - The age of an individual - The weight of an individual which can be 127 kg, 128.2kg etc.
3.3.4.3 Population
The average person thinks of population as a collection of entities usually people. A population or collection of entities may however be animals, machines, plants and cells or even patients. For our purposes, we define a population entity as the largest collection of entities for which we have interest at a particular time. In statistics therefore, our sphere of interest determines or defines population. For instance, if our variable of interest is in the primary school pupils then there lies our population.
3.3.4.4 Sample This is defined as a part of a population. As we mentioned earlier under population, if we are interested in the weights of all primary school children in a local government area, we collect for analysis the weights of a fraction of the children which is only a part of our population of weights that is we have a sample. Note that different kinds of samples can be selected from a population 4.0 CONCLUSION
We have explained that statistics is a field of study concerned with systematic collection of numerical data analyzed and presented in a meaningful manner. Large volumes of data are summarized in the

NSS 241 INTRODUCTION TO BIOSTATISTICS
5
exercise to describe situation as they are and facilitate inferential decisions. When data colleted emanated from biological, medical and health sciences the term biostatistics is employed. Common terms encountered in the course of studying statistics such as variables, statistical tools, samples and population were also highlighted. 5.0 SUMMARY In this unit, you learnt what statistics and Biostatistics are all about. The two main types of statistics descriptive and inferential are discussed. You also learnt to appreciate the value of statistics in our everyday life particularly in the field of health care services. A few common terms are highlighted - such as vital statistics, variables etc.
ANSWER TO SELF ASSESSMENT EXERCISE Statistics is the study of systematic collection, collation, organization, analyzing and presentation of numerical data in a meaningful manner. When the data and figures emanate from biological, medical and health or epidemiological sciences, the term Biostatistics is used.
6.0 TUTOR- MARKED ASSIGNMENT 1. Write brief notes on the following
(a) Discrete variable (b) Population (c) Sample
2. List four examples of continuous variable 7.0 REFERENCES/FURTHER READINGS
Wayne W. Daniel, (1974) BIOSTATISTICS: A Foundation for Analysis
in the Health Sciences New York. John Wiley and Sons Inc Landu V.B (2003) Basic Statistic in Education, Ilorin, Northadex
Publishers
Lucas A.O (1970) Biostatistics - unpublished, Mimeograph University of Ibadan, Ibadan.

NSS 241 INTRODUCTION TO BIOSTATISTICS
6
UNIT 2 SCALE OF MEASUREMENT FOR NUMERICAL DATA
CONTENTS 1.0 Introduction 2.0 Objectives 3.0 Main content
3.1 Nominal scale 3.2 Ordinal scale (/ranking) 3.3 The interval scale 3.4 Ratio scale 3.5 Analysis of numerical Data 3.6 Average or arithmetic mean 3.7 Median 3.8 Mode 3.9 Zigma sign, Σ
4.0 Conclusion 5.0 Summary 6.0 Tutor-Marked Assignment 7.0 References/Further Readings 1.0 INTRODUCTION In unit I you learnt that statistics was described as systematic collection and analysis of numerical data and that numerical data involve some measurement. The study of statistics in this course and allied disciplines provide knowledge and understanding of interplay of activities in different people and things at different places and circumstances. Take for instance weights of 20 babies from two different hospitals will provide variation in data collected etc. In this unit, you will learn about scales of measurement.
2.0 OBJECTIVES At the end of this unit students will know: ● What scales of measurement are and their uses in statistics ● How to compute mean, median and mode from sets of data.

NSS 241 INTRODUCTION TO BIOSTATISTICS
7
3.0 MAIN CONTENT We are going to consider four scales of measurement with illustrations 3.1 Nominal Scale Here the variables are classified into mutually exclusive categories or differentiated according to their qualities, colour etc for example - Coloured balls in a basket (i) Red (ii) Blue (iii) Black (iv) Green
(v) other Colours - Still birth – life birth, premature, birth, full term, died, recovered. - Population of a community (i) Partially Blind (ii) normal
3.2 Ordinal or Ranking Scale
Here the variables are ordered according to a scale that shows the relationship between them and their greatness. e.g. (a) Major – sergeant – Corporal -Private (b) 1st class – 2nd class –3rd class –pass – fail (c) Tall - medium – short 3.3 The Interval Scale
This is characterized by a common and constant unit of measurement e.g (a) Temperature (i) Degrees Fahrenheit 200F, 300F, 400F (ii) Degrees centigrade 1 234 oC (b) Length (i) Inches (ii) Centimetres Note: the zero point is arbitrarily defined 3.4 The Ratio Scale This is similar to the interval scale but in addition there is a meaningful zero e.g. (a) mass or weight – (i) pounds (ii) grams –identical zero point ( of
temperature) (b) mortality (i) percent (ii) per 1000.

NSS 241 INTRODUCTION TO BIOSTATISTICS
8
SELF ASSESSMENT EXERCISE 1 i. Give example of 5 variables that you have measured in
physiology. ii. Describe nominal scale of measurement. 3.5 Analysis of Numerical Data In statistics, due to the use of many variables some numbers are often represented by alphabets e.g X.Y.Z. For instance in a class of seven students s-X represents the variable for students and therefore 7654321 can be written as x1 –x7 referring to the first student etc x1, x2, x3 –x7
3.6 Average or Arithmetic Mean This is a common method of analyzing data. It is obtained by adding all the quantities and dividing by the number of quantities. To find the mean of the data above is written as with bar on top therefore the average or mean is computed as follows. X= x1 –x7 = 28 =4 i.e. the addition of all the x –values. 7 the number of x’s An average is a value which is typical or representative of a set of data. Such value tends to lie centrally within a set of data arranged according to magnitude and therefore averages are also said to measure the central tendency. 3.7 Median
If a set of numbers is arranged in order of magnitude (i.e. in an ordered array) the median is the middle value (odd number of items) or the arithmetic mean of the two middle values (even number of items). Note that when a series is arranged in the order of magnitude the position of the median is such that the number of items below it is equal to the number of items above it. SELF ASSESSMENT QUESTION 2 What is the median of the following numbers? (a) 8, 5, 10, 6, 4 = 4, 5 (6) 8, 10 (b) 8, 5, 10, 6, 4, 19 = 4, 5 (6 8) 10 19

NSS 241 INTRODUCTION TO BIOSTATISTICS
9
3.8 Mode This is the most popular number in the set. It is the highest occurring frequency e.g. 2, 3, 4,6,8,9, 6, 1,2,3,5,7,8,6. Here the number 6 occurs more frequently than any others, so 6 is mode 3.9 Zigma Sign Σ
In statistics also large numbers for addition are not written in long arena as earlier indicated under 3.7, hence the use of Zigma sign Σ which means adding up all the numbers over the total number of variable i.e. Σx n 4.0 CONCLUSION
Summarization is a product of statistical analysis. In the course of computation however it is necessary to assign some kind of description to concepts or events. This process is called measurement. The four basic ways of nominal, ordinal, Interval and ratio scales have been briefly discussed. The methods of Mean, Median and mode as tools for analysis of numerical data were also discussed in the unit.
5.0 SUMMARY.
In this unit you learnt about four basic scales of measurement used in statistics. These are nominal, ordinal, Interval and ratio scales. You also learnt about the concepts of average or arithmetic mean, median, mode and zigma sign employed in the analysis of numerical data. ANSWER TO SELF ASSESSMENT EXERCISE 1
Example of 5 variables measured in physiology. - Haemoglobin % - Life span of red blood cells. - Pulse rate of an elderly woman. - Blood pressure of an adult man. - Normal body temperature of a child. 2. Nominal scale of measurement.
It is a measurement whereby variables are classified into mutually exclusive categories e.g. colour: blue, green, yellow etc or status such as still birth, premature and full term or characteristics or population such as blind, poor etc

NSS 241 INTRODUCTION TO BIOSTATISTICS
10
ANSWER TO SELF ASSESSMENT EXERCISE 2 Median is the number that appears at the middle of the set when arranged in ascending or descending order. Procedure (a) - Arrange the set in order of magnitude - Select the middle figure - The median is ----------
Procedure (b) - Arrange the set in order of magnitude - Find the mean of the two middle values - Median is-------- a) 4, 5, (6), 8, 10 Answer = 6 b) 4, 5, 6, 8, 10, 19 median 8 + 6 = 7 2 6.0 TUTOR-MARKED ASSIGNMENT In the final examination for Bachelor of nursing Science 25 candidates scored the following marks:-
87 32 55 69 84 65 67 42 11 76 29 39 46 62 70 60 47 43 61 92 54 43 54 78 64 1. List the candidates in order of the marks which they obtained
from the highest to the lowest, giving their position in the class. 2. If 45 is regarded as the pass mark how many students passed and
how many students failed? 3. The results as given in (b) are in the ………………………. scale
of measurement. 7.0 REFERENCES/FURTHER READINGS Oyejola B.A (2006) Reasoning in the Realm of Uncertainty. The 80th
inaugural lecture University of Ilorin Aug, 31, Wayne W. Daniel (1974) Biostatistics: A Foundation for Analysis in the
Health Sciences. New York John Wiley and Sons.

NSS 241 INTRODUCTION TO BIOSTATISTICS
11
UNIT 3 FREQUENCY DISTRIBUTION, RANGE AND APPLICATION OF BIOSTATISTICS TO HEALTH CARE DELIVERY
CONTENTS 1.0 Introduction 2.0 Objectives 3.0 Main Content
3.1 Ordered Array 3.2 Frequency Distribution 3.3 The Range 3.4 Uses of Statistics
4.0 Conclusion 5.0 Summary 6.0 Tutor-Marked Assignment 7.0 References/Further Readings. 1.0 INTRODUCTION In unit 2 we studied the concepts of average or arithmetic mean, median mode etc. In this unit we shall study ordered array of data frequency distribution, range and do some reading comprehension as it applies to Biostatistics in order to help our understanding of why we study the subject Biostatistics.
2.0 OBJECTIVES At the end of this unit learners will be able to: ● Describe frequency distribution and range in statistics ● Identify data generating areas in health care system. ● Appreciate values of information derived from health statistics 3.0 MAIN CONTENT 3.1 Ordered Array When measurements of variables are taken the resulting values usually come as a mass of unordered data. Unless in a few observed cases, it will be unlikely to impart much information until they have been put in some kind of order. If the number of observations is large the first step is to organize the data in an ordered array. This involves listing of the values of collection in order of magnitude from the smallest value to the largest value or vice versa. This exercise in the past required manual

NSS 241 INTRODUCTION TO BIOSTATISTICS
12
labour and the use of calculators and time consuming exercise, but today with the advent of computer it is much faster. 3.2 Frequency Distribution This is one way of organizing data for analysis by grouping them into convenient classes. It shows the distribution pattern of variables under investigation by showing the number of times (frequency) a particular variable occurs. The frequency table often shows the data in a meaningful manner. For example fifty Biology students were asked how often they attended the staff clinic during the last year. They gave the following responses: 2 3 1 2 2 1 4 1 2 0 4 3 2 3 5 1 2 2 3 2 2 3 1 6 1 2 4 3 1 1 2 2 3 3 5 2 3 3 2 5 2 1 4 0 2 5 4 1 2 0 For convenience we must group the data by classes. The number of attendance range from 0-6. We can set up classes 0,1,2,3,4,5,6, and find out the number of individuals belonging to each class i.e. the class frequency. This tabular arrangement of the data by classes together with the corresponding class frequencies is called a frequency distribution or a frequency table. SELF ASSESSMENT EXERCISE i. Construct a table showing the frequency distribution of data at
3.2 above. Group the data by classes. The attendance ranged from 0-6 therefore set up classes 0 1 3 4 5 6 and find out the number of individuals belonging to each class.
ii. Present the data in an ordered array. 3.3 The Range One way to measure the variation in a set of values is to compute the range. The range is the difference between the smallest and largest value in a set of observations. For example a set of scores with the highest being 65 and lowest 35 – Range will be 65- 35 = 30.

NSS 241 INTRODUCTION TO BIOSTATISTICS
13
3.4 Uses of Statistics The day to day policy formulation and implementation of health services require numerous choices among alternative courses of action. Choices may be in different broad contexts. Firstly it had to be decided what particular course of action is best for a particular patient or client. Secondly, it has to be decided what course of action is best in the planning of health care services for a whole community or various groups of people and thirdly it has to be decided the accessibility, acceptability and affordability of such services to the entire population of the state or nation. In view of the afore mentioned facts there is the need for a systematic way of learning from experience and using the lessons learned to improve the current healthcare activities and promote better planning of health care delivery by careful selection of activities for future actions. Thus the purpose of this kind of bulletin is to guide in the evaluation of health services in terms of programmes, service delivery, and allocation of human and financial resources. There is no doubt that the use of statistical information would minimize the current wastage and ensure optimal utilization of scarce resources. It is hoped that most ministries and health departments/agencies in the country would find it highly necessary to build up/strengthen a health statistics unit in their respective states with appropriate human, financial and material backing. This bulletin contains among other things the following information. (a) Projected population for the state per local government and sex (b) Number of health institutions, Location and Bed capacity (c) Health manpower, different categories (d) Activities of government Health Institutions (e) Primary healthcare services in the state wish to appeal to all the
Health officers both the state and local government level as well as Private Health institutions to render statistical returns regularly to the ministry. Without adequate and regular rendition the effective healthcare planning will be difficult if not impossible.

NSS 241 INTRODUCTION TO BIOSTATISTICS
14
Observations, Summary and Conclusion The ultimate objectives of introducing statistics in the planning of healthcare services was to ensure that the outcome of planning in terms of services provided is commensurate with the needs of the population and be able to evaluate the extent to which such objectives have been met. Looking at the population of the state from this bulletin by age group it shows that 16.21 percent of the total population falls under the age of 4 years. Those who are in economic (active) age are about 53.37 percent and the remaining 30.42 percent are old people and young children. Similarly the population structure of the state in terms of sex also shows that males are more than females by 2.58 percent. The proportion of males is 51.29 percent while the total percentage of females in the population is 48.71 percent The list of health institutions shows that the state government has about 64 health institutions representing about 14 percent of the whole registered and functioning health institutions in the state while the remaining 86 percent belongs to the local governments, communities, voluntary agencies and private organizations. The analysis of diseases treated also shows that the ten common diseases in the state as at 1985 are malaria, upper respiratory infections, anaemia, dysentery, diarrhoea, scabies, conjunctivitis , measles, chicken pox and otitis media. However the lessons which one may learn include: Firstly rapid population growth which must be checked by placing emphasis on family planning services. This is because of its negative impact of overpopulation on per capita expenditure for health services, and other development plans in the state.
- Secondly, most of the common diseases in the state can be
actively controlled; emphasis should be placed on preventive health care so as to reduce morbidity and mortality rate of these diseases.
- Thirdly, drug procurement should be based on common diseases
and its distribution should be in terms of need of a particular area of the state.

NSS 241 INTRODUCTION TO BIOSTATISTICS
15
4.0 CONCLUSION
In this unit, we have studied frequency with which certain variables occur in a set of data. We also learnt about the range or gap between the lowest and highest variable in a series. We concluded the unit by looking at the values of health data to planning of health care services. 5.0 SUMMARY
Health data come in large volumes and often in an unorganized form. You learnt that a starting point of analysis calls for ordered array of such numerical data. Frequency of occurrence of certain variables and identifying range between the least and greatest numbers was studied. You also learnt the application of health statistics to planning and healthcare delivery. ANSWER TO SELF ASSESSMENT EXERCISE i. ii. 0 0 0 110 217 310 4 4 4 4 4 5 5 5 5 6. 6.0 TUTOR-MARKED ASSIGNMENT
1. List five uses of Biostatistics in planning health services. 2. From the reading of 3.4.1 and 3.4. a well analyzed health data
will provide information on (fill in the blank spaces with appropriate words /phrases
(i) ……………………… …existing health institutions (ii) …………………………of health man - power (iii) ……………………… of health facilities (iv) ……………………….of functioning health institutions by
organization (v) ………………………..of patients (vi) ………………………….Treated (vii) ………………………….Beds and occupancy rate (viii) …………………………of services and care provided
No of Attendance
Tally No of Student
0 111 3 1 1111 1111 10 2 1111 1111 1111 11 17 3 1111 1111 10 4 1111 5 5 1111 4 6 1 1
Total 50

NSS 241 INTRODUCTION TO BIOSTATISTICS
16
7.0 REFERENCES/FURTHER READINGS Jolayemi: E.T (2005) The Choice is Yours, The Seventy Ninth Inaugural
Lecture, University of Ilorin, Sept. 29
Wayne W. Daniel (1974) Biostatistics: A Foundation for Analysis in the Health Sciences, New York John Wiley and sons Inc.
Kwara Ministry of Health (1985) Statistics Unit, Planning Division
Annual Statistical Bulletin.

NSS 241 INTRODUCTION TO BIOSTATISTICS
17
UNIT 4 PRESENTATION OF DATA CONTENTS 1.0 Introduction 2.0 Objectives 3.0 Main content
3.1 Numerical Presentation 3.2 Tabular Method 3.3 Graphic Method
3.3.1 Histogram 3.3.2 Bar Chart 3.3.3 Pie Diagram
4.0 Conclusion 5.0 Summary 6.0 Tutor Marked Assignment 7.0 References/Further Readings 1.0 INTRODUCTION In units two and three, you studied some statistical methods of analyzing data. That is reducing large volumes of numerical figures to manageable size, a process that is also called summarization. After such analysis, data are presented in a way and manner that makes them “speak’. Speak in the sense that summarized data are displayed to give you information about the current status of events as they were, as they are or are likely to be in foreseeable future, so that appropriate decision and actions can be taken. In this unit you will learn three common ways in which summarized data are presented for clear understanding and interpretation. First, there is the tabular presentation in which data are sorted, arranged, condensed and set out in such a way as to bring out the essential points. In order to present data effectively in this manner, the following rules must be observed. • The title should clearly describe the material contained within the
table. • Three elements commonly feature in the title. What? When? and
Where? For example a table showing age distribution of children attending Kulende clinic in May 2006 will look like the following:

NSS 241 INTRODUCTION TO BIOSTATISTICS
18
A Table Showing Age Distribution of Children Attending Kulende Infant Welfare Clinic in May 2006.
Ages No of Children 0 – 11 months 22
1 year 55 2 years 22 3 years 11 total 110
Fig 1
Looking at the table above the three main features displayed are: What? – age distribution of the children. Where? – Kulende infant welfare clinic When? – May 2006
Secondly, there is the numerical presentation which you will learn in this unit. This is used to display figures that are not, too large and cumbersome. With it you will easily notice the least and the largest in the series. Thirdly, you will learn in this unit the graphic representation of data which allows summarized data to be displayed in the form of graphic, geometric figures, or pictures. The aim is to provide a simple visual aid such that the learner will rapidly appreciate the important features of data.
2.0 OBJECTIVES At the end of this unit learners will be able to: • Explain different ways in which analysed data are presented. • Identify methods of presenting data. • Present data in numerical, tabular and graphic forms. • Present data on a histogram a bar and a pie chart • Read health information presented in tabular and graphic forms. 3.0 MAIN CONTENT 3.1 Numerical Presentation This is used when the numbers are few and it shows instantly the lowest and highest numbers which show clearly the range of the set of numbers and from here you can calculate the mean, median and mode, e.g. 1234567. Here the range is 7-1 =6, and the mean is the sum of all the numbers divided by 7 = 28 = 4
7

NSS 241 INTRODUCTION TO BIOSTATISTICS
19
3.2 Tabular Presentation Here you tabulate the data, form frequency distribution and present results in a table. It is important to note that tables should have a clear heading or title indicating exactly the content of the table. Each column in the table should have a clear heading. For example the frequency of number of students attending Kulende clinic in the year 2006 is given as follows:
No of Attendances No of Students 5 3 4 6 8 4 2 8 7 5 SELF ASSESSMENT EXERCISE With a well labelled table, represent the following data in a tabular form. Students who had malaria attack in the year 2006. Students Malaria attack 4 6 9 2 8 3 2 4 5 6 3.3 Graphic Method
Usually these are in the form of pictures presenting the salient part of the data. Examples include:
• Histogram • Bar Chart • Pie Diagram
The heading of each table is important and this must be clearly stated. For example a histogram of age distribution of women attending Abiye clinic is presented as follows:

NSS 241 INTRODUCTION TO BIOSTATISTICS
20
Histogram of Women attending Abiye Clinic 30 25 Frequency 20 15
10 5 0 10 15 20 25 30 35 40 45 AGE GROUP Vertical axis = no of women and frequency Horizontal axis = age group Bar Charts These are similar to histograms except that there is a clear distinction between the classes here and those in histogram. For instance school ‘A’ has 200 students, school B – 100 students and school C has 250 students. This is presented as follow in horizontal bars: No Student 50 100 150 200 250 300
A Schools B
C
Same in vertical presentation

NSS 241 INTRODUCTION TO BIOSTATISTICS
21
250 No of Student (s)200 150 100 50 0 A B C
SCHOOLS Dual Bar Chart The information about number of students in three different schools Above can also be presented the same way in different years using dual bars as shown in the figure below.
2001 2002 No of Student(s) 50 100 150 200 250
Schools
A B
C
Pie Diagram This consists of circle which is divided into sectors which are proportional to the size or value of each variable. Take again three classes.

NSS 241 INTRODUCTION TO BIOSTATISTICS
22
70A 50C
60B of frequencies A 70, B60 C 50 4.0 CONCLUSION This unit has introduced you to the act or method of presenting data after summarization and analyses. Two methods are studied. These are numerical and graphic representation of data. The purpose is to help you read and appreciate what the data are saying in a nutshell about events being examined or studied. 5.0 SUMMARY We have learnt in this unit the importance of presenting analysed data in such a manner that makes them speak. Two common methods of doing this are studied namely numerical and tabular methods. These are employed in the case of few numbers usually. In the tabular mode as the name implies, data are presented in tables. It is important that proper headings or tittles are given to the tables for easy reading. Graphics method displays data on histograms, bar charts and pie charts for instant reading. Example of histogram, bar and pie charts were studied in the unit. ANSWER TO SELF ASSESSMENT EXERCISE Table showing students and frequency of malaria attack in 2006.
Students Frequency 2 4 5 8 9
4 6 6 3 2
Total 28 21

NSS 241 INTRODUCTION TO BIOSTATISTICS
23
6.0 TUTOR- MARKEDASSIGNMENT 50 pregnant mothers were asked how often they attended Adewole clinic during the year 2006, their responses are as follow: 3 attended zero time 10 ,, once 17 ,, twice 10 ,, 3 times 5 ,, 4 times 4 ,, 5 times 1 ,, 6 times Construct a bar chart showing how often the pregnant mothers attended the clinic. 7.0 REFERENCES/FURTHER READINGS Landu V.B (2003) Basic Statistics in Education Ilorin, Northaday
Publishers.

NSS 241 INTRODUCTION TO BIOSTATISTICS
24
UNIT 5 LAWS OF PROBABILITY OR TEACHING
YOURSELF HOW TO GAMBLE CONTENTS 1.0 Introduction 2.0 Objectives 3.0 Main Content.
3.1 Probability 3.2 Chance and Probability 3.3 Laws of Probability 3.4 The Lucky Dip 3.5 Zuba Hospital Patients with Meningitis
4.0 Conclusion 5.0 Summary 6.0 Tutor-Marked Assignment 7.0 Reference/Further Readings 1.0 INTRODUCTION In this unit you are going to learn the concept of probability. This is often referred to as teaching yourself to gamble! The theory of probability provides the foundation for statistical inference. The concept of probability is not strange to health workers and is frequently encountered in everyday communication for example we may hear a physician say that a patient has a 50 – 50 chance of surviving a certain operation. Another physician may say that he is 95% certain that a patient has a particular disease. A public health nurse may say that nine times out of ten a certain clients will break an appointment. Thus we are accustomed to measuring the probability of the occurrence of some event by a number between zero and one. The more likely the event, the closer the number is to one and the more unlikely the event, the closer the number is to zero. An event that cannot occur has a probability of zero. An event that is certain to occur has probability of one. If you flip a coin, the probability that you will get a head or tail is 50 – 50 anytime provided it is a fair coin. If you roll a six sided dice in a game of ludo the probability of getting a 123456 faces are equal to 1/6 to 6/6 each face has equal chance. The scale of measurement of probability is on a compact range, the limits being from 0 to 1. At one extreme, a probability of 1 indicates that there is absolute certainty that the event will occur. At the other extreme, a probability of 0 indicates that there is absolute certainty that the event will not occur. For instance if we say that the sun will rise from the West tomorrow, this is unlikely to happen and therefore has a close to zero probability. On the other hand, if we

NSS 241 INTRODUCTION TO BIOSTATISTICS
25
say that the sun will set in the west, this has probability close to 1 as it is certain to happen. 2.0 OBJECTIVES At the end of this unit learners should be able to: • Explain the concept of probability. • Differentiate between probability and chance • Appreciate the role of probability in the events happening around
clinical practices.
3.0 MAIN CONTENT 3.1 Probability Probability is therefore crudely defined as the degree of possibility of an event occurring. If the event is certain to happen, it has a probability of 1. If however, the event is impossible to happen, if it has a probability of 0. Less likely Probability Scale
That I will fly to the Moon without Mechanical aid.
That when it s tossed a fair coin will turn up heads.
That we will all be dead in AD. 2286.
That when I roll a fair dye it will turn up six.
That a playing card selected from a standard pack will be either a spade or a heart.
The sun will rise in the east tomorrow.
That you will pass the semester exam at the 1st attempt.
0.0 0.1 0.2 0.3 0.4 0.5 0.6 0.7 0.8 0.9

NSS 241 INTRODUCTION TO BIOSTATISTICS
26
3.2 Chance of Probability Chance is another concept used for probability except that chance is always expressed in percentage (%) whereas the other in expressed in absolute units, e.g. chance of 100% = 1, or 50% which is 0.5. When a number of events have equal chance of occurrence, the events are said to be equiprobable i.e. equal probability. That a tossed coin will show a face is certain, that is probability of 1. One face is either a head – prob. of ½ or a tail = prob. of ½. SELF ASSESSMENT EXERCISE Give 5 examples each to illustrate the following: (a) An event that has a probability of 0. (b) An event that has a probability of 1. 3.3 Laws of Probability We have so far dealt with ideas and concepts that can be put into simple laws of probability. Let’s examine three of such laws. (i) If an event can occur in one of different .n. Ways all equally
probable, then the probability of the occurrence of any individual outcome is 1/n, e.g. a dice can turn up in six different ways, therefore the probability of the occurrence of any particular result 1/6.
(ii) If m of these events have the same attribute A, the probability of
the occurrence of the attribute A, is M/n e.g. King out of a pack of cards (p=4/52) (There are 4 kings).
(iii) If A and B are mutually exclusive attributes which an event can
have (i.e. the event cannot have both A&B) then the probability of an A or B is equal to the probability of an A plus the probability of a B. This addition law can be illustrated by the playing card experiment. The probability of turning up a spade is 13/52 = ¼. The probability of turning up a spade or a club is the sum of these two probabilities i.e. ¼ + ¼ = ½.
As mentioned earlier on it is not intended that we do an in-depth study of probability in this unit. The information produced so far is however to wet your appetite and stimulate your interest for future detail studies of the subject.

NSS 241 INTRODUCTION TO BIOSTATISTICS
27
3.4 The Lucky Dip A black bag contains 1000 balls of identical size, texture and surface, but 500 are black, 450 are red and 50 are white. After shaking the bag thoroughly select one ball at random (i.e. without peeping). What is the probability that you have selected (a) a black ball (b) a red ball (c) a white ball? (a) Out of 1000 balls (n), which stand an equal chance of being
selected, 500 of them are black (m). The probability that the selected ball will be black is = M/N i.e. = 500/100 = m/0.5 black = 0.5 n
(b) In this case n= 1000, r (red) = 450. The probability of selecting a
red ball is 450/1000 = 0.45 = red = 0.45. (c) In this case n 1000, w (white) = 50 White 50/1000 = 0.05
Note that all the possible outcomes must give a total probability of.1. Thus P/black + P/red +P/white = 0.5 + 0.45 + 0.05 = 1.00. The probability of getting either a black ball or a red ball = P/black + P/red = 0.95. 3.5 Zuba Hospital At this hospital, 50% of adult patient who are admitted with meningitis die of the infection. In a batch of five patients what is the probability. (a) that all 5 patients will recover (b) that two will recover and (c) that none will recover? (i) The probability of recovery P = ½ (ii) The probability of dying q = ½ (iii) Number of patients in the batch, n=5 (p + q)n = ( ½ + ½)5 . There are six possible outcomes:- (1) That all 5 patients will recover = p5 =( ½ )5 = 1/32 (2) That 4 patients recover and 1 die = 5p 4q =5( ½ ) 4( ½ ) = 5/32 (3) That 3 patients recover and 2 die = 10 p3q2 = 10 (½ ) 3( ½ )2 =
10/32

NSS 241 INTRODUCTION TO BIOSTATISTICS
28
(4) That 2 patients recover and 3die = 10p2q3 = 10 ( ½ )2 ( ½ )3 =10/32 (5) That 1 patient recovers and 4 die = 5pq4 = 5 ( ½ ) ( ½ )4 =532 (6) That 5 patients will die = q5 = (½)5 = 1/32. Answers to above questions therefore are that: (a) The probability that all the patients will recover is 1/32 (b) The probability that 2 patients will recover is 5/32 (c) The probability that none of the patients will recover is 1/32.
4.0 CONCLUSION This unit has introduced you to the concepts of probability in statistical studies. The word chance is also used even though it deals in percentages rather than absolute units an event that is likely to take place has probability of I while the one that is unlikely has probability of 0. 5.0 SUMMARY In this unit, some of the basic ideas and concepts of probability are presented. It is intended to provide the learner some information on the subject so that the probability aspects of statistical inference can be more readily understood and appreciated. You also learnt that probability deals with possibility of an event taking .place at one extreme and not taking place at the other extreme. A game of gambling you may call it!
ANSWER TO SELF ASSESSMENT EXERCISE a. That you will own a Concord Aircraft next week. b. That you will become the Emir of Ilorin tomorrow. c. That the sun will set in the East today. d. That the city of Ilorin will relocate to Oyo State e. That a coin thrown up will remain up. b. i) That the sun will set in the west today. ii That your name will not change tomorrow. iii That you will pass your semester exams. iv. That the general elections will hold as scheduled. v. That a dice rolled will show one of the six sides. 6.0 TUTOR -MARKED ASSIGNMENT 1. Illustrate on a probability scale that you will pilot a booing 747
aircraft from Nigeria to New York next month.

NSS 241 INTRODUCTION TO BIOSTATISTICS
29
2. In the case of Zuba hospital in 3.5. What is the probability that all patients with meningitis will recover?
3. That all 5 patients will recover = p5 = (½)5 = 1/32. 7.0 REFERENCES/FURTHER READINGS Daniel W.W. (1994) Biostatistics: A Foundation for Analysis in the
Health Sciences, New York. John Wiley and Son Lucas A.O. Biostatistics Lecture Notes –
Uni-Ibadan.
NSS 241 INTRODUCTION TO BIOSTATISTICS
30
MODULE 2
Unit 1 Sample and Sampling Unit 2 Biostatistics and Health Care Planning Unit 3 Biostatistics in Health Planning Process Unit 4 Biostatistics and Planning of Health Institution Unit 5 Biostatistics and Health Manpower Planning UNIT 1 SAMPLE AND SAMPLING CONTENTS 1.0 Introduction 2.0 Objectives 3.0 Main Content
3.1 Sample 3.3 Advantages of Sample 3.4 Selecting good Sample 3.5 Random Sample 3.6 Types of Random Sample
4.0 Conclusion 5.0 Summary 6.0 Tutor-Marked Assignment 7.0 References/Further Reading 1.0 INTRODUCTION
You will recall that in unit one, you learnt about the use of sample in statistics. If we are interested in a variable among the people of ILORIN, for instance, it may not be possible to deal with everybody that lives in Ilorin City. Therefore we select a portion of the city and analyze the attributes from that part which is now our sample. The out come of our study will help us to make inference into the population of Ilorin. A descriptive measurement derived from such sample is called statistics while similar measurement from the whole population is called parameter. A sample therefore may be defined simply as a part of a population or a portion of a population which has been selected for study in order that the characteristics of the population can be inferred from the findings in the sample. The sample must therefore be selected in such a way that we can make valid inference from the sample to the population.

NSS 241 INTRODUCTION TO BIOSTATISTICS
31
From Sample Infer UNIVERSE (population)
2.0 OBJECTIVES At the end of this unit learners should be able to:
● Explain what sample means ● State the uses of sample ● Select random sample that will be representative of a given
population ● Demonstrate sampling experiments, in practical terms ● Identify different types of samples
3.0 MAIN CONTENT 3.1 Sample This is an attempt to cross–examine a section of a population. Such section gives the characteristics of that population in totality. 3.2 Advantages Advantages drivable from taking samples. ● It may be the only feasible way of taking any measurements at
all. ● More accurate measurements can be made. ● Demand for personnel and resources are less. ● Results are quicker to come by ● Tests may be destructive e.g. in estimating haemoglobin level of
Mr. A. you don’t need every drop of Mr. As blood, a sample will do.
3.3 Disadvantages of taking Sample (a) There is always a sampling error due to the fact that you are
examining just a portion of the total population.

NSS 241 INTRODUCTION TO BIOSTATISTICS
32
(b) Some skills are essential in selecting a good sample which is representative of the population being investigated and has characteristic structure and identity of the original population
(c) Sample is biased if it is not representative of the population from
which it is taken. 3.4 Selecting Good Sample How to select good sample that is devoid of a bias a good sample is one that is representative of the original population from which it is taken. A representative sample is however not merely a little bit out of a whole. Let us carry out an experiment, to drive home the point. Make a cup of tea, add 8 cubes of sugar, and do not stir (1) Take a teaspoonful from the top and sip (2) Take another spoonful from the bottom and sip (3) Stir thoroughly for five minutes. Now take another sip from the
top. Which of the three samples gave the best estimate of the contents of the cup? Unfortunately, life is not a cup of lea. We cannot simply stir it up with a teaspoon and render it homogeneous. We are often dealing with a heterogeneous mass of discrete items. One way by which we can avoid bias therefore, is to select a random sample.
SELF ASSESSMENT EXERCISE i. What is statistics? ii. What do you mean by parameter? iii. Write a brief note on Sample 3.5 A Random Sample A random sample is one that is selected in such a way that each item within the population has an equal opportunity of being selected e.g. A random sample n from a population N, every possible sample of size n has an equal chance of being selected. For example, write the numbers 1 to 100 on individual cards measuring 1 inch by 1 inch. Place these cards in a large black bag and shake vigorously for 20 minutes. Without looking inside the bag, pull out 10 cards, These 10 cards constitute a random sample of the 100 cards.

NSS 241 INTRODUCTION TO BIOSTATISTICS
33
3.6 Types of Sample (a) Simple random sample as explained in 3.5 (b) Systematic sample in which for example out of 30 people we
select a total of 5 picking one from a group of six people. (c) Stratified sample where population is classified into strata e.g.
.university community of students, academic staff, non-academic staff etc.
(d) Multi –stage sample The sample is selected in stages (e) Cluster sample in which the population is arranged in clusters of
say 1 2 3 4 5 6 and samples selected randomly. 4.0 CONCLUSION Our universe is a massive phenomenon. We are interested in what goes on in our population. We want to know what characteristic are attributable to populations. However, limited resources, time and verseness of the universe would not make it possible. It is therefore necessary that we take a good sample that will depict the characters that we are interested in from a larger population. A small part that will help us to understand the large universe from which the part is taken is known as sample. This is the subject of sample and sampling in this unit. 5.0 SUMMARY In this unit we studied sample and sampling as a way of understanding the attributes of our world. You learnt that a good sample is capable of showing valid information about a larger population. To study the entire universe may not be too easy in view of time, space, human and material resources. Therefore selecting a portion for study is a way of knowing something about the population. You also learnt about ways of selecting good representative samples as well as advantages and disadvantages of taking samples. ANSWER TO SELF ASSESSMENT EXERCISE i. Statistic is a descriptive measurement obtained from a sample. ii. Parameter is a descriptive measurement obtained from a whole
population iii. Sample is a part or portion of population or universe. It must be
able to exhibit all Characteristics of the population from where it

NSS 241 INTRODUCTION TO BIOSTATISTICS
34
is taken. Since it is not always feasible to study an entire population due to lack of time, resources etc. a good sample of it will be alright for analysis. The outcome will provide valid information about the variable that we are interested in.
6.0 TUTOR-MARKED ASSIGNMENT 1. I wish to find out the average haemoglobin level of the people in Ilorin. Which of the following methods will give me the most representative sample of the inhabitants of Ilorin? (a) Shop keepers along unity Road. (b) Stall holders at Ipata market (c) Pedestrians selected at random near Post Office (d) Patients at the Sobi Hospital. (e) Selection of households at random from an aerial photograph of
Ilorin including all residents. Criticise each method in turn. 7.0 REFERENCES/FURTHER READINGS Daniel, W.M. Biostatistics: A Foundation for Analysis in the Health
Sciences A.O Lucas, Unpublished Lecture Notes, Unibadan, Ibadan Nigeria.

NSS 241 INTRODUCTION TO BIOSTATISTICS
35
UNIT 2 BIOSTATISTICS AND HEALTH CARE PLANNING CONTENTS 1.0 Introduction 2.0 Objectives 3.0 Main content.
3.1 What is Planning 3.2 Planning process
4.0 Conclusion 5.0 Summary 6.0 Tutor-Marked Assignment 7.0 References/Further Readings
1.0 INTRODUCTION
In the previous units we studied various statistical variables used in the determination of the state of our total environment. A lot of things we do or see or have are assessed either by their, quantity quality and relevance. How much impact (negative or positive) one event has on the other is often assessed by use of numbers and percentages. Take for instance public opinion polls used to assess the feelings of the governed about those who are governing them. Information for such polls comes in the form of figures, numbers and percentages. A well analyzed opinion poll can be used to evaluate, validate and invalidate actions of Government of the day which in turn will help it to amend its policies appropriately. Healthcare services and biostatistics are inseparable. In fact biostatistics is the bedrock of healthcare services. Every aspect of healthcare delivery from policy formulation to planning to implementation and evaluation depends on reliable statistics. In this unit you will learn the importance of biostatistics to health planning. Health programme planning is an organized approach to the provision of quality health services to the people. To be effective in achieving the support and acceptance of the people and their willingness to do as much as they can for themselves requires systematic planning, the type that is usually given to both the services and operational phases of a specific health programme. The logistics of planning for health programme at all tiers of government; federal, state and local are analogous to the planning for the services or operational phases of the programme. What is being emphasized here is that planning is “sine qua non’ to effective and sustainable health care services at all levels. Health reform programmes can only succeed with proper planning anchored on reliable biostatistics based on sustainable and regular down and up and down flow of health information.

NSS 241 INTRODUCTION TO BIOSTATISTICS
36
3.0 MAIN CONTENT 3.1 What is Planning? It is such a common word to the extent that it is often taken for granted. People become conscious of it only when a programme or project flops. Often we tend to rely on our formal and informal knowledge and know-how gained through years of education exposure, and experience. Of course this technique usually works in some cases. It is therefore necessary for us to change our programme planning glasses in order to improve our forward vision. It is said that those who fail to plan, plan to fail. What then is planning? Several definitions exist. All the definitions are attempts to provide answers to the following basic questions.
● where are we coming from? ● where are we? ● where do we want to be? ● how do we get to where we want to be? ● how do we know that we are there? ● how long does it take us to get there? ● what factors facilitated our “journey? ● what factors militated against our journey? ● how do we improve on such facilitators? ● how do we remove mutilators ? Etc so that the next trip will be
better, smoother and faster in all its ramifications Planning therefore is a decision making process, systematic and continuous, on how when, and where to employ resources in order to achieve future goals.
It is not just scheduling, forecasting or statement of desired results. Without some forms of planning we might run the risk of being busy without really getting anywhere in terms of achieving desired objectives. Planning can make a lot of difference between what would normally happen without it (forecasted) and what can happen if planning is done to allocate resources and direct effort toward future goals (Desired) as illustrated by the figure below.

NSS 241 INTRODUCTION TO BIOSTATISTICS
37
Figure I 70
60
Improvement- Results 50
DESIRED 40 PLANNING 30 20 FORECASTED 0 1 2 3 4 5 6 n TIME
From all indications, it is clear that planning is essential in all our endeavours if we really want to achieve stated goals in our healthcare programmes. Those who don’t believe in planning may argue that it takes time and energy which could be spent in carrying out programmes and serving people. Failing to plan is tantamount to focusing on means and loosing sight of the ends. When this happens, we may fall into the activity trap where we become so occupied with the activity involved in getting something that we lose control of ourselves in the activities itself. A case of much motion with little movement. As we fall deeper into activity trap the true goal moves far from us: it eludes us but the activity persists and becomes a false goal. This false goal then becomes criterion. for making decisions, and our daily decision –making is in terms of perpetuating the activity rather than in choosing wisely among our resources and setting priorities for goal achievement. Therefore we need to plan to know where we are coming from. To know where we are going and why. To know the means to get there in terms of strategies and resources. To know when we reach our destination easily or late and why. Reliable information and biostatistics are essential in our attempts to determine result at the onset, during and the end of a programme. SELF ASSESSMENT EXERCISE What is planning?

NSS 241 INTRODUCTION TO BIOSTATISTICS
38
3.2 The Planning Process Basic steps/guidelines or principles (Local level) The process must be practical and efficient @ Situation Description; WHO gave the following five basic steps
in program planning: (i) Collecting information that are essential for planning (ii) Establishment of objectives (iii) Assessing the barriers to health programme and how they
may be overcome. (iv) Appraising apparent and potential resources, organizations,
personnel’s, materials and funds. (v) Developing the detail plan of operations including a definite
mechanism for continuous evaluation Over the years, the five steps above have been expanded and modified due to increased technological growth to the following seven steps: (i) Collect data for health trend assessment (ii) Define the objectives of the planning to be undertaken. (iii) Define parameters for planning (i.e. national policies budgetary
restrictions, regional priorities, intersectoral linkages, health problems/disease environment, problems and constraints to implementation etc).
(iv) Determine the framework and structure for planning (that is how
you will approach the job and establish a suitable environment to facilitate the planning process and get the job done.
(v) Identify those who will be involved. Decide on the planning organization, and define roles of the participants.
(vi) Quantify the data and information that will be needed for action plan.
(vii) Set up a work schedule for planning. Assign roles and tasks to the participants establish a timetable etc.
4.0 CONCLUSION In the unit we examined the close relationship between health services and biostatistics. The two are interdependent. Good health service depends on reliable information that is biostatistics. Planning is ‘sine

NSS 241 INTRODUCTION TO BIOSTATISTICS
39
qua non,’ to effective and efficient health services. Without planning the desired goals may elude us. You also learnt what planning process entails. 5.0 SUMMARY You have learnt in this unit the importance of biostatistics to health service planning. You also learnt what planning is and what it is not. Without proper planning our health care delivery system may go hay-wire. We need reliable information based on valid statistics to guide us in our planning process. We also examined basic steps and principles of planning process which include situation analysis, data collection, setting of objectives, identifying options, assessing source of resources and developing plan of work etc. ANSWER TO SELF ASSESSMENT EXERCISE It is a decision-making process, systematic and continuous, on how, when and where to employ resources in order to achieve future goals. 6.0 TUTOR-MARKED ASSIGNMENT Describe five basic principles of health service planning. 7.0 REFERENCES/FURTHER READINGS FMOH (1988) Guideline on Health Programme Planning and
Implementation for Local Government Areas in Nigeria Abuja, Nigeria.

NSS 241 INTRODUCTION TO BIOSTATISTICS
40
UNIT 3 BIOSTATISTICS IN HEALTH PLANNING PROCESS
CONTENTS 1.0 Introduction 2.0 Objectives 3.0 Main Content
3.1 Situation Analysis 3.2 Defining Objectives 3.3 Defining Parameters for Planning 3.4 Determining the Structure for Planning 3.5 Identification of Participants 3.6 Identification of Data and Information Needed and Source 3.7 Work Schedule for Planning Health Services
4.0 Conclusion 5.0 Summary 6.0 Tutor-Marked Assignment 7.0 References/Further Readings
1.0 INTRODUCTION Every health care programme is an embodiment of Biostatistics, so also is every aspect of health service planning. At every point or level of health care, we need data; we also require need information to guide in arriving at reasonable decisions, our action or inactions Nigeria along with other nations of the world have just marked World Tuberculosis Day. (March 26). It is reported that the disease kills about 100 people everyday. Major casualties are reported to be living in poverty stricken environments as well as those with HIV/AIDS. Tuberculosis has therefore assumed intimidating position among those opportunistic diseases of this generation. Reports on HIV/AIDS and tuberculosis are always supported by figures and percentages and not mere sweeping statements. Health statistics therefore help us to know the trend of deadly diseases in our society so that appropriate health policies can be formulated and decisions and actions can be taken promptly. From the previous unit you have been sufficiently informed about the relevance of health data to health care programme you will in this unit learn how to harness and apply Biostatistics in the planning of health care services as we examine few steps in the health planning process.

NSS 241 INTRODUCTION TO BIOSTATISTICS
41
2.0 OBJECTIVES
After going through this unit the learner will be able to: ● Appreciate the role of statistics in health care planning. ● Identify the importance of statistics in good health care planning
process. ● Establish where and when it is desirable to plan for and provide
health services ● Identify key steps in health planning process. ● Outline key indicators of health status of a given population etc. 3.0 MAIN CONTENT
3.1 Situation Analysis
Analysis of the situation and assessment of the health trends is an important step in the planning process. It helps you to know where you are and your direction so that you may know where you want to go. The assessment is based on available data and information which include health demographic data and indicators, health resources and indicators, health management and information system indicators, health policies data indicator, socio-economic data and indicator. Remember that if you do not know where you are, then ask someone who knows.
3.2 Defining Objectives
Defining of objective of planning to be done is the next important step. If you cannot state your objectives after assessment of health trends then there is no need starting the planning at all, because you don’t know where you are and where you want to go. It may take repeated attempts to fully define your objectives. Discuss and review with others involved and reach agreement. Once this is done you are off to a good start other steps in the process will follow easily first, from the analysis of available data on health trends, state what you expect to accomplish through planning. Specify objectives in terms of: (i) Who will benefit (ii) The target group e.g. (iii) All Nigerians. (iv) Local Government population (v) Rural and Communities of certain size or population. (vi) Those at risk for specific diseases e.g. HIV/AIDS, industrial
hazards
In addition to specific objectives the approach may be directed toward certain strategies designed to:

NSS 241 INTRODUCTION TO BIOSTATISTICS
42
(vii) Improve the allocation of resources. (viii) Shift roles from one group in the health system to another (ix) Improve the deployment and use of manpower. (x) Influence political decision-making. (xi) Obtain support from other sectors etc. SELF ASSESSMENT EXERCISE Fill in the missing worlds / phrases in the following statement An important step in health planning process is (1)…………of existing (2)…………………which will help us to know (3) ……………… and thereby determine (4) …………………. by defining our (5)………………… based on reliable (6) ……………………. and (7)…..…………………… Defining Parameters for Planning As soon as objectives are spelt out and agreed upon, the next thing is to define the framework within which to carry out the planning. By framework we mean all the factors in the planning environment which in one way or the other will influence or have bearing on the outcome of your plans. One way to do this is to look at the opportunities and problems or constraints which you can identify e.g. A. Opportunities such as:
● Election of new government. ● strengthening of economics-windfall. ● Introduction of new WHO-sponsored programme. ● A shift in budget allocation from one sector to another ● A surge of local enthusiasm for primary health care in
certain area. ● Introduction of new communication systems for health
services-GSM, E-mail E- Treatment etc. ● Adoption of new career incentives for rural health
workers.
B. Problems and Constraints ● Shortages – staff, supplies, equipment, drugs and vaccines,
funds, accommodation. ● Difficulties in posting and keeping health workers in rural
areas. ● Management short comings in supplies and logistics ● Lack of transport and communications ● Manpower in balance i.e. too many of one kind and not
enough of another. ● Lack of community support

NSS 241 INTRODUCTION TO BIOSTATISTICS
43
● Opposition to certain programmes and to change by groups within or outside the health system.
● Political instability/changes.
C. Others include (planning parameter determinants) ● National Health Policies – Reports ● FMOH planning guidelines ● Budget guidelines ● Disease/Health problem analysis ● New National Health programmes ● State and Local Government area Health priorities ● Health related programmes of other ministries,
department, missions etc.
3.4 Determining the Structure for Planning
The next important step is to structure the planning strategy. That is, determine how you will approach the job. A structure around which to organize the planning program. Such structure may emphasize one or another of planning for health care system, such as: ● Resource – orientation – based on resource available and
collection. The five Ms of men, money, material, methods and management.
● Management – orientation – based on functional areas that produce required services.
● Health and disease problem orientation based on analysis of health and disease problems with priorities determined because of their impact on the health status of the target population.
The planning environment which in one way or the other will influence or have bearing on the outcome of your plans. One way to do this is to look at the opportunities and problems or constraints which you can identify e.g.
A. Opportunities such as:
● Election of new government. ● strengthening of economics-windfall. ● Introduction of new WHO-sponsored programmes. ● A shift in budget allocation from one sector to another ● A surge of local enthusiasm for primary health care in
certain area. ● Introduction of new communication systems for health
services-GSM, E-mail E- Treatment etc. ● Adoption of new career incentives for rural health
workers.

NSS 241 INTRODUCTION TO BIOSTATISTICS
44
B. Problems and Constraints ● Shortages – staff, supplies, equipment, drugs and vaccines,
funds, accommodation. ● Difficulties in posting and keeping health workers in rural
areas. ● Management short comings in supplies and logistics ● Lack of transport and communications ● Manpower in balance i.e. too many of one kind and not
enough of another. ● Lack of community support ● Opposition to certain programmes and to change by
groups within or outside the health system. ● Political instability/changes.
C. Others include (planning parameter determinants) ● National Health Policies – Reports ● FMOH planning guidelines ● Budget guidelines ● Disease/Health problem analysis ● New National Health programmes ● State and Local Government area Health priorities ● Health related programmes of other ministries,
department, missions etc. ● Programme – orientation based on analysis of health
programmes, their efficiency and effectiveness and needed restructuring or reform during subsequent planning cycle.
● Facilities orientation-based on the analysis of facilities operations, how they serve consumers needs and their efficiency and effectiveness, with emphasis on cost and demographic orientation etc.
● Functional areas of planning work include: (a) Situation analysis (b) Production and delivery of Health services (c) Human resources (d) Financial sources (e) Management of the above.
3.5 Identification of Participants Identification of those who will participate in the planning work is the next step. This must be done in an early stage with their roles and responsibility clearly stated. Variation and flexibilities in opinion, surveys, diagnosis, policy making, review panel, information and data provide sand analysis are involved. Breakdown to situation analysis, production and delivery. (SPD)

NSS 241 INTRODUCTION TO BIOSTATISTICS
45
Further breakdown to National, State, Local government and district levels. Bring in special groups –medical school Associations, Nurse and midwives council, Trado- healers farmers, market women etc. Outside experts, experiences elsewhere, resources persons from WHO, UNICEF, world Bank, Missions donor organizations, universities interdependency with others. Keep the tempo and ensure good channel of communication and feedback. All participants to have their assignments in writing and be kept abreast of levels of work. Establish task forces and working groups as appropriate and define them in terms of end results (output). For example the human resources team might be expected to produce series of products including: ● Manpower plan with supply and demand forecasts for each
category of health worker. ● Staffing norms, types of health facilities and services ● Incentives for care development ● Recommendation for training programmes and standard cost
estimates for training
3.6 Identification of Data and Information Needed and Source
Identifying the data and information that will be needed is the next step. Important to clearly state the type of Information needed and the use to which the data will be put and means of obtaining them. Be familiar with sources and reliability of data provided. Do not collect too much data. Note that to assess the health status of a given population it is always necessary to do situation analysis to consider the past, and present as well as make future projections. The level at which planning is determines the category of data /information needed. For example National, State, Local Government district levels. Following are those commonly considered. ● Socio-economic and development policies resulting health
policies ● Demographic situation ● Epidemiological Situation ● Health resources including anticipated support services situation ● Health services situation Let us now look at some examples of categories of indicators for health planning. (a) Health policy Indicators
● Political commitment to health

NSS 241 INTRODUCTION TO BIOSTATISTICS
46
● Resources allocation ● Degree of equity of distribution of health resources ● Community involvement in attaining health ● Organizational framework and managerial process
(b) Social and Economic Indicators related to Health
● Rate of population growth ● Gross National or Gross Domestic Product. ● Income distribution ● Work conditions ● Adult literacy Rate ● Housing ● Food availability and security.
(c) Indicators of the provision of Health Care
● Availability ● Physical accessibility ● Economic and cultural accessibility ● Utilization of sources ● Quality of care. ● Coverage by Primary Health care
- Information and education concerning health - Promotion of food availability and proper nutrition - Water and sanitation - Maternal and child health - Immunization - Prevention and control of endemic diseases - Treatment of common diseases and injury - Provision of essential drugs - Mental health care.
● Coverage by Referral system:
- Economic and cultural accessibility - Hospital utilization - Essential components of referral system - Manpower availability - Ratio of population to different types of health workers,
Training facilities.
d) Health Status Indicators
• Nutritional Status • Psychosocial development • Infant mortality rate • Child mortality rate • Under 5 mortality rate

NSS 241 INTRODUCTION TO BIOSTATISTICS
47
• Life expectancy at a given age • Maternal mortality rate • Diseases specific mortality • Morbidity • Disability • Social and mental well being. • Quality of life indicators.
3.7 Work Schedule for Planning Health Services
After taken the steps enumerated earlier you will now set up a work schedule to answer questions of WHAT, WHO and WHERE. Be specific as much as possible as to who will be involved, what they are expected to do and when they should complete these tasks. To do this the following steps should be taken.
● Set up a work plan with objectives and the activities required to
achieve them. ● Set times tables and deadlines ● assign roles and responsibilities to participants both in and out of
your organization. This requires linkages and communications. Be sure that all participants understand the work plan and what they and others have to do.
● Maintain the linkages and communication throughout the entire exercise and collect and prepare resources document and make them available to appropriate individual, and working groups.
4.0 CONCLUSION Every aspect of health care depends on health information. Reliable statistics is sine qua non to provision of efficient and effective health care services. We need to know what we have on ground in terms of quality and quantity so that we can decide whether to maintain the status quo or project for a better future. Good health care planning therefore calls for careful situation analysis, prudent harnessing of resources for the production of health service and all involving service delivery network. 5.0 SUMMARY In this unit you learnt the indispensable role of biostatistics in the planning of health care services. You also learnt a few important steps in the health planning process. Data are important and relevant at every stage of the process. Analysis of existing health situation, production of health services and delivery to target population at various levels of our society depends on reliable health information. You also learn about

NSS 241 INTRODUCTION TO BIOSTATISTICS
48
key indicators of the health status of any given population as well as the degree of political will and commitment to health. In other words, how do you assess a given population as healthy? ANSWER TO SELF ASSESSMENT EXERCISE 1. Analysis 2. Situation 3. Where we are. 4. Where we want to be 5. Objectives/ goals 6. Statistics 7. Information. 6.0 TUTOR-MARKED ASSIGNMENT 1. List five indicators of health status of a population. 2. Describe briefly: (a) Two factors that may facilitate health planning process (b) Two factors that may militate against health planning
process. 3. SPD is an acronym for situation analysis, production of services
and delivery of services. In two to three sentences describe SPD. 7.0 REFERENCES/FURTHER READINGS
F.M.O.H Lagos (1986) Hand Book for the Planning and Managerial
Process for Health Development, Abuja.

NSS 241 INTRODUCTION TO BIOSTATISTICS
49
UNIT 4 BIOSTATISTICS AND PLANNING OF HEALTH
INSTITUTION CONTENTS 1.0 Introduction 2.0 Objectives 3.0 Main Content
3.1 Determination of Service Demand 3.2 Assessment of Services Available 3.3 Setting Objectives 3.4 Implementation 3.5 Commissioning 3.6 Evaluation 3.7 Establishing Health Facility in a Local Area
4.0 Conclusion 5.0 Summary 6.0 Tutor-Marked Assignment 7.0 References /Further Readings
1.0 INTRODUCTION
The world has been described as a global village. Nigeria is part and parcel of this village. What affects one village today must be of concern to another especially in the area of health and communicable or transmissible diseases. Since health is wealth no nation can afford to toy with the health of its citizens. Only healthy people can contribute meaningfully to socio-economic and political development of their societies. The WHO representative in Nigeria, Dr. Mohamed said that Health and global development are closely interrelated. What goes into socio-economic growth and development of a nation affect the health of that nation, equally what goes into the health and well being of the people affect socio-economic growth and development of the Nation. In this unit you will learn few basic requirements for planning a health institution or facility for a given population or community, based on health of the people and norms rather than any other motives. The basic principles learnt in the unit on planning process are applicable here as well as other areas such as health manpower and programmes. 2.0 OBJECTIVES
At the end of this unit learners should be able to:
● Identify key the elements for planning health facility or institution for a given population
● List the WHO norms for locating health institution

NSS 241 INTRODUCTION TO BIOSTATISTICS
50
3.0 MAIN CONTENT By now you should have understood the basic steps in planning based on reliable health information and statistics. You will now earn how to examine the procedure for planning health institutions or facilities for a given population. The principles are applicable to other aspects of health care services such as health manpower, Health programmes for specific health problems e.t.c following are guidelines for establishing health facility based on the need of a given population. 3.1 Determination of Service Demand ● Population index/service norm, population service ratio ● Demand statistics, health information available 3.2 Assessment of Services Available Services available, what is on ground: ● Geographical situation/ location ● Qualitative (Statistical) data. 3.3 Setting Objectives Setting objectives to meet the deficiency between what is available and requirement that is net needs 3.4 Implementation (a) Outline of function and specific assessment of basic need ● Evaluation of existing facilities and decision on which of them
should be modified or reformed (b) Operational Policy ● Health institution and capital services ● Departmental operational policy ● Interrelationship departments.
(c) Development plan ● Listing priorities of services needed ● expected availability of resources /finance ● Cost plan and phasing of the plan.
(d) Design Plans

NSS 241 INTRODUCTION TO BIOSTATISTICS
51
● Preliminary plans ● Final design ● Approved plan.
(e) Decide on procedure
● Planning team /groups of ● Architects ● Engineers ● Directors ● Nurses ● Administrators, etc. SELF ASSESSMENT EXERCISE What is World Health Organization (WHO) Norm?
(f) Cost plan ● Allocation of funds ● Budgetary control
(g) Contract award ● Due process. (h) Construction and post contract supervision
3.5 Commissioning ● Staff – man power ● Equipment ● Installation Tests ● Functional Opening. 3.6 Evaluation ● Concept quantification of service required ● Operational polices ● Work flow ● Adequacy of facilities ● Suitability of equipment ● Cost benefit and cost effectiveness ● Any further changes required.

NSS 241 INTRODUCTION TO BIOSTATISTICS
52
3.7 Establishing Health Facility in a Local Area The outlines listed in 3.1 to 3.6 are applicable to the provision of healthcare institutions at various levels. However we want to go a step further to apply the principles in the provision of health facility at a local level based on the guidelines aforementioned Analysis or Assessment of Existing Situation ● Population total by local area, by age, sex, size of risk groups and
projection for a period of time say five years ● Identify main health problems such as:
10 common causes of illness 10 common causes of death 10 common infective diseases 10 common causes of childhood illness or death
● Identify diseases and conditions of priority concern to the people
and the health services. Current indicator levels and recent trends. ● Highlight current Health resources facilities by: - Staff by type employed - By location and types over several past years - Training facilities and their capacity including NGO and private
sector services known - Vehicles and important equipment by location condition /type - Recruitment and development expenditure for several years past
by types expenditure and source - Income from fees for services and drugs and contributions.
Recent service performance and coverage by service utilization.
- Immunization performance, number and percentage of infants and pregnant women fully immunized
- Number and percentage of pregnant women receiving ante-natal care and qualified delivery attendance
- Number of water supply and sanitation schemes and total population covered with such facilities.
- Number of other disease control services provided.
Existing service system.
- Description of the health service organization.

NSS 241 INTRODUCTION TO BIOSTATISTICS
53
- Its inter-linkages, referral reporting, supervision and support.
- Planning management and control mechanisms Major difficulties brief description of technical operational and managerial problems. 4.0 CONCLUSION
In this unit we tried to apply basic principles of planning learnt in the previous unit to planning of a health institution for a local community. As potential health educators and administrators it is important that you understand clearly issues involved in project planning and execution in order to be good and well informed health advisers. Knowledge acquired in this unit is also to form solid foundation for further growth and understanding of planning processes.
5.0 SUMMARY
This unit has brought to your focus the importance of health information to the establishment of health institution or facility. You have learnt the various steps expected to be taken in health project establishment from conceptualization, planning. Execution, commissioning to operational stage.
ANSWER TO SELF ASSESSMENT EXERCISE It is the norm of WHO/ internationally accepted recommendation of ratio of health facility or personnel to a given population, a standard to guide nations in assessing their health status and requirements.
6.0 TUTOR-MARKED ASSIGNMENT
Briefly outline how you would plan a health facility for a community of 2000 population.
7.0 REFERENCES/FURTHER READINGS
FMOH. (1986), Handbook for the Planning and Managerial Process for Health Development at State and Local Government Levels, Abuja.

NSS 241 INTRODUCTION TO BIOSTATISTICS
54
UNIT 5 BIOSTATISTICS AND HEALTH MANPOWER PLANNING
CONTENTS 1.0 Introduction 2.0 Objectives 3.0 Main Content
3.1 Rationale for Health Manpower 3.2 The How of Manpower Planning 3.3 Health Manpower Planning Methodology 3.4 Health Manpower Planning Based on Health 3.5 Health Manpower Planning Based on Service Target 3.6 Manpower Planning Based on Health Demands 3.7 Health Manpower Supply
4.0 Conclusion 5.0 Summary 6.0 Tutor-Marked Assignment 7.0 References / Further Readings 1.0 INTRODUCTION You have learnt earlier that five resources are crucial to the success of organizations. These are manpower, material, money, management and Method (5m’s) Health care system is a complex organization which also depends on harmonious workings of the resources mentioned above. However among the five, manpower is agreed to be the most important because they produce and control the others. In this unit, you will learn about the what? Why? And how of health manpower planning. 2.0 OBJECTIVES At the end of this unit, you should be able to: ● Define health manpower. ● Appreciate the importance of manpower to the success of any
organization. ● Determine health manpower requirements for health institutions ● Estimate specific health personnel for a given work load

NSS 241 INTRODUCTION TO BIOSTATISTICS
55
3.0 MAIN CONTENT
3.1 Rationale for Health Manpower Planning
The workforce of any organization constitutes its manpower. Health workers of various cadres and professional group therefore constitute health manpower. Like other aspects of health care delivery system, health manpower requires careful and systematic planning. The concept of planning has been described in detail in previous units. However the United Kingdom Department of employment in 1976 described manpower planning at organizational level as “ strategy for the acquisition, utilization, improvement and retention of an enterprises human resources ” Writing on the same concept, Amana in 1984 described manpower planning as the formulation of strategy for procurement, allocation, utilization, improvement and retention of the organizations manpower or workforce”. The process entails a logical and systematic approach to the review of present and future manpower situation with the aim of equating the organizations demand with the supply of labour. A common feature in most Nigerian health service development plans is the desire to improve numerical strength of health manpower in order to cope with the ever increasing population and health care demands. Unfortunately however, a situation often arises whereby new health facilities are put in place without the right calibre of health personnel to operate them. This is because health manpower planning has not been positively recognized as an integral part of overall corporate planning. The result is a kind of health care system that is incomplete since the health team is not complete to be able to operate as a whole system. One of the arguments in favour of proper manpower planning is that it enables organization such as health care establishment to make the best use of their most reliable resources in accordance to their goals. Health manpower planning is further necessitated by the growing difficulties in recruiting and retraining staff of the requisite calibres in adequate numbers at the right time and in the right place for obvious reasons of economy, mobility of labour and treatment of health care issues on parallel grounds with non-health matters. In this era of advances in science and technology where electronic gadgets have taken over some jobs performed by human beings especially in developed countries what and how do we go about health manpower planning in developing nations like Nigeria? 3.2 The How of Manpower Planning How then do we go about health manpower planning? A lot of literature exists on the subject based on statistical mathematical modelling of the flows of labour into within and out of organizations. However an analytical examination of the definition of the subject indicates that it is

NSS 241 INTRODUCTION TO BIOSTATISTICS
56
a multidisciplinary subject which draws from social and behavioural sciences such as economics, sociology, psychology, statistics, demography etc. Understandably, we can decide our future requirements only when we know our existing resources. The starting point for health manpower planning in an organization therefore is to undertake a manpower inventory to ascertain what is existing in terms of numerical strength of various specialities or types of staff. Such stock taking will then bring to light the supply and demand gap in the health organizations manpower. Any manpower gap identified whether shortfall or surplus is a situation which needs to be resolved by management accordingly in order to ensure proper functioning of health institutions. The exercise must take cognisance of prevailing WHO norms on specific health manpower population ratios. 3.3 Health Manpower Planning Methodology. There are different methods of estimating manpower requirements. One of such methods is the familiar manpower/population ratio, in which the total staff requirements are determined by applying the desired staff to population ratio to the population base to be served. The basic data needed for ratio method are existing manpower supply of the types being considered, normative ratio to be used e.g. WHO recommended standards and the projected population worked out in the following mathematical formula desired type of staff to population and determined by population base e.g. One nurse to 2000 people in a population of 2, 000,000 people will translate to 1:2000 = 1 x 2,000.000 2, 000,000 2000 1 = 1, 000 Nurses.
This method can be applied to other types of staff and spread over target years in the plan as illustrated below bearing in mind the annual growth rate of 3.5%
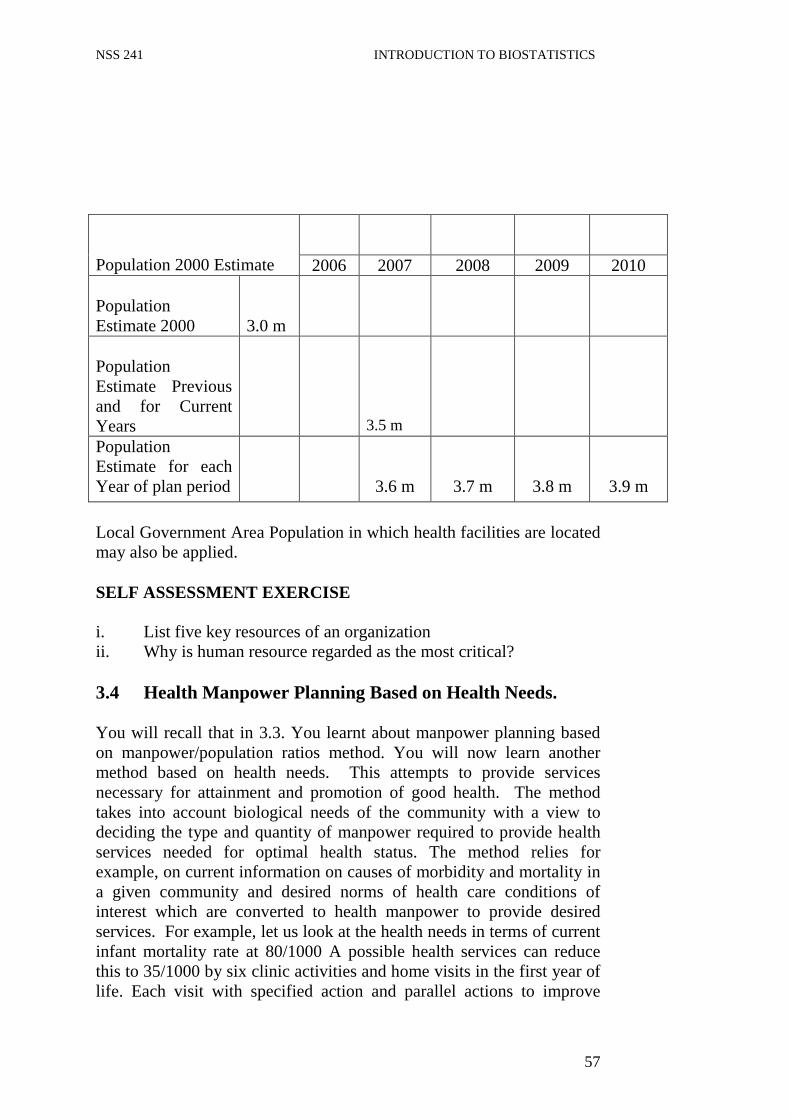
NSS 241 INTRODUCTION TO BIOSTATISTICS
57
Population 2000 Estimate
2006 2007 2008 2009 2010 Population Estimate 2000
3.0 m
Population Estimate Previous and for Current Years
3.5 m
Population Estimate for each Year of plan period
3.6 m
3.7 m
3.8 m
3.9 m
Local Government Area Population in which health facilities are located may also be applied. SELF ASSESSMENT EXERCISE i. List five key resources of an organization ii. Why is human resource regarded as the most critical? 3.4 Health Manpower Planning Based on Health Needs. You will recall that in 3.3. You learnt about manpower planning based on manpower/population ratios method. You will now learn another method based on health needs. This attempts to provide services necessary for attainment and promotion of good health. The method takes into account biological needs of the community with a view to deciding the type and quantity of manpower required to provide health services needed for optimal health status. The method relies for example, on current information on causes of morbidity and mortality in a given community and desired norms of health care conditions of interest which are converted to health manpower to provide desired services. For example, let us look at the health needs in terms of current infant mortality rate at 80/1000 A possible health services can reduce this to 35/1000 by six clinic activities and home visits in the first year of life. Each visit with specified action and parallel actions to improve

NSS 241 INTRODUCTION TO BIOSTATISTICS
58
physical environment of the children will translate to required manpower using the following formula: M = Px1x N x T
S Where: M = Manpower requirement in a year
P = Projected population at risk I = Number of rate N = Average number of given kind of service T = Average time a service takes S = The total time taken by practitioner
3.5 Manpower Planning Based on Service Target This method is similar to health needs except that it concerns itself with factors such as the public want of health services, priority health services, political views, costs, efficiency of services delivery, effects segment of population served accessibility and administrative feasibility. Like other methods, it also draws from population estimates and projections as well as current and future estimates of productivity which is converted to manpower requirements. Take for example a hospital of 80 beds capacity consisting of four wards of 20 beds each. Our service target is to provide nursing care twenty four hours, seven days a week for one year covering all the four wards. Minimum of three nurse s are needed to run three shifts i.e. 3x4 = 12 Nurses x 365 days = 4380 days per year. In order to estimate number of Nurses required bearing in mind that not everyday of the year is actually a working day the following procedure may be adopted.
365 days in a year
● minus 104 Work free days per year 261
● “ 21 Annual leave 216 240 ● minus 10 sick leaves
● “ 7 Public holidays 206 233 available working times for a nurse per year ● “ 7 Casual leave 226 ● “ 10 Training period Therefore 4380 divided by 206 =21 nurses will be required to provide the nursing care target.
By the same token, the number can be modified on the basis of shift workload and availability of other senior nurses who are involved in administrative duties. For example Am or 1st shifts usually have the

NSS 241 INTRODUCTION TO BIOSTATISTICS
59
heaviest workload as well as staffing complement in a hospital, followed by 2nd shift and lastly the 3rd shift. Therefore for the same hospital of four wards to provide hypothetical service coverage and converting services to manpower estimates as follows:
Wards 1st shift 2nd shift 3rd shift Male 1 1 Female 1 1 Children 1 1 Maternity 1 1 1 TOTAL 4 3 2
= 9 manday x 365 = 3285 days Therefore: 3285 divided by 206 =16. It follows that one matron and one assistant plus 16 nurses are required for the services envisaged. It is important to note that manpower requirement varies from hospital to hospital depending on factors such as:
● Geographical location ● Intensity of acute care ● Complexity of sickness presented ● Health facility utilization etc. 3.6 Manpower Planning Based on Health Demands Determination of manpower requirements here is based on likely future demand for services by the population and its ability to pay for such services. It is derived from the current use of the services and patterns of socio economic growth of the population. Data are derived from demographic characteristics of the population e.g. sex, age, income level, urban / rural etc current and projected productivity of man-power in different types of work situation and current use of services available according to diverse population characteristics. It will be observed that all the four methods considered above have areas of overlapping in their application drawing data from population and demographic and biostatistical sources. However health manpower planning should be undertaken by health planners providing basic guidelines, health administrator who utilize the manpower and educators in training institutions who produce the manpower.

NSS 241 INTRODUCTION TO BIOSTATISTICS
60
3.7 Health Manpower Supply This has to do with forecasting the future health manpower supply or availability in right quantity and quality at the right time. It is equal to staff in post minus leavers plus joiners putting it in a nutshell. A Where and how to start? (1) Identification of manpower problem (2) Establish data bank (3) Establish national standard for staffing (norms) (4) Undertake utilization studies (5) Make simple projections for the future supply and future
requirement (6) Undertake manpower planning for a specified period say one
year. (B) Information required for supply planning (1) Number of existing staff by type of staff. (2) Number of staff by type of staff and location as well as facility. (3) Age of staff by staff type (4) Number of leavers by staff type (5) Age distribution of pre- retirement leavers (6) Sex of pre-retirement leavers. (7) Reasons for leaving (8) Numbers of moves (in and out) by staff type (9) Number of new graduates (10) Ratio of graduates to entrants (11) Ratios of graduates to recruits (12) Deaths, discharges through sickness etc
(C) Determination of loss through: (1) Retirement cadre by cadre by age (2) Pre-retirement by age (3) Examine the rate over 2-3 previous years (4) Death records (5) Inter-state transfers by category (6) Resignations (7) Permanent /Temporary losses via maternity leaves, study leaves,
training leaves, leaves of absence etc. (8) Movement to private sectors following further academic works.
(D) Determination of health manpower increments. (1) Number of new entrants to training institutions (2) Loss rate in training by type of training, who are those that drop
out or fail? (3) How many graduates each year excluding losses?
NSS 241 INTRODUCTION TO BIOSTATISTICS
61
(4) What are the losses between graduation and employment or induction?
(5) Inter –state transfers, inter-service transfers? (6) Transfers from private to public sector. (7) Return from leaves.
In all aspects of health manpower planning the following are essential resources:
● Personnel of right quality and quantity ● Materials and equipment. ● Funds ● Constant information flow reliable biostatistics. 4.0 CONCLUSION The workforce of every organization is crucial to the success or otherwise of such organization. It is important to have the right quality and quantity of staff at the right time for the job to be done well. Manpower planning therefore should form an integral put of the entire organizational structure. You have equally learnt in this unit the nitty - gritty of health manpower planning such as why and how to go about it. 5.0 SUMMARY In this unit you learnt that of all the resources employed by organization, manpower or workforce or human resource is of great importance because it controls other resources to a great extent. It follows therefore that in health organizations, manpower should be given adequate attention in its planning, its demand and supply. The right calibre of staff in right quantity and quality at the right time should be the watch word for the success of health care delivery services. You learnt also a few methods of health manpower planning as well as demand and supply of health manpower. Constant information flow, reliable statistics, funds, materials and equipments are essential resources to all aspects of health manpower planning. ANSWER TO SELF ASSESSMENT EXERCISE i. Manpower, material, money, management and method. ii. Because human resources control and operate others. Its quality
and quantity therefore determine the success or failure of the organization.

NSS 241 INTRODUCTION TO BIOSTATISTICS
62
6.0 TUTOR-MARKED ASSIGNMENT 1. Describe health manpower planning 2. List 5 ways of
(a) Gaining manpower (b) Losing manpower
7.0 REFERENCES/FURTHER READINGS Edwards J. et al, (1983) Manpower Planning. Hornby P. et al, (1980) Guideline for Health manpower
Planning, WHO.
Yissa S, S. (1985) Conceptual Framework of Policy, Planning and Management (Health Sector).

NSS 241 INTRODUCTION TO BIOSTATISTICS
63
MODULE 3 Unit 1 History of Health Development Plans in Nigeria Unit 2 Immunization Statistics and Trend of Diseases Unit 3 Management of Health Information (Statistics) Unit 4 Guinea Worm infection Statistics UNIT 1 HISTORY OF HEALTH DEVELOPMENT
PLANS IN NIGERIA CONTENTS 1.0 Introduction 2.0 Objectives 3.0 Main Content
3.1 First Development Plan 3.2 Goals of Health Plans. 3.3 Emergence of National Health Policy 3.4 Health Sector Reforms 3.5 The Millennium Development Goals
4.0 Conclusion 5.0 Summary 6.0 Tutor-Marked Assignment 7.0 References/Further Readings 1.0 INTRODUCTION
There have been national socio-economic development plans in Nigeria. Planning for health care delivery services in Nigeria has equally been an integral part of the national development plans. It follows therefore that whatever problems and difficulties may have bedevilled /affected health care plans ought to be examined with a view to proffering solution to such problems. In this unit we shall examine the history of health care development plans in Nigeria both in the pre – and post -independence periods.
2.0 OBJECTIVES
At the end of this unit, learners should be able to:
● Have knowledge of evolution of health plans in Nigeria. ● Appreciate efforts of successive governments in Nigeria
regarding health plans ● Be aware of the Health sector reforms of the present
administration ● Have good knowledge about the Millennium Development Goals.
NSS 241 INTRODUCTION TO BIOSTATISTICS
64
3.0 MAIN CONTENT 3.1 First Development Plan The first ever formal pre-independence governmental planning for provision of health services for Nigeria population dates back to 1946. The then unitary colonial Government of Nigeria produced a health plan along with other sectors in a ten year plan spanning 1946 – 1956 (Harkness – Walker Plan). There have been other development plans since independence in 1960 with ambitious and laudable provisions for the health sector. They include:
● Ten year Pre – independence plan 1946 – 1956 ● 1st National Development Plan 1962 – 1968 ● 2ndNational Development Plan 1970 – 1974 ● 3rd National Development Plan 1975 – 1980 ● 4th National Development Plan 1981 – 1985 The 5th plan 1986 – was launched between the mid and late eighties and for the first time ever against the background of a National Health Policy. Almost all the previous plans referred to had to be revised at one time or the other as a result of constitutional, political and economic exigencies. These factors had their effects also on the health care plans as an integral part of the National development plan. 3.2 Goals of Health Plans There is ample evidence to show that successive governments in Nigeria has underscored the importance of good health to the citizens. They have also accordingly attempted health plans to meet such goals, of providing good health service to the population and by extension to the socio-economic development of the nation. It is said often and often that only healthy people can make meaningful contributions to socio-economic and even political development of the nation. This philosophy is reflected in the fact that all the aforementioned health plans emphasized the following key areas: ● Establishment and expansion of health institutions in all parts of
the country to ensure 80-100% coverage in foreseeable future. ● Development and training of health staff of all categories ● Control or eradication of communicable diseases. ● Equitable distribution of health institutions and personnel to
ensure even provision of high quality care to the people. ● Provision of comprehensive health care services within the
framework of basic health service schemes.

NSS 241 INTRODUCTION TO BIOSTATISTICS
65
● Provision of primary, secondary, and tertiary health care at various levels of health clinics, hospitals, and specialist and or teaching hospitals.
● Establishment of efficient management and utilization of health institutions by establishing management boards etc.
3.3 Emergence of National Health Policy Between the mid and late eighties witnessed significant strides in the health care planning for Nigeria. This was the period the National Health Policy was introduced to guide and direct health activities in the nation. It has primary Health Care as the strategy for achieving health for all Nigerians by year 2000 and beyond. Although the policy has undergone some modifications and reforms under successive governments, it has the following goals predicated on the Alma Ata declaration to be a level of health that will enable all Nigerians to achieve socially and economically productive lives. The national health systems shall be based on primary health care. The primary health care shall include:
● Education concerning preventing health problems and the
methods of preventing and controlling them. ● Promotion of food supply and proper nutrition. ● An adequate supply of safe water and basic sanitation. ● Maternal and child health care including family planning. ● Immunization against the major infectious diseases. ● Prevention and control of locally endemic and epidemic diseases. ● Appropriate treatment of common diseases and injuries. ● Provision of essential drugs and supplies. ● Maintenance of mental health. A few questions come to mind readily as to how far we have come as a Nation in the last five to six decades of health polices and plans around these laudable goals? What are the basic problems associated with our health policies, plans and implementation methods over the years that still make the state of health care services in Nigeria to be unsatisfactory not-withstanding modest achievements recorded here and there? We need good statistics and information on the current indicators to take up the challenges still facing us in the health sector.
SELF ASSESSMENT EXERCISE List four common areas emphasized by past health plans. 3.3 Health Sector Reforms and Millennium Development
Goals

NSS 241 INTRODUCTION TO BIOSTATISTICS
66
Against the background of inadequacies in our health care system, the present administration since its inception has embarked on various reform programmes in the public sector. The health reform is described as a broad based purposeful and sustainable fundamental change in the function, structure, and performance of health systems (i.e. vision, policies, legislation institutional arrangement, organization, plans, programmes and projects) in order to deliver efficient, quality, affordable, accessible effective and equitable health care services to the populace and ultimately improve the health status of the people (FMOH, 2004). We need a sound health reform in Nigeria because many of our people especially women and children as well as the poor in our society die from avoidable and preventable health problems such as infectious diseases, malnutrition, complications at pregnancy and childbirth. Available data have shown that health service in Nigeria has suffered from decades of neglects, endangering the nations health. It is also on record that Nigeria ranked 187th in position among the 191 member states by the World Health Organization in 2000. Health status indicators are worst than the average for sub-Saharan Africa. For example, infant mortality rate is 115/1000, under five mortality rate of 205/1000, and maternal mortality ratio 948/100,000 is one of the highest and unacceptable to government of Nigeria. Most of these deaths are due to acute respiratory infections, malaria, measles, diarrhoea, Tuberculosis, and HIV/AIDS and sexually Transmitted infections. They have adverse effects on socio-economic development and school attendance. They are also preventable diseases that a well organized health system and active participation of communities can control to a point where they cease to be of public health importance any longer. 3.5 The Millennium Development Goals The Millennium Development Goals summarize the development goals agreed on at international conferences and world summit in the 1990s. In September 2000, however world leaders gathered in New York and condensed the key goals and targets into the Millennium Declaration. Based on this declaration, UNDP and other United Nations Department, funds, and programmes have come together to evolve a concise and quantifiable set of goals, targets and indicators that will be used to assess progress. This is what has culminated into what is now known as the Millennium Development Goals, which include eight goals, 18 targets, and 48 indicators. The UN General Assembly has approved these as part of the Secretary Generals’ Millennium Roadmap to development. Those that pertain to health directly will be highlighted. The goals are to be achieved between 1990 and 2015.

NSS 241 INTRODUCTION TO BIOSTATISTICS
67
● MDG – 4 - Reduce child mortality from 185/1000 to 50/1000 Target – 5 – Reduce by 2/3 between 1990 and 2015 the less than five mortality rate.
● MDG5 – Improve Maternal Health. 980/100,000 Target 6 – Halve by 2015
● MDG 6 – Combat HIV/AIDS, malaria and other diseases Target 7 – Have halted by 2015 and begin to reverse the spread of HIV/AIDS Target 8 – Have halted by 2015 and begin to reverse the incidence of malaria and other major diseases.
● MDG 7 – Ensure environmental sustainability Target 9 – integrate the principles of sustainable development into country policies and programme and reverse the loss of environmental resources. Target 10 – Halve by 2015 the proportion of people without sustainable access to safe drinking water and basic sanitation.
4.0 CONCLUSION In this unit you have learnt about the history of health plans in Nigeria before and since independence. The recycling goals, of these plans were also discussed. We also examined the efforts of successive administrations to improve and build on previous health foundations. However, there is still room for improvement in the health care system and delivery in the country. Reforms and Millennium Development goals are the current steps being taken to face the challenges in the health sector within the framework of other sectors.
5.0 SUMMARY This unit introduced the evolution of Health development plans in Nigeria since 1946. Five of such plans were highlighted followed by the introduction of a national Health Policy to guide subsequent health plans. Health sector reforms and the millennium development Goals of the present administration were also examined. ANSWER TO SELF ASSESSMENT EXERCISE ● Establishment and expansion of health institutions, ● Development of training institutions, ● Equitable distribution of health facilities and personnel. ● Provision of Primary, Secondary, and Tertiary health care
facilities.

NSS 241 INTRODUCTION TO BIOSTATISTICS
68
6.0 TUTOR-MARKED ASSIGNMENT Describe the Health Sector Reform of the Federal Ministry of Health. 7.0 REFERENCES/FURTHER READINGS FMOH – (1988) National Health Policy Abuja FMH. F.G.N – Millennium Development Goals. FMOH – (2004) Health Sector Reform Document Abuja FMH. Yissa S.S, (1985) Conceptual Framework of Policy, Planning and
Management. (Unpublished paper) University of Aston in Birmingham. U.K.

NSS 241 INTRODUCTION TO BIOSTATISTICS
69
UNIT 2 IMMUNIZATION STATISTICS AND TREND
OF DISEASES CONTENTS 1.0 Introduction 2.0 Objectives 3.0 Main Content
3.1 Nigeria on the Global Village Map 3.2 National Health System 3.3 Historical Development of Immunization in Nigeria 3.4 Review of Immunization 1995-2000 3.5 Five Year Strategic Immunization Plan 2001-2005
4.0 Conclusion 5.0 Summary 6.0 Tutor-Marked Assignment 7.0 Reference/Further Readings 1.0 INTRODUCTION Nigeria is a signatory to the declaration of the survival, protection and development of children which was articulated at the 49th World Assembly in 1988 and reinforced by the World Summit for children held in New York in 1990. This declaration established challenges for global immunization which includes eradication of the poliovirus from the world by the year 2000. One major step taken by the country in 1997 towards achieving this goal was the reformation and restructuring of the then Expanded Programme on Immunization (EPI) renaming it as National Programme on Immunization (NPI). A lot of efforts had been made since then to rid this nation of polio virus and other vaccine preventable diseases. However, immunization coverage for the vaccine preventable diseases have remained low disease surveillance is inadequate and the immunization services delivery system is poor. 2.0 OBJECTIVES After going through this unit learners should be able to:- ● Distinguishing between EPI and NPI ● State the circumstance that gave birth to NPI ● Appreciate the importance of statistics to reporting progress of
programme

NSS 241 INTRODUCTION TO BIOSTATISTICS
70
● Appreciate progress made so far towards eradication of polio virus and other vaccine preventable diseases in Nigeria.
● Have awareness on the trend of certain diseases in Nigeria
3.0 MAIN CONTENT 3.1 Nigeria on the Global Village Map The entire world has been described as a global village. Nigeria is a member of this village. It is situated along the West Coast of Africa with the surface area of 932,678 square kilometres and lie between longitude 30 and 140 east of the Greenwich Meriden and latitude 40 and 140 north of the Equator. The climate conditions divided the country into mangrove swamps and rainforests in the South, savannah region in the middle belt and Sahel in the far North. Nigeria population estimate in 2006 was put at 140,000,000 plus. In 2001, the population was estimated to be 118,800,696 based on the 1991 population census with an annual growth rate of 3.0%. Nigeria’s discovery of petroleum in the 70s increased the GNP by over 30%. However this increase coincided with the population increase causing only 2% increase in the GNP in more than 20 years. The country has a Federal system of government consisting of a central administration in Abuja, 36 states and 774 local government areas which are further divided into districts. The entire country is divided into six geo-political zones that consist of 5 – 7 States. 3.4 National Health System The National health system is based on primary health care of which immunization is a key component as stated in the National Health Policy. The health sector reform plan of action as well as the millellium development goals has eradication, elimination and control of childhood and vaccine preventable diseases through adequate immunization services as some of the objectives. Provision of health services is shared among the three tiers of government – Federal, State and Local. In addition, International agencies, private sectors and non-governmental organizations are involved in line with the national health policy. It is also estimated that the private sector provides health services up to 30 to 40 percents of the population including immunization services. Infant mortality rate of 105/1000 live birth and life expectancy of 52 years or 49 year for women and men respectively are of great concern. 3.3 Historical Development of Immunization in Nigeria Historically, immunization services were initiated in 1979 under the EPI. In 1997 EPI transferred to NPI and was established as a parastatal

NSS 241 INTRODUCTION TO BIOSTATISTICS
71
under FMOH. It has the responsibility to effectively control through immunization and provision of vaccines the occurrence of the following diseases:- ● Tuberculosis ● Poliomyelitis ● Diphtheria ● Whooping cough ● Neonatal tetanus ● Measles ● Yellow fever ● Cerebrospinal meningitis ● Hepatitis B and any other disease as epidemiological evidence
may deem necessary. Inspite of commendable efforts made and achievements recorded so far, there is still a long way to go to improve immunization services in Nigeria.
SELF ASSESSMENT EXERCISE Criticise the following statement. ‘However immunization coverage for the vaccine preventable diseases has remained low, disease surveillance is inadequate and the immunization services delivery system is poor’.
3.4 Review of Immunization 1995 - 2000 Early in the year 2000, the NPI felt the need to go back to the drawing board. A situation analysis and problem statement was to be redefined aimed at improving immunization services in the country. An external consultants meeting was conducted with the participation of partners agencies including the WHO, UNICEF, USAID, Dept of International Dev. (DFIDA) Center for Disease Control and Prevention (CDC) Rotary International, John Hopkins University (JHU) and the Christian Health Association of Nigeria (CHAN). The goal of the exercise was to identify priority areas where improvements were needed and to recommend or/suggest solutions to the NPI. Consequently field units to sleeted States (Samples) were organized to collect information on vaccines management, cold chain, logistics and immunization service delivery using standardized data collection instrument at Central, State, LGA and health facility levels. Following this exercise and in response to their recommendations in Sept 2000 a rapid assessment of the immunization services at the health facility level was conducted. These assessments revealed a number of problems/weaknesses within the immunization programme as shown in the following tables.

NSS 241 INTRODUCTION TO BIOSTATISTICS
72
Table 1 Reported Routine Immunization Coverage (%) 1995-
2000.
Source: NPI/FMOH As shown in table 1, immunization coverage is low due to the following factors:- ● Lack of proper planning at State and Local Government level. ● Lack of up-to-date national immunization policy and guideline at
the service delivery points, ● Decreasing motivation of health workers, ● Poor quality of services, ● Frequent stock-out of vaccines at LGAS and health facility
levels, ● Low demand for services from the community etc. Table 2 Summary of Vaccine Preventable Diseases 1995-2000. Diseases/causes per year
1995 1996 1997 1998 1999 2000 *NA
Pertusis 13639 26745 33729 49550 50039 Diphtheria 1556 2768 3285 6071 3996 Measles 49880 59134 73735 164069 215955 AFP Cases 513 1237 991 Polio Confirmed Cases
53 95 25
Yellow Fever 25 Neonatal Tetanus 1064 1550 1086 1806 1669 C/Meningitis (CSM) 7378 108991 39973 10793 4586 Sources: NHMIS/FMOH
Table 2 gives us information about the trend of vaccine preventable diseases during the period under review i.e. 1995-2000. There are no specific goals highlighted against which the figures can be compared. Nevertheless there is great evidence from the data presented that the challenges are enormous calling for serious attention.
1995 1996 1997 1998 1999 2000 *NA BCG 42 36 29 33 13 DTP3 32 20 21 26 19 OPV3 29 21 25 27 23
Measles 41 32 37 57 26 TT2+ 34 38 23 41 30

NSS 241 INTRODUCTION TO BIOSTATISTICS
73
3.5 Five Year Strategic Immunization Plan 2001-2005 Against the background of data in table 2of 3.4, NPI embarked on a 5 year National Strategic Plan spanning 2001 to 2005. The goal is to provide sustainable immunization services that reach every child in Nigeria in order to reduce morbidity and mortality due to vaccine preventable diseases. Specific objects of the programme are: ● To achieve polio eradication by the year 2002, ● To eliminate maternal and neonatal tetanus by the year 2005 ● To reduce measles morbidity by 90% and mortality by 95% by
2005 ● To improved routine immunization service delivery to achieve
80% coverage by 2005. ● To introduced new and under utilized vaccines including
Yellow fever. Hepatitis B and Haemophilus Influenza type b vaccines. Specific targets were set as shown in table 3 and 4 based on official population figures derived from the projections of the 1991 population census for planning purposes. The figures were obtained from the National Population commission. Table 3 Target Population 2001 2002 2003 2004 2005
Total Population 118800696 122443748 126152844 129927452 133766926
Children 0-11mons 4752028 4897750 5146144 5197099 5350678
Children 0-59mons 23760140 24488750 25230569 225985491 26753386
Children 6-59mons 21384126 22039875 22707513 23386942 24070847
Pregnant women 5940035 6122188 6307643 6496373 6688347
Women of child-bearing age 15-49
26136154
26937645
27753626
28584040
29429724
Sources: National Population Commission.

NSS 241 INTRODUCTION TO BIOSTATISTICS
74
Table 4 Targets for Immunization
Reports and records show that tremendous effects achievement have been recorded here and there. However Nigeria still remains polio endemic along with few other Asian and sub-Saharan countries.
4.0 CONCLUSION
This unit brings into focus the importance of statistics to immunization services as important element of primary health care delivery system. Complete and reliable figures are necessary to enable us know how well we are doing in the area of eradication of polio and reduction in the prevalence of vaccine preventable diseases in Nigeria.
5.0 SUMMARY
You have learnt in this unit the place of Nigeria on the global village map and also as stakeholder in the global initiative for child survival, protection and development. Some progress has been made over the years but there are still challenges in the area of polio eradication and reduction of morbidity and mortality caused by vaccine preventable diseases especially among children and women.
ANSWER TO SELF ASSESSMENT EXERCISE
The statement is a true reflection of state of immunization in the country. However, it would have been more meaningful if data or statistics are provided to support the low, inadequate and poor levels of the exercise.
6.0 TUTOR-MARKED ASSIGNMENT
List four factors responsible for low immunization coverage in Nigeria between 1995 and 2000.
7.0 REFERENCE/FURTHER READINGS FMOH/NPI (2001) 5Year National Strategic Plan Abuja, FMH.
2000 2001 2002 2003 2004 2005
BCG 45% 50% 60% 70% 75% 80%
OPV3 routine
38% 45% 55% 65% 75% 80%
DTP3 38% 45% 55% 65% 75% 80%
Measles 30% 40% 55% 65% 77% 89%
TT2+ 35% 45% 60% 70% 75% 80%

NSS 241 INTRODUCTION TO BIOSTATISTICS
75
UNIT 3 MANAGEMENT OF HEALTH INFORMATION (STATISTICS)
CONTENTS 1.0 Introduction 2.0 Objectives 3.0 Main Content
3.1 Sources of Health Information 3.2 Health Information Flow and Management 3.3 National Health Information 3.4 Health Information Management Acute Renal Failure
Outbreak 4.0 Conclusion 5.0 Summary 6.0 Tutor-Marked Assignment 7.0 References /Further Reading 1.0 INTRODUCTION In unit 12 we stressed the importance of reliable health statistics to immunization activities just like other health activities. Information is power. Reliable and timely data play crucial role in making or marring decision making and policy formulation. Our sources of health data grapple with several problems especially incompleteness making data incomprehensive. The bulk of health statistics come from Federal State and local government owned health facilities. These institutions account for 60 – 70% of health services available to the populace. Privately owned health facilities are estimated to cater for 30-40% of health needs of the population. These figures and contributions cannot be ignored. Unfortunately health information from these facilities is not easy to come by. It follows therefore that computation of available data becomes incomplete and incomprehensive. This situation will continue to adversely affect the quantity and quality of analysed product until a system is put in place which will allow free flow of information between public and private health care facilities. All said and done proper management of health information available is critical and calls for careful attention including data from traditional practitioners. This is the focus of this unit. 2.0 OBJECTIVES After going through this unit learners should be able to: ● Identify major sources of health statistics

NSS 241 INTRODUCTION TO BIOSTATISTICS
76
● Appreciate problems of sourcing health information from private health facilities,
● Appreciate the need for completeness and timeliness of health data collection and reporting
● Identify problems associated with data collection. 3.0 MAIN CONTENT 3.1 Sources of Health Information Health data and situation reports on selected diseases are compiled from information received from health institutions and organizations. Similarly, reports on issues of public health significance such as paracetamol syrup poisoning outbreak, new immunization policies and strategies, highlights of international primary health conferences, health reforms and millennium development goals are veritable sources of public health information. In order to attain the lofty goals set in the health sector, we must be able to control communicable and non-communicable diseases in appropriate and affordable ways. Factors militating against achievement of desired progress include:
● Lack of awareness ● Inadequate information on the problem posed by communicable
and non-communicable diseases ● Constraints on human and material resources, ● Ineffective and unreliable mechanics of data collection, analysis
and retrieval. ● Information on disease trend is not exchanged among all health
institutions in the Federation. ● Lack of full cooperation of all persons and organizations
concerned with health care delivery services ● Late reporting ● Incomplete reporting etc.
3.2 Health Information Flow and Management It has been said repeatedly that, information flow is very important especially when it is properly managed. Health data are collected from health facilities and are supposed to be channelled to the States through local government offices. The States compile the data and forward them to the Federal Ministry of Health for further action and necessary feedback. Problems usually encountered include ● Under reporting of diseases and immunization coverage. ● Lack of standardization in some cases. ● Absence of data collecting forms at the health facility level

NSS 241 INTRODUCTION TO BIOSTATISTICS
77
● Lack of knowledge on the use of the forms ● Over reporting in some local government areas. It is important to note again that disease information and vaccine coverage for children and others attended to by the private sector institutions is hard to collect and almost not included in the National figures computed. This may skew the problems and lead to incorrect assessment of the public sector services since the private sector serves a relatively big portion of population. The role of traditional practitioners should also not be ignored. The apparent secretary attached to their practice further compound accessibility to information at their end. Table 1 shows the flow of health information up and down the hierarchy. Table 1 Flow of Health Information for Disease notification 1st tier Lg, State, va, Missions,
comm. etc
2nd tier 3rd tier 4th tier Source: NIGERIA BULLETIN OF Epidemiology, VOL 1 1991 Let us now look at the key duties of each tier in Table 1. 1st tier Facility level ● Compile data on standard forms ● Use data for decision making at the local level. 2nd tier – Local Government level ● Receive and collect forms from 1st tier ● Collate and forward to SMOH Epid unit ● Analyse and feed-back to 1st tier and to and to the public 3rd tier – State Government Level
Peripheral Health Institutions
Local Govt. Headquarters LGA Health Dept. State Health Office
State MOH Epidemiological Unit
FMOH Epidemiological Division
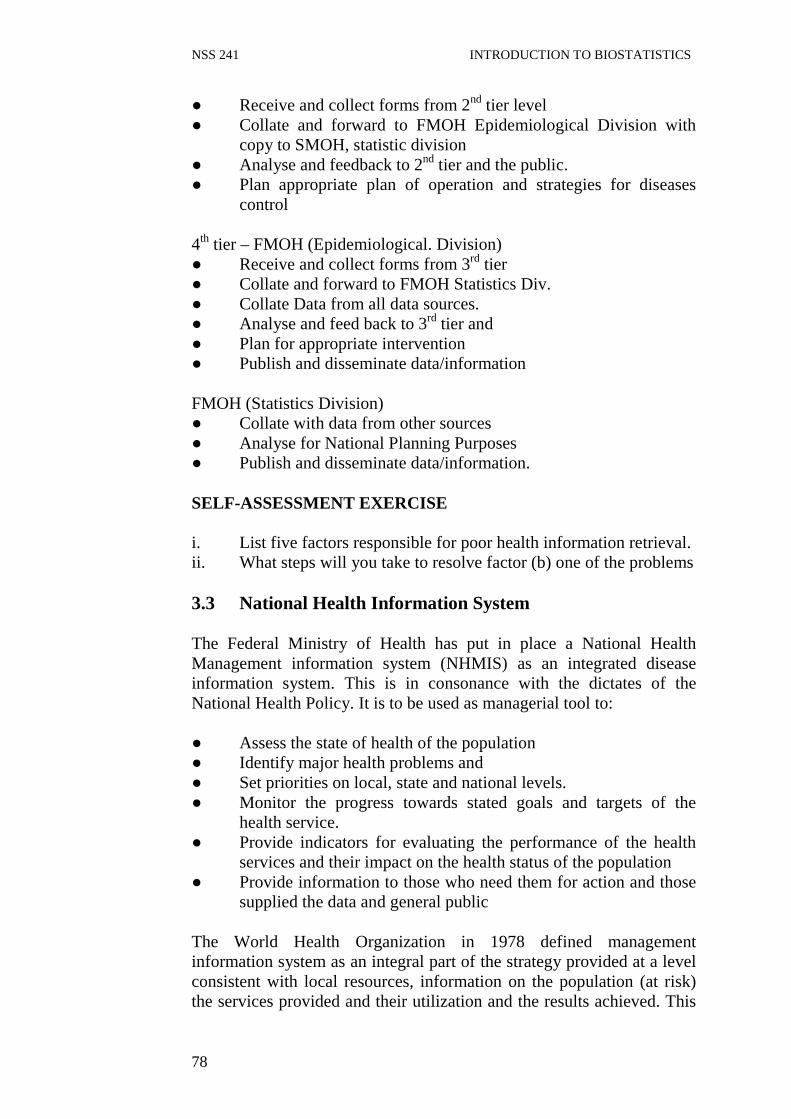
NSS 241 INTRODUCTION TO BIOSTATISTICS
78
● Receive and collect forms from 2nd tier level ● Collate and forward to FMOH Epidemiological Division with
copy to SMOH, statistic division ● Analyse and feedback to 2nd tier and the public. ● Plan appropriate plan of operation and strategies for diseases
control 4th tier – FMOH (Epidemiological. Division) ● Receive and collect forms from 3rd tier ● Collate and forward to FMOH Statistics Div. ● Collate Data from all data sources. ● Analyse and feed back to 3rd tier and ● Plan for appropriate intervention ● Publish and disseminate data/information FMOH (Statistics Division) ● Collate with data from other sources ● Analyse for National Planning Purposes ● Publish and disseminate data/information. SELF-ASSESSMENT EXERCISE i. List five factors responsible for poor health information retrieval. ii. What steps will you take to resolve factor (b) one of the problems
3.3 National Health Information System
The Federal Ministry of Health has put in place a National Health Management information system (NHMIS) as an integrated disease information system. This is in consonance with the dictates of the National Health Policy. It is to be used as managerial tool to: ● Assess the state of health of the population ● Identify major health problems and ● Set priorities on local, state and national levels. ● Monitor the progress towards stated goals and targets of the
health service. ● Provide indicators for evaluating the performance of the health
services and their impact on the health status of the population ● Provide information to those who need them for action and those
supplied the data and general public
The World Health Organization in 1978 defined management information system as an integral part of the strategy provided at a level consistent with local resources, information on the population (at risk) the services provided and their utilization and the results achieved. This

NSS 241 INTRODUCTION TO BIOSTATISTICS
79
knowledge can be used to extent coverage, to change practices, to reallocate resources and to monitor consequences of such improvement. It may not be of place to say that decision makers within the health and social welfare fields require information about the health of the population/community they claim to serve. In the same vein MIS can be used to assess the impact of decisions to develop a data base for decision making, public information, to appraise the need for allocation of resources, to assist in determining priorities for illustrative purposes, planning, finance control, problem identification and many other purposes (Gordon Davis/Okani). Notable features of Health Information System include: ● Usefulness – information helps to assess and to improve efforts to
control diseases ● Simplicity – reporting methods should be appropriately detailed
functional and clear. ● Flexibility – reporting responses to changing disease patterns and
priorities, ● Completeness – data allocation is complete or where appropriate
representative. ● Accuracy – sensitivity and specificity are very high. ● Timeliness – forms are promptly submitted at all levels, promptly
analysed and feedback provided.
3.4 Health Information Management Acute Renal Failure Outbreak
Let us revisit the case of acute renal failure secondary to ingestion of adulterated Paracetamol Syrup in Oyo and Plateau States between June and September 1990 and see how the principles highlighted above applied to MIS. Between June and September 1990, at least 111 children died of acute renal failure after ingesting paracetamol syrup containing the potent toxin diethylene glycol. This chemical was used as a solvent in the preparation of paracetamol syrup instead of the proper ingredient propylene glycol. Cases of renal failure occurred in Oyo and Plateau State involving children between six months and six years of age. Acute renal failure occurred in children who had been given paracetamol syrup prepared at two hospital pharmacies under the supervision of qualified pharmacists. All affected children had a history of a previous minor illness which was treated with paracemetamol syrup. In both Plateau and Oyo States cases of renal failure were seen soon after the involved hospitals pharmacists began to dispense newly prepared paracetamol syrup. The “propylene glycol” was obtained from local chemist shops which had got their supply from shops in Onitsha, Anambra State. The substance sold by the Onitsha traders as ‘propylene glycol’ was in fact diethylene gloycol which had been diverted from oil drilling sites run by

NSS 241 INTRODUCTION TO BIOSTATISTICS
80
multinational companies. These companies had legally imported diethylene glycol for their legitimate drilling operations. Laboratory analyses showed that diethylene glycol was present in the syrup remaining in bottles given to children who died in samples of ‘propylene glycol’ from the hospital pharmacies and the material seized from traders in Onitsha by the Task Force on Fake and Counterfeit Drugs, Food and Drug Administration and Control, FMOH. On the receipt of information the FMOH responded to the outbreak as follow: (i) Banning the use of paracetamol syrup (ii) Surveillance to identify new cases (iii) Community outreach to remove unused medications from homes (iv) Investigation and tracing the sources of the toxin. (v) Seizure of 348 gallons of diethylene glycol which could have
been used for future batches of the pcm syrup. (vi) Arrest of persons in Onitsha and Port Harcourt for involvement in
the sale of diethylene glycol requiring that manufacturers demonstrate that propylene glycol used by them is genuine.
Histogram showing cases of Acute Renal Failure by week of onset of Anuria, Plateau and Oyo State, May to Sept. 1990
Based further investigation it was clear that in Nigeria, the sale of chemicals, including poisons are not adequately monitored or controlled. There also exist no adequate control and supervision of personnel’s in some of the places where pharmaceutical products are prepared and sold. Another reason is that fake drugs are easily available and are invariably cheaper than genuine ones that are being sold to the public. Furthermore, the oil companies apparently do not have adequate security

NSS 241 INTRODUCTION TO BIOSTATISTICS
81
on their premises to ensure that dangerous chemicals do not get into wrong hands. It was said that in fact there was nothing to prevent incidents like this after this occurring in the future. We have had cases of acid attacks, families wiped off after eating common meals, probably poisoned by toxic chemicals intended to preserve foods or to kill rodents. The rodents having contaminated such food in the store, the food became unsafe for consumption. It was also reported that the only other large outbreak of diethylene glycol poisoning occurred in 1937 in the U.S.A Investigators of that outbreak said that-there is no short -cut from the chemical laboratory to clinic except one that passes too close to morgue. Human lives have been sacrificed by the failure to meet standards of preliminary tests and many more lives will be sacrificed if such standards are not put into effect. 4.0 CONCLUSION Dissemination of correct information on health situation is important and it is a powerful management tool. Information about the quality and of health data can make positive impact on health activities if properly managed. Failure in this area will rubbish all efforts input into information gathering and analysis. 5.0 SUMMARY This unit has taught you about the importance of proper management of health information. Resources that are not properly managed fail to meet the desired goals. You have also learnt in this unit channel of information flow from lower level health facility to the highest level and the need for prompt reporting of data and corresponding prompt action/feedback. ANSWER TO SELF ASSESSMENT EXERCISE i. (a) Absence of data collecting forms,
(b) Lack of knowledge of procedure (c) Lack of motivation due to lack of feedback on previous
reports (d) Under reporting.
ii. Proper training and appropriate education of those responsible for data collection at all levels.
6.0 TUTOR-MARKED ASSIGNMENT Enumerate four measure of intervention taken by FMOH to control outbreak of acute renal failure reported in 3.4

NSS 241 INTRODUCTION TO BIOSTATISTICS
82
7.0 REFERENCES/ FURTHER READINGS FMOH. Feb. (1991) Nigeria Bulletin of Epidemiology, Abuja Vol. 1 Okani, R.C (1992) Concepts, Goals and objective of NHMIS,
Conference paper Abuja

NSS 241 INTRODUCTION TO BIOSTATISTICS
83
UNIT 4 GUINEA WORM INFECTION STATISTICS CONTENTS 1.0 Introduction 2.0 Objectives 3.0 Main Content.
3.1 Guinea Worm Disease 3.2 Intervention Measures 3.3 The case Search.
4.0 Conclusion 5.0 Summary 6.0 Tutor Marked Assignment 7.0 References/Further Readings 1.0 INTRODUCTION The health status of every nation is assessed by several indicators. They include rate of morbidity from common diseases a well as rate of mortality from specific diseases affecting particular age group especially the under –fives. Other indicators include quality of life, life expectancy among male and female population, food availability and security. Guinea Worm infection is a serious health condition which is an indicator of poor source of potable water supply in such community. The importance of water to biological, social and physical well being of nations cannot be overemphasized. In this Unit you will learn about guinea worm infection looking at few statistics. 2.0 OBJECTIVES After going through this unit you should be able to: ● Appreciate the negative effects of guinea worm disease on the
health of a population ● Appreciate the quality and quantity of potable water available to
people, ● Identify the economic and social implications of guinea worm
disease ● Identify the trend of guinea worm disease in Nigeria following
active case search. ● Teach people simple ways of treating water to make it safe for
drinking. ● Educate people in endemic areas on what to do to avoid the
disease.

NSS 241 INTRODUCTION TO BIOSTATISTICS
84
3.0 MAIN CONTENT 3.1 Guinea Worm Disease Guinea Worm disease also known as Dracunliasis is a painful debilitating disease. It can incapacitate affected person for up to twelve weeks with serious consequences for agricultural productivity, school attendance and mothers’ ability to care for her children. The disease is endemic in Nigeria. Consequently the FMOH and Global 2000 established secretariat in 1988 to coordinate the Nigeria Guinea Worm Eradication Programme (NIGEP) The goal was to eradicate Guinea Worm disease by year 1995. Appropriate task forces at National, State and Local Government Levels were established to co-ordinate its activities. NIGER conducted two nation wide surveys to search for active guinea worm cases, to identify all villages affected and to define the extent of the problems in these villages. These searches were done in 1988 and 1989. A third search was in 1990 –1991. The surveys also addressed the data needs of various water projects in support of National directive that all water projects should make endemic villages a priority for water supply. It must be said here with emphasis that infestation of guinea worm anywhere is an indication of POOR sources of potable water supply in that area. The surveys identified villages with active guinea worm cases between July 1987 and June 1988 and between July 1988 and June 1989. Results from 1989 search show more than 640000 guinea worm cases in about 6000 villages as indicated in the table 1. Table 1. Cases of Active Guinea Worm Disease + Endemic Villages, by State. July 1988 - June 1989 STATE No of
Endemic LGA’s
Total No of LGA’s Surveyed
No of Infected Villages 87-88
No of Infected Villages 88-89
No of Cases 87-88
No of Case 88-89
Abuja 6 9 36 21 1,405 779 Akwa Ibom
0 20 0 1 0 6
Anambra 10 29 872 1,185 175,432 233,278 Bauchi 20 20 537 440 13,197 27,131 Bendel 6 20 19 31 21 572 Benue 8 19 146 245 38,317 41,337 Borno 12 24 188 162 5,246 9,374 Cross River
6
8
71
76
10,959
6,700
Gongola 12 21 59 37 319 269
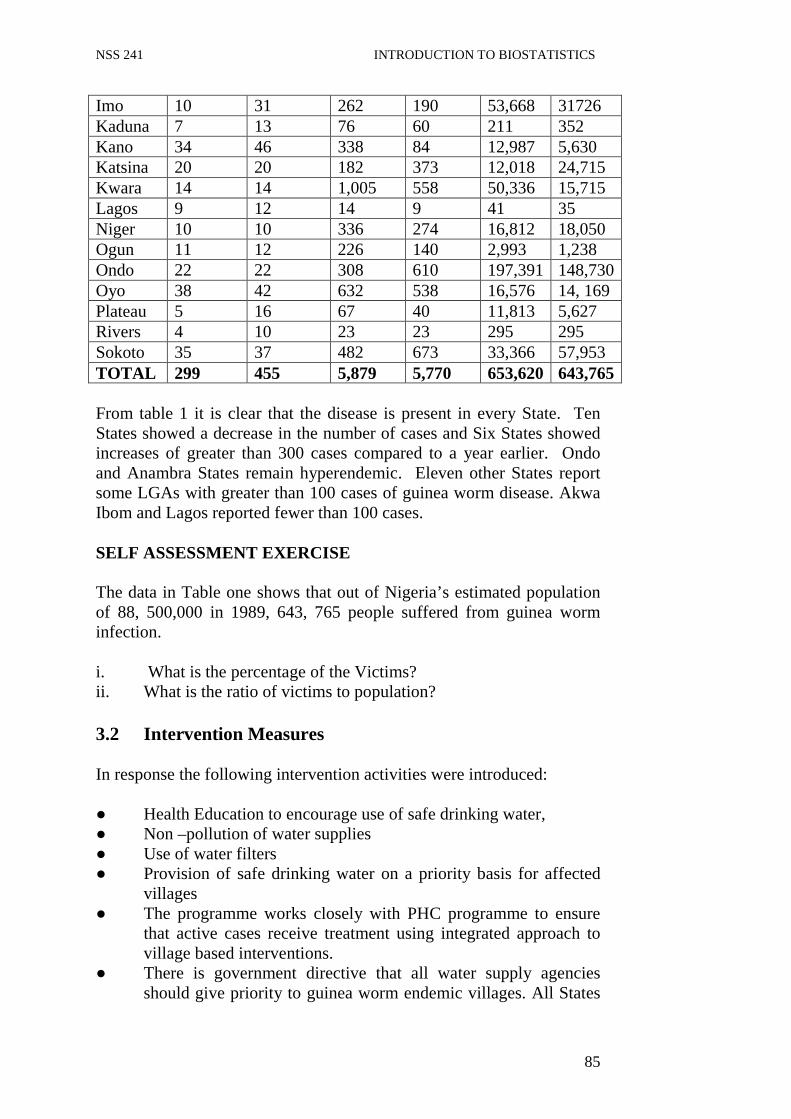
NSS 241 INTRODUCTION TO BIOSTATISTICS
85
Imo 10 31 262 190 53,668 31726 Kaduna 7 13 76 60 211 352 Kano 34 46 338 84 12,987 5,630 Katsina 20 20 182 373 12,018 24,715 Kwara 14 14 1,005 558 50,336 15,715 Lagos 9 12 14 9 41 35 Niger 10 10 336 274 16,812 18,050 Ogun 11 12 226 140 2,993 1,238 Ondo 22 22 308 610 197,391 148,730 Oyo 38 42 632 538 16,576 14, 169 Plateau 5 16 67 40 11,813 5,627 Rivers 4 10 23 23 295 295 Sokoto 35 37 482 673 33,366 57,953 TOTAL 299 455 5,879 5,770 653,620 643,765 From table 1 it is clear that the disease is present in every State. Ten States showed a decrease in the number of cases and Six States showed increases of greater than 300 cases compared to a year earlier. Ondo and Anambra States remain hyperendemic. Eleven other States report some LGAs with greater than 100 cases of guinea worm disease. Akwa Ibom and Lagos reported fewer than 100 cases. SELF ASSESSMENT EXERCISE The data in Table one shows that out of Nigeria’s estimated population of 88, 500,000 in 1989, 643, 765 people suffered from guinea worm infection. i. What is the percentage of the Victims? ii. What is the ratio of victims to population? 3.2 Intervention Measures In response the following intervention activities were introduced: ● Health Education to encourage use of safe drinking water, ● Non –pollution of water supplies ● Use of water filters ● Provision of safe drinking water on a priority basis for affected
villages ● The programme works closely with PHC programme to ensure
that active cases receive treatment using integrated approach to village based interventions.
● There is government directive that all water supply agencies should give priority to guinea worm endemic villages. All States
NSS 241 INTRODUCTION TO BIOSTATISTICS
86
are complying with the directive assisted by national and international agencies.
3.3 The Case Search The third national case search conducted in 1991 provided data from affected villages. On the basis of this specific intervention plans and activities were initiated at village level. Major areas of focus included the following: ● Treatment for infected persons (cleaning and bandaging) ● Health education for infected persons ● Health education for communities to support use of safe drinking
water ● Non – pollution of drinking water ● Use of water filters ● Provision of new safe drinking water sources ● Provision of materials for water filters ● Chemical treatment of water supplies when appropriate. Results and Statistics from third and other case searches will provide information on the disease trend and effects of intervention activities that have been carried out. 4.0 CONCLUSION In this unit Guinea Worm infection was highlighted as an endemic and debilitating disease. Its incapacitating effects on victims adversely affect productivity in the area of agriculture, education, general well being and economy. Statistical information show its widespread throughout Nigeria and calls for national and international efforts on case search and appropriate intervention activities. Further information is required to monitor its trend. 5.0 SUMMARY You learnt in this unit how statistics help us to determine the scope and spread of communicable diseases. Guinea worm infection also known as dracunculiasis was used as a case study. You learnt about its debilitating effects on victims and that it is endemic in Nigeria. Efforts of both National and International bodies to control or eradicate the disease are highlighted. Current information on the effects of intervention activities over the years is needed to keep abreast of the trend of the disease in our society. You also learned that existence of guinea worm disease tells story about the quality of drinking water supply in such area.
NSS 241 INTRODUCTION TO BIOSTATISTICS
87
ANSWER TO SELF ASSESSMENT EXERCISE a) 643, 765 over 88, 500.00 times 100= .73% b) 88,500,000 divided by 643, 765 = 1: 137, 473 6.0 TUTOR-MARKED ASSIGNMENT Reported cases of guinea worm in Nigeria in 1989 showed 643, 765 victims while in year 2004, 495 cases were reported. Comment. 7.0 REFERENCES/FURTHER READINGS FMOH (1991) Nigeria bulletin of Epidemiology, Vol.1 No. Feb. p18.