Embed Size (px)
Citation preview
NATIONAL REVENUE REPORT
2001-2002
Department of Revenue and Customs
Ministry of Finance
The Hon’ble Finance Minister Lyonpo Yeshey Zimba, Secretary Dasho Wangdi Norbu, Director Mr. Nima Wangdi and officials of the
Department of Revenue and Customs at the Ninth Annual General Meeting 2002.

CONTENTS
FORWORD
1 OVERALL REVENUE PERFORMANCE .................................................... 1
1.1 Domestic Revenue by year
2 SUMMARY OF NATIONAL REVENUE ....................................................... 1
2.1 Tax Revenue ....................................................................................... 2
2.1.1 Direct Taxes ........................................................................................ 3
Corporate Income Tax (CIT) ............................................................... 4
Business Income Tax (BIT) ................................................................. 4
Royalties ............................................................................................. 4
Rural Tax ............................................................................................. 4
2.1.2 Indirect Taxes ...................................................................................... 5
Sales Tax ............................................................................................. 6
Excise Duty ......................................................................................... 6
Motor Vehicle Tax ............................................................................... 6
Import Duty ......................................................................................... 6
2.2 Non-Tax Revenue ............................................................................... 7
Revenue from Government Agencies ................................................ 8
Dividends ............................................................................................ 8
Transfer of profits ................................................................................ 8
Capital Revenue ................................................................................. 8
ADM fees & Charges .......................................................................... 8
3 SECTORAL REVENUE ............................................................................... 9
3.1 Highlights of Revenue by Sectors ...................................................... 9
Electricity (Power) ............................................................................... 9
Trade ................................................................................................... 9
Service .............................................................................................. 10
Primary ............................................................................................. 10
Manufacturing ................................................................................... 10
Finance ............................................................................................. 10
4 TOP TEN REVENUE AGENCIES .............................................................. 11
5 REVENUE BY REGION (RRCO) ............................................................... 13
6 DZONGKHAG REVENUE ......................................................................... 15
7 PRIVATE SECTOR .................................................................................... 16
7.1 Private Sector Revenue.................................................................... 16
8 TOP TEN PRIVATE COMPANIES ............................................................. 17
9. Overview of domestic revenue performance during 8th plan period .. 18
Comparison of 7th and 8th plan collections ................................................. 19
Statement of Revenue collections for the 8th Plan Period.......................... 21
ANNEXURES
ANNEXURE I .................................................................................................... 23
Details of National Revenue: FY 2001-02
ANNEXURE II ................................................................................................... 25
Details of Regional Revenue: FY 2001-02
ANNEXURE III .................................................................................................. 32
Details of Dzongkhag Revenue : FY 2001-02
ANNEXURE IV.................................................................................................. 34
Sectoral Revenue Performance: FY 2001-02

REVENUE REPORT 2001-2002
The National Revenue Report, 2001-2002 highlights the revenue
collection during the fiscal year 2001-2002. It presents performance
by type of collection, and agencies involved in collection both at
national and regional level.
As the fiscal year marks the end of the 8th FYP, the report also looks at
achievements made in the plan period from 1996 - 1997 to 2001 - 2002
and highlights major revenue generating agencies that have made
notable contributions to the total national revenue.
The information is based on the collection of revenue in the Royal
Government Revenue Accounts maintained with the Bank of Bhutan
and it’s branches, except interest on loan component, which is accounted
directly by the Department of Budget & Accounts at the end of every
fiscal year. The figures used in the report unless otherwise indicated
are net figures, that is, after adjustment of refunds.
As evident in this report the total collection for the 8th FYP recorded a
growth of 129% over the collection in 7th plan and exceeded both the
initial and revised target set for the plan period. This was possible due
to concerted effort made by our regional offices. With an ambitious target
set in the 9th FYP, we look forward to the same spirit of hard work and
dedication from our staff in the regional offices.
The Department would also like to express sincere appreciation to all
revenue generating agencies for their continued support and cooperation
in achieving our national revenue target.
With best wishes,
Nima Wangdi
Director
FOREWORD
NIMA WANGDI Director
With an ambitious target set in the 9th FYP, we look forward to the same spirit of
hard work and dedication from our staff in the regional offices.
REVENUE REPORT 2001-2002
0
500
1000
1500
2000
2500
3000
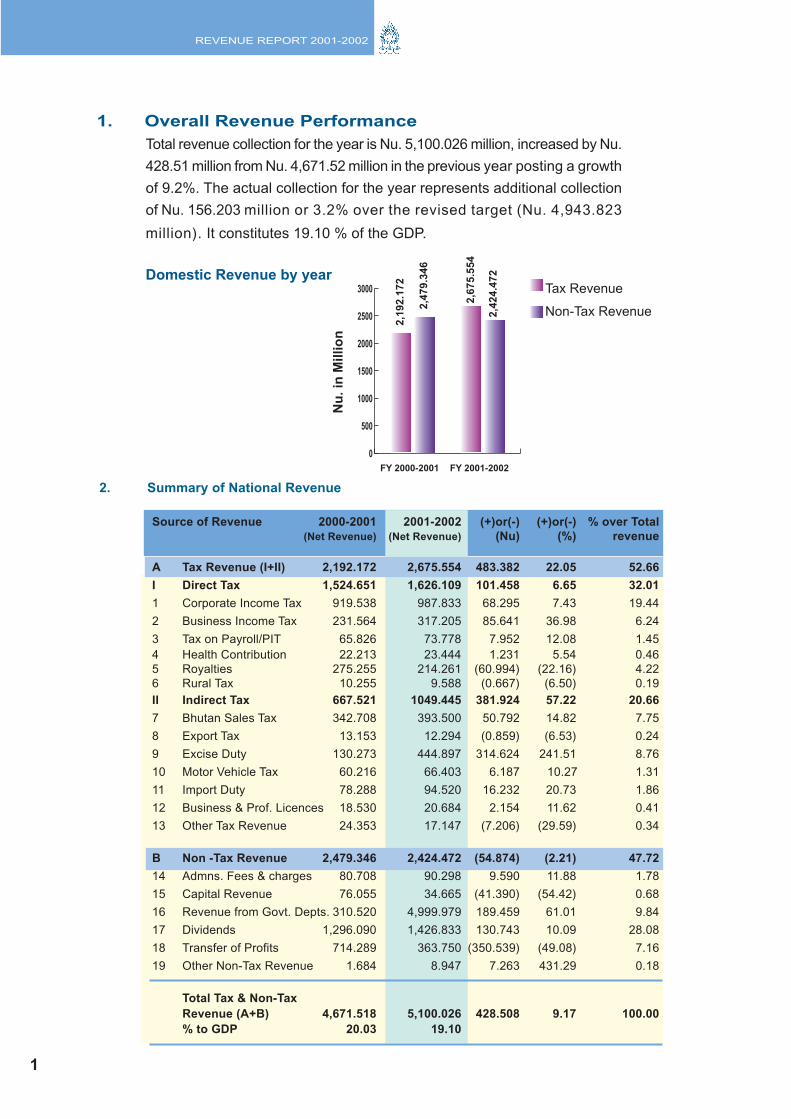
1. Overall Revenue Performance
Total revenue collection for the year is Nu. 5,100.026 million, increased by Nu.
428.51 million from Nu. 4,671.52 million in the previous year posting a growth
of 9.2%. The actual collection for the year represents additional collection
of Nu. 156.203 million or 3.2% over the revised target (Nu. 4,943.823
million). It constitutes 19.10 % of the GDP.
Domestic Revenue by yearTax Revenue
Non-Tax Revenue
FY 2000-2001 FY 2001-2002
1
2,1
92
.17
2
2,4
79
.34
6
2,6
75
.55
4
2,4
24
.47
2
Nu
. in
Millio
n
2. Summary of National Revenue
Source of Revenue 2000-2001 2001-2002 (+)or(-) (+)or(-) % over Total
(Net Revenue) (Net Revenue) (Nu) (%) revenue
A Tax Revenue (I+II) 2,192.172 2,675.554 483.382 22.05 52.66
I Direct Tax 1,524.651 1,626.109 101.458 6.65 32.01
1 Corporate Income Tax 919.538 987.833 68.295 7.43 19.44
2 Business Income Tax 231.564 317.205 85.641 36.98 6.24
3 Tax on Payroll/PIT 65.826 73.778 7.952 12.08 1.45
4 Health Contribution 22.213 23.444 1.231 5.54 0.46
5 Royalties 275.255 214.261 (60.994) (22.16) 4.22
6 Rural Tax 10.255 9.588 (0.667) (6.50) 0.19
II Indirect Tax 667.521 1049.445 381.924 57.22 20.66
7 Bhutan Sales Tax 342.708 393.500 50.792 14.82 7.75
8 Export Tax 13.153 12.294 (0.859) (6.53) 0.24
9 Excise Duty 130.273 444.897 314.624 241.51 8.76
10 Motor Vehicle Tax 60.216 66.403 6.187 10.27 1.31
11 Import Duty 78.288 94.520 16.232 20.73 1.86
12 Business & Prof. Licences 18.530 20.684 2.154 11.62 0.41
13 Other Tax Revenue 24.353 17.147 (7.206) (29.59) 0.34
B Non -Tax Revenue 2,479.346 2,424.472 (54.874) (2.21) 47.72
14 Admns. Fees & charges 80.708 90.298 9.590 11.88 1.78
15 Capital Revenue 76.055 34.665 (41.390) (54.42) 0.68
16 Revenue from Govt. Depts. 310.520 4,999.979 189.459 61.01 9.84
17 Dividends 1,296.090 1,426.833 130.743 10.09 28.08
18 Transfer of Profits 714.289 363.750 (350.539) (49.08) 7.16
19 Other Non-Tax Revenue 1.684 8.947 7.263 431.29 0.18
Total Tax & Non-Tax
Revenue (A+B) 4,671.518 5,100.026 428.508 9.17 100.00
% to GDP 20.03 19.10
REVENUE REPORT 2001-2002
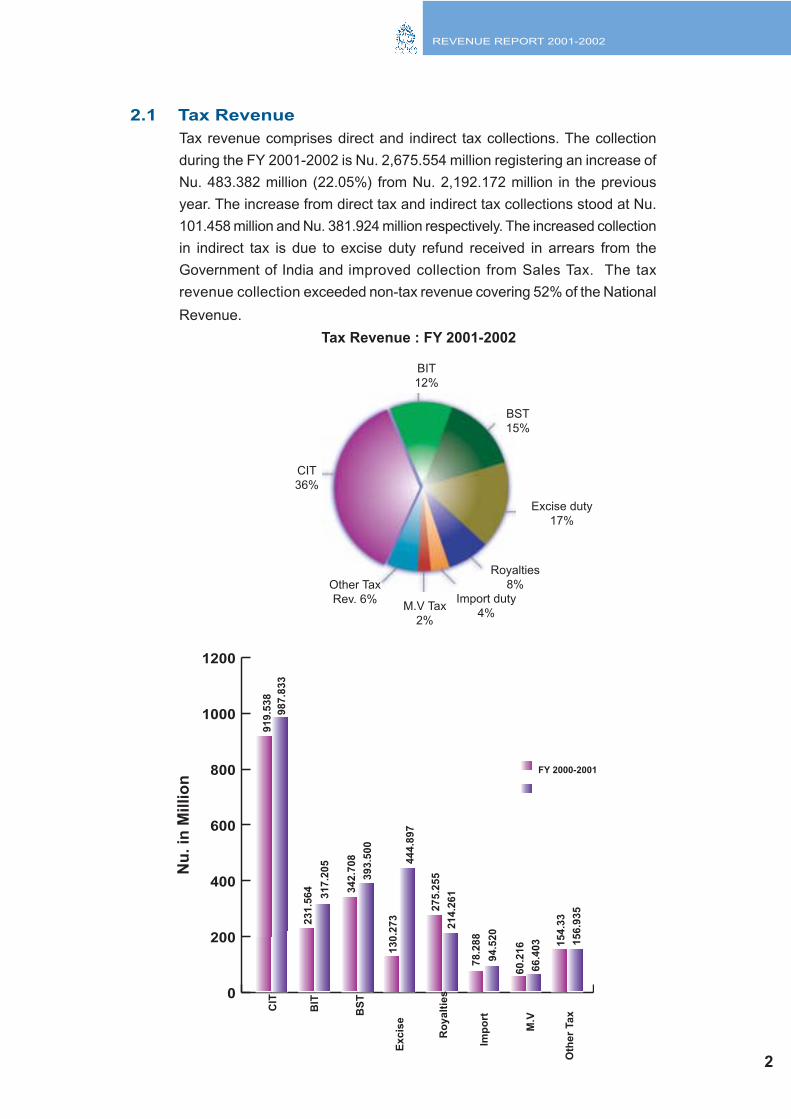
2.1 Tax Revenue
Tax revenue comprises direct and indirect tax collections. The collection
during the FY 2001-2002 is Nu. 2,675.554 million registering an increase of
Nu. 483.382 million (22.05%) from Nu. 2,192.172 million in the previous
year. The increase from direct tax and indirect tax collections stood at Nu.
101.458 million and Nu. 381.924 million respectively. The increased collection
in indirect tax is due to excise duty refund received in arrears from the
Government of India and improved collection from Sales Tax. The tax
revenue collection exceeded non-tax revenue covering 52% of the National
Revenue.
Tax Revenue : FY 2001-2002
CIT
36%
BIT
12%
BST
15%
Excise duty
17%
Other Tax
Rev. 6%
Royalties
8%
M.V Tax
2%
Import duty
4%
2
Nu
. in
Millio
n
0
200
400
600
800
1000
1200
Oth
er
Tax
CIT
Excis
e
Imp
ort
BIT
BS
T
Ro
yalt
ies
M.V
FY 2000-2001
919.5
38
987.8
33
231.5
64
317.2
05
342.7
08
393.5
00
130.2
73
444.8
97
275.2
55
214.2
61
78.2
88
94.5
20
60.2
16
66.4
03 154.3
3
156.9
35
REVENUE REPORT 2001-2002
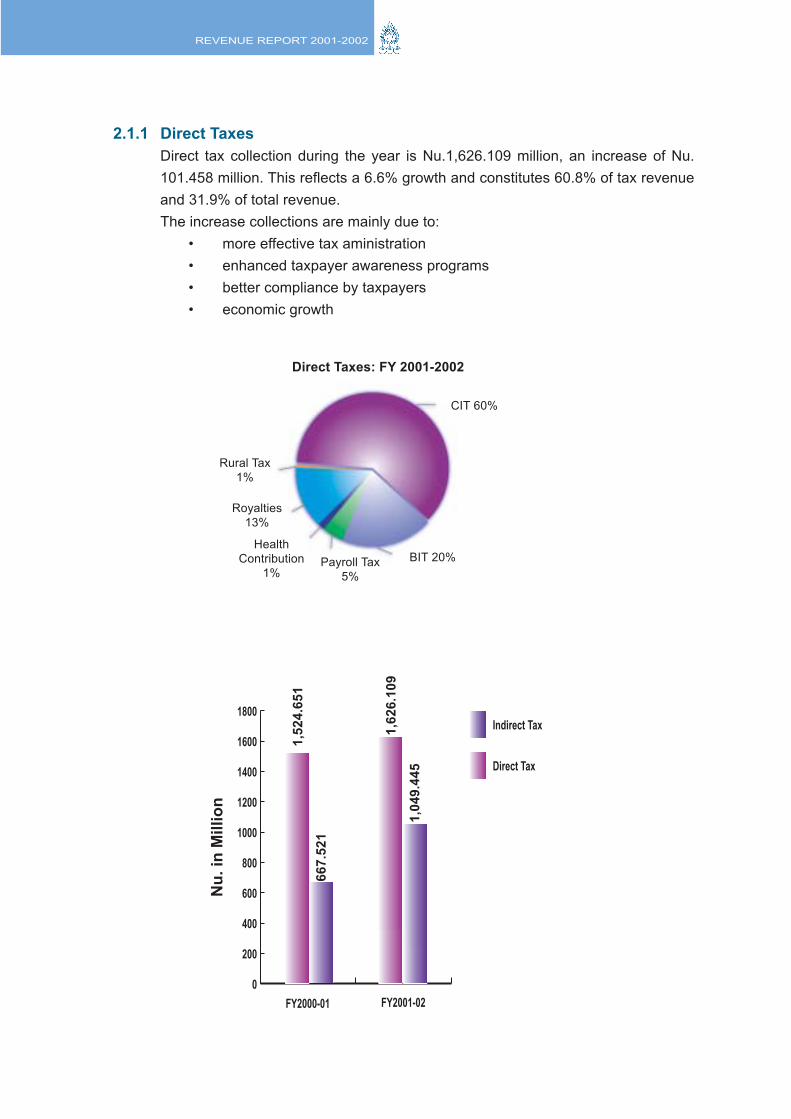
2.1.1 Direct Taxes
Direct tax collection during the year is Nu.1,626.109 million, an increase of Nu.
101.458 million. This reflects a 6.6% growth and constitutes 60.8% of tax revenue
and 31.9% of total revenue.
The increase collections are mainly due to:
• more effective tax aministration
• enhanced taxpayer awareness programs
• better compliance by taxpayers
• economic growth1
,52
4.6
51
0
200
400
600
800
1000
1200
1400
1600
1800Indirect Tax
Direct Tax
FY2001-02FY2000-01
Payroll Tax
5%
CIT 60%
Rural Tax
1%
Royalties
13%
BIT 20%Health
Contribution
1%
Direct Taxes: FY 2001-2002
66
7.5
21
1,6
26
.10
9
1,0
49.4
45
Nu
. in
Millio
n
REVENUE REPORT 2001-2002
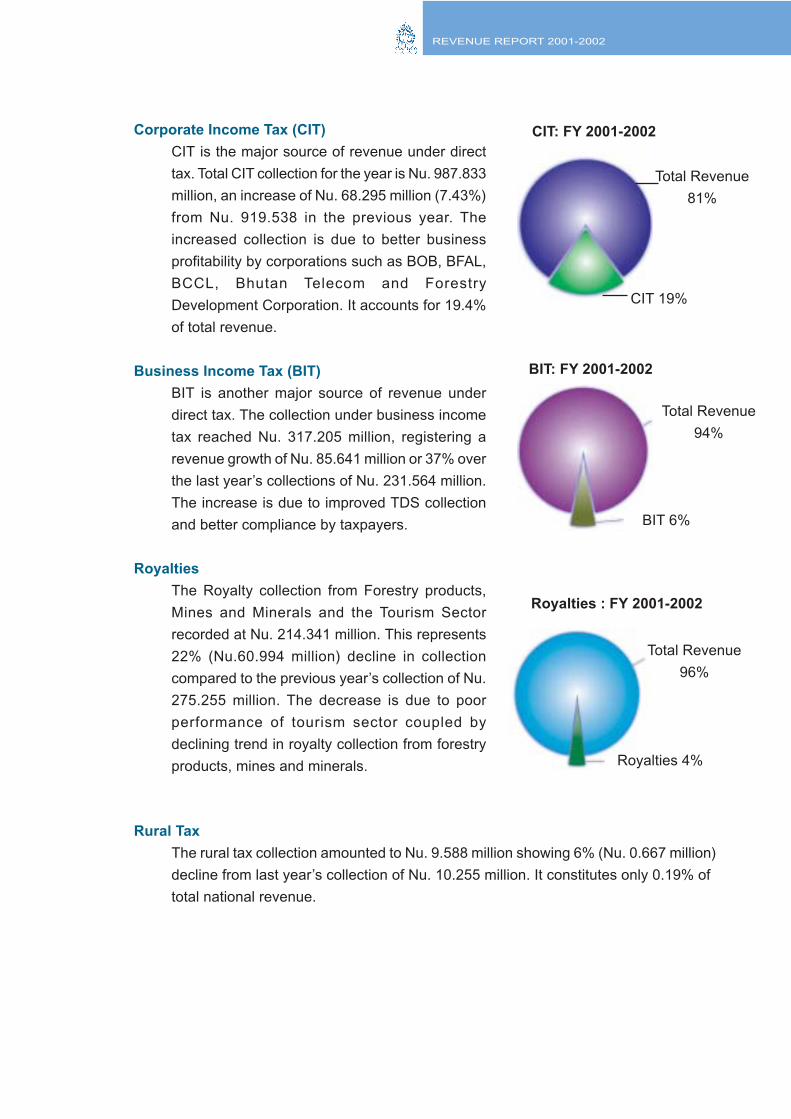
Corporate Income Tax (CIT)
CIT is the major source of revenue under direct
tax. Total CIT collection for the year is Nu. 987.833
million, an increase of Nu. 68.295 million (7.43%)
from Nu. 919.538 in the previous year. The
increased collection is due to better business
profitability by corporations such as BOB, BFAL,
BCCL, Bhutan Telecom and Forestry
Development Corporation. It accounts for 19.4%
of total revenue.
Business Income Tax (BIT)
BIT is another major source of revenue under
direct tax. The collection under business income
tax reached Nu. 317.205 million, registering a
revenue growth of Nu. 85.641 million or 37% over
the last year’s collections of Nu. 231.564 million.
The increase is due to improved TDS collection
and better compliance by taxpayers.
Royalties
The Royalty collection from Forestry products,
Mines and Minerals and the Tourism Sector
recorded at Nu. 214.341 million. This represents
22% (Nu.60.994 million) decline in collection
compared to the previous year’s collection of Nu.
275.255 million. The decrease is due to poor
performance of tourism sector coupled by
declining trend in royalty collection from forestry
products, mines and minerals.
Rural Tax
The rural tax collection amounted to Nu. 9.588 million showing 6% (Nu. 0.667 million)
decline from last year’s collection of Nu. 10.255 million. It constitutes only 0.19% of
total national revenue.
Royalties : FY 2001-2002
BIT: FY 2001-2002
CIT: FY 2001-2002
CIT 19%
Total Revenue
81%
Total Revenue
94%
Total Revenue
96%
BIT 6%
Royalties 4%
REVENUE REPORT 2001-2002
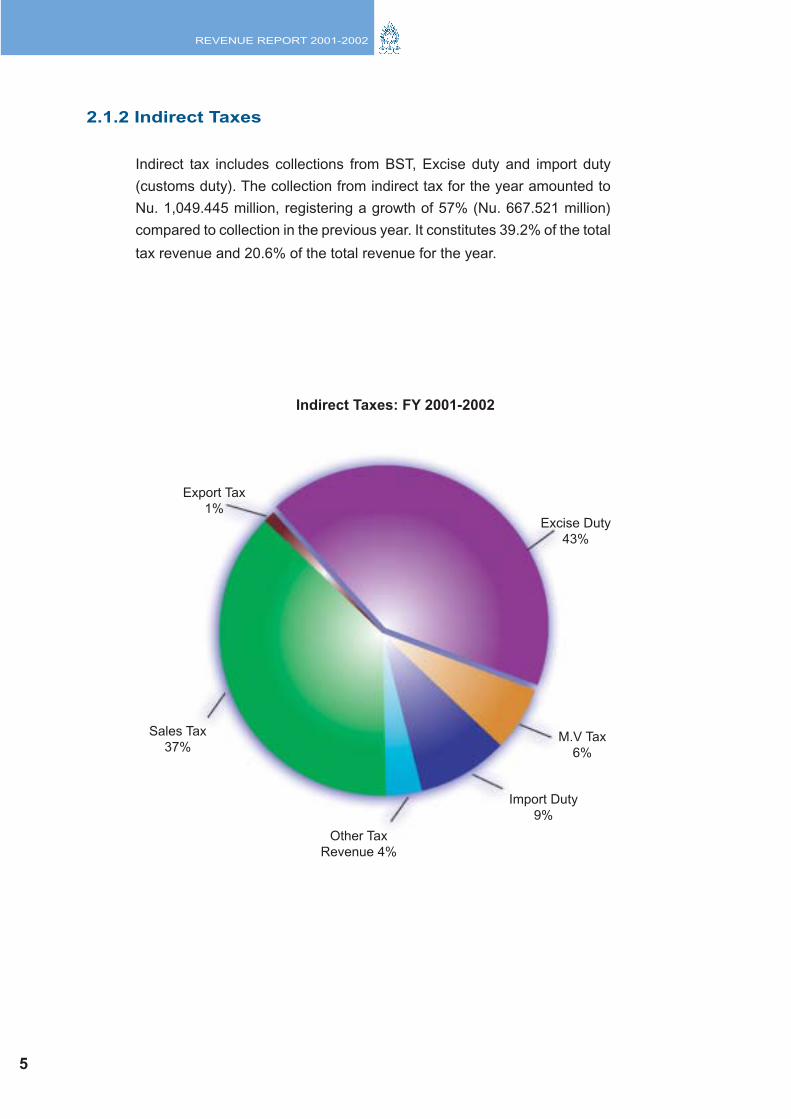
2.1.2 Indirect Taxes
Indirect tax includes collections from BST, Excise duty and import duty
(customs duty). The collection from indirect tax for the year amounted to
Nu. 1,049.445 million, registering a growth of 57% (Nu. 667.521 million)
compared to collection in the previous year. It constitutes 39.2% of the total
tax revenue and 20.6% of the total revenue for the year.
Excise Duty
43%
Export Tax
1%
M.V Tax
6%
Import Duty
9%
Other Tax
Revenue 4%
Sales Tax
37%
Indirect Taxes: FY 2001-2002
5
REVENUE REPORT 2001-2002
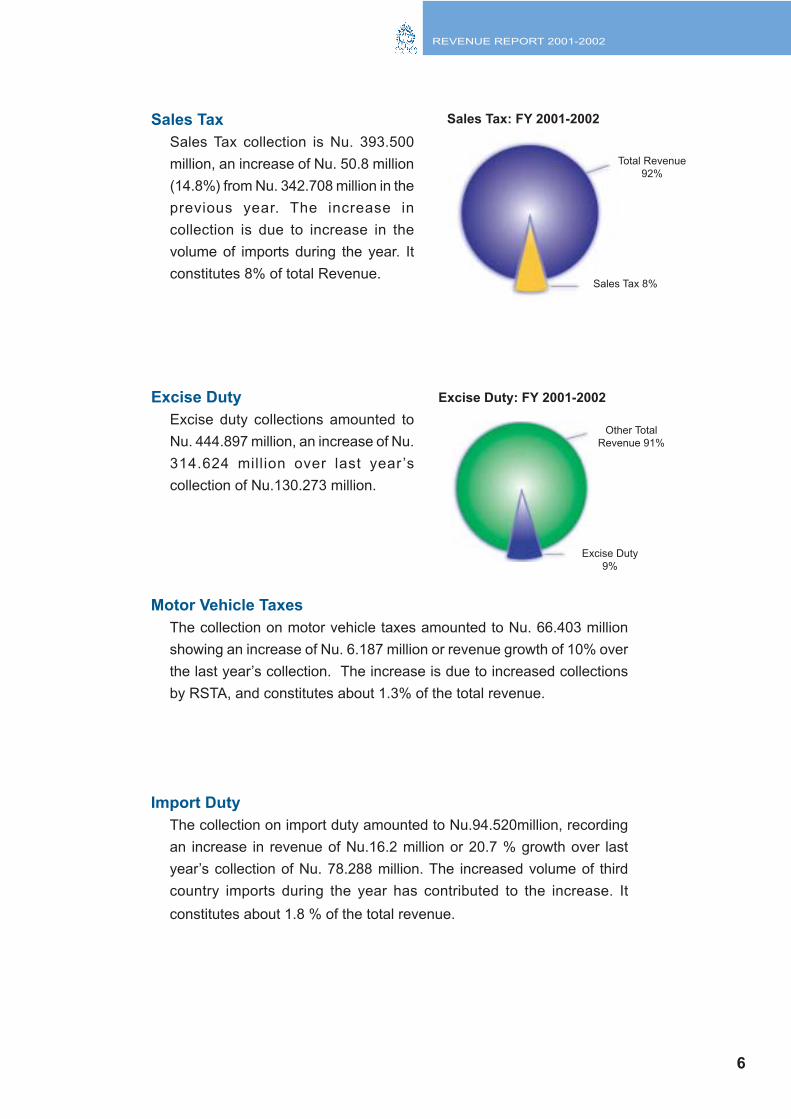
Sales Tax
Sales Tax collection is Nu. 393.500
million, an increase of Nu. 50.8 million
(14.8%) from Nu. 342.708 million in the
previous year. The increase in
collection is due to increase in the
volume of imports during the year. It
constitutes 8% of total Revenue.
Excise Duty
Excise duty collections amounted to
Nu. 444.897 million, an increase of Nu.
314.624 million over last year ’s
collection of Nu.130.273 million.
Motor Vehicle Taxes
The collection on motor vehicle taxes amounted to Nu. 66.403 million
showing an increase of Nu. 6.187 million or revenue growth of 10% over
the last year’s collection. The increase is due to increased collections
by RSTA, and constitutes about 1.3% of the total revenue.
Import Duty
The collection on import duty amounted to Nu.94.520million, recording
an increase in revenue of Nu.16.2 million or 20.7 % growth over last
year’s collection of Nu. 78.288 million. The increased volume of third
country imports during the year has contributed to the increase. It
constitutes about 1.8 % of the total revenue.
Sales Tax: FY 2001-2002
Excise Duty: FY 2001-2002
Total Revenue
92%
Sales Tax 8%
Excise Duty
9%
Other Total
Revenue 91%
6
REVENUE REPORT 2001-2002
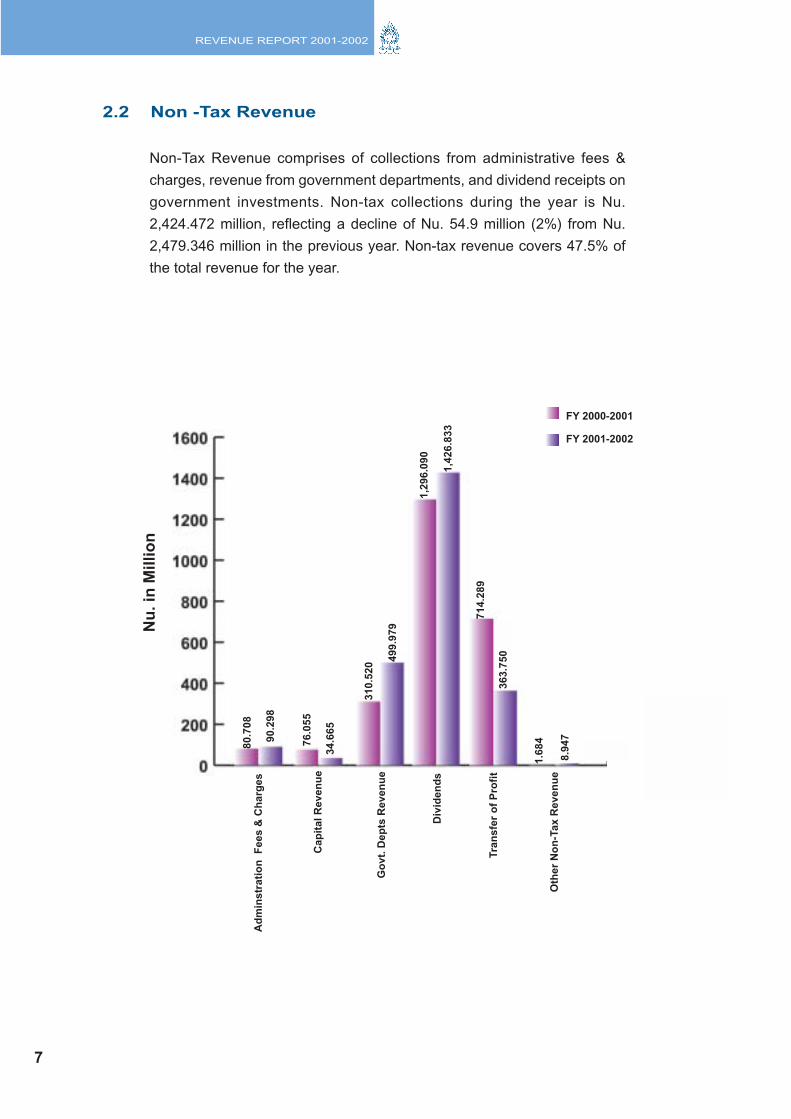
Non-Tax Revenue comprises of collections from administrative fees &
charges, revenue from government departments, and dividend receipts on
government investments. Non-tax collections during the year is Nu.
2,424.472 million, reflecting a decline of Nu. 54.9 million (2%) from Nu.
2,479.346 million in the previous year. Non-tax revenue covers 47.5% of
the total revenue for the year.
2.2 Non -Tax Revenue
Ad
min
str
ati
on
F
ees &
Ch
arg
es
Cap
ital
Reven
ue
Go
vt.
Dep
ts R
even
ue
Div
ide
nd
s
Tra
nsfe
r o
f P
rofi
t
Oth
er
No
n-T
ax R
even
ue
FY 2000-2001
FY 2001-2002
Nu
. in
Millio
n
7
80.7
08
363.7
50
714.2
89
8.9
47
1.6
84
1,4
26
.83
3
1,2
96
.09
0
310.5
20
499.9
79
90.2
98
76.0
55
34.6
65
REVENUE REPORT 2001-2002
Revenue from Government Departments
The collection from Government Departments for the year is Nu. 499.979
million, increased by Nu. 189.459 million (61%) from Nu. 310.520 million
in the previous year. The increase is mainly from increased collections
from Department of Power and the cost of excess land collected by the
Department of Survey.
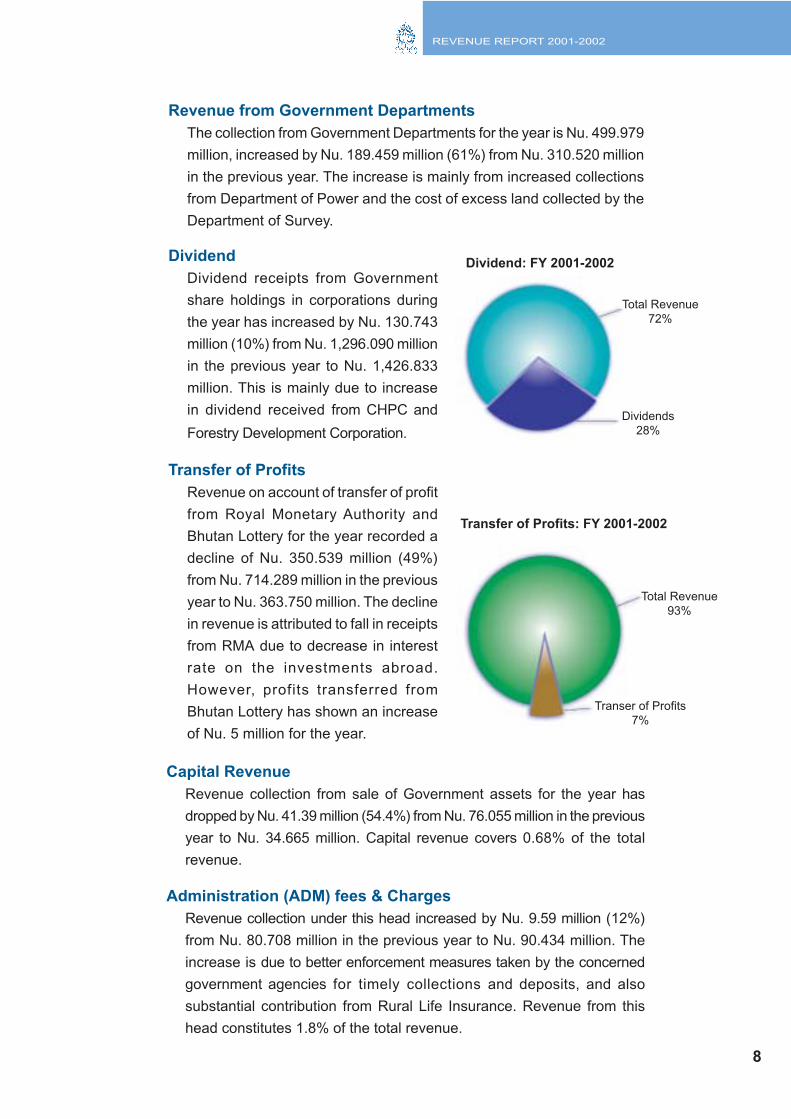
Dividend
Dividend receipts from Government
share holdings in corporations during
the year has increased by Nu. 130.743
million (10%) from Nu. 1,296.090 million
in the previous year to Nu. 1,426.833
million. This is mainly due to increase
in dividend received from CHPC and
Forestry Development Corporation.
Transfer of Profits
Revenue on account of transfer of profit
from Royal Monetary Authority and
Bhutan Lottery for the year recorded a
decline of Nu. 350.539 million (49%)
from Nu. 714.289 million in the previous
year to Nu. 363.750 million. The decline
in revenue is attributed to fall in receipts
from RMA due to decrease in interest
rate on the investments abroad.
However, profits transferred from
Bhutan Lottery has shown an increase
of Nu. 5 million for the year.
Capital Revenue
Revenue collection from sale of Government assets for the year has
dropped by Nu. 41.39 million (54.4%) from Nu. 76.055 million in the previous
year to Nu. 34.665 million. Capital revenue covers 0.68% of the total
revenue.
Administration (ADM) fees & Charges
Revenue collection under this head increased by Nu. 9.59 million (12%)
from Nu. 80.708 million in the previous year to Nu. 90.434 million. The
increase is due to better enforcement measures taken by the concerned
government agencies for timely collections and deposits, and also
substantial contribution from Rural Life Insurance. Revenue from this
head constitutes 1.8% of the total revenue.
Total Revenue
72%
Total Revenue
93%
Dividends
28%
Transer of Profits
7%
Dividend: FY 2001-2002
Transfer of Profits: FY 2001-2002
8
REVENUE REPORT 2001-2002
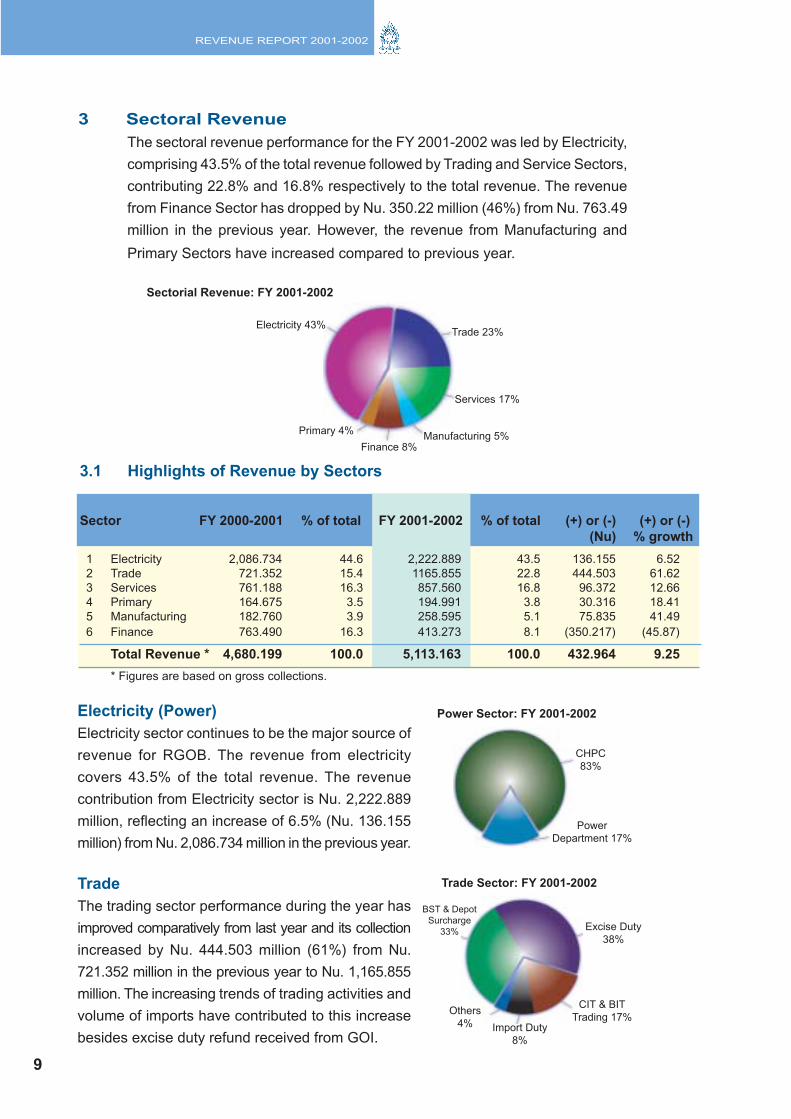
3 Sectoral Revenue
The sectoral revenue performance for the FY 2001-2002 was led by Electricity,
comprising 43.5% of the total revenue followed by Trading and Service Sectors,
contributing 22.8% and 16.8% respectively to the total revenue. The revenue
from Finance Sector has dropped by Nu. 350.22 million (46%) from Nu. 763.49
million in the previous year. However, the revenue from Manufacturing and
Primary Sectors have increased compared to previous year.
Electricity (Power)
Electricity sector continues to be the major source of
revenue for RGOB. The revenue from electricity
covers 43.5% of the total revenue. The revenue
contribution from Electricity sector is Nu. 2,222.889
million, reflecting an increase of 6.5% (Nu. 136.155
million) from Nu. 2,086.734 million in the previous year.
Trade
The trading sector performance during the year has
improved comparatively from last year and its collection
increased by Nu. 444.503 million (61%) from Nu.
721.352 million in the previous year to Nu. 1,165.855
million. The increasing trends of trading activities and
volume of imports have contributed to this increase
besides excise duty refund received from GOI.
3.1 Highlights of Revenue by Sectors
Sector FY 2000-2001 % of total FY 2001-2002 % of total (+) or (-) (+) or (-)
(Nu) % growth
Sectorial Revenue: FY 2001-2002
Trade 23%
Services 17%
Electricity 43%
Manufacturing 5%Primary 4%
Finance 8%
Power Sector: FY 2001-2002
Trade Sector: FY 2001-2002
CHPC
83%
Power
Department 17%
Excise Duty
38%
BST & Depot
Surcharge
33%
CIT & BIT
Trading 17%Import Duty
8%
Others
4%
9
1 Electricity 2,086.734 44.6 2,222.889 43.5 136.155 6.52
2 Trade 721.352 15.4 1165.855 22.8 444.503 61.62
3 Services 761.188 16.3 857.560 16.8 96.372 12.66
4 Primary 164.675 3.5 194.991 3.8 30.316 18.41
5 Manufacturing 182.760 3.9 258.595 5.1 75.835 41.49
6 Finance 763.490 16.3 413.273 8.1 (350.217) (45.87)
Total Revenue * 4,680.199 100.0 5,113.163 100.0 432.964 9.25
* Figures are based on gross collections.
REVENUE REPORT 2001-2002
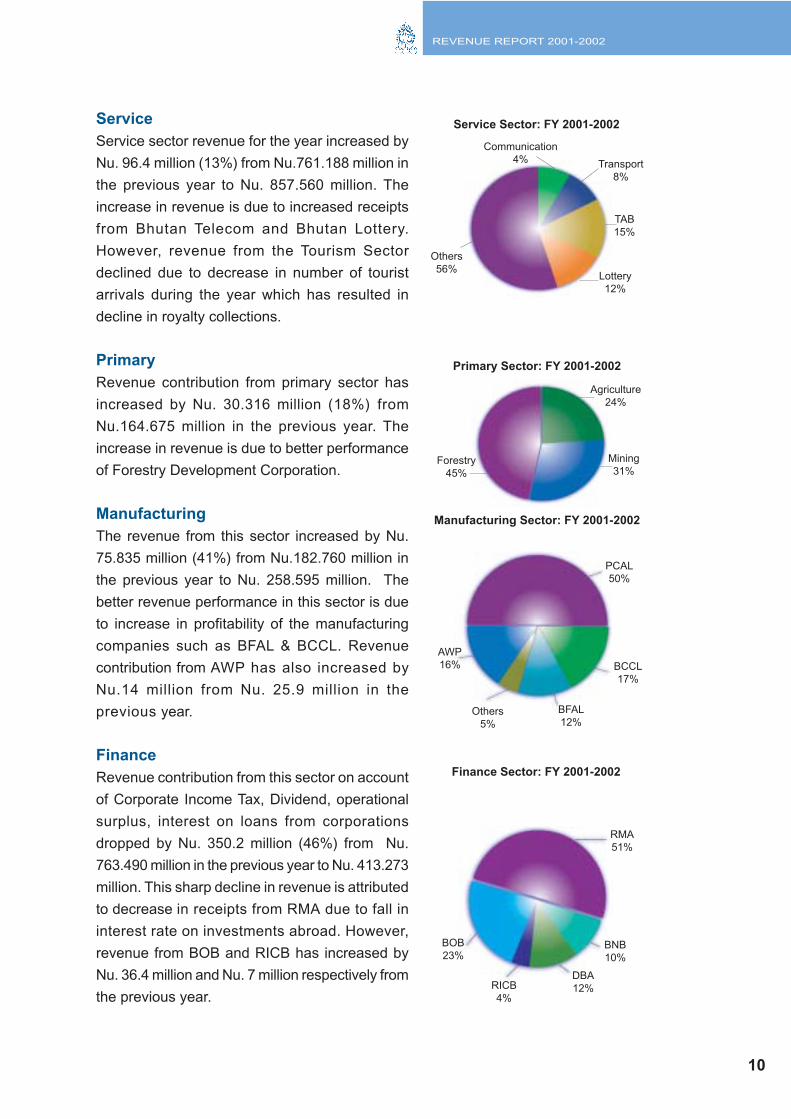
Service
Service sector revenue for the year increased by
Nu. 96.4 million (13%) from Nu.761.188 million in
the previous year to Nu. 857.560 million. The
increase in revenue is due to increased receipts
from Bhutan Telecom and Bhutan Lottery.
However, revenue from the Tourism Sector
declined due to decrease in number of tourist
arrivals during the year which has resulted in
decline in royalty collections.
Primary
Revenue contribution from primary sector has
increased by Nu. 30.316 million (18%) from
Nu.164.675 million in the previous year. The
increase in revenue is due to better performance
of Forestry Development Corporation.
Manufacturing
The revenue from this sector increased by Nu.
75.835 million (41%) from Nu.182.760 million in
the previous year to Nu. 258.595 million. The
better revenue performance in this sector is due
to increase in profitability of the manufacturing
companies such as BFAL & BCCL. Revenue
contribution from AWP has also increased by
Nu.14 million from Nu. 25.9 million in the
previous year.
Finance
Revenue contribution from this sector on account
of Corporate Income Tax, Dividend, operational
surplus, interest on loans from corporations
dropped by Nu. 350.2 million (46%) from Nu.
763.490 million in the previous year to Nu. 413.273
million. This sharp decline in revenue is attributed
to decrease in receipts from RMA due to fall in
interest rate on investments abroad. However,
revenue from BOB and RICB has increased by
Nu. 36.4 million and Nu. 7 million respectively from
the previous year.
Service Sector: FY 2001-2002
Primary Sector: FY 2001-2002
Manufacturing Sector: FY 2001-2002
Finance Sector: FY 2001-2002
Communication
4%
TAB
15%
Lottery
12%
Transport
8%
Others
56%
Agriculture
24%
Mining
31%Forestry
45%
PCAL
50%
BCCL
17%
RMA
51%
BFAL
12%Others
5%
AWP
16%
BNB
10%
BOB
23%
DBA
12%RICB
4%
10
REVENUE REPORT 2001-2002
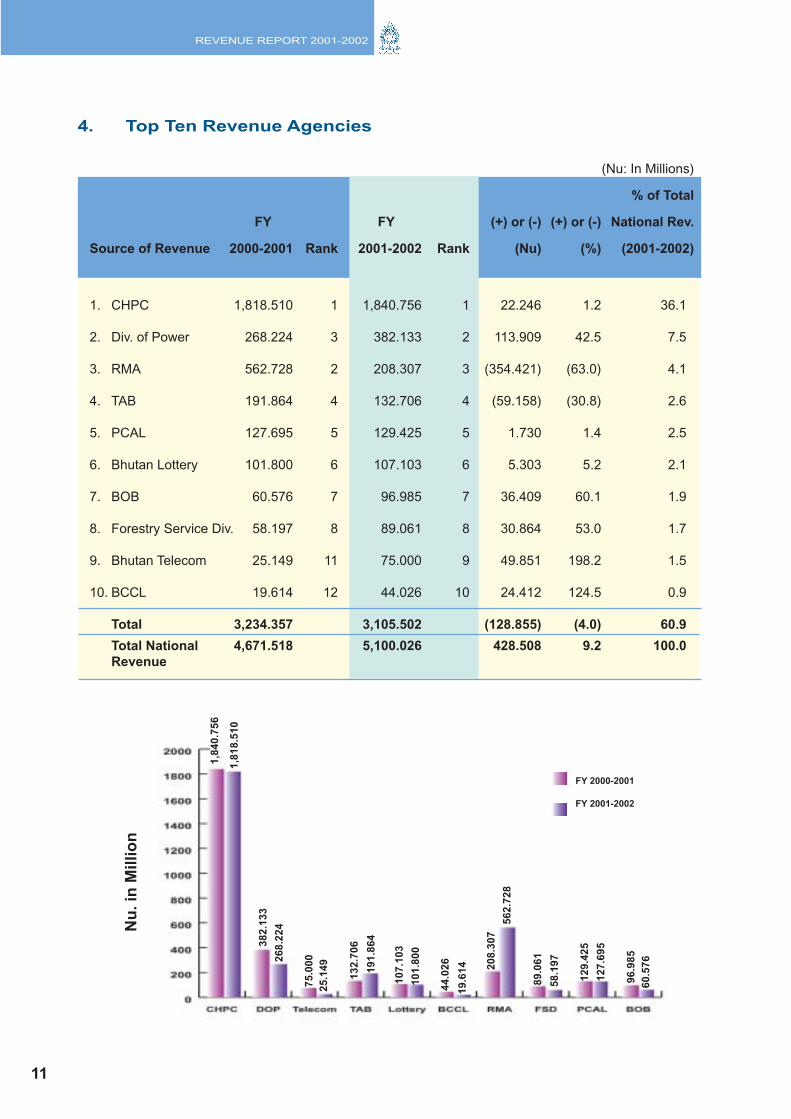
4. Top Ten Revenue Agencies
(Nu: In Millions)
% of Total
FY FY (+) or (-) (+) or (-) National Rev.
Source of Revenue 2000-2001 Rank 2001-2002 Rank (Nu) (%) (2001-2002)
1. CHPC 1,818.510 1 1,840.756 1 22.246 1.2 36.1
2. Div. of Power 268.224 3 382.133 2 113.909 42.5 7.5
3. RMA 562.728 2 208.307 3 (354.421) (63.0) 4.1
4. TAB 191.864 4 132.706 4 (59.158) (30.8) 2.6
5. PCAL 127.695 5 129.425 5 1.730 1.4 2.5
6. Bhutan Lottery 101.800 6 107.103 6 5.303 5.2 2.1
7. BOB 60.576 7 96.985 7 36.409 60.1 1.9
8. Forestry Service Div. 58.197 8 89.061 8 30.864 53.0 1.7
9. Bhutan Telecom 25.149 11 75.000 9 49.851 198.2 1.5
10. BCCL 19.614 12 44.026 10 24.412 124.5 0.9
Total 3,234.357 3,105.502 (128.855) (4.0) 60.9
Total National 4,671.518 5,100.026 428.508 9.2 100.0
Revenue
11
FY 2000-2001
FY 2001-2002
1,8
40
.75
6
60.5
76
562.7
28
129.4
25
127.6
953
82.1
33
268.2
24
75.0
00
132.7
06
191.8
64
107.1
03
101.8
00
44.0
26
1,8
18
.51
0
19.6
14
89.0
61
58.1
97
96.9
85
25.1
49 208.3
07
Nu
. in
Millio
n
REVENUE REPORT 2001-2002
1 Chukha Hydro Power Corporation (CHPC)
CHPC continues to be the highest single revenue source for the Royal Government though there
is not much increase in revenue for the year. The revenue from CHPC for the year increased by
1.2% (Nu. 22.246 million) from Nu. 1,818.510 million in the previous year. CHPC revenue covers
36% of the total revenue.
2 Division of Power (DOP)
Revenue from DOP increased by Nu. 113.9 million (42%) from Nu. 268.224 in the previous year.
Revenue from DOP covers 7.5% of the national revenue.
3 Royal Monetary Authority (RMA)
The transfer of profit from RMA for the year recorded a decline of Nu. 355.330 million (63.2%) from
Nu. 714.289 million in the previous year to Nu. 206.216 million. The decline in revenue is due to
decrease in interest rates on the investment abroad. Interest from foreign investments constitute
96% of RMA’s revenue and the sudden fall of interest rate from 6.5% to 1.6% in United States of
America has affected the revenue.
4 Tourism Authority of Bhutan (TAB)
The revenue collections on account of royalty and withholding tax declined by Nu. 59 million (31%)
from Nu.191.864 in the previous year. The decline in revenue is mainly due to decrease in number
of tourist during the year.
5 Penden Cement Authority Ltd. (PCAL)
The contribution from PCAL on account of CIT and Dividend has increased by Nu. 1.7 million
(1.4%) from Nu. 127.695 million in the previous year. The Revenue from PCAL covers 2.5% of the
total revenue.
6 Royal Bhutan Lottery
The collection from Lottery has increased by Nu. 5.3 million (5%) from Nu. 107.103 million in the
previous year and it constitutes 2.1% of the total revenue.
7 Bank of Bhutan (BOB)
The CIT and dividend payment from BOB has increased by Nu. 36.4 million (60%) from Nu. 60.576
million in the previous year.
8 Forestry Service Division
The collection under this includes revenue from Forestry Department, royalty on forest products
and revenue from Forestry Development Corporation. The total collections increased by Nu. 30.8
million (53%) from Nu. 58.197 million in the previous year.
9 Bhutan Telecom Corporation (BTC)
Bhutan telecom paid its first CIT and dividend after it’s corporatization. The revenue from BTC
amounted to Nu. 75 million for the year.
Bhutan Carbide Chemical Ltd. (BCCL)
The CIT collection from BCCL reached Nu. 44.026 million for the year. In the previous year the
revenue from this agency recorded a sharp decline due to flood which caused great damage to the
business. This year the company has regained its position and recorded an increase in revenue of
Nu. 24.4 million (124%) from Nu. 19.6 million in the previous year.
12
10
REVENUE REPORT 2001-2002
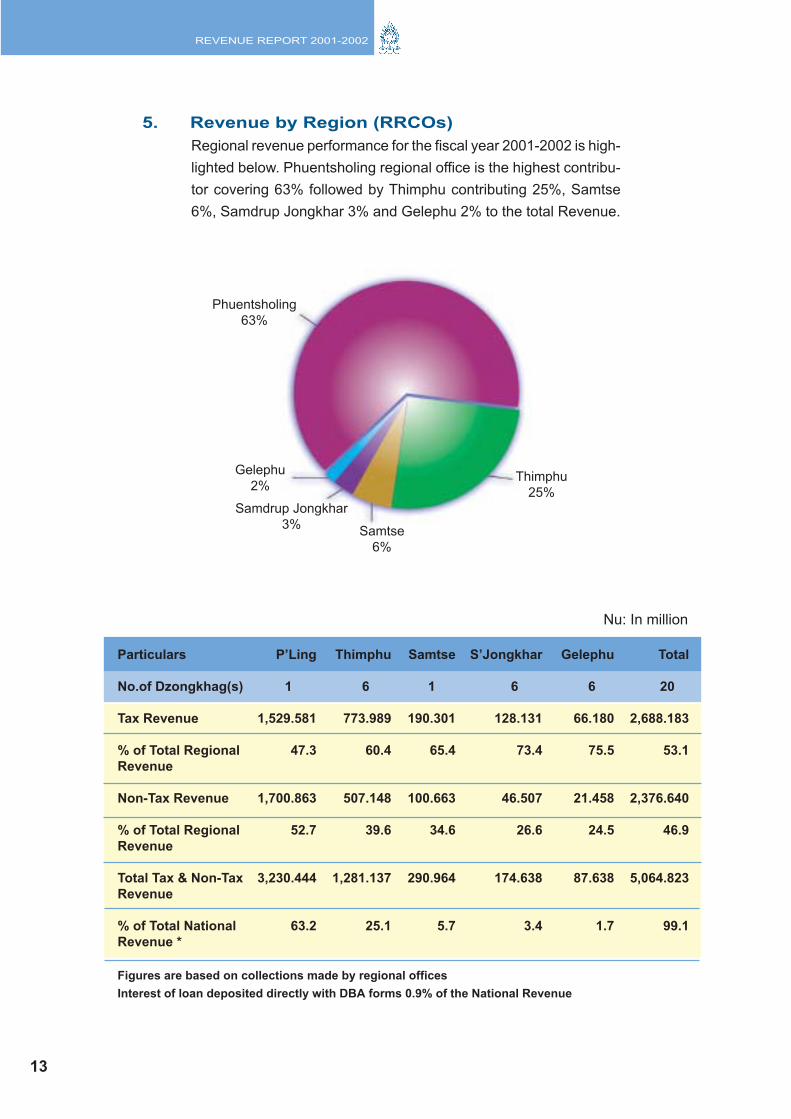
5. Revenue by Region (RRCOs)
Regional revenue performance for the fiscal year 2001-2002 is high-
lighted below. Phuentsholing regional office is the highest contribu-
tor covering 63% followed by Thimphu contributing 25%, Samtse
6%, Samdrup Jongkhar 3% and Gelephu 2% to the total Revenue.
Nu: In million
Particulars P’Ling Thimphu Samtse S’Jongkhar Gelephu Total
No.of Dzongkhag(s) 1 6 1 6 6 20
Tax Revenue 1,529.581 773.989 190.301 128.131 66.180 2,688.183
% of Total Regional 47.3 60.4 65.4 73.4 75.5 53.1
Revenue
Non-Tax Revenue 1,700.863 507.148 100.663 46.507 21.458 2,376.640
% of Total Regional 52.7 39.6 34.6 26.6 24.5 46.9
Revenue
Total Tax & Non-Tax 3,230.444 1,281.137 290.964 174.638 87.638 5,064.823
Revenue
% of Total National 63.2 25.1 5.7 3.4 1.7 99.1
Revenue *
Figures are based on collections made by regional offices
Interest of loan deposited directly with DBA forms 0.9% of the National Revenue
Phuentsholing
63%
Gelephu
2%Thimphu
25%
Samtse
6%
Samdrup Jongkhar
3%
13
REVENUE REPORT 2001-2002
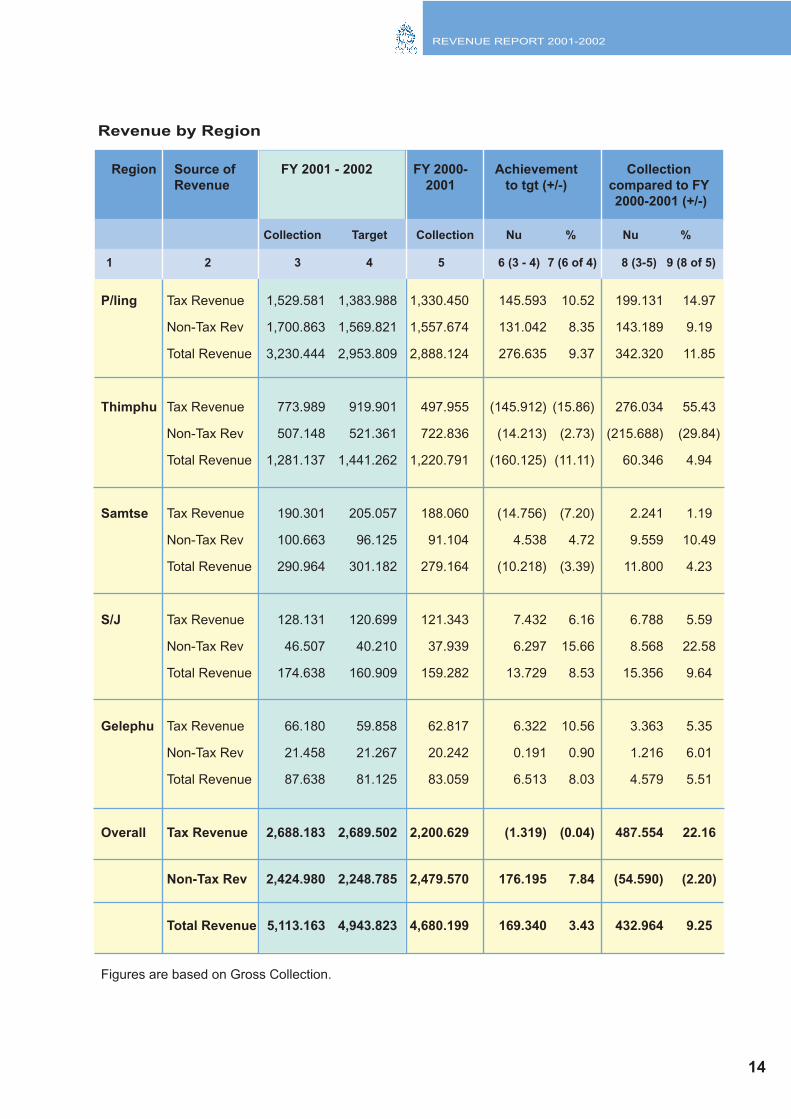
Revenue by Region
14
P/ling Tax Revenue 1,529.581 1,383.988 1,330.450 145.593 10.52 199.131 14.97
Non-Tax Rev 1,700.863 1,569.821 1,557.674 131.042 8.35 143.189 9.19
Total Revenue 3,230.444 2,953.809 2,888.124 276.635 9.37 342.320 11.85
Thimphu Tax Revenue 773.989 919.901 497.955 (145.912) (15.86) 276.034 55.43
Non-Tax Rev 507.148 521.361 722.836 (14.213) (2.73) (215.688) (29.84)
Total Revenue 1,281.137 1,441.262 1,220.791 (160.125) (11.11) 60.346 4.94
Samtse Tax Revenue 190.301 205.057 188.060 (14.756) (7.20) 2.241 1.19
Non-Tax Rev 100.663 96.125 91.104 4.538 4.72 9.559 10.49
Total Revenue 290.964 301.182 279.164 (10.218) (3.39) 11.800 4.23
S/J Tax Revenue 128.131 120.699 121.343 7.432 6.16 6.788 5.59
Non-Tax Rev 46.507 40.210 37.939 6.297 15.66 8.568 22.58
Total Revenue 174.638 160.909 159.282 13.729 8.53 15.356 9.64
Gelephu Tax Revenue 66.180 59.858 62.817 6.322 10.56 3.363 5.35
Non-Tax Rev 21.458 21.267 20.242 0.191 0.90 1.216 6.01
Total Revenue 87.638 81.125 83.059 6.513 8.03 4.579 5.51
Overall Tax Revenue 2,688.183 2,689.502 2,200.629 (1.319) (0.04) 487.554 22.16
Non-Tax Rev 2,424.980 2,248.785 2,479.570 176.195 7.84 (54.590) (2.20)
Total Revenue 5,113.163 4,943.823 4,680.199 169.340 3.43 432.964 9.25
Figures are based on Gross Collection.
Region Source of FY 2001 - 2002 FY 2000- Achievement Collection
Revenue 2001 to tgt (+/-) compared to FY
2000-2001 (+/-)
Collection Target Collection Nu % Nu %
1 2 3 4 5 6 (3 - 4) 7 (6 of 4) 8 (3-5) 9 (8 of 5)
REVENUE REPORT 2001-2002
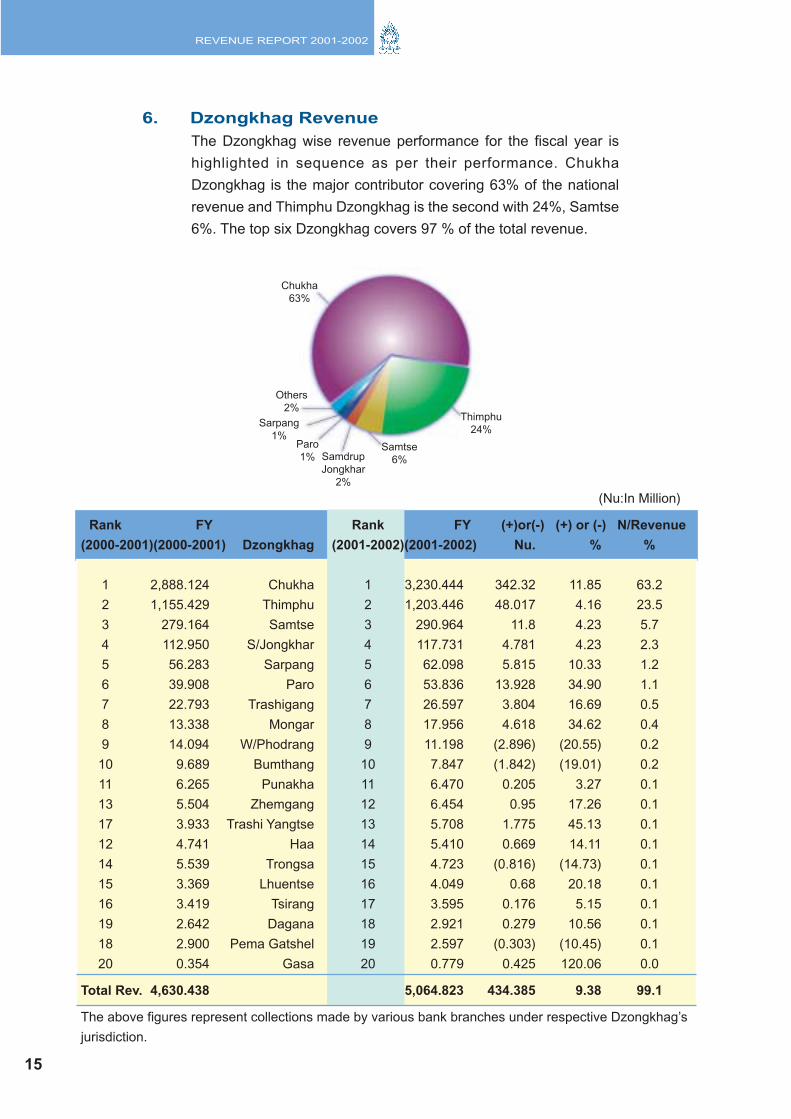
6. Dzongkhag Revenue
The Dzongkhag wise revenue performance for the fiscal year is
highlighted in sequence as per their performance. Chukha
Dzongkhag is the major contributor covering 63% of the national
revenue and Thimphu Dzongkhag is the second with 24%, Samtse
6%. The top six Dzongkhag covers 97 % of the total revenue.
(Nu:In Million)
Rank FY Rank FY (+)or(-) (+) or (-) N/Revenue
(2000-2001)(2000-2001) Dzongkhag (2001-2002)(2001-2002) Nu. % %
1 2,888.124 Chukha 1 3,230.444 342.32 11.85 63.2
2 1,155.429 Thimphu 2 1,203.446 48.017 4.16 23.5
3 279.164 Samtse 3 290.964 11.8 4.23 5.7
4 112.950 S/Jongkhar 4 117.731 4.781 4.23 2.3
5 56.283 Sarpang 5 62.098 5.815 10.33 1.2
6 39.908 Paro 6 53.836 13.928 34.90 1.1
7 22.793 Trashigang 7 26.597 3.804 16.69 0.5
8 13.338 Mongar 8 17.956 4.618 34.62 0.4
9 14.094 W/Phodrang 9 11.198 (2.896) (20.55) 0.2
10 9.689 Bumthang 10 7.847 (1.842) (19.01) 0.2
11 6.265 Punakha 11 6.470 0.205 3.27 0.1
13 5.504 Zhemgang 12 6.454 0.95 17.26 0.1
17 3.933 Trashi Yangtse 13 5.708 1.775 45.13 0.1
12 4.741 Haa 14 5.410 0.669 14.11 0.1
14 5.539 Trongsa 15 4.723 (0.816) (14.73) 0.1
15 3.369 Lhuentse 16 4.049 0.68 20.18 0.1
16 3.419 Tsirang 17 3.595 0.176 5.15 0.1
19 2.642 Dagana 18 2.921 0.279 10.56 0.1
18 2.900 Pema Gatshel 19 2.597 (0.303) (10.45) 0.1
20 0.354 Gasa 20 0.779 0.425 120.06 0.0
Total Rev. 4,630.438 5,064.823 434.385 9.38 99.1
The above figures represent collections made by various bank branches under respective Dzongkhag’s
jurisdiction.
Chukha
63%
Thimphu
24%
Others
2%
Samtse
6%
Sarpang
1%Paro
1% Samdrup
Jongkhar
2%
15
REVENUE REPORT 2001-2002
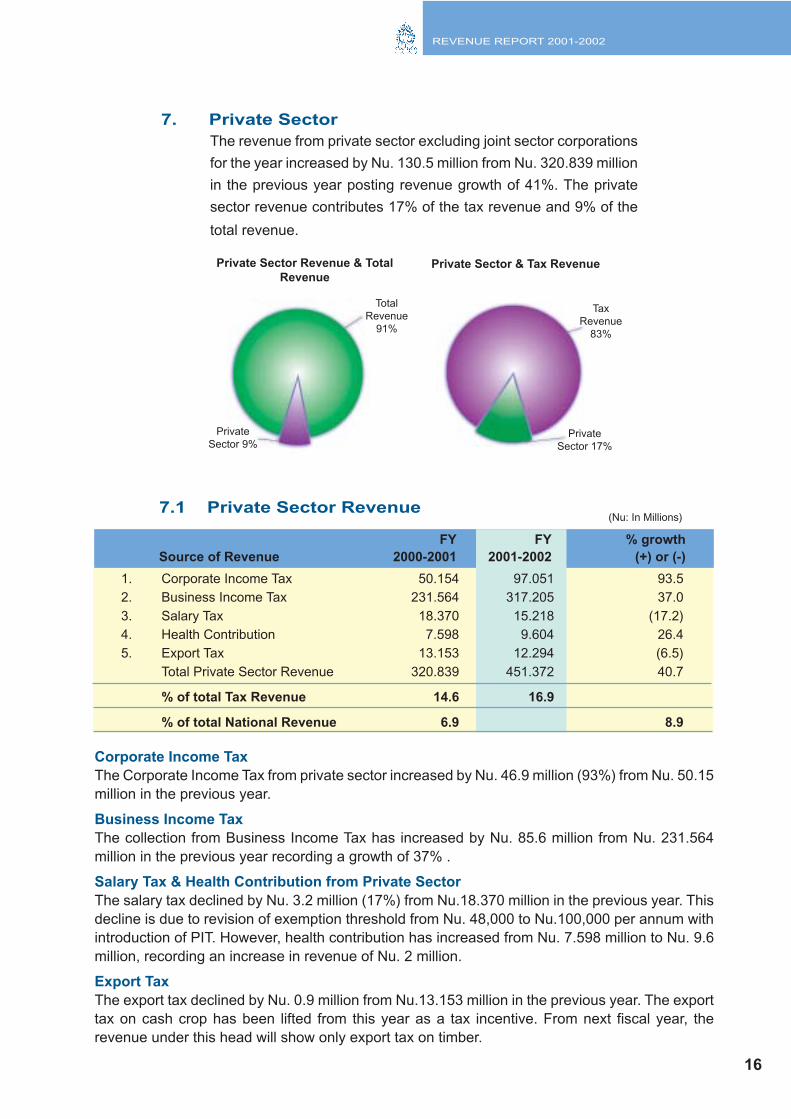
7. Private Sector
The revenue from private sector excluding joint sector corporations
for the year increased by Nu. 130.5 million from Nu. 320.839 million
in the previous year posting revenue growth of 41%. The private
sector revenue contributes 17% of the tax revenue and 9% of the
total revenue.
7.1 Private Sector Revenue
Corporate Income Tax
The Corporate Income Tax from private sector increased by Nu. 46.9 million (93%) from Nu. 50.15
million in the previous year.
Business Income Tax
The collection from Business Income Tax has increased by Nu. 85.6 million from Nu. 231.564
million in the previous year recording a growth of 37% .
Salary Tax & Health Contribution from Private Sector
The salary tax declined by Nu. 3.2 million (17%) from Nu.18.370 million in the previous year. This
decline is due to revision of exemption threshold from Nu. 48,000 to Nu.100,000 per annum with
introduction of PIT. However, health contribution has increased from Nu. 7.598 million to Nu. 9.6
million, recording an increase in revenue of Nu. 2 million.
Export Tax
The export tax declined by Nu. 0.9 million from Nu.13.153 million in the previous year. The export
tax on cash crop has been lifted from this year as a tax incentive. From next fiscal year, the
revenue under this head will show only export tax on timber.
Private Sector Revenue & Total
RevenuePrivate Sector & Tax Revenue
Total
Revenue
91%
Tax
Revenue
83%
Private
Sector 9%Private
Sector 17%
16
(Nu: In Millions)
FY FY % growth
Source of Revenue 2000-2001 2001-2002 (+) or (-)
1. Corporate Income Tax 50.154 97.051 93.5
2. Business Income Tax 231.564 317.205 37.0
3. Salary Tax 18.370 15.218 (17.2)
4. Health Contribution 7.598 9.604 26.4
5. Export Tax 13.153 12.294 (6.5)
Total Private Sector Revenue 320.839 451.372 40.7
% of total Tax Revenue 14.6 16.9
% of total National Revenue 6.9 8.9
REVENUE REPORT 2001-2002
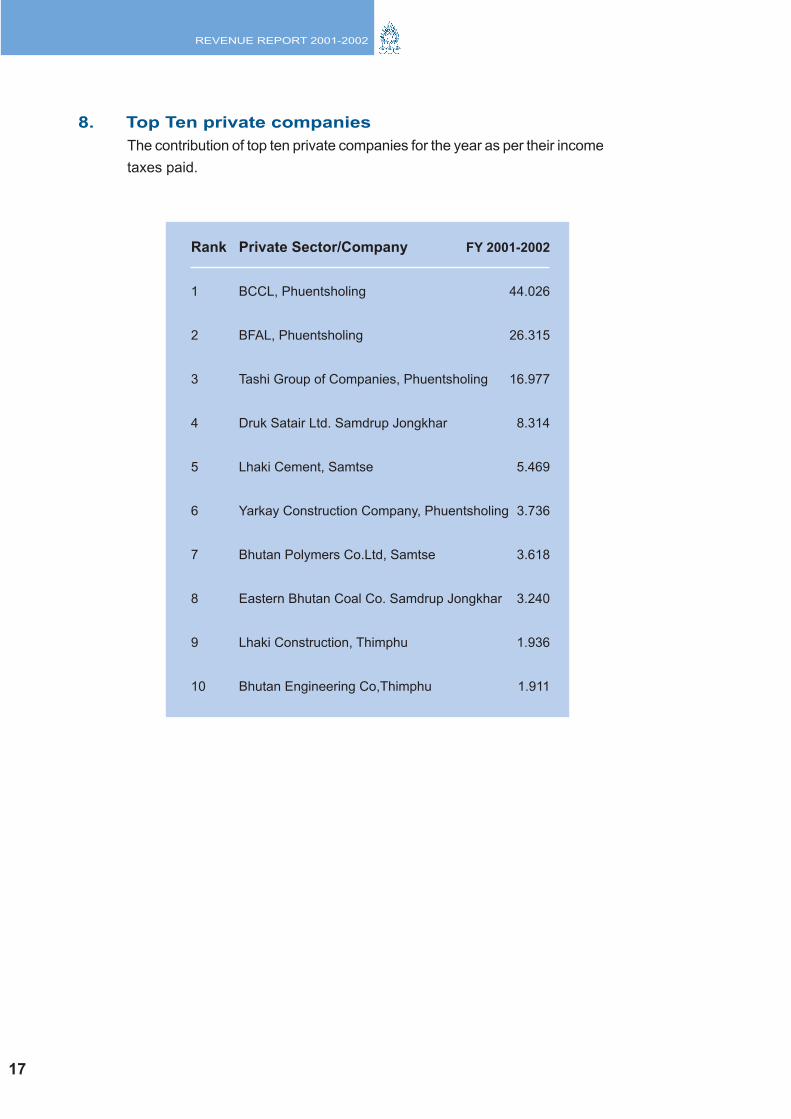
Rank Private Sector/Company FY 2001-2002
1 BCCL, Phuentsholing 44.026
2 BFAL, Phuentsholing 26.315
3 Tashi Group of Companies, Phuentsholing 16.977
4 Druk Satair Ltd. Samdrup Jongkhar 8.314
5 Lhaki Cement, Samtse 5.469
6 Yarkay Construction Company, Phuentsholing 3.736
7 Bhutan Polymers Co.Ltd, Samtse 3.618
8 Eastern Bhutan Coal Co. Samdrup Jongkhar 3.240
9 Lhaki Construction, Thimphu 1.936
10 Bhutan Engineering Co,Thimphu 1.911
8. Top Ten private companies
The contribution of top ten private companies for the year as per their income
taxes paid.
17
REVENUE REPORT 2001-2002
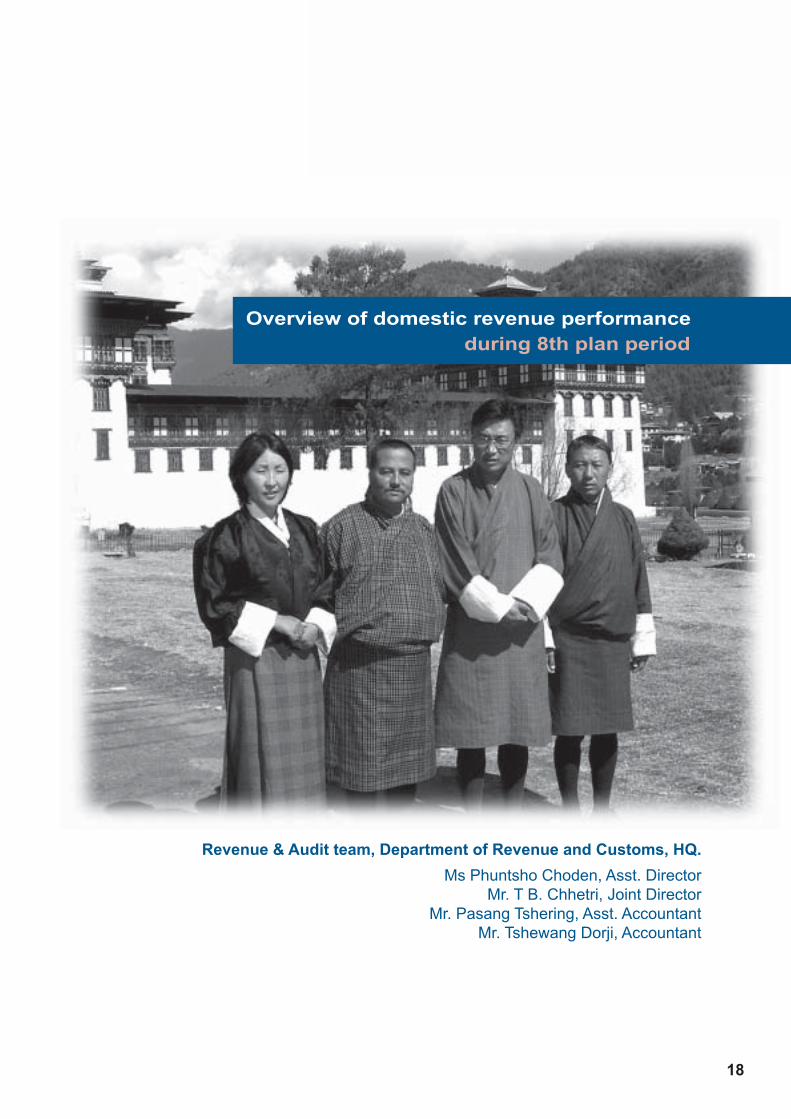
Overview of domestic revenue performance
during 8th plan period
Revenue & Audit team, Department of Revenue and Customs, HQ.
Ms Phuntsho Choden, Asst. Director
Mr. T B. Chhetri, Joint Director
Mr. Pasang Tshering, Asst. Accountant
Mr. Tshewang Dorji, Accountant
18
REVENUE REPORT 2001-2002
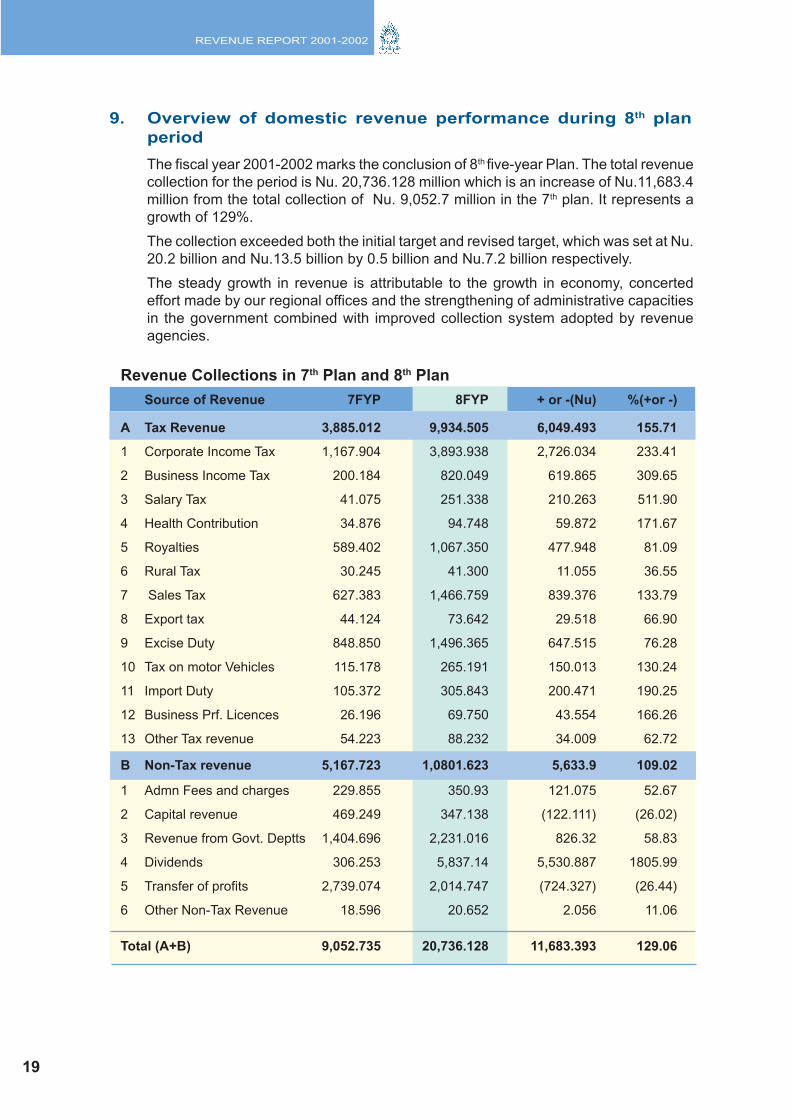
The fiscal year 2001-2002 marks the conclusion of 8th five-year Plan. The total revenue
collection for the period is Nu. 20,736.128 million which is an increase of Nu.11,683.4
million from the total collection of Nu. 9,052.7 million in the 7th plan. It represents a
growth of 129%.
The collection exceeded both the initial target and revised target, which was set at Nu.
20.2 billion and Nu.13.5 billion by 0.5 billion and Nu.7.2 billion respectively.
The steady growth in revenue is attributable to the growth in economy, concerted
effort made by our regional offices and the strengthening of administrative capacities
in the government combined with improved collection system adopted by revenue
agencies.
9. Overview of domestic revenue performance during 8th plan
period
19
Revenue Collections in 7th Plan and 8th Plan
Source of Revenue 7FYP 8FYP + or -(Nu) %(+or -)
A Tax Revenue 3,885.012 9,934.505 6,049.493 155.71
1 Corporate Income Tax 1,167.904 3,893.938 2,726.034 233.41
2 Business Income Tax 200.184 820.049 619.865 309.65
3 Salary Tax 41.075 251.338 210.263 511.90
4 Health Contribution 34.876 94.748 59.872 171.67
5 Royalties 589.402 1,067.350 477.948 81.09
6 Rural Tax 30.245 41.300 11.055 36.55
7 Sales Tax 627.383 1,466.759 839.376 133.79
8 Export tax 44.124 73.642 29.518 66.90
9 Excise Duty 848.850 1,496.365 647.515 76.28
10 Tax on motor Vehicles 115.178 265.191 150.013 130.24
11 Import Duty 105.372 305.843 200.471 190.25
12 Business Prf. Licences 26.196 69.750 43.554 166.26
13 Other Tax revenue 54.223 88.232 34.009 62.72
B Non-Tax revenue 5,167.723 1,0801.623 5,633.9 109.02
1 Admn Fees and charges 229.855 350.93 121.075 52.67
2 Capital revenue 469.249 347.138 (122.111) (26.02)
3 Revenue from Govt. Deptts 1,404.696 2,231.016 826.32 58.83
4 Dividends 306.253 5,837.14 5,530.887 1805.99
5 Transfer of profits 2,739.074 2,014.747 (724.327) (26.44)
6 Other Non-Tax Revenue 18.596 20.652 2.056 11.06
Total (A+B) 9,052.735 20,736.128 11,683.393 129.06
REVENUE REPORT 2001-2002
0
20
40
60
80
8th FYP7th FYP6th FYP
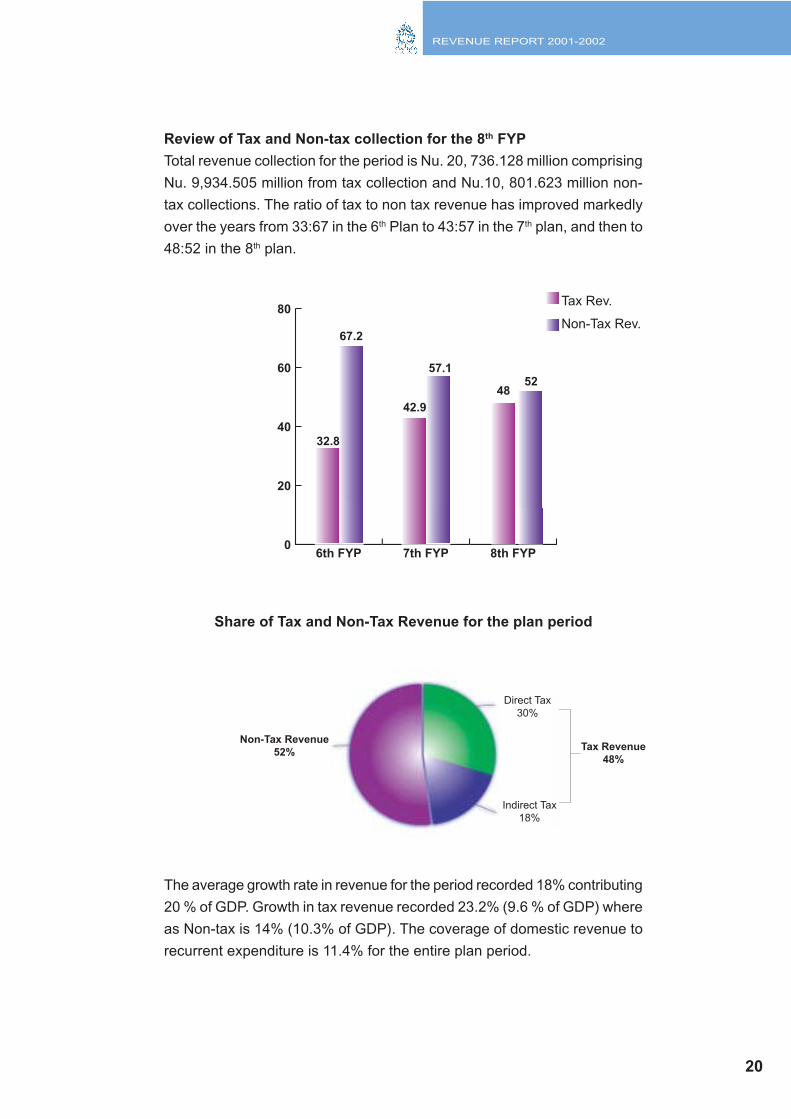
Review of Tax and Non-tax collection for the 8th FYP
Total revenue collection for the period is Nu. 20, 736.128 million comprising
Nu. 9,934.505 million from tax collection and Nu.10, 801.623 million non-
tax collections. The ratio of tax to non tax revenue has improved markedly
over the years from 33:67 in the 6th Plan to 43:57 in the 7th plan, and then to
48:52 in the 8th plan.
Share of Tax and Non-Tax Revenue for the plan period
The average growth rate in revenue for the period recorded 18% contributing
20 % of GDP. Growth in tax revenue recorded 23.2% (9.6 % of GDP) where
as Non-tax is 14% (10.3% of GDP). The coverage of domestic revenue to
recurrent expenditure is 11.4% for the entire plan period.
Tax Rev.
Non-Tax Rev.
Direct Tax
30%
Indirect Tax
18%
Non-Tax Revenue
52%
20
32.8
67.2
42.9
48
57.152
Tax Revenue
48%
REVENUE REPORT 2001-2002
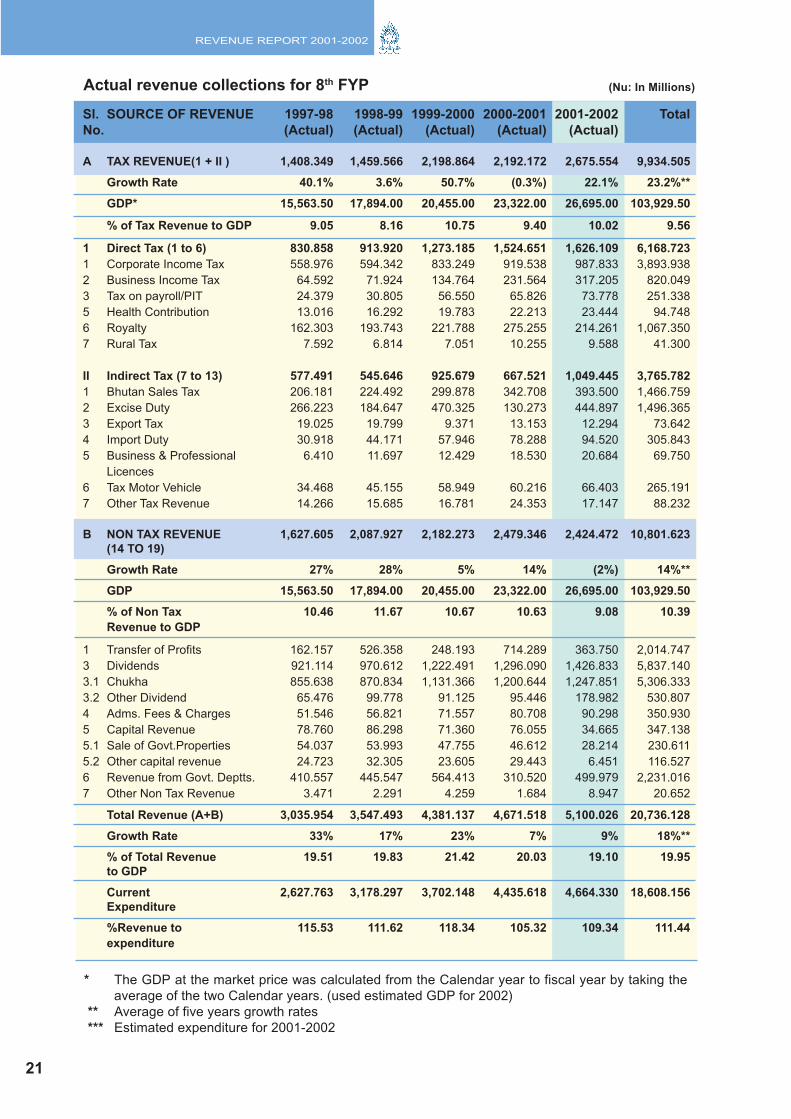
Actual revenue collections for 8th FYP
21
(Nu: In Millions)
***
* The GDP at the market price was calculated from the Calendar year to fiscal year by taking the
average of the two Calendar years. (used estimated GDP for 2002)
** Average of five years growth rates
*** Estimated expenditure for 2001-2002
Sl. SOURCE OF REVENUE 1997-98 1998-99 1999-2000 2000-2001 2001-2002 Total
No. (Actual) (Actual) (Actual) (Actual) (Actual)
A TAX REVENUE(1 + II ) 1,408.349 1,459.566 2,198.864 2,192.172 2,675.554 9,934.505
Growth Rate 40.1% 3.6% 50.7% (0.3%) 22.1% 23.2%**
GDP* 15,563.50 17,894.00 20,455.00 23,322.00 26,695.00 103,929.50
% of Tax Revenue to GDP 9.05 8.16 10.75 9.40 10.02 9.56
1 Direct Tax (1 to 6) 830.858 913.920 1,273.185 1,524.651 1,626.109 6,168.723
1 Corporate Income Tax 558.976 594.342 833.249 919.538 987.833 3,893.938
2 Business Income Tax 64.592 71.924 134.764 231.564 317.205 820.049
3 Tax on payroll/PIT 24.379 30.805 56.550 65.826 73.778 251.338
5 Health Contribution 13.016 16.292 19.783 22.213 23.444 94.748
6 Royalty 162.303 193.743 221.788 275.255 214.261 1,067.350
7 Rural Tax 7.592 6.814 7.051 10.255 9.588 41.300
II Indirect Tax (7 to 13) 577.491 545.646 925.679 667.521 1,049.445 3,765.782
1 Bhutan Sales Tax 206.181 224.492 299.878 342.708 393.500 1,466.759
2 Excise Duty 266.223 184.647 470.325 130.273 444.897 1,496.365
3 Export Tax 19.025 19.799 9.371 13.153 12.294 73.642
4 Import Duty 30.918 44.171 57.946 78.288 94.520 305.843
5 Business & Professional 6.410 11.697 12.429 18.530 20.684 69.750
Licences
6 Tax Motor Vehicle 34.468 45.155 58.949 60.216 66.403 265.191
7 Other Tax Revenue 14.266 15.685 16.781 24.353 17.147 88.232
B NON TAX REVENUE 1,627.605 2,087.927 2,182.273 2,479.346 2,424.472 10,801.623
(14 TO 19)
Growth Rate 27% 28% 5% 14% (2%) 14%**
GDP 15,563.50 17,894.00 20,455.00 23,322.00 26,695.00 103,929.50
% of Non Tax 10.46 11.67 10.67 10.63 9.08 10.39
Revenue to GDP
1 Transfer of Profits 162.157 526.358 248.193 714.289 363.750 2,014.747
3 Dividends 921.114 970.612 1,222.491 1,296.090 1,426.833 5,837.140
3.1 Chukha 855.638 870.834 1,131.366 1,200.644 1,247.851 5,306.333
3.2 Other Dividend 65.476 99.778 91.125 95.446 178.982 530.807
4 Adms. Fees & Charges 51.546 56.821 71.557 80.708 90.298 350.930
5 Capital Revenue 78.760 86.298 71.360 76.055 34.665 347.138
5.1 Sale of Govt.Properties 54.037 53.993 47.755 46.612 28.214 230.611
5.2 Other capital revenue 24.723 32.305 23.605 29.443 6.451 116.527
6 Revenue from Govt. Deptts. 410.557 445.547 564.413 310.520 499.979 2,231.016
7 Other Non Tax Revenue 3.471 2.291 4.259 1.684 8.947 20.652
Total Revenue (A+B) 3,035.954 3,547.493 4,381.137 4,671.518 5,100.026 20,736.128
Growth Rate 33% 17% 23% 7% 9% 18%**
% of Total Revenue 19.51 19.83 21.42 20.03 19.10 19.95
to GDP
Current 2,627.763 3,178.297 3,702.148 4,435.618 4,664.330 18,608.156
Expenditure
%Revenue to 115.53 111.62 118.34 105.32 109.34 111.44
expenditure

REVENUE REPORT 2001-2002
22
Regional
Directors
Tenzing NorbuGelephu RRCO
Jambay DorjiSamdrup Jongkhar RRCO
Karma LodayThimphu RRCO
Choyzang TashiPhuentsholing RRCO
Ugen NamgyalSamtse RRCO
REVENUE REPORT 2001-2002
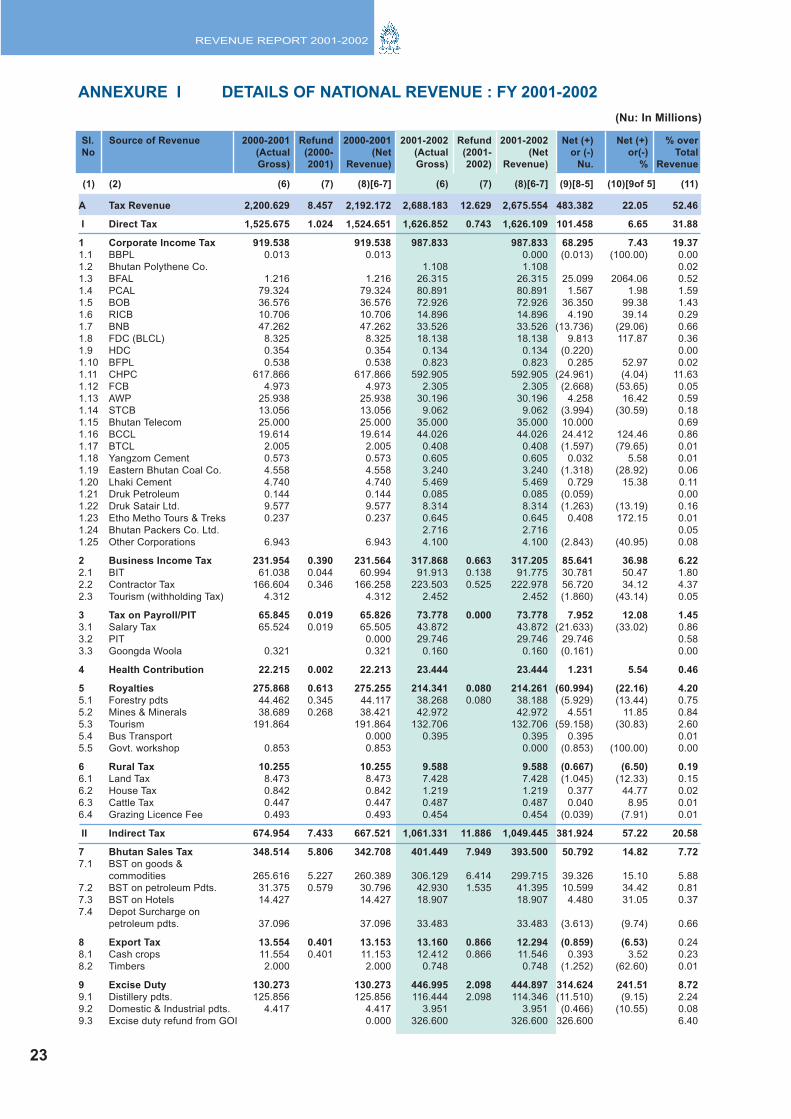
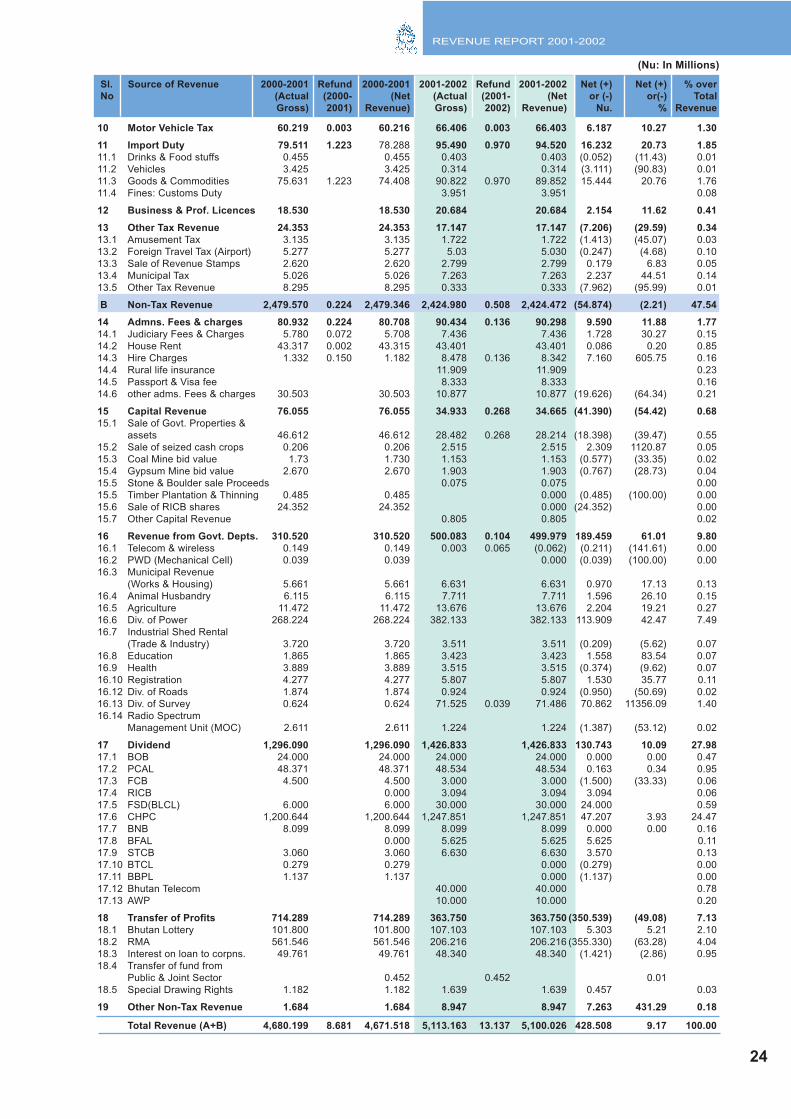
ANNEXURE I DETAILS OF NATIONAL REVENUE : FY 2001-2002
A Tax Revenue 2,200.629 8.457 2,192.172 2,688.183 12.629 2,675.554 483.382 22.05 52.46
I Direct Tax 1,525.675 1.024 1,524.651 1,626.852 0.743 1,626.109 101.458 6.65 31.88
1 Corporate Income Tax 919.538 919.538 987.833 987.833 68.295 7.43 19.37
1.1 BBPL 0.013 0.013 0.000 (0.013) (100.00) 0.00
1.2 Bhutan Polythene Co. 1.108 1.108 0.02
1.3 BFAL 1.216 1.216 26.315 26.315 25.099 2064.06 0.52
1.4 PCAL 79.324 79.324 80.891 80.891 1.567 1.98 1.59
1.5 BOB 36.576 36.576 72.926 72.926 36.350 99.38 1.43
1.6 RICB 10.706 10.706 14.896 14.896 4.190 39.14 0.29
1.7 BNB 47.262 47.262 33.526 33.526 (13.736) (29.06) 0.66
1.8 FDC (BLCL) 8.325 8.325 18.138 18.138 9.813 117.87 0.36
1.9 HDC 0.354 0.354 0.134 0.134 (0.220) 0.00
1.10 BFPL 0.538 0.538 0.823 0.823 0.285 52.97 0.02
1.11 CHPC 617.866 617.866 592.905 592.905 (24.961) (4.04) 11.63
1.12 FCB 4.973 4.973 2.305 2.305 (2.668) (53.65) 0.05
1.13 AWP 25.938 25.938 30.196 30.196 4.258 16.42 0.59
1.14 STCB 13.056 13.056 9.062 9.062 (3.994) (30.59) 0.18
1.15 Bhutan Telecom 25.000 25.000 35.000 35.000 10.000 0.69
1.16 BCCL 19.614 19.614 44.026 44.026 24.412 124.46 0.86
1.17 BTCL 2.005 2.005 0.408 0.408 (1.597) (79.65) 0.01
1.18 Yangzom Cement 0.573 0.573 0.605 0.605 0.032 5.58 0.01
1.19 Eastern Bhutan Coal Co. 4.558 4.558 3.240 3.240 (1.318) (28.92) 0.06
1.20 Lhaki Cement 4.740 4.740 5.469 5.469 0.729 15.38 0.11
1.21 Druk Petroleum 0.144 0.144 0.085 0.085 (0.059) 0.00
1.22 Druk Satair Ltd. 9.577 9.577 8.314 8.314 (1.263) (13.19) 0.16
1.23 Etho Metho Tours & Treks 0.237 0.237 0.645 0.645 0.408 172.15 0.01
1.24 Bhutan Packers Co. Ltd. 2.716 2.716 0.05
1.25 Other Corporations 6.943 6.943 4.100 4.100 (2.843) (40.95) 0.08
2 Business Income Tax 231.954 0.390 231.564 317.868 0.663 317.205 85.641 36.98 6.22
2.1 BIT 61.038 0.044 60.994 91.913 0.138 91.775 30.781 50.47 1.80
2.2 Contractor Tax 166.604 0.346 166.258 223.503 0.525 222.978 56.720 34.12 4.37
2.3 Tourism (withholding Tax) 4.312 4.312 2.452 2.452 (1.860) (43.14) 0.05
3 Tax on Payroll/PIT 65.845 0.019 65.826 73.778 0.000 73.778 7.952 12.08 1.45
3.1 Salary Tax 65.524 0.019 65.505 43.872 43.872 (21.633) (33.02) 0.86
3.2 PIT 0.000 29.746 29.746 29.746 0.58
3.3 Goongda Woola 0.321 0.321 0.160 0.160 (0.161) 0.00
4 Health Contribution 22.215 0.002 22.213 23.444 23.444 1.231 5.54 0.46
5 Royalties 275.868 0.613 275.255 214.341 0.080 214.261 (60.994) (22.16) 4.20
5.1 Forestry pdts 44.462 0.345 44.117 38.268 0.080 38.188 (5.929) (13.44) 0.75
5.2 Mines & Minerals 38.689 0.268 38.421 42.972 42.972 4.551 11.85 0.84
5.3 Tourism 191.864 191.864 132.706 132.706 (59.158) (30.83) 2.60
5.4 Bus Transport 0.000 0.395 0.395 0.395 0.01
5.5 Govt. workshop 0.853 0.853 0.000 (0.853) (100.00) 0.00
6 Rural Tax 10.255 10.255 9.588 9.588 (0.667) (6.50) 0.19
6.1 Land Tax 8.473 8.473 7.428 7.428 (1.045) (12.33) 0.15
6.2 House Tax 0.842 0.842 1.219 1.219 0.377 44.77 0.02
6.3 Cattle Tax 0.447 0.447 0.487 0.487 0.040 8.95 0.01
6.4 Grazing Licence Fee 0.493 0.493 0.454 0.454 (0.039) (7.91) 0.01
II Indirect Tax 674.954 7.433 667.521 1,061.331 11.886 1,049.445 381.924 57.22 20.58
7 Bhutan Sales Tax 348.514 5.806 342.708 401.449 7.949 393.500 50.792 14.82 7.72
7.1 BST on goods &
commodities 265.616 5.227 260.389 306.129 6.414 299.715 39.326 15.10 5.88
7.2 BST on petroleum Pdts. 31.375 0.579 30.796 42.930 1.535 41.395 10.599 34.42 0.81
7.3 BST on Hotels 14.427 14.427 18.907 18.907 4.480 31.05 0.37
7.4 Depot Surcharge on
petroleum pdts. 37.096 37.096 33.483 33.483 (3.613) (9.74) 0.66
8 Export Tax 13.554 0.401 13.153 13.160 0.866 12.294 (0.859) (6.53) 0.24
8.1 Cash crops 11.554 0.401 11.153 12.412 0.866 11.546 0.393 3.52 0.23
8.2 Timbers 2.000 2.000 0.748 0.748 (1.252) (62.60) 0.01
9 Excise Duty 130.273 130.273 446.995 2.098 444.897 314.624 241.51 8.72
9.1 Distillery pdts. 125.856 125.856 116.444 2.098 114.346 (11.510) (9.15) 2.24
9.2 Domestic & Industrial pdts. 4.417 4.417 3.951 3.951 (0.466) (10.55) 0.08
9.3 Excise duty refund from GOI 0.000 326.600 326.600 326.600 6.40
23
Sl. Source of Revenue 2000-2001 Refund 2000-2001 2001-2002 Refund 2001-2002 Net (+) Net (+) % over
No (Actual (2000- (Net (Actual (2001- (Net or (-) or(-) Total
Gross) 2001) Revenue) Gross) 2002) Revenue) Nu. % Revenue
(1) (2) (6) (7) (8)[6-7] (6) (7) (8)[6-7] (9)[8-5] (10)[9of 5] (11)
(Nu: In Millions)
REVENUE REPORT 2001-2002
(Nu: In Millions)
24
10 Motor Vehicle Tax 60.219 0.003 60.216 66.406 0.003 66.403 6.187 10.27 1.30
11 Import Duty 79.511 1.223 78.288 95.490 0.970 94.520 16.232 20.73 1.85
11.1 Drinks & Food stuffs 0.455 0.455 0.403 0.403 (0.052) (11.43) 0.01
11.2 Vehicles 3.425 3.425 0.314 0.314 (3.111) (90.83) 0.01
11.3 Goods & Commodities 75.631 1.223 74.408 90.822 0.970 89.852 15.444 20.76 1.76
11.4 Fines: Customs Duty 3.951 3.951 0.08
12 Business & Prof. Licences 18.530 18.530 20.684 20.684 2.154 11.62 0.41
13 Other Tax Revenue 24.353 24.353 17.147 17.147 (7.206) (29.59) 0.34
13.1 Amusement Tax 3.135 3.135 1.722 1.722 (1.413) (45.07) 0.03
13.2 Foreign Travel Tax (Airport) 5.277 5.277 5.03 5.030 (0.247) (4.68) 0.10
13.3 Sale of Revenue Stamps 2.620 2.620 2.799 2.799 0.179 6.83 0.05
13.4 Municipal Tax 5.026 5.026 7.263 7.263 2.237 44.51 0.14
13.5 Other Tax Revenue 8.295 8.295 0.333 0.333 (7.962) (95.99) 0.01
B Non-Tax Revenue 2,479.570 0.224 2,479.346 2,424.980 0.508 2,424.472 (54.874) (2.21) 47.54
14 Admns. Fees & charges 80.932 0.224 80.708 90.434 0.136 90.298 9.590 11.88 1.77
14.1 Judiciary Fees & Charges 5.780 0.072 5.708 7.436 7.436 1.728 30.27 0.15
14.2 House Rent 43.317 0.002 43.315 43.401 43.401 0.086 0.20 0.85
14.3 Hire Charges 1.332 0.150 1.182 8.478 0.136 8.342 7.160 605.75 0.16
14.4 Rural life insurance 11.909 11.909 0.23
14.5 Passport & Visa fee 8.333 8.333 0.16
14.6 other adms. Fees & charges 30.503 30.503 10.877 10.877 (19.626) (64.34) 0.21
15 Capital Revenue 76.055 76.055 34.933 0.268 34.665 (41.390) (54.42) 0.68
15.1 Sale of Govt. Properties &
assets 46.612 46.612 28.482 0.268 28.214 (18.398) (39.47) 0.55
15.2 Sale of seized cash crops 0.206 0.206 2.515 2.515 2.309 1120.87 0.05
15.3 Coal Mine bid value 1.73 1.730 1.153 1.153 (0.577) (33.35) 0.02
15.4 Gypsum Mine bid value 2.670 2.670 1.903 1.903 (0.767) (28.73) 0.04
15.5 Stone & Boulder sale Proceeds 0.075 0.075 0.00
15.5 Timber Plantation & Thinning 0.485 0.485 0.000 (0.485) (100.00) 0.00
15.6 Sale of RICB shares 24.352 24.352 0.000 (24.352) 0.00
15.7 Other Capital Revenue 0.805 0.805 0.02
16 Revenue from Govt. Depts. 310.520 310.520 500.083 0.104 499.979 189.459 61.01 9.80
16.1 Telecom & wireless 0.149 0.149 0.003 0.065 (0.062) (0.211) (141.61) 0.00
16.2 PWD (Mechanical Cell) 0.039 0.039 0.000 (0.039) (100.00) 0.00
16.3 Municipal Revenue
(Works & Housing) 5.661 5.661 6.631 6.631 0.970 17.13 0.13
16.4 Animal Husbandry 6.115 6.115 7.711 7.711 1.596 26.10 0.15
16.5 Agriculture 11.472 11.472 13.676 13.676 2.204 19.21 0.27
16.6 Div. of Power 268.224 268.224 382.133 382.133 113.909 42.47 7.49
16.7 Industrial Shed Rental
(Trade & Industry) 3.720 3.720 3.511 3.511 (0.209) (5.62) 0.07
16.8 Education 1.865 1.865 3.423 3.423 1.558 83.54 0.07
16.9 Health 3.889 3.889 3.515 3.515 (0.374) (9.62) 0.07
16.10 Registration 4.277 4.277 5.807 5.807 1.530 35.77 0.11
16.12 Div. of Roads 1.874 1.874 0.924 0.924 (0.950) (50.69) 0.02
16.13 Div. of Survey 0.624 0.624 71.525 0.039 71.486 70.862 11356.09 1.40
16.14 Radio Spectrum
Management Unit (MOC) 2.611 2.611 1.224 1.224 (1.387) (53.12) 0.02
17 Dividend 1,296.090 1,296.090 1,426.833 1,426.833 130.743 10.09 27.98
17.1 BOB 24.000 24.000 24.000 24.000 0.000 0.00 0.47
17.2 PCAL 48.371 48.371 48.534 48.534 0.163 0.34 0.95
17.3 FCB 4.500 4.500 3.000 3.000 (1.500) (33.33) 0.06
17.4 RICB 0.000 3.094 3.094 3.094 0.06
17.5 FSD(BLCL) 6.000 6.000 30.000 30.000 24.000 0.59
17.6 CHPC 1,200.644 1,200.644 1,247.851 1,247.851 47.207 3.93 24.47
17.7 BNB 8.099 8.099 8.099 8.099 0.000 0.00 0.16
17.8 BFAL 0.000 5.625 5.625 5.625 0.11
17.9 STCB 3.060 3.060 6.630 6.630 3.570 0.13
17.10 BTCL 0.279 0.279 0.000 (0.279) 0.00
17.11 BBPL 1.137 1.137 0.000 (1.137) 0.00
17.12 Bhutan Telecom 40.000 40.000 0.78
17.13 AWP 10.000 10.000 0.20
18 Transfer of Profits 714.289 714.289 363.750 363.750 (350.539) (49.08) 7.13
18.1 Bhutan Lottery 101.800 101.800 107.103 107.103 5.303 5.21 2.10
18.2 RMA 561.546 561.546 206.216 206.216 (355.330) (63.28) 4.04
18.3 Interest on loan to corpns. 49.761 49.761 48.340 48.340 (1.421) (2.86) 0.95
18.4 Transfer of fund from
Public & Joint Sector 0.452 0.452 0.01
18.5 Special Drawing Rights 1.182 1.182 1.639 1.639 0.457 0.03
19 Other Non-Tax Revenue 1.684 1.684 8.947 8.947 7.263 431.29 0.18
Total Revenue (A+B) 4,680.199 8.681 4,671.518 5,113.163 13.137 5,100.026 428.508 9.17 100.00
Sl. Source of Revenue 2000-2001 Refund 2000-2001 2001-2002 Refund 2001-2002 Net (+) Net (+) % over
No (Actual (2000- (Net (Actual (2001- (Net or (-) or(-) Total
Gross) 2001) Revenue) Gross) 2002) Revenue) Nu. % Revenue
REVENUE REPORT 2001-2002
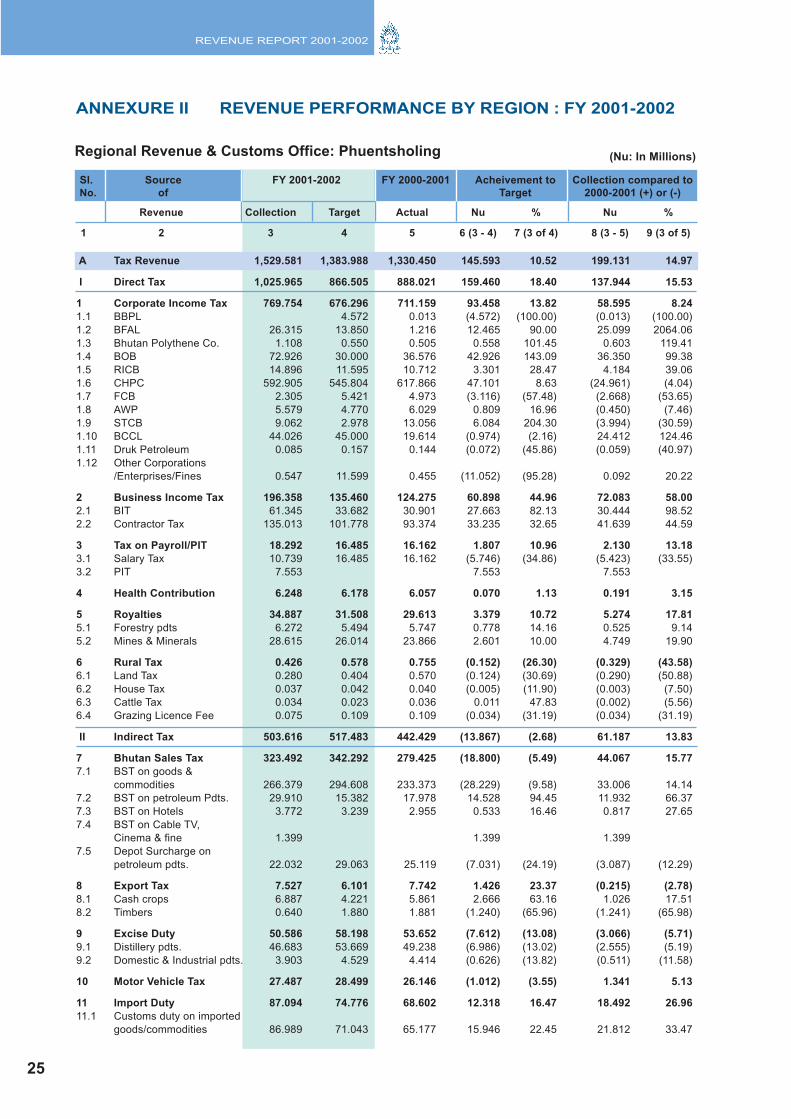
ANNEXURE II REVENUE PERFORMANCE BY REGION : FY 2001-2002
Regional Revenue & Customs Office: Phuentsholing
25
(Nu: In Millions)
Sl. Source FY 2001-2002 FY 2000-2001 Acheivement to Collection compared to
No. of Target 2000-2001 (+) or (-)
Revenue Collection Target Actual Nu % Nu %
1 2 3 4 5 6 (3 - 4) 7 (3 of 4) 8 (3 - 5) 9 (3 of 5)
A Tax Revenue 1,529.581 1,383.988 1,330.450 145.593 10.52 199.131 14.97
I Direct Tax 1,025.965 866.505 888.021 159.460 18.40 137.944 15.53
1 Corporate Income Tax 769.754 676.296 711.159 93.458 13.82 58.595 8.24
1.1 BBPL 4.572 0.013 (4.572) (100.00) (0.013) (100.00)
1.2 BFAL 26.315 13.850 1.216 12.465 90.00 25.099 2064.06
1.3 Bhutan Polythene Co. 1.108 0.550 0.505 0.558 101.45 0.603 119.41
1.4 BOB 72.926 30.000 36.576 42.926 143.09 36.350 99.38
1.5 RICB 14.896 11.595 10.712 3.301 28.47 4.184 39.06
1.6 CHPC 592.905 545.804 617.866 47.101 8.63 (24.961) (4.04)
1.7 FCB 2.305 5.421 4.973 (3.116) (57.48) (2.668) (53.65)
1.8 AWP 5.579 4.770 6.029 0.809 16.96 (0.450) (7.46)
1.9 STCB 9.062 2.978 13.056 6.084 204.30 (3.994) (30.59)
1.10 BCCL 44.026 45.000 19.614 (0.974) (2.16) 24.412 124.46
1.11 Druk Petroleum 0.085 0.157 0.144 (0.072) (45.86) (0.059) (40.97)
1.12 Other Corporations
/Enterprises/Fines 0.547 11.599 0.455 (11.052) (95.28) 0.092 20.22
2 Business Income Tax 196.358 135.460 124.275 60.898 44.96 72.083 58.00
2.1 BIT 61.345 33.682 30.901 27.663 82.13 30.444 98.52
2.2 Contractor Tax 135.013 101.778 93.374 33.235 32.65 41.639 44.59
3 Tax on Payroll/PIT 18.292 16.485 16.162 1.807 10.96 2.130 13.18
3.1 Salary Tax 10.739 16.485 16.162 (5.746) (34.86) (5.423) (33.55)
3.2 PIT 7.553 7.553 7.553
4 Health Contribution 6.248 6.178 6.057 0.070 1.13 0.191 3.15
5 Royalties 34.887 31.508 29.613 3.379 10.72 5.274 17.81
5.1 Forestry pdts 6.272 5.494 5.747 0.778 14.16 0.525 9.14
5.2 Mines & Minerals 28.615 26.014 23.866 2.601 10.00 4.749 19.90
6 Rural Tax 0.426 0.578 0.755 (0.152) (26.30) (0.329) (43.58)
6.1 Land Tax 0.280 0.404 0.570 (0.124) (30.69) (0.290) (50.88)
6.2 House Tax 0.037 0.042 0.040 (0.005) (11.90) (0.003) (7.50)
6.3 Cattle Tax 0.034 0.023 0.036 0.011 47.83 (0.002) (5.56)
6.4 Grazing Licence Fee 0.075 0.109 0.109 (0.034) (31.19) (0.034) (31.19)
II Indirect Tax 503.616 517.483 442.429 (13.867) (2.68) 61.187 13.83
7 Bhutan Sales Tax 323.492 342.292 279.425 (18.800) (5.49) 44.067 15.77
7.1 BST on goods &
commodities 266.379 294.608 233.373 (28.229) (9.58) 33.006 14.14
7.2 BST on petroleum Pdts. 29.910 15.382 17.978 14.528 94.45 11.932 66.37
7.3 BST on Hotels 3.772 3.239 2.955 0.533 16.46 0.817 27.65
7.4 BST on Cable TV,
Cinema & fine 1.399 1.399 1.399
7.5 Depot Surcharge on
petroleum pdts. 22.032 29.063 25.119 (7.031) (24.19) (3.087) (12.29)
8 Export Tax 7.527 6.101 7.742 1.426 23.37 (0.215) (2.78)
8.1 Cash crops 6.887 4.221 5.861 2.666 63.16 1.026 17.51
8.2 Timbers 0.640 1.880 1.881 (1.240) (65.96) (1.241) (65.98)
9 Excise Duty 50.586 58.198 53.652 (7.612) (13.08) (3.066) (5.71)
9.1 Distillery pdts. 46.683 53.669 49.238 (6.986) (13.02) (2.555) (5.19)
9.2 Domestic & Industrial pdts. 3.903 4.529 4.414 (0.626) (13.82) (0.511) (11.58)
10 Motor Vehicle Tax 27.487 28.499 26.146 (1.012) (3.55) 1.341 5.13
11 Import Duty 87.094 74.776 68.602 12.318 16.47 18.492 26.96
11.1 Customs duty on imported
goods/commodities 86.989 71.043 65.177 15.946 22.45 21.812 33.47
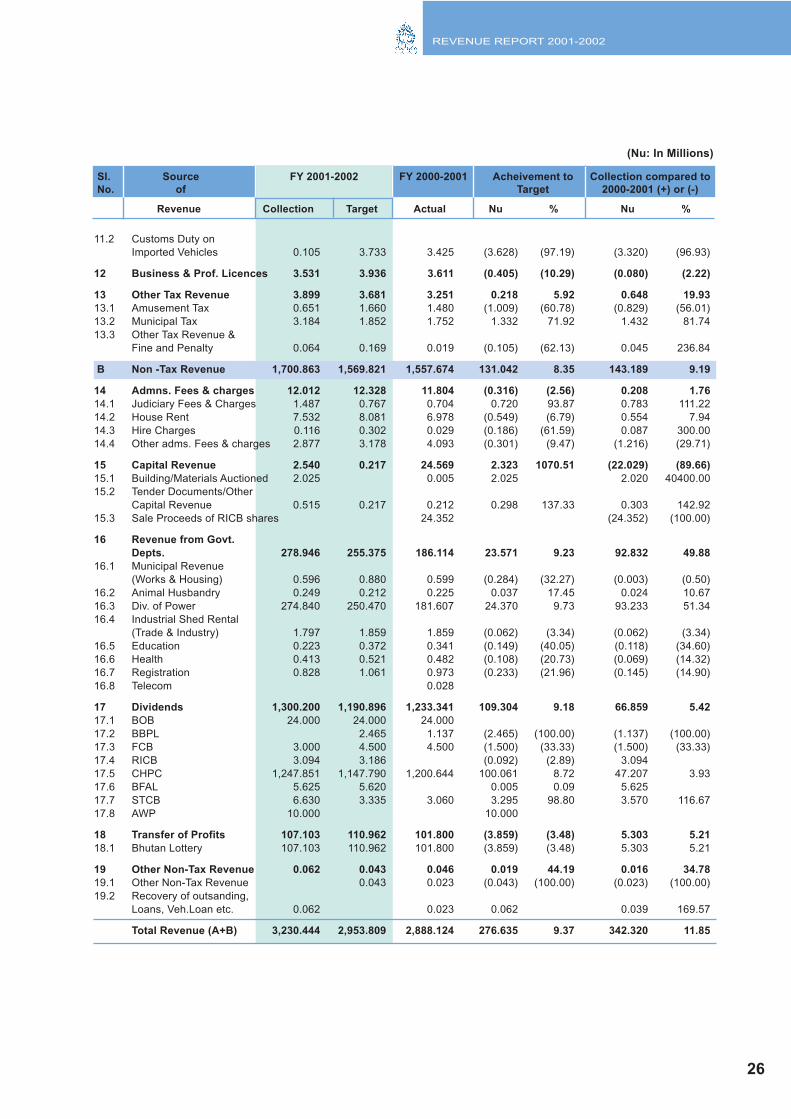
REVENUE REPORT 2001-2002
26
Revenue Collection Target Actual Nu % Nu %
Sl. Source FY 2001-2002 FY 2000-2001 Acheivement to Collection compared to
No. of Target 2000-2001 (+) or (-)
(Nu: In Millions)
11.2 Customs Duty on
Imported Vehicles 0.105 3.733 3.425 (3.628) (97.19) (3.320) (96.93)
12 Business & Prof. Licences 3.531 3.936 3.611 (0.405) (10.29) (0.080) (2.22)
13 Other Tax Revenue 3.899 3.681 3.251 0.218 5.92 0.648 19.93
13.1 Amusement Tax 0.651 1.660 1.480 (1.009) (60.78) (0.829) (56.01)
13.2 Municipal Tax 3.184 1.852 1.752 1.332 71.92 1.432 81.74
13.3 Other Tax Revenue &
Fine and Penalty 0.064 0.169 0.019 (0.105) (62.13) 0.045 236.84
B Non -Tax Revenue 1,700.863 1,569.821 1,557.674 131.042 8.35 143.189 9.19
14 Admns. Fees & charges 12.012 12.328 11.804 (0.316) (2.56) 0.208 1.76
14.1 Judiciary Fees & Charges 1.487 0.767 0.704 0.720 93.87 0.783 111.22
14.2 House Rent 7.532 8.081 6.978 (0.549) (6.79) 0.554 7.94
14.3 Hire Charges 0.116 0.302 0.029 (0.186) (61.59) 0.087 300.00
14.4 Other adms. Fees & charges 2.877 3.178 4.093 (0.301) (9.47) (1.216) (29.71)
15 Capital Revenue 2.540 0.217 24.569 2.323 1070.51 (22.029) (89.66)
15.1 Building/Materials Auctioned 2.025 0.005 2.025 2.020 40400.00
15.2 Tender Documents/Other
Capital Revenue 0.515 0.217 0.212 0.298 137.33 0.303 142.92
15.3 Sale Proceeds of RICB shares 24.352 (24.352) (100.00)
16 Revenue from Govt.
Depts. 278.946 255.375 186.114 23.571 9.23 92.832 49.88
16.1 Municipal Revenue
(Works & Housing) 0.596 0.880 0.599 (0.284) (32.27) (0.003) (0.50)
16.2 Animal Husbandry 0.249 0.212 0.225 0.037 17.45 0.024 10.67
16.3 Div. of Power 274.840 250.470 181.607 24.370 9.73 93.233 51.34
16.4 Industrial Shed Rental
(Trade & Industry) 1.797 1.859 1.859 (0.062) (3.34) (0.062) (3.34)
16.5 Education 0.223 0.372 0.341 (0.149) (40.05) (0.118) (34.60)
16.6 Health 0.413 0.521 0.482 (0.108) (20.73) (0.069) (14.32)
16.7 Registration 0.828 1.061 0.973 (0.233) (21.96) (0.145) (14.90)
16.8 Telecom 0.028
17 Dividends 1,300.200 1,190.896 1,233.341 109.304 9.18 66.859 5.42
17.1 BOB 24.000 24.000 24.000
17.2 BBPL 2.465 1.137 (2.465) (100.00) (1.137) (100.00)
17.3 FCB 3.000 4.500 4.500 (1.500) (33.33) (1.500) (33.33)
17.4 RICB 3.094 3.186 (0.092) (2.89) 3.094
17.5 CHPC 1,247.851 1,147.790 1,200.644 100.061 8.72 47.207 3.93
17.6 BFAL 5.625 5.620 0.005 0.09 5.625
17.7 STCB 6.630 3.335 3.060 3.295 98.80 3.570 116.67
17.8 AWP 10.000 10.000
18 Transfer of Profits 107.103 110.962 101.800 (3.859) (3.48) 5.303 5.21
18.1 Bhutan Lottery 107.103 110.962 101.800 (3.859) (3.48) 5.303 5.21
19 Other Non-Tax Revenue 0.062 0.043 0.046 0.019 44.19 0.016 34.78
19.1 Other Non-Tax Revenue 0.043 0.023 (0.043) (100.00) (0.023) (100.00)
19.2 Recovery of outsanding,
Loans, Veh.Loan etc. 0.062 0.023 0.062 0.039 169.57
Total Revenue (A+B) 3,230.444 2,953.809 2,888.124 276.635 9.37 342.320 11.85
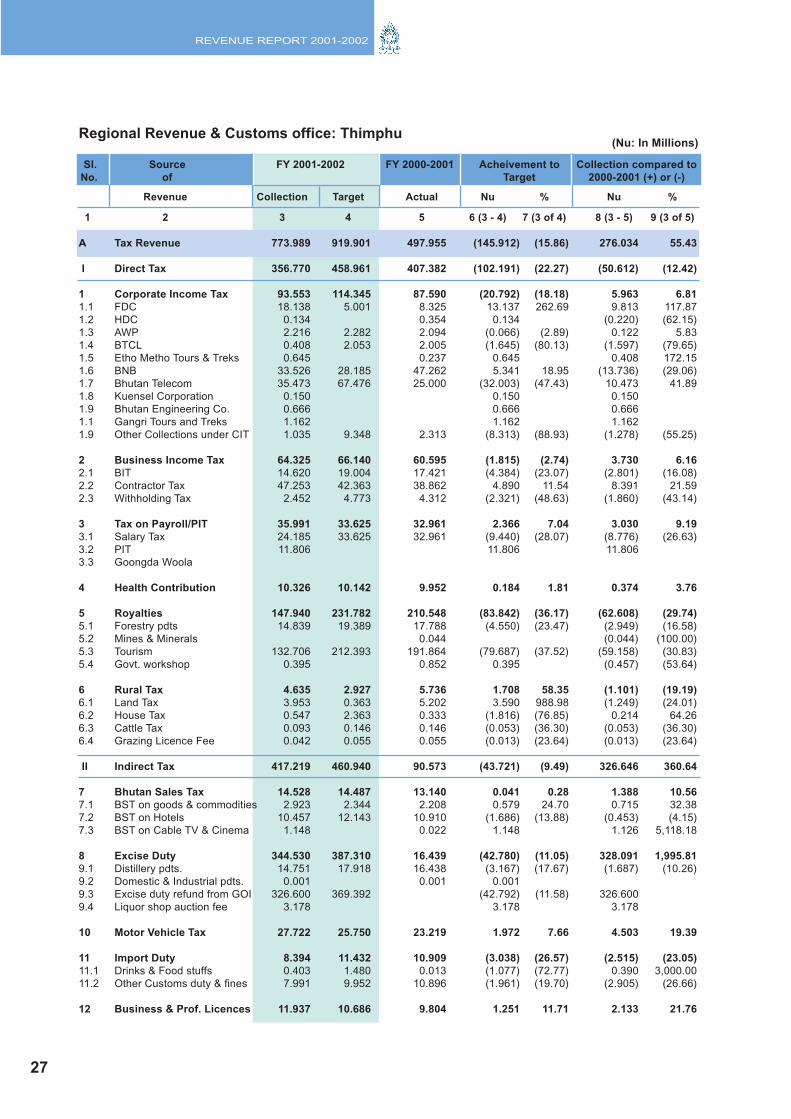
REVENUE REPORT 2001-2002
Regional Revenue & Customs office: Thimphu
Revenue Collection Target Actual Nu % Nu %
1 2 3 4 5 6 (3 - 4) 7 (3 of 4) 8 (3 - 5) 9 (3 of 5)
Sl. Source FY 2001-2002 FY 2000-2001 Acheivement to Collection compared to
No. of Target 2000-2001 (+) or (-)
27
(Nu: In Millions)
A Tax Revenue 773.989 919.901 497.955 (145.912) (15.86) 276.034 55.43
I Direct Tax 356.770 458.961 407.382 (102.191) (22.27) (50.612) (12.42)
1 Corporate Income Tax 93.553 114.345 87.590 (20.792) (18.18) 5.963 6.81
1.1 FDC 18.138 5.001 8.325 13.137 262.69 9.813 117.87
1.2 HDC 0.134 0.354 0.134 (0.220) (62.15)
1.3 AWP 2.216 2.282 2.094 (0.066) (2.89) 0.122 5.83
1.4 BTCL 0.408 2.053 2.005 (1.645) (80.13) (1.597) (79.65)
1.5 Etho Metho Tours & Treks 0.645 0.237 0.645 0.408 172.15
1.6 BNB 33.526 28.185 47.262 5.341 18.95 (13.736) (29.06)
1.7 Bhutan Telecom 35.473 67.476 25.000 (32.003) (47.43) 10.473 41.89
1.8 Kuensel Corporation 0.150 0.150 0.150
1.9 Bhutan Engineering Co. 0.666 0.666 0.666
1.1 Gangri Tours and Treks 1.162 1.162 1.162
1.9 Other Collections under CIT 1.035 9.348 2.313 (8.313) (88.93) (1.278) (55.25)
2 Business Income Tax 64.325 66.140 60.595 (1.815) (2.74) 3.730 6.16
2.1 BIT 14.620 19.004 17.421 (4.384) (23.07) (2.801) (16.08)
2.2 Contractor Tax 47.253 42.363 38.862 4.890 11.54 8.391 21.59
2.3 Withholding Tax 2.452 4.773 4.312 (2.321) (48.63) (1.860) (43.14)
3 Tax on Payroll/PIT 35.991 33.625 32.961 2.366 7.04 3.030 9.19
3.1 Salary Tax 24.185 33.625 32.961 (9.440) (28.07) (8.776) (26.63)
3.2 PIT 11.806 11.806 11.806
3.3 Goongda Woola
4 Health Contribution 10.326 10.142 9.952 0.184 1.81 0.374 3.76
5 Royalties 147.940 231.782 210.548 (83.842) (36.17) (62.608) (29.74)
5.1 Forestry pdts 14.839 19.389 17.788 (4.550) (23.47) (2.949) (16.58)
5.2 Mines & Minerals 0.044 (0.044) (100.00)
5.3 Tourism 132.706 212.393 191.864 (79.687) (37.52) (59.158) (30.83)
5.4 Govt. workshop 0.395 0.852 0.395 (0.457) (53.64)
6 Rural Tax 4.635 2.927 5.736 1.708 58.35 (1.101) (19.19)
6.1 Land Tax 3.953 0.363 5.202 3.590 988.98 (1.249) (24.01)
6.2 House Tax 0.547 2.363 0.333 (1.816) (76.85) 0.214 64.26
6.3 Cattle Tax 0.093 0.146 0.146 (0.053) (36.30) (0.053) (36.30)
6.4 Grazing Licence Fee 0.042 0.055 0.055 (0.013) (23.64) (0.013) (23.64)
II Indirect Tax 417.219 460.940 90.573 (43.721) (9.49) 326.646 360.64
7 Bhutan Sales Tax 14.528 14.487 13.140 0.041 0.28 1.388 10.56
7.1 BST on goods & commodities 2.923 2.344 2.208 0.579 24.70 0.715 32.38
7.2 BST on Hotels 10.457 12.143 10.910 (1.686) (13.88) (0.453) (4.15)
7.3 BST on Cable TV & Cinema 1.148 0.022 1.148 1.126 5,118.18
8 Excise Duty 344.530 387.310 16.439 (42.780) (11.05) 328.091 1,995.81
9.1 Distillery pdts. 14.751 17.918 16.438 (3.167) (17.67) (1.687) (10.26)
9.2 Domestic & Industrial pdts. 0.001 0.001 0.001
9.3 Excise duty refund from GOI 326.600 369.392 (42.792) (11.58) 326.600
9.4 Liquor shop auction fee 3.178 3.178 3.178
10 Motor Vehicle Tax 27.722 25.750 23.219 1.972 7.66 4.503 19.39
11 Import Duty 8.394 11.432 10.909 (3.038) (26.57) (2.515) (23.05)
11.1 Drinks & Food stuffs 0.403 1.480 0.013 (1.077) (72.77) 0.390 3,000.00
11.2 Other Customs duty & fines 7.991 9.952 10.896 (1.961) (19.70) (2.905) (26.66)
12 Business & Prof. Licences 11.937 10.686 9.804 1.251 11.71 2.133 21.76
REVENUE REPORT 2001-2002
28
Revenue Collection Target Actual Nu % Nu %
Sl. Source FY 2001-2002 FY 2000-2001 Acheivement to Collection compared to
No. of Target 2000-2001 (+) or (-)
(Nu: In Millions)
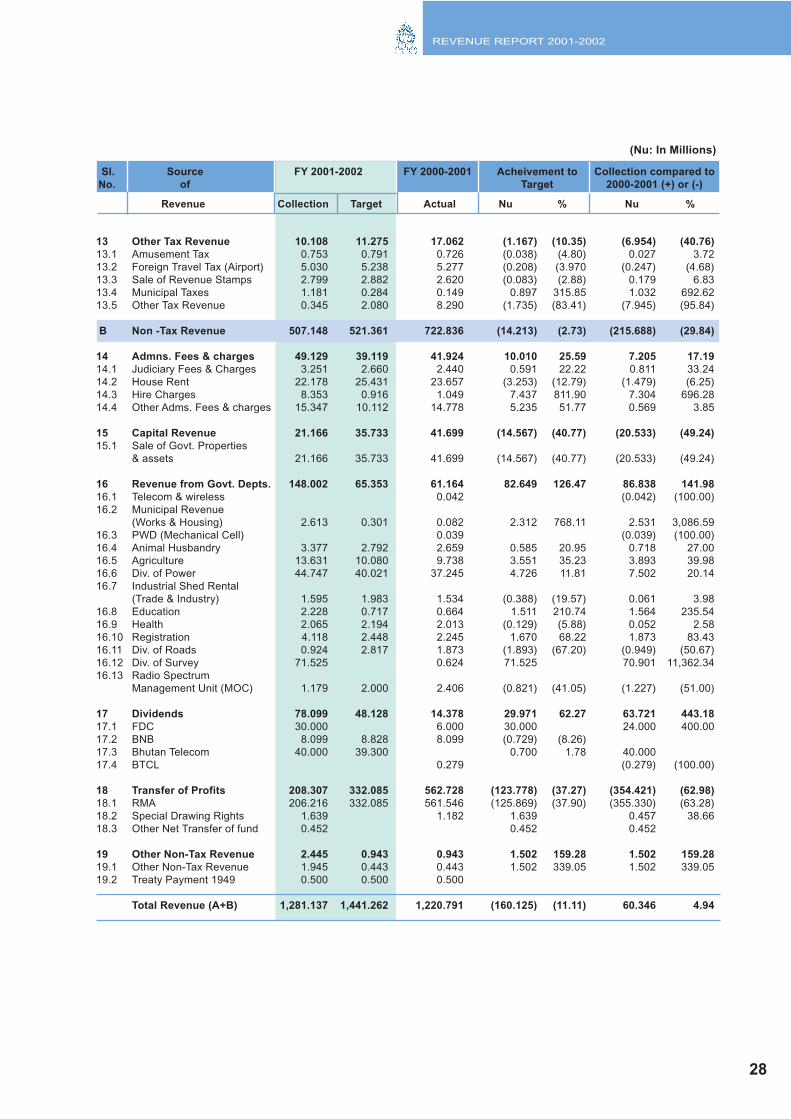
13 Other Tax Revenue 10.108 11.275 17.062 (1.167) (10.35) (6.954) (40.76)
13.1 Amusement Tax 0.753 0.791 0.726 (0.038) (4.80) 0.027 3.72
13.2 Foreign Travel Tax (Airport) 5.030 5.238 5.277 (0.208) (3.970 (0.247) (4.68)
13.3 Sale of Revenue Stamps 2.799 2.882 2.620 (0.083) (2.88) 0.179 6.83
13.4 Municipal Taxes 1.181 0.284 0.149 0.897 315.85 1.032 692.62
13.5 Other Tax Revenue 0.345 2.080 8.290 (1.735) (83.41) (7.945) (95.84)
B Non -Tax Revenue 507.148 521.361 722.836 (14.213) (2.73) (215.688) (29.84)
14 Admns. Fees & charges 49.129 39.119 41.924 10.010 25.59 7.205 17.19
14.1 Judiciary Fees & Charges 3.251 2.660 2.440 0.591 22.22 0.811 33.24
14.2 House Rent 22.178 25.431 23.657 (3.253) (12.79) (1.479) (6.25)
14.3 Hire Charges 8.353 0.916 1.049 7.437 811.90 7.304 696.28
14.4 Other Adms. Fees & charges 15.347 10.112 14.778 5.235 51.77 0.569 3.85
15 Capital Revenue 21.166 35.733 41.699 (14.567) (40.77) (20.533) (49.24)
15.1 Sale of Govt. Properties
& assets 21.166 35.733 41.699 (14.567) (40.77) (20.533) (49.24)
16 Revenue from Govt. Depts. 148.002 65.353 61.164 82.649 126.47 86.838 141.98
16.1 Telecom & wireless 0.042 (0.042) (100.00)
16.2 Municipal Revenue
(Works & Housing) 2.613 0.301 0.082 2.312 768.11 2.531 3,086.59
16.3 PWD (Mechanical Cell) 0.039 (0.039) (100.00)
16.4 Animal Husbandry 3.377 2.792 2.659 0.585 20.95 0.718 27.00
16.5 Agriculture 13.631 10.080 9.738 3.551 35.23 3.893 39.98
16.6 Div. of Power 44.747 40.021 37.245 4.726 11.81 7.502 20.14
16.7 Industrial Shed Rental
(Trade & Industry) 1.595 1.983 1.534 (0.388) (19.57) 0.061 3.98
16.8 Education 2.228 0.717 0.664 1.511 210.74 1.564 235.54
16.9 Health 2.065 2.194 2.013 (0.129) (5.88) 0.052 2.58
16.10 Registration 4.118 2.448 2.245 1.670 68.22 1.873 83.43
16.11 Div. of Roads 0.924 2.817 1.873 (1.893) (67.20) (0.949) (50.67)
16.12 Div. of Survey 71.525 0.624 71.525 70.901 11,362.34
16.13 Radio Spectrum
Management Unit (MOC) 1.179 2.000 2.406 (0.821) (41.05) (1.227) (51.00)
17 Dividends 78.099 48.128 14.378 29.971 62.27 63.721 443.18
17.1 FDC 30.000 6.000 30.000 24.000 400.00
17.2 BNB 8.099 8.828 8.099 (0.729) (8.26)
17.3 Bhutan Telecom 40.000 39.300 0.700 1.78 40.000
17.4 BTCL 0.279 (0.279) (100.00)
18 Transfer of Profits 208.307 332.085 562.728 (123.778) (37.27) (354.421) (62.98)
18.1 RMA 206.216 332.085 561.546 (125.869) (37.90) (355.330) (63.28)
18.2 Special Drawing Rights 1.639 1.182 1.639 0.457 38.66
18.3 Other Net Transfer of fund 0.452 0.452 0.452
19 Other Non-Tax Revenue 2.445 0.943 0.943 1.502 159.28 1.502 159.28
19.1 Other Non-Tax Revenue 1.945 0.443 0.443 1.502 339.05 1.502 339.05
19.2 Treaty Payment 1949 0.500 0.500 0.500
Total Revenue (A+B) 1,281.137 1,441.262 1,220.791 (160.125) (11.11) 60.346 4.94
REVENUE REPORT 2001-2002
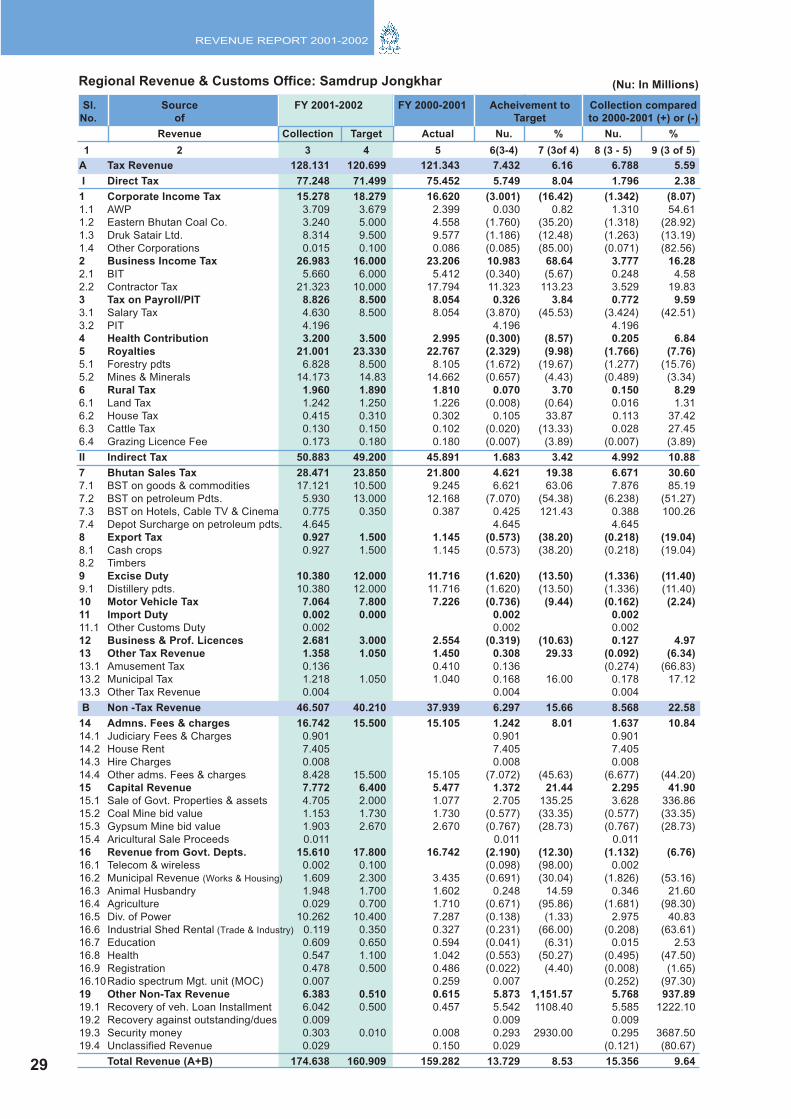
Regional Revenue & Customs Office: Samdrup Jongkhar
Revenue Collection Target Actual Nu. % Nu. %
1 2 3 4 5 6(3-4) 7 (3of 4) 8 (3 - 5) 9 (3 of 5)
Sl. Source FY 2001-2002 FY 2000-2001 Acheivement to Collection compared
No. of Target to 2000-2001 (+) or (-)
29
(Nu: In Millions)
A Tax Revenue 128.131 120.699 121.343 7.432 6.16 6.788 5.59
I Direct Tax 77.248 71.499 75.452 5.749 8.04 1.796 2.38
1 Corporate Income Tax 15.278 18.279 16.620 (3.001) (16.42) (1.342) (8.07)
1.1 AWP 3.709 3.679 2.399 0.030 0.82 1.310 54.61
1.2 Eastern Bhutan Coal Co. 3.240 5.000 4.558 (1.760) (35.20) (1.318) (28.92)
1.3 Druk Satair Ltd. 8.314 9.500 9.577 (1.186) (12.48) (1.263) (13.19)
1.4 Other Corporations 0.015 0.100 0.086 (0.085) (85.00) (0.071) (82.56)
2 Business Income Tax 26.983 16.000 23.206 10.983 68.64 3.777 16.28
2.1 BIT 5.660 6.000 5.412 (0.340) (5.67) 0.248 4.58
2.2 Contractor Tax 21.323 10.000 17.794 11.323 113.23 3.529 19.83
3 Tax on Payroll/PIT 8.826 8.500 8.054 0.326 3.84 0.772 9.59
3.1 Salary Tax 4.630 8.500 8.054 (3.870) (45.53) (3.424) (42.51)
3.2 PIT 4.196 4.196 4.196
4 Health Contribution 3.200 3.500 2.995 (0.300) (8.57) 0.205 6.84
5 Royalties 21.001 23.330 22.767 (2.329) (9.98) (1.766) (7.76)
5.1 Forestry pdts 6.828 8.500 8.105 (1.672) (19.67) (1.277) (15.76)
5.2 Mines & Minerals 14.173 14.83 14.662 (0.657) (4.43) (0.489) (3.34)
6 Rural Tax 1.960 1.890 1.810 0.070 3.70 0.150 8.29
6.1 Land Tax 1.242 1.250 1.226 (0.008) (0.64) 0.016 1.31
6.2 House Tax 0.415 0.310 0.302 0.105 33.87 0.113 37.42
6.3 Cattle Tax 0.130 0.150 0.102 (0.020) (13.33) 0.028 27.45
6.4 Grazing Licence Fee 0.173 0.180 0.180 (0.007) (3.89) (0.007) (3.89)
II Indirect Tax 50.883 49.200 45.891 1.683 3.42 4.992 10.88
7 Bhutan Sales Tax 28.471 23.850 21.800 4.621 19.38 6.671 30.60
7.1 BST on goods & commodities 17.121 10.500 9.245 6.621 63.06 7.876 85.19
7.2 BST on petroleum Pdts. 5.930 13.000 12.168 (7.070) (54.38) (6.238) (51.27)
7.3 BST on Hotels, Cable TV & Cinema 0.775 0.350 0.387 0.425 121.43 0.388 100.26
7.4 Depot Surcharge on petroleum pdts. 4.645 4.645 4.645
8 Export Tax 0.927 1.500 1.145 (0.573) (38.20) (0.218) (19.04)
8.1 Cash crops 0.927 1.500 1.145 (0.573) (38.20) (0.218) (19.04)
8.2 Timbers
9 Excise Duty 10.380 12.000 11.716 (1.620) (13.50) (1.336) (11.40)
9.1 Distillery pdts. 10.380 12.000 11.716 (1.620) (13.50) (1.336) (11.40)
10 Motor Vehicle Tax 7.064 7.800 7.226 (0.736) (9.44) (0.162) (2.24)
11 Import Duty 0.002 0.000 0.002 0.002
11.1 Other Customs Duty 0.002 0.002 0.002
12 Business & Prof. Licences 2.681 3.000 2.554 (0.319) (10.63) 0.127 4.97
13 Other Tax Revenue 1.358 1.050 1.450 0.308 29.33 (0.092) (6.34)
13.1 Amusement Tax 0.136 0.410 0.136 (0.274) (66.83)
13.2 Municipal Tax 1.218 1.050 1.040 0.168 16.00 0.178 17.12
13.3 Other Tax Revenue 0.004 0.004 0.004
B Non -Tax Revenue 46.507 40.210 37.939 6.297 15.66 8.568 22.58
14 Admns. Fees & charges 16.742 15.500 15.105 1.242 8.01 1.637 10.84
14.1 Judiciary Fees & Charges 0.901 0.901 0.901
14.2 House Rent 7.405 7.405 7.405
14.3 Hire Charges 0.008 0.008 0.008
14.4 Other adms. Fees & charges 8.428 15.500 15.105 (7.072) (45.63) (6.677) (44.20)
15 Capital Revenue 7.772 6.400 5.477 1.372 21.44 2.295 41.90
15.1 Sale of Govt. Properties & assets 4.705 2.000 1.077 2.705 135.25 3.628 336.86
15.2 Coal Mine bid value 1.153 1.730 1.730 (0.577) (33.35) (0.577) (33.35)
15.3 Gypsum Mine bid value 1.903 2.670 2.670 (0.767) (28.73) (0.767) (28.73)
15.4 Aricultural Sale Proceeds 0.011 0.011 0.011
16 Revenue from Govt. Depts. 15.610 17.800 16.742 (2.190) (12.30) (1.132) (6.76)
16.1 Telecom & wireless 0.002 0.100 (0.098) (98.00) 0.002
16.2 Municipal Revenue (Works & Housing) 1.609 2.300 3.435 (0.691) (30.04) (1.826) (53.16)
16.3 Animal Husbandry 1.948 1.700 1.602 0.248 14.59 0.346 21.60
16.4 Agriculture 0.029 0.700 1.710 (0.671) (95.86) (1.681) (98.30)
16.5 Div. of Power 10.262 10.400 7.287 (0.138) (1.33) 2.975 40.83
16.6 Industrial Shed Rental (Trade & Industry) 0.119 0.350 0.327 (0.231) (66.00) (0.208) (63.61)
16.7 Education 0.609 0.650 0.594 (0.041) (6.31) 0.015 2.53
16.8 Health 0.547 1.100 1.042 (0.553) (50.27) (0.495) (47.50)
16.9 Registration 0.478 0.500 0.486 (0.022) (4.40) (0.008) (1.65)
16.10Radio spectrum Mgt. unit (MOC) 0.007 0.259 0.007 (0.252) (97.30)
19 Other Non-Tax Revenue 6.383 0.510 0.615 5.873 1,151.57 5.768 937.89
19.1 Recovery of veh. Loan Installment 6.042 0.500 0.457 5.542 1108.40 5.585 1222.10
19.2 Recovery against outstanding/dues 0.009 0.009 0.009
19.3 Security money 0.303 0.010 0.008 0.293 2930.00 0.295 3687.50
19.4 Unclassified Revenue 0.029 0.150 0.029 (0.121) (80.67)
Total Revenue (A+B) 174.638 160.909 159.282 13.729 8.53 15.356 9.64
REVENUE REPORT 2001-2002
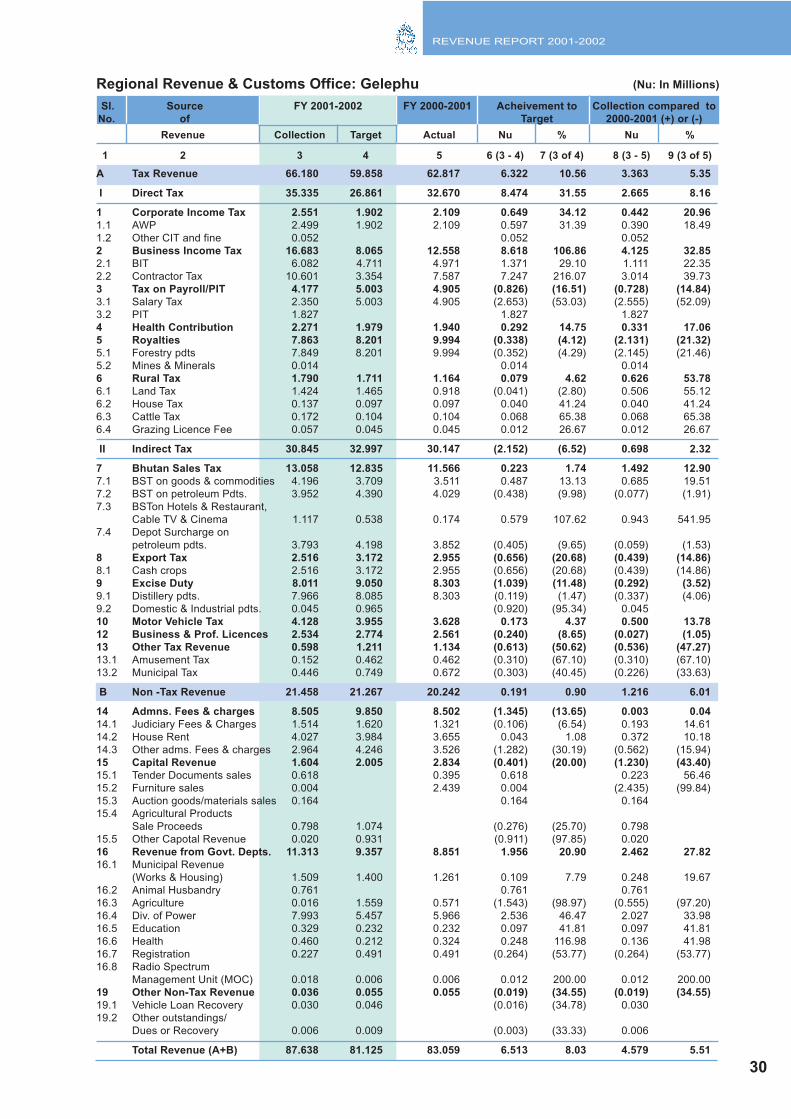
Regional Revenue & Customs Office: Gelephu
Revenue Collection Target Actual Nu % Nu %
1 2 3 4 5 6 (3 - 4) 7 (3 of 4) 8 (3 - 5) 9 (3 of 5)
Sl. Source FY 2001-2002 FY 2000-2001 Acheivement to Collection compared to
No. of Target 2000-2001 (+) or (-)
30
(Nu: In Millions)
A Tax Revenue 66.180 59.858 62.817 6.322 10.56 3.363 5.35
I Direct Tax 35.335 26.861 32.670 8.474 31.55 2.665 8.16
1 Corporate Income Tax 2.551 1.902 2.109 0.649 34.12 0.442 20.96
1.1 AWP 2.499 1.902 2.109 0.597 31.39 0.390 18.49
1.2 Other CIT and fine 0.052 0.052 0.052
2 Business Income Tax 16.683 8.065 12.558 8.618 106.86 4.125 32.85
2.1 BIT 6.082 4.711 4.971 1.371 29.10 1.111 22.35
2.2 Contractor Tax 10.601 3.354 7.587 7.247 216.07 3.014 39.73
3 Tax on Payroll/PIT 4.177 5.003 4.905 (0.826) (16.51) (0.728) (14.84)
3.1 Salary Tax 2.350 5.003 4.905 (2.653) (53.03) (2.555) (52.09)
3.2 PIT 1.827 1.827 1.827
4 Health Contribution 2.271 1.979 1.940 0.292 14.75 0.331 17.06
5 Royalties 7.863 8.201 9.994 (0.338) (4.12) (2.131) (21.32)
5.1 Forestry pdts 7.849 8.201 9.994 (0.352) (4.29) (2.145) (21.46)
5.2 Mines & Minerals 0.014 0.014 0.014
6 Rural Tax 1.790 1.711 1.164 0.079 4.62 0.626 53.78
6.1 Land Tax 1.424 1.465 0.918 (0.041) (2.80) 0.506 55.12
6.2 House Tax 0.137 0.097 0.097 0.040 41.24 0.040 41.24
6.3 Cattle Tax 0.172 0.104 0.104 0.068 65.38 0.068 65.38
6.4 Grazing Licence Fee 0.057 0.045 0.045 0.012 26.67 0.012 26.67
II Indirect Tax 30.845 32.997 30.147 (2.152) (6.52) 0.698 2.32
7 Bhutan Sales Tax 13.058 12.835 11.566 0.223 1.74 1.492 12.90
7.1 BST on goods & commodities 4.196 3.709 3.511 0.487 13.13 0.685 19.51
7.2 BST on petroleum Pdts. 3.952 4.390 4.029 (0.438) (9.98) (0.077) (1.91)
7.3 BSTon Hotels & Restaurant,
Cable TV & Cinema 1.117 0.538 0.174 0.579 107.62 0.943 541.95
7.4 Depot Surcharge on
petroleum pdts. 3.793 4.198 3.852 (0.405) (9.65) (0.059) (1.53)
8 Export Tax 2.516 3.172 2.955 (0.656) (20.68) (0.439) (14.86)
8.1 Cash crops 2.516 3.172 2.955 (0.656) (20.68) (0.439) (14.86)
9 Excise Duty 8.011 9.050 8.303 (1.039) (11.48) (0.292) (3.52)
9.1 Distillery pdts. 7.966 8.085 8.303 (0.119) (1.47) (0.337) (4.06)
9.2 Domestic & Industrial pdts. 0.045 0.965 (0.920) (95.34) 0.045
10 Motor Vehicle Tax 4.128 3.955 3.628 0.173 4.37 0.500 13.78
12 Business & Prof. Licences 2.534 2.774 2.561 (0.240) (8.65) (0.027) (1.05)
13 Other Tax Revenue 0.598 1.211 1.134 (0.613) (50.62) (0.536) (47.27)
13.1 Amusement Tax 0.152 0.462 0.462 (0.310) (67.10) (0.310) (67.10)
13.2 Municipal Tax 0.446 0.749 0.672 (0.303) (40.45) (0.226) (33.63)
B Non -Tax Revenue 21.458 21.267 20.242 0.191 0.90 1.216 6.01
14 Admns. Fees & charges 8.505 9.850 8.502 (1.345) (13.65) 0.003 0.04
14.1 Judiciary Fees & Charges 1.514 1.620 1.321 (0.106) (6.54) 0.193 14.61
14.2 House Rent 4.027 3.984 3.655 0.043 1.08 0.372 10.18
14.3 Other adms. Fees & charges 2.964 4.246 3.526 (1.282) (30.19) (0.562) (15.94)
15 Capital Revenue 1.604 2.005 2.834 (0.401) (20.00) (1.230) (43.40)
15.1 Tender Documents sales 0.618 0.395 0.618 0.223 56.46
15.2 Furniture sales 0.004 2.439 0.004 (2.435) (99.84)
15.3 Auction goods/materials sales 0.164 0.164 0.164
15.4 Agricultural Products
Sale Proceeds 0.798 1.074 (0.276) (25.70) 0.798
15.5 Other Capotal Revenue 0.020 0.931 (0.911) (97.85) 0.020
16 Revenue from Govt. Depts. 11.313 9.357 8.851 1.956 20.90 2.462 27.82
16.1 Municipal Revenue
(Works & Housing) 1.509 1.400 1.261 0.109 7.79 0.248 19.67
16.2 Animal Husbandry 0.761 0.761 0.761
16.3 Agriculture 0.016 1.559 0.571 (1.543) (98.97) (0.555) (97.20)
16.4 Div. of Power 7.993 5.457 5.966 2.536 46.47 2.027 33.98
16.5 Education 0.329 0.232 0.232 0.097 41.81 0.097 41.81
16.6 Health 0.460 0.212 0.324 0.248 116.98 0.136 41.98
16.7 Registration 0.227 0.491 0.491 (0.264) (53.77) (0.264) (53.77)
16.8 Radio Spectrum
Management Unit (MOC) 0.018 0.006 0.006 0.012 200.00 0.012 200.00
19 Other Non-Tax Revenue 0.036 0.055 0.055 (0.019) (34.55) (0.019) (34.55)
19.1 Vehicle Loan Recovery 0.030 0.046 (0.016) (34.78) 0.030
19.2 Other outstandings/
Dues or Recovery 0.006 0.009 (0.003) (33.33) 0.006
Total Revenue (A+B) 87.638 81.125 83.059 6.513 8.03 4.579 5.51
REVENUE REPORT 2001-2002
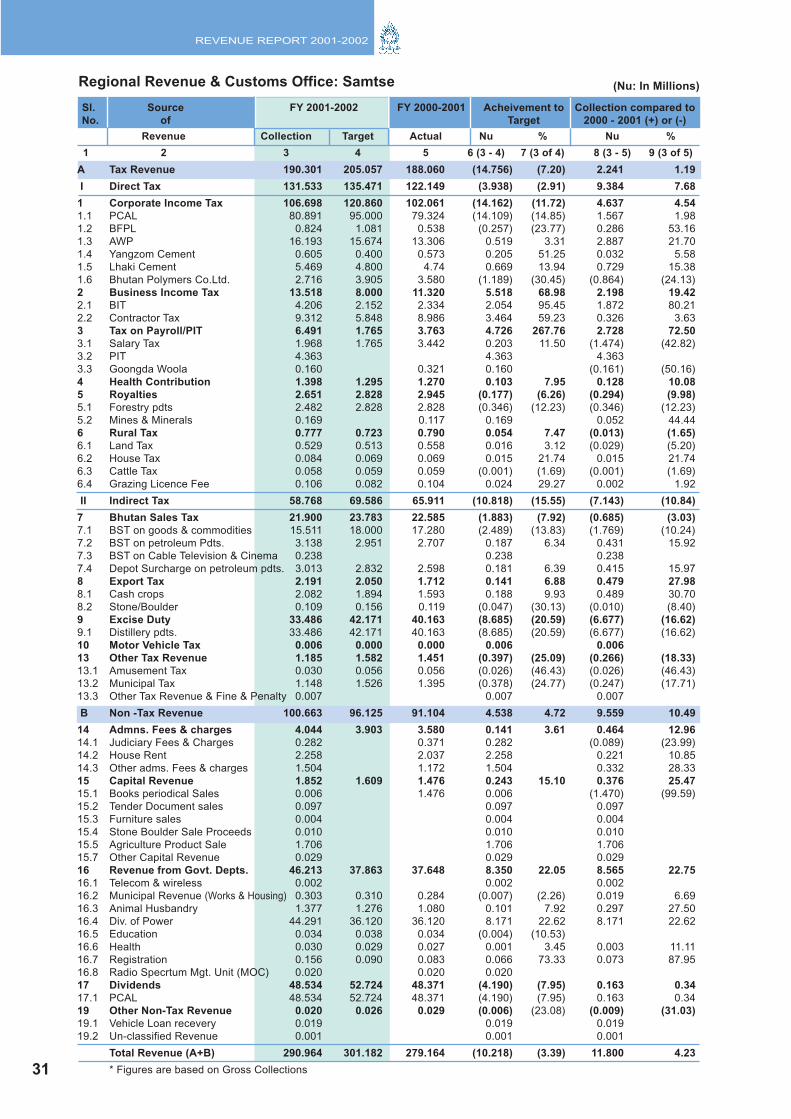
Regional Revenue & Customs Office: Samtse
Revenue Collection Target Actual Nu % Nu %
1 2 3 4 5 6 (3 - 4) 7 (3 of 4) 8 (3 - 5) 9 (3 of 5)
Sl. Source FY 2001-2002 FY 2000-2001 Acheivement to Collection compared to
No. of Target 2000 - 2001 (+) or (-)
31
(Nu: In Millions)
A Tax Revenue 190.301 205.057 188.060 (14.756) (7.20) 2.241 1.19
I Direct Tax 131.533 135.471 122.149 (3.938) (2.91) 9.384 7.68
1 Corporate Income Tax 106.698 120.860 102.061 (14.162) (11.72) 4.637 4.54
1.1 PCAL 80.891 95.000 79.324 (14.109) (14.85) 1.567 1.98
1.2 BFPL 0.824 1.081 0.538 (0.257) (23.77) 0.286 53.16
1.3 AWP 16.193 15.674 13.306 0.519 3.31 2.887 21.70
1.4 Yangzom Cement 0.605 0.400 0.573 0.205 51.25 0.032 5.58
1.5 Lhaki Cement 5.469 4.800 4.74 0.669 13.94 0.729 15.38
1.6 Bhutan Polymers Co.Ltd. 2.716 3.905 3.580 (1.189) (30.45) (0.864) (24.13)
2 Business Income Tax 13.518 8.000 11.320 5.518 68.98 2.198 19.42
2.1 BIT 4.206 2.152 2.334 2.054 95.45 1.872 80.21
2.2 Contractor Tax 9.312 5.848 8.986 3.464 59.23 0.326 3.63
3 Tax on Payroll/PIT 6.491 1.765 3.763 4.726 267.76 2.728 72.50
3.1 Salary Tax 1.968 1.765 3.442 0.203 11.50 (1.474) (42.82)
3.2 PIT 4.363 4.363 4.363
3.3 Goongda Woola 0.160 0.321 0.160 (0.161) (50.16)
4 Health Contribution 1.398 1.295 1.270 0.103 7.95 0.128 10.08
5 Royalties 2.651 2.828 2.945 (0.177) (6.26) (0.294) (9.98)
5.1 Forestry pdts 2.482 2.828 2.828 (0.346) (12.23) (0.346) (12.23)
5.2 Mines & Minerals 0.169 0.117 0.169 0.052 44.44
6 Rural Tax 0.777 0.723 0.790 0.054 7.47 (0.013) (1.65)
6.1 Land Tax 0.529 0.513 0.558 0.016 3.12 (0.029) (5.20)
6.2 House Tax 0.084 0.069 0.069 0.015 21.74 0.015 21.74
6.3 Cattle Tax 0.058 0.059 0.059 (0.001) (1.69) (0.001) (1.69)
6.4 Grazing Licence Fee 0.106 0.082 0.104 0.024 29.27 0.002 1.92
II Indirect Tax 58.768 69.586 65.911 (10.818) (15.55) (7.143) (10.84)
7 Bhutan Sales Tax 21.900 23.783 22.585 (1.883) (7.92) (0.685) (3.03)
7.1 BST on goods & commodities 15.511 18.000 17.280 (2.489) (13.83) (1.769) (10.24)
7.2 BST on petroleum Pdts. 3.138 2.951 2.707 0.187 6.34 0.431 15.92
7.3 BST on Cable Television & Cinema 0.238 0.238 0.238
7.4 Depot Surcharge on petroleum pdts. 3.013 2.832 2.598 0.181 6.39 0.415 15.97
8 Export Tax 2.191 2.050 1.712 0.141 6.88 0.479 27.98
8.1 Cash crops 2.082 1.894 1.593 0.188 9.93 0.489 30.70
8.2 Stone/Boulder 0.109 0.156 0.119 (0.047) (30.13) (0.010) (8.40)
9 Excise Duty 33.486 42.171 40.163 (8.685) (20.59) (6.677) (16.62)
9.1 Distillery pdts. 33.486 42.171 40.163 (8.685) (20.59) (6.677) (16.62)
10 Motor Vehicle Tax 0.006 0.000 0.000 0.006 0.006
13 Other Tax Revenue 1.185 1.582 1.451 (0.397) (25.09) (0.266) (18.33)
13.1 Amusement Tax 0.030 0.056 0.056 (0.026) (46.43) (0.026) (46.43)
13.2 Municipal Tax 1.148 1.526 1.395 (0.378) (24.77) (0.247) (17.71)
13.3 Other Tax Revenue & Fine & Penalty 0.007 0.007 0.007
B Non -Tax Revenue 100.663 96.125 91.104 4.538 4.72 9.559 10.49
14 Admns. Fees & charges 4.044 3.903 3.580 0.141 3.61 0.464 12.96
14.1 Judiciary Fees & Charges 0.282 0.371 0.282 (0.089) (23.99)
14.2 House Rent 2.258 2.037 2.258 0.221 10.85
14.3 Other adms. Fees & charges 1.504 1.172 1.504 0.332 28.33
15 Capital Revenue 1.852 1.609 1.476 0.243 15.10 0.376 25.47
15.1 Books periodical Sales 0.006 1.476 0.006 (1.470) (99.59)
15.2 Tender Document sales 0.097 0.097 0.097
15.3 Furniture sales 0.004 0.004 0.004
15.4 Stone Boulder Sale Proceeds 0.010 0.010 0.010
15.5 Agriculture Product Sale 1.706 1.706 1.706
15.7 Other Capital Revenue 0.029 0.029 0.029
16 Revenue from Govt. Depts. 46.213 37.863 37.648 8.350 22.05 8.565 22.75
16.1 Telecom & wireless 0.002 0.002 0.002
16.2 Municipal Revenue (Works & Housing) 0.303 0.310 0.284 (0.007) (2.26) 0.019 6.69
16.3 Animal Husbandry 1.377 1.276 1.080 0.101 7.92 0.297 27.50
16.4 Div. of Power 44.291 36.120 36.120 8.171 22.62 8.171 22.62
16.5 Education 0.034 0.038 0.034 (0.004) (10.53)
16.6 Health 0.030 0.029 0.027 0.001 3.45 0.003 11.11
16.7 Registration 0.156 0.090 0.083 0.066 73.33 0.073 87.95
16.8 Radio Specrtum Mgt. Unit (MOC) 0.020 0.020 0.020
17 Dividends 48.534 52.724 48.371 (4.190) (7.95) 0.163 0.34
17.1 PCAL 48.534 52.724 48.371 (4.190) (7.95) 0.163 0.34
19 Other Non-Tax Revenue 0.020 0.026 0.029 (0.006) (23.08) (0.009) (31.03)
19.1 Vehicle Loan recevery 0.019 0.019 0.019
19.2 Un-classified Revenue 0.001 0.001 0.001
Total Revenue (A+B) 290.964 301.182 279.164 (10.218) (3.39) 11.800 4.23
* Figures are based on Gross Collections31
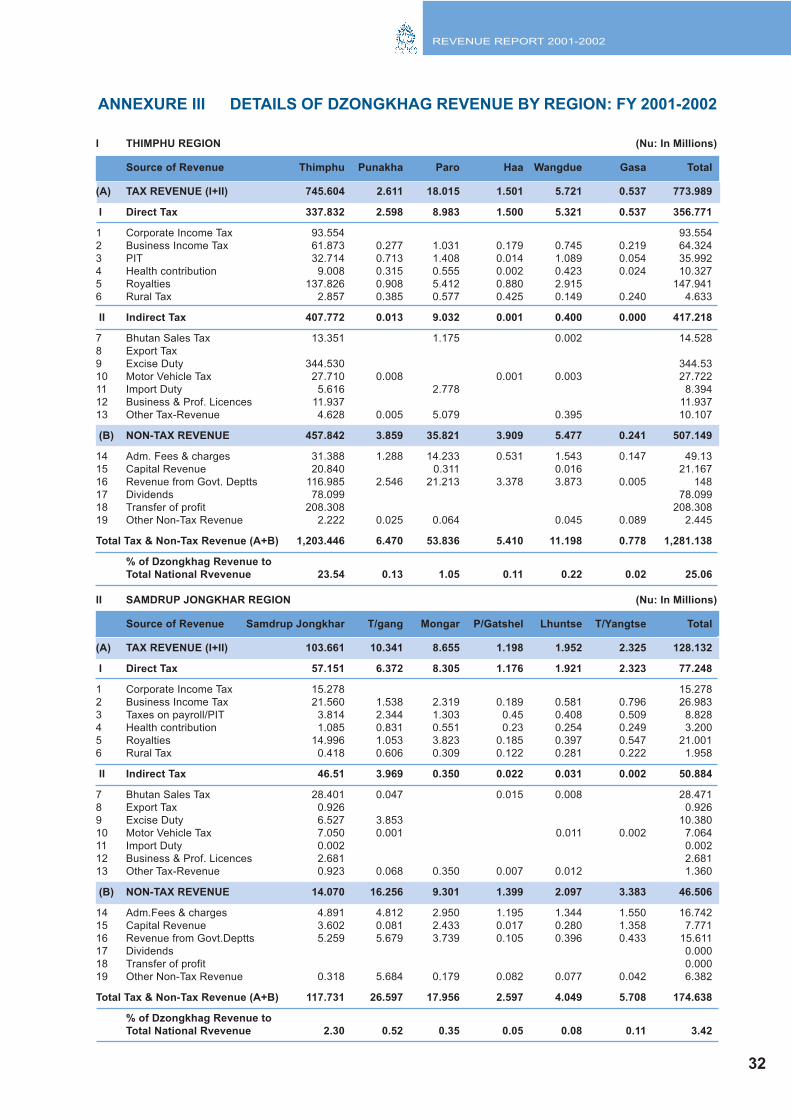
REVENUE REPORT 2001-2002
ANNEXURE III DETAILS OF DZONGKHAG REVENUE BY REGION: FY 2001-2002
32
I THIMPHU REGION (Nu: In Millions)
Source of Revenue Thimphu Punakha Paro Haa Wangdue Gasa Total
(A) TAX REVENUE (I+II) 745.604 2.611 18.015 1.501 5.721 0.537 773.989
I Direct Tax 337.832 2.598 8.983 1.500 5.321 0.537 356.771
1 Corporate Income Tax 93.554 93.554
2 Business Income Tax 61.873 0.277 1.031 0.179 0.745 0.219 64.324
3 PIT 32.714 0.713 1.408 0.014 1.089 0.054 35.992
4 Health contribution 9.008 0.315 0.555 0.002 0.423 0.024 10.327
5 Royalties 137.826 0.908 5.412 0.880 2.915 147.941
6 Rural Tax 2.857 0.385 0.577 0.425 0.149 0.240 4.633
II Indirect Tax 407.772 0.013 9.032 0.001 0.400 0.000 417.218
7 Bhutan Sales Tax 13.351 1.175 0.002 14.528
8 Export Tax
9 Excise Duty 344.530 344.53
10 Motor Vehicle Tax 27.710 0.008 0.001 0.003 27.722
11 Import Duty 5.616 2.778 8.394
12 Business & Prof. Licences 11.937 11.937
13 Other Tax-Revenue 4.628 0.005 5.079 0.395 10.107
(B) NON-TAX REVENUE 457.842 3.859 35.821 3.909 5.477 0.241 507.149
14 Adm. Fees & charges 31.388 1.288 14.233 0.531 1.543 0.147 49.13
15 Capital Revenue 20.840 0.311 0.016 21.167
16 Revenue from Govt. Deptts 116.985 2.546 21.213 3.378 3.873 0.005 148
17 Dividends 78.099 78.099
18 Transfer of profit 208.308 208.308
19 Other Non-Tax Revenue 2.222 0.025 0.064 0.045 0.089 2.445
Total Tax & Non-Tax Revenue (A+B) 1,203.446 6.470 53.836 5.410 11.198 0.778 1,281.138
% of Dzongkhag Revenue to
Total National Rvevenue 23.54 0.13 1.05 0.11 0.22 0.02 25.06
II SAMDRUP JONGKHAR REGION (Nu: In Millions)
Source of Revenue Samdrup Jongkhar T/gang Mongar P/Gatshel Lhuntse T/Yangtse Total
(A) TAX REVENUE (I+II) 103.661 10.341 8.655 1.198 1.952 2.325 128.132
I Direct Tax 57.151 6.372 8.305 1.176 1.921 2.323 77.248
1 Corporate Income Tax 15.278 15.278
2 Business Income Tax 21.560 1.538 2.319 0.189 0.581 0.796 26.983
3 Taxes on payroll/PIT 3.814 2.344 1.303 0.45 0.408 0.509 8.828
4 Health contribution 1.085 0.831 0.551 0.23 0.254 0.249 3.200
5 Royalties 14.996 1.053 3.823 0.185 0.397 0.547 21.001
6 Rural Tax 0.418 0.606 0.309 0.122 0.281 0.222 1.958
II Indirect Tax 46.51 3.969 0.350 0.022 0.031 0.002 50.884
7 Bhutan Sales Tax 28.401 0.047 0.015 0.008 28.471
8 Export Tax 0.926 0.926
9 Excise Duty 6.527 3.853 10.380
10 Motor Vehicle Tax 7.050 0.001 0.011 0.002 7.064
11 Import Duty 0.002 0.002
12 Business & Prof. Licences 2.681 2.681
13 Other Tax-Revenue 0.923 0.068 0.350 0.007 0.012 1.360
(B) NON-TAX REVENUE 14.070 16.256 9.301 1.399 2.097 3.383 46.506
14 Adm.Fees & charges 4.891 4.812 2.950 1.195 1.344 1.550 16.742
15 Capital Revenue 3.602 0.081 2.433 0.017 0.280 1.358 7.771
16 Revenue from Govt.Deptts 5.259 5.679 3.739 0.105 0.396 0.433 15.611
17 Dividends 0.000
18 Transfer of profit 0.000
19 Other Non-Tax Revenue 0.318 5.684 0.179 0.082 0.077 0.042 6.382
Total Tax & Non-Tax Revenue (A+B) 117.731 26.597 17.956 2.597 4.049 5.708 174.638
% of Dzongkhag Revenue to
Total National Rvevenue 2.30 0.52 0.35 0.05 0.08 0.11 3.42
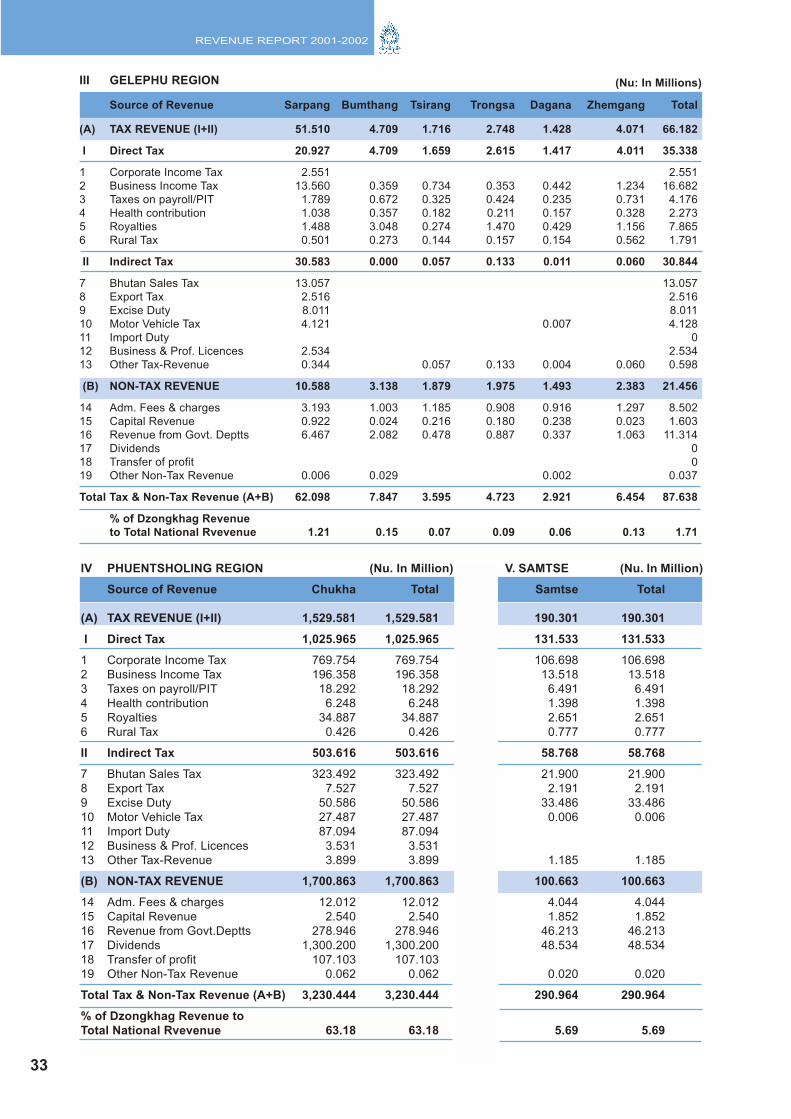
REVENUE REPORT 2001-2002
IV PHUENTSHOLING REGION (Nu. In Million) V. SAMTSE (Nu. In Million)
Source of Revenue Chukha Total Samtse Total
(A) TAX REVENUE (I+II) 1,529.581 1,529.581 190.301 190.301
I Direct Tax 1,025.965 1,025.965 131.533 131.533
1 Corporate Income Tax 769.754 769.754 106.698 106.698
2 Business Income Tax 196.358 196.358 13.518 13.518
3 Taxes on payroll/PIT 18.292 18.292 6.491 6.491
4 Health contribution 6.248 6.248 1.398 1.398
5 Royalties 34.887 34.887 2.651 2.651
6 Rural Tax 0.426 0.426 0.777 0.777
II Indirect Tax 503.616 503.616 58.768 58.768
7 Bhutan Sales Tax 323.492 323.492 21.900 21.900
8 Export Tax 7.527 7.527 2.191 2.191
9 Excise Duty 50.586 50.586 33.486 33.486
10 Motor Vehicle Tax 27.487 27.487 0.006 0.006
11 Import Duty 87.094 87.094
12 Business & Prof. Licences 3.531 3.531
13 Other Tax-Revenue 3.899 3.899 1.185 1.185
(B) NON-TAX REVENUE 1,700.863 1,700.863 100.663 100.663
14 Adm. Fees & charges 12.012 12.012 4.044 4.044
15 Capital Revenue 2.540 2.540 1.852 1.852
16 Revenue from Govt.Deptts 278.946 278.946 46.213 46.213
17 Dividends 1,300.200 1,300.200 48.534 48.534
18 Transfer of profit 107.103 107.103
19 Other Non-Tax Revenue 0.062 0.062 0.020 0.020
Total Tax & Non-Tax Revenue (A+B) 3,230.444 3,230.444 290.964 290.964
% of Dzongkhag Revenue to
Total National Rvevenue 63.18 63.18 5.69 5.69
33
(Nu: In Millions)III GELEPHU REGION
Source of Revenue Sarpang Bumthang Tsirang Trongsa Dagana Zhemgang Total
(A) TAX REVENUE (I+II) 51.510 4.709 1.716 2.748 1.428 4.071 66.182
I Direct Tax 20.927 4.709 1.659 2.615 1.417 4.011 35.338
1 Corporate Income Tax 2.551 2.551
2 Business Income Tax 13.560 0.359 0.734 0.353 0.442 1.234 16.682
3 Taxes on payroll/PIT 1.789 0.672 0.325 0.424 0.235 0.731 4.176
4 Health contribution 1.038 0.357 0.182 0.211 0.157 0.328 2.273
5 Royalties 1.488 3.048 0.274 1.470 0.429 1.156 7.865
6 Rural Tax 0.501 0.273 0.144 0.157 0.154 0.562 1.791
II Indirect Tax 30.583 0.000 0.057 0.133 0.011 0.060 30.844
7 Bhutan Sales Tax 13.057 13.057
8 Export Tax 2.516 2.516
9 Excise Duty 8.011 8.011
10 Motor Vehicle Tax 4.121 0.007 4.128
11 Import Duty 0
12 Business & Prof. Licences 2.534 2.534
13 Other Tax-Revenue 0.344 0.057 0.133 0.004 0.060 0.598
(B) NON-TAX REVENUE 10.588 3.138 1.879 1.975 1.493 2.383 21.456
14 Adm. Fees & charges 3.193 1.003 1.185 0.908 0.916 1.297 8.502
15 Capital Revenue 0.922 0.024 0.216 0.180 0.238 0.023 1.603
16 Revenue from Govt. Deptts 6.467 2.082 0.478 0.887 0.337 1.063 11.314
17 Dividends 0
18 Transfer of profit 0
19 Other Non-Tax Revenue 0.006 0.029 0.002 0.037
Total Tax & Non-Tax Revenue (A+B) 62.098 7.847 3.595 4.723 2.921 6.454 87.638
% of Dzongkhag Revenue
to Total National Rvevenue 1.21 0.15 0.07 0.09 0.06 0.13 1.71
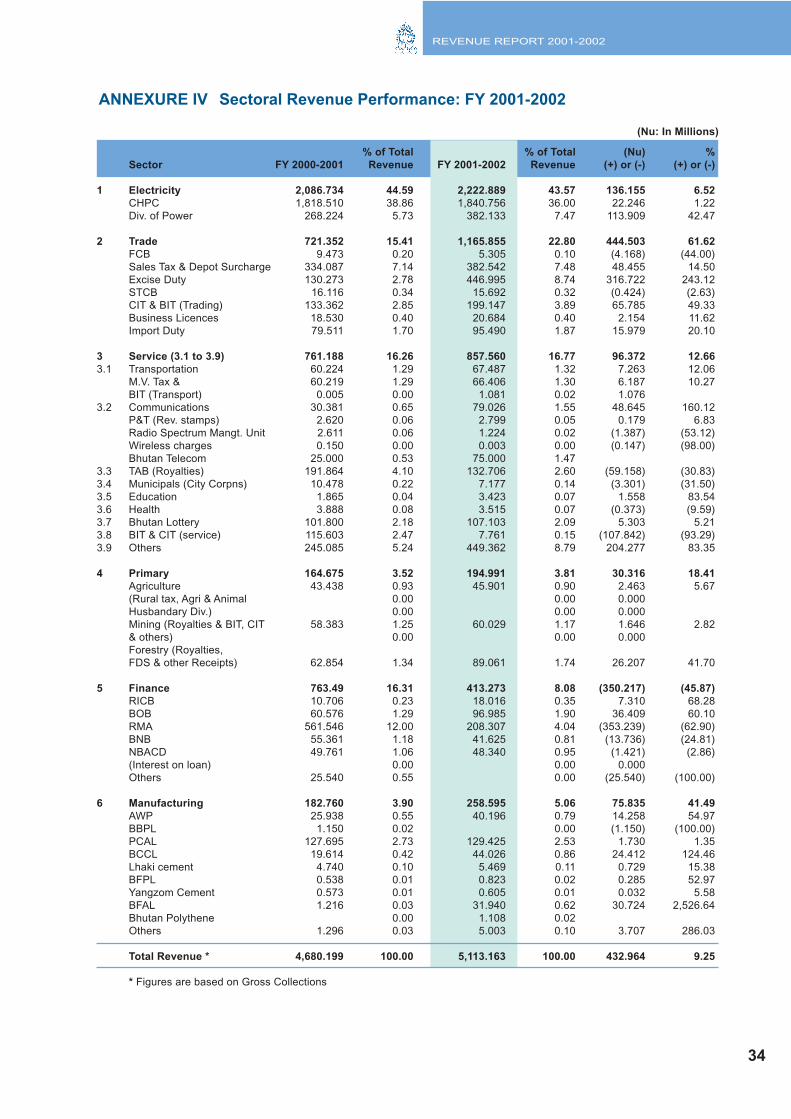
REVENUE REPORT 2001-2002
% of Total % of Total (Nu) %
Sector FY 2000-2001 Revenue FY 2001-2002 Revenue (+) or (-) (+) or (-)
1 Electricity 2,086.734 44.59 2,222.889 43.57 136.155 6.52
CHPC 1,818.510 38.86 1,840.756 36.00 22.246 1.22
Div. of Power 268.224 5.73 382.133 7.47 113.909 42.47
2 Trade 721.352 15.41 1,165.855 22.80 444.503 61.62
FCB 9.473 0.20 5.305 0.10 (4.168) (44.00)
Sales Tax & Depot Surcharge 334.087 7.14 382.542 7.48 48.455 14.50
Excise Duty 130.273 2.78 446.995 8.74 316.722 243.12
STCB 16.116 0.34 15.692 0.32 (0.424) (2.63)
CIT & BIT (Trading) 133.362 2.85 199.147 3.89 65.785 49.33
Business Licences 18.530 0.40 20.684 0.40 2.154 11.62
Import Duty 79.511 1.70 95.490 1.87 15.979 20.10
3 Service (3.1 to 3.9) 761.188 16.26 857.560 16.77 96.372 12.66
3.1 Transportation 60.224 1.29 67.487 1.32 7.263 12.06
M.V. Tax & 60.219 1.29 66.406 1.30 6.187 10.27
BIT (Transport) 0.005 0.00 1.081 0.02 1.076
3.2 Communications 30.381 0.65 79.026 1.55 48.645 160.12
P&T (Rev. stamps) 2.620 0.06 2.799 0.05 0.179 6.83
Radio Spectrum Mangt. Unit 2.611 0.06 1.224 0.02 (1.387) (53.12)
Wireless charges 0.150 0.00 0.003 0.00 (0.147) (98.00)
Bhutan Telecom 25.000 0.53 75.000 1.47
3.3 TAB (Royalties) 191.864 4.10 132.706 2.60 (59.158) (30.83)
3.4 Municipals (City Corpns) 10.478 0.22 7.177 0.14 (3.301) (31.50)
3.5 Education 1.865 0.04 3.423 0.07 1.558 83.54
3.6 Health 3.888 0.08 3.515 0.07 (0.373) (9.59)
3.7 Bhutan Lottery 101.800 2.18 107.103 2.09 5.303 5.21
3.8 BIT & CIT (service) 115.603 2.47 7.761 0.15 (107.842) (93.29)
3.9 Others 245.085 5.24 449.362 8.79 204.277 83.35
4 Primary 164.675 3.52 194.991 3.81 30.316 18.41
Agriculture 43.438 0.93 45.901 0.90 2.463 5.67
(Rural tax, Agri & Animal 0.00 0.00 0.000
Husbandary Div.) 0.00 0.00 0.000
Mining (Royalties & BIT, CIT 58.383 1.25 60.029 1.17 1.646 2.82
& others) 0.00 0.00 0.000
Forestry (Royalties,
FDS & other Receipts) 62.854 1.34 89.061 1.74 26.207 41.70
5 Finance 763.49 16.31 413.273 8.08 (350.217) (45.87)
RICB 10.706 0.23 18.016 0.35 7.310 68.28
BOB 60.576 1.29 96.985 1.90 36.409 60.10
RMA 561.546 12.00 208.307 4.04 (353.239) (62.90)
BNB 55.361 1.18 41.625 0.81 (13.736) (24.81)
NBACD 49.761 1.06 48.340 0.95 (1.421) (2.86)
(Interest on loan) 0.00 0.00 0.000
Others 25.540 0.55 0.00 (25.540) (100.00)
6 Manufacturing 182.760 3.90 258.595 5.06 75.835 41.49
AWP 25.938 0.55 40.196 0.79 14.258 54.97
BBPL 1.150 0.02 0.00 (1.150) (100.00)
PCAL 127.695 2.73 129.425 2.53 1.730 1.35
BCCL 19.614 0.42 44.026 0.86 24.412 124.46
Lhaki cement 4.740 0.10 5.469 0.11 0.729 15.38
BFPL 0.538 0.01 0.823 0.02 0.285 52.97
Yangzom Cement 0.573 0.01 0.605 0.01 0.032 5.58
BFAL 1.216 0.03 31.940 0.62 30.724 2,526.64
Bhutan Polythene 0.00 1.108 0.02
Others 1.296 0.03 5.003 0.10 3.707 286.03
Total Revenue * 4,680.199 100.00 5,113.163 100.00 432.964 9.25
* Figures are based on Gross Collections
ANNEXURE IV Sectoral Revenue Performance: FY 2001-2002
(Nu: In Millions)
34
Design/Photographs
Public Information Services
Department of Revenue and Customs
Layout, Graphs & Printed at
Kuensel Corporation
www.mof.gov.bt/drc