Embed Size (px)
Citation preview
Canadian Science Advisory Secretariat (CSAS)
Research Document 2013/128 National Capital Region
January 2014
National Risk Assessment for Introduction of Aquatic Nonindigenous Species to Canada by Ballast Water
O. Casas-Monroy1, R.D. Linley1, J.K. Adams1, F.T. Chan2, D.A.R. Drake1, and S.A. Bailey1
1Great Lakes Laboratory for Fisheries and Aquatic Sciences, Fisheries and Oceans Canada, 867 Lakeshore Road, Burlington, ON, L7R 4A6
2Great Lakes Institute for Environmental Research, University of Windsor, 401 Sunset Ave., Windsor, ON N9B 3P4
Foreword This series documents the scientific basis for the evaluation of aquatic resources and ecosystems in Canada. As such, it addresses the issues of the day in the time frames required and the documents it contains are not intended as definitive statements on the subjects addressed but rather as progress reports on ongoing investigations.
Research documents are produced in the official language in which they are provided to the Secretariat.
Published by: Fisheries and Oceans Canada
Canadian Science Advisory Secretariat 200 Kent Street
Ottawa ON K1A 0E6
http://www.dfo-mpo.gc.ca/csas-sccs/ [email protected]
© Her Majesty the Queen in Right of Canada, 2014
ISSN 1919-5044
Correct citation for this publication: Casas-Monroy, O., Linley, R.D., Adams, J.K., Chan, F.T., Drake, D.A.R., and Bailey, S.A. 2014.
National Risk Assessment for Introduction of Aquatic Nonindigenous Species to Canada by Ballast Water. DFO Can. Sci. Advis. Sec. Res. Doc. 2013/128. vi + 73 p.
iii
TABLE OF CONTENTS ABSTRACT ................................................................................................................................ V
RÉSUMÉ .................................................................................................................................. VI
INTRODUCTION ....................................................................................................................... 1 THE BIOLOGICAL INVASION PROCESS ............................................................................. 2 THE ROLE OF SHIPPING AS A PATHWAY OF AQUATIC NIS INTRODUCTIONS .............. 3 HISTORY OF AQUATIC NIS IN CANADA ............................................................................. 3
The Canadian Arctic ........................................................................................................... 3 The Great Lakes and the St. Lawrence River (GLSLR) ...................................................... 3 The Atlantic Region ............................................................................................................ 4 The Pacific Region ............................................................................................................. 4
CANADIAN BALLAST WATER MANAGEMENT REGULATIONS .......................................... 4 Specific Issues of Concern ..................................................................................................... 6
Ballast water exchange exemption zones ........................................................................... 6 Domestic ballast water ....................................................................................................... 7 Coastal voyages ................................................................................................................. 7
METHODS ................................................................................................................................. 7 STUDY AREA ........................................................................................................................ 7 DETERMINING BALLAST-MEDIATED INVASION RISK ....................................................... 8
Step 1A: Estimating arrival potential ................................................................................... 8 Step 1B: Estimating survival potential ...............................................................................11 Step 1C: Estimating introduction potential .........................................................................12 Step 2: Estimating magnitude of consequences (NIS impacts) ..........................................12 Step 3: Estimating final relative invasion risk .....................................................................12
ESTIMATING FUTURE RISK OF INTRODUCTIONS AFTER ENTRY INTO FORCE OF THE CONVENTION ......................................................................................................................13
RESULTS .................................................................................................................................13 ARRIVAL POTENTIAL ..........................................................................................................13
Annual arrivals - zooplankton NIS .....................................................................................13 Annual arrivals - phytoplankton NIS ..................................................................................14 Per-event arrivals - zooplankton NIS .................................................................................14 Per-event arrivals - phytoplankton NIS ..............................................................................14 Uncertainty ........................................................................................................................14
SURVIVAL POTENTIAL ........................................................................................................14 Uncertainty ........................................................................................................................15
INTRODUCTION POTENTIAL ..............................................................................................15 Uncertainty ........................................................................................................................15
MAGNITUDE OF CONSEQUENCES ....................................................................................15 Uncertainty ........................................................................................................................16
FINAL RELATIVE INVASION RISK .......................................................................................16 Uncertainty ........................................................................................................................16
iv
SENSITIVITY ANALYSIS ......................................................................................................16 FUTURE RISK WITH IMO D-2 STANDARD .........................................................................17
Future annual arrivals - zooplankton NIS ...........................................................................17 Future annual arrivals - phytoplankton NIS ........................................................................17 Future per-event arrivals - zooplankton NIS ......................................................................17 Future per-event arrivals - phytoplankton NIS ...................................................................17 Future survival potential ....................................................................................................18 Future introduction potential ..............................................................................................18 Future magnitude of consequences ..................................................................................18 Future final relative invasion risk .......................................................................................18
DISCUSSION............................................................................................................................18 CONSIDERATIONS ..............................................................................................................22
Hull Biofouling ...................................................................................................................22
CONCLUSIONS ........................................................................................................................23
RECOMMENDATIONS .............................................................................................................24
REFERENCES .........................................................................................................................24
TABLES ....................................................................................................................................33
FIGURES ..................................................................................................................................45
APPENDICES ...........................................................................................................................54
v
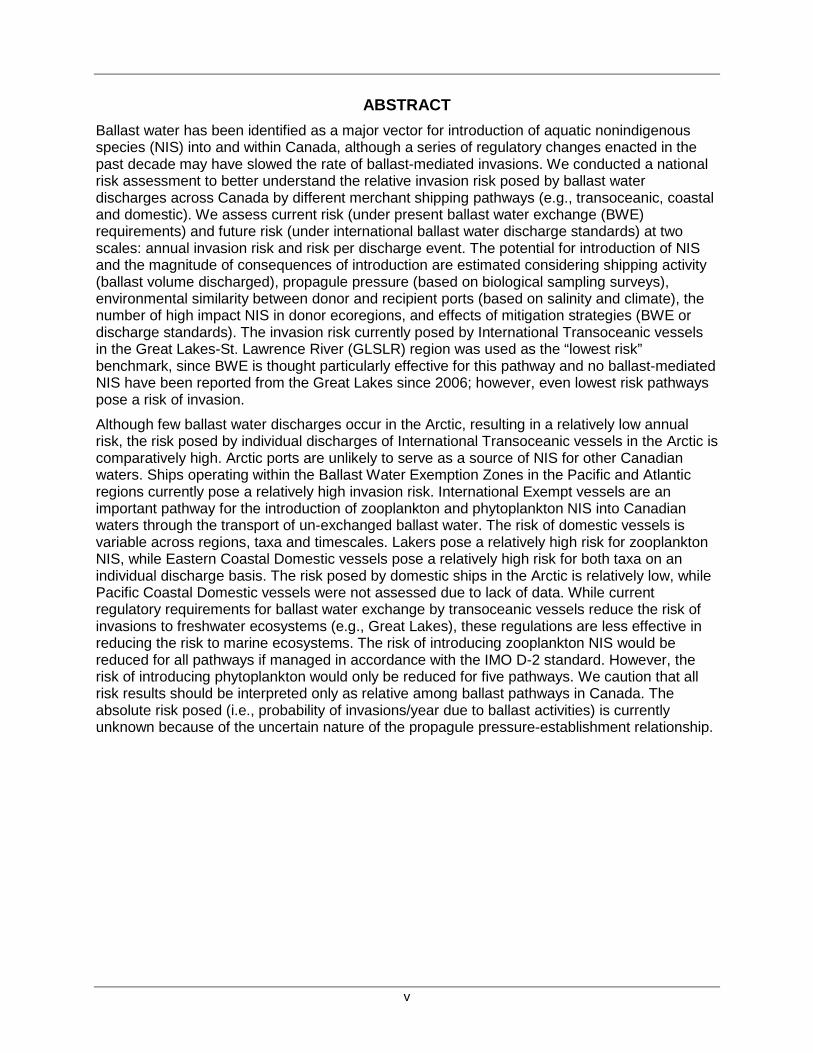
ABSTRACT Ballast water has been identified as a major vector for introduction of aquatic nonindigenous species (NIS) into and within Canada, although a series of regulatory changes enacted in the past decade may have slowed the rate of ballast-mediated invasions. We conducted a national risk assessment to better understand the relative invasion risk posed by ballast water discharges across Canada by different merchant shipping pathways (e.g., transoceanic, coastal and domestic). We assess current risk (under present ballast water exchange (BWE) requirements) and future risk (under international ballast water discharge standards) at two scales: annual invasion risk and risk per discharge event. The potential for introduction of NIS and the magnitude of consequences of introduction are estimated considering shipping activity (ballast volume discharged), propagule pressure (based on biological sampling surveys), environmental similarity between donor and recipient ports (based on salinity and climate), the number of high impact NIS in donor ecoregions, and effects of mitigation strategies (BWE or discharge standards). The invasion risk currently posed by International Transoceanic vessels in the Great Lakes-St. Lawrence River (GLSLR) region was used as the “lowest risk” benchmark, since BWE is thought particularly effective for this pathway and no ballast-mediated NIS have been reported from the Great Lakes since 2006; however, even lowest risk pathways pose a risk of invasion.
Although few ballast water discharges occur in the Arctic, resulting in a relatively low annual risk, the risk posed by individual discharges of International Transoceanic vessels in the Arctic is comparatively high. Arctic ports are unlikely to serve as a source of NIS for other Canadian waters. Ships operating within the Ballast Water Exemption Zones in the Pacific and Atlantic regions currently pose a relatively high invasion risk. International Exempt vessels are an important pathway for the introduction of zooplankton and phytoplankton NIS into Canadian waters through the transport of un-exchanged ballast water. The risk of domestic vessels is variable across regions, taxa and timescales. Lakers pose a relatively high risk for zooplankton NIS, while Eastern Coastal Domestic vessels pose a relatively high risk for both taxa on an individual discharge basis. The risk posed by domestic ships in the Arctic is relatively low, while Pacific Coastal Domestic vessels were not assessed due to lack of data. While current regulatory requirements for ballast water exchange by transoceanic vessels reduce the risk of invasions to freshwater ecosystems (e.g., Great Lakes), these regulations are less effective in reducing the risk to marine ecosystems. The risk of introducing zooplankton NIS would be reduced for all pathways if managed in accordance with the IMO D-2 standard. However, the risk of introducing phytoplankton would only be reduced for five pathways. We caution that all risk results should be interpreted only as relative among ballast pathways in Canada. The absolute risk posed (i.e., probability of invasions/year due to ballast activities) is currently unknown because of the uncertain nature of the propagule pressure-establishment relationship.
vi
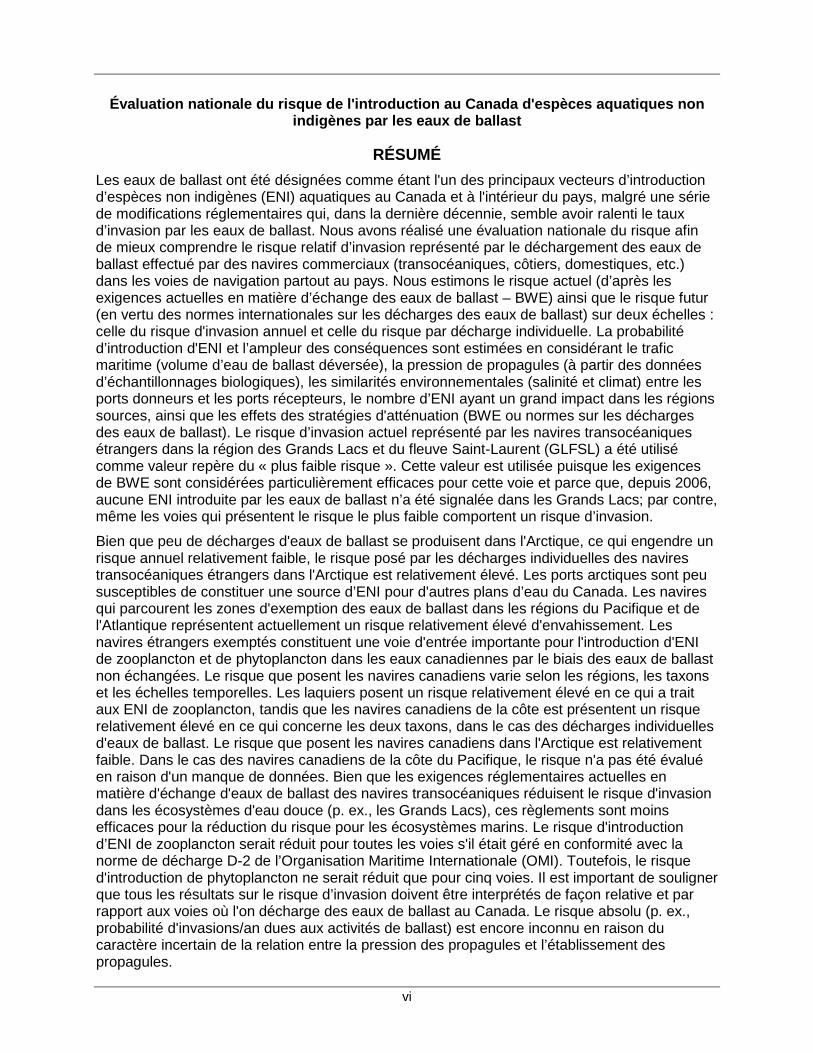
Évaluation nationale du risque de l'introduction au Canada d'espèces aquatiques non indigènes par les eaux de ballast
RÉSUMÉ Les eaux de ballast ont été désignées comme étant l'un des principaux vecteurs d’introduction d’espèces non indigènes (ENI) aquatiques au Canada et à l'intérieur du pays, malgré une série de modifications réglementaires qui, dans la dernière décennie, semble avoir ralenti le taux d’invasion par les eaux de ballast. Nous avons réalisé une évaluation nationale du risque afin de mieux comprendre le risque relatif d’invasion représenté par le déchargement des eaux de ballast effectué par des navires commerciaux (transocéaniques, côtiers, domestiques, etc.) dans les voies de navigation partout au pays. Nous estimons le risque actuel (d’après les exigences actuelles en matière d’échange des eaux de ballast – BWE) ainsi que le risque futur (en vertu des normes internationales sur les décharges des eaux de ballast) sur deux échelles : celle du risque d'invasion annuel et celle du risque par décharge individuelle. La probabilité d’introduction d'ENI et l’ampleur des conséquences sont estimées en considérant le trafic maritime (volume d’eau de ballast déversée), la pression de propagules (à partir des données d’échantillonnages biologiques), les similarités environnementales (salinité et climat) entre les ports donneurs et les ports récepteurs, le nombre d’ENI ayant un grand impact dans les régions sources, ainsi que les effets des stratégies d'atténuation (BWE ou normes sur les décharges des eaux de ballast). Le risque d’invasion actuel représenté par les navires transocéaniques étrangers dans la région des Grands Lacs et du fleuve Saint-Laurent (GLFSL) a été utilisé comme valeur repère du « plus faible risque ». Cette valeur est utilisée puisque les exigences de BWE sont considérées particulièrement efficaces pour cette voie et parce que, depuis 2006, aucune ENI introduite par les eaux de ballast n’a été signalée dans les Grands Lacs; par contre, même les voies qui présentent le risque le plus faible comportent un risque d’invasion.
Bien que peu de décharges d'eaux de ballast se produisent dans l'Arctique, ce qui engendre un risque annuel relativement faible, le risque posé par les décharges individuelles des navires transocéaniques étrangers dans l'Arctique est relativement élevé. Les ports arctiques sont peu susceptibles de constituer une source d’ENI pour d'autres plans d’eau du Canada. Les navires qui parcourent les zones d'exemption des eaux de ballast dans les régions du Pacifique et de l'Atlantique représentent actuellement un risque relativement élevé d'envahissement. Les navires étrangers exemptés constituent une voie d'entrée importante pour l'introduction d'ENI de zooplancton et de phytoplancton dans les eaux canadiennes par le biais des eaux de ballast non échangées. Le risque que posent les navires canadiens varie selon les régions, les taxons et les échelles temporelles. Les laquiers posent un risque relativement élevé en ce qui a trait aux ENI de zooplancton, tandis que les navires canadiens de la côte est présentent un risque relativement élevé en ce qui concerne les deux taxons, dans le cas des décharges individuelles d'eaux de ballast. Le risque que posent les navires canadiens dans l'Arctique est relativement faible. Dans le cas des navires canadiens de la côte du Pacifique, le risque n'a pas été évalué en raison d'un manque de données. Bien que les exigences réglementaires actuelles en matière d'échange d'eaux de ballast des navires transocéaniques réduisent le risque d'invasion dans les écosystèmes d'eau douce (p. ex., les Grands Lacs), ces règlements sont moins efficaces pour la réduction du risque pour les écosystèmes marins. Le risque d'introduction d’ENI de zooplancton serait réduit pour toutes les voies s'il était géré en conformité avec la norme de décharge D-2 de l’Organisation Maritime Internationale (OMI). Toutefois, le risque d'introduction de phytoplancton ne serait réduit que pour cinq voies. Il est important de souligner que tous les résultats sur le risque d’invasion doivent être interprétés de façon relative et par rapport aux voies où l'on décharge des eaux de ballast au Canada. Le risque absolu (p. ex., probabilité d'invasions/an dues aux activités de ballast) est encore inconnu en raison du caractère incertain de la relation entre la pression des propagules et l’établissement des propagules.
1
INTRODUCTION Species that have established populations outside of their native range are known as nonindigenous species (NIS), regardless of their eventual impact on native ecosystems. While only a small proportion (approximately 10%) of introduced NIS have measurable impacts and are considered ‘invasive’, biological invasions have become increasingly prevalent as globalization has increased both intentional and unintentional species introductions worldwide. NIS can impact recipient ecosystems by competing with native species for limited resources and disrupting food web structure (Ricciardi et al. 2013; Simberloff et al. 2013). In fact, biological invasions are the second greatest cause of species extinction globally and the greatest threat to biodiversity in freshwater ecosystems (MEA 2005; Lawler et al. 2006). NIS have caused irreparable damage to ecosystem function and natural resources in many terrestrial and aquatic systems (Ricciardi 2007; Simberloff et al. 2013). Long-term economic consequences of NIS have impacted industry and society both directly and indirectly amounting to costs between $13.3 and $34.5 billion/year in Canada alone (Colautti et al. 2006a). Examples of aquatic NIS impacts include the depletion of commercially important fisheries, increased industrial maintenance costs from NIS-fouled equipment, and the need for ongoing, costly mitigation programs. All ecosystems are vulnerable to, and may suffer severe impacts from, NIS unless comprehensive prevention and management programs are introduced (Ricciardi et al. 2011).
The objective of this study is to assess the relative risk of ballast water as a vector of NIS across Canada, including the Arctic, Great Lakes and St. Lawrence River (GLSLR), Atlantic and Pacific regions (Figure 1). For biological invasions, risk assessment considers the likelihood of a NIS introduction (i.e., the probabilities of arrival, survival and establishment) and the corresponding ecological impact (i.e., magnitude of the consequence). Risk assessment also incorporates a measure of uncertainty in order to provide managers with an indication of the inherent strengths and weaknesses of the process. Uncertainty may involve the quality or quantity of data used to conduct the assessment, or the scientific uncertainty (i.e., variation of outcomes) when ranking likelihood and impact. This risk assessment is semi-quantitative as it evaluates relative risks among different shipping pathways, but does not assign the absolute probability of an invasion associated with ballast activities. Relative risk can be used to identify and prioritize research needs, resource allocation and policy decisions among different shipping sectors. It is currently not possible to calibrate risk ratings against known invasion outcomes; therefore, rankings of “lower” or “lowest” are relative across shipping pathways. This study was conducted in response to the following questions posed by formal science advice request:
1. What is the level of risk posed by ships transiting to, or from, Arctic ports for the introduction of AIS (aquatic invasive species) to Canadian waters;
2. What is the level of risk posed by ships operating within the ballast water exchange exemption zones on the East and West coasts;
3. What is the level of risk posed by domestic shipping activities; and
4. Do current ballast water management regulations provide sufficient protection against ship-mediated AIS introductions?
This document is the final step of an iterative process to address the above questions – initially, invasion risk was examined for the most active ports in each region. Each regional Canadian Science Advisory Secretariat (CSAS) research document provided a synopsis of the history and concerns of NIS in the region and a relative risk assessment for the most active ports in the region based on shipping activity, environmental similarity between source and recipient ports, and the number of high impact NIS in source ecoregions (Bailey et al. 2012; Chan et al. 2012). This national document builds on the regional documents by evaluating invasion risk at the
2
scale of shipping pathways, rather than by individual ports, and also incorporates new data from recent biological surveys of ballast water. This risk assessment is based upon the best available information and methodology, and was peer-reviewed by international biological invasion, risk assessment and shipping experts at meetings overseen by DFO's Centre of Expertise for Aquatic Risk Assessment (CEARA).
THE BIOLOGICAL INVASION PROCESS Founding individuals, known as propagules, must pass through multiple stages of the invasion process to successfully establish populations within a new location (Figure 2). First, the propagules must be taken up by, and survive conditions within, a transport vector to be moved from the source region to a new environment. Once released, the propagules must survive in the new environment in order to form a reproductive population (i.e., establish). Any established NIS population can act as a source of propagules for further introduction of the species, a process called “stepping stone” or “secondary” invasion (Floerl et al. 2009). The process and impacts of secondary invasions are the same as for primary invasions - the term “secondary” implies only that propagules are transported from an intermediate location rather than the native range. For example, following the introduction of the spiny waterflea Bythotrephes longimanus into the Great Lakes from Eurasia, the Great Lakes served as a source of secondary invasions to Ontario inland lakes (MacIsaac et al. 2004). Secondary invasions are distinct from spread, which is the result of population increase and natural diffusion away from an initial site of establishment. Successful transition between stages of the invasion process is dependent on at least three factors: propagule pressure, physical-chemical requirements and biological interactions.
Propagule pressure is a measure of the number of individuals released per event coupled with the number of release events over a given time period (Wonham et al. 2000; Kolar and Lodge 2001; Colautti et al. 2006b). In general, the probability that a particular species will become established increases as propagule pressure increases, however, invasions are a stochastic process and the shape of the propagule pressure-establishment relationship is highly context-dependent. Therefore, assigning deterministic outcomes of invasion failure or success based on various levels of propagule supply is currently not possible. The relationship is further complicated by the wide range of possible combinations of the number of individuals released per event and the frequency of release events; the relative importance of different combinations has not been quantified, although there is evidence that invasion success is greater for multiple release events spaced over time and space than for single large release events, since repeated introductions may allow founding populations to overcome stochastic demographic and environmental limitations (Bailey et al. 2009; NRC 2011).
Physical-chemical requirements and biological interactions also directly affect invasion success acting alone or in combination with propagule pressure, further complicating quantification of the invasion process. In general, inhospitable environmental conditions (e.g., intolerable temperature, salinity, or substrate type) or community interactions (e.g., severe predation or limited food supply) will decrease the probability of establishment (Lockwood et al. 2006, 2009), although again, establishment is a stochastic process with few deterministic outcomes.
As established NIS can be almost impossible to eradicate, management interventions generally focus on preventing invasions. Preventative efforts focused on reducing propagule pressure during transportation and combination strategies aimed at multiple factors of the invasion process are regarded as most effective and cost-efficient (ANSTF 2007; EPA SAB 2011; Briski et al. 2013). It is important to curtail both primary and secondary invasions by NIS in order to reduce the magnitude of ecological and economic impacts (Lodge et al. 1998). Since NIS are
3
introduced by a variety of vectors and pathways, assessments prioritizing relative risks are needed to direct limited research and management resources.
THE ROLE OF SHIPPING AS A PATHWAY OF AQUATIC NIS INTRODUCTIONS The rapid rate, global spatial scale and immense diversity of human-assisted invasions are considered a unique driver of global change (Ricciardi 2006a). Introductions of aquatic NIS in Canada’s freshwater and marine ecosystems have occurred both intentionally (i.e., authorized stocking programs) and unintentionally. Unintentional releases are predominantly associated with commercial shipping activities (e.g., ballast water discharge or hull biofouling), escape from aquaculture facilities, or unauthorized releases of aquarium, baitfish, and ornamental pond species.
Ballast water is defined as water pumped into ballast tanks to control the trim, stability and stresses on operational ships. Since ballast water is comprised of the natural waters surrounding the ship, diverse assemblages of plankton present in the water column are inadvertently pumped into ballast tanks during water uptake, along with re-suspended port sediments and associated benthic communities. These communities are then transported and released at a subsequent commercial port, which can be located thousands of kilometres away from the source port – a distance far greater than achieved by natural dispersal.
Ballast water is responsible for a substantial number of aquatic invasions globally (Ruiz et al. 2000; Holeck et al. 2004; Mead et al. 2011; Katsanevakis et al. 2013). Similarly, residual sediments accumulated in ballast tanks are recognized as a vector for NIS (Briski et al. 2011, Villac and Kaczmarska 2011; Casas-Monroy et al. 2012). Management strategies for ballast water are relatively straight-forward and enforceable since ballast water discharge is required to ultimately release individuals from ballast tanks (Dunstan and Bax 2008; Bailey et al. 2011; Albert et al. 2013).
HISTORY OF AQUATIC NIS IN CANADA A detailed history of aquatic NIS in each Canadian region is provided in the regional risk assessment reports; thus, it will be described here only briefly.
The Canadian Arctic The Canadian Arctic constitutes more than 40% of Canada’s land mass and nearly 75% of Canada’s coastline (Standing Senate Committee on National Security and Defence) (Figure 3). Shipping plays an important role in supporting Arctic communities and transporting Arctic resources (e.g., minerals) to domestic and international markets (McCalla 1994). Future plans for mineral and petroleum resource extractions as well as tourism and community development will increase exposure of Arctic ports to ships (Arctic Council 2009; Stewart and Howland 2009; DFO 2012). In addition, invasion risk for Arctic ports will increase if global climate change opens new waterways and shipping channels in the Arctic Ocean, resulting in greater shipping traffic (ACIA 2004; Niimi 2004; Chan et al. 2012, 2013). To date, there have been no published reports of ship-mediated NIS established in the Canadian Arctic. However, if shipping activities increase as expected, propagule pressure will also increase and the Arctic will be more vulnerable to future invasions (Chan et al. 2012).
The Great Lakes and the St. Lawrence River (GLSLR) The Laurentian Great Lakes form the world’s largest freshwater system, holding 21% of the world’s freshwater supply and covering 244,000 km2 (U.S. EPA 2006) (Figure 4). The Great
4
Lakes is one of the most ecologically diverse areas in North America, containing a variety of unique habitats for over 150 fish species and 50 native plant communities (OMNR 2009). The St. Lawrence River, which contains freshwater, brackish-water and marine regions, connects the Great Lakes to the Atlantic Ocean. Some 160-185 aquatic NIS have established in the GLSLR, making the system one of the most highly invaded ecosystems globally (Holeck et al. 2004; Ricciardi 2006b). Approximately 55-65% of these NIS were transported to the Great Lakes by ballast water (Ricciardi 2006b; Kelly et al. 2009). Requirements for ballast water exchange and tank flushing have significantly decreased the risk of ballast-mediated invasions in the GLSLR (Bailey et al. 2011), although these strategies do not provide complete protection against biological invasions (see below).
The Atlantic Region The Atlantic region of Canada constitutes the coastline and waters of the Estuary and Gulf of St. Lawrence, the Bay of Fundy and the Canadian Atlantic Coast, which includes the four Atlantic Provinces: Newfoundland and Labrador, Prince Edward Island, Nova Scotia, and New Brunswick (Figure 5). Historically, this region has had significant finfish (cod, halibut), lobster, and bivalve fisheries; however, overfishing has considerably reduced many native fish populations, and today aquaculture, tourism and mining are gaining importance (Environment Canada 2005). As of 2011, at least 112 aquatic NIS had established on Canada’s Atlantic coast (see Adams et al. pers.comm.1). Serious economic losses have resulted from impacts to the shellfish industry (Scheibling and Gagnon 2006; Drouin and McKindsey 2007) and increased operation and production costs for aquaculture industries (Howes et al. 2007; Locke et al. 2009).
The Pacific Region The western shoreline of Canada stretches 29,000 km along the Pacific Ocean, an area inhabited by more than 400 marine fish and bird species and at least 27 different groups of marine mammals (see Linley et al. pers comm.2) (Figure 6). The Pacific coast is important for aquaculture, the alternative energy industry, First Nations’ communities, commercial fisheries, shipping, marine tourism, and recreational activities (MacConnachie et al. 2007, PNCIMA 2009). The Pacific coast supports a large shipping industry and serves as the Canadian gateway to the Pacific (Transport Canada 2007). At least 94 aquatic NIS have established in the marine waters of Canada’s Pacific coast, 78 of which were recorded near the port of Vancouver in the Georgia Strait (Levings et al. 2002, Gillespie 2007, Daniel and Therriault 2007).
CANADIAN BALLAST WATER MANAGEMENT REGULATIONS Voluntary ballast water management was initiated in the GLSLR in 1989 and was extended to all waters under Canadian jurisdiction in 2000 (see Bailey et al. 2012; Transport Canada 2012). National, mandatory ballast water regulations (the Ballast Water Control and Management
1 Adams, J. K., Ellis, S.M., Chan, F. T., Bronnenhuber, J. E., Simard, N., McKenzie, C. H., Martin, J. L., and Bailey, S. A. 2013. Relative risk assessment for ship-mediated introductions of aquatic nonindigenous species to the Atlantic Region of Canada. DFO Canadian Science Advisory Secretariat Working Paper. 2 Linley, R. D., Doolittle, A. G., Chan, F. T., O’Neill, J., Sutherland, T. and Bailey, S. A. 2013. Risk assessment for ship-mediated introductions of aquatic nonindigenous species to the Pacific Region of Canada. DFO Canadian Science Advisory Secretariat Working Paper.
5
Regulations) were established in 2006, and revised in 2007 and 2011. The present regulations require all vessels operating in waters under Canadian jurisdiction to manage their ballast water, with the following exceptions:
i) vessels that operate exclusively in waters under Canadian jurisdiction,
ii) vessels that operate exclusively in waters under Canadian jurisdiction and in the United States waters of the Great Lakes Basin or the French waters of the islands of Saint Pierre and Miquelon,
iii) search and rescue vessels less than 50 m in length with maximum ballast capacity of eight m3,
iv) pleasure craft less than 50 m in length with maximum ballast capacity of eight m3,
v) ships that carry only permanent ballast in sealed tanks,
vi) vessels used only in government non-commercial service,
vii) ships that operate exclusively between ports, offshore terminals or anchorage areas situated on the Pacific coast of North America, north of Cape Blanco,
viii) ships that operate exclusively between ports, offshore terminals or anchorage areas situated on the Atlantic coast of North America north of Cape Cod, within the Bay of Fundy, on the east coast of Nova Scotia, or the south or east coasts of the island of Newfoundland.
A ship can manage its ballast water by one of the following methods:
• exchanging its ballast water (and, for vessels destined to the Great Lakes, flushing residual ballast in empty tanks);
• treating ballast water to the D-2 standard of the International Convention for the Control and Management of Ships’ Ballast Water and Sediments, 2004 (see below);
• discharging its ballast water to a reception facility; or
• retaining ballast water on board the ship.
Of these options, ballast water exchange (BWE) is predominantly utilized at present. BWE is a process by which a ship exchanges ballast water loaded near shore with oceanic saltwater. BWE is based on two main principles: (1) coastal species contained in ballast water are replaced by oceanic species which are unlikely to survive when discharged into a coastal environment and (2) exposure to oceanic levels of salinity would be fatal for many nearshore organisms. Empirical studies indicate that BWE purges 80-100% of coastal planktonic organisms entrained at the source port although efficacy varies according to ship type, method of BWE, location of exchange and type of organism (e.g., Dickman and Zhang 1999; Lavoie et al. 1999; Taylor and Bruce 2000; McCollin et al. 2008; Cordell et al. 2009; Simard et al. 2011). Similar to BWE, tank flushing involves rinsing ‘empty’ tanks with open-ocean water, and is required for all vessels entering the Great Lakes from overseas.
To maximize BWE efficacy, vessels must replace a minimum of 95% of their ballast water (Canada Shipping Act 2011). Ballast water exchange/tank flushing must be conducted ≥ 200 nautical miles from land where water depth is ≥ 2000 m; vessels not voyaging in waters meeting these conditions may undertake BWE/tank flushing ≥ 50 nautical miles from land where water depth is ≥ 500 m. In both cases, the vessel’s ballast water must achieve a final salinity of ≥ 30 parts per thousand (Transport Canada 2007). Under certain weather conditions or other reasonable circumstances, Transport Canada will authorize BWE in designated alternate
6
exchange zones closer to shore (Levings and Foreman 2004; Department of Justice Canada 2011). Additionally, the uptake of sediment must be minimized, and sediment management procedures, such as monitoring and removal of sediment on a regular basis and deposition at a reception facility, must be incorporated into a vessel’s ballast water management plan.
The International Maritime Organization (IMO), the United Nations’ specialized agency with responsibility for the safety and security of shipping and the prevention of marine pollution by ships, adopted the International Convention for the Control and Management of Ships Ballast Water and Sediments, 2004 (hereafter, the “Convention”) in February 2004. The Convention has not yet entered into force. The Convention applies to all vessels flying the flag of a party to the Convention, with certain exceptions (notably domestic shipping that does not impair or damage the environment, human health, property or resources). The Convention must be applied as may be necessary to ensure that no more favourable treatment is given to ships of non-parties to the Convention.
The Convention, amongst other requirements, sets maximum allowable discharge limits for organisms and indicator microbes in ballast water, known as the IMO D-2 performance standard (Table 1). Canada ratified the Convention in April 2010, thereby agreeing to adopt this standard for waters under Canadian jurisdiction. (As noted above, Canada already allows vessels to manage their ballast water through treatment to this standard on a voluntary basis.) In the expectation that the Convention will enter into force in the near future, Transport Canada is preparing to fully implement a mandatory transition to the D-2 standard by way of further amendments to the Ballast Water Control and Management Regulations (Transport Canada 2012). Although the Convention envisions replacement of BWE with the IMO D-2 standard, Transport Canada has proposed retaining requirements for BWE in combination with the IMO D- 2 standard to provide enhanced protection to recipient freshwater ports (IMO 2010; Transport Canada 2012).
SPECIFIC ISSUES OF CONCERN Ballast water exchange exemption zones As noted above, current Canadian regulations provide a ballast water management exemption for vessels that operate exclusively on the Atlantic coast of North America north of Cape Cod, within the Bay of Fundy, along the east coast of Nova Scotia, or the south or east coasts of the island of Newfoundland (Figure 5), and for vessels that operate exclusively on the Pacific coast of North America between Cape Blanco and the Aleutian Islands (Figure 6). The exemption zones were originally created based on general biogeographic or oceanographic considerations (e.g., plankton communities north of Cape Mendocino are considered contiguous with those in the Canadian Pacific Region because of northward currents) (Pickard and Emery 1996, Transport Canada 2007). However, due to the risk of secondary invasions by NIS that first establish at international shipping ports, recent research does not support regional “common waters” agreements that allow vessels to move intra-coastal ballast without any form of ballast management (Levings and Foreman 2004, Lawrence and Cordell 2010, David et al. 2013). Exempt vessels typically have short voyage times and are likely to discharge viable organisms in ballast water (Simkanin et al. 2009, Lawrence and Cordell 2010). In addition, environmental gradients within exemption zones may not vary widely, so discharged biota could have high probability of survival in the new recipient port.
7
Domestic ballast water Domestic shipping is often overlooked as a vector for NIS. Canada currently exempts domestic ballast water from ballast water management; therefore, ballast water is typically transferred directly between Canadian ports without BWE or tank flushing, even if those ports have large geographic separation (e.g., Great Lakes-Arctic transfers). Since there are distinct ecoregions within Canada, this transfer of domestic ballast water can facilitate primary invasions of species that are native to a subset of Canadian ports but which are NIS to other Canadian ports. Similarly, domestic voyages can facilitate secondary invasions of NIS initially introduced to one Canadian port (by any vector) to other Canadian ports. As an example, domestic vessels have been highlighted as a potentially important mechanism for introduction of NIS from the North American Atlantic coast to the St. Lawrence River, and from there into the Great Lakes (de Lafontaine and Costan 2002; Ricciardi 2006b; Kelly et al. 2009; Adebayo et al. 2013). Domestic ballast water carried by vessels on short voyages typically has higher propagule supply compared to vessels on longer voyages due to the inverse relationship between voyage length and survival – plankton are more likely to survive hostile environmental conditions, predation and competition inside a ballast tank over a shorter period of time (Cordell et al. 2009; Klein et al. 2009; Simard et al. 2011; Briski et al. 2012b).
Coastal voyages While coastal voyages were not specifically included in the formal science advice request, concern was raised during the regional risk assessments regarding the reduced efficacy of BWE conducted closer to the North American coast (50-200 nautical miles offshore) in comparison to mid-ocean exchange (> 200 nautical miles offshore) (see also McCollin et al. 2007, 2008, Lawrence and Cordell 2010). There are at least 113 ballast-mediated NIS on the U.S. Pacific coast (Simkanin et al. 2009), which could be introduced to Canadian Pacific ports by intra-coastal shipping; a similar situation likely exists on the Atlantic coast. Intra-coastal shipping can disperse species within a region at much higher rates than would occur naturally, and can also transport species to regions which cannot be reached via natural mechanisms (Simkanin et al. 2009). Since intra-coastal voyages are often short in duration, high survival in ballast tanks is expected and a potentially high number of propagules could be released, making intra-coastal shipping a pathway of interest (Wasson et al. 2001, Simkanin et al. 2009, Lawrence and Cordell 2010, DiBacco et al. 2012).
METHODS
STUDY AREA For the purpose of this study Canada was divided into four regions. The first region, the Canadian Arctic, includes all Canadian waters north of 60°, Ungava Bay, Hudson Bay, and James Bay, as defined by Transport Canada (Figure 3). The second region, hereafter known as the ‘Great Lakes – St. Lawrence River’ (GLSLR) region, includes all Canadian and American freshwater ports in the five Great Lakes (Lakes Superior, Michigan, Huron, Erie, and Ontario) and the St. Lawrence River, up to and including Quebec City (El-Sabh and Murty 1990) (Figure 4). The third region is the Atlantic region, which includes all ports east of Quebec City in the Estuary and Gulf of St. Lawrence, and all ports located in Nova Scotia, Labrador and Newfoundland, and the Bay of Fundy (Figure 5). The fourth region is the Pacific region which includes all ports in the coastal waters of British Columbia (Figure 6).
8
DETERMINING BALLAST-MEDIATED INVASION RISK A three-step risk assessment was conducted broadly consistent with the previous regional risk assessments (Bailey et al. 2012; Chan et al., 2012) and the CEARA National Detailed-Level Risk Assessment Guidelines (Mandrak et al. 2012). The assessment was based on introduction potential (i.e., the potential for species to arrive, survive, and establish), and the magnitude of consequences following species introduction (i.e., the biological consequences following establishment).
First, introduction potential was estimated by combining the individual potentials for arrival and survival (i.e., successful invasion), based on ballast water discharge volume, abundances of zooplankton and phytoplankton NIS sampled from ballast water, and environmental similarity between source and recipient regions. Microbes were not considered in this assessment due to insufficient data. Establishment was assumed to occur in the event that arriving organisms survived recipient environmental conditions. Second, the potential magnitude of consequences of introduction was estimated based on the number of high impact ballast-mediated NIS occurring in each source ecoregion. Third, introduction potential and potential magnitude of consequences were combined using a risk matrix to determine the final relative invasion risk rating among shipping pathways. Relative invasion risk was calculated based on annual and per event ballast water discharge volumes, allowing examination of risk at different temporal scales (individual ship discharge events vs. cumulative risk over time).
To ensure that uncertainty was characterized in a standardized way for each component of the assessment, we assigned levels of uncertainty, ranging from very high to very low, based on the combination of the quality of data available for analysis and the suitability of the selected measure as a proxy for the variable of interest (Table 2).
Step 1A: Estimating arrival potential For each region, a comprehensive database of merchant vessel discharge events and volume of ballast water discharged at Canadian ports was compiled. Analyses were limited to vessels ≥50m length with ballast capacity ≥8 m3 since these vessels facilitate the vast majority of ballast water movements in Canada and are subject to Canadian ballast water management and reporting regulations (i.e., bulk carriers, tankers, general cargo, and roll on/roll off vessels). To maximize data coverage and quality, shipping activity information was extracted and cross-referenced from at least two government sources; data sources and years of data coverage varied slightly for each region, as follows.
For the Arctic region, data were primarily obtained from the Transport Canada Ballast Water Database (TCBWD) and the Canadian Coast Guard’s Information System on Marine Navigation (INNAV), for vessels arriving between 2005 and 2008 (Chan et al. 2012). For the GLSLR region, data were obtained from the TCBWD, INNAV and the U.S. National Ballast Information Clearinghouse (NBIC), for vessels arriving between 1 January 2007 and 31 December 2007 (Bailey et al. 2012). For the Atlantic region, data were obtained from the TCBWD and INNAV for vessels arriving between 1 January 2006 and 31 December 2006 (Adams et al. pers.comm.3). Finally, data for vessel arrivals at Canadian Pacific ports between 1 January 2008 and 31 December 2008 were assembled using the Canadian Coast Guard’s Vessel Traffic Operations
3 Adams, J. K., Ellis, S.M., Chan, F. T., Bronnenhuber, J. E., Simard, N., McKenzie, C. H., Martin, J. L., and Bailey, S. A. 2013. Relative risk assessment for ship-mediated introductions of aquatic nonindigenous species to the Atlantic Region of Canada. DFO Canadian Science Advisory Secretariat Working Paper.
9
Support System (VTOSS), the TCBWD and the NBIC (Linley et al. pers.comm. 4). Since vessels operating strictly within Canadian waters are not required to submit ballast water reports, ballast information for vessels on domestic transits were obtained directly from shipping companies and/or reconstructed from INNAV data following the method of Rup et al. (2010); it was not possible to examine domestic shipping activities in the Pacific region since domestic shipping was undertaken exclusively by tug/barge in 2008; only tugs are required to report movements to the Canadian Coast Guard, while barges are the conveyors of ballast water, and a tug may operate with a variety of barges during a single season. All ballast water transported by domestic vessels was assumed to be unmanaged unless otherwise reported to the TCBWD.
It was not possible to compile multiple years of data for all regions due to time constraints, preventing analyses of inter-annual variability in shipping activity. Similarly, data were not available for the same year in all regions. As result, for the following comparative analyses of arrivals, a 12 month time frame of data was compiled and analysed, representing an annual estimate of the arrival potential of NIS; when multiple years of data existed, the year with the greatest number of events was selected (Table 3). Since vessels transiting different geographic regions will likely carry different species assemblages with different characteristics and requirements affecting invasion risk, shipping activity was summarized based on each vessel’s operational profile during the entire period of study (hereafter referred to as pathways; see Table 4 for definitions).
Biological data (density and diversity of plankton in ballast water) were obtained from recent biological sampling surveys conducted by the Canadian Aquatic Invasive Species Network and Fisheries and Oceans Canada (Humphrey 2008; Klein et al. 2009; Bailey et al. 2011; Briski et al. 2012 a,b; Casas-Monroy 2012; DiBacco et al. 2012; Roy et al. 2012; Adebayo et al. 2013; Bailey and Munawar, Fisheries and Oceans Canada, unpublished data) (Table 5). For this step we defined NIS as being non-native to the recipient region, regardless of impact. Results of recent biological surveys of ballast water in the Arctic region, however, are not yet available; since International Transoceanic vessels arriving to the Arctic operate in a similar manner to those in the Atlantic region, zooplankton species sampled from the Atlantic pathway were re-evaluated to calculate abundance of species that are NIS to the Arctic (K. Howland, Fisheries and Oceans Canada, personal communication). Since phytoplankton communities in the Canadian Arctic are poorly studied, a similar reassessment could not be performed for phytoplankton NIS, thus, we applied the phytoplankton NIS densities calculated for the Atlantic pathway to the Arctic pathway, assuming these two pathways transport similar abundances of phytoplankton NIS to the two regions. For the Arctic Coastal Domestic pathway, we determined that all ballast water transported by these vessels originated from ports in the St. Lawrence Estuary. As a result, we utilized a subset of data from the Eastern Coastal Domestic pathway (Quebec-sourced ballast water) to estimate the number of zooplankton NIS transported by Arctic Coastal Domestic vessels (K. Howland, Fisheries and Oceans Canada, personal communication); no data was available for phytoplankton NIS for this subset of data. We recognize that invasion risk is determined by both abundance (propagule pressure) and diversity (colonization pressure) of NIS (Briski et al. 2012a); however, analyses of species richness were not feasible due to high variability in the data.
4 Linley, R. D., Doolittle, A. G., Chan, F. T., O’Neill, J., Sutherland, T. and Bailey, S. A. 2013. Risk assessment for ship-mediated introductions of aquatic nonindigenous species to the Pacific Region of Canada. DFO Canadian Science Advisory Secretariat Working Paper.
10
Arrival potential was assessed at two timescales: annual (i.e., number of individuals of NIS/pathway/year) and per-event (i.e., number of individuals of NIS /pathway/discharge event). Both arrival metrics were estimated separately for zooplankton and phytoplankton using a Monte Carlo re-sampling process. First, probability distributions were fitted to the biological data described above for each pathway. These distributions represented the NIS biological density (individuals m-3 or cells m-3) sampled from each pathway. Probability distributions (i.e., geometric vs. negative binomial vs. Poisson) were selected based on an Akaike information criterion statistic, which measures the relative quality of a statistical model for a given data set. Most biological data followed a negative binomial process; in some cases, geometric distributions provided superior fit. Once a probability distribution and its parameters were assigned for a given pathway, a re-sampling process occurred as follows: the ballast volume for an individual discharge event within a pathway (e.g., discharge number 1 out of a total 5,227 Laker discharges) was multiplied by a random value selected from the biological probability distribution. The result of this ballast volume and biological density pairing is the absolute number of NIS discharged for that single discharge event. This process was repeated for all discharge events within a given pathway (e.g., across 5,227 Laker discharges), and the entire process of pairing n discharge events with n selections from the biological density distribution was repeated across 1,000 iterations. Per-event NIS arrivals were summarized as the distribution of n discharge events across 20 iterations for a single pathway (e.g., 5,227 Laker discharge events across 20 iterations for a total of 104,540 per-event data points). Annual NIS arrivals were summarized as the distribution of the sum of n discharges across 1,000 iterations (e.g., the sum of 5,227 individual discharges across 1000 iterations; 1,000 annual data points). Sensitivity analysis was performed to determine the influence of the probability distributions (biological survey data) on the outcome of the arrival models. Biological density parameters (i.e., k or μ if negative binomial; probability if geometric) were altered +25% and -25% from the original fitted values. The re-sampling process was conducted again using the altered parameters and the response of annual and per-event outcomes were observed (see Appendix 1 for an example of the Monte Carlo resampling process and sensitivity analysis for the arrival stage).
For graphical purposes, results from the Monte Carlo process were sorted from lowest to highest based on mean values for each pathway. Results were displayed as box plots with median and 5th and 95th percentiles (whiskers) to give an indication of the spread of the data. Because of large differences in magnitude among pathways, the y-axis of the plots was log-transformed. Initial statistical tests determined that all pathways are significantly different (tests not included here), thus, categorical bins of arrival potential (5 categorical bins ranging from lowest through highest) were created by determining the 0, 20th, 40th, 60th, 80th, and 100th percentiles from the entire distribution of values from the Monte Carlo process (e.g., for annual arrivals, percentiles were calculated from the 11,000 annual data points calculated for all pathways). We utilized the mean arrival values (which are influenced by right-tail skew in the distribution) derived during the Monte Carlo process to assign pathways into the percentile bins because discharges with very high NIS density, although rare, can be very important for invasion success (Lewis 1997). Lakers and Arctic Coastal Domestic pathways were included in all plots even if their means were zero. This allowed Lakers to be included in comparisons of arrival metrics for phytoplankton NIS even though no NIS were recorded during phytoplankton analyses (n=6, S. Bailey and M. Munawar, Fisheries and Oceans Canada, unpublished data). Arctic Coastal Domestic vessels were not included in comparisons for arrival metrics of phytoplankton NIS, since data were not available for this pathway.
11
Step 1B: Estimating survival potential Survival potential was estimated by a comparison of environmental similarity (salinity and climate) between paired source and recipient ports, using a three step process. We focused our analysis on salinity and climate (temperature) because they are fundamental physical factors for survival and reproduction of all aquatic organisms (Kinne 1963; Anger 1991; Browne and Wanigasekera 2000; Verween et al. 2007). We limited this analysis to two variables, since including additional variables that are not related to invasion risk for some or all potential NIS within a pathway can dramatically decrease the effectiveness of an environmental similarity approach (Barry et al. 2008).
First, source-recipient port-pairs were identified for each discharge event in Canada; this analysis included all years of shipping data available for the Arctic and GLSLR regions. The annual mean salinity was determined for each coastal source and recipient port, using the online World Ocean Atlas database (Antonov et al. 2005; Locarnini et al. 2006). The World Ocean Atlas database contains in situ coastal marine environmental information, such as salinity, at a horizontal spatial resolution of 1° and 40 depth levels and contains global monthly averages, variances and extremes (Locarnini et al. 2006). We utilized data for the “sea surface” layer, representing the first 10 m of the water column, which is characteristic of coastal ports and other shallow-water environments accessible by ships’ ballast intakes (Glasby et al. 2007). We then interpolated salinity values for each port using kriging in ArcGIS 10 (ESRI Inc.; see Chan et al. 2013). Mean salinity values for inland ports (e.g., Great Lakes ports) were obtained from Keller et al. (2011).The annual mean salinities were used to classify each port according to a three level scale (Por 1972; Bald et al. 2005). Since most freshwater species have poor salinity tolerance and most estuarine planktonic taxa have broader salinity tolerance (Taylor and Pahlinger 1987; Carty 2003; Bailey et al. 2004), ports with salinities between 0.0-5.0 ‰ were classified as oligohaline (hereafter called freshwater); ports with salinities between 5.1-18.0 ‰ were classified as mesohaline (hereafter called brackish); ports with salinities 18.1 ‰ and higher were classified as polyhaline (hereafter called marine). In addition, a correction was applied to account for changes in salinity due to mid-ocean ballast water exchange: for all ship transits that completed BWE, the source port salinity was changed to 30.0 ‰. A matrix approach was used to determine similarity of salinity between all source-recipient port-pairs (Gollasch 2006; Gollasch and Leppäkoski 2007). The score has three metrics and ranged from “lowest” similarity of salinity for a port-pair with highly divergent salinities (e.g., freshwater - marine) to “highest” similarity if both ports had the same salinity classification (e.g., freshwater - freshwater) (Table 6).
The second step to calculate survival potential involved a climate classification based on location of each source and recipient port. All ports were classified by latitude into four climate zones: Tropical (0°N-20°N), Warm-Temperate (20°N-40°N), Cold-Temperate (40°N-60°N) and Polar (>60°N) following Spalding et al. (2007), Rubel and Kottek (2010) and Keller et al. (2011). Again a matrix approach was used to determine climate similarity between each source-recipient port-pair. The score has three metrics and ranged from “lowest” climate similarity for a port-pair with highly divergent climates (e.g., Polar-Tropic) to “highest” similarity if both ports were located in the same or adjacent climate category (Table 7). The final step was to calculate survival potential by combining the salinity and climate scores into a single ‘environmental similarity’ measure. Since both salinity and climate must be suitable for NIS to survive, the lowest score of salinity vs. climate was retained to reflect the score of the most limiting environmental variable. For example, for a given source-recipient pair-ports with high similarity for salinity and intermediate similarity for climate, the final environmental similarity is intermediate.
12
An overall pathway ranking was then determined by tallying the environmental similarity values for all transits within the pathway and retaining the category with the greatest number of transits. For example, given a tally of 39 transits ranked highest, 18 transits ranked intermediate and 10 transits ranked lowest, the overall ranking given to the pathway is highest. Note that source port information was missing for 337 port-pairs (1.67% of all data), which were omitted from analysis.
Step 1C: Estimating introduction potential The overall introduction potential is dependent on the sequential occurrence of arrival and survival, thus, the lowest value for arrival and survival steps was used to determine the overall introduction potential (Mandrak et al. 2012). For example, given a low arrival potential and a high survival potential, the overall introduction potential would be low, because high survival probabilities are offset by the small number of arriving individuals. Introduction potential was calculated separately for each pathway in each region, considering both annual and per-event arrivals and differential propagule pressures of zooplankton and phytoplankton. The highest level of uncertainty for arrival vs. survival was retained as the uncertainty associated with introduction potential.
Step 2: Estimating magnitude of consequences (NIS impacts) The number of high impact NIS (i.e., aquatic ‘invasive’ species - AIS) potentially present at ballast water source ports was used to estimate the magnitude of consequences of ballast-mediated invasions in Canada. AIS are defined as invaders that displace native species, change community structure and food webs, and alter fundamental processes, such as nutrient cycling and sedimentation (Molnar et al. 2008). First, a list of ballast-mediated AIS present in 232 coastal ecoregions was extracted from the Nature Conservancy’s Marine Invasive Database (species ranked at harm levels 3 or 4; Molnar et al. 2008). The list was reviewed for accuracy in the context of Canadian recipient ecoregions by experts during the peer review of this risk assessment; species native to a Canadian recipient ecoregion and marine species connected to freshwater recipient ports were removed, and taxonomic nomenclature was updated. Additionally, since the GLSLR ecoregion is not included in the Nature Conservancy dataset, we added 11 AIS from the GLSLR (Bailey et al. 2012) for a total of 167 AIS in 233 ecoregions (Appendix 6).
We then tabulated the number of AIS potentially associated with each ballast discharge event, considering each source-recipient port-pair. We assumed that each source port may be a donor of all AIS established within its ecoregion and the analysis included all years of shipping data available for Arctic and GLSLR regions. Then, the mean number of AIS was plotted by pathway. For graphical purposes, results were displayed as box plots with median and 5th and 95th percentiles (whiskers) to give an indication of the spread of the data, and pathways were sorted from lowest to highest based on mean values. Because of large differences in magnitude among certain pathways, y-axis values on plots were log-transformed. Pathways were assigned into categorical ranks (e.g., lowest through highest) using the percentile bin method described for arrivals.
Step 3: Estimating final relative invasion risk The introduction potential (Step 1) and magnitude of consequences (Step 2) for ballast-mediated NIS were combined into a final relative invasion risk for each pathway based on a risk matrix that reduces the final ratings to three levels (Table 8; colouring of matrix determined by the use of GLSLR International Transoceanic vessels as the “lowest risk” benchmark).
13
ESTIMATING FUTURE RISK OF INTRODUCTIONS AFTER ENTRY INTO FORCE OF THE CONVENTION Since Canada will transition to a new ballast water management regime under the Convention that is expected to enhance protection against ballast-mediated NIS, we repeated the relative risk assessment process described above using estimates of phytoplankton/zooplankton NIS densities expected after ballast water treatment to the IMO D-2 standard in the calculation of propagule arrivals. Recent biological surveys indicate that only a proportion of the total community transported in ballast water are NIS to the recipient port, thus, we estimated future NIS densities as the proportional reduction in NIS expected when the density of all organisms (i.e., NIS and other taxa) met the IMO D-2 standards. In many cases, the current density of NIS of phytoplankton was already lower than estimated future densities; for these cases, current data were utilized for future projections.
Categorical rankings of pathways within the future scenario were based on the percentile bins created for current scenarios, so that the outcome of future regulations could be interpreted relative to the current scenario. For example, if in the future scenario the highest value of NIS abundance was 2 x10⁴ (individuals or cells/pathway) for a given variable, but this value fits within the lowest percentile bin in current scenario, all the pathways in the future scenario were ranked with the lowest level for that variable. We assumed that all vessel pathways would be required to meet the IMO D-2 standard, but the results of this study may help to inform management decisions on whether or not exemptions are warranted for vessels operating within specific pathways. Survival potential for the future assessment was calculated without BWE for marine ports. The BWE correction was only applied for transoceanic transits arriving to freshwater ports in line with requirements for “exchange plus treatment” under consideration by Transport Canada (Transport Canada 2012).
RESULTS
ARRIVAL POTENTIAL Merchant vessels conducted roughly 11,000 ballast water discharge events at 309 Canadian ports annually, discharging an estimated 116,159,585 m3 of ballast water in the twelve-month period of this assessment (Table 3). Lakers and International Transoceanic vessels are the most active pathways, in terms of number of discharge events and annual volume of ballast water discharged (Figure 7). Biological sampling surveys revealed that Lakers typically carry the highest abundances of zooplankton NIS, followed by Arctic Coastal Domestic vessels (Table 5). In contrast, Pacific International Exempt vessels transport the highest abundances of phytoplankton NIS followed by GLSLR International Transoceanic and Pacific International Coastal U.S. vessels. No phytoplankton NIS were reported from the few Laker samples analyzed (n = 6; S. Bailey and M. Munawar, Fisheries and Oceans Canada, unpublished data).
Annual arrivals - zooplankton NIS Five groups were obtained for annual arrival potential for zooplankton NIS (Figure 8; Appendix 2). Lakers and Atlantic International Transoceanic vessels had the highest annual arrival potential for zooplankton NIS, followed by Pacific International Coastal U.S., GLSLR International Transoceanic and Pacific International Exempt vessels, which were classified with higher annual arrival potential for zooplankton NIS. Pacific International Transoceanic and Arctic Coastal Domestic vessels represent intermediate annual arrival potential for zooplankton NIS, while Atlantic International Coastal U.S. and Atlantic International Exempt vessels showed lower
14
annual arrival potential for zooplankton NIS. The remaining pathways showed lowest annual arrival potential.
Annual arrivals - phytoplankton NIS Five groups were obtained for annual arrival potential for phytoplankton NIS (Figure 9; Appendix 2). Pacific International Exempt and Atlantic International Transoceanic vessels had the highest annual arrival potential for phytoplankton NIS, while higher annual arrival potential were found for GLSLR International Transoceanic, Pacific International Transoceanic and Atlantic International Coastal U.S. vessels. Pacific International Coastal U.S. and Atlantic International Exempt vessels had intermediate annual arrival potential for phytoplankton NIS. Finally, Arctic International Transoceanic and Eastern Coastal Domestic vessels pose lower annual arrival potential while Lakers pose lowest annual arrival potential for phytoplankton NIS. Arctic Coastal Domestic vessels were not assessed due to absence of data.
Per-event arrivals - zooplankton NIS Three groups were obtained for per-event arrivals for zooplankton NIS (Figure 10; Appendix 2). The first group, representing highest per-event arrival potential of zooplankton NIS, includes Lakers and Arctic Coastal Domestic vessels. Pacific International Exempt, Pacific International Coastal U.S., GLSLR International Transoceanic, Atlantic International Transoceanic and Arctic International Transoceanic vessels all had higher per-event arrival potential for zooplankton NIS. The remaining pathways had intermediate per-event arrival potential for zooplankton NIS.
Per-event arrivals - phytoplankton NIS Three groups were obtained for per-event arrival potential of phytoplankton NIS (Figure 11; Appendix 2). Pacific International Exempt, Atlantic International Coastal U.S., GLSLR International Transoceanic, Atlantic International Transoceanic, Pacific International Coastal U.S., Arctic International Transoceanic, and Pacific International Transoceanic vessels all pose highest per-event arrival potential for phytoplankton NIS. Atlantic International Exempt and Eastern Coastal Domestic vessels had higher arrival potential for phytoplankton NIS on a per event basis. Lakers were ranked lowest per-event arrival potential for phytoplankton NIS. Arctic Coastal Domestic vessels were not assessed due to absence of data.
Uncertainty The uncertainty surrounding arrival estimates is considered low for most pathways for zooplankton NIS since the ballast water volume data is extracted from extensive systematic government databases and the biological data generated from direct surveys of ballast water (although sample size is small in many cases). However, the uncertainty is greater (moderate) for phytoplankton NIS, which are less studied than zooplankton, and the pathways for which biological surveys were not available and additional assumptions were required (i.e., Arctic pathways).
SURVIVAL POTENTIAL A total of 20,140 comparisons were conducted to evaluate the environmental similarity between ballast water source-recipient port-pairs. Results indicate that 88% of port-pair comparisons had highest similarity for salinity, and 87% of port-pair comparisons had highest similarity for climate.
Relative survival potential based on the combination of both salinity and climate similarity is shown in Table 9. Arctic International Transoceanic, Eastern Coastal Domestic, Lakers, Atlantic International Coastal U.S., Atlantic International Transoceanic, Pacific International Coastal
15
U.S., Pacific International Exempt and Pacific International Transoceanic pathways are all ranked as having highest survival potential. Atlantic International Exempt vessels are ranked at intermediate survival potential, while Arctic Coastal Domestic and GLSLR International Transoceanic vessels have lowest survival potential.
Uncertainty The uncertainty surrounding the estimate of survival potential is considered moderate since annual salinity may not capture spatial and temporal changes in salinity at all global ports, and because a number of additional physical and biological factors may impact survival in a species-specific manner.
INTRODUCTION POTENTIAL Three pathways exhibit highest annual introduction potential: Atlantic International Transoceanic (both taxonomic groups), Lakers (zooplankton NIS) and Pacific International Exempt (phytoplankton NIS) (Table 10). Pacific International Coastal U.S. and Pacific International Exempt vessels pose higher annual introduction potential for zooplankton NIS while Atlantic International Coastal U.S. and Pacific International Transoceanic vessels pose higher annual introduction potential for phytoplankton NIS. Pacific International Transoceanic vessels pose intermediate annual introduction potential for zooplankton NIS, while Atlantic International Exempt and Pacific International Coastal U.S. pose intermediate annual introduction potential for phytoplankton NIS. Arctic Coastal Domestic, Arctic International Transoceanic, Eastern Coastal Domestic and GLSLR International Transoceanic vessels all pose lower or lowest annual introduction potential for both taxa.
In relation to a single discharge event, Arctic International Transoceanic, Atlantic International Transoceanic, Pacific International Coastal U.S. and Pacific International Exempt vessels all pose higher introduction potential for zooplankton NIS and highest introduction potential for phytoplankton NIS. Laker vessels pose highest introduction potential for zooplankton NIS but lowest introduction potential for phytoplankton NIS. Eastern Coastal Domestic, Atlantic International Coastal U.S. and Pacific International Transoceanic vessels all pose intermediate introduction potential for zooplankton NIS and highest introduction potential for phytoplankton NIS, except Eastern coastal domestic that pose higher introduction potential. Atlantic International Exempt vessels exhibit intermediate introduction potential for both taxonomic groups. The GLSLR International Transoceanic and Arctic Coastal Domestic pathways pose lowest introduction potential of NIS per event, for both taxa and zooplankton, respectively.
Uncertainty The highest level of uncertainty assigned to either arrival or survival potential was retained as the uncertainty associated with introduction potential (moderate).
MAGNITUDE OF CONSEQUENCES The mean number of ballast-mediated AIS potentially transported by pathways from source ports to Canadian ports or within Canadian ports ranged from 5 (Lakers) to 68 (Pacific International Coastal U.S.) per discharge event. Based on categorical ranking, Pacific International Coastal U.S., Pacific International Exempt, Atlantic International Coastal U.S., Arctic International Transoceanic, Atlantic International Transoceanic, Eastern Coastal Domestic, Atlantic International Exempt, GLSLR International Transoceanic and Pacific International Transoceanic vessels are rated highest for potential magnitude of consequences
16
(Figure 12). Arctic Coastal Domestic vessels were rated higher for potential magnitude of consequences. Finally, Laker vessels are rated intermediate for potential magnitude of consequences. Appendix 2 provides the mean and percentile values used to determine rankings. Appendix 6 provides a list of AIS potentially introduced to each Canadian region.
Uncertainty The uncertainty surrounding the estimate of magnitude of consequences is considered moderate since the list of AIS available for ecoregions is a static list that may not represent current AIS distribution, and does not account for species that may cause high impacts in new recipient regions despite low or negligible impact in source regions, or high impact species that are native to the source region but NIS to the recipient region.
FINAL RELATIVE INVASION RISK Results of the relative risk assessment are summarized in Table 10. Atlantic International Transoceanic, Pacific International Coastal U.S., Pacific International Exempt and Pacific International Transoceanic vessels all pose highest invasion risk for both taxonomic groups, on both an annual and per-event basis. Lakers pose highest invasion risk for zooplankton NIS but lowest invasion risk for phytoplankton NIS, on both temporal scales. Atlantic International Coastal U.S. and Atlantic International Exempt vessels pose an intermediate invasion risk for zooplankton NIS and highest for phytoplankton on an annual basis, while both pathways pose highest invasion risk for both taxonomic groups at the per-event scale. Arctic International Transoceanic vessels pose lowest annual invasion risk for zooplankton NIS and intermediate annual invasion risk for phytoplankton NIS but highest invasion risk for both taxonomic groups on a per-event basis. Eastern Coastal Domestic vessels pose lowest annual invasion risk for zooplankton NIS and intermediate annual invasion risk for phytoplankton NIS while the invasion risk on a per event basis was highest for both taxonomic groups. Finally, GLSLR International Transoceanic and Arctic Coastal Domestic vessels pose lowest invasion risk for both taxonomic groups, at both temporal scales.
Uncertainty The highest level of uncertainty assigned to either introduction potential or magnitude of consequences was retained as the uncertainty associated with the final relative invasion risk (moderate).
SENSITIVITY ANALYSIS When biological density parameters were altered + or - 25% of their original fitted values, mean per-event arrival values (e.g., absolute number of arriving NIS) changed from as low as 56.6% (Atlantic International Exempt; phytoplankton) and 72.2% (Atlantic International Exempt; zooplankton) to as high as 82.4% (Arctic Coastal Domestic; zooplankton) and 84.6% (Arctic International Transoceanic; phytoplankton) of their original mean values. Deviations in mean annual arrivals changed from as low as 68.3% (Pacific International Exempt; phytoplankton) and 73.7% (Eastern Coastal Domestic; zooplankton) to as high as 80.8% (Arctic International Transoceanic; phytoplankton) and 81.5% (Atlantic International Coastal US; zooplankton). Despite the strong sensitivity of absolute NIS arrivals to biological densities, the downstream categorical rankings of arrival potential for each pathway were generally insensitive, due to large differences in the magnitude of arrival values across pathways. For example, for per-event zooplankton arrivals, increases or decreases of biological parameters resulted in a categorical re-assignment of only two pathways (Arctic Coastal Domestic, from
17
highest to higher and Arctic International Transoceanic, from higher to intermediate). For per-event phytoplankton arrivals, no categorical changes were observed. For annual zooplankton arrivals, three categorical reassignments were observed (Pacific International Coastal U.S., from higher to Highest; GLSLR International Transoceanic, from higher to intermediate; Arctic Coastal Domestic, from intermediate to lower). For annual phytoplankton arrivals, four categorical reassignments were observed (GLSLR International Transoceanic, from higher to highest, Atlantic International Coastal US, from higher to intermediate; Atlantic International Exempt, from intermediate to lower; Pacific International Transoceanic, from higher to intermediate). However, many of the categorical changes observed for the arrival stage were offset by strong survival mismatch (i.e., survival determined introduction potential), with only two categorical changes to final invasion risk ratings as follows: Atlantic International Coastal U.S. (annual), from Intermediate/Higher to Intermediate; Arctic International Transoceanic, from higher to intermediate/higher. These results indicate that the overall relative ranking of risk is largely insensitive to changes in biological densities (estimates of NIS abundance) given the large differences in magnitude between pathways and the large influence of survival.
FUTURE RISK WITH IMO D-2 STANDARD Table 11 summarizes the abundances of zooplankton NIS (individuals per m3) and phytoplankton NIS (cells per m3) expected for each vessel pathway under the IMO D-2 standards. Arctic Coastal Domestic and GLSLR International Transoceanic vessels are expected to carry the highest abundances for zooplankton NIS, while Pacific International Exempt vessels are expected to carry the highest abundances of phytoplankton NIS. Application of the IMO D-2 standards is expected to decrease abundances of zooplankton NIS for all pathways, ranging from 98% to 99% in magnitude. The ten pathways assessed already have mean densities of phytoplankton NIS below the future discharge standard; nevertheless, abundances of phytoplankton NIS are expected to decrease for five pathways (ranging from 0.4% decrease for Pacific International Coastal U.S. to 97% decrease for Pacific International Exempt).
Future annual arrivals - zooplankton NIS The future annual arrivals of zooplankton NIS fall into one group (Figure 13). In comparison to the current scenario, all pathways are ranked as lowest future annual arrival potential for zooplankton NIS.
Future annual arrivals - phytoplankton NIS The future annual arrivals of phytoplankton NIS fall into five groups (Figure 14). In comparison to the current scenario, there is only one change in ranking: Atlantic International Coastal U.S. decreases to intermediate ranking.
Future per-event arrivals - zooplankton NIS The highest expected average abundance of zooplankton NIS per event under future IMO D-2 standards was well below the current average abundance (Figure 15). As a result, in comparison to the current scenario, all pathways were designated lowest future arrival potential per event for zooplankton NIS.
Future per-event arrivals - phytoplankton NIS The future per-event arrival potential of phytoplankton NIS fall into three groups (Figure 16). No rankings changed in comparison to the current scenario.
18
Future survival potential The future survival potential based on similarity of salinity and climate (with BWE for freshwater ports, but without BWE for marine ports) is shown in Table 12). In comparison to the current scenario, two rankings change: Eastern Coastal Domestic decreases to lowest and Atlantic International U.S. decreases to intermediate survival potential.
Future introduction potential Future introduction potential is ranked lowest for all pathways for zooplankton NIS, on both temporal scales. Future introduction potential for phytoplankton NIS ranges from lowest to highest at both temporal scales (Table 13).
Future magnitude of consequences The magnitude of consequences under the future scenario remains the same as was calculated for the current relative invasion risk (Table 13).
Future final relative invasion risk The results of the future relative risk assessment are summarized in Table 13. All pathways are expected to pose lowest invasion risk for zooplankton NIS, while future invasion risk for phytoplankton NIS ranges from lowest to highest. In comparison to the current scenario, the final relative invasion risk for zooplankton NIS decreased for seven pathways, but for phytoplankton NIS, decreased for only one pathway.
DISCUSSION Biological invasions are a stochastic process and it is currently not possible to identify levels of propagule pressure, that will, with certainty, result in a successful invasion. This is due to the wide range of variables involved in the invasion process from arrival through establishment and impact. Despite this difficulty, effective strategies to manage biological invasions focus on reducing propagule pressure at the transportation stage and combination strategies aimed at multiple factors of the invasion process. In the present study, arrival potential was estimated by considering the absolute abundances of both zooplankton and phytoplankton NIS transported on a per-event and annual basis. These calculations were based on abundances of NIS recently sampled from ballast water and the number and volume of ballast water discharge events, by each pathway, in each region. We then incorporated the potential for survival and negative impacts following arrival to produce a comprehensive view of the relative invasion risk among pathways in Canada. These results constitute the best available science-based predictions about the number of NIS introduced (i.e., NIS that arrive, survive and establish) by a given pathway in a given region, whether based on a single discharge event or the cumulative number of discharge events each year. Given the systematic approach and extensive data taken into consideration here, results of this report may differ from previous ballast water research in Canada, which has typically focused on characterizing the community of organisms moved by ballast water, without accounting for additional factors known to significantly affect invasion success. Similarly, there may be some differences in relative invasion risk between this national risk assessment and its precursory regional risk assessments, as this document evaluates risk on a pathway basis, while regional documents assessed risk in a port-specific manner.
Based on sensitivity analysis, the few categorical changes observed within the arrival stage (should we have under or over-estimated density of NIS within pathways) were insignificant due to low survival potential, resulting in only two categorical reassignments for final invasion risk. The overall relative ranking of risk is largely insensitive given the large differences in magnitude
19
between pathways and strong influence of survival mismatch; nonetheless, strong changes in the magnitude of individual pathway arrival outcomes indicate that future research is warranted to more fully determine the statistical distribution of organisms contained in ballast water.
1) What is the level of risk posed by ships transiting to, or from, Arctic ports for the introduction of AIS (aquatic invasive species) to Canadian waters?
In comparison to the other shipping pathways, Arctic Coastal Domestic vessels pose lowest relative invasion risk (for both temporal scales). Survival appears to be the limiting factor for Arctic Coastal Domestic vessels, however, Arctic Coastal Domestic vessels that conduct voluntary BWE in the Strait of Belle Isle, despite good intentions, may not be reducing introduction potential effectively since this area is more environmentally similar to Arctic ports (high salinity, colder temperature) than are ballast source ports in the St. Lawrence River (K. Howland, Fisheries and Oceans Canada, personal communication). Further, it should be noted that this pathway had the second highest mean abundance of zooplankton NIS; if environmental similarity between donor and recipient ports increases due to climate change, introduction potential for this pathway will increase.
Arctic International Transoceanic vessels pose lowest/intermediate invasion risk for zooplankton/phytoplankton at the annual scale, but highest invasion risk for both taxa on the per-event basis, indicating that individual discharges by transoceanic vessels are high risk and cumulative risk will increase if international shipping traffic increases in the region. Our shipping traffic analysis indicates that Canadian Arctic ports are connected with a variety of international ports, providing a mechanism for the introduction of a variety of NIS into the Canadian Arctic.
The movement of ballast water appears to be almost unidirectional, with only 14 transits moving ballast water from Arctic ports to non-Arctic Canadian waters (to the Great Lakes = 9; to the East coast = 5), discharging less than 60,000 m3. As there are no NIS reported from Canadian Arctic waters, the consequences associated with these transits are lowest. Thus, there is limited opportunity for Arctic ports to serve as a source of NIS for other Canadian waters.
Invasion risk for Arctic ports will increase if global climate change results in greater shipping traffic through new waterways and shipping channels in the Arctic Ocean (ACIA 2004; Niimi 2004; Chan et al. 2013; Smith and Stephenson 2013). Commercial vessels began using the Northeast Passage for cargo shipments in 2009, with the number of transiting vessels doubling from seven vessels in 2009 to at least 18 in 2010 (CBC 2010). While the Northwest Passage has not yet been utilized by commercial traffic, Chan et al. (2013) noted that shipping traffic in the Canadian Arctic steadily increased between 2005 and 2009, particularly in late summer. Increasingly warm surface water temperatures are also expected to extend the length of the shipping season in the Arctic (ACIA 2004; Howell and Yackel 2004; Khon et al. 2010), and may increase the potential for survival in Arctic ports. Our analysis of survival potential indicates that salinity and climate are already quite similar between many source-recipient ports for the Arctic region, indicating that invasion risk probably would increase if propagule supply increases, particularly through International Transoceanic vessels. Several proposed large-scale resource extraction developments and new deep-water ports would require shipping for bulk exports as well as logistics and fuel imports, vastly increasing shipping traffic in the region (Arctic Council 2009; Stewart and Howland 2009; City of Iqaluit 2010). The environmental impact statement for one of these projects indicated that supersize vessels would be utilized to export bulk resources, arriving every second day, year-round, with at least 70,000 m3 of ballast water each trip (R. Stewart, Fisheries and Oceans Canada, personal communication; DFO 2012); shipping activities of this magnitude would rank amongst Canada’s top 10 ports currently.
20
2) What is the level of risk posed by ships operating within the ballast water exchange exemption zones on the East and West coasts?
International Exempt vessels are an important pathway for the introduction of zooplankton and phytoplankton NIS into Canadian waters through the transport of un-exchanged ballast water.
Atlantic International Exempt vessels currently pose intermediate invasion risk for zooplankton NIS and highest invasion risk for phytoplankton NIS on an annual basis, and highest relative risk for both taxonomic groups on the per-event scale. Although this pathway operates within a limited geographic extent, the source ports have a moderate number of AIS that could be transported to Canadian ports.
Pacific International Exempt vessels currently pose highest invasion risk for both taxonomic groups, on both temporal scales. Despite the low volume of ballast water discharged per year and the relatively small amount of vessel activity associated with this pathway, the average abundance of NIS is relatively high per vessel, and survival potential is highest with a highest magnitude of consequences.
It should be noted that the ballast water management exemption appears to be applied more liberally in the Pacific region than in the Atlantic region, with the exemption granted based on a vessels’ last port of call rather than limiting the exemption to vessels which operate ‘exclusively’ in the exemption zone as is written in Canadian regulations. In fact, none of the Pacific vessels included in our analysis strictly fit the exemption requirements as written, and estimates of propagule arrival for the Pacific International Exempt pathway are also based on biological surveys of vessels which only conducted their most recent ballast uptake within the exemption zone (E. Briski, Fisheries and Oceans Canada, pers. comm.). This liberal application of the ballast water management exemption in the Pacific region parallels the ‘no ballast on board’ (NOBOB) situation identified in the Great Lakes prior to tank flushing regulations, where discharge of ballast water sourced from local ports posed a risk of new introductions by mixing with untreated residual ballast water from foreign ports (Duggan et al. 2005; Ricciardi 2006b).
3) What is the level of risk posed by domestic shipping activities?
Our results indicate that risk of domestic vessels is variable across regions, taxa and timescales. Lakers pose highest invasion risk for zooplankton NIS but lowest for phytoplankton NIS for both annual and per-event temporal scales, although risk of phytoplankton in Lakers may be underestimated due to the small number of samples assessed (n=6). Eastern Coastal Domestic vessels currently pose lowest (zooplankton NIS) and intermediate (phytoplankton NIS) annual invasion risk, but highest invasion risk for both taxonomic groups on the per-event scale. Arctic Coastal Domestic vessels pose lowest invasion risk (zooplankton NIS) on both temporal scales, while the risk posed by domestic vessels in the Pacific region has not been assessed due to absence of data.
In general, domestic vessels transport high abundances of zooplankton NIS, and environmental similarity between ports within regions is very high. Since biological communities among Canadian ports can be very different, domestic ballast water can facilitate primary invasions of species that are native to a subset of Canadian ports but which are NIS to other Canadian ports (de Lafontaine and Costan 2002; Kelly et al. 2009; Adebayo et al. 2013). Similarly, domestic shipping can facilitate secondary invasions of NIS initially introduced to one Canadian port (by any vector) to other Canadian ports (Carlton and Hodder 1995; Lavoie et al. 1999). For these reasons, domestic ships are important to consider when developing management plans to reduce risk.
21
4) Do current ballast water management regulations provide sufficient protection against ship-mediated AIS introductions?
Evaluating the appropriateness of the current ballast water management regulations is a management exercise that involves risk tolerance. While such an evaluation is beyond the scope of this scientific risk assessment, science can provide relevant information for the decision-making process.
Ballast water exchange is currently used by several countries as a voluntary or mandatory measure to reduce risks for ballast-mediated introductions of NIS to coastal waters. While the introduction of ocean water into tanks is thought highly effective for reducing survival for freshwater taxa (Gray et al. 2007; Bailey et al. 2011), risk reduction is variable for coastal taxa (Taylor et al. 2007; McCollin et al. 2008; Cordell et al. 2009; Lawrence and Cordell 2010; Simard et al. 2011). The invasion risk currently posed by GLSLR international Transoceanic vessels was used as the lowest risk benchmark in this study, since BWE is thought particularly effective for this pathway and no ballast-mediated NIS have been reported from the Great Lakes since 2006 (Bailey et al. 2011). Under this rationale, all seven of the remaining International pathways pose an intermediate to highest annual invasion risk for at least one taxon. Five of these seven pathways are already managed by BWE, indicating that BWE is not providing equivalent protection across all Canadian ports. This is because the efficacy of BWE is highly variable, particularly for coastal voyages. In fact, in some studies BWE appears to have increased the risk of introduction potential of NIS, particularly for phytoplankton on the Atlantic coast (e.g., Carver and Mallet 2002). Roy et al. (2012) also reported that diversity of phytoplankton NIS was higher on ships that had undertaken BWE (Transoceanic or Coastal), with some species being of oceanic origin. Similarly, on the Pacific coast, Cordell et al. (2009) reported that BWE had no significant influence on coastal zooplankton species but increased the abundance of oceanic zooplankton species found on Pacific International Transoceanic vessels.
Causes for BWE inefficiency may include structural limitations inside ballast tanks that restrict exchange of water, or offshore transport of coastal taxa. Ballast water regulation in Canada started in the Great Lakes in 1989 on a voluntary basis and evolved to full regulation of ballast water across Canada in the 2006 Ballast Water Control and Management Regulations. Thus, a potentially confounding factor is that vessels on the three Canadian coasts have a shorter history and experience in undertaking BWE than does the GLSLR. In addition, ships entering the Great Lakes have to manage ballast residuals through tank flushing and a comprehensive bi-national ballast water inspection program was established in 2006 for the GLSLR region. This inspection program includes a review of ballast water reporting forms submitted by vessels prior to arrival; ships reporting unmanaged ballast are instructed to conduct exchange and/or flushing while still offshore. A physical visit to the ship is then conducted on arrival to inspect ballast water logs and management plans, and to assess crew competency. Finally, a ballast tank exam is conducted, wherein the salinity of ballast water is measured (Bailey et al. 2011). Full inspections have been conducted on 100% of tanks of 100% of vessels in the GLSLR region since 2009; enforcement efforts are considerably lower in the other regions.
Nevertheless, as biological surveys of ballast water indicated that the density of NIS carried by vessels remains high after BWE, our future risk projections indicate that ballast water management at the level of the IMO D-2 standards will dramatically reduce arrival potential for zooplankton for all pathways in all regions. In contrast, the IMO D-2 standards will have a lesser effect on arrival potential for phytoplankton (reducing expected abundances of NIS for only five pathways). The proposed requirements for vessels arriving to Canadian freshwater ports, which combine BWE with the IMO D-2 standards, are expected to maintain very low survival potential
22
of introduced organisms while systematically reducing propagule pressure; these expected benefits are supported by recent empirical tests (Briski et al. 2013).
CONSIDERATIONS The results presented in this report are based on recent shipping patterns and environmental conditions; any changes to one or both factors will lead to changes in relative invasion risk. In particular, efforts to increase trade and shipping traffic to Canada would result in higher arrival potential and could establish new connections with global source ports sharing high environmental similarity to Canadian recipient ports. While results of recent biological surveys for different shipping pathways to Canada were considered in this assessment, data were not available for all pathways in this study, and the diversity and distribution of zooplankton is considerably better studied than for phytoplankton.
Further, climate change scenarios predict both thermal and physical changes across Canada that could impact analyses of environmental similarity between port pairs (Lines et al. 2008). A reanalysis of environmental similarity between donor and recipient port-pairs, using environmental variables projected under climate change scenarios, may be useful to further refine predictions of future invasion risk across Canada.
We also caution that these risk outcomes must be interpreted only as a relative ranking of the pathways; understanding the quantitative risk of a given pathway will require considerable research to determine the propagule pressure-establishment relationship.
Hull Biofouling Hull biofouling is known to be an important vector for the transfer of marine and coastal aquatic NIS (Gollasch 2002; Coutts et al. 2003), and has recently become a particular concern for both primary and secondary invasions of tunicates in Atlantic and Pacific Canada. In contrast, biofouling has received little attention in the Great Lakes since less than 4% of established aquatic NIS are believed to have been introduced by this vector (Sylvester and MacIsaac 2010), while its influence in transporting NIS to the Arctic is currently unknown. The low incidence of hull-mediated NIS in the GLSLR is likely due to voyage patterns: vessels must pass through high salinity marine water en route to the Great Lakes, which will kill most nonindigenous freshwater taxa that could survive in Great Lakes’ habitat (Sylvester and MacIsaac 2010). Coastal and marine taxa are more likely to survive transoceanic passage, and as such, hull-biofouling introductions are more prevalent in marine and brackish water ports.
The International Convention on the Control of Harmful Anti-fouling Systems on Ships, 2001, which entered into force in 2008, was ratified by Canada in April 2010. While shipping companies have historically worked to minimize biological fouling of exterior underwater surfaces since biofouling increases drag and decreases fuel economy and ship speed, this convention banned the use of the highly effective tributyl tin-based anti-fouling paint, which may have increased the importance of hull biofouling as an invasion vector. While Canada has regulations regarding anti-fouling systems, such as the regular application of non-tributyl tin anti-fouling paint (Department of Justice Canada 2011), and has supported the adoption of recent international guidelines for control and management of ships’ biofouling, Canada does not currently have domestic biofouling regulations. The regional risk assessments used the number of ship arrivals to estimate propagule arrival of NIS by hull fouling, however, the number of vessel arrivals is a coarse proxy for propagule supply; sailing speed, port layover time, anti-fouling management, and voyage history are all important factors affecting the propagule supply associated with hull fouling of individual ships (Minchin and Gollasch 2003; Coutts and Taylor
23
2004; Floerl and Inglis 2005). As this information was not available, we could not further extend the regional risk assessments for hull fouling.
In addition to international merchant vessels, Darbyson et al. (2009) flagged the importance of biofouling of non-merchant recreational and fishing vessels in Canada. The actual or potential role of recreational boats in the introduction of NIS in marine environments is increasingly recognised (Acosta and Forrest 2009; Piola and Forrest 2009). However, the actual mechanisms of site- and species-specific patterns of vessel colonization remain poorly understood (Lacoursière-Roussel 2012). As a result, the evaluation of non-merchant vessel hull biofouling as a vector of NIS will require extensive research beyond the scope of this study. Limited information regarding risks of Atlantic non-merchant vessels is available in the regional risk assessment (Adams et al. pers.comm.5). Finally, some non-merchant vessels, such as cruise ships and large fishing vessels, do carry and exchange > 8m3 ballast water, but because of a lack of data and inconsistent reporting, these vessels were not included in this risk assessment. In addition, it has been demonstrated that Department of Defense vessels (in the U.S.A.) can transport large quantities of phytoplankton species, including harmful taxa, in the ballast water (Burkholder et al. 2007). The assumption that non-merchant vessels conduct only limited ballasting operations should be confirmed.
CONCLUSIONS • The results of this comparative risk assessment, which allows prioritization of different
ballast pathways, show that ballast water is a significant mechanism for transporting NIS to and within Canada.
• Although few ballast water discharges occur in the Arctic, resulting in a relatively low annual risk, the risk posed by individual discharges of International Transoceanic vessels in the Arctic is ranked highest. This risk will increase in the future with expected growth of commercial shipping activities due to longer ice free seasons, northern development and climate change. Arctic ports are unlikely to serve as a source of NIS for other Canadian waters.
• Ships operating within the Ballast Water Exemption Zones in the Pacific and Atlantic regions currently pose a relatively high invasion risk. International Exempt vessels are an important pathway for the introduction of zooplankton and phytoplankton NIS into Canadian waters through the transport of un-exchanged ballast directly from ports with established NIS.
• The risk of domestic vessels is variable across regions, taxa and timescales. Lakers pose highest risk for zooplankton NIS at both timescales, while Eastern Coastal Domestic vessels pose highest risk for both taxa only on an individual discharge basis. The risk posed by domestic ships in the Arctic is lowest, while Pacific Coastal Domestic vessels were not assessed due to lack of data.
5 Adams, J. K., Ellis, S.M., Chan, F. T., Bronnenhuber, J. E., Simard, N., McKenzie, C. H., Martin, J. L., and Bailey, S. A. 2013. Relative risk assessment for ship-mediated introductions of aquatic nonindigenous species to the Atlantic Region of Canada. DFO Canadian Science Advisory Secretariat Working Paper.
24
• Current regulatory requirements for ballast water exchange by transoceanic vessels effectively reduce the risk of invasions to freshwater ecosystems (e.g., Great Lakes), but are less effective in reducing the risk to marine ecosystems.
• The risk of introducing zooplankton NIS would be reduced for all pathways if managed in accordance with the IMO D-2 Standard. However, the risk of introducing phytoplankton NIS would only be reduced for half of the pathways.
• Effective management of all ship-mediated NIS introductions will require consideration of other shipping vectors such as hull biofouling and ballast sediments, by both commercial and non-commercial vessels.
RECOMMENDATIONS • Future biological sampling of ballast water should be prioritized for shipping pathways
having no data available (Arctic pathways) or small sample size (phytoplankton NIS in domestic ships) to more accurately quantify the arrival potential of NIS; the Atlantic International Coastal U.S. and Atlantic International Transoceanic pathways were identified as being most sensitive to changes in biological density estimates.
• Research should be conducted at dominant ballast water source ports, both within and outside Canada, to more accurately estimate the diversity of NIS that could be introduced by shipping pathways.
• Advice on potential benefits and risks associated with different locations of BWE should be developed for Arctic Coastal Domestic transits.
• A reanalysis of environmental similarity between donor and recipient port-pairs, using environmental variables projected under climate change scenarios, would be useful to further refine predictions of future invasion risk across Canada.
• Additional research should be conducted to evaluate the risk of ballast-mediated NIS introductions by domestic vessels in the Pacific region
• Additional research should be conducted to evaluate the risk of hull biofouling-mediated NIS introductions, by both commercial and non-commercial ships.
REFERENCES ACIA. 2004. Impacts of a warming Arctic: Arctic climate impact assessment. Cambridge
University Press 146pp.
Acosta, H., and Forrest, B. M. 2009. Recreational boating and the spread of marine non-indigenous species: a conceptual model for risk assessment. Ecol. Model. 220: 1586–1598.
Adebayo, A. A., Zhan, A., Bailey, S. A., and MacIsaac, H. J. 2013. Domestic ships as a potential pathway of nondigenous species introduction from the Saint Lawrence River to the Great Lakes. Biological Invasions (in press).
Albert, R.J., Lishman, J.M. and Saxena, J.R. 2013. Ballast water regulations and the move toward concentration-based numeric discharge limits. Ecol. Appl. 23: 289-300.
Anger, K. 1991. Effects of temperature and salinity on the larval development of the Chinese mitten crab Eriocheir sinensis (Decapoda: Grapsidae). Mar. Ecol. Prog. Ser. 72:103-110.
25
[ANSTF] Aquatic Nuisance Species Task Force. 2007. Aquatic Nuisance Species Task Force strategic plan (2007–2012)
Antonov, J. I., Locarnini, R. A., Boyer, T. P., Mishonov, A. V., and Garcia, H. E. 2006. World Ocean Atlas 2005, Volume 2: Salinity. Edited by S. Levitus. NOAA Atlas NESDIS 62, U.S. Government Printing Office, Washington, D.C. 182 p.
Arctic Council. 2009. Arctic marine shipping assessment 2009 report. Arctic Council, Tromsø, Norway.
Bailey, S. A., Duggan, I. C., van Overdijk, C. D. A., Johengen, T. H., Reid, D. F., and MacIsaac, H. J. 2004. Salinity tolerance of diapausing eggs of freshwater zooplankton. Freshw. Biol. 49(3): 286-295
Bailey, S. A., Vélez-Espino, L. A., Johannsson, O. E., Koops, M. A., and Wiley, C. J. 2009. Estimating establishment probabilities of Cladocera introduced at low density: An evaluation of the proposed ballast water discharge standards. Can. J. Fish. Aquat. Sci. 66(2): 261-276.
Bailey, S. A., Deneau, M. G., Jean, L., Wiley, C. J., Leung, B., and MacIsaac, H. J. 2011. Evaluating efficacy of an environmental policy to prevent biological invasions. Environ. Sci. Technol. 45: 2554-2561.
Bailey, S. A., Chan, F., Ellis, S. M., Bronnenhuber, J. E., Bradie, J. N., and Simard, N. 2012. Risk Assessment for ship-mediated introductions of aquatic nonindigenous species to the Great Lakes and freshwater St. Lawrence River. DFO Can. Sci. Advis. Sec. Res. Doc.. 2011/104 vi+224p.
Bald, J., Borja, A., Muxika, I., Franco, J., and Valencia, V. 2005. Assessing reference conditions and physico-chemical status according to the European Water Framework Directive: A case-study from the Basque Country (Northern Spain). Mar. Pollut. Bull. 50: 1508-1522.
Barry, S. C., Hayes, K. R., Hewitt, C. L., Behrens, H. L., Dragsund, E., and Bakke, S. M. 2008. Ballast water risk assessment: principles, processes, and methods. ICES J. Mar. Sci. 65:121-131.
Briski, E., Bailey, S.A., and MacIsaac, H.J. 2011. Invertebrates and their dormant eggs transported in ballast sediments of ships arriving to the Canadian coasts and the Laurentian Great Lakes. Limnol. Oceanogr. 56: 1929-1939.
Briski, E., Bailey, S. A., Casas-Monroy, O., DiBacco, C., Kaczmarska, I., Levings, C., MacGillivary, M. L., McKindsey, C. W., Nasmith, L. E., Parenteau, M., Piercey, G., Rochon, A., Roy, S., Simard, N., Villac, M.C., Weise, A., and MacIsaac, H. J. 2012a. Relationship between propagule pressure and colonization pressure in invasion ecology: a test with ships’ ballast. Proceedings of the Royal Society. Doi:10.1098/rspb.2011.2671
Briski, E., Ghabooli, S., Bailey, S. A., and MacIsaac, H. J. 2012b. Role of domestic shipping in the introduction or secondary spread of nonindigenous species: biological invasions within the Laurentian Great Lakes. J. Appl. Ecol. 49: 1124-1130.
Briski, E., Allinger, L. E., Balcer, M., Cangelosi, A., Fanberg, L., Markee, T. P., Mays, N., Polkinghorne, C. N., Prihoda, K. R., Reavie, E. D., Regan, D. H., Reid, D. M., Saillard, H. J., Schwerdt, T., Schaefer, H., TenEyck, M., Wiley, C. J., and Bailey, S. A. 2013. A multi-dimensional approach to invasive species prevention. Environ. Sci. Technol. 47: 1216-1221.
26
Browne, R. A., and Wanigasekera, G. 2000. Combined effects of salinity and temperature on survival and reproduction of five species of Artemia. J. Exp. Mar. Biol. Ecol. 244:29-44.
Burkholder, J. M., Hallegraeff, G. M., Melia, G., Cohen, A., Bowers, H.A., Oldach, D. W., Parrow, M. W., Sullivan, M. J., Zimba, P. V., Allen, E. H., Kinder, C. A., and Mallin, M. A. 2007. Phytoplankton and bacterial assemblages in ballast water of US military ships as a function of port of origin, voyage time, and ocean exchange practices. Harmful Algae 6(4): 486-518.
Canada Shipping Act. 2011. Ballast Water Control and Management Regulations.
Casas-Monroy, O. 2012. Introduction des dinoflagellés non-indigènes dans les écosystèmes aquatiques canadiens via les réservoirs de ballast de navires. Ph.D. thesis. Univ. of Quebec at Rimouski.
Casas-Monroy, O., Roy, S., and Rochon, A. 2012. Dinoflagellate cysts in ballast sediments: differences between Canada’s east coast, west coast and the Great Lakes. Aquat. Conserv.: Mar. Freshwat. Ecosyst. DOI: 10.1002/aqc.2310.
Carlton, J. T., and Hodder, J. 1995. Biogeography and dispersal of coastal marine organisms: experimental studies on a replica of a 16th-century sailing vessel. Mar. Biol. 121(4): 721-730.
Carty, S. 2003. Dinoflagellates. In: Wehr J. D., Sheath R. G. (eds) Freshwater algae of North America – ecology and classification. Academic Press, New York, pp 685–714
Carver, C. E., and Mallet, A. L. 2002. An assessment of the risk of ballast water-mediated introduction of non-indigenous phytoplankton and zooplankton into Atlantic Canadian waters. Mallet Research Services, Dartmouth, Nova Scotia.
[CBC] Canadian Broadcasting Corporation. 2010. Northwest Passage Traffic up in 2010.
Chan, F. T., Bronnenhuber, J. E., Bradie, J. N., Howland, K. L., Simard, N., and Bailey, S. A. 2012. Risk assessment for ship-mediated introductions of aquatic nonindigenous species to the Canadian Arctic. DFO Canadian Science Advisory Secretariat Research Document. 2011/105. vi + 93 p.
Chan, F. T., Bailey, S. A., Wiley, C. J., and MacIsaac, H. J. 2013. Relative risk assessment for ballast-mediated invasions at Canadian Arctic ports. Biol. Invasions 15(2): 295-308.
City of Iqaluit. 2010. Iqaluit Deepwater Port Project.
Colautti, R. I., Bailey, S.A., van Overdijk, C.D.A., Amundsen, K., and MacIsaac, H.J. 2006a. Characterised and projected costs of nonindigenous species in Canada. Biol. Invasions 8: 45-59.
Colautti, R. I., Grigorovich, I.A., and MacIsaac, H.J. 2006b. Propagule pressure: A null model for biological invasions. Biol. Inv. 8: 1023-1037.
Cordell, J. R., Lawrence, D. J., Ferm, N. C., Tear, L. M., Smith, S. S., and Herwig, R. P. 2009. Factors influencing densities of non-indigenous species in the ballast water of ships arriving at ports in Puget Sound, Washington, United States. Aquat. Conserv.: Mar. Freshwat. Ecosyst. 19: 322-343.
Coutts, A. D. M., and Taylor, M. D. 2004. A preliminary investigation of biosecurity risks associated with biofouling on merchant vessels in New Zealand. N. Z. J. Mar. Freshwat. Res. 38(2): 215-229.
27
Coutts, A. D. M., Moore, K. M., and Hewitt, C. L. 2003. Ships’ sea-chests: An overlooked transfer mechanism for non-indigenous marine species? Mar. Pollut. Bull. 46(11): 1510 1513.
Daniel, K. S., and Therriault T. W. 2007. Biological synopsis of the invasive tunicate Didemnum sp. Canadian Manuscript Report of Fisheries and Aquatic Sciences Nanaimo, BC, CANADA, Pacific Biological Station: 1-53.
Darbyson, E., Locke, A., Hanson, J. M., and Willison H. M. 2009. Marine boating habits and the potential for spread of invasive species in the Gulf of St. Lawrence. Aquatic Invasions 4(1): 87-94.
David, M., Gollasch, S., and Pavliha, M. 2013. Global ballast water management and the “same location” concept: a clear term or a clear issue? Ecol. Appl. 23: 331-338.
de Lafontaine, Y., and Costan, G. 2002. Introduction and transfer of alien aquatic species in the Great Lakes-St. Lawrence River Drainage Basin. In Alien invaders in Canada’s Waters, Wetlands, and Forests. Edited by R. Claudi, P. Nantel, and E. Muckle-Jeffs. Natural Resources Canada, Ottawa, Ontario, pp. 219-231.
Department of Justice Canada. 2011 Ballast water control and management regulations. SOR/2011-237.
[DFO] Fisheries and Oceans Canada. 2012. Science review of Baffinland’s Mary River Project final environmental impact statement. DFO Can. Sci. Advis. Sec. Sci. Resp. 2012/016.
DiBacco, C., Humphrey, D. B., Nasmith, L. E., and Levings, C. D. 2012. Ballast water transport of non-indigenous zooplankton to Canadian ports. ICES J. Mar. Sci. 69: 483-491.
Dickman, M., and Zhang, F. 1999. Mid-ocean exchange of container vessel ballast water. 2: Effects of vessel type in the transport of diatoms and dinoflagellates from Manzanillo, Mexico, to Hong Kong, China. Mar. Ecol. Prog. Ser. 176: 253-262.
Drouin, A., and McKindsey, C. W. 2007. QBRAT v2 assessment Codium fragile spp. tomentosoides in the Gulf of St. Lawrence as a case study. DFO Can. Sci. Advis. Sec. Res. Doc. 2007/007. 28 p.
Duggan, I.C., van Overdijk, C.D.A., Bailey, S.A., Jenkins, P.T., Limen, H., and MacIsaac, H.J. 2005. Invertebrates associated with residual ballast water and sediments of cargo-carrying ships entering the Great Lakes. Can. J. Fish. Aquat. Sci. 62: 2463-2474.
Dunstan, P. K., and Bax, N. J. 2008. Management of an invasive marine species: defining and testing the effectiveness of ballast-water management options using management strategy evaluation. ICES J. Mar. Sci. 65:841-850.
El-Sabh, M. I., and Murty, T. S. 1990. Mathematical modelling of tides in the St. Lawrence Estuary. In Oceanography of a large-scale estuarine system: The St. Lawrence. Edited by M.I. El-Sabh and N. Silverberg. Coastal and Estuarine Studies 39. pp 10-50.
Environment Canada. 2005. Wildlife of the Atlantic Maritime Ecozone.
[EPA-SAB] Environmental Protection Agency-Science Advisory Board. 2011. Efficacy of ballast water treatment systems: EPA Science Advisory Board. United States Environmental Protection Agency. Washington D.C.
Floerl, O., and Inglis, G. J. 2005. Starting the invasion pathway: the interaction between source populations and human transport vectors. Biol. Invasions 7:589–606. doi:10.1007/s10530- 004-0952-8.
28
Floerl, O., Inglis, G. J., Dey, K., and Smith, A. 2009. The importance of transport hubs in stepping-stone invasions. J. Appl. Ecol. 46(1):37-45.
Gillespie, G.E. 2007. Distribution of non-indigenous intertidal species on the Pacific Coast of Canada. Nippon Suisan Gakkaishi 73(6): 1133-1137.
Glasby, T., Connell, S., Holloway, M., and Hewitt, C. 2007. Nonindigenous biota on artificial structures: could habitat creation facilitate biological invasions? Mar. Biol. 2007: 887-895.
Gollasch, S. 2002. The importance of ship hull fouling as a vector of species introductions into the North Sea. Biofouling 18(2): 105-121.
Gollasch, S. 2006. Assessment of the introduction potential of aquatic alien species in new environments. In: In Koike, F., Clout, M. N., Kawamichi, M., De Poorter, M. and Iwatsuki, K. (eds), Assessment and Control of Biological Invasion Risks. Shoukadoh Book Sellers, Kyoto, Japan and IUCN, Gland, Switzerland. pp. 88-91.
Gollasch, S., and Leppäkoski, E. 2007. Risk assessment and management scenarios for ballast water mediated species introductions into Baltic Sea. Aquatic Invasions 2(4): 313-340.
Gray, D. K., Johengen, T.H., Reid, D. F., and MacIsaac, H. J. 2007. Efficacy of open-ocean ballast water exchange as a means of preventing invertebrate invasions between freshwater ports. Aquatic Invasions 52(6): 2386-2397.
Holeck, K.T., Mills, E.L., MacIsaac, H.J., Dochoda, M.R., Colautti, R.I., and Ricciardi, A. 2004. Bridging troubled waters: biological invasions, transoceanic shipping, and the Laurentian Great Lakes. BioScience 54: 919-929.
Howell, S. E. L., and Yackel, J. J. 2004. A vessels transit assessment of sea ice variability in the western Arctic, 1969-2002: implications for ship navigation. Canadian Journal of remote Science 30(2): 205-215
Howes, S., Herbinger, C. M., Darnell, P., and Vercaemer, B. 2007. Spatial and temporal patterns of recruitment of the tunicate Ciona intestinalis on a mussel farm in Nova Scotia. J. Exp. Mar. Biol. Ecol. 342: 85-92.
Humphrey, D. B. 2008. Characterizing ballast water as a vector for nonindigenous zooplankton transport. M.Sc. thesis, Faculty of Graduate Studies (Oceanography), The University of British Columbia, Vancouver, B. C.
[IMO] International Maritime Organization. 2010. Development of Guidelines and Other Documents for Uniform Implementation of the 2004 BWM Convention: Proposal to Utilize Ballast Water Exchange in Combination with a Ballast Water Management System to Achieve an Enhanced Level of Protection. Submitted by Canada to International Maritime Organization, Sub-Committee on Bulk Liquids and Gases, 15th Session, BLG 15/5/7.
Katsanevakis, S., Zenetos, A., Belchior, C., and Cardoso, A.C. 2013. Invading European Seas: assessing pathways of introduction of marine aliens. Ocean Coast. Manage. 76: 64-74.
Keller, R. P., Drake, J. M., Drew, M. B., and Lodge, D. M. 2011. Linking environmental conditions and ship movements to estimate invasive species transport across the global shipping network. Divers. Distrib. DOI: 10.1111/j.1472-4642.2010.00696.x.
Kelly, D.W., Lamberti, G.A., and MacIsaac H.J. 2009. The Laurentian Great Lakes as a case study of biological invasions. In: Keller, R.P., Lodge D.M., Lewis, M.A. Shogren, J.F. (Eds.). Bioeconimcs of invasive species: Integrating ecology, economics, policy and management. Oxfort University Press, 205-225p.
29
Khon, V. C., Mokhov, I. I., Latif, M., Semenov, V. A., and Park, W. 2010. Perspectives of Northern Sea Route and Northwest Passage in the twenty-first century. Clim. Chang. 100: 757-768.
Kinne, O. 1963. The effect of temperature and salinity on marine and brackish water animals. I. Temperature. Oceanogr. Mar. Biol. Annu. Rev. 1(1): 301-340.
Klein, G., Kaczmarska, I., and Ehrman, J. M. 2009. The Diatom chatoceros in ships' ballast waters-survivorship of stowaways. Acta Botanica Croatia 68(2): 325-338.
Kolar, C. S., and Lodge, D. M. 2001. Progress in invasion biology: predicting invaders. Trends Ecol. Evol. 16(4): 199-204.
Lacoursière-Roussel, A., Forrest, B. M., Guichard, F., Piola, R. F., and McKindsey, C. W. 2012. Modeling biofouling from boat and source characteristics: a comparative study between Canada and New Zealand. Biol. Invasions 14: 2301-2314.
Lavoie, D. M., Smith, L. D., and Ruiz, G. M. 1999. The potential for intracoastal transfer of non indigenous species in the ballast water of ships. Estuar. Coast. Shelf Sci. 48(5): 551-564.
Lawler, J. J., White, D., Neilson, R. P., and Blaustein, A. R. 2006. Predicting climate-induced range shifts: model differences and model reliability. Global Change Biol. 12(8): 1568-1584.
Lawrence, D. J., and Cordell, J. R. 2010. Relative contributions of domestic and foreign sourced ballast water to propagule pressure in Puget Sound, Washington, USA. Biol. Conserv. 143(3): 700-709.
Levings, C. D., Kieser, D., Jamieson, G. S., and Dudas S. 2002. Marine and estuarine alien species in the Straight of Georgia, British Columbia. In Alien invaders in Canada’s Waters, Wetlands, and Forests. Claudi, R., Nantel, P., and Muckle-Jeffs, E. (Eds.). Natural Resources Canada, Ottawa, Ontario, pp. 111-133.
Levings, C. D., and Foreman, M. G. G. 2004. Ecological and oceanographic criteria for alternate ballast water exchange zones in the Pacific Region. DFO Can. Sci. Advis. Sec. Res. Doc. 2004/118. iv + 37 p.
Lewis, M. 1997. Variability, patchiness, and jump dispersal in the spread of an invading population. In Spatial ecology: the role of space in population dynamics and interspecific interactions. Princeton University Press, Princeton, N.J. pp. 46–69.
Lines, G. S., Pancura, M., Lander, C., and Titus, L. 2008. Climate change scenarios for Atlantic Canada utilizing a statistical downscaling model based on two global climate models. Meteorological Service of Canada, Scientific Report Series 2009-01.
Locarnini, R. A., Mishonov, A. V., Antonov, J. I., Boyer, T. P., and Garcia, H. E. 2006. World Ocean Atlas 2005, Volume 1: Temperature. Edited by S. Levitus. NOAA Atlas NESDIS 61, U.S. Government Printing Office, Washington, D.C. 182 p.
Locke, A., Hanson, J. M., MacNair, N. G., and Smith, A. 2009. Rapid responce to non-indigenous species. 2. Case studies of invasive tunicates in Prince Edward Island. Aquatic Invasions 4: 249-258.
Lockwood, J., Hoopes, M., and Marchetti, M. 2006. Invasion ecology. Wiley-Blackwell Publishing, Oxford, United Kingdom.
30
Lockwood, J. L., Blackburn, T. M., and Cassey, P. 2009. The more you introduce the more you get: the role of colonization pressure and propagule pressure in invasion ecology. Divers. Distrib. 15: 904-910.
Lodge, D. M., Stein, R. A., Brown, K. M., Covich, A. P., Brönmark, C., Garvey, J. E. and Klosiewski, S. P. 1998. Predicting impact of freshwater exotic species on native biodiversity: challenges in spatial scaling. Aust. J. Ecol. 23(1): 53–67.
MacConnachie, S., Hillier, J., and Butterfield, S. 2007. Marine Use Analysis for the Pacific North Coast Integrated Management Area. DFO Canadian Technical Report of Fisheries and Aquatic Sciences 2677: viii + 188 p.
MacIsaac, H. J., Borberly, J. V. M., Muirhead, J. R., and Graniero, P. A. 2004. Backcasting and forecasting biological invasions of inland lakes. Ecol. Appl. 14(3): 773-783.
Mandrak, N. E., Cudmore, B., and Chapman, P. M. 2012. National Detailed-Level Risk Assessment Guidelines: Assessing the Biological Risk of Aquatic Invasive Species in Canada. DFO Can. Sci. Advis. Sec. Res. Doc. 2011/092. vi + 17 p.
McCalla, R.J. 1994. Sovereignty and shipping in the Canadian Arctic archipelago. In Water transportation in Canada. McCalla, R. J. (ed) Formae Publishing Company Limited, Halifax, Nova Scotia, pp. 194-223.
McCollin, T., Shanks, A. M., and Dunn, J. 2007. The efficiency of regional ballast water exchange: changes in phytoplankton abundance and diversity. Harmful Algae 6: 531-546.
McCollin, T., Shanks, A. M., and Dunn, J. 2008. Changes in zooplankton abundance and diversity after ballast water exchange in regional seas. Mar. Pollut. Bull. 56: 834-844.
Mead, A., Carlton, J.T., Griffiths, C.L., and Rius, M. 2011. Revealing the scale of marine bioinvasions in developing regions: a South African re-assessment. Biol. Invasions 13: 1991-2008.
[MEA] Millennium Ecosystem Assessment. 2005. Millennium ecosystem assessment: sub-global assessments.
Minchin, D., and Gollasch, S. 2003. Fouling and ships' hulls: how changing circumstances and spawning events may result in the spread of exotic species. Biofouling 19: 111-122.
Molnar, J. L., Gamboa, R. L., Revenga, C., and Spalding, M. D. 2008. Assessing the global threat of invasive species to marine biodiversity. Front. Ecol. Environ. 6(9): 485-492.
Niimi, A. J. 2004. Environmental and economic factors can increase the risk of exotic species introductions to the Arctic Region through increased ballast water discharged. Environ. Manag. 33(5): 712-718.
[NRC] National Research Council. 2011. Assesing the relationship between propagule pressure and invasion risk in ballast water. The National Academies Press. Washington, D.C.
[OMNR] Ontario Ministry of Natural Resources. 2009. Great Lakes: Living systems.
Pickard, G. L., and Emery, W. J. 1996. Descriptive Physical Oceanography, 5th ed. Butterworth-Heinemann, Oxford.
Piola, R. F., and Forrest, B. 2009. Options for managing biosecurity risks from recreational vessel hubs. Cawthron Report No. 1591. p 51.
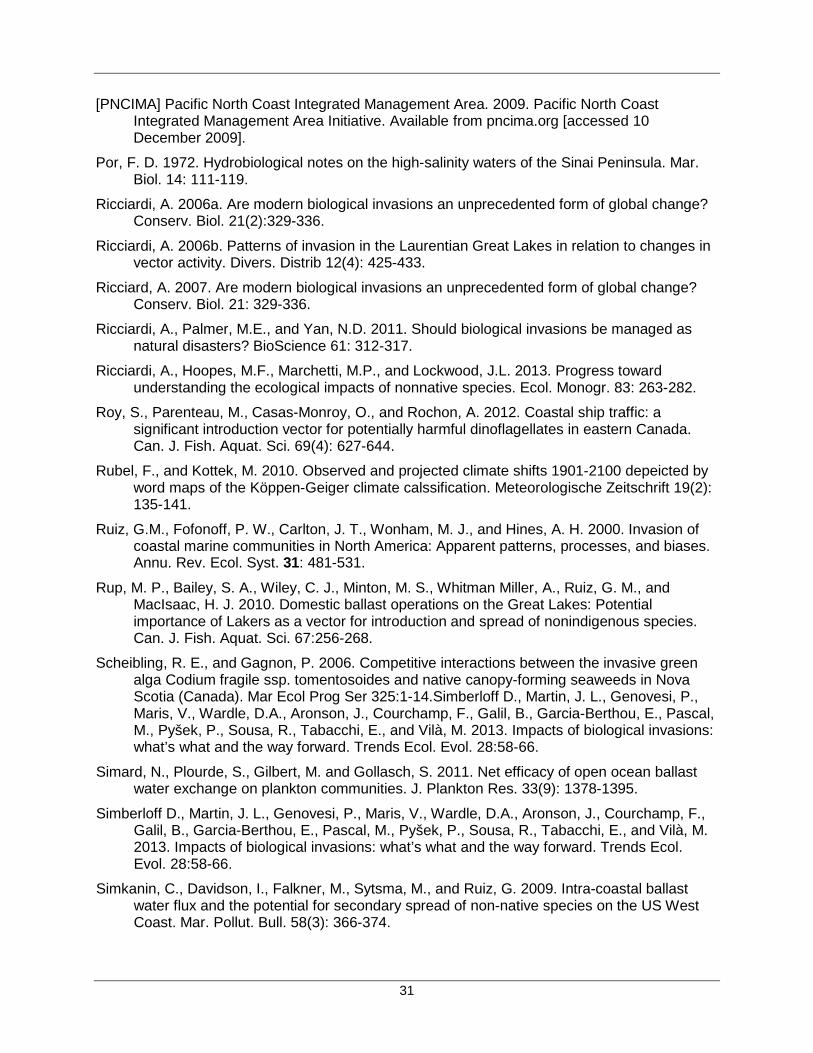
31
[PNCIMA] Pacific North Coast Integrated Management Area. 2009. Pacific North Coast Integrated Management Area Initiative. Available from pncima.org [accessed 10 December 2009].
Por, F. D. 1972. Hydrobiological notes on the high-salinity waters of the Sinai Peninsula. Mar. Biol. 14: 111-119.
Ricciardi, A. 2006a. Are modern biological invasions an unprecedented form of global change? Conserv. Biol. 21(2):329-336.
Ricciardi, A. 2006b. Patterns of invasion in the Laurentian Great Lakes in relation to changes in vector activity. Divers. Distrib 12(4): 425-433.
Ricciard, A. 2007. Are modern biological invasions an unprecedented form of global change? Conserv. Biol. 21: 329-336.
Ricciardi, A., Palmer, M.E., and Yan, N.D. 2011. Should biological invasions be managed as natural disasters? BioScience 61: 312-317.
Ricciardi, A., Hoopes, M.F., Marchetti, M.P., and Lockwood, J.L. 2013. Progress toward understanding the ecological impacts of nonnative species. Ecol. Monogr. 83: 263-282.
Roy, S., Parenteau, M., Casas-Monroy, O., and Rochon, A. 2012. Coastal ship traffic: a significant introduction vector for potentially harmful dinoflagellates in eastern Canada. Can. J. Fish. Aquat. Sci. 69(4): 627-644.
Rubel, F., and Kottek, M. 2010. Observed and projected climate shifts 1901-2100 depeicted by word maps of the Köppen-Geiger climate calssification. Meteorologische Zeitschrift 19(2): 135-141.
Ruiz, G.M., Fofonoff, P. W., Carlton, J. T., Wonham, M. J., and Hines, A. H. 2000. Invasion of coastal marine communities in North America: Apparent patterns, processes, and biases. Annu. Rev. Ecol. Syst. 31: 481-531.
Rup, M. P., Bailey, S. A., Wiley, C. J., Minton, M. S., Whitman Miller, A., Ruiz, G. M., and MacIsaac, H. J. 2010. Domestic ballast operations on the Great Lakes: Potential importance of Lakers as a vector for introduction and spread of nonindigenous species. Can. J. Fish. Aquat. Sci. 67:256-268.
Scheibling, R. E., and Gagnon, P. 2006. Competitive interactions between the invasive green alga Codium fragile ssp. tomentosoides and native canopy-forming seaweeds in Nova Scotia (Canada). Mar Ecol Prog Ser 325:1-14.Simberloff D., Martin, J. L., Genovesi, P., Maris, V., Wardle, D.A., Aronson, J., Courchamp, F., Galil, B., Garcia-Berthou, E., Pascal, M., Pyšek, P., Sousa, R., Tabacchi, E., and Vilà, M. 2013. Impacts of biological invasions: what’s what and the way forward. Trends Ecol. Evol. 28:58-66.
Simard, N., Plourde, S., Gilbert, M. and Gollasch, S. 2011. Net efficacy of open ocean ballast water exchange on plankton communities. J. Plankton Res. 33(9): 1378-1395.
Simberloff D., Martin, J. L., Genovesi, P., Maris, V., Wardle, D.A., Aronson, J., Courchamp, F., Galil, B., Garcia-Berthou, E., Pascal, M., Pyšek, P., Sousa, R., Tabacchi, E., and Vilà, M. 2013. Impacts of biological invasions: what’s what and the way forward. Trends Ecol. Evol. 28:58-66.
Simkanin, C., Davidson, I., Falkner, M., Sytsma, M., and Ruiz, G. 2009. Intra-coastal ballast water flux and the potential for secondary spread of non-native species on the US West Coast. Mar. Pollut. Bull. 58(3): 366-374.
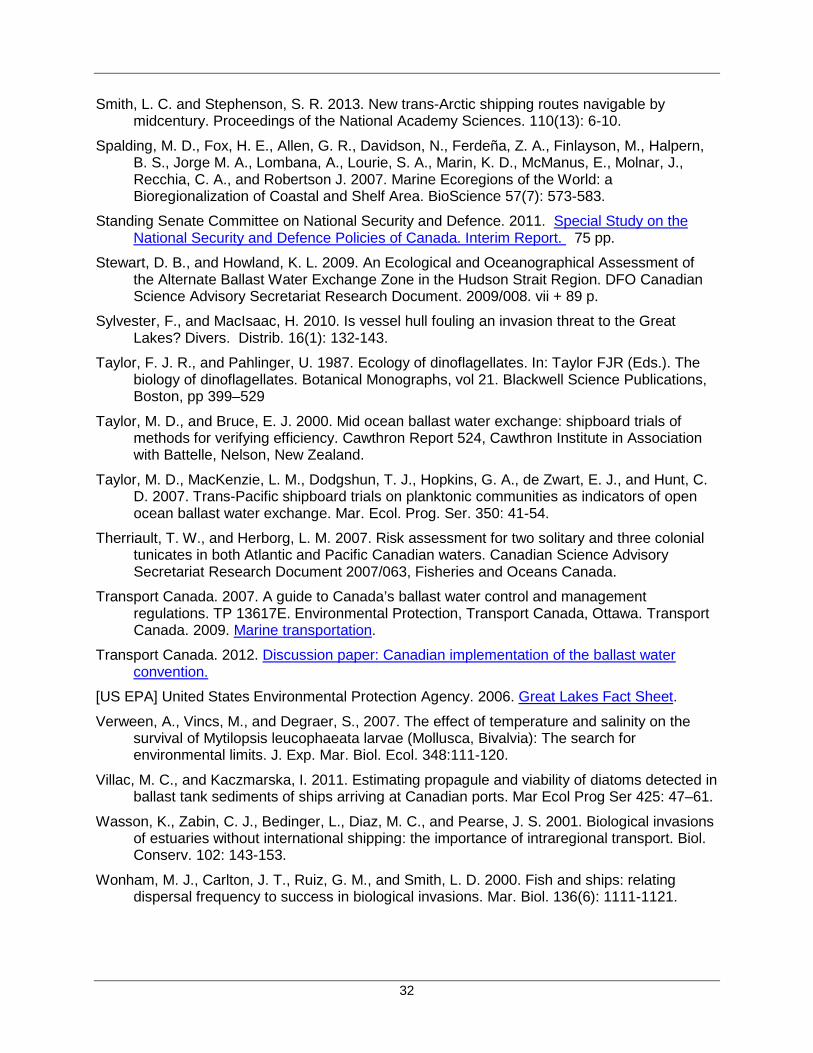
32
Smith, L. C. and Stephenson, S. R. 2013. New trans-Arctic shipping routes navigable by midcentury. Proceedings of the National Academy Sciences. 110(13): 6-10.
Spalding, M. D., Fox, H. E., Allen, G. R., Davidson, N., Ferdeña, Z. A., Finlayson, M., Halpern, B. S., Jorge M. A., Lombana, A., Lourie, S. A., Marin, K. D., McManus, E., Molnar, J., Recchia, C. A., and Robertson J. 2007. Marine Ecoregions of the World: a Bioregionalization of Coastal and Shelf Area. BioScience 57(7): 573-583.
Standing Senate Committee on National Security and Defence. 2011. Special Study on the National Security and Defence Policies of Canada. Interim Report. 75 pp.
Stewart, D. B., and Howland, K. L. 2009. An Ecological and Oceanographical Assessment of the Alternate Ballast Water Exchange Zone in the Hudson Strait Region. DFO Canadian Science Advisory Secretariat Research Document. 2009/008. vii + 89 p.
Sylvester, F., and MacIsaac, H. 2010. Is vessel hull fouling an invasion threat to the Great Lakes? Divers. Distrib. 16(1): 132-143.
Taylor, F. J. R., and Pahlinger, U. 1987. Ecology of dinoflagellates. In: Taylor FJR (Eds.). The biology of dinoflagellates. Botanical Monographs, vol 21. Blackwell Science Publications, Boston, pp 399–529
Taylor, M. D., and Bruce, E. J. 2000. Mid ocean ballast water exchange: shipboard trials of methods for verifying efficiency. Cawthron Report 524, Cawthron Institute in Association with Battelle, Nelson, New Zealand.
Taylor, M. D., MacKenzie, L. M., Dodgshun, T. J., Hopkins, G. A., de Zwart, E. J., and Hunt, C. D. 2007. Trans-Pacific shipboard trials on planktonic communities as indicators of open ocean ballast water exchange. Mar. Ecol. Prog. Ser. 350: 41-54.
Therriault, T. W., and Herborg, L. M. 2007. Risk assessment for two solitary and three colonial tunicates in both Atlantic and Pacific Canadian waters. Canadian Science Advisory Secretariat Research Document 2007/063, Fisheries and Oceans Canada.
Transport Canada. 2007. A guide to Canada’s ballast water control and management regulations. TP 13617E. Environmental Protection, Transport Canada, Ottawa. Transport Canada. 2009. Marine transportation.
Transport Canada. 2012. Discussion paper: Canadian implementation of the ballast water convention.
[US EPA] United States Environmental Protection Agency. 2006. Great Lakes Fact Sheet.
Verween, A., Vincs, M., and Degraer, S., 2007. The effect of temperature and salinity on the survival of Mytilopsis leucophaeata larvae (Mollusca, Bivalvia): The search for environmental limits. J. Exp. Mar. Biol. Ecol. 348:111-120.
Villac, M. C., and Kaczmarska, I. 2011. Estimating propagule and viability of diatoms detected in ballast tank sediments of ships arriving at Canadian ports. Mar Ecol Prog Ser 425: 47–61.
Wasson, K., Zabin, C. J., Bedinger, L., Diaz, M. C., and Pearse, J. S. 2001. Biological invasions of estuaries without international shipping: the importance of intraregional transport. Biol. Conserv. 102: 143-153.
Wonham, M. J., Carlton, J. T., Ruiz, G. M., and Smith, L. D. 2000. Fish and ships: relating dispersal frequency to success in biological invasions. Mar. Biol. 136(6): 1111-1121.
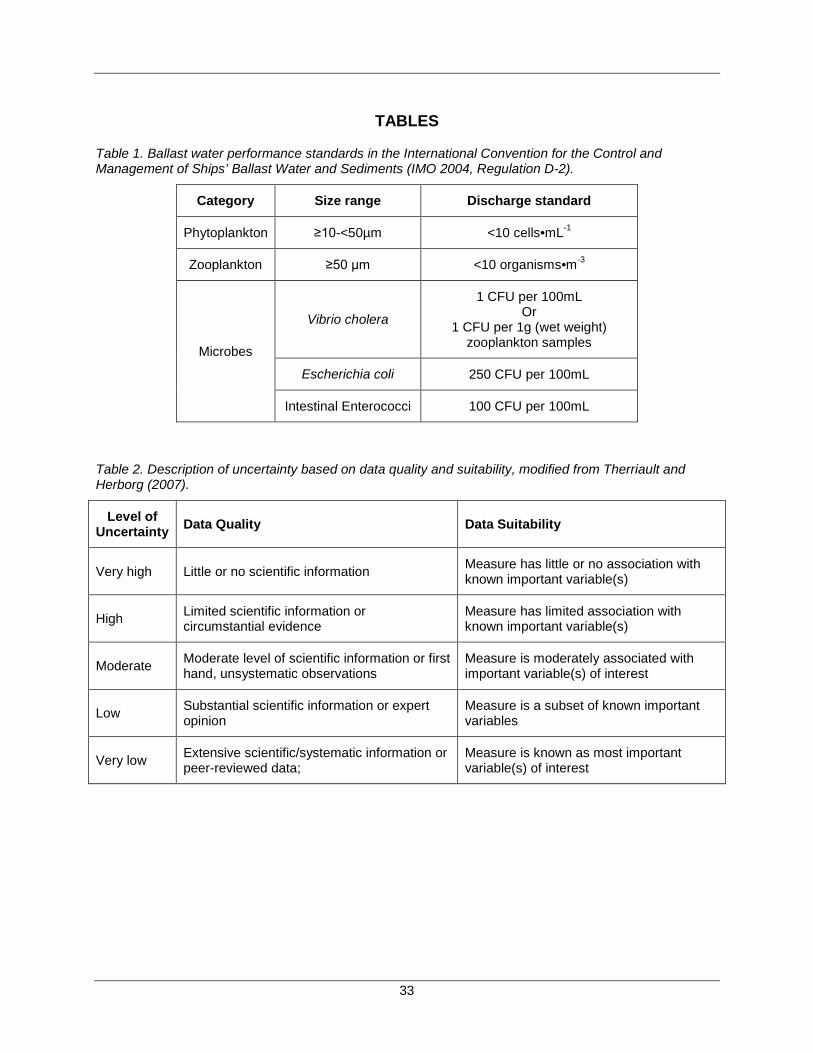
33
TABLES
Table 1. Ballast water performance standards in the International Convention for the Control and Management of Ships’ Ballast Water and Sediments (IMO 2004, Regulation D-2).
Category Size range Discharge standard
Phytoplankton ≥10-<50µm <10 cells•mL-1
Zooplankton ≥50 µm <10 organisms•m-3
Microbes
Vibrio cholera
1 CFU per 100mL Or
1 CFU per 1g (wet weight) zooplankton samples
Escherichia coli 250 CFU per 100mL
Intestinal Enterococci 100 CFU per 100mL
Table 2. Description of uncertainty based on data quality and suitability, modified from Therriault and Herborg (2007).
Level of Uncertainty Data Quality Data Suitability
Very high Little or no scientific information Measure has little or no association with known important variable(s)
High Limited scientific information or circumstantial evidence
Measure has limited association with known important variable(s)
Moderate Moderate level of scientific information or first hand, unsystematic observations
Measure is moderately associated with important variable(s) of interest
Low Substantial scientific information or expert opinion
Measure is a subset of known important variables
Very low Extensive scientific/systematic information or peer-reviewed data;
Measure is known as most important variable(s) of interest
34
Table 3. List of shipping pathways, with annual number of discharge events and year of observation.
Pathway Volume of Ballast Water Discharged (m3)
Number of Discharge Events Year
Arctic Coastal Domestic 78,125 16 2006
Arctic International Transoceanic 197,589 30 2007
Eastern Coastal Domestic 5,952,615 667 2006
GLSLR International Transoceanic 2,914,206 759 2006
Lakers 52,418,330 5227 2006
Atlantic International Coastal U.S. 7,665,502 343 2006
Atlantic International Exempt 5,652,994 357 2006
Atlantic International Transoceanic 23,253,391 1530 2006
Pacific International Coastal U.S. 2,324,543 415 2008
Pacific International Exempt 592,089 79 2008
Pacific International Transoceanic 15,110,203 1488 2008
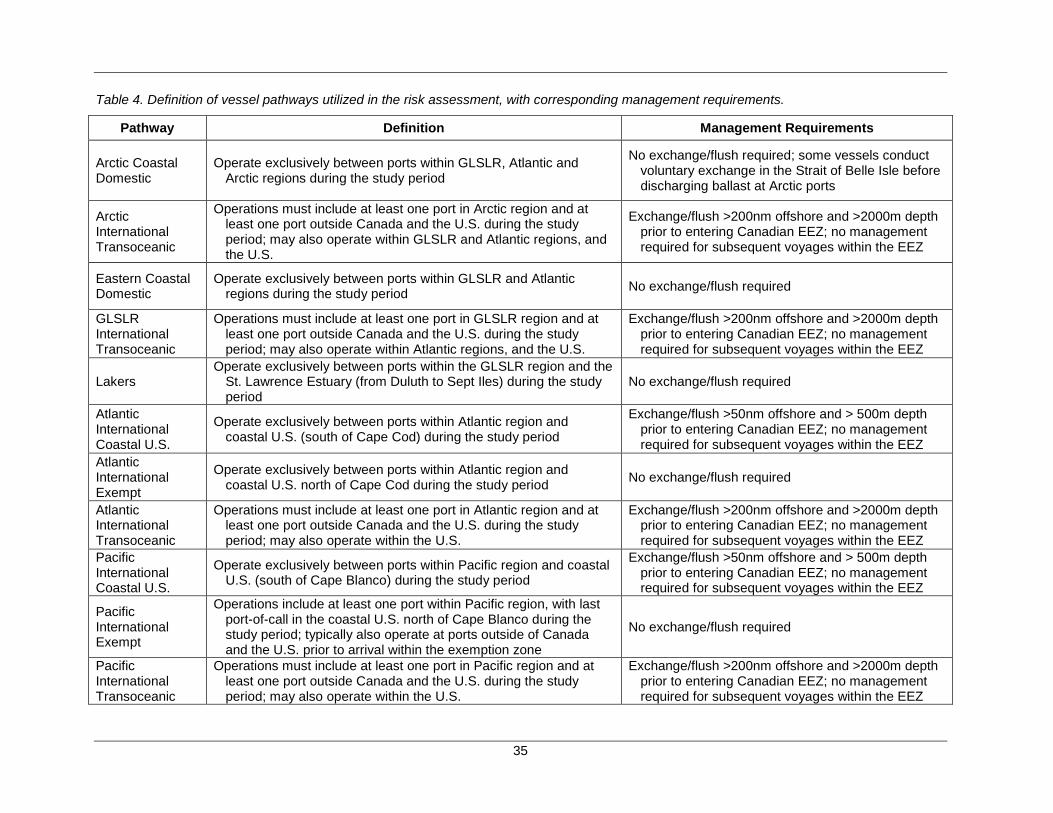
35
Table 4. Definition of vessel pathways utilized in the risk assessment, with corresponding management requirements.
Pathway Definition Management Requirements
Arctic Coastal Domestic
Operate exclusively between ports within GLSLR, Atlantic and Arctic regions during the study period
No exchange/flush required; some vessels conduct voluntary exchange in the Strait of Belle Isle before discharging ballast at Arctic ports
Arctic International Transoceanic
Operations must include at least one port in Arctic region and at least one port outside Canada and the U.S. during the study period; may also operate within GLSLR and Atlantic regions, and the U.S.
Exchange/flush >200nm offshore and >2000m depth prior to entering Canadian EEZ; no management required for subsequent voyages within the EEZ
Eastern Coastal Domestic
Operate exclusively between ports within GLSLR and Atlantic regions during the study period No exchange/flush required
GLSLR International Transoceanic
Operations must include at least one port in GLSLR region and at least one port outside Canada and the U.S. during the study period; may also operate within Atlantic regions, and the U.S.
Exchange/flush >200nm offshore and >2000m depth prior to entering Canadian EEZ; no management required for subsequent voyages within the EEZ
Lakers Operate exclusively between ports within the GLSLR region and the
St. Lawrence Estuary (from Duluth to Sept Iles) during the study period
No exchange/flush required
Atlantic International Coastal U.S.
Operate exclusively between ports within Atlantic region and coastal U.S. (south of Cape Cod) during the study period
Exchange/flush >50nm offshore and > 500m depth prior to entering Canadian EEZ; no management required for subsequent voyages within the EEZ
Atlantic International Exempt
Operate exclusively between ports within Atlantic region and coastal U.S. north of Cape Cod during the study period No exchange/flush required
Atlantic International Transoceanic
Operations must include at least one port in Atlantic region and at least one port outside Canada and the U.S. during the study period; may also operate within the U.S.
Exchange/flush >200nm offshore and >2000m depth prior to entering Canadian EEZ; no management required for subsequent voyages within the EEZ
Pacific International Coastal U.S.
Operate exclusively between ports within Pacific region and coastal U.S. (south of Cape Blanco) during the study period
Exchange/flush >50nm offshore and > 500m depth prior to entering Canadian EEZ; no management required for subsequent voyages within the EEZ
Pacific International Exempt
Operations include at least one port within Pacific region, with last port-of-call in the coastal U.S. north of Cape Blanco during the study period; typically also operate at ports outside of Canada and the U.S. prior to arrival within the exemption zone
No exchange/flush required
Pacific International Transoceanic
Operations must include at least one port in Pacific region and at least one port outside Canada and the U.S. during the study period; may also operate within the U.S.
Exchange/flush >200nm offshore and >2000m depth prior to entering Canadian EEZ; no management required for subsequent voyages within the EEZ
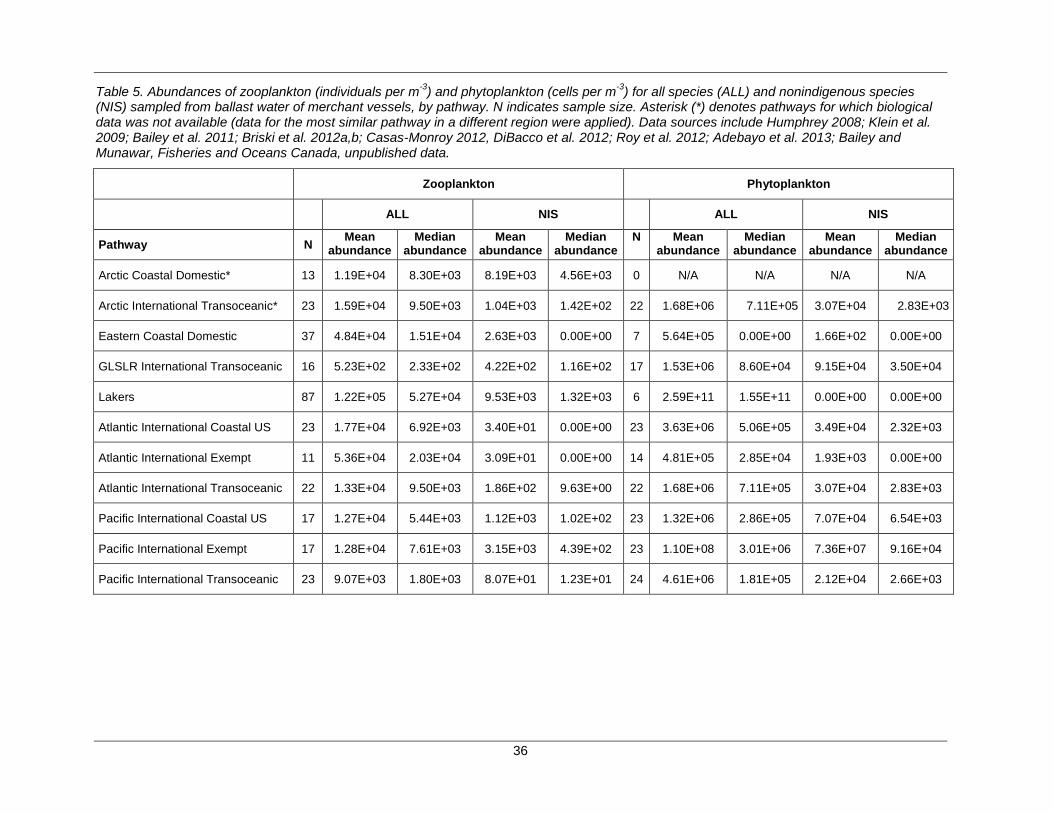
36
Table 5. Abundances of zooplankton (individuals per m-3) and phytoplankton (cells per m-3) for all species (ALL) and nonindigenous species (NIS) sampled from ballast water of merchant vessels, by pathway. N indicates sample size. Asterisk (*) denotes pathways for which biological data was not available (data for the most similar pathway in a different region were applied). Data sources include Humphrey 2008; Klein et al. 2009; Bailey et al. 2011; Briski et al. 2012a,b; Casas-Monroy 2012, DiBacco et al. 2012; Roy et al. 2012; Adebayo et al. 2013; Bailey and Munawar, Fisheries and Oceans Canada, unpublished data.
Zooplankton Phytoplankton
ALL NIS ALL NIS
Pathway N Mean abundance
Median abundance
Mean abundance
Median abundance
N Mean abundance
Median abundance
Mean abundance
Median abundance
Arctic Coastal Domestic* 13 1.19E+04 8.30E+03 8.19E+03 4.56E+03 0 N/A N/A N/A N/A
Arctic International Transoceanic* 23 1.59E+04 9.50E+03 1.04E+03 1.42E+02 22 1.68E+06 7.11E+05 3.07E+04 2.83E+03
Eastern Coastal Domestic 37 4.84E+04 1.51E+04 2.63E+03 0.00E+00 7 5.64E+05 0.00E+00 1.66E+02 0.00E+00
GLSLR International Transoceanic 16 5.23E+02 2.33E+02 4.22E+02 1.16E+02 17 1.53E+06 8.60E+04 9.15E+04 3.50E+04
Lakers 87 1.22E+05 5.27E+04 9.53E+03 1.32E+03 6 2.59E+11 1.55E+11 0.00E+00 0.00E+00
Atlantic International Coastal US 23 1.77E+04 6.92E+03 3.40E+01 0.00E+00 23 3.63E+06 5.06E+05 3.49E+04 2.32E+03
Atlantic International Exempt 11 5.36E+04 2.03E+04 3.09E+01 0.00E+00 14 4.81E+05 2.85E+04 1.93E+03 0.00E+00
Atlantic International Transoceanic 22 1.33E+04 9.50E+03 1.86E+02 9.63E+00 22 1.68E+06 7.11E+05 3.07E+04 2.83E+03
Pacific International Coastal US 17 1.27E+04 5.44E+03 1.12E+03 1.02E+02 23 1.32E+06 2.86E+05 7.07E+04 6.54E+03
Pacific International Exempt 17 1.28E+04 7.61E+03 3.15E+03 4.39E+02 23 1.10E+08 3.01E+06 7.36E+07 9.16E+04
Pacific International Transoceanic 23 9.07E+03 1.80E+03 8.07E+01 1.23E+01 24 4.61E+06 1.81E+05 2.12E+04 2.66E+03
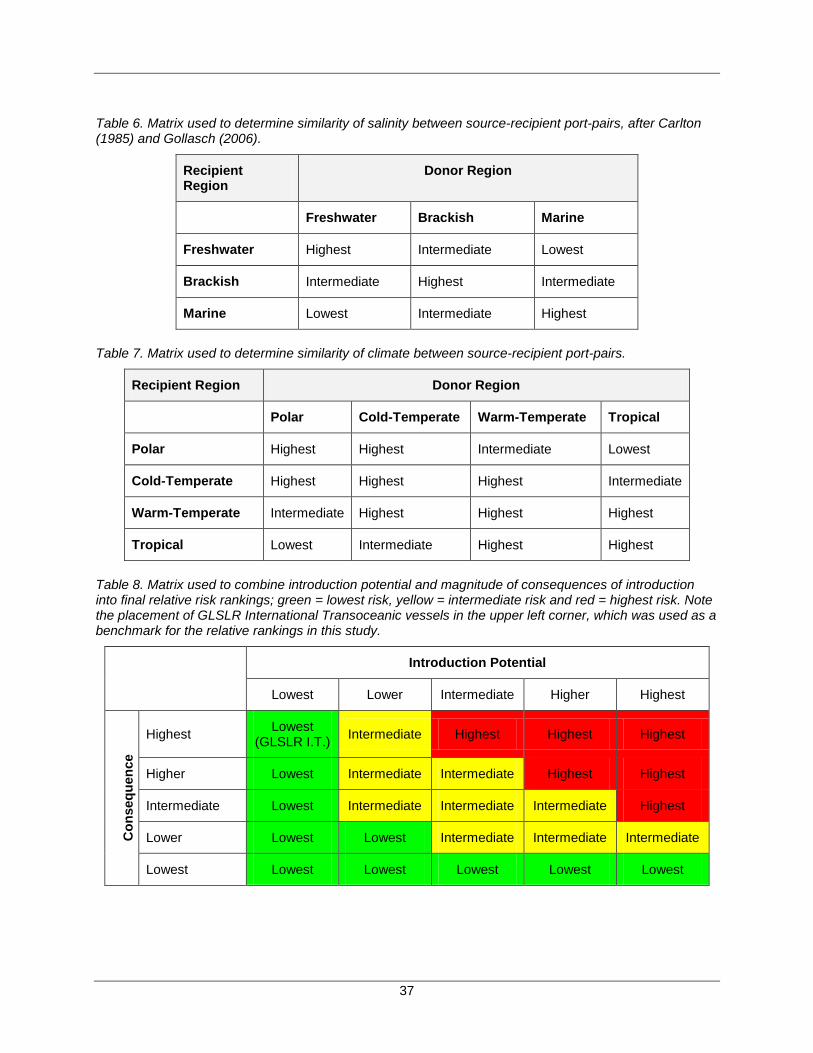
37
Table 6. Matrix used to determine similarity of salinity between source-recipient port-pairs, after Carlton (1985) and Gollasch (2006).
Recipient Region
Donor Region
Freshwater Brackish Marine
Freshwater Highest Intermediate Lowest
Brackish Intermediate Highest Intermediate
Marine Lowest Intermediate Highest
Table 7. Matrix used to determine similarity of climate between source-recipient port-pairs.
Recipient Region Donor Region
Polar Cold-Temperate Warm-Temperate Tropical
Polar Highest Highest Intermediate Lowest
Cold-Temperate Highest Highest Highest Intermediate
Warm-Temperate Intermediate Highest Highest Highest
Tropical Lowest Intermediate Highest Highest
Table 8. Matrix used to combine introduction potential and magnitude of consequences of introduction into final relative risk rankings; green = lowest risk, yellow = intermediate risk and red = highest risk. Note the placement of GLSLR International Transoceanic vessels in the upper left corner, which was used as a benchmark for the relative rankings in this study.
Introduction Potential
Lowest Lower Intermediate Higher Highest
Con
sequ
ence
Highest Lowest (GLSLR I.T.) Intermediate Highest Highest Highest
Higher Lowest Intermediate Intermediate Highest Highest
Intermediate Lowest Intermediate Intermediate Intermediate Highest
Lower Lowest Lowest Intermediate Intermediate Intermediate
Lowest Lowest Lowest Lowest Lowest Lowest
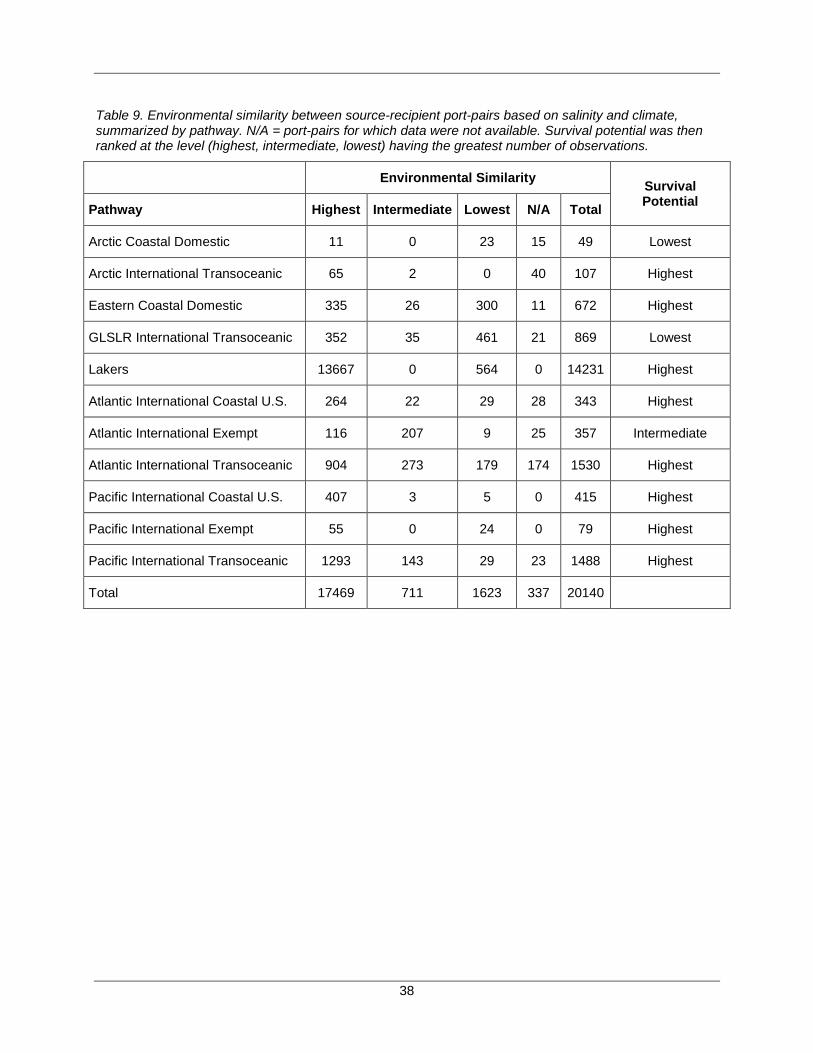
38
Table 9. Environmental similarity between source-recipient port-pairs based on salinity and climate, summarized by pathway. N/A = port-pairs for which data were not available. Survival potential was then ranked at the level (highest, intermediate, lowest) having the greatest number of observations.
Environmental Similarity Survival Potential Pathway Highest Intermediate Lowest N/A Total
Arctic Coastal Domestic 11 0 23 15 49 Lowest
Arctic International Transoceanic 65 2 0 40 107 Highest
Eastern Coastal Domestic 335 26 300 11 672 Highest
GLSLR International Transoceanic 352 35 461 21 869 Lowest
Lakers 13667 0 564 0 14231 Highest
Atlantic International Coastal U.S. 264 22 29 28 343 Highest
Atlantic International Exempt 116 207 9 25 357 Intermediate
Atlantic International Transoceanic 904 273 179 174 1530 Highest
Pacific International Coastal U.S. 407 3 5 0 415 Highest
Pacific International Exempt 55 0 24 0 79 Highest
Pacific International Transoceanic 1293 143 29 23 1488 Highest
Total 17469 711 1623 337 20140
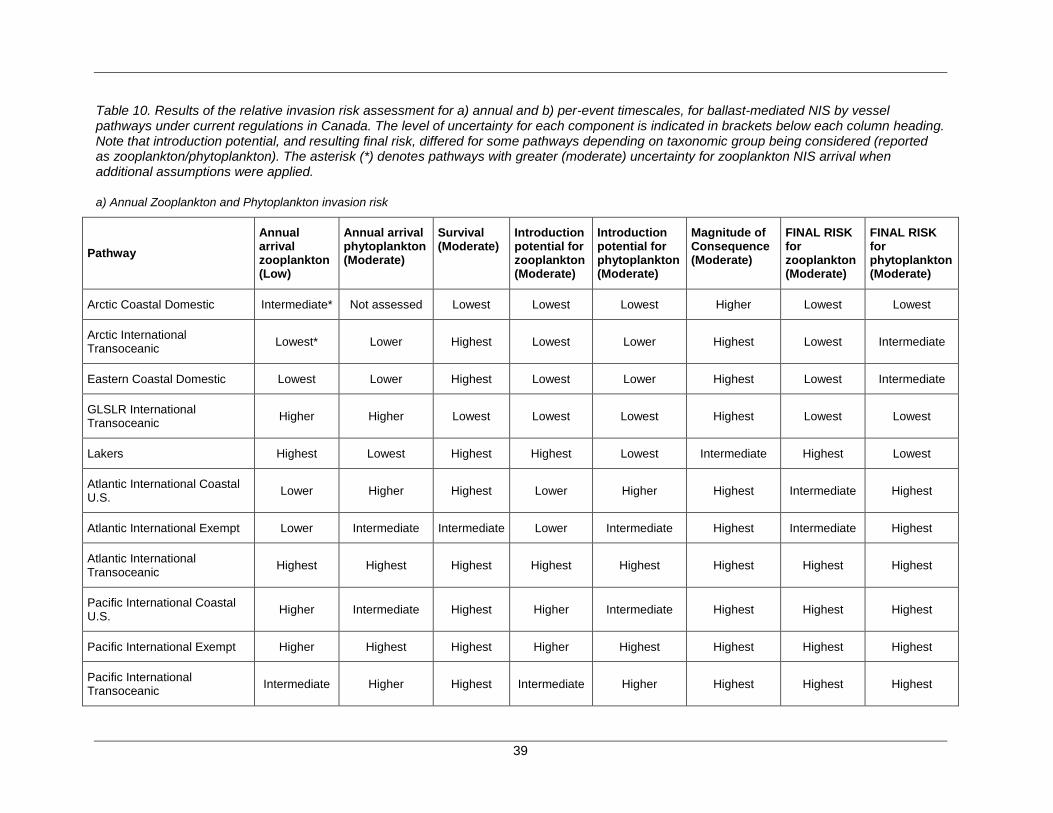
39
Table 10. Results of the relative invasion risk assessment for a) annual and b) per-event timescales, for ballast-mediated NIS by vessel pathways under current regulations in Canada. The level of uncertainty for each component is indicated in brackets below each column heading. Note that introduction potential, and resulting final risk, differed for some pathways depending on taxonomic group being considered (reported as zooplankton/phytoplankton). The asterisk (*) denotes pathways with greater (moderate) uncertainty for zooplankton NIS arrival when additional assumptions were applied.
a) Annual Zooplankton and Phytoplankton invasion risk
Pathway Annual arrival zooplankton (Low)
Annual arrival phytoplankton (Moderate)
Survival (Moderate)
Introduction potential for zooplankton (Moderate)
Introduction potential for phytoplankton (Moderate)
Magnitude of Consequence (Moderate)
FINAL RISK for zooplankton (Moderate)
FINAL RISK for phytoplankton (Moderate)
Arctic Coastal Domestic Intermediate* Not assessed Lowest Lowest Lowest Higher Lowest Lowest
Arctic International Transoceanic Lowest* Lower Highest Lowest Lower Highest Lowest Intermediate
Eastern Coastal Domestic Lowest Lower Highest Lowest Lower Highest Lowest Intermediate
GLSLR International Transoceanic Higher Higher Lowest Lowest Lowest Highest Lowest Lowest
Lakers Highest Lowest Highest Highest Lowest Intermediate Highest Lowest
Atlantic International Coastal U.S. Lower Higher Highest Lower Higher Highest Intermediate Highest
Atlantic International Exempt Lower Intermediate Intermediate Lower Intermediate Highest Intermediate Highest
Atlantic International Transoceanic Highest Highest Highest Highest Highest Highest Highest Highest
Pacific International Coastal U.S. Higher Intermediate Highest Higher Intermediate Highest Highest Highest
Pacific International Exempt Higher Highest Highest Higher Highest Highest Highest Highest
Pacific International Transoceanic Intermediate Higher Highest Intermediate Higher Highest Highest Highest
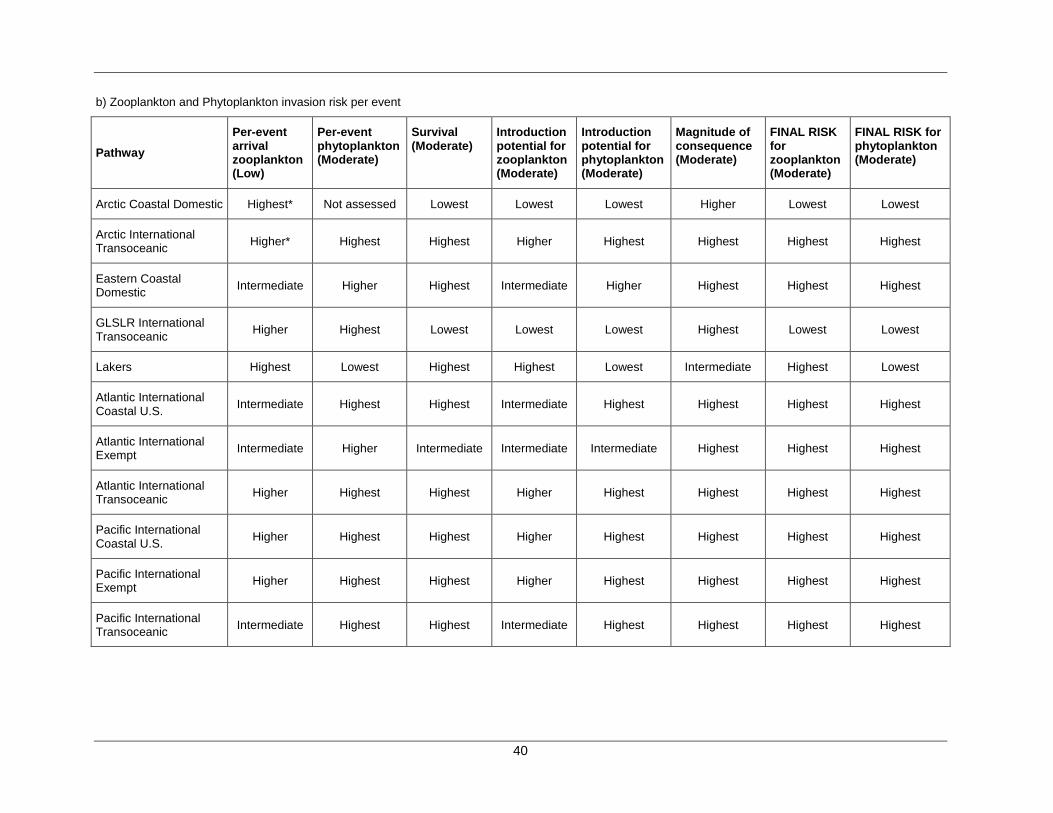
40
b) Zooplankton and Phytoplankton invasion risk per event
Pathway Per-event arrival zooplankton (Low)
Per-event phytoplankton (Moderate)
Survival (Moderate)
Introduction potential for zooplankton (Moderate)
Introduction potential for phytoplankton (Moderate)
Magnitude of consequence (Moderate)
FINAL RISK for zooplankton (Moderate)
FINAL RISK for phytoplankton (Moderate)
Arctic Coastal Domestic Highest* Not assessed Lowest Lowest Lowest Higher Lowest Lowest
Arctic International Transoceanic Higher* Highest Highest Higher Highest Highest Highest Highest
Eastern Coastal Domestic Intermediate Higher Highest Intermediate Higher Highest Highest Highest
GLSLR International Transoceanic Higher Highest Lowest Lowest Lowest Highest Lowest Lowest
Lakers Highest Lowest Highest Highest Lowest Intermediate Highest Lowest
Atlantic International Coastal U.S. Intermediate Highest Highest Intermediate Highest Highest Highest Highest
Atlantic International Exempt Intermediate Higher Intermediate Intermediate Intermediate Highest Highest Highest
Atlantic International Transoceanic Higher Highest Highest Higher Highest Highest Highest Highest
Pacific International Coastal U.S. Higher Highest Highest Higher Highest Highest Highest Highest
Pacific International Exempt Higher Highest Highest Higher Highest Highest Highest Highest
Pacific International Transoceanic Intermediate Highest Highest Intermediate Highest Highest Highest Highest
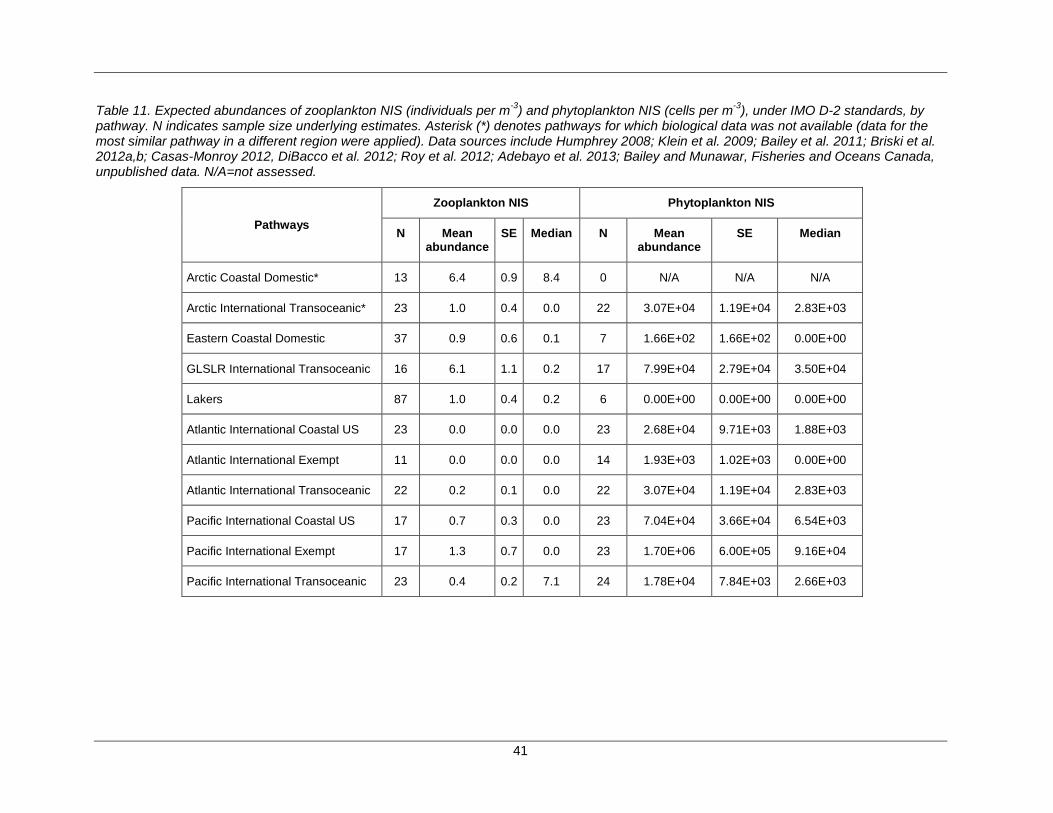
41
Table 11. Expected abundances of zooplankton NIS (individuals per m-3) and phytoplankton NIS (cells per m-3), under IMO D-2 standards, by pathway. N indicates sample size underlying estimates. Asterisk (*) denotes pathways for which biological data was not available (data for the most similar pathway in a different region were applied). Data sources include Humphrey 2008; Klein et al. 2009; Bailey et al. 2011; Briski et al. 2012a,b; Casas-Monroy 2012, DiBacco et al. 2012; Roy et al. 2012; Adebayo et al. 2013; Bailey and Munawar, Fisheries and Oceans Canada, unpublished data. N/A=not assessed.
Pathways
Zooplankton NIS Phytoplankton NIS
N Mean abundance
SE Median N Mean abundance
SE Median
Arctic Coastal Domestic* 13 6.4 0.9 8.4 0 N/A N/A N/A
Arctic International Transoceanic* 23 1.0 0.4 0.0 22 3.07E+04 1.19E+04 2.83E+03
Eastern Coastal Domestic 37 0.9 0.6 0.1 7 1.66E+02 1.66E+02 0.00E+00
GLSLR International Transoceanic 16 6.1 1.1 0.2 17 7.99E+04 2.79E+04 3.50E+04
Lakers 87 1.0 0.4 0.2 6 0.00E+00 0.00E+00 0.00E+00
Atlantic International Coastal US 23 0.0 0.0 0.0 23 2.68E+04 9.71E+03 1.88E+03
Atlantic International Exempt 11 0.0 0.0 0.0 14 1.93E+03 1.02E+03 0.00E+00
Atlantic International Transoceanic 22 0.2 0.1 0.0 22 3.07E+04 1.19E+04 2.83E+03
Pacific International Coastal US 17 0.7 0.3 0.0 23 7.04E+04 3.66E+04 6.54E+03
Pacific International Exempt 17 1.3 0.7 0.0 23 1.70E+06 6.00E+05 9.16E+04
Pacific International Transoceanic 23 0.4 0.2 7.1 24 1.78E+04 7.84E+03 2.66E+03
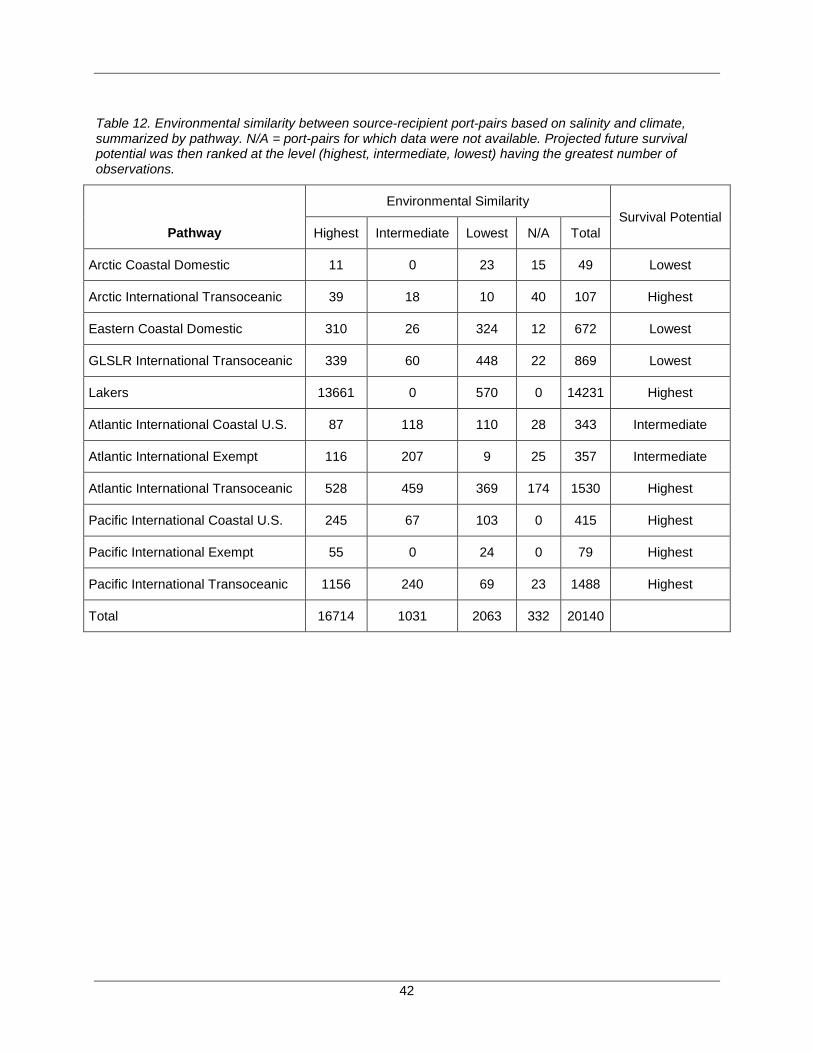
42
Table 12. Environmental similarity between source-recipient port-pairs based on salinity and climate, summarized by pathway. N/A = port-pairs for which data were not available. Projected future survival potential was then ranked at the level (highest, intermediate, lowest) having the greatest number of observations.
Pathway
Environmental Similarity Survival Potential
Highest Intermediate Lowest N/A Total
Arctic Coastal Domestic 11 0 23 15 49 Lowest
Arctic International Transoceanic 39 18 10 40 107 Highest
Eastern Coastal Domestic 310 26 324 12 672 Lowest
GLSLR International Transoceanic 339 60 448 22 869 Lowest
Lakers 13661 0 570 0 14231 Highest
Atlantic International Coastal U.S. 87 118 110 28 343 Intermediate
Atlantic International Exempt 116 207 9 25 357 Intermediate
Atlantic International Transoceanic 528 459 369 174 1530 Highest
Pacific International Coastal U.S. 245 67 103 0 415 Highest
Pacific International Exempt 55 0 24 0 79 Highest
Pacific International Transoceanic 1156 240 69 23 1488 Highest
Total 16714 1031 2063 332 20140
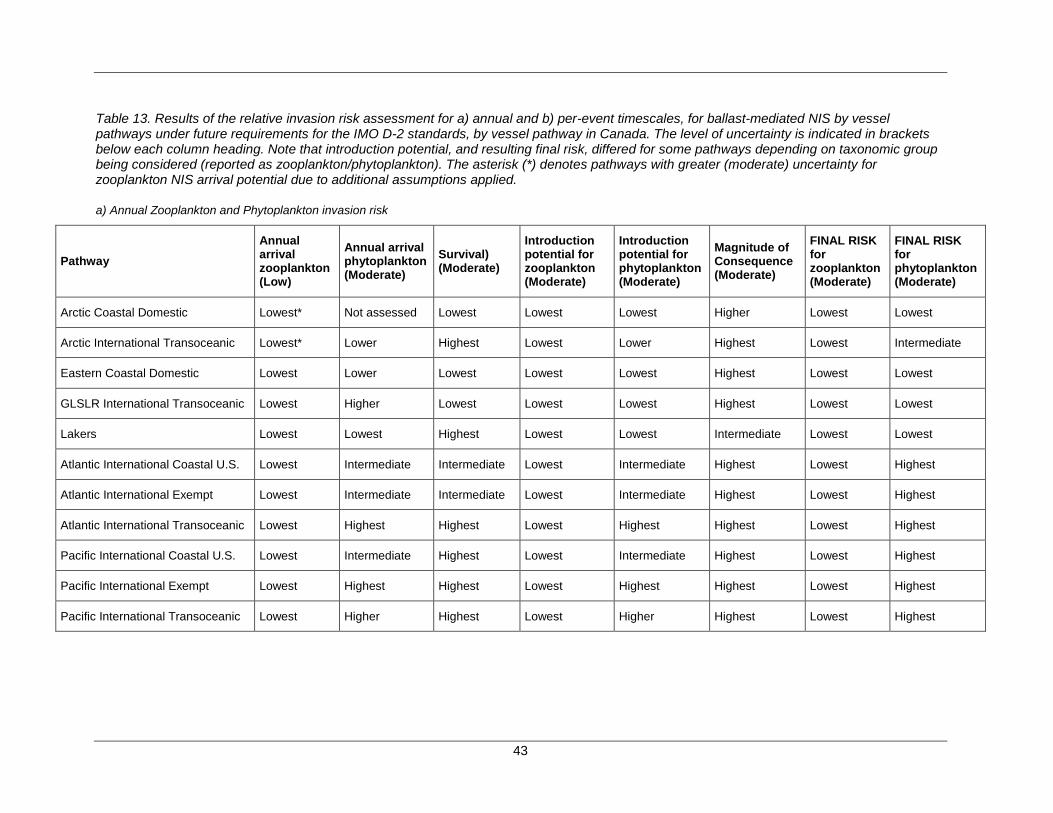
43
Table 13. Results of the relative invasion risk assessment for a) annual and b) per-event timescales, for ballast-mediated NIS by vessel pathways under future requirements for the IMO D-2 standards, by vessel pathway in Canada. The level of uncertainty is indicated in brackets below each column heading. Note that introduction potential, and resulting final risk, differed for some pathways depending on taxonomic group being considered (reported as zooplankton/phytoplankton). The asterisk (*) denotes pathways with greater (moderate) uncertainty for zooplankton NIS arrival potential due to additional assumptions applied.
a) Annual Zooplankton and Phytoplankton invasion risk
Pathway Annual arrival zooplankton (Low)
Annual arrival phytoplankton (Moderate)
Survival) (Moderate)
Introduction potential for zooplankton (Moderate)
Introduction potential for phytoplankton (Moderate)
Magnitude of Consequence (Moderate)
FINAL RISK for zooplankton (Moderate)
FINAL RISK for phytoplankton (Moderate)
Arctic Coastal Domestic Lowest* Not assessed Lowest Lowest Lowest Higher Lowest Lowest
Arctic International Transoceanic Lowest* Lower Highest Lowest Lower Highest Lowest Intermediate
Eastern Coastal Domestic Lowest Lower Lowest Lowest Lowest Highest Lowest Lowest
GLSLR International Transoceanic Lowest Higher Lowest Lowest Lowest Highest Lowest Lowest
Lakers Lowest Lowest Highest Lowest Lowest Intermediate Lowest Lowest
Atlantic International Coastal U.S. Lowest Intermediate Intermediate Lowest Intermediate Highest Lowest Highest
Atlantic International Exempt Lowest Intermediate Intermediate Lowest Intermediate Highest Lowest Highest
Atlantic International Transoceanic Lowest Highest Highest Lowest Highest Highest Lowest Highest
Pacific International Coastal U.S. Lowest Intermediate Highest Lowest Intermediate Highest Lowest Highest
Pacific International Exempt Lowest Highest Highest Lowest Highest Highest Lowest Highest
Pacific International Transoceanic Lowest Higher Highest Lowest Higher Highest Lowest Highest
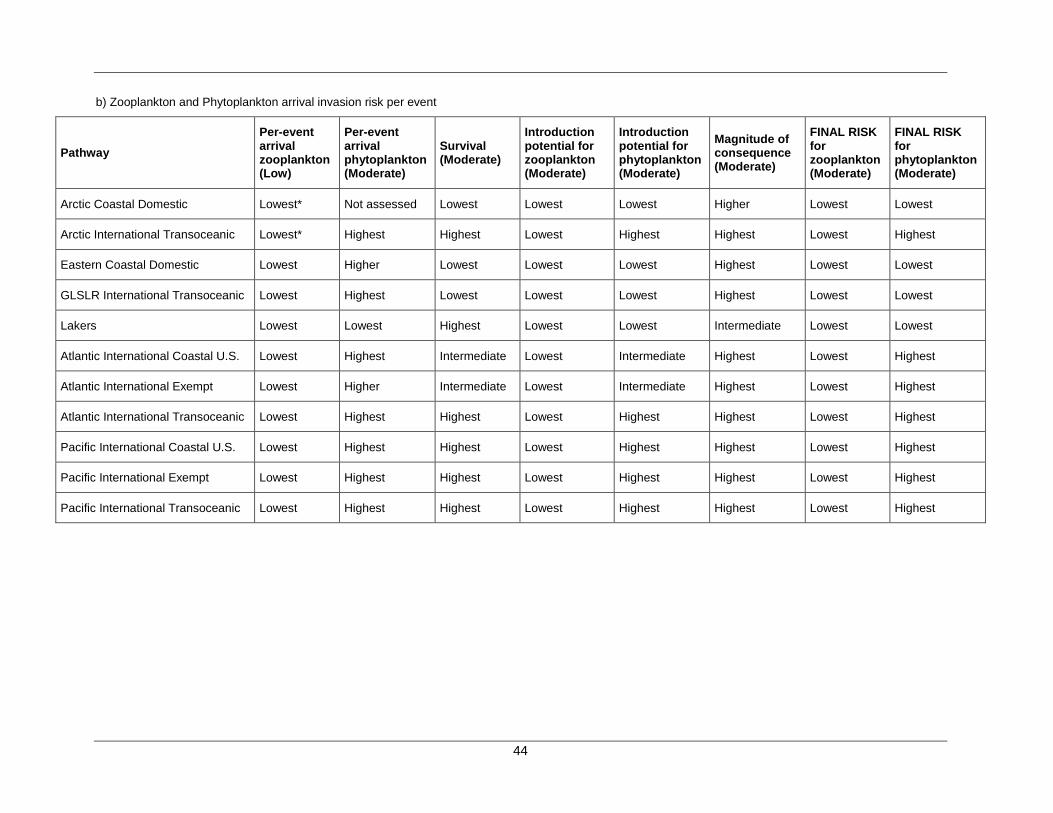
44
b) Zooplankton and Phytoplankton arrival invasion risk per event
Pathway Per-event arrival zooplankton (Low)
Per-event arrival phytoplankton (Moderate)
Survival (Moderate)
Introduction potential for zooplankton (Moderate)
Introduction potential for phytoplankton (Moderate)
Magnitude of consequence (Moderate)
FINAL RISK for zooplankton (Moderate)
FINAL RISK for phytoplankton (Moderate)
Arctic Coastal Domestic Lowest* Not assessed Lowest Lowest Lowest Higher Lowest Lowest
Arctic International Transoceanic Lowest* Highest Highest Lowest Highest Highest Lowest Highest
Eastern Coastal Domestic Lowest Higher Lowest Lowest Lowest Highest Lowest Lowest
GLSLR International Transoceanic Lowest Highest Lowest Lowest Lowest Highest Lowest Lowest
Lakers Lowest Lowest Highest Lowest Lowest Intermediate Lowest Lowest
Atlantic International Coastal U.S. Lowest Highest Intermediate Lowest Intermediate Highest Lowest Highest
Atlantic International Exempt Lowest Higher Intermediate Lowest Intermediate Highest Lowest Highest
Atlantic International Transoceanic Lowest Highest Highest Lowest Highest Highest Lowest Highest
Pacific International Coastal U.S. Lowest Highest Highest Lowest Highest Highest Lowest Highest
Pacific International Exempt Lowest Highest Highest Lowest Highest Highest Lowest Highest
Pacific International Transoceanic Lowest Highest Highest Lowest Highest Highest Lowest Highest
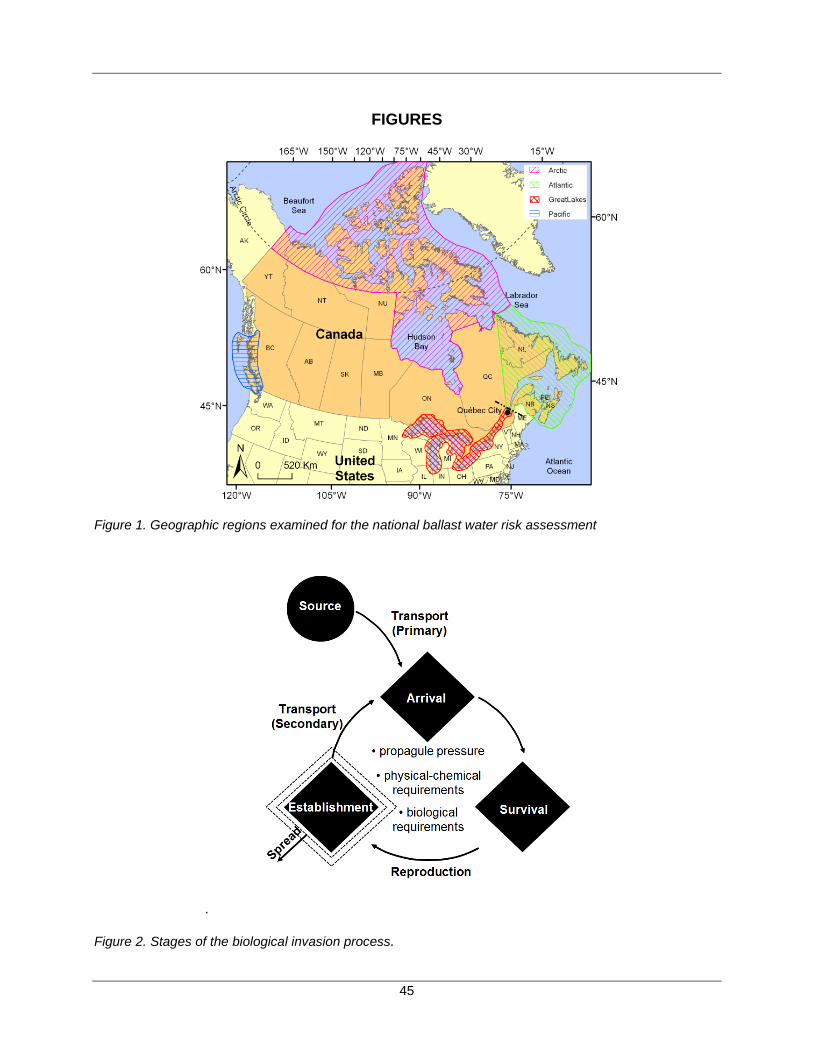
45
FIGURES
Figure 1. Geographic regions examined for the national ballast water risk assessment
.
Figure 2. Stages of the biological invasion process.
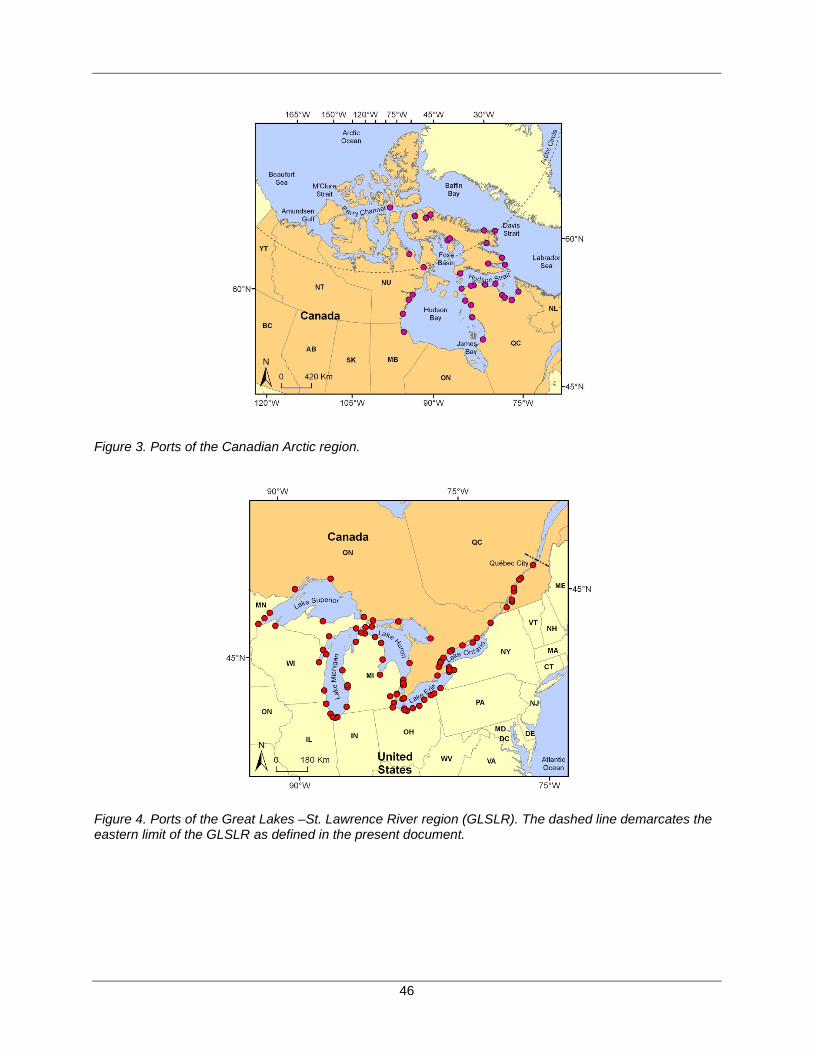
46
Figure 3. Ports of the Canadian Arctic region.
Figure 4. Ports of the Great Lakes –St. Lawrence River region (GLSLR). The dashed line demarcates the eastern limit of the GLSLR as defined in the present document.
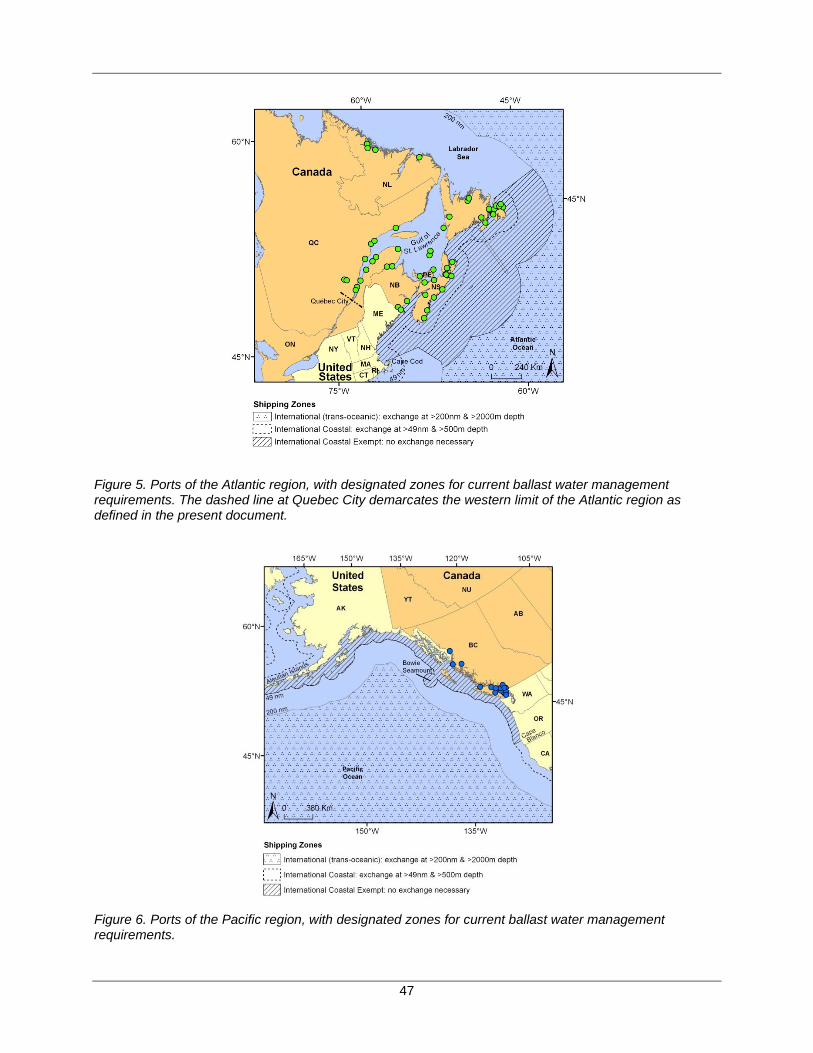
47
Figure 5. Ports of the Atlantic region, with designated zones for current ballast water management requirements. The dashed line at Quebec City demarcates the western limit of the Atlantic region as defined in the present document.
Figure 6. Ports of the Pacific region, with designated zones for current ballast water management requirements.
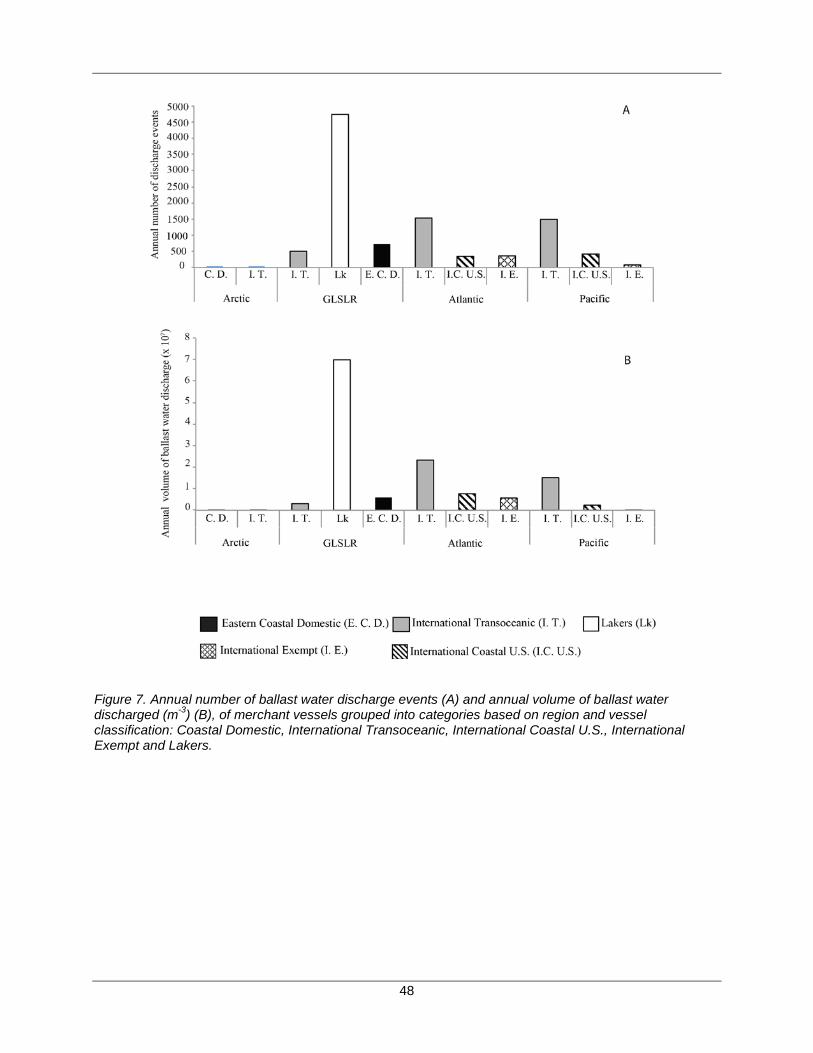
48
Figure 7. Annual number of ballast water discharge events (A) and annual volume of ballast water discharged (m-3) (B), of merchant vessels grouped into categories based on region and vessel classification: Coastal Domestic, International Transoceanic, International Coastal U.S., International Exempt and Lakers.
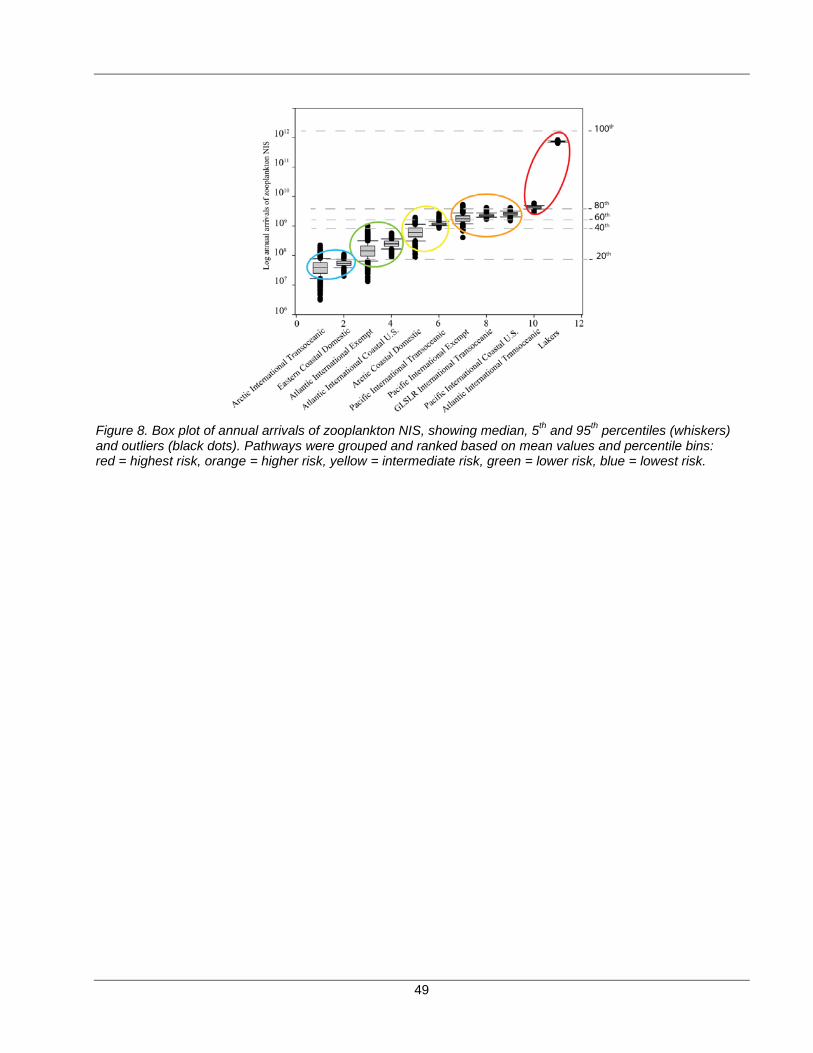
49
Figure 8. Box plot of annual arrivals of zooplankton NIS, showing median, 5th and 95th percentiles (whiskers) and outliers (black dots). Pathways were grouped and ranked based on mean values and percentile bins: red = highest risk, orange = higher risk, yellow = intermediate risk, green = lower risk, blue = lowest risk.
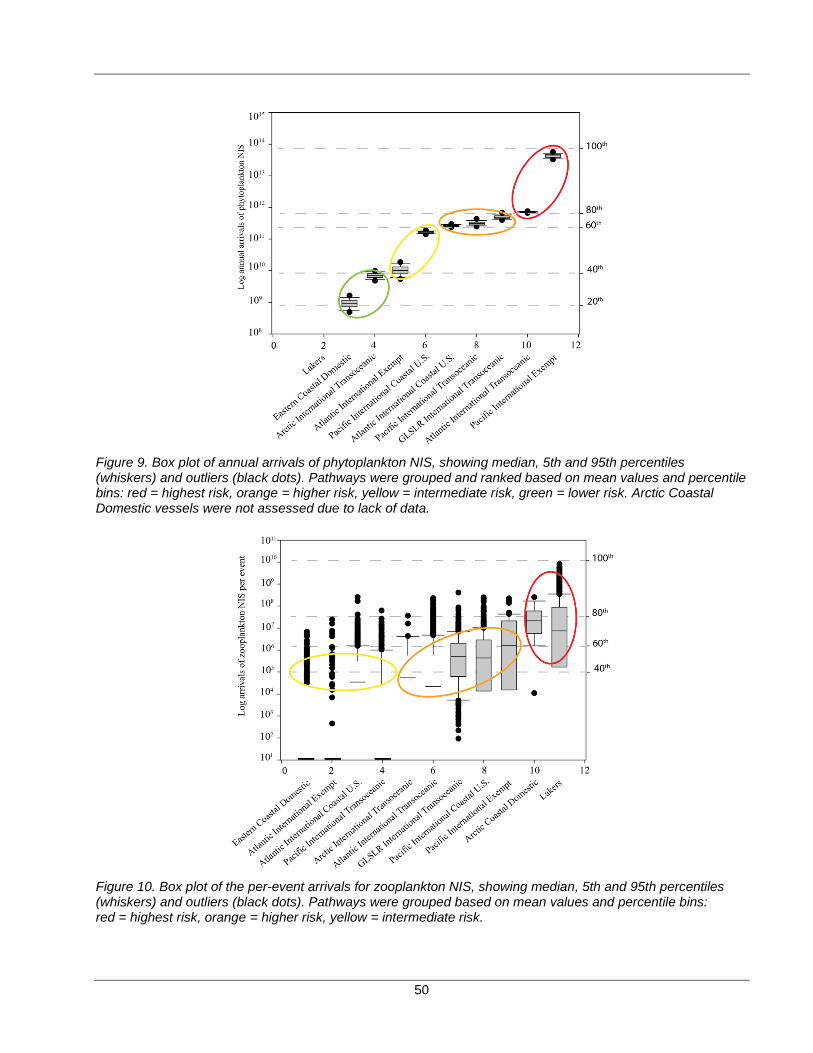
50
Figure 9. Box plot of annual arrivals of phytoplankton NIS, showing median, 5th and 95th percentiles (whiskers) and outliers (black dots). Pathways were grouped and ranked based on mean values and percentile bins: red = highest risk, orange = higher risk, yellow = intermediate risk, green = lower risk. Arctic Coastal Domestic vessels were not assessed due to lack of data.
Figure 10. Box plot of the per-event arrivals for zooplankton NIS, showing median, 5th and 95th percentiles (whiskers) and outliers (black dots). Pathways were grouped based on mean values and percentile bins: red = highest risk, orange = higher risk, yellow = intermediate risk.
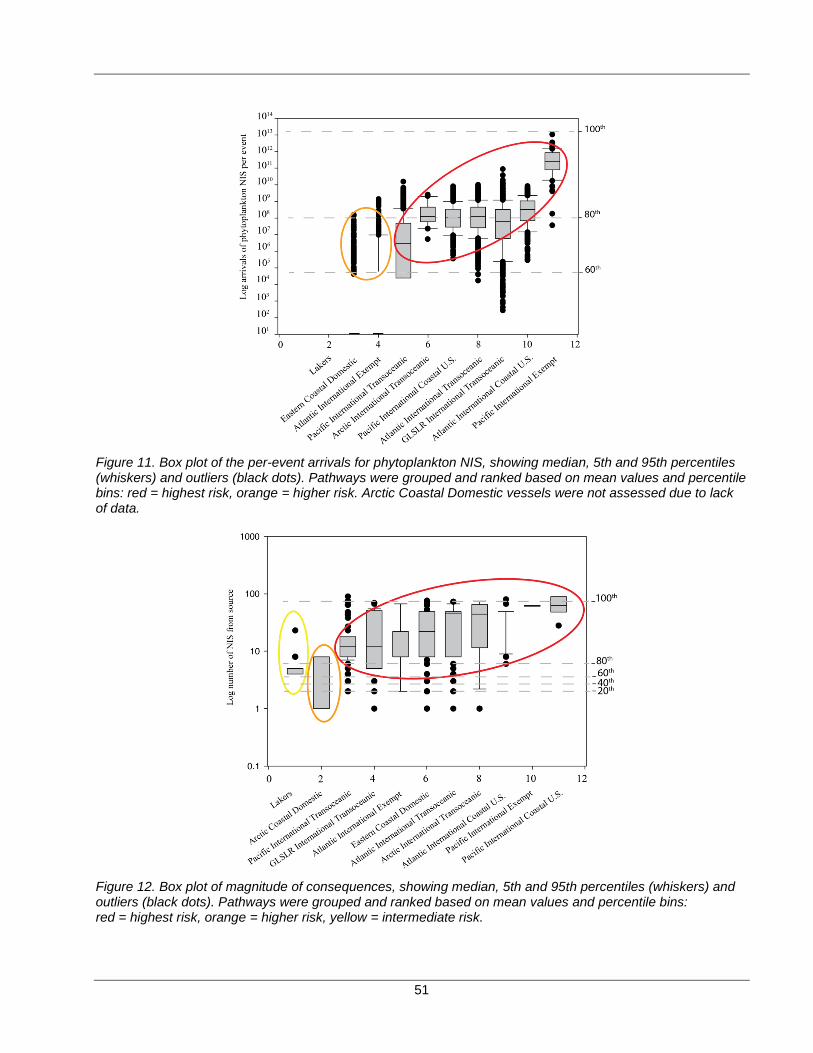
51
Figure 11. Box plot of the per-event arrivals for phytoplankton NIS, showing median, 5th and 95th percentiles (whiskers) and outliers (black dots). Pathways were grouped and ranked based on mean values and percentile bins: red = highest risk, orange = higher risk. Arctic Coastal Domestic vessels were not assessed due to lack of data.
Figure 12. Box plot of magnitude of consequences, showing median, 5th and 95th percentiles (whiskers) and outliers (black dots). Pathways were grouped and ranked based on mean values and percentile bins: red = highest risk, orange = higher risk, yellow = intermediate risk.
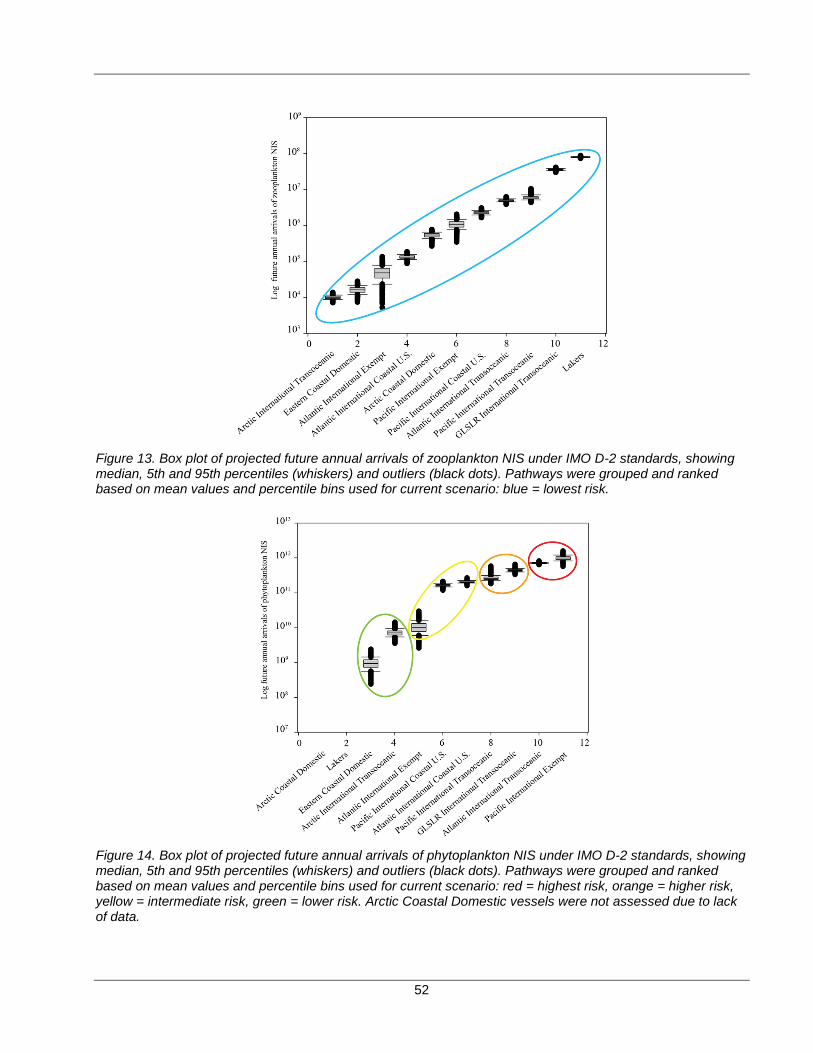
52
Figure 13. Box plot of projected future annual arrivals of zooplankton NIS under IMO D-2 standards, showing median, 5th and 95th percentiles (whiskers) and outliers (black dots). Pathways were grouped and ranked based on mean values and percentile bins used for current scenario: blue = lowest risk.
Figure 14. Box plot of projected future annual arrivals of phytoplankton NIS under IMO D-2 standards, showing median, 5th and 95th percentiles (whiskers) and outliers (black dots). Pathways were grouped and ranked based on mean values and percentile bins used for current scenario: red = highest risk, orange = higher risk, yellow = intermediate risk, green = lower risk. Arctic Coastal Domestic vessels were not assessed due to lack of data.
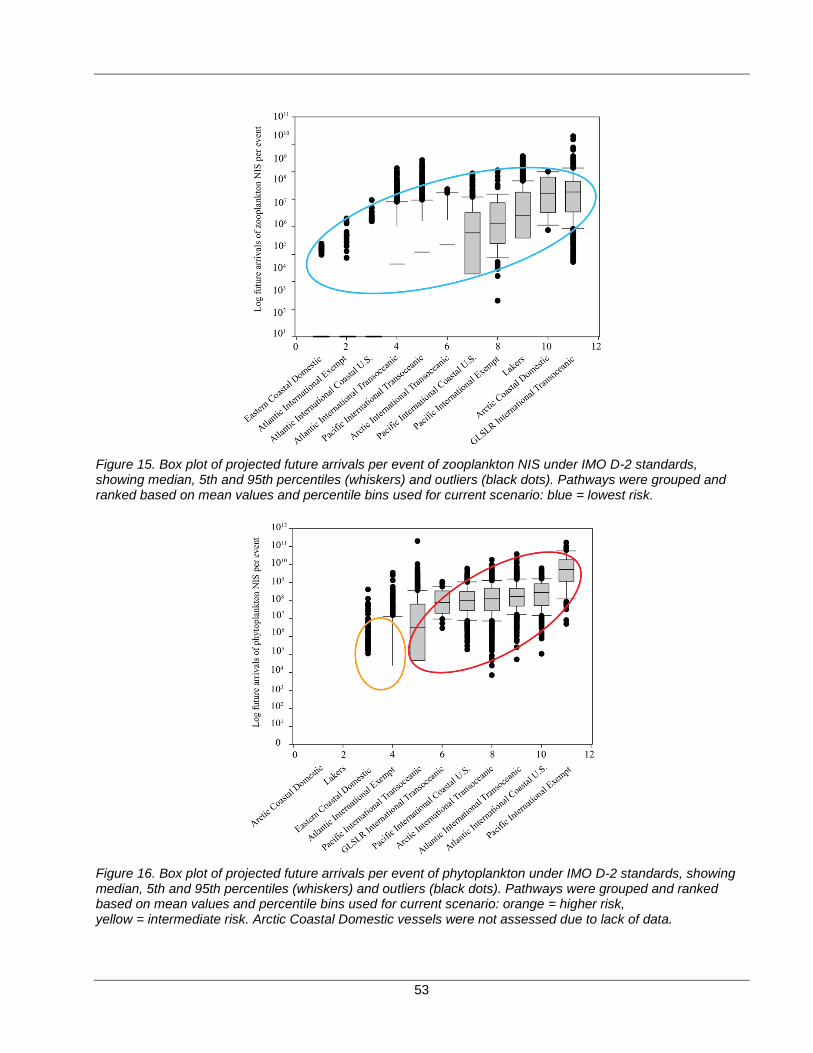
53
Figure 15. Box plot of projected future arrivals per event of zooplankton NIS under IMO D-2 standards, showing median, 5th and 95th percentiles (whiskers) and outliers (black dots). Pathways were grouped and ranked based on mean values and percentile bins used for current scenario: blue = lowest risk.
Figure 16. Box plot of projected future arrivals per event of phytoplankton under IMO D-2 standards, showing median, 5th and 95th percentiles (whiskers) and outliers (black dots). Pathways were grouped and ranked based on mean values and percentile bins used for current scenario: orange = higher risk, yellow = intermediate risk. Arctic Coastal Domestic vessels were not assessed due to lack of data.
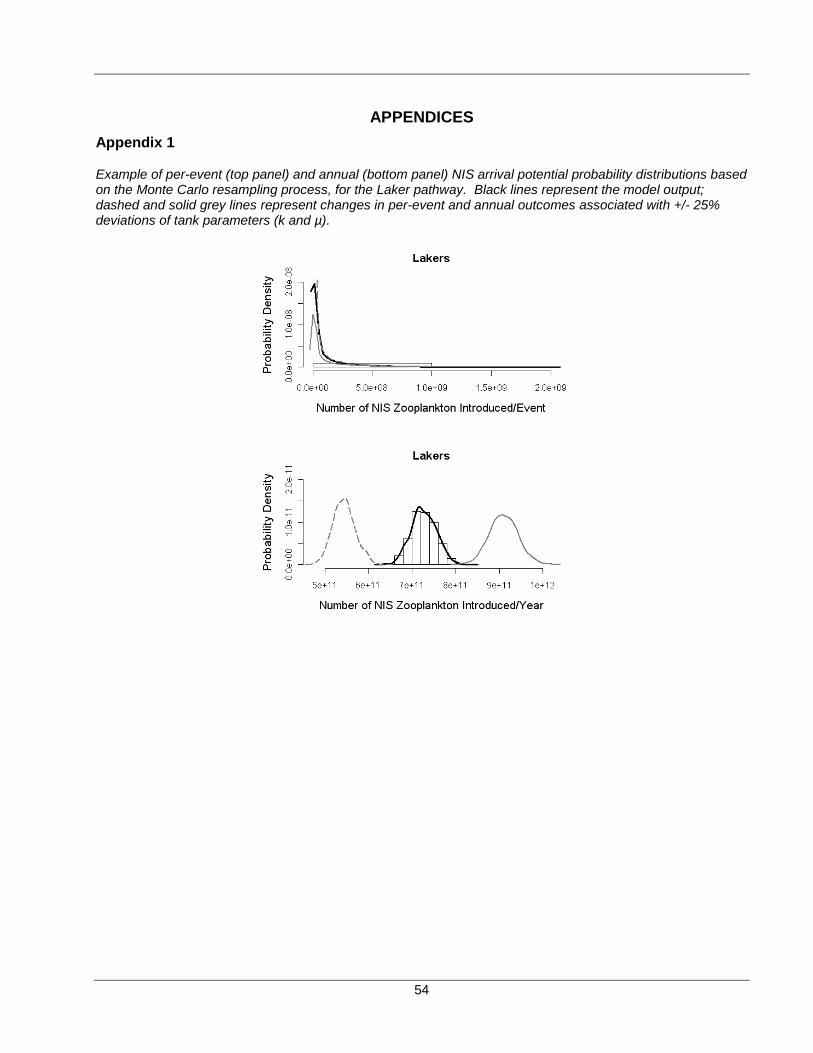
54
APPENDICES Appendix 1
Example of per-event (top panel) and annual (bottom panel) NIS arrival potential probability distributions based on the Monte Carlo resampling process, for the Laker pathway. Black lines represent the model output; dashed and solid grey lines represent changes in per-event and annual outcomes associated with +/- 25% deviations of tank parameters (k and µ).
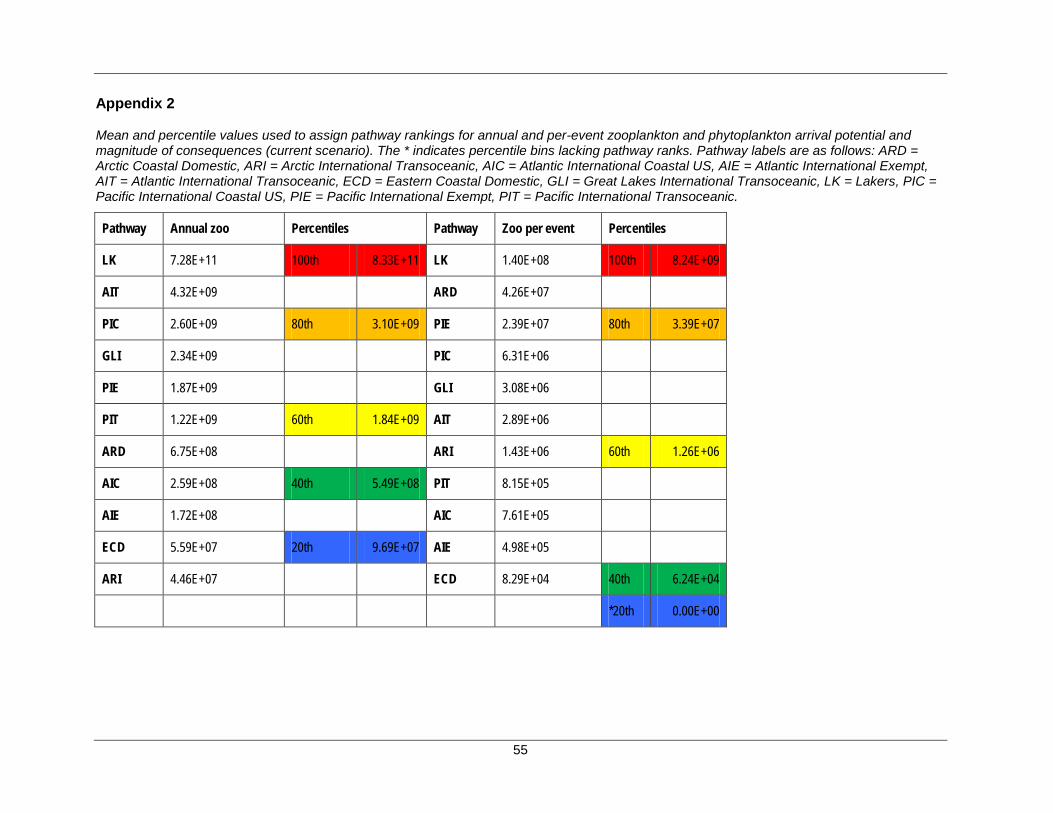
55
Appendix 2
Mean and percentile values used to assign pathway rankings for annual and per-event zooplankton and phytoplankton arrival potential and magnitude of consequences (current scenario). The * indicates percentile bins lacking pathway ranks. Pathway labels are as follows: ARD = Arctic Coastal Domestic, ARI = Arctic International Transoceanic, AIC = Atlantic International Coastal US, AIE = Atlantic International Exempt, AIT = Atlantic International Transoceanic, ECD = Eastern Coastal Domestic, GLI = Great Lakes International Transoceanic, LK = Lakers, PIC = Pacific International Coastal US, PIE = Pacific International Exempt, PIT = Pacific International Transoceanic.
Pathway Annual zoo Percentiles Pathway Zoo per event Percentiles
LK 7.28E+11 100th 8.33E+11 LK 1.40E+08 100th 8.24E+09
AIT 4.32E+09
ARD 4.26E+07
PIC 2.60E+09 80th 3.10E+09 PIE 2.39E+07 80th 3.39E+07
GLI 2.34E+09
PIC 6.31E+06
PIE 1.87E+09
GLI 3.08E+06
PIT 1.22E+09 60th 1.84E+09 AIT 2.89E+06
ARD 6.75E+08
ARI 1.43E+06 60th 1.26E+06
AIC 2.59E+08 40th 5.49E+08 PIT 8.15E+05
AIE 1.72E+08
AIC 7.61E+05
ECD 5.59E+07 20th 9.69E+07 AIE 4.98E+05
ARI 4.46E+07
ECD 8.29E+04 40th 6.24E+04
*20th 0.00E+00
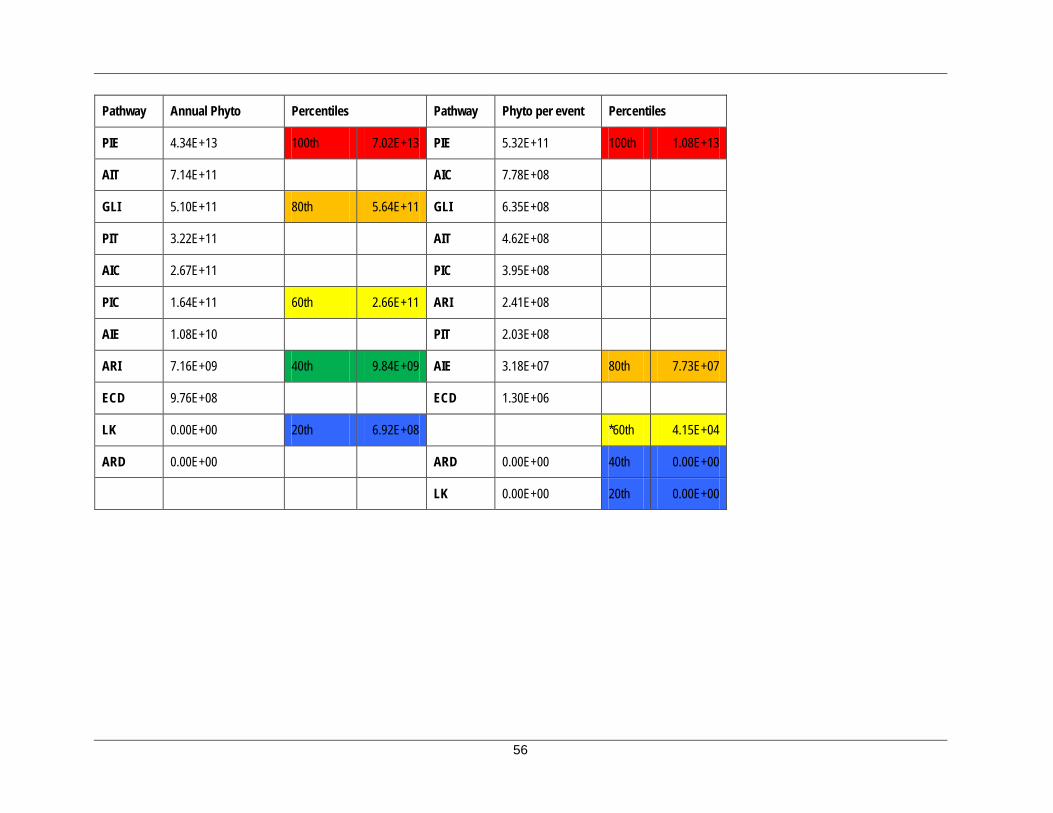
56
Pathway Annual Phyto Percentiles Pathway Phyto per event Percentiles
PIE 4.34E+13 100th 7.02E+13 PIE 5.32E+11 100th 1.08E+13
AIT 7.14E+11
AIC 7.78E+08
GLI 5.10E+11 80th 5.64E+11 GLI 6.35E+08
PIT 3.22E+11
AIT 4.62E+08
AIC 2.67E+11
PIC 3.95E+08
PIC 1.64E+11 60th 2.66E+11 ARI 2.41E+08
AIE 1.08E+10
PIT 2.03E+08
ARI 7.16E+09 40th 9.84E+09 AIE 3.18E+07 80th 7.73E+07
ECD 9.76E+08
ECD 1.30E+06
LK 0.00E+00 20th 6.92E+08
*60th 4.15E+04
ARD 0.00E+00
ARD 0.00E+00 40th 0.00E+00
LK 0.00E+00 20th 0.00E+00
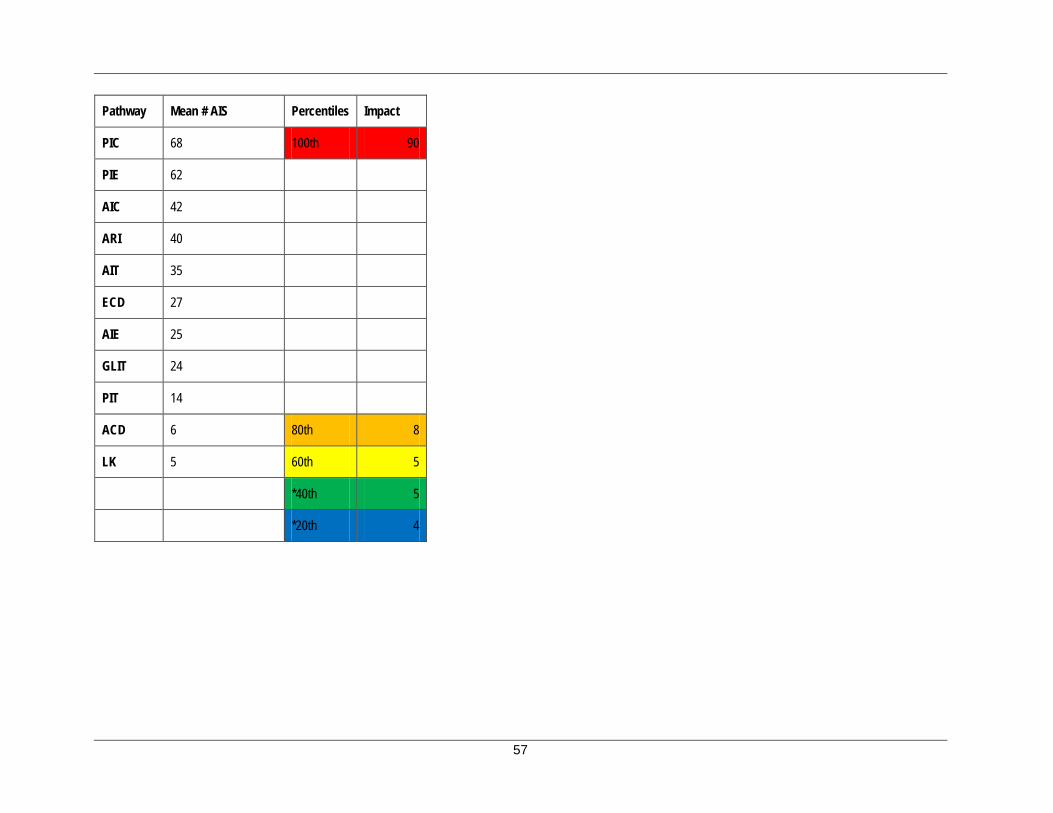
57
Pathway Mean # AIS Percentiles Impact
PIC 68 100th 90
PIE 62
AIC 42
ARI 40
AIT 35
ECD 27
AIE 25
GLIT 24
PIT 14
ACD 6 80th 8
LK 5 60th 5
*40th 5
*20th 4
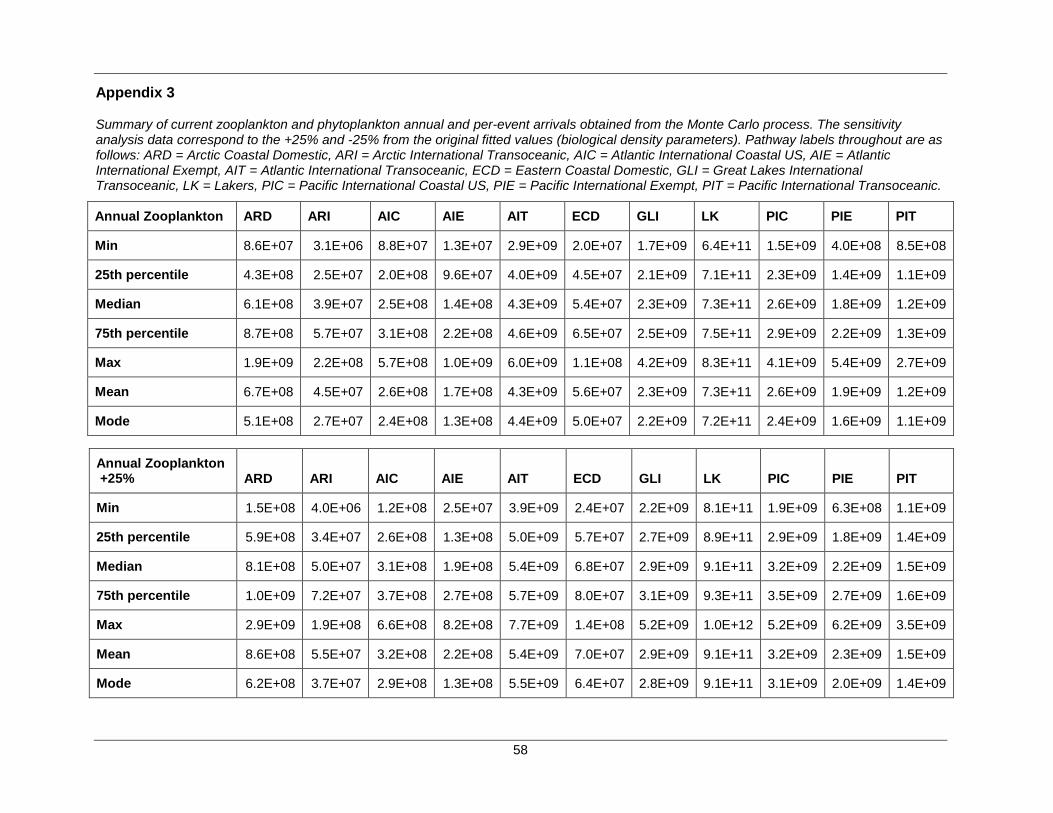
58
Appendix 3
Summary of current zooplankton and phytoplankton annual and per-event arrivals obtained from the Monte Carlo process. The sensitivity analysis data correspond to the +25% and -25% from the original fitted values (biological density parameters). Pathway labels throughout are as follows: ARD = Arctic Coastal Domestic, ARI = Arctic International Transoceanic, AIC = Atlantic International Coastal US, AIE = Atlantic International Exempt, AIT = Atlantic International Transoceanic, ECD = Eastern Coastal Domestic, GLI = Great Lakes International Transoceanic, LK = Lakers, PIC = Pacific International Coastal US, PIE = Pacific International Exempt, PIT = Pacific International Transoceanic.
Annual Zooplankton ARD ARI AIC AIE AIT ECD GLI LK PIC PIE PIT
Min 8.6E+07 3.1E+06 8.8E+07 1.3E+07 2.9E+09 2.0E+07 1.7E+09 6.4E+11 1.5E+09 4.0E+08 8.5E+08
25th percentile 4.3E+08 2.5E+07 2.0E+08 9.6E+07 4.0E+09 4.5E+07 2.1E+09 7.1E+11 2.3E+09 1.4E+09 1.1E+09
Median 6.1E+08 3.9E+07 2.5E+08 1.4E+08 4.3E+09 5.4E+07 2.3E+09 7.3E+11 2.6E+09 1.8E+09 1.2E+09
75th percentile 8.7E+08 5.7E+07 3.1E+08 2.2E+08 4.6E+09 6.5E+07 2.5E+09 7.5E+11 2.9E+09 2.2E+09 1.3E+09
Max 1.9E+09 2.2E+08 5.7E+08 1.0E+09 6.0E+09 1.1E+08 4.2E+09 8.3E+11 4.1E+09 5.4E+09 2.7E+09
Mean 6.7E+08 4.5E+07 2.6E+08 1.7E+08 4.3E+09 5.6E+07 2.3E+09 7.3E+11 2.6E+09 1.9E+09 1.2E+09
Mode 5.1E+08 2.7E+07 2.4E+08 1.3E+08 4.4E+09 5.0E+07 2.2E+09 7.2E+11 2.4E+09 1.6E+09 1.1E+09
Annual Zooplankton +25% ARD ARI AIC AIE AIT ECD GLI LK PIC PIE PIT
Min 1.5E+08 4.0E+06 1.2E+08 2.5E+07 3.9E+09 2.4E+07 2.2E+09 8.1E+11 1.9E+09 6.3E+08 1.1E+09
25th percentile 5.9E+08 3.4E+07 2.6E+08 1.3E+08 5.0E+09 5.7E+07 2.7E+09 8.9E+11 2.9E+09 1.8E+09 1.4E+09
Median 8.1E+08 5.0E+07 3.1E+08 1.9E+08 5.4E+09 6.8E+07 2.9E+09 9.1E+11 3.2E+09 2.2E+09 1.5E+09
75th percentile 1.0E+09 7.2E+07 3.7E+08 2.7E+08 5.7E+09 8.0E+07 3.1E+09 9.3E+11 3.5E+09 2.7E+09 1.6E+09
Max 2.9E+09 1.9E+08 6.6E+08 8.2E+08 7.7E+09 1.4E+08 5.2E+09 1.0E+12 5.2E+09 6.2E+09 3.5E+09
Mean 8.6E+08 5.5E+07 3.2E+08 2.2E+08 5.4E+09 7.0E+07 2.9E+09 9.1E+11 3.2E+09 2.3E+09 1.5E+09
Mode 6.2E+08 3.7E+07 2.9E+08 1.3E+08 5.5E+09 6.4E+07 2.8E+09 9.1E+11 3.1E+09 2.0E+09 1.4E+09
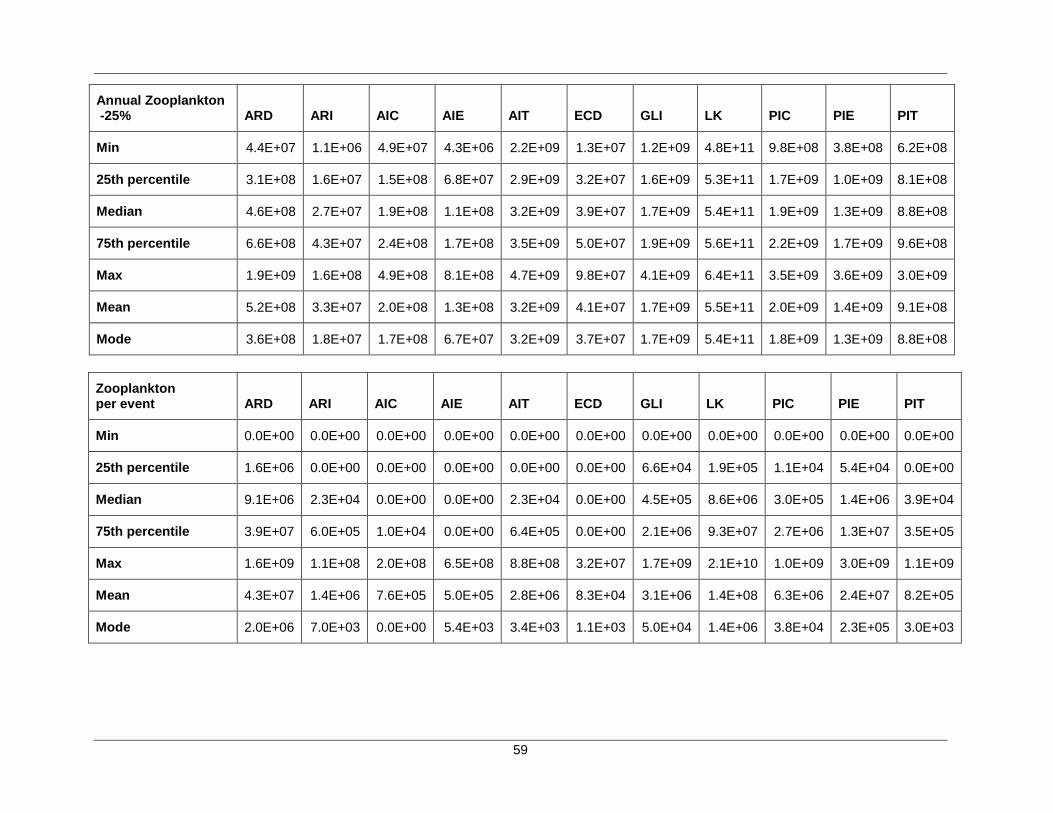
59
Annual Zooplankton -25% ARD ARI AIC AIE AIT ECD GLI LK PIC PIE PIT
Min 4.4E+07 1.1E+06 4.9E+07 4.3E+06 2.2E+09 1.3E+07 1.2E+09 4.8E+11 9.8E+08 3.8E+08 6.2E+08
25th percentile 3.1E+08 1.6E+07 1.5E+08 6.8E+07 2.9E+09 3.2E+07 1.6E+09 5.3E+11 1.7E+09 1.0E+09 8.1E+08
Median 4.6E+08 2.7E+07 1.9E+08 1.1E+08 3.2E+09 3.9E+07 1.7E+09 5.4E+11 1.9E+09 1.3E+09 8.8E+08
75th percentile 6.6E+08 4.3E+07 2.4E+08 1.7E+08 3.5E+09 5.0E+07 1.9E+09 5.6E+11 2.2E+09 1.7E+09 9.6E+08
Max 1.9E+09 1.6E+08 4.9E+08 8.1E+08 4.7E+09 9.8E+07 4.1E+09 6.4E+11 3.5E+09 3.6E+09 3.0E+09
Mean 5.2E+08 3.3E+07 2.0E+08 1.3E+08 3.2E+09 4.1E+07 1.7E+09 5.5E+11 2.0E+09 1.4E+09 9.1E+08
Mode 3.6E+08 1.8E+07 1.7E+08 6.7E+07 3.2E+09 3.7E+07 1.7E+09 5.4E+11 1.8E+09 1.3E+09 8.8E+08
Zooplankton per event ARD ARI AIC AIE AIT ECD GLI LK PIC PIE PIT
Min 0.0E+00 0.0E+00 0.0E+00 0.0E+00 0.0E+00 0.0E+00 0.0E+00 0.0E+00 0.0E+00 0.0E+00 0.0E+00
25th percentile 1.6E+06 0.0E+00 0.0E+00 0.0E+00 0.0E+00 0.0E+00 6.6E+04 1.9E+05 1.1E+04 5.4E+04 0.0E+00
Median 9.1E+06 2.3E+04 0.0E+00 0.0E+00 2.3E+04 0.0E+00 4.5E+05 8.6E+06 3.0E+05 1.4E+06 3.9E+04
75th percentile 3.9E+07 6.0E+05 1.0E+04 0.0E+00 6.4E+05 0.0E+00 2.1E+06 9.3E+07 2.7E+06 1.3E+07 3.5E+05
Max 1.6E+09 1.1E+08 2.0E+08 6.5E+08 8.8E+08 3.2E+07 1.7E+09 2.1E+10 1.0E+09 3.0E+09 1.1E+09
Mean 4.3E+07 1.4E+06 7.6E+05 5.0E+05 2.8E+06 8.3E+04 3.1E+06 1.4E+08 6.3E+06 2.4E+07 8.2E+05
Mode 2.0E+06 7.0E+03 0.0E+00 5.4E+03 3.4E+03 1.1E+03 5.0E+04 1.4E+06 3.8E+04 2.3E+05 3.0E+03
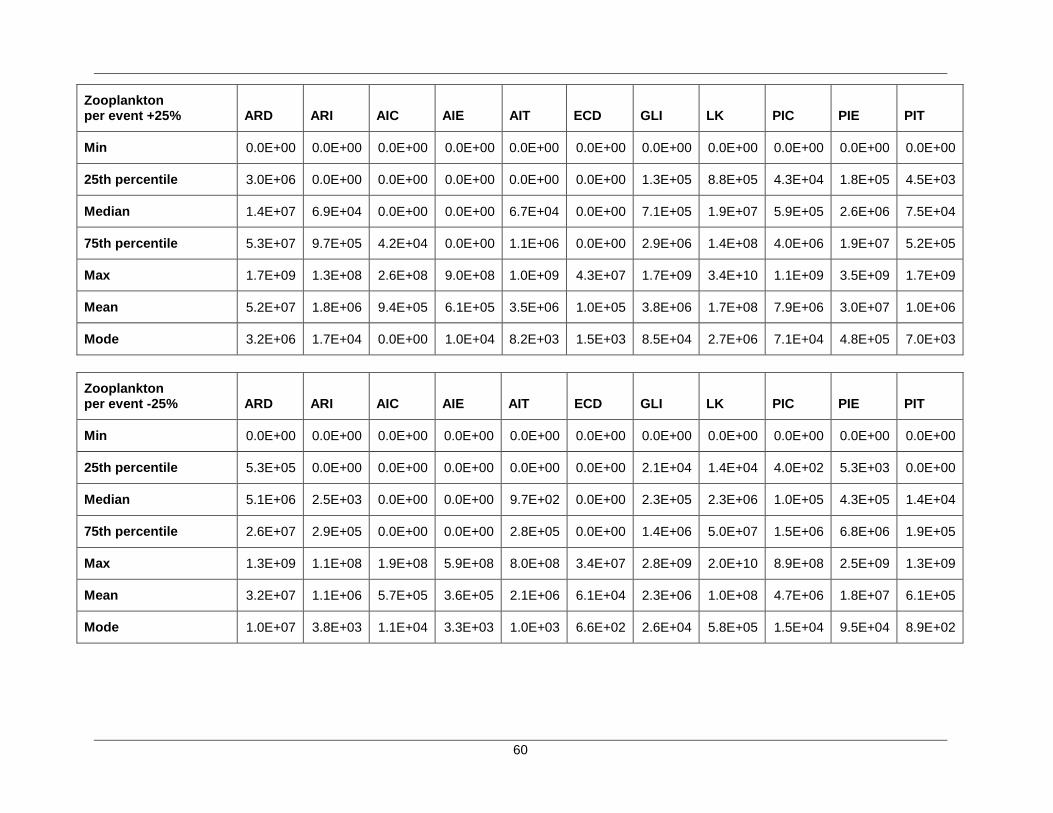
60
Zooplankton per event +25% ARD ARI AIC AIE AIT ECD GLI LK PIC PIE PIT
Min 0.0E+00 0.0E+00 0.0E+00 0.0E+00 0.0E+00 0.0E+00 0.0E+00 0.0E+00 0.0E+00 0.0E+00 0.0E+00
25th percentile 3.0E+06 0.0E+00 0.0E+00 0.0E+00 0.0E+00 0.0E+00 1.3E+05 8.8E+05 4.3E+04 1.8E+05 4.5E+03
Median 1.4E+07 6.9E+04 0.0E+00 0.0E+00 6.7E+04 0.0E+00 7.1E+05 1.9E+07 5.9E+05 2.6E+06 7.5E+04
75th percentile 5.3E+07 9.7E+05 4.2E+04 0.0E+00 1.1E+06 0.0E+00 2.9E+06 1.4E+08 4.0E+06 1.9E+07 5.2E+05
Max 1.7E+09 1.3E+08 2.6E+08 9.0E+08 1.0E+09 4.3E+07 1.7E+09 3.4E+10 1.1E+09 3.5E+09 1.7E+09
Mean 5.2E+07 1.8E+06 9.4E+05 6.1E+05 3.5E+06 1.0E+05 3.8E+06 1.7E+08 7.9E+06 3.0E+07 1.0E+06
Mode 3.2E+06 1.7E+04 0.0E+00 1.0E+04 8.2E+03 1.5E+03 8.5E+04 2.7E+06 7.1E+04 4.8E+05 7.0E+03
Zooplankton per event -25% ARD ARI AIC AIE AIT ECD GLI LK PIC PIE PIT
Min 0.0E+00 0.0E+00 0.0E+00 0.0E+00 0.0E+00 0.0E+00 0.0E+00 0.0E+00 0.0E+00 0.0E+00 0.0E+00
25th percentile 5.3E+05 0.0E+00 0.0E+00 0.0E+00 0.0E+00 0.0E+00 2.1E+04 1.4E+04 4.0E+02 5.3E+03 0.0E+00
Median 5.1E+06 2.5E+03 0.0E+00 0.0E+00 9.7E+02 0.0E+00 2.3E+05 2.3E+06 1.0E+05 4.3E+05 1.4E+04
75th percentile 2.6E+07 2.9E+05 0.0E+00 0.0E+00 2.8E+05 0.0E+00 1.4E+06 5.0E+07 1.5E+06 6.8E+06 1.9E+05
Max 1.3E+09 1.1E+08 1.9E+08 5.9E+08 8.0E+08 3.4E+07 2.8E+09 2.0E+10 8.9E+08 2.5E+09 1.3E+09
Mean 3.2E+07 1.1E+06 5.7E+05 3.6E+05 2.1E+06 6.1E+04 2.3E+06 1.0E+08 4.7E+06 1.8E+07 6.1E+05
Mode 1.0E+07 3.8E+03 1.1E+04 3.3E+03 1.0E+03 6.6E+02 2.6E+04 5.8E+05 1.5E+04 9.5E+04 8.9E+02
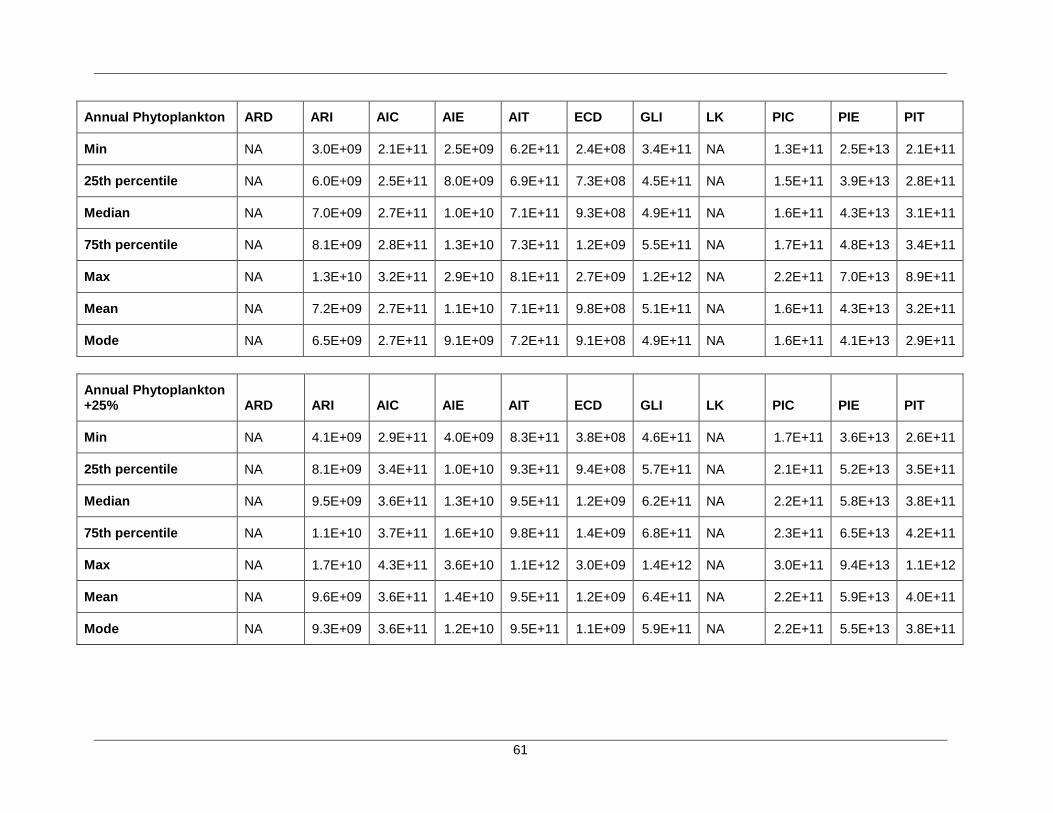
61
Annual Phytoplankton ARD ARI AIC AIE AIT ECD GLI LK PIC PIE PIT
Min NA 3.0E+09 2.1E+11 2.5E+09 6.2E+11 2.4E+08 3.4E+11 NA 1.3E+11 2.5E+13 2.1E+11
25th percentile NA 6.0E+09 2.5E+11 8.0E+09 6.9E+11 7.3E+08 4.5E+11 NA 1.5E+11 3.9E+13 2.8E+11
Median NA 7.0E+09 2.7E+11 1.0E+10 7.1E+11 9.3E+08 4.9E+11 NA 1.6E+11 4.3E+13 3.1E+11
75th percentile NA 8.1E+09 2.8E+11 1.3E+10 7.3E+11 1.2E+09 5.5E+11 NA 1.7E+11 4.8E+13 3.4E+11
Max NA 1.3E+10 3.2E+11 2.9E+10 8.1E+11 2.7E+09 1.2E+12 NA 2.2E+11 7.0E+13 8.9E+11
Mean NA 7.2E+09 2.7E+11 1.1E+10 7.1E+11 9.8E+08 5.1E+11 NA 1.6E+11 4.3E+13 3.2E+11
Mode NA 6.5E+09 2.7E+11 9.1E+09 7.2E+11 9.1E+08 4.9E+11 NA 1.6E+11 4.1E+13 2.9E+11
Annual Phytoplankton +25% ARD ARI AIC AIE AIT ECD GLI LK PIC PIE PIT
Min NA 4.1E+09 2.9E+11 4.0E+09 8.3E+11 3.8E+08 4.6E+11 NA 1.7E+11 3.6E+13 2.6E+11
25th percentile NA 8.1E+09 3.4E+11 1.0E+10 9.3E+11 9.4E+08 5.7E+11 NA 2.1E+11 5.2E+13 3.5E+11
Median NA 9.5E+09 3.6E+11 1.3E+10 9.5E+11 1.2E+09 6.2E+11 NA 2.2E+11 5.8E+13 3.8E+11
75th percentile NA 1.1E+10 3.7E+11 1.6E+10 9.8E+11 1.4E+09 6.8E+11 NA 2.3E+11 6.5E+13 4.2E+11
Max NA 1.7E+10 4.3E+11 3.6E+10 1.1E+12 3.0E+09 1.4E+12 NA 3.0E+11 9.4E+13 1.1E+12
Mean NA 9.6E+09 3.6E+11 1.4E+10 9.5E+11 1.2E+09 6.4E+11 NA 2.2E+11 5.9E+13 4.0E+11
Mode NA 9.3E+09 3.6E+11 1.2E+10 9.5E+11 1.1E+09 5.9E+11 NA 2.2E+11 5.5E+13 3.8E+11
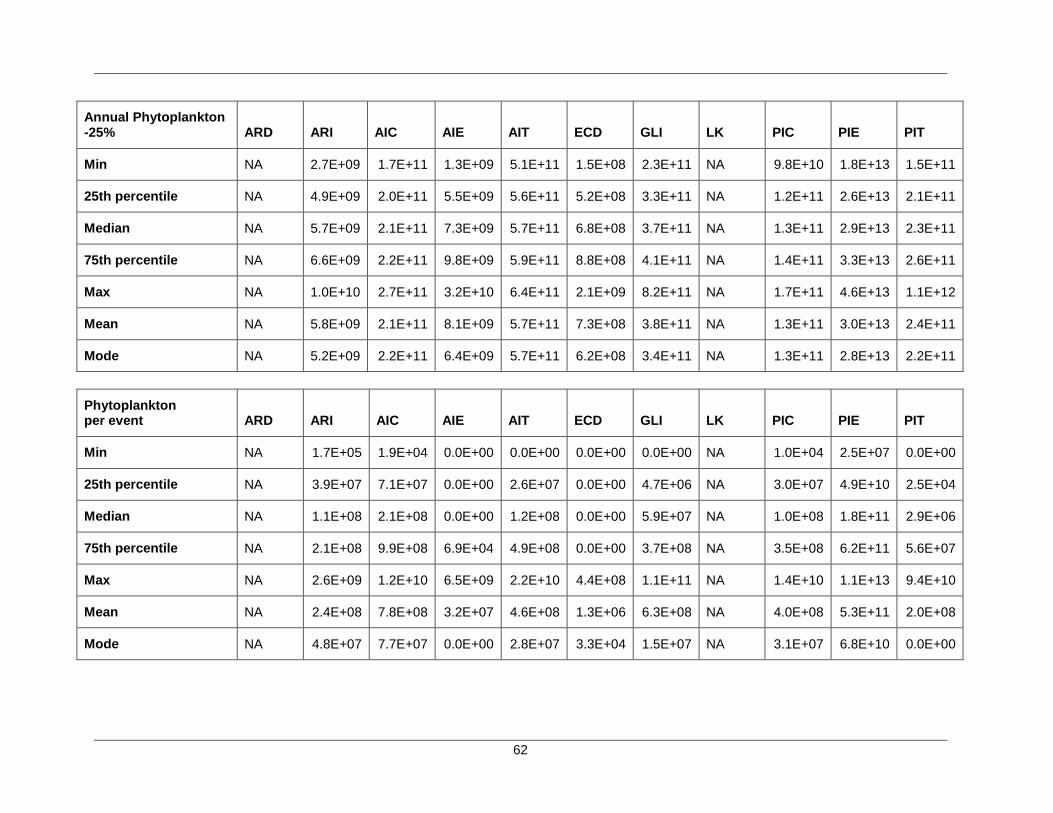
62
Annual Phytoplankton -25% ARD ARI AIC AIE AIT ECD GLI LK PIC PIE PIT
Min NA 2.7E+09 1.7E+11 1.3E+09 5.1E+11 1.5E+08 2.3E+11 NA 9.8E+10 1.8E+13 1.5E+11
25th percentile NA 4.9E+09 2.0E+11 5.5E+09 5.6E+11 5.2E+08 3.3E+11 NA 1.2E+11 2.6E+13 2.1E+11
Median NA 5.7E+09 2.1E+11 7.3E+09 5.7E+11 6.8E+08 3.7E+11 NA 1.3E+11 2.9E+13 2.3E+11
75th percentile NA 6.6E+09 2.2E+11 9.8E+09 5.9E+11 8.8E+08 4.1E+11 NA 1.4E+11 3.3E+13 2.6E+11
Max NA 1.0E+10 2.7E+11 3.2E+10 6.4E+11 2.1E+09 8.2E+11 NA 1.7E+11 4.6E+13 1.1E+12
Mean NA 5.8E+09 2.1E+11 8.1E+09 5.7E+11 7.3E+08 3.8E+11 NA 1.3E+11 3.0E+13 2.4E+11
Mode NA 5.2E+09 2.2E+11 6.4E+09 5.7E+11 6.2E+08 3.4E+11 NA 1.3E+11 2.8E+13 2.2E+11
Phytoplankton per event ARD ARI AIC AIE AIT ECD GLI LK PIC PIE PIT
Min NA 1.7E+05 1.9E+04 0.0E+00 0.0E+00 0.0E+00 0.0E+00 NA 1.0E+04 2.5E+07 0.0E+00
25th percentile NA 3.9E+07 7.1E+07 0.0E+00 2.6E+07 0.0E+00 4.7E+06 NA 3.0E+07 4.9E+10 2.5E+04
Median NA 1.1E+08 2.1E+08 0.0E+00 1.2E+08 0.0E+00 5.9E+07 NA 1.0E+08 1.8E+11 2.9E+06
75th percentile NA 2.1E+08 9.9E+08 6.9E+04 4.9E+08 0.0E+00 3.7E+08 NA 3.5E+08 6.2E+11 5.6E+07
Max NA 2.6E+09 1.2E+10 6.5E+09 2.2E+10 4.4E+08 1.1E+11 NA 1.4E+10 1.1E+13 9.4E+10
Mean NA 2.4E+08 7.8E+08 3.2E+07 4.6E+08 1.3E+06 6.3E+08 NA 4.0E+08 5.3E+11 2.0E+08
Mode NA 4.8E+07 7.7E+07 0.0E+00 2.8E+07 3.3E+04 1.5E+07 NA 3.1E+07 6.8E+10 0.0E+00
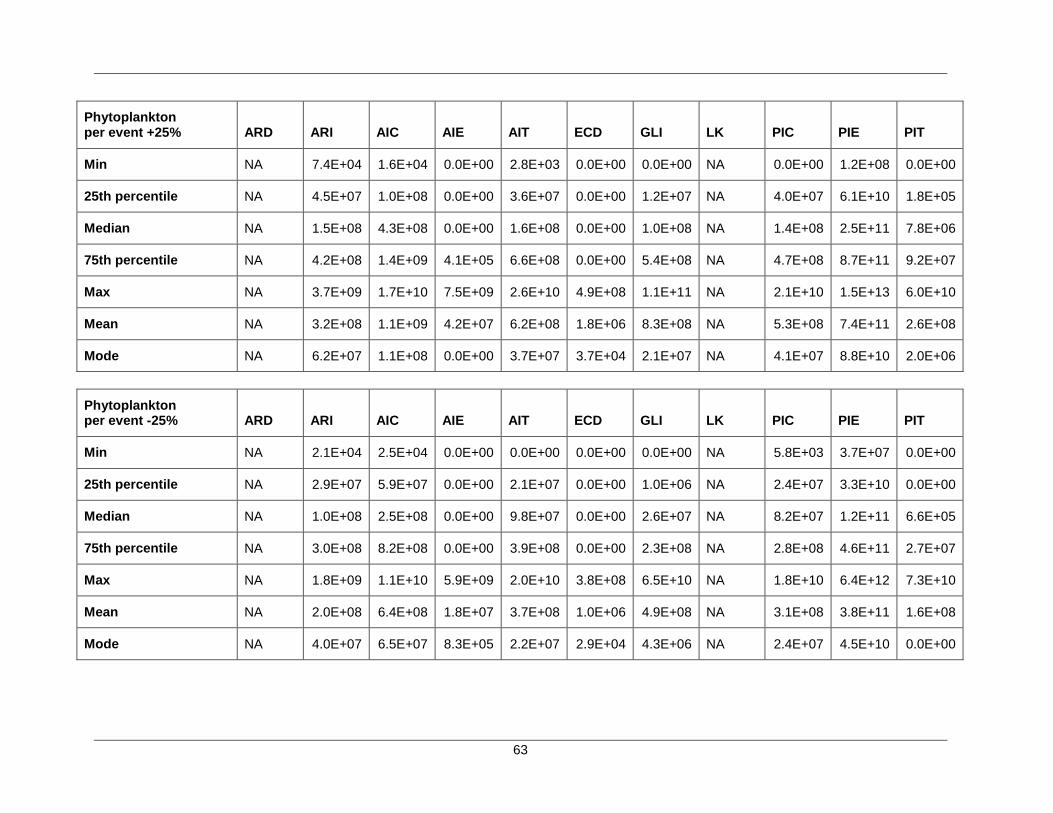
63
Phytoplankton per event +25% ARD ARI AIC AIE AIT ECD GLI LK PIC PIE PIT
Min NA 7.4E+04 1.6E+04 0.0E+00 2.8E+03 0.0E+00 0.0E+00 NA 0.0E+00 1.2E+08 0.0E+00
25th percentile NA 4.5E+07 1.0E+08 0.0E+00 3.6E+07 0.0E+00 1.2E+07 NA 4.0E+07 6.1E+10 1.8E+05
Median NA 1.5E+08 4.3E+08 0.0E+00 1.6E+08 0.0E+00 1.0E+08 NA 1.4E+08 2.5E+11 7.8E+06
75th percentile NA 4.2E+08 1.4E+09 4.1E+05 6.6E+08 0.0E+00 5.4E+08 NA 4.7E+08 8.7E+11 9.2E+07
Max NA 3.7E+09 1.7E+10 7.5E+09 2.6E+10 4.9E+08 1.1E+11 NA 2.1E+10 1.5E+13 6.0E+10
Mean NA 3.2E+08 1.1E+09 4.2E+07 6.2E+08 1.8E+06 8.3E+08 NA 5.3E+08 7.4E+11 2.6E+08
Mode NA 6.2E+07 1.1E+08 0.0E+00 3.7E+07 3.7E+04 2.1E+07 NA 4.1E+07 8.8E+10 2.0E+06
Phytoplankton per event -25% ARD ARI AIC AIE AIT ECD GLI LK PIC PIE PIT
Min NA 2.1E+04 2.5E+04 0.0E+00 0.0E+00 0.0E+00 0.0E+00 NA 5.8E+03 3.7E+07 0.0E+00
25th percentile NA 2.9E+07 5.9E+07 0.0E+00 2.1E+07 0.0E+00 1.0E+06 NA 2.4E+07 3.3E+10 0.0E+00
Median NA 1.0E+08 2.5E+08 0.0E+00 9.8E+07 0.0E+00 2.6E+07 NA 8.2E+07 1.2E+11 6.6E+05
75th percentile NA 3.0E+08 8.2E+08 0.0E+00 3.9E+08 0.0E+00 2.3E+08 NA 2.8E+08 4.6E+11 2.7E+07
Max NA 1.8E+09 1.1E+10 5.9E+09 2.0E+10 3.8E+08 6.5E+10 NA 1.8E+10 6.4E+12 7.3E+10
Mean NA 2.0E+08 6.4E+08 1.8E+07 3.7E+08 1.0E+06 4.9E+08 NA 3.1E+08 3.8E+11 1.6E+08
Mode NA 4.0E+07 6.5E+07 8.3E+05 2.2E+07 2.9E+04 4.3E+06 NA 2.4E+07 4.5E+10 0.0E+00
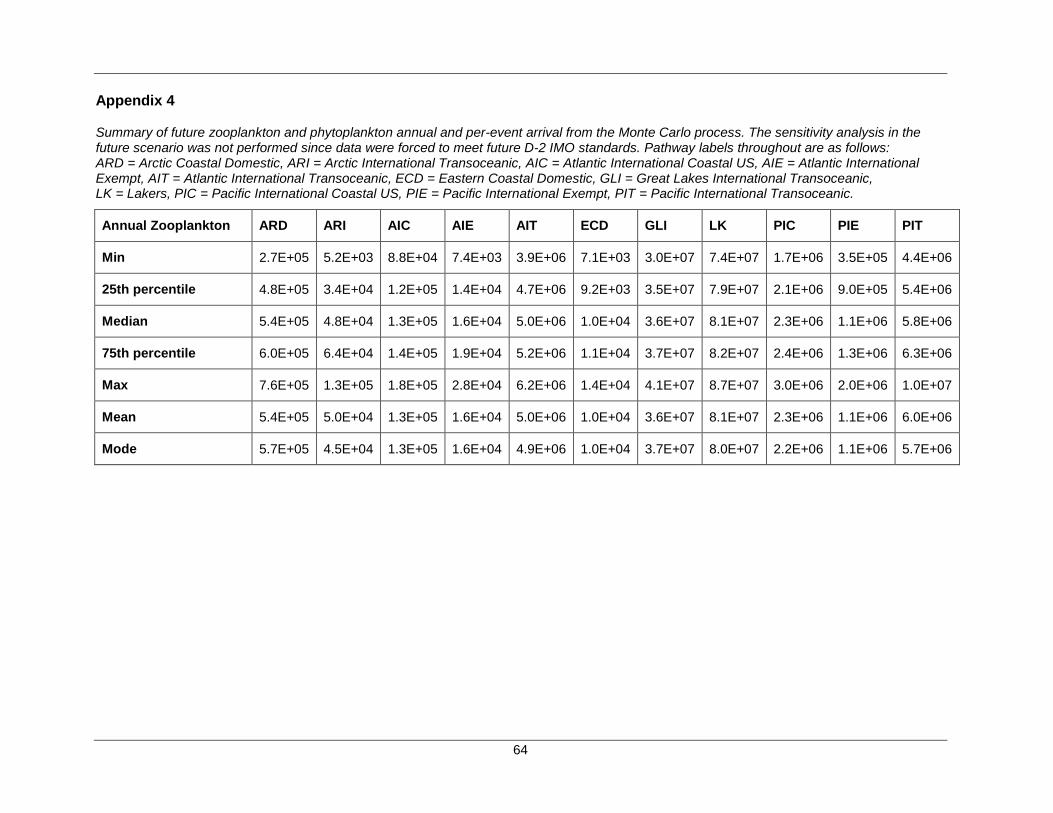
64
Appendix 4
Summary of future zooplankton and phytoplankton annual and per-event arrival from the Monte Carlo process. The sensitivity analysis in the future scenario was not performed since data were forced to meet future D-2 IMO standards. Pathway labels throughout are as follows: ARD = Arctic Coastal Domestic, ARI = Arctic International Transoceanic, AIC = Atlantic International Coastal US, AIE = Atlantic International Exempt, AIT = Atlantic International Transoceanic, ECD = Eastern Coastal Domestic, GLI = Great Lakes International Transoceanic, LK = Lakers, PIC = Pacific International Coastal US, PIE = Pacific International Exempt, PIT = Pacific International Transoceanic.
Annual Zooplankton ARD ARI AIC AIE AIT ECD GLI LK PIC PIE PIT
Min 2.7E+05 5.2E+03 8.8E+04 7.4E+03 3.9E+06 7.1E+03 3.0E+07 7.4E+07 1.7E+06 3.5E+05 4.4E+06
25th percentile 4.8E+05 3.4E+04 1.2E+05 1.4E+04 4.7E+06 9.2E+03 3.5E+07 7.9E+07 2.1E+06 9.0E+05 5.4E+06
Median 5.4E+05 4.8E+04 1.3E+05 1.6E+04 5.0E+06 1.0E+04 3.6E+07 8.1E+07 2.3E+06 1.1E+06 5.8E+06
75th percentile 6.0E+05 6.4E+04 1.4E+05 1.9E+04 5.2E+06 1.1E+04 3.7E+07 8.2E+07 2.4E+06 1.3E+06 6.3E+06
Max 7.6E+05 1.3E+05 1.8E+05 2.8E+04 6.2E+06 1.4E+04 4.1E+07 8.7E+07 3.0E+06 2.0E+06 1.0E+07
Mean 5.4E+05 5.0E+04 1.3E+05 1.6E+04 5.0E+06 1.0E+04 3.6E+07 8.1E+07 2.3E+06 1.1E+06 6.0E+06
Mode 5.7E+05 4.5E+04 1.3E+05 1.6E+04 4.9E+06 1.0E+04 3.7E+07 8.0E+07 2.2E+06 1.1E+06 5.7E+06
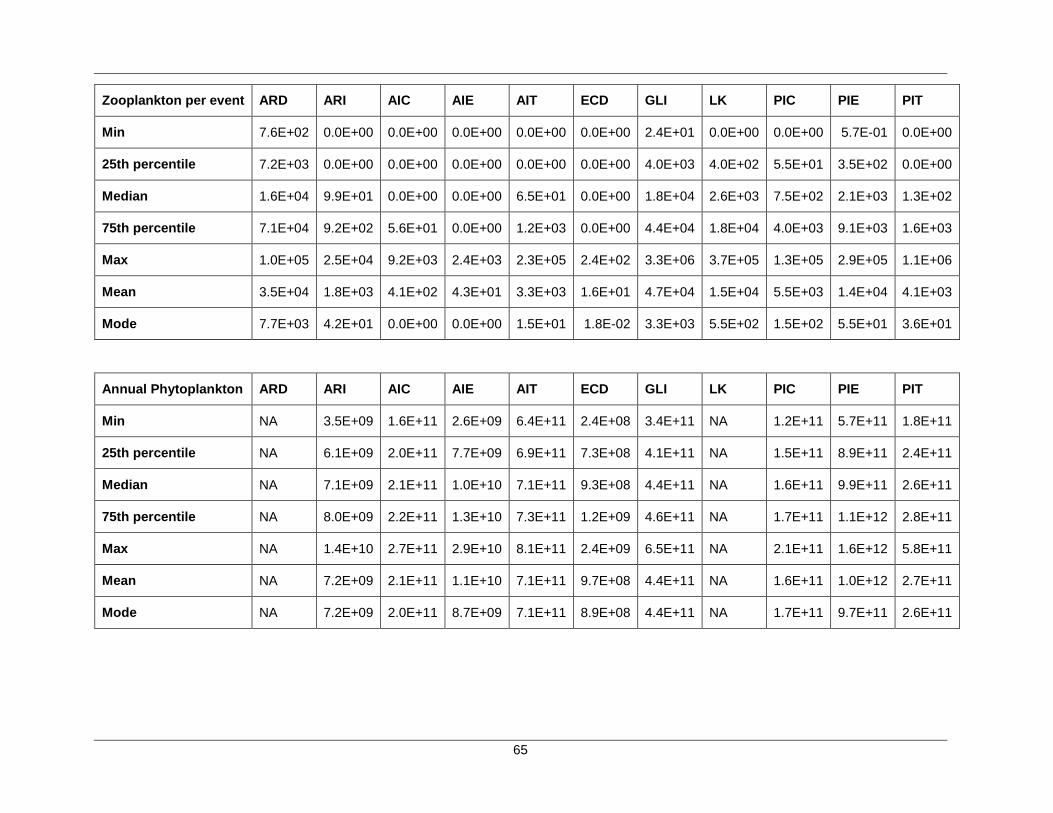
65
Zooplankton per event ARD ARI AIC AIE AIT ECD GLI LK PIC PIE PIT
Min 7.6E+02 0.0E+00 0.0E+00 0.0E+00 0.0E+00 0.0E+00 2.4E+01 0.0E+00 0.0E+00 5.7E-01 0.0E+00
25th percentile 7.2E+03 0.0E+00 0.0E+00 0.0E+00 0.0E+00 0.0E+00 4.0E+03 4.0E+02 5.5E+01 3.5E+02 0.0E+00
Median 1.6E+04 9.9E+01 0.0E+00 0.0E+00 6.5E+01 0.0E+00 1.8E+04 2.6E+03 7.5E+02 2.1E+03 1.3E+02
75th percentile 7.1E+04 9.2E+02 5.6E+01 0.0E+00 1.2E+03 0.0E+00 4.4E+04 1.8E+04 4.0E+03 9.1E+03 1.6E+03
Max 1.0E+05 2.5E+04 9.2E+03 2.4E+03 2.3E+05 2.4E+02 3.3E+06 3.7E+05 1.3E+05 2.9E+05 1.1E+06
Mean 3.5E+04 1.8E+03 4.1E+02 4.3E+01 3.3E+03 1.6E+01 4.7E+04 1.5E+04 5.5E+03 1.4E+04 4.1E+03
Mode 7.7E+03 4.2E+01 0.0E+00 0.0E+00 1.5E+01 1.8E-02 3.3E+03 5.5E+02 1.5E+02 5.5E+01 3.6E+01
Annual Phytoplankton ARD ARI AIC AIE AIT ECD GLI LK PIC PIE PIT
Min NA 3.5E+09 1.6E+11 2.6E+09 6.4E+11 2.4E+08 3.4E+11 NA 1.2E+11 5.7E+11 1.8E+11
25th percentile NA 6.1E+09 2.0E+11 7.7E+09 6.9E+11 7.3E+08 4.1E+11 NA 1.5E+11 8.9E+11 2.4E+11
Median NA 7.1E+09 2.1E+11 1.0E+10 7.1E+11 9.3E+08 4.4E+11 NA 1.6E+11 9.9E+11 2.6E+11
75th percentile NA 8.0E+09 2.2E+11 1.3E+10 7.3E+11 1.2E+09 4.6E+11 NA 1.7E+11 1.1E+12 2.8E+11
Max NA 1.4E+10 2.7E+11 2.9E+10 8.1E+11 2.4E+09 6.5E+11 NA 2.1E+11 1.6E+12 5.8E+11
Mean NA 7.2E+09 2.1E+11 1.1E+10 7.1E+11 9.7E+08 4.4E+11 NA 1.6E+11 1.0E+12 2.7E+11
Mode NA 7.2E+09 2.0E+11 8.7E+09 7.1E+11 8.9E+08 4.4E+11 NA 1.7E+11 9.7E+11 2.6E+11
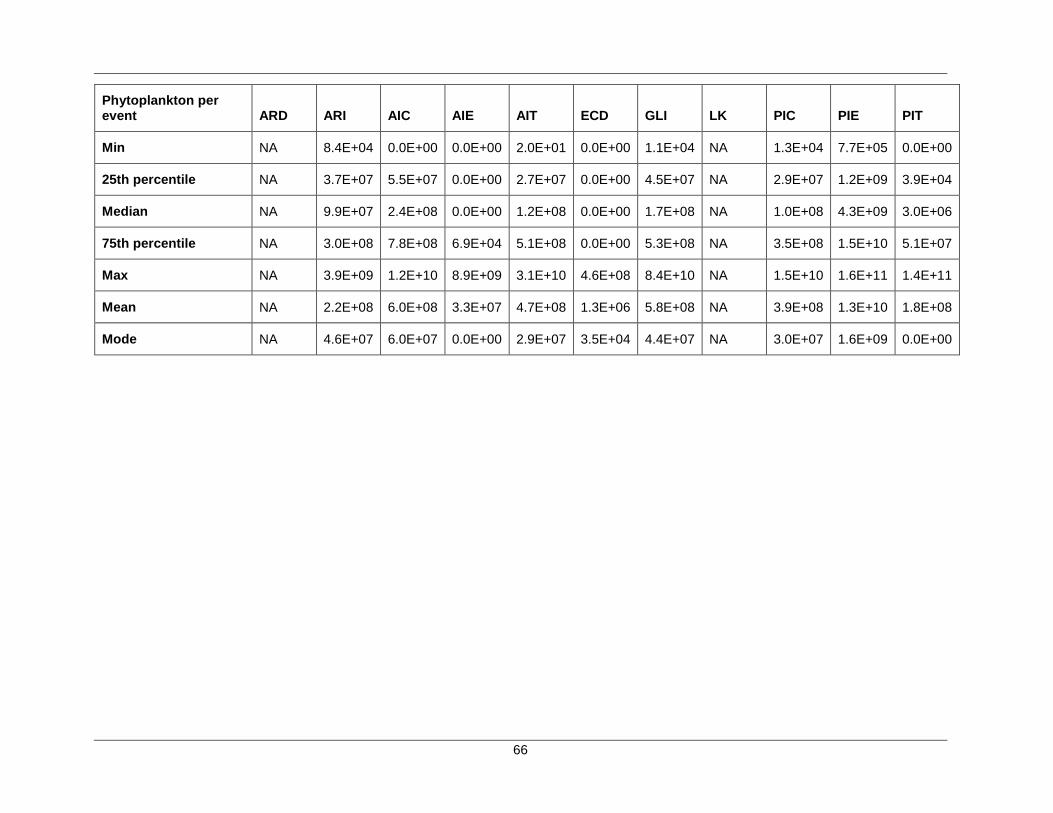
66
Phytoplankton per event ARD ARI AIC AIE AIT ECD GLI LK PIC PIE PIT
Min NA 8.4E+04 0.0E+00 0.0E+00 2.0E+01 0.0E+00 1.1E+04 NA 1.3E+04 7.7E+05 0.0E+00
25th percentile NA 3.7E+07 5.5E+07 0.0E+00 2.7E+07 0.0E+00 4.5E+07 NA 2.9E+07 1.2E+09 3.9E+04
Median NA 9.9E+07 2.4E+08 0.0E+00 1.2E+08 0.0E+00 1.7E+08 NA 1.0E+08 4.3E+09 3.0E+06
75th percentile NA 3.0E+08 7.8E+08 6.9E+04 5.1E+08 0.0E+00 5.3E+08 NA 3.5E+08 1.5E+10 5.1E+07
Max NA 3.9E+09 1.2E+10 8.9E+09 3.1E+10 4.6E+08 8.4E+10 NA 1.5E+10 1.6E+11 1.4E+11
Mean NA 2.2E+08 6.0E+08 3.3E+07 4.7E+08 1.3E+06 5.8E+08 NA 3.9E+08 1.3E+10 1.8E+08
Mode NA 4.6E+07 6.0E+07 0.0E+00 2.9E+07 3.5E+04 4.4E+07 NA 3.0E+07 1.6E+09 0.0E+00
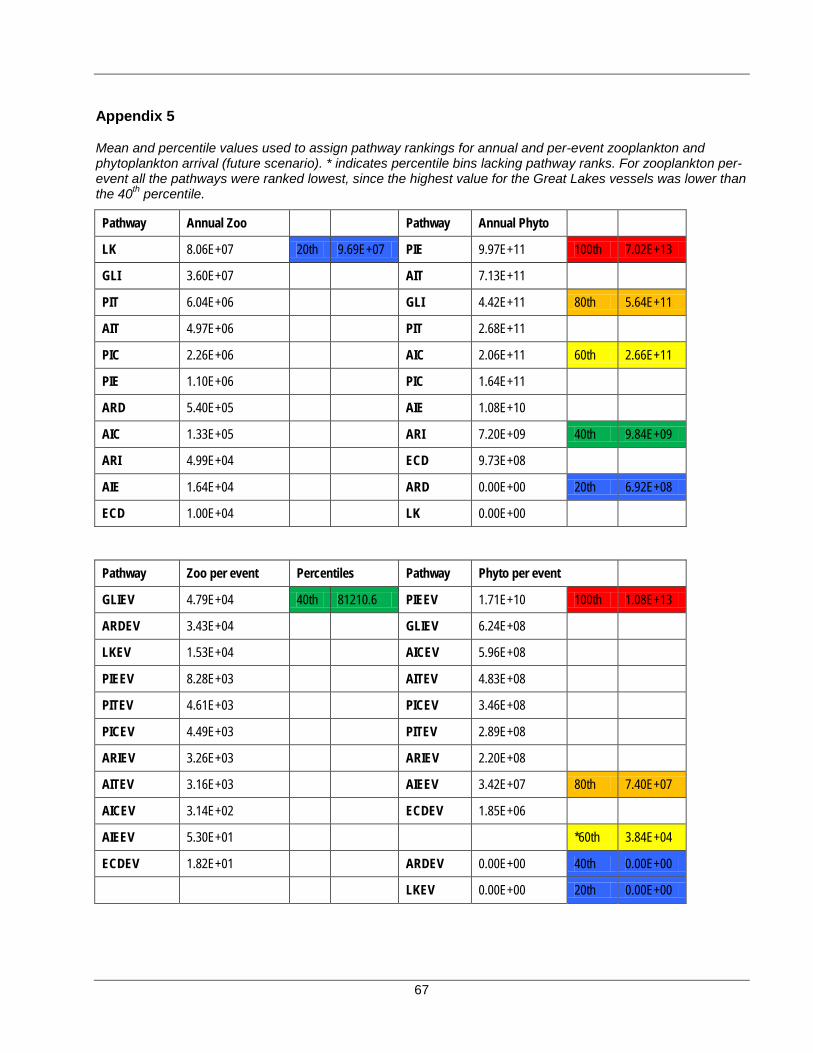
67
Appendix 5
Mean and percentile values used to assign pathway rankings for annual and per-event zooplankton and phytoplankton arrival (future scenario). * indicates percentile bins lacking pathway ranks. For zooplankton per-event all the pathways were ranked lowest, since the highest value for the Great Lakes vessels was lower than the 40th percentile.
Pathway Annual Zoo Pathway Annual Phyto LK 8.06E+07 20th 9.69E+07 PIE 9.97E+11 100th 7.02E+13
GLI 3.60E+07 AIT 7.13E+11 PIT 6.04E+06 GLI 4.42E+11 80th 5.64E+11
AIT 4.97E+06 PIT 2.68E+11 PIC 2.26E+06 AIC 2.06E+11 60th 2.66E+11
PIE 1.10E+06 PIC 1.64E+11 ARD 5.40E+05 AIE 1.08E+10 AIC 1.33E+05 ARI 7.20E+09 40th 9.84E+09
ARI 4.99E+04 ECD 9.73E+08 AIE 1.64E+04 ARD 0.00E+00 20th 6.92E+08
ECD 1.00E+04 LK 0.00E+00
Pathway Zoo per event Percentiles Pathway Phyto per event GLIEV 4.79E+04 40th 81210.6 PIEEV 1.71E+10 100th 1.08E+13
ARDEV 3.43E+04 GLIEV 6.24E+08 LKEV 1.53E+04 AICEV 5.96E+08 PIEEV 8.28E+03 AITEV 4.83E+08 PITEV 4.61E+03 PICEV 3.46E+08 PICEV 4.49E+03 PITEV 2.89E+08 ARIEV 3.26E+03 ARIEV 2.20E+08 AITEV 3.16E+03 AIEEV 3.42E+07 80th 7.40E+07
AICEV 3.14E+02 ECDEV 1.85E+06 AIEEV 5.30E+01 *60th 3.84E+04
ECDEV 1.82E+01 ARDEV 0.00E+00 40th 0.00E+00
LKEV 0.00E+00 20th 0.00E+00

68
Appendix 6
List of 167 aquatic invasive species (AIS) potentially arriving by vessels to each Canadian region. The list of species was modified from the list of ballast-mediated AIS ranked at harm levels 3 or 4 by Molnar et al (2008) by experts during peer review. (*) indicates AIS native to some but not all portions of the Atlantic region. (**) indicates species that are farmed in some parts of the receiving regions. This AIS list does not represent a comprehensive list of species that may pose risks for Canadian waters, but should be treated as an index of relative risk by pathways. Expert reviewers: A. Locke, C. DiBacco, K. Howland, N. Mandrak, J. Martin, C. McKenzie, J. Pederson, N. Simard, T. Therriault, with advice from R. Horner and P. Archambault.
Species Name Atlantic region GLSLR region Arctic region Pacific region
Acanthogobius flavimanus x x x x
Acartia tonsa x x x
Acrothamnion preissii x x x
Aglaothamnion halliae x x x x
Alepes djedaba x x x x
Alexandrium catenella x x
Alexandrium minutum x x x
Alexandrium ostenfeldii x x x
Alexandrium peruvianum x x x
Alexandrium fundyense/tamarense* x x x
Alexandrium taylori x x x
Alitta succinea x x x x
Alosa sapidissima x x x
Alpheus audouini x x x x
Amphibalanus improvisus x x x
Anadara demiri x x x x
Anadara inaequivalvis x x x x
Anguillicola crassus x x x x
Antithamnionella ternifolia x x x x
Asparagopsis armata x x x x
Austrominius modestus x x x x
Balanus trigonus x x x
Batillaria attramentaria x x x x
Belonesox belizanus x x x x
Boonea bisuturalis x x x x
Botrylloides violaceus x x x
Botryllus schlosseri x x x
Brachidontes pharaonis x x x x
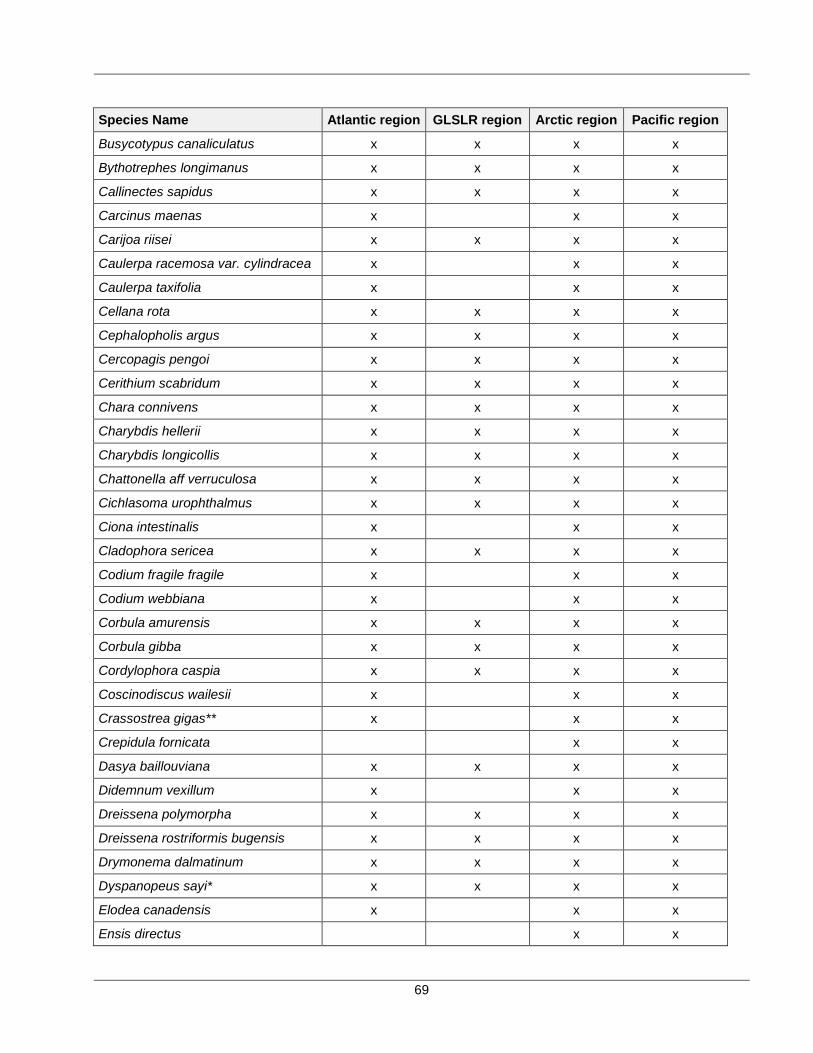
69
Species Name Atlantic region GLSLR region Arctic region Pacific region
Busycotypus canaliculatus x x x x
Bythotrephes longimanus x x x x
Callinectes sapidus x x x x
Carcinus maenas x x x
Carijoa riisei x x x x
Caulerpa racemosa var. cylindracea x x x
Caulerpa taxifolia x x x
Cellana rota x x x x
Cephalopholis argus x x x x
Cercopagis pengoi x x x x
Cerithium scabridum x x x x
Chara connivens x x x x
Charybdis hellerii x x x x
Charybdis longicollis x x x x
Chattonella aff verruculosa x x x x
Cichlasoma urophthalmus x x x x
Ciona intestinalis x x x
Cladophora sericea x x x x
Codium fragile fragile x x x
Codium webbiana x x x
Corbula amurensis x x x x
Corbula gibba x x x x
Cordylophora caspia x x x x
Coscinodiscus wailesii x x x
Crassostrea gigas** x x x
Crepidula fornicata x x
Dasya baillouviana x x x x
Didemnum vexillum x x x
Dreissena polymorpha x x x x
Dreissena rostriformis bugensis x x x x
Drymonema dalmatinum x x x x
Dyspanopeus sayi* x x x x
Elodea canadensis x x x
Ensis directus x x
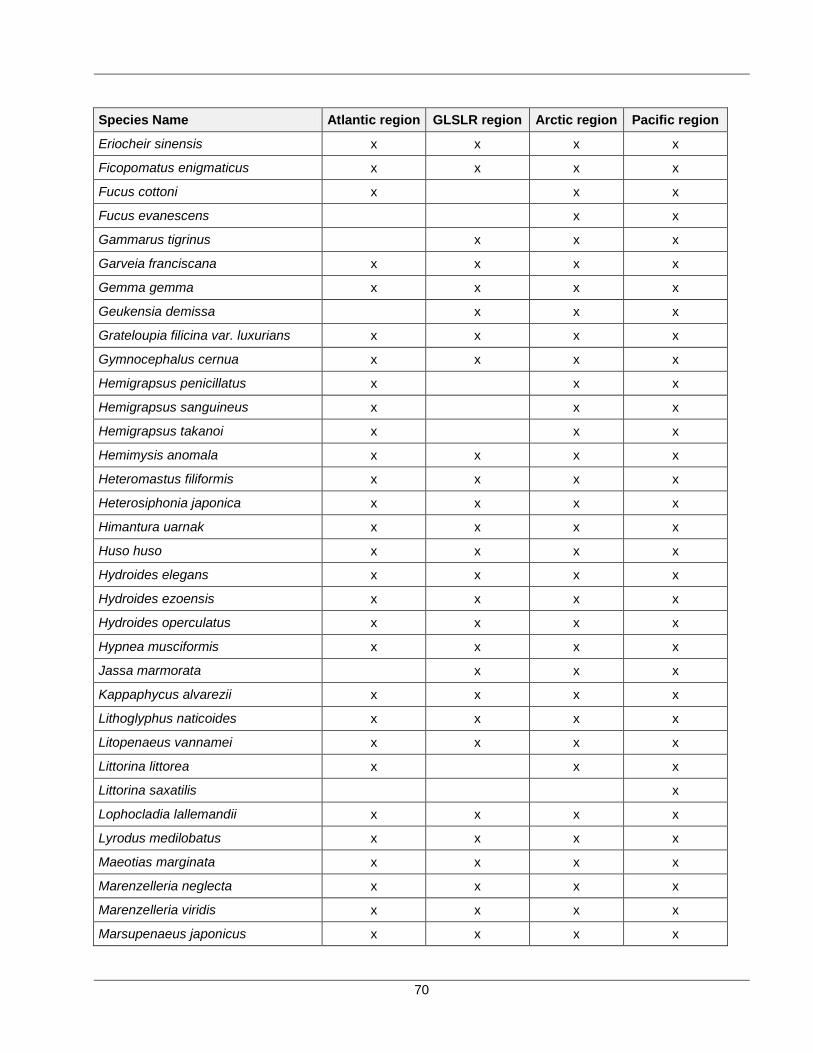
70
Species Name Atlantic region GLSLR region Arctic region Pacific region
Eriocheir sinensis x x x x
Ficopomatus enigmaticus x x x x
Fucus cottoni x x x
Fucus evanescens x x
Gammarus tigrinus x x x
Garveia franciscana x x x x
Gemma gemma x x x x
Geukensia demissa x x x
Grateloupia filicina var. luxurians x x x x
Gymnocephalus cernua x x x x
Hemigrapsus penicillatus x x x
Hemigrapsus sanguineus x x x
Hemigrapsus takanoi x x x
Hemimysis anomala x x x x
Heteromastus filiformis x x x x
Heterosiphonia japonica x x x x
Himantura uarnak x x x x
Huso huso x x x x
Hydroides elegans x x x x
Hydroides ezoensis x x x x
Hydroides operculatus x x x x
Hypnea musciformis x x x x
Jassa marmorata x x x
Kappaphycus alvarezii x x x x
Lithoglyphus naticoides x x x x
Litopenaeus vannamei x x x x
Littorina littorea x x x
Littorina saxatilis x
Lophocladia lallemandii x x x x
Lyrodus medilobatus x x x x
Maeotias marginata x x x x
Marenzelleria neglecta x x x x
Marenzelleria viridis x x x x
Marsupenaeus japonicus x x x x
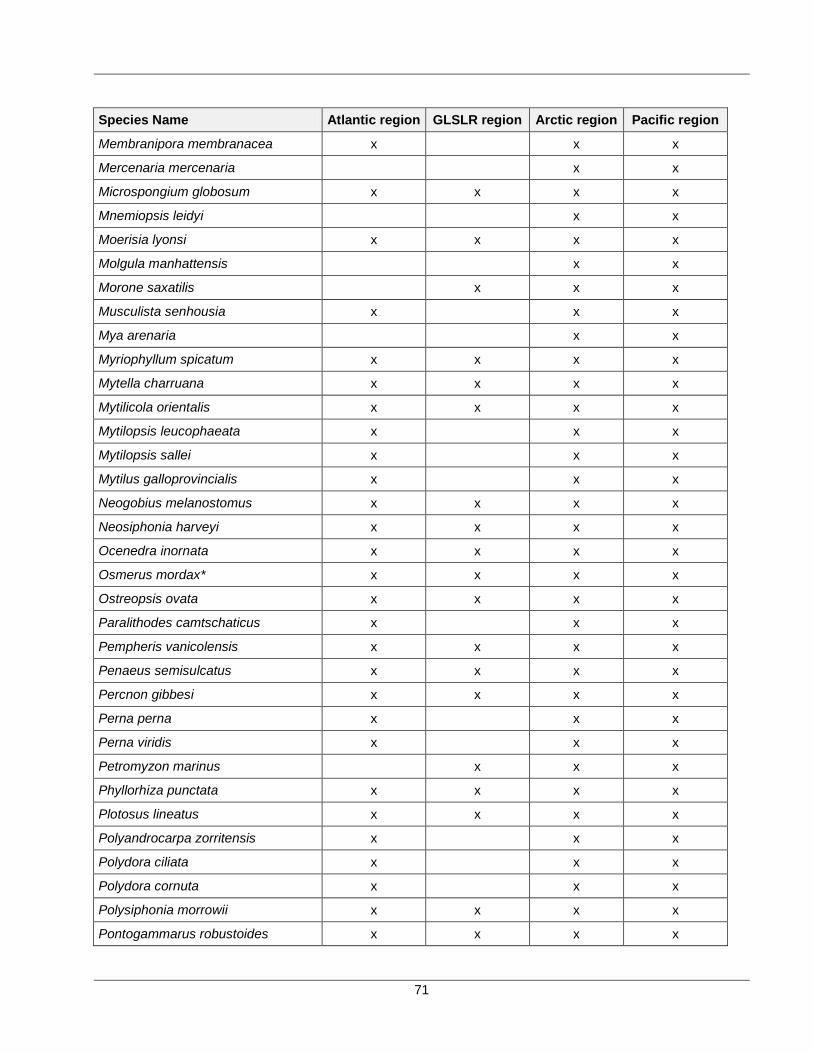
71
Species Name Atlantic region GLSLR region Arctic region Pacific region
Membranipora membranacea x x x
Mercenaria mercenaria x x
Microspongium globosum x x x x
Mnemiopsis leidyi x x
Moerisia lyonsi x x x x
Molgula manhattensis x x
Morone saxatilis x x x
Musculista senhousia x x x
Mya arenaria x x
Myriophyllum spicatum x x x x
Mytella charruana x x x x
Mytilicola orientalis x x x x
Mytilopsis leucophaeata x x x
Mytilopsis sallei x x x
Mytilus galloprovincialis x x x
Neogobius melanostomus x x x x
Neosiphonia harveyi x x x x
Ocenedra inornata x x x x
Osmerus mordax* x x x x
Ostreopsis ovata x x x x
Paralithodes camtschaticus x x x
Pempheris vanicolensis x x x x
Penaeus semisulcatus x x x x
Percnon gibbesi x x x x
Perna perna x x x
Perna viridis x x x
Petromyzon marinus x x x
Phyllorhiza punctata x x x x
Plotosus lineatus x x x x
Polyandrocarpa zorritensis x x x
Polydora ciliata x x x
Polydora cornuta x x x
Polysiphonia morrowii x x x x
Pontogammarus robustoides x x x x
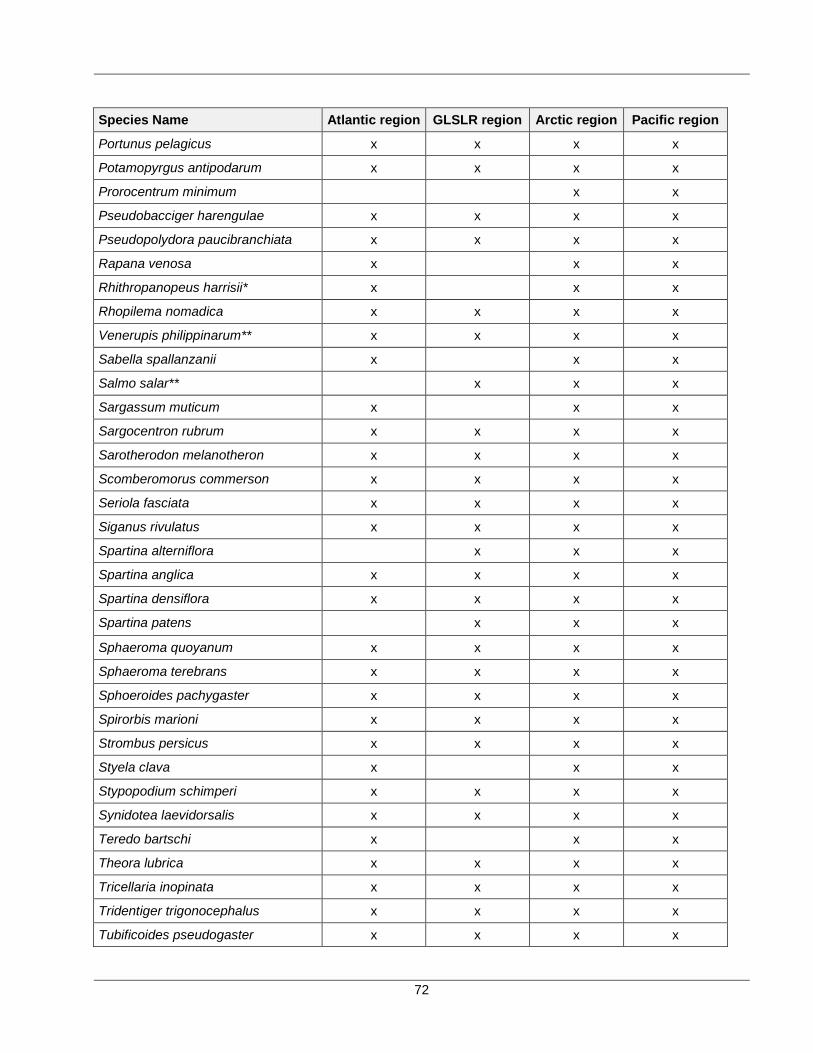
72
Species Name Atlantic region GLSLR region Arctic region Pacific region
Portunus pelagicus x x x x
Potamopyrgus antipodarum x x x x
Prorocentrum minimum x x
Pseudobacciger harengulae x x x x
Pseudopolydora paucibranchiata x x x x
Rapana venosa x x x
Rhithropanopeus harrisii* x x x
Rhopilema nomadica x x x x
Venerupis philippinarum** x x x x
Sabella spallanzanii x x x
Salmo salar** x x x
Sargassum muticum x x x
Sargocentron rubrum x x x x
Sarotherodon melanotheron x x x x
Scomberomorus commerson x x x x
Seriola fasciata x x x x
Siganus rivulatus x x x x
Spartina alterniflora x x x
Spartina anglica x x x x
Spartina densiflora x x x x
Spartina patens x x x
Sphaeroma quoyanum x x x x
Sphaeroma terebrans x x x x
Sphoeroides pachygaster x x x x
Spirorbis marioni x x x x
Strombus persicus x x x x
Styela clava x x x
Stypopodium schimperi x x x x
Synidotea laevidorsalis x x x x
Teredo bartschi x x x
Theora lubrica x x x x
Tricellaria inopinata x x x x
Tridentiger trigonocephalus x x x x
Tubificoides pseudogaster x x x x
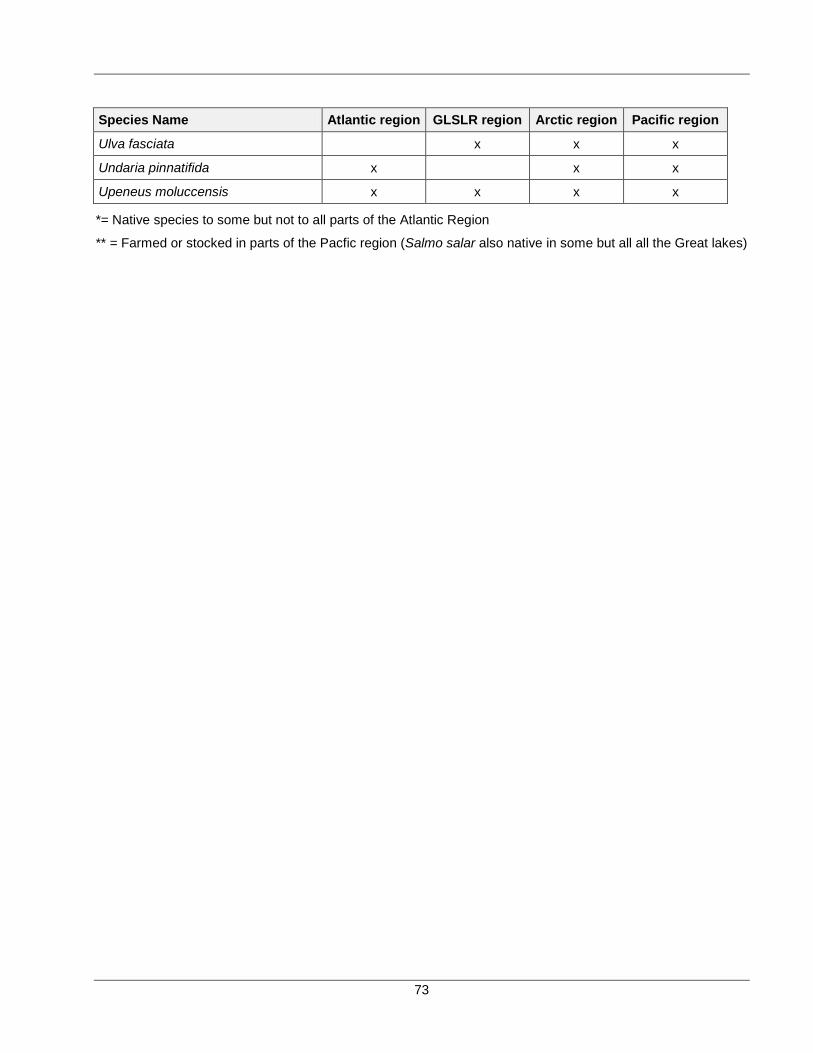
73
Species Name Atlantic region GLSLR region Arctic region Pacific region
Ulva fasciata x x x
Undaria pinnatifida x x x
Upeneus moluccensis x x x x
*= Native species to some but not to all parts of the Atlantic Region
** = Farmed or stocked in parts of the Pacfic region (Salmo salar also native in some but all all the Great lakes)
![California Aquatic Invasive Species Management Plan1].pdfactivities other than the purposeful or intentional introduction of the species involved, such as the transport of nonindigenous](https://img.pdfslide.net/doc/110x75/5f92078b8c4d3e351e19d7e0/california-aquatic-invasive-species-management-1pdf-activities-other-than-the.jpg)