Embed Size (px)
Citation preview
1
National Survey for Wales, 2016-17 to 2019-20
Contents
1. Introduction 2
2. Summary of quality 2
2.1 Relevance 2
Primary purpose 4
Users and uses 4
Strengths and limitations 4
2.2 Accuracy 6
Sampling error 6
Non-sampling error 8
2.3 Timeliness and punctuality 11
2.4 Accessibility and clarity 11
Publications 11
UK Data Archive 12
Methods and definitions 12
2.5 Comparability and coherence 12
Comparisons with other countries 12
Comparisons over time 13
3. Feedback or further information 15
2
1. Introduction
The National Survey for Wales is a large-scale random sample survey of people across Wales
that is carried out face-to-face in respondents’ homes. In each reporting year, April to the
following March, the survey is completed by around 12,000 people aged 16 and over.
Respondents are selected at random to ensure the results are representative.
The survey covers a wide range of topics. It has run continuously since March 2016, replacing the
previous National Survey (2012-15), Welsh Health Survey, Active Adults Survey, Arts in Wales
Survey, and Welsh Outdoor Recreation Survey, all of which came to an end in 2014 or 2015. The
results are used to inform and monitor Welsh Government policies as well as being a valuable
source of information for other public sector organisations such as local councils and NHS Wales,
voluntary organisations, academics, the media, and members of the public.
This report sets out how the survey adheres to the European Statistical System definition of
quality (Section 2), and provides a summary of methods used to compile the output (Section 3).
2. Summary of quality
This section covers how the National Survey meets the six dimensions of quality set out in the
European Statistical System: relevance; accuracy; timeliness and punctuality; accessibility and
clarity; comparability; and coherence.
2.1 Relevance
The degree to which the statistical product meets user needs for both coverage and
content.
Characteristic Details
What it
measures
The National Survey covers a broad range of topics including active travel,
education, sport and recreation, health, social care, use of the internet, views
about the local area, environment, wellbeing, finances, and the Welsh
language. The topics covered change from year to year to keep up with
changing needs for information. Topics can be explored using our interactive
question viewer.
A range of demographic questions is also included, to allow for detailed cross-
analysis of the results.
The survey content and materials for each year of the survey are available
from the National Survey web pages. This includes questionnaires, showcards
and the letter and leaflet sent to each selected household.
3
Characteristic Details
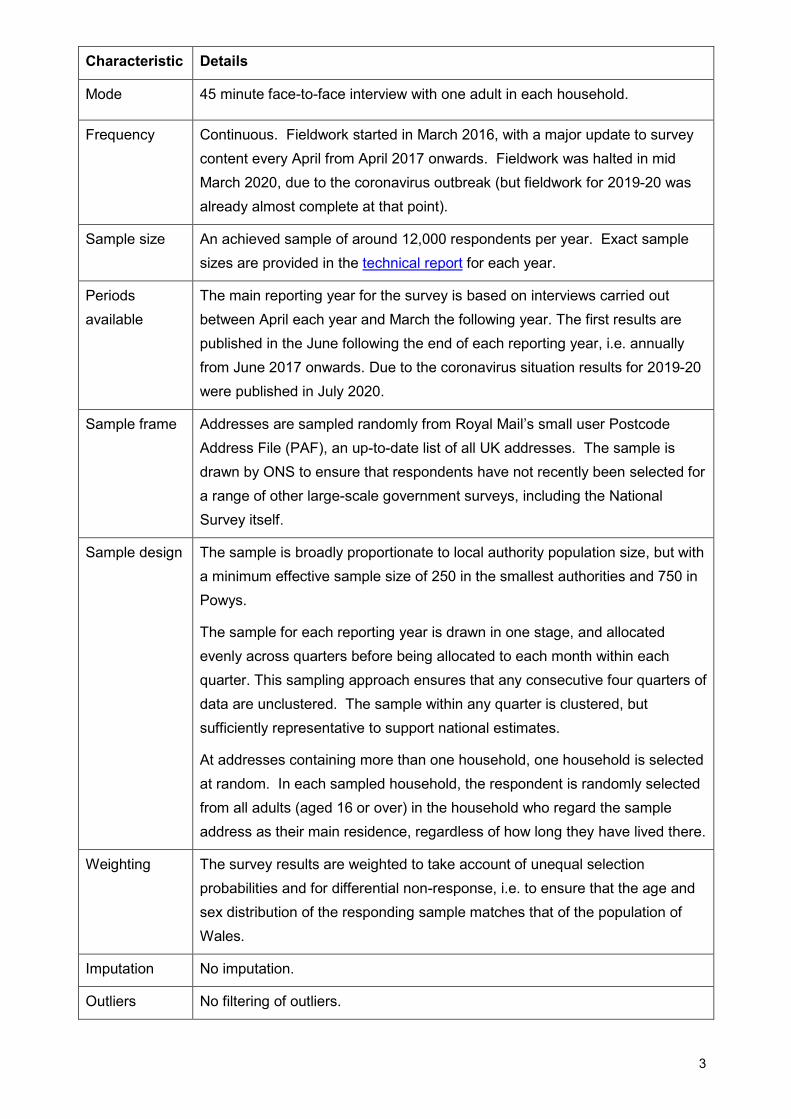
Mode 45 minute face-to-face interview with one adult in each household.
Frequency Continuous. Fieldwork started in March 2016, with a major update to survey
content every April from April 2017 onwards. Fieldwork was halted in mid
March 2020, due to the coronavirus outbreak (but fieldwork for 2019-20 was
already almost complete at that point).
Sample size An achieved sample of around 12,000 respondents per year. Exact sample
sizes are provided in the technical report for each year.
Periods
available
The main reporting year for the survey is based on interviews carried out
between April each year and March the following year. The first results are
published in the June following the end of each reporting year, i.e. annually
from June 2017 onwards. Due to the coronavirus situation results for 2019-20
were published in July 2020.
Sample frame Addresses are sampled randomly from Royal Mail’s small user Postcode
Address File (PAF), an up-to-date list of all UK addresses. The sample is
drawn by ONS to ensure that respondents have not recently been selected for
a range of other large-scale government surveys, including the National
Survey itself.
Sample design The sample is broadly proportionate to local authority population size, but with
a minimum effective sample size of 250 in the smallest authorities and 750 in
Powys.
The sample for each reporting year is drawn in one stage, and allocated
evenly across quarters before being allocated to each month within each
quarter. This sampling approach ensures that any consecutive four quarters of
data are unclustered. The sample within any quarter is clustered, but
sufficiently representative to support national estimates.
At addresses containing more than one household, one household is selected
at random. In each sampled household, the respondent is randomly selected
from all adults (aged 16 or over) in the household who regard the sample
address as their main residence, regardless of how long they have lived there.
Weighting The survey results are weighted to take account of unequal selection
probabilities and for differential non-response, i.e. to ensure that the age and
sex distribution of the responding sample matches that of the population of
Wales.
Imputation No imputation.
Outliers No filtering of outliers.
4
More detail on the survey design and methodology is set out in the technical report for each
fieldwork year.
Primary purpose
The main purpose of the survey is to provide information on the views and behaviours of adults in
Wales, covering a wide range of topics relating to them and their local area.
The results help public sector organisations to:
make decisions that are based on sound evidence;
monitor changes over time;
identify areas of good practice that can be implemented more widely; and
identify areas or groups that would benefit from intensive local support, so action can be
targeted as effectively as possible.
Users and uses
The survey is commissioned and used to help with policy-making by the Welsh Government,
Sport Wales, Natural Resources Wales, and the Arts Council of Wales. As well as these
organisations, there is a wide range of other users of the survey, including: local authorities
across Wales, NHS Wales, and Public Health Wales; other UK government departments and local
government organisations; other public sector organisations; academics; the media; members of
the public; and the voluntary sector, particularly organisations based in Wales.
Datasets are deposited each year at the UK Data Archive to ensure that the results are widely
accessible for research purposes. Results are also linked with other datasets via secure research
environments, for example the Secure Anonymised Information Linkage databank (SAIL) at
Swansea University. Respondents are able to opt out of having their results linked if they wish.
Strengths and limitations
The strengths of the National Survey include:
A randomly-selected sample with a target response rate of 59% each year. This helps to
ensure that the results are as representative as possible of people in Wales, including
harder-to-reach groups such as younger working people. The survey is weighted to adjust
for non-response, which also helps make the results as representative as possible.
A large sample size. This allows analysis by population sub-groups and local authority
areas.
It is carried out face-to-face. This has a range of advantages in addition to contributing to
a relatively good response rate. For example, it allows people who do not use the internet
to take part; it is easier than online surveys for those with lower levels of literacy; and is
easier than telephone surveys for those who find it more difficult to hear. Compared with
5
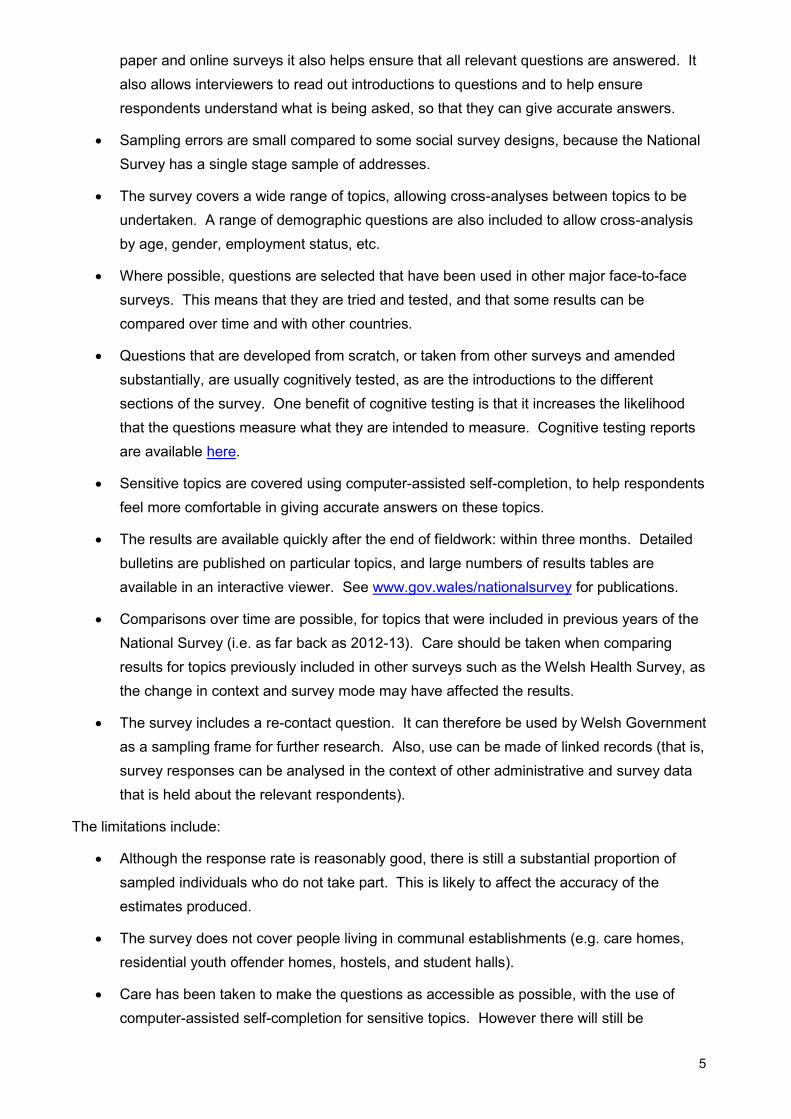
paper and online surveys it also helps ensure that all relevant questions are answered. It
also allows interviewers to read out introductions to questions and to help ensure
respondents understand what is being asked, so that they can give accurate answers.
Sampling errors are small compared to some social survey designs, because the National
Survey has a single stage sample of addresses.
The survey covers a wide range of topics, allowing cross-analyses between topics to be
undertaken. A range of demographic questions are also included to allow cross-analysis
by age, gender, employment status, etc.
Where possible, questions are selected that have been used in other major face-to-face
surveys. This means that they are tried and tested, and that some results can be
compared over time and with other countries.
Questions that are developed from scratch, or taken from other surveys and amended
substantially, are usually cognitively tested, as are the introductions to the different
sections of the survey. One benefit of cognitive testing is that it increases the likelihood
that the questions measure what they are intended to measure. Cognitive testing reports
are available here.
Sensitive topics are covered using computer-assisted self-completion, to help respondents
feel more comfortable in giving accurate answers on these topics.
The results are available quickly after the end of fieldwork: within three months. Detailed
bulletins are published on particular topics, and large numbers of results tables are
available in an interactive viewer. See www.gov.wales/nationalsurvey for publications.
Comparisons over time are possible, for topics that were included in previous years of the
National Survey (i.e. as far back as 2012-13). Care should be taken when comparing
results for topics previously included in other surveys such as the Welsh Health Survey, as
the change in context and survey mode may have affected the results.
The survey includes a re-contact question. It can therefore be used by Welsh Government
as a sampling frame for further research. Also, use can be made of linked records (that is,
survey responses can be analysed in the context of other administrative and survey data
that is held about the relevant respondents).
The limitations include:
Although the response rate is reasonably good, there is still a substantial proportion of
sampled individuals who do not take part. This is likely to affect the accuracy of the
estimates produced.
The survey does not cover people living in communal establishments (e.g. care homes,
residential youth offender homes, hostels, and student halls).
Care has been taken to make the questions as accessible as possible, with the use of
computer-assisted self-completion for sensitive topics. However there will still be
6
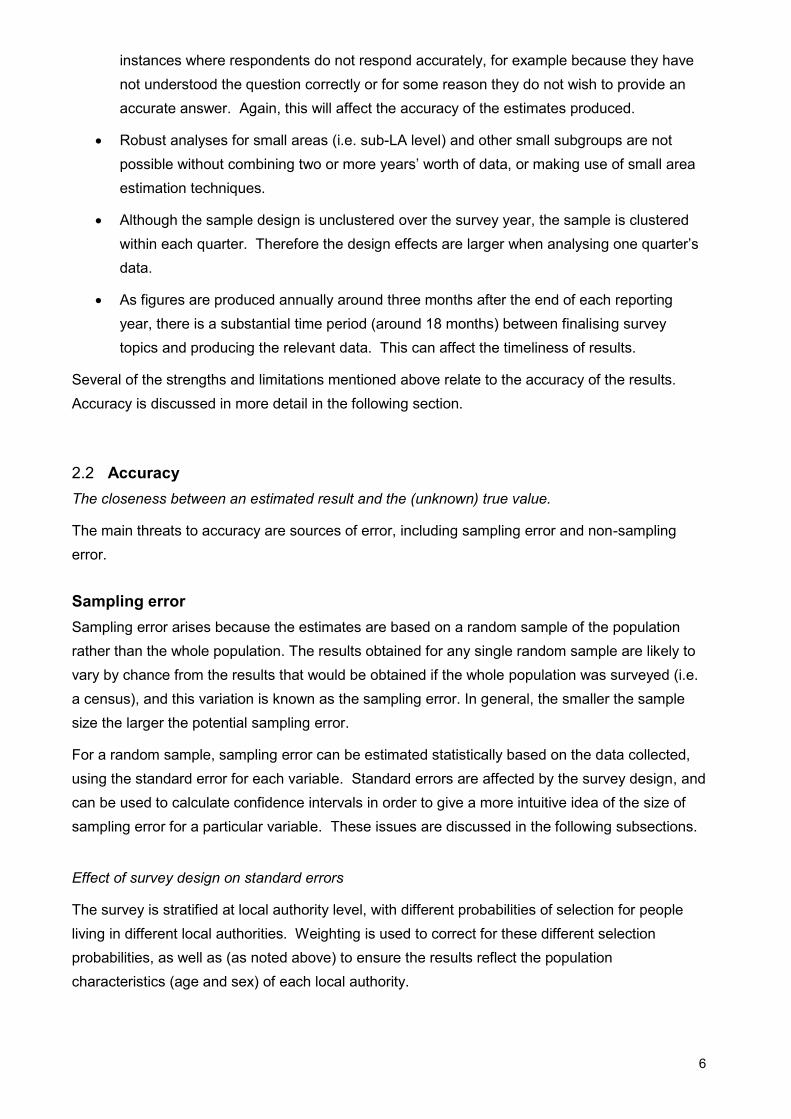
instances where respondents do not respond accurately, for example because they have
not understood the question correctly or for some reason they do not wish to provide an
accurate answer. Again, this will affect the accuracy of the estimates produced.
Robust analyses for small areas (i.e. sub-LA level) and other small subgroups are not
possible without combining two or more years’ worth of data, or making use of small area
estimation techniques.
Although the sample design is unclustered over the survey year, the sample is clustered
within each quarter. Therefore the design effects are larger when analysing one quarter’s
data.
As figures are produced annually around three months after the end of each reporting
year, there is a substantial time period (around 18 months) between finalising survey
topics and producing the relevant data. This can affect the timeliness of results.
Several of the strengths and limitations mentioned above relate to the accuracy of the results.
Accuracy is discussed in more detail in the following section.
2.2 Accuracy
The closeness between an estimated result and the (unknown) true value.
The main threats to accuracy are sources of error, including sampling error and non-sampling
error.
Sampling error
Sampling error arises because the estimates are based on a random sample of the population
rather than the whole population. The results obtained for any single random sample are likely to
vary by chance from the results that would be obtained if the whole population was surveyed (i.e.
a census), and this variation is known as the sampling error. In general, the smaller the sample
size the larger the potential sampling error.
For a random sample, sampling error can be estimated statistically based on the data collected,
using the standard error for each variable. Standard errors are affected by the survey design, and
can be used to calculate confidence intervals in order to give a more intuitive idea of the size of
sampling error for a particular variable. These issues are discussed in the following subsections.
Effect of survey design on standard errors
The survey is stratified at local authority level, with different probabilities of selection for people
living in different local authorities. Weighting is used to correct for these different selection
probabilities, as well as (as noted above) to ensure the results reflect the population
characteristics (age and sex) of each local authority.
7
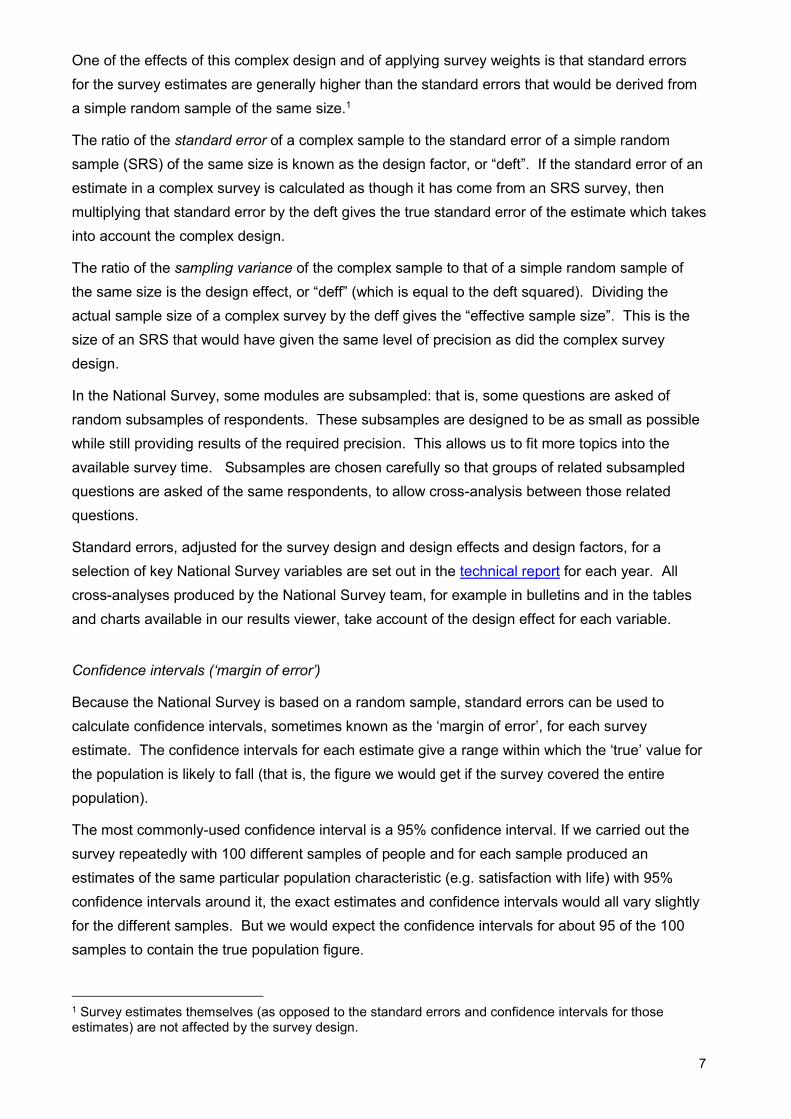
One of the effects of this complex design and of applying survey weights is that standard errors
for the survey estimates are generally higher than the standard errors that would be derived from
a simple random sample of the same size.1
The ratio of the standard error of a complex sample to the standard error of a simple random
sample (SRS) of the same size is known as the design factor, or “deft”. If the standard error of an
estimate in a complex survey is calculated as though it has come from an SRS survey, then
multiplying that standard error by the deft gives the true standard error of the estimate which takes
into account the complex design.
The ratio of the sampling variance of the complex sample to that of a simple random sample of
the same size is the design effect, or “deff” (which is equal to the deft squared). Dividing the
actual sample size of a complex survey by the deff gives the “effective sample size”. This is the
size of an SRS that would have given the same level of precision as did the complex survey
design.
In the National Survey, some modules are subsampled: that is, some questions are asked of
random subsamples of respondents. These subsamples are designed to be as small as possible
while still providing results of the required precision. This allows us to fit more topics into the
available survey time. Subsamples are chosen carefully so that groups of related subsampled
questions are asked of the same respondents, to allow cross-analysis between those related
questions.
Standard errors, adjusted for the survey design and design effects and design factors, for a
selection of key National Survey variables are set out in the technical report for each year. All
cross-analyses produced by the National Survey team, for example in bulletins and in the tables
and charts available in our results viewer, take account of the design effect for each variable.
Confidence intervals (‘margin of error’)
Because the National Survey is based on a random sample, standard errors can be used to
calculate confidence intervals, sometimes known as the ‘margin of error’, for each survey
estimate. The confidence intervals for each estimate give a range within which the ‘true’ value for
the population is likely to fall (that is, the figure we would get if the survey covered the entire
population).
The most commonly-used confidence interval is a 95% confidence interval. If we carried out the
survey repeatedly with 100 different samples of people and for each sample produced an
estimates of the same particular population characteristic (e.g. satisfaction with life) with 95%
confidence intervals around it, the exact estimates and confidence intervals would all vary slightly
for the different samples. But we would expect the confidence intervals for about 95 of the 100
samples to contain the true population figure.
1 Survey estimates themselves (as opposed to the standard errors and confidence intervals for those estimates) are not affected by the survey design.
8
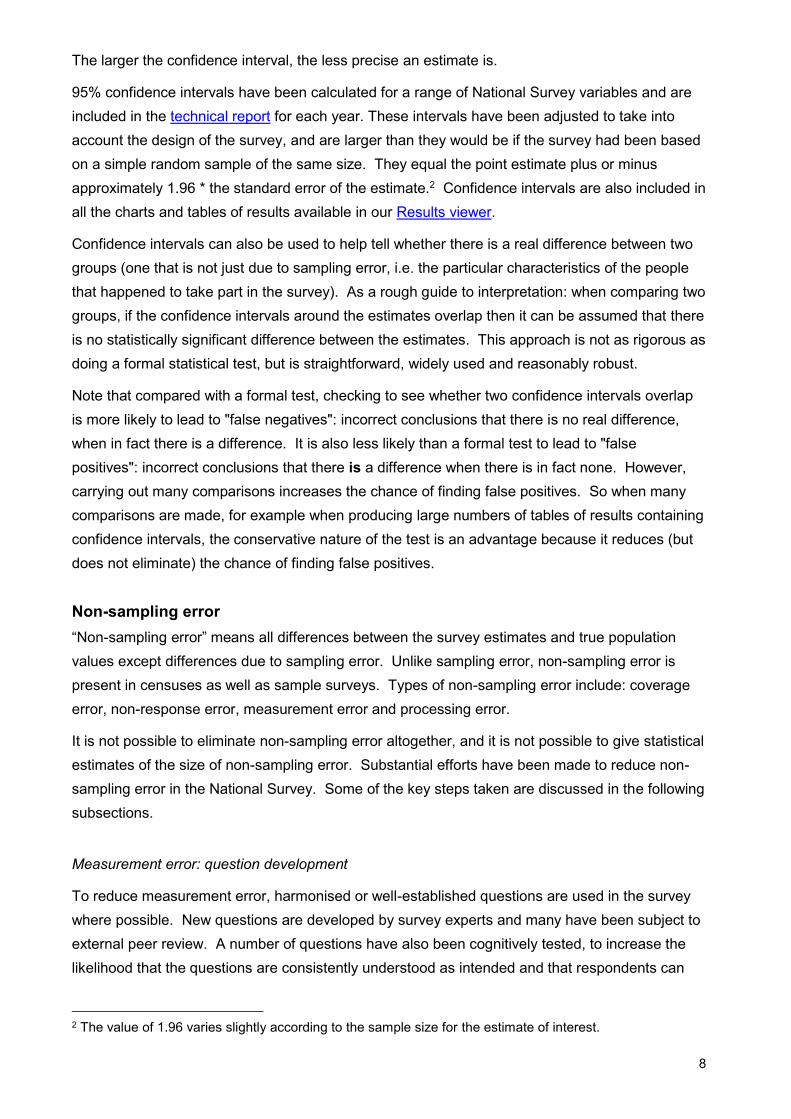
The larger the confidence interval, the less precise an estimate is.
95% confidence intervals have been calculated for a range of National Survey variables and are
included in the technical report for each year. These intervals have been adjusted to take into
account the design of the survey, and are larger than they would be if the survey had been based
on a simple random sample of the same size. They equal the point estimate plus or minus
approximately 1.96 * the standard error of the estimate.2 Confidence intervals are also included in
all the charts and tables of results available in our Results viewer.
Confidence intervals can also be used to help tell whether there is a real difference between two
groups (one that is not just due to sampling error, i.e. the particular characteristics of the people
that happened to take part in the survey). As a rough guide to interpretation: when comparing two
groups, if the confidence intervals around the estimates overlap then it can be assumed that there
is no statistically significant difference between the estimates. This approach is not as rigorous as
doing a formal statistical test, but is straightforward, widely used and reasonably robust.
Note that compared with a formal test, checking to see whether two confidence intervals overlap
is more likely to lead to "false negatives": incorrect conclusions that there is no real difference,
when in fact there is a difference. It is also less likely than a formal test to lead to "false
positives": incorrect conclusions that there is a difference when there is in fact none. However,
carrying out many comparisons increases the chance of finding false positives. So when many
comparisons are made, for example when producing large numbers of tables of results containing
confidence intervals, the conservative nature of the test is an advantage because it reduces (but
does not eliminate) the chance of finding false positives.
Non-sampling error
“Non-sampling error” means all differences between the survey estimates and true population
values except differences due to sampling error. Unlike sampling error, non-sampling error is
present in censuses as well as sample surveys. Types of non-sampling error include: coverage
error, non-response error, measurement error and processing error.
It is not possible to eliminate non-sampling error altogether, and it is not possible to give statistical
estimates of the size of non-sampling error. Substantial efforts have been made to reduce non-
sampling error in the National Survey. Some of the key steps taken are discussed in the following
subsections.
Measurement error: question development
To reduce measurement error, harmonised or well-established questions are used in the survey
where possible. New questions are developed by survey experts and many have been subject to
external peer review. A number of questions have also been cognitively tested, to increase the
likelihood that the questions are consistently understood as intended and that respondents can
2 The value of 1.96 varies slightly according to the sample size for the estimate of interest.
9
recall the information needed to answer them. Reports on this work are available on the National
Survey webpages.
Non-response
Non-response (i.e. individuals who are selected but do not take part in the survey) is a key
component of non-sampling error. Response rates are therefore an important dimension of
survey quality and are monitored closely. The annual minimum response rate for the National
Survey at national level is 56%
More details on response rates are given in the technical report for each year.
Categories of response include the following.
Successful interview – the respondent has answered all applicable questions.
Outright refusal – the household or respondent refuses to respond to the survey, and the
interviewer feels that there is no chance of an interview.
Office refusal – the respondent or someone else from the household contacts the
fieldwork contractor or the Welsh Government to refuse to participate in the survey
(usually in response to the advance letter).
Non-contact – the address is known to be occupied but it has not been possible to
contact any member of the household in the field period.
The response rate is the proportion of eligible addresses that yielded an interview, and is defined
as:
Completed interviews d
(Total sample – ineligible addresses)
Ineligible addresses are those that are found to be ineligible to take part in the survey. These are
addresses that were identified as being vacant, non-residential, or not occupied as a main
residence (e.g. holiday homes) as well as those coded by interviewers as inaccessible or that they
were unable to locate. It does not include addresses that have been called at a number of times
by interviewers but where no contact has been made, unless there is clear evidence that the
address is vacant or is not occupied as a main residence (e.g. by confirming this with neighbours).
The survey results are weighted to take account of differential non-response across age and sex
population subgroups, i.e. to ensure that the age and sex distribution of the responding sample
matches that of the population of Wales. This step is designed to reduce the non-sampling error
due to differential non-response by age and sex.
Missing answers
10
Missing answers occur for several reasons, including refusal or inability to answer a particular
question, and cases where the question is not applicable to the respondent. Missing answers are
usually omitted from tables and analyses, except where they are of particular interest (e.g. a high
level of “Don’t know” responses may be of substantive interest).
Measurement error: interview quality checks
Another potential cause of bias is interviewers systemically influencing responses in some way. It
it is likely, particularly in a face-to-face survey, that responses will still be subject to effects such
as social desirability bias (where the answer given is affected by what the respondent perceives to
be socially acceptable). Extensive interviewer training is provided to minimise this effect and
interviewers are also closely supervised, with up to 10% of interviews verified through 'back-
checking'.
The questionnaire is administered face-to-face using a Computer Assisted Personal Interviewing
(CAPI) / Computer Assisted Self Interviewing (CASI) script. This approach allows the interviewer
to tailor how questions are introduced to each respondent, for example by providing some
additional explanation where it is clear that the meaning is not understood by that respondent. To
help them do this, interviewers are provided with background information on some of the
questions at the interviewer briefings that take place before fieldwork begins. The script also
contains additional information where prompts or further explanations have been found to be
needed. CASI (i.e. self-completion) questions are used for particularly sensitive topics, to avoid
respondents feeling uncomfortable and to encourage honest responses on those topics.
Some answers given are included in the wording of subsequent questions or checks (e.g. the
names of children are added to questions on children’s schools). This helps prevent the
respondent (and interviewer) from becoming confused or losing their place in the questionnaire.
A range of logic checks and interviewer prompts are included in the script to make sure the
answers provided are consistent and realistic. Some of these checks are ‘hard checks’: that is,
checks used in cases where the respondent’s answer could not be correct based on other
information given by the respondent. In these cases the question has to be asked again, and the
response changed, in order to proceed with the interview. Other checks are ‘soft checks’, for
responses that seem unlikely but could be correct. In these cases the interviewer is prompted to
confirm with the respondent that the information is indeed correct.
Processing error: data validation
The main survey outputs are SPSS data files that are delivered on a regular basis. For each
fieldwork period, three main data files are provided:
An anonymised sample file, with fieldwork outcome, first impressions data, and geo-
demographic data for each address in the fieldwork period.
A household dataset, containing responses to the enumeration grid and any information
asked of the respondent about other members of the household; and
11
A respondent dataset, containing each respondent’s answers to the main questionnaire.
Each dataset is checked by the survey contractor. A set of checks on the content and format of
the datasets is then carried out by the Welsh Government and any amendments made by the
contractor before the datasets are signed off.
2.3 Timeliness and punctuality
Timeliness refers to the lapse of time between publication and the period to which the data refers.
Punctuality refers to the time lag between the actual and planned dates of publication.
The main reporting year for the survey is from April to March of the following year. A First
Release containing headline statistics for some key topics is published each June. The time
lapse between end of fieldwork and publication for each full set of results is therefore around
three months.
More detailed topic-specific reporting follows publication of the First Release each year.
All National Survey outputs are pre-announced on the Welsh Government’s Upcoming calendar
web pages, in line with the Code of Practice for Statistics.
Should the need arise to change the pre-announced release schedule, the Welsh Government’s
Revisions, Errors and Postponements process is followed, and a full explanation of the reasons
for the change is made available.
2.4 Accessibility and clarity
Accessibility is the ease with which users are able to access the data, also reflecting the format(s)
in which the data are available and the availability of supporting information. Clarity refers to the
quality and sufficiency of the metadata, illustrations and accompanying advice.
Publications
All reports are available to download from the National Survey webpages. The National Survey
web pages have been designed to be easy to navigate.
Statistics from the National Survey are pre-announced, and are published on the Welsh
Government website at 9.30am on the day of publication. All releases are available to download
without charge. An RSS feed alerts registered users to each publication. Simultaneously the
releases are also published on the National Statistics Publication Hub, and on StatsUserNet.
Outputs are announced and shared on the Welsh Government and #StatisticsWales Twitter
feeds.
Around 10,000 different charts and tables of results are available via an interactive results viewer.
For further information about the survey results, for example if you would like to see a different
breakdown of results, contact the National Survey team at [email protected] or on 03000 256
685.
12
Disclosure control
We take care to ensure that individuals are not identifiable from the published results. We follow
the requirements for confidentiality and data access set out in the Code of Practice for Statistics.
Quality assurance
Some weeks before publication, a draft version of each release is shared under restricted
conditions with relevant analytical colleagues, to ensure that the publication is clear, accurate, and
comprehensive.
Language requirements
We comply with the Welsh language standards for all our outputs. Our website, First Release and
Results viewer are published in both Welsh and English.
We aim to write clearly (using plain English or ‘Cymraeg Clir’ as appropriate).
UK Data Archive
An anonymised version of the annual dataset (from which some information is removed to ensure
confidentiality is preserved), together with supporting documentation, is deposited with the UK
Data Archive in the autumn after the publication of each year’s results. These datasets may be
accessed by registered users for specific research projects.
From time to time, researchers may wish to analyse more detailed data than is available through
the Data Archive. Requests for such data can be made to the National Survey team (see contact
details below). Requests are considered on a case by case basis, and procedures are in place to
ensure that confidentiality and data security are maintained.
Methods and definitions
The National Survey technical report for each year contains more detailed information on how the
survey is undertaken. It provides information on topics such as sampling, fieldwork procedures
and weighting. Each survey publication also contains a glossary with descriptions of more
general terms used in the output. An interactive question viewer and copies of the questionnaires
are available on our web pages.
2.5 Comparability and coherence
The degree to which data can be compared over both time and domain.
Throughout National Survey statistical bulletins and releases, we highlight relevant comparators
as well as information sources that are not directly comparable but provide useful context.
Comparisons with other countries
Wherever possible, survey questions are taken from surveys run elsewhere. This allows for some
comparisons across countries to be made (although differences in design and context may affect
comparability).

13
Comparisons over time
As noted above, up until 2015 the Welsh Government (WG) and its sponsored bodies conducted
five large-scale social surveys: the 2012-15 National Survey for Wales, Welsh Health Survey,
Active Adults Survey, Arts in Wales Survey, and Welsh Outdoor Recreation Survey. A review of
the way social surveys were carried out in Wales concluded that a viable approach was to bring
together the five surveys into a single National Survey, and this is the approach that has been
followed from 2016-17.
The new National Survey is longer than its predecessor surveys, and is carried out using a
different methodology than were some of those surveys. The characteristics of the original
surveys are set out in Table 1.
14
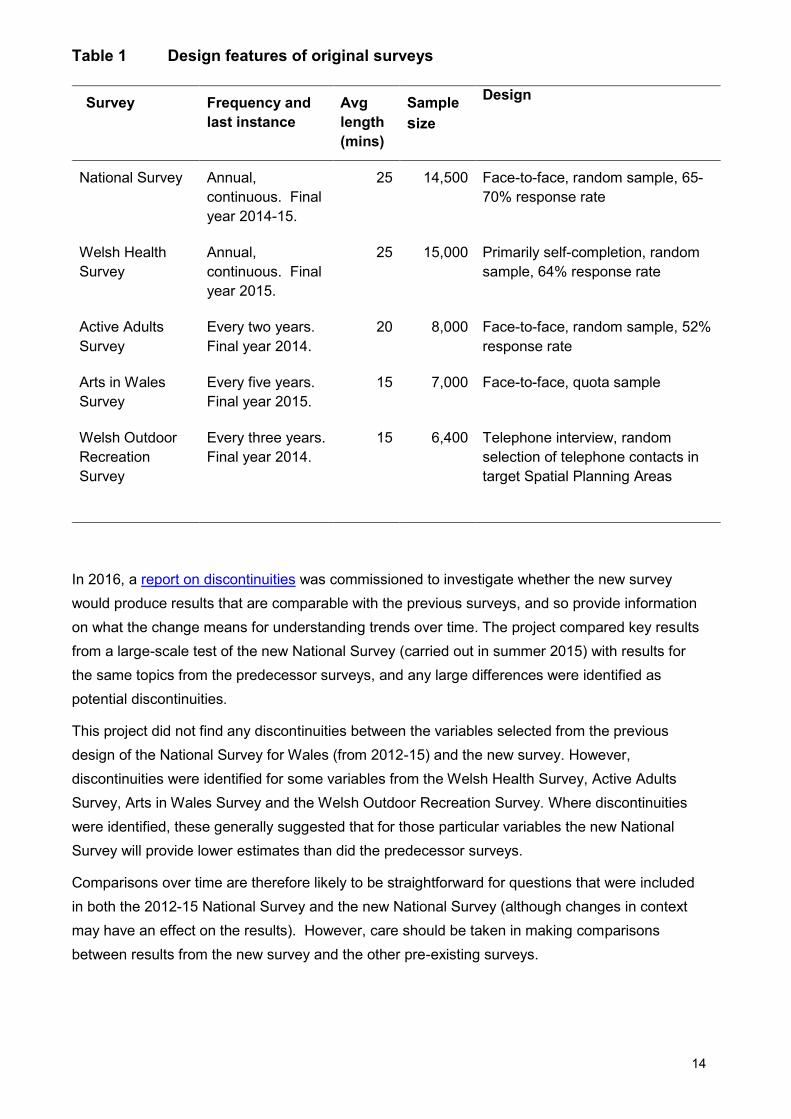
Table 1 Design features of original surveys
Survey Frequency and
last instance
Avg
length
(mins)
Sample
size
Design
National Survey Annual,
continuous. Final
year 2014-15.
25 14,500 Face-to-face, random sample, 65-
70% response rate
Welsh Health
Survey
Annual,
continuous. Final
year 2015.
25 15,000 Primarily self-completion, random
sample, 64% response rate
Active Adults
Survey
Every two years.
Final year 2014.
20 8,000 Face-to-face, random sample, 52%
response rate
Arts in Wales
Survey
Every five years.
Final year 2015.
15 7,000 Face-to-face, quota sample
Welsh Outdoor
Recreation
Survey
Every three years.
Final year 2014.
15 6,400 Telephone interview, random
selection of telephone contacts in
target Spatial Planning Areas
In 2016, a report on discontinuities was commissioned to investigate whether the new survey
would produce results that are comparable with the previous surveys, and so provide information
on what the change means for understanding trends over time. The project compared key results
from a large-scale test of the new National Survey (carried out in summer 2015) with results for
the same topics from the predecessor surveys, and any large differences were identified as
potential discontinuities.
This project did not find any discontinuities between the variables selected from the previous
design of the National Survey for Wales (from 2012-15) and the new survey. However,
discontinuities were identified for some variables from the Welsh Health Survey, Active Adults
Survey, Arts in Wales Survey and the Welsh Outdoor Recreation Survey. Where discontinuities
were identified, these generally suggested that for those particular variables the new National
Survey will provide lower estimates than did the predecessor surveys.
Comparisons over time are therefore likely to be straightforward for questions that were included
in both the 2012-15 National Survey and the new National Survey (although changes in context
may have an effect on the results). However, care should be taken in making comparisons
between results from the new survey and the other pre-existing surveys.
15
Where there is a continuing demand to make comparisons over time, topics will be included in
future years of the new National Survey. As the survey proceeds, this will largely address issues
of comparability over time.
3. Feedback or further information
If you have would like further information please visit our website, or contact us on
03000 256 685 or at [email protected]. We welcome comments from users of the survey, for
example on the content and presentation of our publications.
Chris McGowan
National Survey team
Knowledge and Analytical Services
Welsh Government
Cathays Park
Cardiff CF10 3NQ
Document last reviewed: July 2020