Embed Size (px)
Citation preview

Understanding SRU Student EngagementPatterns of Evidence
National Survey of Student Engagement (NSSE)
2008 NSSE

NSSE Presentation Overview
What is student engagement?
What do we already know about student engagement?
Why is student engagement important?
What is the NSSE?
National Survey of Student Engagement
What are some highlights from SRU’s NSSE results?
How can we use the NSSE results to improve our institutional efforts to improve student engagement?

What is Student Engagement?
Represents several important aspects of collegiate quality:
Academic Engagement
• The amount of time and effort students put into their studies and other meaningful academic activities
• How the institution deploys resources and organizes its curriculum and other learning opportunities
Social and Personal Engagement
• The amount of time and effort students involve themselves in social activities (clubs, organizations, honoraries, athletics, recreation, fraternities/sororities, community service, etc.)
Correlates with student learning and retention

The Student Engagement Trinity
What students do – time and energy devoted to educationally purposeful activities
What institutions do – using effective educational practices to induce students to do the right things
Educationally effective institutions channel student energy toward activities that matter

What Really Matters in College: Student Engagement
“The research is unequivocal: students who are actively involved in both academic and out-of-class activities gain more from the college experience than those who are not so involved.”
Pascarella & Terenzini. (2005). How college affects students: A third decade of research. San Francisco: Jossey-Bass Publishers, 2005

Why a national survey to measure student engagement?
Refocuses conversations about undergraduate quality to what matters most
Assesses students’ engagement in educational practices associated with high levels of learning and personal development
Enhances institutional improvement efforts
Fosters comparative & consortium activity
Informs accountability
Provides systematic national data on “good educational practices”

NSSE Project Scope
More than 1,200 different colleges/universities
50 states, Puerto Rico, & Canada
Data from more than 1,520,470 students
Institutions include Historically Black College and Universities, Hispanic Serving Institutions, Tribal Colleges, and all female and all male colleges
Year Colleges/
Universities
2000 276
2001 321
2002 366
2003 437
2004 473
2005 529
2006 557
2007 610
2008 774

What Does The College Student Report Cover?
Student Behaviors in College
Institutional Actions And Requirements
Student Reactions to College
Student BackgroundInformation
Student Learning & Development

Description of SRU NSSE Results – “Excel File”
Comparison of SRU Results to Carnegie Classification Peers
A Longitudinal Comparison of SRU Means from 2003 to 2008
Comparison of SRU Results to PASSHE Institutional Group
Benchmark Comparisons
Longitudinal Comparison of BCSSE to NSSE Results
Multi-Year SRU Benchmark Comparisons
PASSHE Consortium Additional Questions
Level of Academic Challenge
Active & Collaborative Learning
Student Faculty Interaction
Enriching Educational Experiences
Supportive Campus Environment

Mean Comparisons
Means, statistical
significance and effect
sizes

What Have We Learned About College Student Engagement from the NSSE?
How often do our students make class presentations?
First-Year SeniorsSRU 2008 – 2.43
SRU 2006 – 2.32
PASSHE 2008 – 2.32
Carnegie - 2.33
NSSE – 2.27
SRU 2008 – 3.04
SRU 2006 – 2.99
PASSHE 2008 – 2.90
Carnegie - 2.87
NSSE – 2.80
1-never, 2-sometimes, 3- often, & 4- very often
Sample
Middle States Accreditation Standards – 11, 12, 14

What Have We Learned About College Student Engagement from the NSSE?
Worked with other students on projects during class?
First-Year SeniorsSRU 2008 – 2.63
SRU 2007 – 2.54
PASSHE - 2.44
Carnegie – 2.44
NSSE – 2.41
SRU 2008 – 2.72
SRU 2007 – 2.73
PASSHE – 2.58
Carnegie – 2.60
NSSE – 2.52
1-never, 2-sometimes, 3- often, & 4- very often
Sample
Middle States Accreditation Standards – 11, 12, 14

What Have We Learned About College Student Engagement from the NSSE?
How often have our students worked with faculty members on activities other than coursework (committees, orientation, student life activities, etc.) as compared with other institutions nationally?
SeniorsSRU – 1.71 *
Masters – 1.53
NSSE 2003 – 1.56
SRU – 2.36 *
Master’s – 1.79
NSSE 2003 – 1.85
1-never, 2-sometimes, 3- often, & 4- very often
Sample
First-Year SeniorsSRU 2008 – 1.96
SRU 2007 – 1.76
PASSHE - 1.63
Carnegie – 1.63
NSSE – 1.65
SRU 2008 – 2.08
SRU 2007 – 1.98
PASSHE - 2.00
Carnegie – 1.80
NSSE – 1.84
Middle States Accreditation Standards – 9, 10, 11, 14

What Have We Learned About College Student Engagement from the NSSE?
How often have our students participated in community-based project (service learning) as part of a regular course?
SeniorsSRU – 1.71 *
Masters – 1.53
NSSE 2003 – 1.56
SRU – 2.36 *
Master’s – 1.79
NSSE 2003 – 1.85
1-never, 2-sometimes, 3- often, & 4- very often
Sample
First-Year SeniorsSRU 2008 – 1.78
SRU 2007 – 1.59
PASSHE - 1.56
Carnegie – 1.57
NSSE – 1.60
SRU 2008 – 2.04
SRU 2007 – 1.97
PASSHE - 1.77
Carnegie – 1.76
NSSE – 1.74
Middle States Accreditation Standards – 9, 11, 14
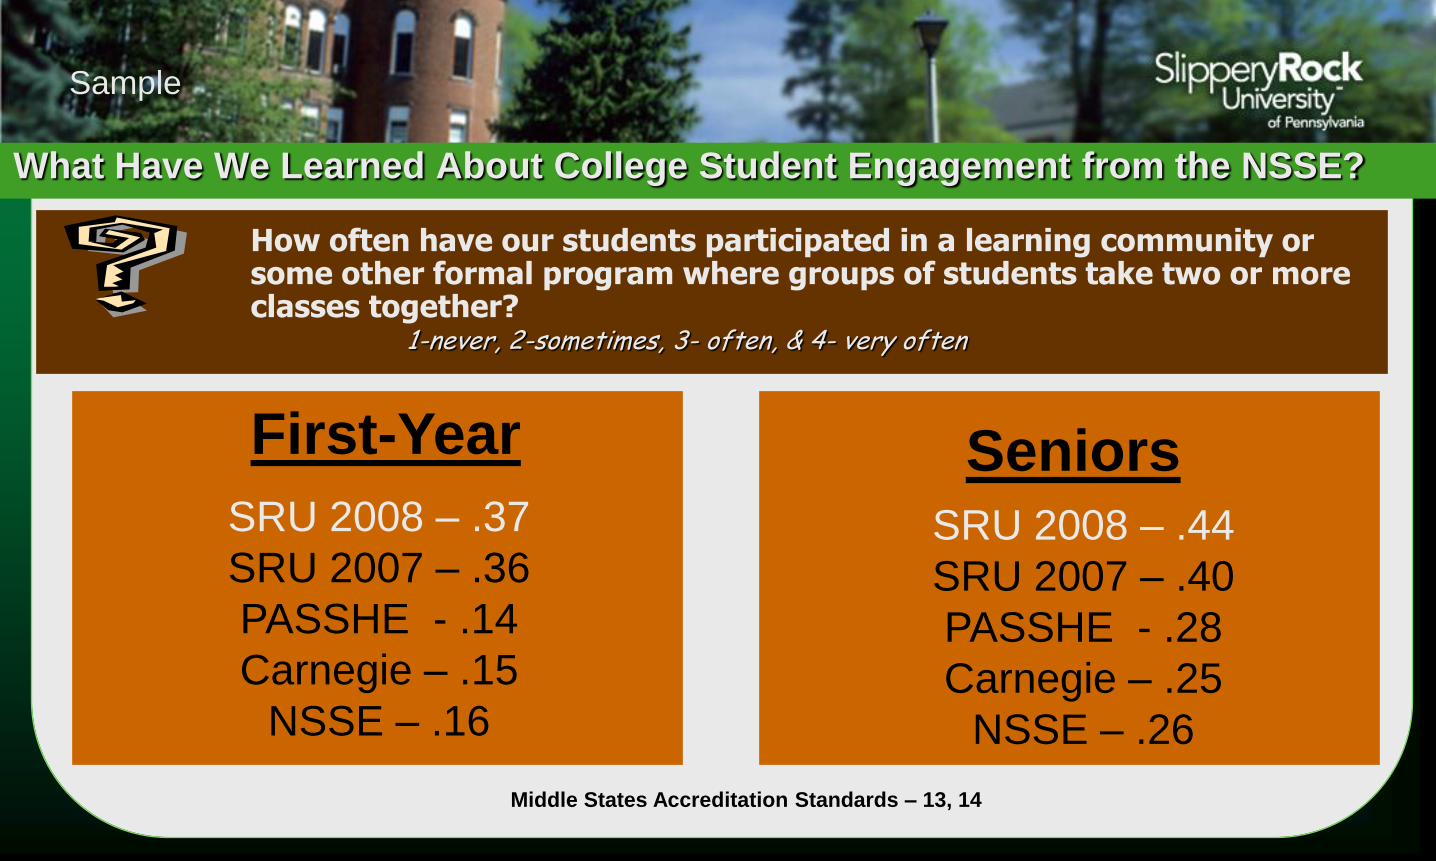
What Have We Learned About College Student Engagement from the NSSE?
How often have our students participated in a learning community or some other formal program where groups of students take two or more classes together?
SeniorsSRU – 1.71 *
Masters – 1.53
NSSE 2003 – 1.56
SRU – 2.36 *
Master’s – 1.79
NSSE 2003 – 1.85
1-never, 2-sometimes, 3- often, & 4- very often
Sample
First-Year SeniorsSRU 2008 – .37
SRU 2007 – .36
PASSHE - .14
Carnegie – .15
NSSE – .16
SRU 2008 – .44
SRU 2007 – .40
PASSHE - .28
Carnegie – .25
NSSE – .26
Middle States Accreditation Standards – 13, 14

Mapping Results to Middle States Accreditation

Level of Academic Challenge
Active and Collaborative Learning
Student Faculty Interaction
Enriching Educational Experiences
Supportive Campus Environment
Effective Educational Practices – Benchmark Groupings

NSSE - Benchmark ComparisonsThe Benchmark Comparisons report compares the performance of SRU with our PASSHE institutions, Carnegie Peers, and all 2008 institutions.
To focus discussions on the importance of student engagement and guide institutional improvement efforts, NSSE created five clusters or “benchmarks” of effective educational practice:
Level of Academic challenge – including the number and length of written reports, hours spent studying and preparing for class, reading requirements, and the need to synthesize and organize ideas (SRU FR Means were higher than PASSHE Institutions and Carnegie Peers).
Active and collaborative learning – including working with other students inside and outside class, participating in class discussions, making presentations, tutoring, and community-based projects. (SRU FR and SR Means were higher than PASSHE Institutions and Carnegie Peers).
Student-faculty interaction – including faculty feedback, working with faculty on research projects and other activities, and discussing assignments and career plans with faculty. (SRU FR and SR Means were higher than PASSHE Institutions and Carnegie Peers).
Enriching educational experiences – including interaction with students of diverse economic, social, and racial backgrounds, community service and volunteer work, learning communities, internships, practicum, field work, independent study, and culminating senior experiences. (SRU FR and SR Means were equal to or higher than PASSHE Institutions and Carnegie Peers).
Supportive campus environment – including how campuses help students cope with non-academic responsibilities like work and family, the quality of relationships with faculty, administration, and other students, and the presence of social supports. (SRU FR and SR Means were higher than PASSHE Institutions and Carnegie Peers).

Benchmark Comparisons
Analysis mirrors Means report

NSSE 2008 SRU Benchmark Comparisons– First Year Students
Statistically Significant

NSSE 2008 SRU Benchmark Comparisons– Seniors
Statistically Significant

Multi-Year Benchmark Comparisons

NSSE 2008 SRU Multi-Year Benchmark Report – First Year Students
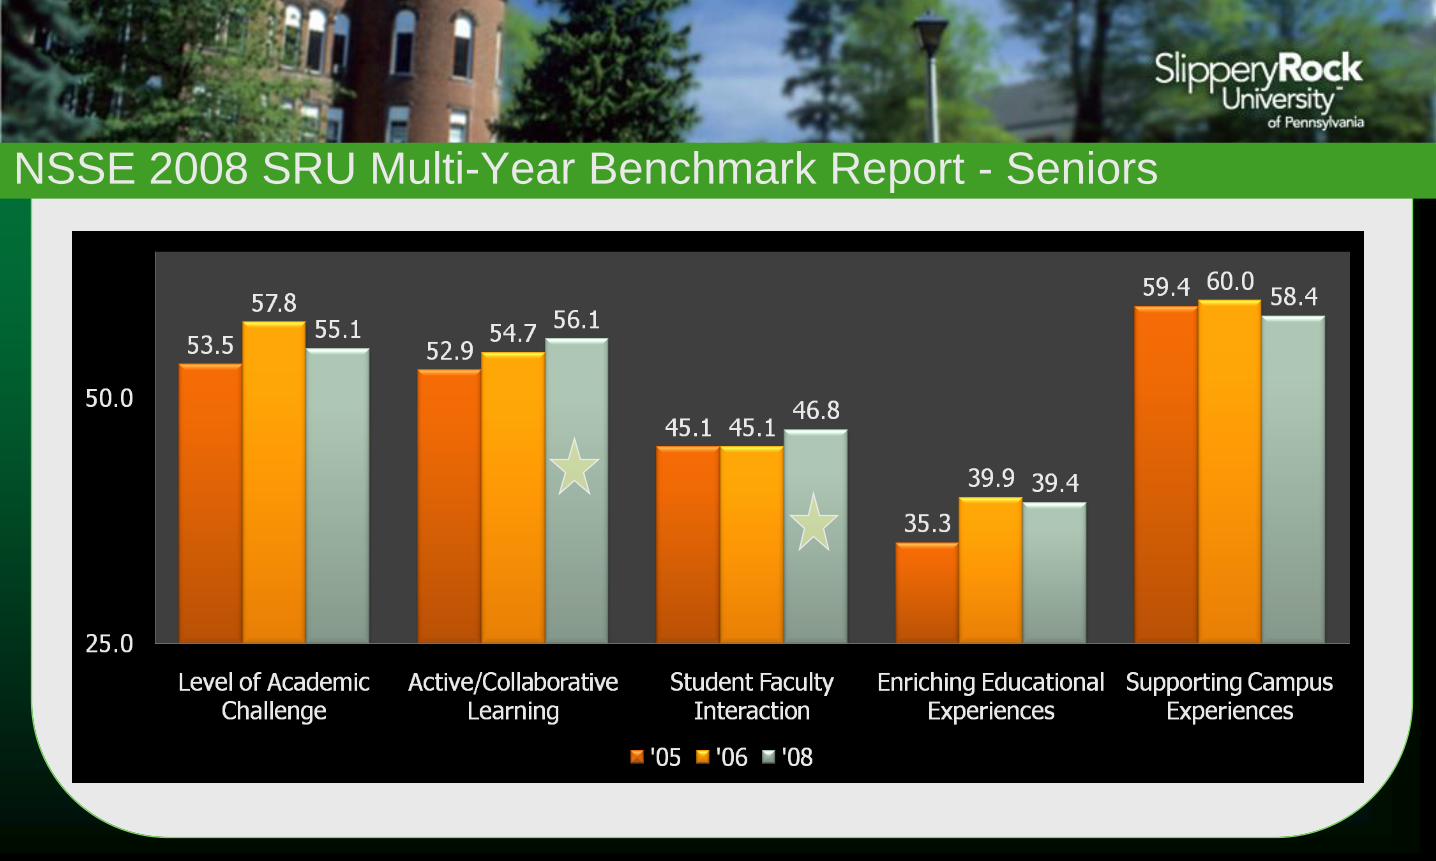
NSSE 2008 SRU Multi-Year Benchmark Report - Seniors

BCSSE – NSSE Results

BCSSE – NSSE Results

PASSHE Additional Questions
1. In the current school year, about how often have you: SRU PASSHE Sig M Diff
1a.Used a web-based course management system to
access the course syllabus, notes or assignmentsFY 3.27 3.26 .01
SR 3.35 3.19 ** .18
1b. Taken a course that was offered on-lineFY 1.28 1.30 -.02
SR 1.56 1.46 .11
1c.Participated in a research project supervised by a faculty
memberFY 1.83 1.56 *** .33
SR 1.85 1.73 .12
1d. Attended a university athletic eventFY 2.51 2.20 *** .31
SR 2.02 1.93 .09
1e.
Participated in a community-based project (e.g., service
learning) as part of an organized university or student
government project (not through a course)
FY 2.06 1.65 *** .45
SR 1.90 1.76 * .14
1f.
Had meaningful conversations with a faculty member or
administrator of a different race or ethnicity than your
own
FY 2.03 1.90 .13
SR 2.22 2.13 .08
1g.Had a conversation regarding personal and academic
ethics with a faculty member or residence hall staffFY 2.12 1.95 * .18
SR 2.12 2.09 .04
1h.Had meaningful conversations with a person with a
disabilityFY 2.04 1.94 .11
SR 2.22 2.08 * .15
1i. Asked a librarian or library staff member for assistanceFY 2.09 1.96 * .15
SR 2.05 2.01 .04
1j.Discussed your learning style with your adviser or staff
memberFY 2.04 1.88 * .18
SR 2.02 1.98 .04

PASSHE Additional Questions Continued…1. In the current school year, about how often have you: SRU PASSHE Sig M Diff
1k.Discussed selection of academic majors, minors, or academic concentrations
with a faculty or staff memberFY 2.39 2.29 .12
SR 2.27 2.23 .04
11.Discussed career-related topics such as internships, resumes, and
references with a faculty or staff memberFY 2.21 1.96 *** .27
SR 2.67 2.58 .09
1m. Discussed your career plans with a faculty or staff memberFY 2.38 2.16 *** .24
SR 2.65 2.59 .06
2. During the current school year, how many times have you had:
2a. Assignments based on the work of minority author(s)FY 2.20 2.05 * .19
SR 1.97 1.98 -.02
2b. Assignments that addressed issues in countries other than the United StatesFY 2.36 2.20 * .16
SR 2.10 2.22 * -.11
3. As a student at your current institution, how often have you:
3a. Changed your majorFY 1.40 1.25 *** .31
SR 1.56 1.48 .11
3b. Changed graduation plans because courses were not available when neededFY 1.16 1.09 * .20
SR 1.52 1.50 .02
4. To what extent does your institution emphasize:
4a.A safe environment for students by providing features and services that
enhance safetyFY 3.12 3.12 .00
SR 2.98 2.90 .10
4b. A residential experience that facilitates adjustment to collegeFY 2.98 2.87 .12
SR 2.82 2.63 ** .20
4c. Diverse perspectives and global citizenshipFY 2.73 2.67 .06
SR 2.58 2.44 * .14

Using NSSE Data
Discover current levels of engagement (institution, major field, year in school)
Determine if current levels are satisfactory (criterion reference, normative or peer comparison)
Target areas for improvement
Modify programs and policies accordingly
Monitor institutional performance
Areas of
Effective
Educational
Practice
Areas for
Institutional
Improvement

Internal Campus Uses
Gauge status of campus priorities
Examine changes in student engagement between first and senior years
Assess campus progressover time
Encourage dialogue aboutgood practice
Link with other data to test hypotheses, evaluateprograms
Improve curricula, instruction, services
InstitutionalImprovement
LearningCommunities 1ST Year
and Senior Experience
AcademicAffairs
Middle-StatesAssessment
FacultyDevelopment
AcademicAdvising
PeerComparison
StudentLife
InstitutionalResearch
EnrollmentManagement
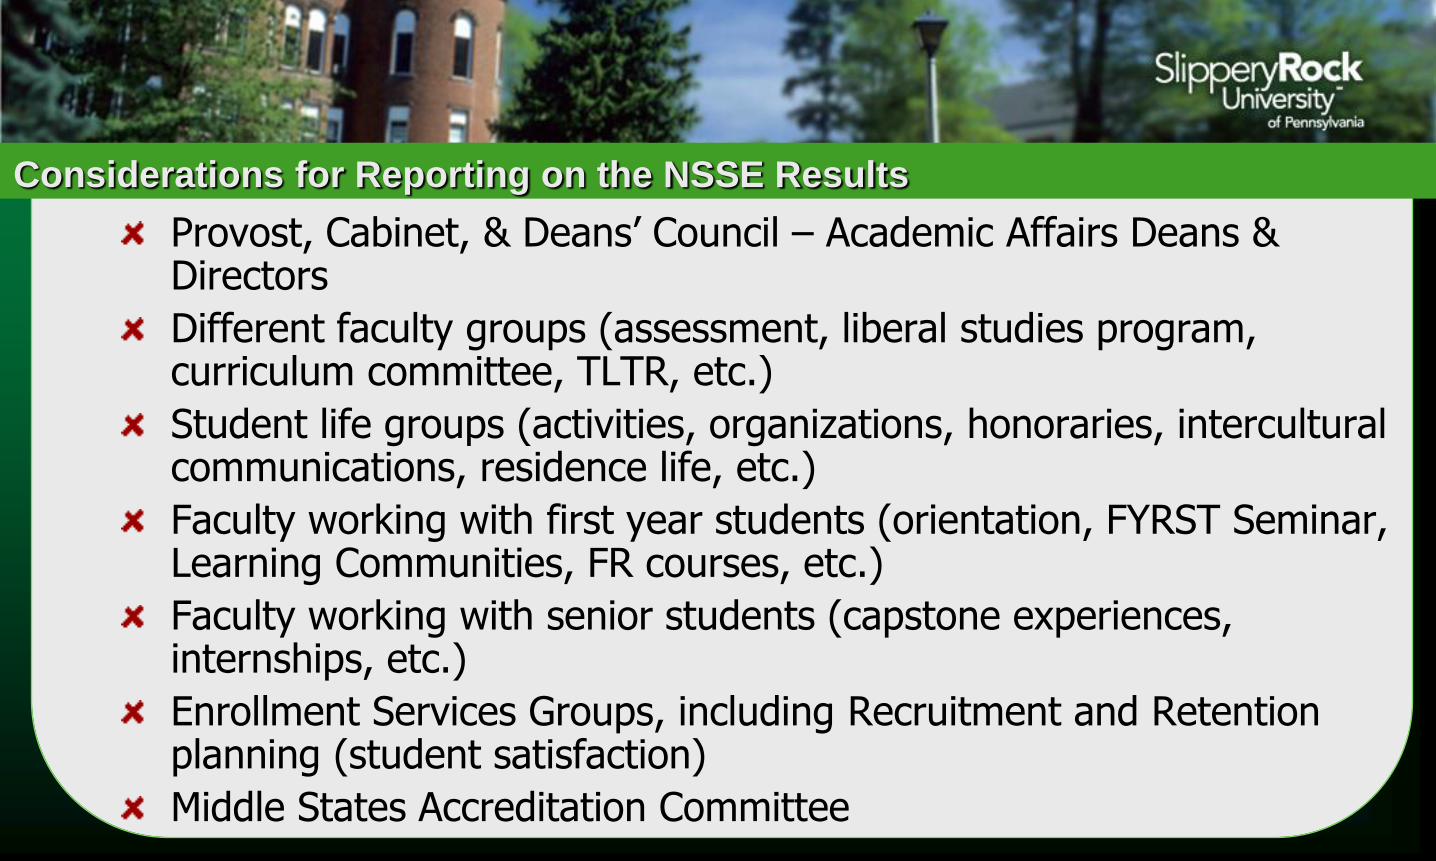
Considerations for Reporting on the NSSE Results
Provost, Cabinet, & Deans’ Council – Academic Affairs Deans & Directors
Different faculty groups (assessment, liberal studies program, curriculum committee, TLTR, etc.)
Student life groups (activities, organizations, honoraries, intercultural communications, residence life, etc.)
Faculty working with first year students (orientation, FYRST Seminar, Learning Communities, FR courses, etc.)
Faculty working with senior students (capstone experiences, internships, etc.)
Enrollment Services Groups, including Recruitment and Retention planning (student satisfaction)
Middle States Accreditation Committee
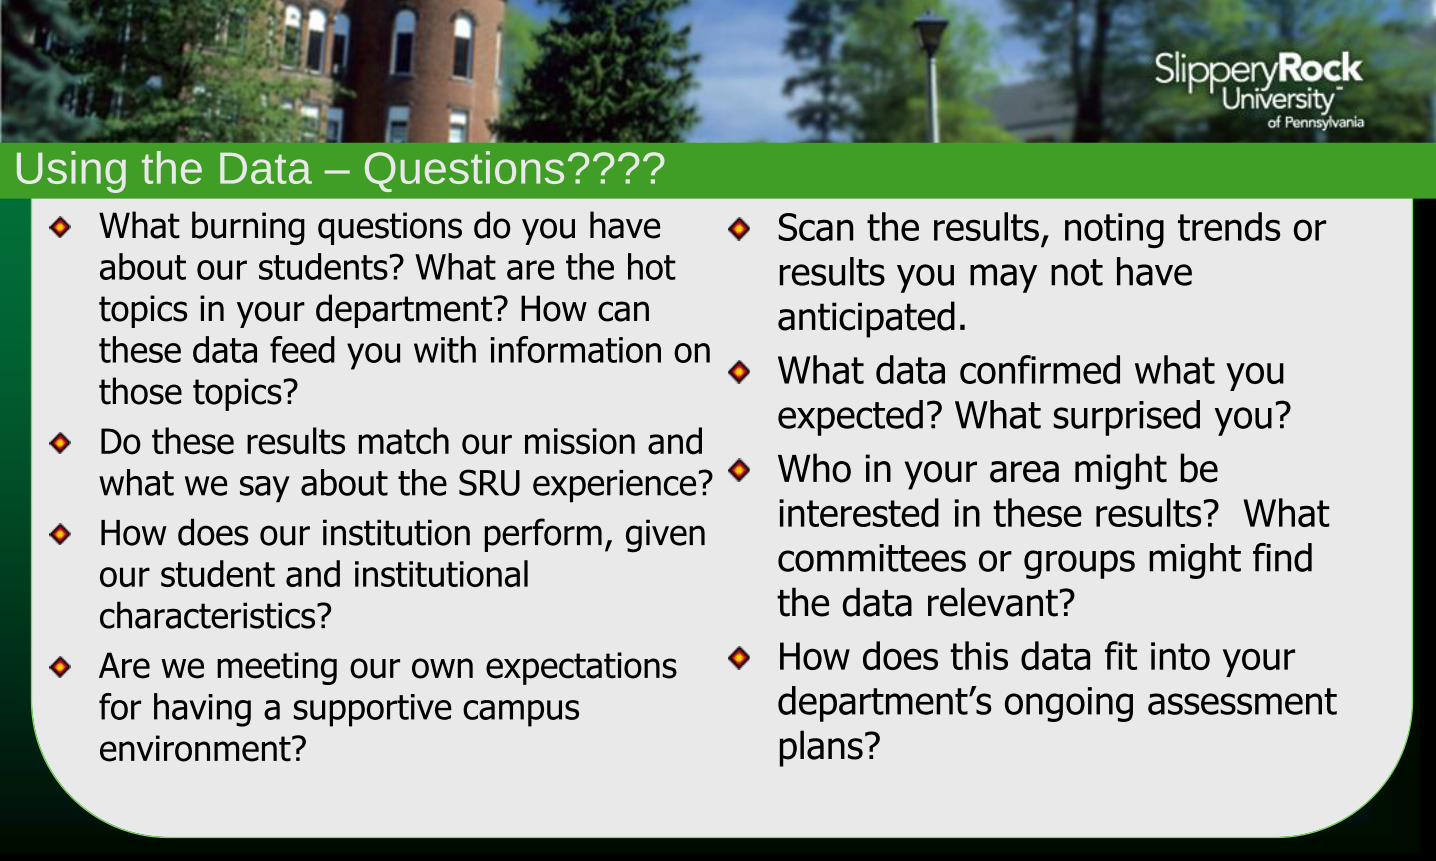
Using the Data – Questions????
What burning questions do you have about our students? What are the hot topics in your department? How can these data feed you with information on those topics?
Do these results match our mission and what we say about the SRU experience?
How does our institution perform, given our student and institutional characteristics?
Are we meeting our own expectations for having a supportive campus environment?
Scan the results, noting trends or results you may not have anticipated.
What data confirmed what you expected? What surprised you?
Who in your area might be interested in these results? What committees or groups might find the data relevant?
How does this data fit into your department’s ongoing assessment plans?
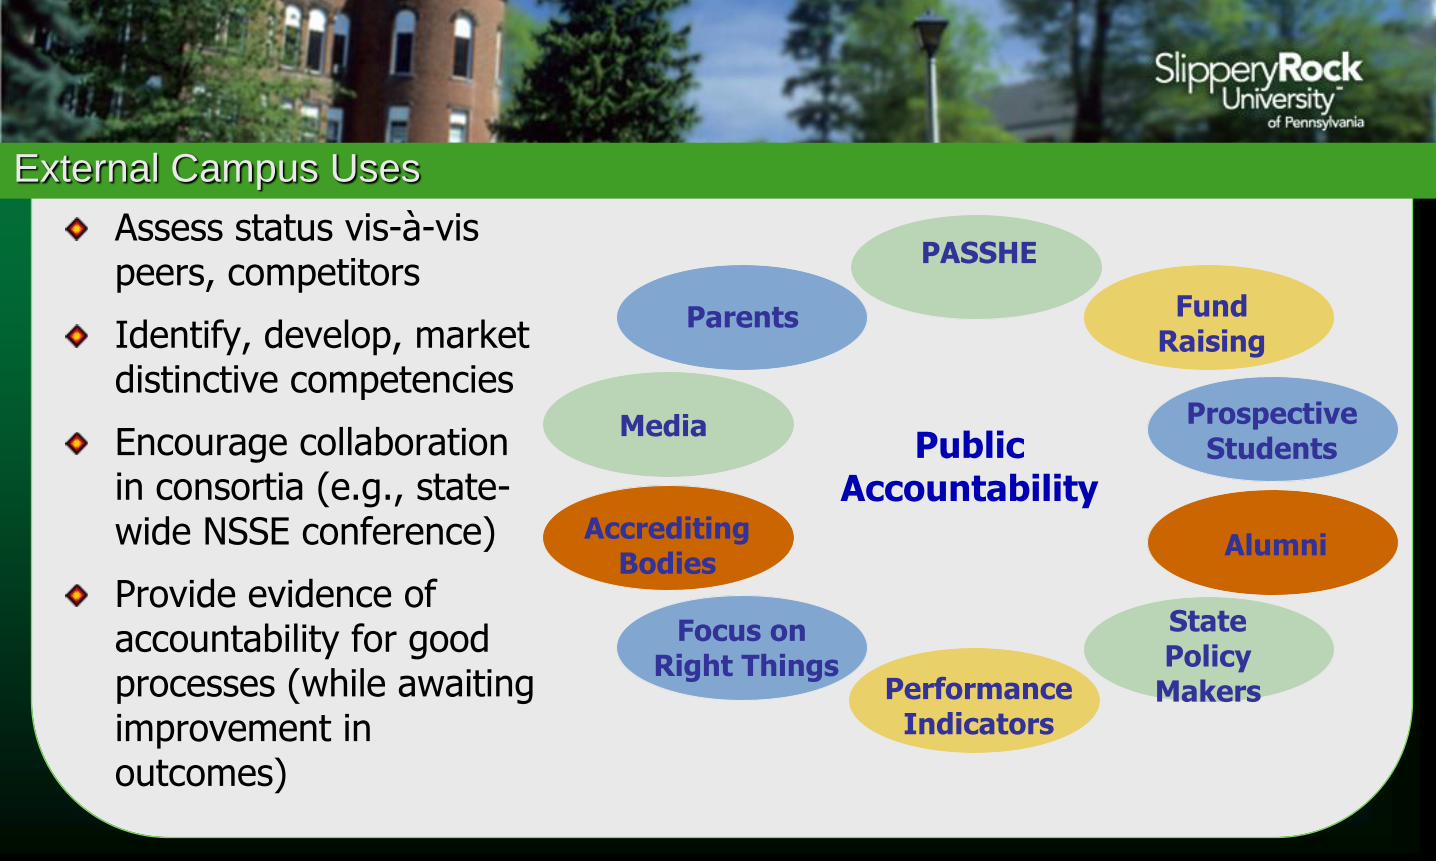
External Campus Uses
Assess status vis-à-vis peers, competitors
Identify, develop, market distinctive competencies
Encourage collaboration in consortia (e.g., state-wide NSSE conference)
Provide evidence of accountability for good processes (while awaiting improvement in outcomes)
PublicAccountability
FundRaising
PASSHE
ProspectiveStudents
Alumni
StatePolicy
MakersPerformanceIndicators
Focus on Right Things
AccreditingBodies
Media
Parents

Culture Matters!
Ultimately, it’s all about the culture…
Identify cultural properties that impede success
Expand the number of cultural practitioners on campus
Cultivate an ethic of positive restlessness
• “We know who we are and what we aspire to.”
• Confident, responsive, but never quite satisfied…
• Self-correcting orientation
• Continually questioning, “Are we performing as well as we can?” “How do we know?”

Staying the Course….
• The good-to-great-transformations never happened in one fell swoop. There is no single defining action, no grand program, no
one killer innovation, no solitary lucky break, no miracle moment. Sustainable transformations follow a predictable
pattern of buildup and breakthrough…
• Collins, 2001, p. 186

Questions and Discussion