Embed Size (px)
Citation preview
National Sustainable Development Strategies – What Future Role with Respect to Green Economy?
Andreas Endl & Michal Sedlacko
European Sustainable Development Network
UNCSD Side Event Policy Brief
June 2012
2
Authors:
Andreas Endl Michal Sedlacko
Contact:
ESDN Office at the Research Institute for Managing Sustainability Vienna University of Economics and Business Franz Klein Gasse 1, A-1190 Vienna, Austria E: [email protected] T: +43-1-31336-4807
© 2012 European Sustainable Development Network (ESDN)
Visit www.sd-network.eu for The European Sustainabel Development Network
Basic information on SD (ESDN) is an informal network of public administrators
Country profiles and other experts who deal with sustainable develop-
Quarterly reports ment strategies and policies. The network covers all
Policy briefs 27 EU Member States, plus other European countries.
Case studies The ESDN is active in promoting sustainable develop-
Conference papers ment and facilitating the exchange of good practices in
Workshop papers Europe and gives advice to policy-makers at the
Getting in touch with us European and national level. European and national level.
3
Contents
1. Introducti on . . . . . . . . . . . . . . . . . . . . . . . . . . . . . . . . . . . . . . . . . . . . . . . . . . . . . . . . . . . . . . . . . . . . . . . . . . . . . . . . . . . . . . . . . . . 4
2. The conceptual relationships between sustai nable development and green
economy .. . . . . . . . . . . . . . . . . . . . . . . . . . . . . . . . . . . . . . . . . . . . . . . . . . . . . . . . . . . . . . . . . . . . . . . . . . . . . . . . . . . . . . . . . . . . . . . . . . . . . 5
3. Recent international SD and green economy measurement initiatives . . . . . . . . . . 10
3.1. Sustainable development indicators and measurement systems .................. 11
3.2. European sustainable development indi cators .................................................. 13
3.3. The Rio+20 debate on global Sustainable Development Goals ...................... 14
3.4. The ‘GDP and Beyond’ initiative ............................................................................ 16
3.5. The Stig l i tz–Sen–Fitoussi Commission .................................................................. 16
3.6. The OECD Green Growth Strategy indicators ..................................................... 17
3.7. The UNEP Green Economy indicators ................................................................... 17
3.8. Europe 2020 and the measurement of i ts per formance .................................. 18
3.9. Insights into national measurement developments .......................................... 19
3.10. Translation of di fferences between concepts into competing
measurement approaches ................................................................................................... 21
4. Conclusions and recommendations . . . . . . . . . . . . . . . . . . . . . . . . . . . . . . . . . . . . . . . . . . . . . . . . . . . . . . . . . . 23
Annex I Eurostat SDIs . . . . . . . . . . . . . . . . . . . . . . . . . . . . . . . . . . . . . . . . . . . . . . . . . . . . . . . . . . . . . . . . . . . . . . . . . . . . . . . 28
Annex I I A short history of the EU Sustainable Development Strategy . . . . . . . . . . . . . 31
4
1. Introduction This policy brief aims to contribute to the UNCSD-related debate on the relationships between
sustainable development (SD) and green economy, and between the measurement and monitoring
systems in the form of indicator sets resulting from these two concepts. This policy brief has been
prepared in support of an UNCSD side event titled National Sustainable Development Strategies –
What Future Role with Respect to Green Economy?, taking place on 14 June 2012 in RioCentro, Rio
de Janeiro. The side-event referred to chapter IV, section D (Regional, national local institutional
framework for Sustainable Development) of the Zero Draft of the Rio+20 outcome document in
connection with chapter III regarding green economy strategies, measures and indicators. The goal
of the side event, as well as of this policy brief, is to contribute to an informed discussion, a
clarification of the role of national sustainable development strategies and sustainable development
monitoring systems in comparison to approaches for green economy, and to give an orientation for
actors on the national and local levels regarding the implementation of the Rio+20 outcomes on the
ground. This version of the text has been complemented by views, experiences and
recommendations from the side event.
The following, second section of this policy brief aims to shed more light on the relationships
between the concepts of sustainable development and the various ‘greening the economy’
concepts. The third section constitutes the main part of this policy brief and provides an overview of
the recent measurement initiatives which have or are taking place in the broader context of
sustainable on the international level (3.1–3.8), dealing both with indicator initiatives
operationalising the sustainable development concept (3.1–3.5) as well as the green economy or
green growth concepts (3.6–3.8). This section also provides some information on selected
measurement approaches towards sustainable development and green economy on the national
level, using the examples of Switzerland and Finland (3.9). Furthermore, it offers a comparison of
the described measurement approaches (3.10). The fourth section offers conclusions and
recommendations on the co-evolution or integration of sustainable development and green
economy measurement systems in light of the Rio+20 outcomes.
5
2. The conceptual relationships between sustainable development and green economy
Key messages:
Green economy can serve as a vehicle for sustainable development; the link to the “context of
sustainable development and poverty eradication” is sufficiently stressed in the UNCSD
outcome document.
Green economy is a very flexible concept with as of now unclear tools, models or policy
examples, embracing the somewhat contradictory agendas of support to international trade
and change of unsustainable consumption and production measures.
Green economy and
green growth are
controversial
concepts
The ways and means of measuring progress towards sustainable
development or, more specifically, prosperity or green economy, are closely
tied to the underlying concepts behind the measurement systems as well as
strategies for the concepts’ practical implementation. In this section we will
address the relationships between the concepts of sustainable development
and green economy or green growth, respectively.
The concepts of ‘green economy’ (a concept pioneered by UNEP and picked
up by the UNCSD process) and of ‘green growth’ (a concept promoted on the
international level by the OECD and the World Bank) have recently acquired
a lot of attention. These concepts respond to the recent economic crisis and
they can be understood in line with other initiatives for ‘restarting growth’
and addressing unemployment. Green economy and green growth attempt
to locate economic opportunities in the response to climate change and to
the increasing scarcities of natural resources, primarily through the means of
energy- and resource-saving technological innovation. Nevertheless, their
definitions are not settled1 and, prior to the Rio+20 summit, a number of
their aspects were considered to be controversial (and some remained so).
Some confusion is caused by the fact that these two concepts point in
slightly different directions: As understood by UNEP, the green economy
concept aims for a transition of the economy towards one that delivers
“improved human well-being and social equity, while significantly reducing
environmental risks and ecological scarcities” (UNEP 2010). The primary
means for this transition, as suggested by UNEP (2011), are green
investment, creation of green jobs, market creation (e.g. a global carbon
market, markets for ecosystem services), support of international trade, and
1 UNEP defines green economy as ‘one that results in improved human well-being and social equity, while significantly reducing
environmental risks and ecological scarcities (...) [i]n its simplest expression, a green economy can be thought of as one which is low
carbon, resource efficient and socially inclusive’.
6
circular economy. An explicit goal of a green economy is to combat poverty
and foster development of developing countries, which should follow a
different pathway from those of the developed countries. The Green Growth
Strategy by OECD (2011) is stating a different objective: to enable the
continuation of economic growth while incorporating natural capital into
how we think about and measure the economy. Its main means are placing
value on natural capital and considering natural capital as a factor of
production (i.e. primarily ensuring the pricing of pollution and resource use,
but also preventing risks stemming from resource scarcities and eliminating
perverse subsidies), with a continuing stress on innovation (which is needed
for pushing the boundary where trade-offs between environment and
economy become necessary) and competition. Furthermore, the Europe
2020 strategy, the ‘umbrella’ strategy of the European Union for the coming
years, has also a function of greening the economy: it is a “new strategy for
jobs and smart, sustainable and inclusive growth“ (EC 2011), with achieving
higher resource efficiency, ensuring jobs and tackling poverty among its key
priorities.
The main criticisms and controversies can be grouped into three areas –
perceived shortcomings of these concepts in the social dimension, the
uncertainties related to economic transformation, and the risks in shifting
political commitment. These concerns were voiced on the one hand in
reaction to the January version of the zero draft of The Future We Want, but
on the other hand there were concerns that the model underlying OECD’s
Green Growth Strategy would gain a considerable influence on the UNCSD
outcomes. In the following, we will briefly cover these concerns and to what
extent they turned out to be true.
The fears that the
green economy
concept might put the
development
aspirations of the
world’s poor in
danger proved to be
unfounded
Concerns have been raised about the lack of the social dimension (i.e. issues
related to gender, poverty, education, or equity) in the concepts of green
economy and green growth. Particularly the green growth concept might be
problematic from the perspective of poverty eradication, i.e. securing the
priority of needs of the world’s poor and the economic development of
developing countries.
During the last Prep Com it became quite clear that green economy as
understood by the Rio+20 process won’t be too heavily influenced by the
green growth concept. In the outcome document The Future We Want green
economy is explicitly understood “in the context of sustainable development
and poverty eradication”, and as one of the tools available to pursue
sustainable development in all its three dimensions. It should “contribute to
eradicating poverty as well as sustained economic growth, enhancing social
inclusion, improving human welfare and creating opportunities for
7
employment and decent work for all, while maintaining the healthy
functioning of the Earth’s ecosystems” (para. 56). Green economy is fully
consistent with all the Rio Principles, Agenda 21 and Johannesburg Plan of
Implementation.
Prior to the summit there were concerns of no clear recognition of the
different status of countries in terms of their stage of development.
Paragraph 58 of the outcome document stresses to “tak[e] into account [the
country’s] national circumstances, objectives, responsibilities, priorities and
policy space“, as well as to “take into account the needs of developing
countries, particularly those in special situations”.
Further fears were related to the possibility that green economy may make
developing countries less competitive, thereby endangering their
development goals. Examples would be measures potentially introduced by
developed countries such as environmental standards, ‘carbon tariffs’,
subsidies to energy-efficient production technology, or environmentally-
related conditionality on development assistance. The outcome document
makes clear that green economy should “avoid unwarranted conditionalities
on ODA and finance” and should not “constitute a means of arbitrary or
unjustifiable discrimination or a disguised restriction on international trade”
(para. 58).
There was also a concern that green economy will per se not address
precarious working conditions and ensure more decent, pro-poor and fair
jobs, and that the transition from the current state to a green economy
might not be just. Even though the concrete means for achieving a green
economy are not explicitly captured in the document, the guiding principles
of green economy which are present place emphasis on job creation
particularly for the most vulnerable societal floors, on the equipment of
workers with the right skills, on social protection floors and social and health
protection, and on welfare of smallholders and subsistence farmers, fishers,
as well as SME employees.
Green economy
should serve as a
vehicle for sustainable
development, yet it is
unclear what it’s
means should be
There are debates about whether a transformation of our economies is
requires for achieving sustainable development (even though it might not be
a sufficient condition), and whether green economy or green growth will be
able to deliver such a transition. There are fears that the stress on economic
growth might reinforce current global economic architecture and the neo-
liberal paradigm behind economic regulation, thereby not preventing the
reproduction of the current misallocation of capital, addressing prevailing
social inequalities, or addressing the vulnerabilities created by short-term
speculation on the financial markets. Thus long-term social objectives and
8
satisfaction of human needs might continue to be undermined. In this
respect, a number of questions have been raised: Are trade-offs between
environment and economic development going to be handled differently in
different stages of development? What is the role of free markets in a green
economy? Will green economy continue in the prevailing economic model
and lead further down the path of privatisation, deregulation, stress on
individual property rights and financial liberalisation? Will green economy be
able to address gender, social or race inequality, and the overconsumption of
the few as well as underconsumption of the majority?
The green growth concept reframes the dilemma between economic
development and protection of the environment in the language of
opportunities for medium-term economic growth, not quite acknowledging
the need for structural changes.
The outcome document is careful on the role of green economy for
transition towards sustainable development – even though it strongly
confirms this role, is does not make clear how this transition should come
about. Green economy is presented as a flexible approach (with toolboxes,
models or policy examples as of yet largely absent) which, on the one hand,
respects international trade, while on the other hand acknowledges the
fundamental necessity of making consumption and production patterns
more sustainable. Nevertheless, it also stresses preservation of and respect
for non-market approaches that contribute to the eradication of poverty, in
practice by various communities (para. 58), acknowledges the role of
cooperatives and microenterprises (para. 70), and emphasises welfare of the
most vulnerable societal groups.
Differences in
governance structures
exist between
implementing the
concepts of SD and
green economy
Another set of risks was perceived by the different governance arrangements
for the concepts of green economy and sustainable development. In Europe
sustainable development is typically coordinated by ministries of the
environment (that are struggling with decreasing political commitment for
sustainable development), but green economy initiatives are coordinated
primarily by ministries of economy and finance. In the ‘context of sustainable
development and poverty eradication’ green economy is supposed to serve
as a (narrower) short- to mid-term strategy for the implementation of
sustainable development. Ensuring that green economy will continue to be
part of mainstreaming of sustainable development rather than of
competition between different policy communities is a challenge that needs
to be met. Green economy must not jeopardise the political commitment for
the sustainable development concept; rather, it should reinvigorate it. Policy
integration between green economy and sustainable development strategies
will be a particular challenge; however, a lot of experience and cases of good
9
practice in institutional conditions for and processes of coordination of
sustainable development exists in Europe.
Divergence on
conceptual level
might lead to parallel
measurement
systems
Numerous recent initiatives and statements by a number of various
stakeholders stress the need to rethink what we mean by progress and how
we measure it, and one of the focal points of the discussion are the
shortcomings and uses of the GDP/GNP indicator. Nevertheless, the
potential competition between the wider concept of sustainable
development and the narrower and operational concept of green economy
might also be reproduced at the level of their measuring and monitoring,
such as in Europe between the Eurostat sustainable development indicators
and Europe 2020 headline indicators. The next section will take a look at the
recent measurement systems in the light of the described relationships
between the sustainable development and green economy concepts.
10
3. Recent international SD and green economy measurement initiatives
Key messages:
It is unclear whether newly emerging and already existing measurement systems or tools will
be integrated into SD measuring systems rather than existing in parallel, thus weakening
already existing SD measuring systems.
Green economy, green growth and Europe 2020 indicator sets emphasise environmental
performance of the economy, but they do not sufficiently cover a range of social and
environmental aspects, including international equity issues.
Sustainable Development Goals (SDGs) will probably not replace or extend the Millennium
Development Goals (MDGs), and it is unclear whether a separate measurement framework
focusing on development and following up on MDGs will continue to exist; the progress on
SDGs in Rio+20 has been rather limited.
The usage of gross
domestic product
(GDP) for measuring
progress, wealth and
prosperity of our
societies is
increasingly
questioned
The recent financial and economic crisis and the challenges posed by various
sustainable development issues (e.g. climate change, natural resource
consumption, poverty reduction, etc.) raised again interest in the arguments
questioning conventional approaches to economic growth and the emphasis
on the usage of gross domestic product (GDP) for measuring progress,
wealth and prosperity in our societies. In this context the concern of
measuring societal progress beyond economic growth is gaining momentum
through various initiatives at the international and national level. 2 This
section will take a closer look at the recent measurement initiatives related
to SD or green economy.
There is a range of
approaches to the
measurement of
societal progress,
sustainable
development and
well-being
Several broad approaches to measurement of SD, well-being and the
progress of societies in general are being tried out:
sets of sustainable development indicators (SDI) covering all three
pillars of SD and a number of issues such as biodiversity, poverty,
energy etc. – these sets are often comprised of a large number of
indicators prioritised into some kind of hierarchy
o a special sub-class are indicators aiming to supplement GDP
by extending the System of National Accounts to cover
additional types of assets (an example is natural capital
accounting)
comprehensive sustainability or well-being indices which try to
2 Also the Rio+20 outcome document The Future We Want calls for “broader measures of progress to complement GDP in order to better inform policy
decisions” (para. 38), and coordination on “methodologies for evaluation of policies of green economy in the context of sustainable development and poverty eradication“ (para. 66), acknowledges the importance of integrating evaluation of a range of social, environmental and economic factors into decision making (para. 63), as well as initiates a process of development of Sustainable Development Goals (SDGs) and of a corresponding measurement and monitoring system (paras. 245–251).
11
integrate a number of indicators into a single unit-less number or
ranking which facilitate communication with the public but tend to
‘hide’ specificities (examples are the Sustainable Society Index or the
Human Development Index)
o a special sub-class are indicators which attempt to translate
a range of sustainability issues into a single number using the
perspective of material flows (an example is the ecological
footprint indicator)
o a special sub-class are indicators which attempt to translate
a range of sustainability and well-being issues into monetary
units, thereby enabling adjustment of the GDP indicator (an
example is the Index of Sustainable Economic Welfare/
Genuine Progress Indicator)
3.1. SD indicators and measurement systems
The origin and
purpose of SDIs: A
brief history
Among some of the most prominent documents with regard to the global
development process on sustainable development indicators are the
resolutions adopted at the United Nations Earth Summit in Rio de Janeiro
1992: the Rio Declaration, which lays down the basic principles governing the
conduct of nations and placing human beings at the centre of concerns, and
Agenda 21, which illustrates the concrete measures and steps needed for the
transition to sustainable development. Moreover, a third major UN
conference on issues of environment and development, the World Summit
on Sustainable Development in Johannesburg held in 2002, was held in order
to review the progress – by means of sustainable development indicators
(SDI) – made towards achieving sustainable development and the
implementation of Agenda 21. The UN Commission on Sustainable
Development (UNCSD) has stated that “such indicators are needed to
increase focus on sustainable development and to assist decision-makers at
all levels to adopt sound national sustainable development policies” (Agenda
21, chapter 40). Thus from the outset, the focus of sustainable development
indicators has been with the twofold purpose of awareness-raising and
supporting political decision-making.
Agenda 21 calls for
the development and
use of sustainable
development
indicators
Chapter 40 of Agenda 21 called for countries and the international
community to “[…] develop the concept of indicators of sustainable
development in order to identify such indicators. […]” (para. 40.6) and
furthermore “[…] should use a suitable set of sustainable development
indicators […]” (para. 40.7). Following this call, the OECD in 1994 presented a
set of environmental indicators in the so-called ‘Pressure-State-Response’
(PSR) framework. The indicators reflected major environmental
12
preoccupations and challenges in the OECD countries and were classified
into (i) indicators of environmental pressures (‘Pressure’), (ii) indicators of
environmental conditions (‘State’) and (iii) indicators of societal responses
(‘Response’) (OECD, 2003). Although the PSR-framework, originating from
environmental statistics, shows clear limitations when being tied to SD, it
was further adopted by various organizations such as the UNCSD and the
European Environmental Agency (EEA).
UNCSD and Eurostat
together developed a
set of SDIs
In 1996, the UNCSD – collaborating with Eurostat since 1993 – proposed a
set of 134 SDIs in the Driving force-State-Response framework, linked to the
thematic chapters of the Agenda 21. In connection to this SDI set, the UNCSD
launched an international testing programme aimed at advancing the
understanding, development and use of SDIs by governments. 22 countries
covering all regions of the world participated in the testing programme,
including seven EU Member States (Austria, Belgium, Czech Republic,
Finland, France, Germany and the UK). In addition, Eurostat and a number of
countries not officially participating in the testing were affiliated with the
programme. The results of this testing phase were discussed at the
International Workshop on CSD Indicators of Sustainable Development held
in Barbados in December 1999. An important conclusion was that “indicators
have to be adapted to country specific conditions and requirements due to
different priorities and circumstances in each country. Consequently, the
testing phase ultimately led to a revision of the UNCSD SDI set (i.e. 59 core
indicators), resulting in a smaller but more policy-relevant set of SDIs
(UNCSD, 2001; Eurostat, 2011).
Furthermore, the Johannesburg Plan of Implementation, (see Chapter X),
and the UNCSD at its 11th and 13th sessions encouraged further work on
indicators for sustainable development by countries, in line with their
specific conditions and priorities. CSD-13 invited the international
community to support efforts of developing countries in this regard.
Taking a similar course, the OECD has been working on the measurement of
SD since the 1980s. Efforts with collaboration of national and international
bodies have been made to explore various options for measuring sustainable
development in this respect (OECD, 1998, 2000). In the follow-up to the Rio
Earth Summit, the OECD continued work on indicators and in 1997 identified
sustainable development as one of the five priority areas for future work
(OECD, 2001).
More recently in 2009, OCED, UNECE and Eurostat collaborated in a joint
Task force to pursue the work on sustainable development indicators based
on the capital approach. In this regard, the OECD contributes to this work
mainly through a project on the measurement of human capital based on the
13
life-time income approach (OECD, 2010a).
3.2. European Union’s sustainable development indicators
In 2001 the EU started
the process of
developing indicators
on sustainable
development
As a response to the Gothenburg European Council meeting and the first EU
SDS (for a short note on the history of the EU SDS see Annex 6.1), in 2001 a
task force was established to develop a common response from the
European Statistical System to the need for a set of EU indicators on
sustainable development (European Sustainable Development indicators -
EU SDI). The result of an extensive testing programme was the replacement
of the DSR framework elaborated by the UN by one focusing on themes and
sub-themes of SD (Pintér et al., 2005; UNCSD, 2001). This new approach was
taken up by the European Commission when designing a “framework for
indicators based on themes and sub-themes, which are directly linked to EU
policy priorities” (European Commission, 2005).
The indicators are
derived from
principles and
objectives of the EU
SDS
In this regard it was decided that the framework of indicators should be
derived from the intended use. This view was consistent with the overall
principles of the Rio 1992 Earth Summit and the Johannesburg conference
2002 to assist policy makers and inform their decision making. Therefore, the
indicators are derived from the principles and objectives of the EU SD
strategy and are organised thematically.
The EU SDI set
comprises different
themes and levels of
indicators, and
reflects the objectives
of the EU SDS
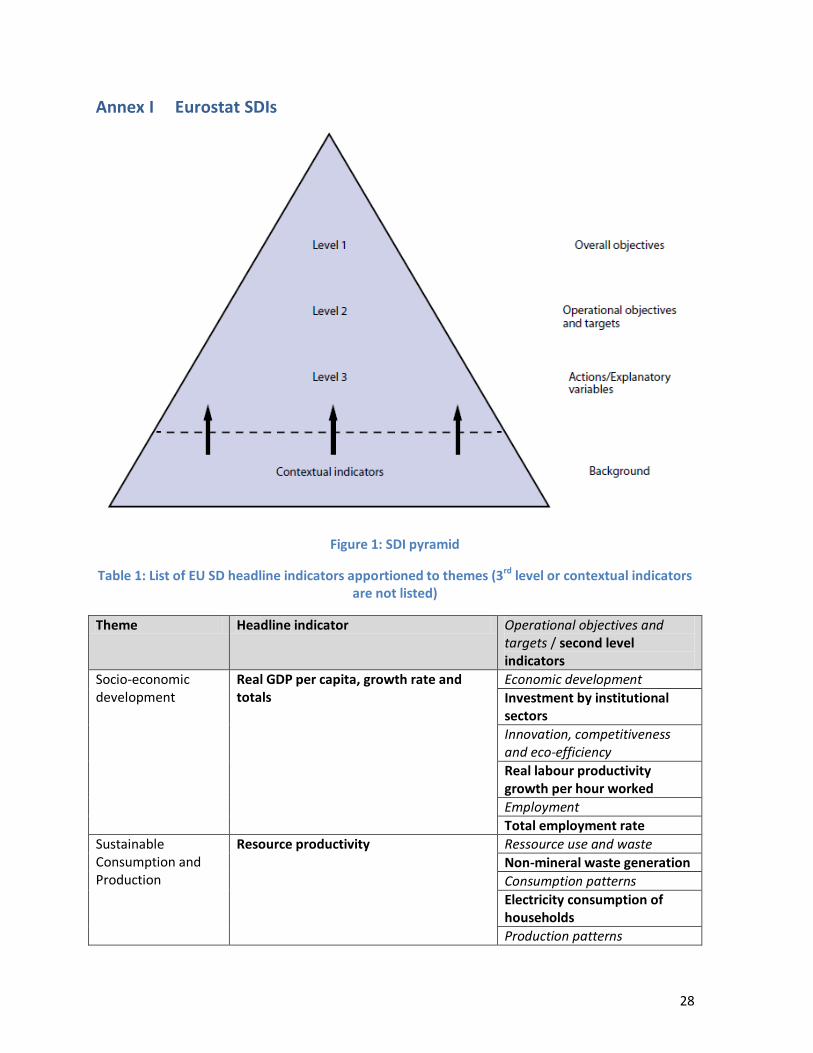
The set of EU SDIs is structured as a three-storey pyramid (see Annex),
distinguishing between three levels of indicators. This approach not only
reflects the structure of the EU SDS (overall objectives, operational
objectives, actions), but also responds to different kinds of user needs. The
three-level pyramid is complemented with contextual indicators. The
Commission, with the assistance of the working group on SDIs, constantly
reviews the situation regarding the development of appropriate indicators,
so as to further improve the relevance of the set of indicators. The current
set of indicators (for list of indicators please refer to the Annex) follows a
gradient from the economic, through the social and environmental to the
global and institutional dimensions (headline indicators of the corresponding
theme are listed in brackets):
• socioeconomic development (Growth rate of real GDP per capita),
• sustainable consumption and production (Resource productivity),
• social inclusion (People at-risk-of-poverty or social exclusion),
• demographic changes (Employment rate of older workers),
• public health (Healthy life years and life expectancy at birth),
• climate change and energy (Greenhouse gas emissions, Share of
14
renewable energy in gross final energy consumption),
• sustainable transport (Energy consumption of transport relative to
GDP),
• natural resources (Common bird index, Fish catches taken from stocks
outside safe biological limits),
• global partnership (Official development assistance as share of gross
national income),
• good governance (No headline indicator).
Each theme is further divided into subthemes to organise the set according
to the operational objectives and actions of the EU SDS.
The review of the EU
SDS led to a review of
the SD measuring
system
The initial set of SDIs was endorsed by the European Commission in February
2005. To remain in line with political priorities and emerging issues,
EUROSTAT has undertaken a review of the 2005 EU SDI set in 2006-2007.
This review followed three objectives (European Commission, 2007):
Adjust the SDI set adopted in 2005 to the renewed EU SD strategy;
Streamline the set of indicators in order to improve communication
whilst maintaining the maximum stability of the set over time;
Improve the overall quality of the set, taking into account recent
statistical developments.
The revised EU SDI set was published in October 2007 in the annex to the
Commission Staff Working Document accompanying the first EU SDS
progress report. It represents the state of the art of SDIs at the EU level.
However, efforts are undertaken by EUROSTAT to continuously revise the
indicator set and improve the quality of data collection methods of existing
indicators.
3.3. The Rio+20 debate on global Sustainable Development Goals 3
Global Sustainable
Development Goals
(SDGs) meant to be a
framework for the
post-MDG period
An initiative to establish Sustainable Development Goals (SDGs) through the
Rio+20 process had the aim to ‘complement and strengthen the Millennium
Development Goals (MDGs) in the development agenda for the post-2015
period’ (January version of the zero draft), indeed use the concept
sustainable development as the framework for post-2015 development
agenda. The current MDG framework focuses specifically on development
issues of developing countries, with the environmental theme playing only a
relatively minor role of enabling conditions and does not fully cover
emerging or urgent issues such as climate change, energy security, resilience
3 A more detailed coverage can be found in the June 2012 ESDN quarterly report The Rio+20 Conference 2012: Objectives, processes and outcomes.
15
or disaster preparedness, one of the possible forms of the upcoming SDGs
was to address shortcomings and challenges of the MDGs and broaden their
goals to reflect other SD objectives. Similarly to MDGs, they were supposed
to be a set of political targets as well as a set of indicators (complementing
GDP in measuring well-being and integrating economic, social, and
environmental dimensions) and mechanisms for their monitoring and
reporting. Development of SDGs was to ensure wide political and policy
appeal and to focus attention, particularly in the post Rio+20 phase, on
monitoring the implementation of Rio+20 outcomes. At the same time, SDGs
would need to be sufficiently rigorous to provide a valuable basis for decision
making, especially at the national level, and should be of use to the national
policy community. SDGs were supported by a number of stakeholders,
including the European Environmental and Sustainable Development
Advisory Councils, United Nations Secretary-General’s High-level Panel on
Global Sustainability, the UNCSD Stakeholder Forum, a number of
governments and UN agencies (such as, UNDESA and UNEP),4 and their
adoption was expected to be one of the key criteria for measuring success of
UNCSD.
Relevance of MDGs
reconfirmed
The outcome document The Future We Want has a whole section on SDGs.
Nevertheless, the continuing relevance of MDGs is stressed throughout the
whole outcome document, and SDGs “should not divert focus or effort from
the achievement of the Millennium Development Goals” (para. 246).5 In that
light it seems improbable that SDGs would fully replace MDGs or their
follow-up initiatives (the UN Development Agenda beyond 2015).
Initiation of SDGs
development in the
outcome document
The announced SDGs “should address and incorporate in a balanced way all
three dimensions of sustainable development and their inter-linkages” and
serve “as a driver for implementation and mainstreaming of sustainable
development in the United Nations system as a whole” (para. 246). The UN
commits to initiate a process on the development and establishment of
SDGs, primarily through the work of an open working group of thirty
representatives, nominated by Member States through the five UN regional
groups (para. 248). The SDGs process should be coordinated with the post-
2015 development agenda. There is, however, no clear timeline or agreed
themes for SDGs.
The role of The outcome document also expresses the recognition that “progress
4 See also the options articulated in the Declaration of the 64th Annual UN DPI/NGO Conference (2011), Chair’s Text. Sustainable
Societies; Responsive Citizens (http://www.uncsd2012.org/rio20/index.php?page=view&nr=273&type=230&menu=38) and in Rio+20: Sustainable Development Goals (SDGs). A Proposal from the Governments of Colombia and Guatemala (Ministerio de Relaciones
Exteriores, Republica de Colombia, 2011). 5 See also the “Insights from the Informal Consultations on the SDG Proposal,” Bogota, Colombia, 4-5 November 2011.
16
measurement and
monitoring tools
confirmed in the
outcome document;
their integration still
unclear
towards the achievement of the goals needs to be assessed and
accompanied by targets and indicators while taking into account different
national circumstances, capacities and levels of development” (para. 250).
Consequently, monitoring and measurement of SD will comprise an
important element in the UNCSD follow-up. Also, the issue of measurement
cannot be dealt with through SDGs alone. A discussion on this issue is
reflected also in the outcome document (paras. 28, 63, 66, and 245–251).
Nevertheless, there is a risk that green economy initiatives will aim to
develop a measurement and monitoring system separate from the current
SD indicator initiatives and thus duplicate measurement efforts – and it is
also possible that the post-2015 UN development agenda will result in
another set of development indicators.
3.4. The ‘GDP and Beyond’ initiative
Complementing GDP
with other indicators
to provide a more
comprehensive
picture on progress in
social, economic and
environmental
domains
The most important initiatives at the European level is the European
Commission’s Communication “GDP and beyond” of 2009 which is based on
the debates and follow-up activities of the high-level conference “Beyond
GDP” that took place in November 2007 and was hosted by the European
Commission, the European Parliament, the Club of Rome, OECD and WWF.
The communication “GDP and beyond” does not aim to replace GDP, but to
complement it with other top-level indicators in order to provide a more
accurate view of progress in social, economic and environmental domains.
This measurement framework is also linked to the “Europe 2020” strategy.
Most recently, “Beyond GDP” initiated a debate at the EU Council of
Ministers and corresponding council conclusions underline the importance to
“use, and where necessary develop and agree on, indicators that
complement GDP and contribute to a more accurate picture of the inter-
linkages between the environmental, economic and social aspects of wealth,
welfare and well-being” (Council of the European Union, 2012).
3.5. The Stiglitz–Sen–Fitoussi Commission
The commission gives
recommendations to
the potential and
limits of GDP and
quality of life
measurement
The Stiglitz-Sen-Fitoussi Commission has been established in early 2008 on
the initiative of the former French President, Nicolas Sarkozy, and has
delivered its final report in autumn 2009. The report opened a discussion
which has since been taken up on the national and international level and,
moreover gives recommendations on the following topics: (1) limits and
potential of GDP as indicator, (2) quality of life and, (3) sustainable
17
development and environment.
3.6. The OECD Green Growth Strategy indicators
The indicator set is
structured around
four groups to
monitor green
growth:
(1) Environmental and resource productivity, (2) natural asset base, (3) Environmental quality of life, (4) Economic opportunities and policy responses
The Green Growth Strategy aims to identify policies that would promote
both economic efficiency and environmental integrity, while ensuring social
equity. The Strategy guides government intervention across broader green
growth policy areas and focuses on four environmental areas: 1) climate
change, 2) biodiversity and quality of eco-systems, 3) use of natural
resources, and 4) materials management (OECD, 2010b). Besides a policy
framework and an expanded growth accounting model, the OECD developed
green growth indicators which measure progress over time and across
countries, making it a practical tool for policymakers. The indicators are
embedded in a conceptual framework, which is structured around four
groups to capture the main features of green growth:
Environmental and resource productivity, to indicate whether economic
growth is becoming greener with more efficient use of natural capital and
to capture aspects of production which are rarely quantified in economic
models and accounting frameworks;
The natural asset base, to indicate the risks to growth from a declining
natural asset base;
Environmental quality of life, to indicate how environmental conditions
affect the quality of life and wellbeing of people;
Economic opportunities and policy responses, to indicate the
effectiveness of policies in delivering green growth and describe the
societal responses needed to secure business and employment
opportunities.
3.7. The UNEP Green Economy indicators
A framework for
indicators acts as a
advisory service on
green economy and is
clustered around
three areas
(1) Green
transformation of key
sectors and the
economy,
The UNEP-led Green Economy Initiative, launched in 2008, provides analysis
and guidance to countries on policy reforms and investments to achieve a
green transformation of key sectors of the economy.
As part of the Initiative, a framework for assessing progress in moving
towards a green economy is being developed. This framework on indicators
and metrics, which will present options to governments and other
stakeholders, will form part of the advisory services on green economy
offered to governments by UNEP.
18
(2) Decoupling and
Efficiency,
(3) Aggregate
indicators of progress
and well-being
The framework for green economy indicators comprises three principal
areas:
“Green transformation of key sectors and the economy” focusing on
investments in a green transformation of various sectors of the economy,
and their associated share in output and employment.
“Decoupling and Efficiency” assessing resource efficiency and
productivity, and the decoupling of economic activity from resource use
and related environmental impacts, at both sector and economy-wide
levels, building on the work of the International Resource Panel.
“Aggregate indicators of progress and well-being” referring to various
initiatives on overall measures of economic progress and well-being,
including poverty alleviation and natural capital depreciation.
3.8. Europe 2020 and the measurement of its performance
The Europe 2020
Strategy was
developed in
response to the
economic crisis and its
main orientation is
green growth
The “Europe 2020” Strategy – intended as successor of the Lisbon Strategy –
will focus on “new sustainable social market economy, a smarter, greener
economy, where our prosperity will come from innovation and from using
resources better, and where the key input will be knowledge” (European
Commission, 2009b).
Economic growth in the “Europe 2020” strategy is still seen as the only
mechanism bringing our economies out of the crisis and offsetting
unemployment. But there is a clear shift on the focus of the strategy to a
low-carbon or green economy based on knowledge and new environmentally
friendly technologies, by creating new job opportunities such as green jobs
and meeting the environmental and climate goals and guaranteeing more
social inclusion.
The Europe 2020
Strategy combines
priorities and
headline targets with
its main instruments
the Flagship initiatives
The Europe 2020 Strategy is organised around a thematic approach focusing
on the themes identified combining priorities and headline targets with the
main instrument being the Europe 2020 programme and its seven flagship
initiatives. Although the Europe 2020 Strategy and its Flagships include – to
varying degrees – sustainable development, their main orientation is
towards economic growth and an increase in employment; environmental
issues are included but generally serve an economic purpose.
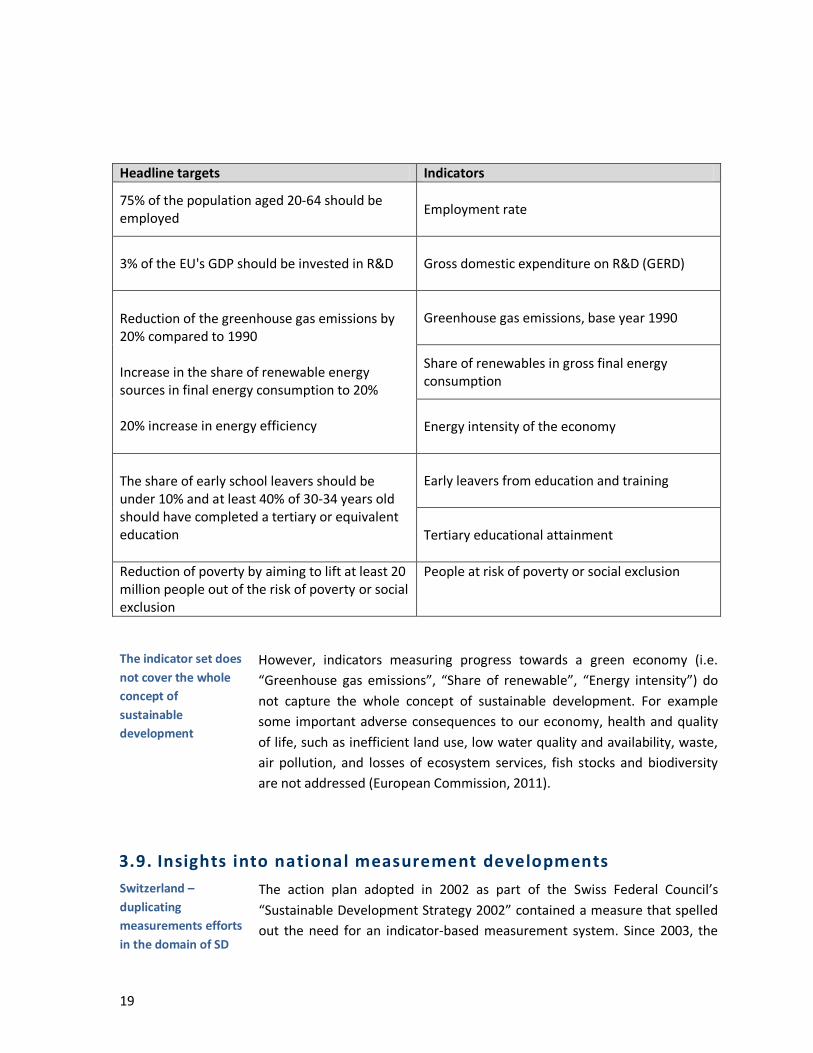
Five EU headline targets are to be achieved by 2020 which “are
representative of the three priorities of [the strategy] (…) but they are not
exhaustive” (ibid.). These five EU headline targets are currently measured by
eight headline indicators:
19
Headline targets Indicators
75% of the population aged 20-64 should be employed
Employment rate
3% of the EU's GDP should be invested in R&D Gross domestic expenditure on R&D (GERD)
Reduction of the greenhouse gas emissions by 20% compared to 1990 Increase in the share of renewable energy sources in final energy consumption to 20% 20% increase in energy efficiency
Greenhouse gas emissions, base year 1990
Share of renewables in gross final energy consumption
Energy intensity of the economy
The share of early school leavers should be under 10% and at least 40% of 30-34 years old should have completed a tertiary or equivalent education
Early leavers from education and training
Tertiary educational attainment
Reduction of poverty by aiming to lift at least 20 million people out of the risk of poverty or social exclusion
People at risk of poverty or social exclusion
The indicator set does
not cover the whole
concept of
sustainable
development
However, indicators measuring progress towards a green economy (i.e.
“Greenhouse gas emissions”, “Share of renewable”, “Energy intensity”) do
not capture the whole concept of sustainable development. For example
some important adverse consequences to our economy, health and quality
of life, such as inefficient land use, low water quality and availability, waste,
air pollution, and losses of ecosystem services, fish stocks and biodiversity
are not addressed (European Commission, 2011).
3.9. Insights into national measurement developments
Switzerland –
duplicating
measurements efforts
in the domain of SD
The action plan adopted in 2002 as part of the Swiss Federal Council’s
“Sustainable Development Strategy 2002” contained a measure that spelled
out the need for an indicator-based measurement system. Since 2003, the
20
and GE? MONET Indicator System (Monitoring der Nachhaltigen Entwicklung or
Monitoring of Sustainable Development) has provided an overview of
sustainable development in Switzerland taking into account the three
sustainability dimensions as well as time (“now” and “later”) and space
(“here” and “elsewhere”). Each of the approximately 75 indicators illustrates
a different facet of sustainable development and contributes to an overall
picture of sustainable development in Switzerland. The indicator system is
based on a clearly defined methodological background consisting of a frame
of reference, an indicator typology and a set of rules and criteria for the
selection of indicators6.
In 2010, as part of a “Green Economy” action plan and under the influence of
the international debate on “GDP and beyond”, the Federal Council gave a
mandate to elaborate economic, social and ecologic indicators to
complement GDP as well as a compound index for environmental pressure
and ecosystem services. In the first phase until summer 2012, existing
statistical information has been placed in the context of the economy or of
society as a whole. Subsequently, the indicator set will be further developed
and consolidated. So far, this work in the context of “GDP and beyond” has
been separate from the MONET sustainable development system, even
though the results presented in spring 20127 used the well-known three
dimensions or circles model of sustainable development for presentation.
Some, but not all of the indicators, overlap with the MONET system, raising
questions about the usefulness and the value added by two parallel, very
similar, but nevertheless separated indicators systems.
Finland – increasing
the timeliness of
indicators
During the last 15 years, the national SD indicators sets in Finland have
developed from holistic overall descriptions of sustainability towards policy
oriented indicator sets tightly coupled with national SD strategies. The main
recent development in Finland has been the “Findicator” portal that was
launched by the Prime Minister’s Office and Statistics Finland in 2009. The
portal has not been formally adopted as the Finnish national SD indicator set,
but it includes several of the indicators used in previous national SD indicator
sets. Currently, the potential for integrating the portal with the national SD
indicator set is investigated.
The portal includes approximately 100 indicators for economic and social
wellbeing and environmental issues. Indicators are continuously updated
and modified, taking into account user requests. Indicators include direct
links to a database providing further details on the indicators. Improving the
6 http://www.bfs.admin.ch/bfs/portal/en/index/news/publikationen.Document.138495.pdf
7 http://www.bfs.admin.ch/bfs/portal/en/index/news/medienmitteilungen.Document.157733.pdf
21
timeliness of indicators was one of the main goals of the portal. A recent
study (Lyytimäki, 2012) showed that the time lag of indicators published
through this portal is substantially smaller than the average time lag of over
two years of previous Finnish SD indicators and EU-level SD indicators. This is
likely to improve the usefulness of the indicators in policy-making and
evaluation.
3.10. Translation of differences between concepts into competing measurement approaches
Differences between
the EU SDS and the
Europe 2020
measuring systems
exist concerning
structure, content and
focus
Due to the eminent differences among the concepts of sustainable
development (SD) and green economy (GE) dealt in the second section of
this policy brief, measuring and monitoring systems originating from these
are characterised by dissimilarities in their structure, content and focus. The
following paragraphs show some of the differences on a European-level
example, i.e. EUROSTAT sustainable development indicators and Europe
2020 headline indicators.
The EU SDI covers a
comprehensive set of
indicators reflecting
various policy
objectives
When looking at the overall structure of measuring systems, the SDI set
comprises several themes which are further divided into subthemes to
organise the set according to the policy objectives of the EU SDS. This
enables a direct link to policies by reviewing progress to achieve policy
targets. On the other hand, a more elaborated and detailed structure leads
to a rather large set of indicators allowing a comprehensive view on different
policy areas. For example, the theme of public health covers objective
indicators such as healthy life years or life expectancy as well as subjective
indicators such as self reported unmet need for medical examination or
treatment. The patterns of different levels of indicators (a headline indicator
supported by several other indicators reflecting different aspects of the
theme and various policy objectives) could provide a more detailed and also
broader picture on development trends.
At the Europe 2020
Strategy measures are
undertaken to
complement the 8
headline indicators
with specific indicator
sets targeting policy
priorities
By comparison the Europe 2020 Strategy provides a smaller set with 8
headline indicators associated to five headline targets. However, with regard
to the various flagship initiatives, efforts are undertaken to develop a more
comprehensive set of indicators. For example, concerning the smart growth
priority the European Commission plans to develop indicators and analysis to
support Research & Innovation (R&I) policy making at three different levels
(Key R&I indicators and economic analysis): (1) Headline indicators for the
highest political level, (2) Innovation Union scoreboard (IUS) indicators for
ministers directly responsible for Research and (3) comprehensive set of
22
indicators used for in-depth economic analysis published in The Science,
Technology and Competitiveness (STC) Report and other analytical studies
especially for expert use.
Europe 2020
indicators emphasize
the environmental
performance of the
economy and neglects
a number of social
and environmental
issues
One of the most prominent differences between existing or proposed
measurement systems is the lack of indicators comprehensively covering
social aspects in the green economy indicator sets (in the Europe 2020
Strategy social aspects are conceptually addressed through indicators on
education – i.e. empowering people with new skills and education in order to
foster economic growth – and the headline target on poverty eradication).
Another difference is that green economy measuring systems focus on the
environmental performance of the economy (such as resource and energy
efficiency or emissions), while the environmental dimension (for example,
status of ecosystem services and biomass stock) are to some extent missing.
National statistical offices find themselves in a situation of increasing
number of tasks and public budget cuts, thereby facing increasing scarcity of
administrative and financial resources. When in such a situation
predominant political attention is given to the green economy concept, there
is a risk that a competition between priorities might result in endangering
the monitoring and further development of sustainable development
indicators. We would thereby lose vital and complex information on the
progress towards sustainable development, and it could further weaken the
political commitment given to sustainable development.
As green economy measuring system the Europe 2020 indicators are
focusing on the environmental performance of the economy (e.g. resource
and energy efficiency, and emissions etc), the performance and status of the
environmental dimension (e.g. status of ecosystem services and biomass
stock) is to some extent missing. More specifically, more efficient resource
extraction and consumption or decreasing emissions might put less burden
on ecosystems, however, the status and performance of these systems
remains unclear.
23
4. Conclusions and recommendations There is a need to
make SD an
overarching principle
on the international
level
The continuing relevance of sustainable development was confirmed
through the UNCSD; nevertheless it will not anytime soon become the
overarching principle on the international level (as it seems that there will be
a parallel development agenda). A certain success can also be seen in the
way how green economy was framed ‘in the context of sustainable
development and poverty eradication’.
The development of
measurement
systems should be
kept separate from
each other
Resulting indicators
should be integrated
into existing SD
measurement
systems
New measurement
systems are
conceptually not
revolutionary
The different development processes of and conceptual work on
measurement frameworks such as the GDP and Beyond initiative or the
OECD Green Growth Strategy indicators should be kept separated from each
other and elaborated in different institutional settings. However, the
resulting indicators should be integrated into SD measurement systems
rather than maintained as separately existent measurement systems as this
could draw political attention away from established SD measurement
systems. The concept of sustainable development (and therefore also its
measurement systems) supports a more holistic picture on development
trends rather than approaches fragmented by different policy areas.
Furthermore, the proliferation of measurement initiatives, particularly
should they become institutionalised on country level and have to be
maintained in practice, is resource-intensive in financial and administrative
terms. Many states thus might not be able to afford maintaining several
separate measurement systems. Moreover, the new measurement
approaches, even though offering partial insights, are in no way conceptually
revolutionary, and their value added to SD measurement systems is limited.
As a positive example, the Eurostat Working Group on Sustainable
Development Indicators (Eurostat, 2009) engages in the development of
indicators covering aspects of green economy, such as ‘green public
procurement’, ‘share of consumption of products with an eco-label’ or
‘energy and material use per unit of output’.
In the light of the above we recommend the following:
As the concept of sustainable development should remain the
overarching concept within which green economy initiatives should
be contextualised, the same should be valid for monitoring and
measurement sets. Initiatives developing indicators for green
economy initiatives, well-being or development should not result
into new separate indicator sets; rather, these indicators should be
integrated into and complement existing sustainable development
indicator systems.
Indicators developed for measuring progress of green economy
24
initiatives should respect the understanding of the green economy
concept developed during the UNCSD process, but also strive for
harmonisation with the work of OECD on measuring green growth.
The resulting indicators should also enable adjustment to national
specifics.
The reform of the system of national accounts (SNA; see for example
the WAVES Partnership on natural capital accounting pioneered by
the World Bank and the UN Statistics Commission) and the
measurement of wealth, growth and well-being initiatives by OECD
and EU (‘GDP and beyond’) should be taken up by the UN in the
latter stages of development.
Sustainable Development Goals (SDGs) should be an expression of
sustainable development concerns and can constitute a subset of
particularly relevant sustainable development indicators; their
development, however, should not replace existing sustainable
development indicator sets and initiatives.
A number of political and technical criteria meet during the
formulation of SDI sets. Such a process therefore needs to be
transparent and involve the public.
Attention needs to be paid to the motivation of countries to join.
There might be concerns over public image of countries which are
not performing very well, which might affect their willingness to
institutionalise national SDI processes.
Due to the potentially high costs and capacity needs, attention needs
to be paid to the financing of the institutionalisation, further
development and operation costs of SDI systems in particular to
ensure participation of developing countries.
Education of the public on sustainable development issues is an
important factor in increasing the potential role of the public to act
as a driver of policies related to SD, keep the political relevance of
sustainable development, and mobilise efforts for SDIs.
The legitimacy and
importance of UN
with regard to the
development of
concepts would
increase by
introducing regional
aspects
The cooperation on and further development of existing concepts as well as
introduction of specific regional aspects will substantially increase the
legitimacy and importance of UN in the international context. Amendments
of the UN indicator framework by concepts such as green economy should
take into account work done by UNECE, OECD or the Eurostat Task Force
(which will soon report on 5 years of work on indicators). At the moment
more attention is given to the different policy actors and academic
disciplines reflected in the different measuring activities rather than to the
possibilities for collaboration among different institutions in the direction of
25
a better integration of the concepts (i.e. green economy in the context of
sustainable development).
26
5. References
European Council (2011). 17 June 2010 Conclusions. EUCO 13/10. European Council, Brussels.
European Council (2012). 3152th ENVIRONMENT Council meeting: Council conclusions: Rio+20:
Pathways to a Sustainable Future.
http://www.consilium.europa.eu/uedocs/cms_data/docs/pressdata/en/envir/128881.pdf
European Commission (2005). Communication from Mr. Almunia to the Members of the
Commission. Sustainable Development Indicators to monitor the implementation of the EU
Sustainable Development Strategy (No. SEC(2005) 161 final). Brussels: Commission of the
European Communities.
European Commission (2009). Consultation on the "EU 2020" Strategy, Commission Working
Document, COM(2009)647 final, http://ec.europa.eu/eu2020/pdf/eu2020_en.pdf
European Commission (2010). EUROPE 2020 - A strategy for smart, sustainable and inclusive growth,
COM(2010) 2020 final, 2010, http://eur-
lex.europa.eu/LexUriServ/LexUriServ.do?uri=COM:2010:2020:FIN:EN:PDF
European Commission (2011). Roadmap to a Resource Efficient Europe. COM(2011) 571 final.
http://eur-lex.europa.eu/LexUriServ/LexUriServ.do?uri=COM:2011:0571:FIN:EN:PDF
European Council (2011). 17 June 2010 Conclusions. EUCO 13/10. European Council, Brussels.
European Council (2012). 3152th ENVIRONMENT Council meeting: Council conclusions: Rio+20:
Pathways to a Sustainable Future.
http://www.consilium.europa.eu/uedocs/cms_data/docs/pressdata/en/envir/128881.pdf
Eurostat (2005). Measuring progress towards a more sustainable Europe. Sustainable development
indicators for the European Union. Luxembourg: Office for Official Publications of the European
Communities.
Eurostat (2011). Measuring progress towards a more sustainable Europe. 2011 monitoring report of
the EU sustainable development strategy. Luxembourg: Office for Official Publications of the
European Communities. http://ec.europa.eu/eurostat/product?code=KS-31-11-
224&language=en
Lyytimäki, J., (2012). Evaluation of sustainable development strategies and policies: The need for
more timely indicators Natural Resources Forum 36(2): 101-108.
OECD (1998). Environmental and Sustainable Development Indicators. State of the art in Member
countries. Informal contributions, OECD, Paris
OECD (2000). Towards Sustainable Development: Indicators to Measure Progress. Proceedings of
the Rome Conference, Rome, Italy, 15-17 December, OECD, Paris
OECD (2001). Sustainable development strategies What are they and how can development co -
operation agencies support them? , OECD, Paris
http://www.oecd.org/dataoecd/60/55/1899857.pdf
OECD (2003). OECD Environment Indicators. Development, Measurement and Use. Paris: OECD.
OECD (2009). Measuring and fostering well-being and progress: the OECD roadmap.
http://www.oecd.org/dataoecd/40/0/44005046.pdf
27
OECD (2010a). "The OECD Human Capital Project: Progress Report", paper presented at the 31st
General Conference of The International Association for Research in Income and Wealth, St.
Gallen, Switzerland, August 22-28. http://www.iariw.org/papers/2010/5Mira.pdf
OECD (2010b). Interim report of the Green Growth Strategy: implementing our commitment for a
sustainable future. C/MIN(2010)5. Paris: OECD.
OECD (2011). Towards Green Growth. OECD, Paris.
Pintér, L., Hardi, P., & Bartelmus, P. (2005). Sustainable Development Indicators. Proposals for a Way
Forward. Winnipeg, Manitoba: IISD.
UN (2012). The future we want - zero draft of the outcome document.
http://www.uncsd2012.org/rio20/futurewewant.html
UNCSD. (2001). Indicators of Sustainable Development: Guidelines and Methodologies.
UNEP (2010). Green Economy Developing Countries Success Stories. UNEP, Geneva.
UNEP (2011). Towards a Green Economy: Pathways to Sustainable Development and Poverty
Reduction. UNEP, Geneva.
28
Annex I Eurostat SDIs
Figure 1: SDI pyramid
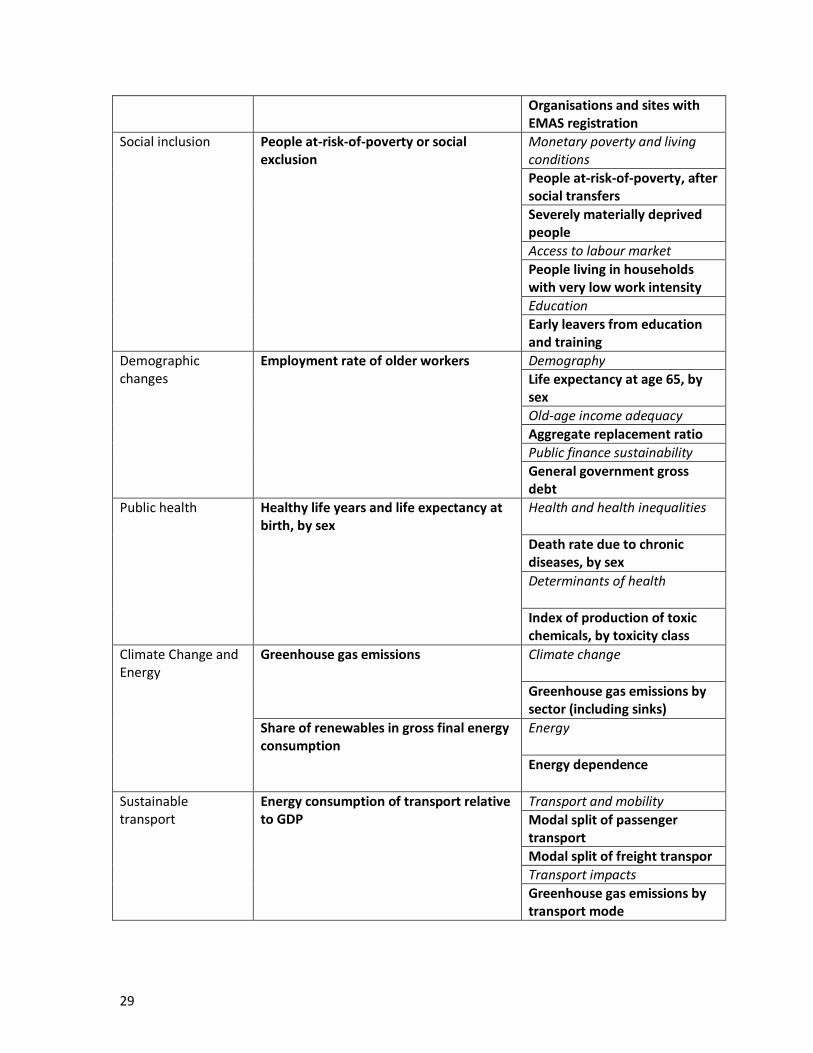
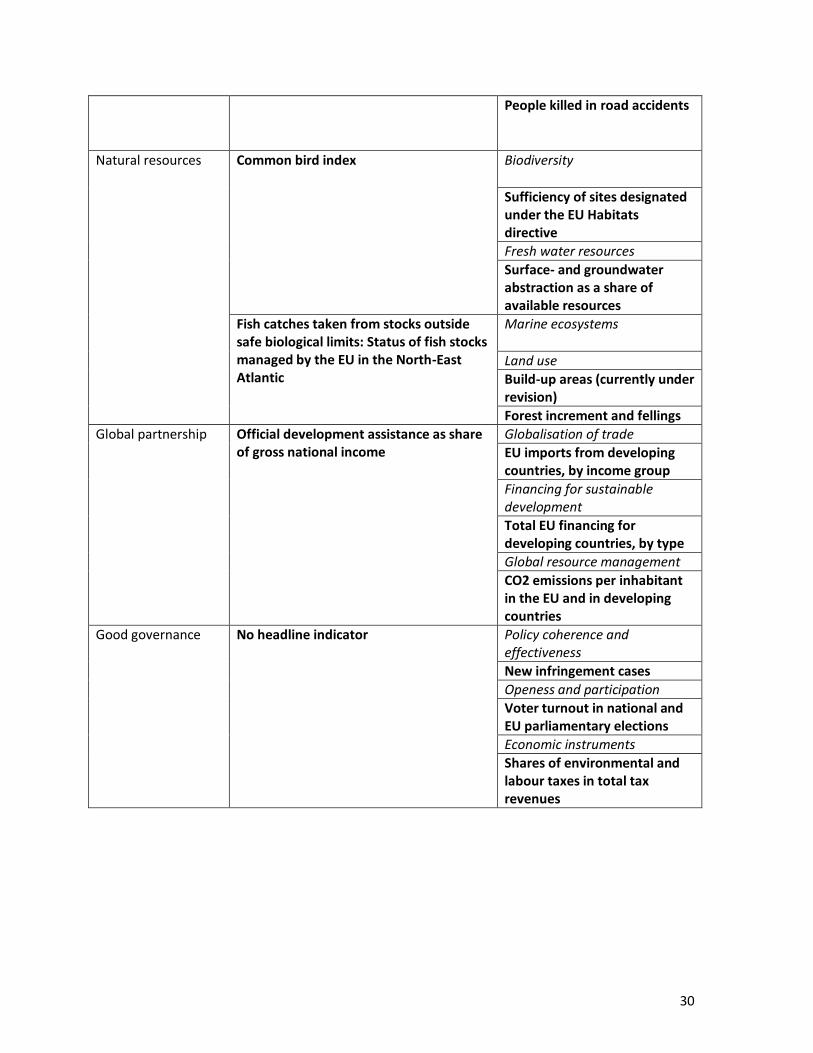
Table 1: List of EU SD headline indicators apportioned to themes (3rd level or contextual indicators are not listed)
Theme Headline indicator Operational objectives and targets / second level indicators
Socio-economic development
Real GDP per capita, growth rate and totals
Economic development
Investment by institutional sectors
Innovation, competitiveness and eco-efficiency
Real labour productivity growth per hour worked
Employment
Total employment rate
Sustainable Consumption and Production
Resource productivity Ressource use and waste
Non-mineral waste generation
Consumption patterns
Electricity consumption of households
Production patterns
29
Organisations and sites with EMAS registration
Social inclusion People at-risk-of-poverty or social exclusion
Monetary poverty and living conditions
People at-risk-of-poverty, after social transfers
Severely materially deprived people
Access to labour market
People living in households with very low work intensity
Education
Early leavers from education and training
Demographic changes
Employment rate of older workers Demography
Life expectancy at age 65, by sex
Old-age income adequacy
Aggregate replacement ratio
Public finance sustainability
General government gross debt
Public health Healthy life years and life expectancy at birth, by sex
Health and health inequalities
Death rate due to chronic diseases, by sex
Determinants of health
Index of production of toxic chemicals, by toxicity class
Climate Change and Energy
Greenhouse gas emissions Climate change
Greenhouse gas emissions by sector (including sinks)
Share of renewables in gross final energy consumption
Energy
Energy dependence
Sustainable transport
Energy consumption of transport relative to GDP
Transport and mobility
Modal split of passenger transport
Modal split of freight transpor
Transport impacts
Greenhouse gas emissions by transport mode
30
People killed in road accidents
Natural resources Common bird index Biodiversity
Sufficiency of sites designated under the EU Habitats directive
Fresh water resources
Surface- and groundwater abstraction as a share of available resources
Fish catches taken from stocks outside safe biological limits: Status of fish stocks managed by the EU in the North-East Atlantic
Marine ecosystems
Land use
Build-up areas (currently under revision)
Forest increment and fellings
Global partnership Official development assistance as share of gross national income
Globalisation of trade
EU imports from developing countries, by income group
Financing for sustainable development
Total EU financing for developing countries, by type
Global resource management
CO2 emissions per inhabitant in the EU and in developing countries
Good governance No headline indicator Policy coherence and effectiveness
New infringement cases
Openess and participation
Voter turnout in national and EU parliamentary elections
Economic instruments
Shares of environmental and labour taxes in total tax revenues
31
Annex II A short history of the EU Sustainable Development Strategy Through the Rio
declaration and the
Amsterdam Treaty
the EU committed
itself to the objective
of SD
The importance of SD was acknowledged by the EU by signing the Rio
Declaration and committing itself to draw up a cross-sectoral SD strategy in
time for the next UN World Summit on SD (held 2002 in Johannesburg). This
commitment has been confirmed when the EU included sustainable
development objectives in the 1997 Amsterdam Treaty: “The Union shall set
itself the following objectives: to promote economic and social progress and
a high level of employment and to achieve balanced and sustainable
development (…)”.
The first European
Sustainable
Development Strategy
came into place in
2001
It was at the Gothenburg European Council meeting in June 2001 that the
Council members agreed on the first EU SDS. The Council conclusions
pointed out that the EU SDS completes the Union’s commitment for an
economic and social renewal, adds an environmental dimension to the
Lisbon Strategy, and establishes a new approach to policy-making. Generally,
the EU SDS is based “on the principle that the economic, social and
environmental effects of all policies should be examined in a coordinated
way and taken into account in decision-making” (European Commission,
2005). Since some Member States objected to parts of the proposal, the
Council members ‘welcomed’ the draft but did not approve it as official EU
strategy. Instead, they included 14 modestly ambitious paragraphs on SD in
Europe in the Presidency Conclusions.
After an extensive
stakeholder dialogue
the review of the
strategy in 2004 led to
a renewed EU SDS for
an enlarged EU
A long road to the
current EU SDS
The review of the EU SDS was a lengthy process that began in early 2004 and
led to the adoption of the renewed EU SDS at the Brussels European Council
in June 2006. It was open for three months for stakeholders from all over the
world. Based on the results of the public consultation, which was open for
three months for stakeholders from all over the world, and on the work of
the European Economic and Social Committee, the European Commission
presented the communication “The 2005 Review of the EU Sustainable
Development Strategy: Initial stock-taking and future orientations”. In
February 2005. In May 2005, the Commission published a “Guiding Principles
for Sustainable Development” which were adopted by the Brussels European
Council in June 2005 and served as a conceptual basis for the renewed EU
SDS.´
In June 2006, the European Council adopted the renewed EU SDS for an
enlarged EU. The renewed EU SDS was conceived as a single and coherent
strategy on how the EU came to more effectively live up to its long-standing
commitment to meet the challenges of sustainable development. It
recognises the need to gradually change our current unsustainable
consumption and production patterns, and to move towards a better-
32
integrated approach to policy-making. It also reaffirms the need for global
solidarity and recognises the importance of strengthening our work with
partners outside the EU, including rapidly developing countries, which will
have a significant impact on global sustainable development. The overall aim
of the EU SDS is to identify and develop actions to enable the EU to achieve a
continuous long-term improvement of quality of life through the creation of
sustainable communities that are able to manage and use resources more
efficiently, are able to tap the ecological and social innovation potential of
the economy, and are able to ensure prosperity, environmental protection,
and social cohesion.