Embed Size (px)
Citation preview
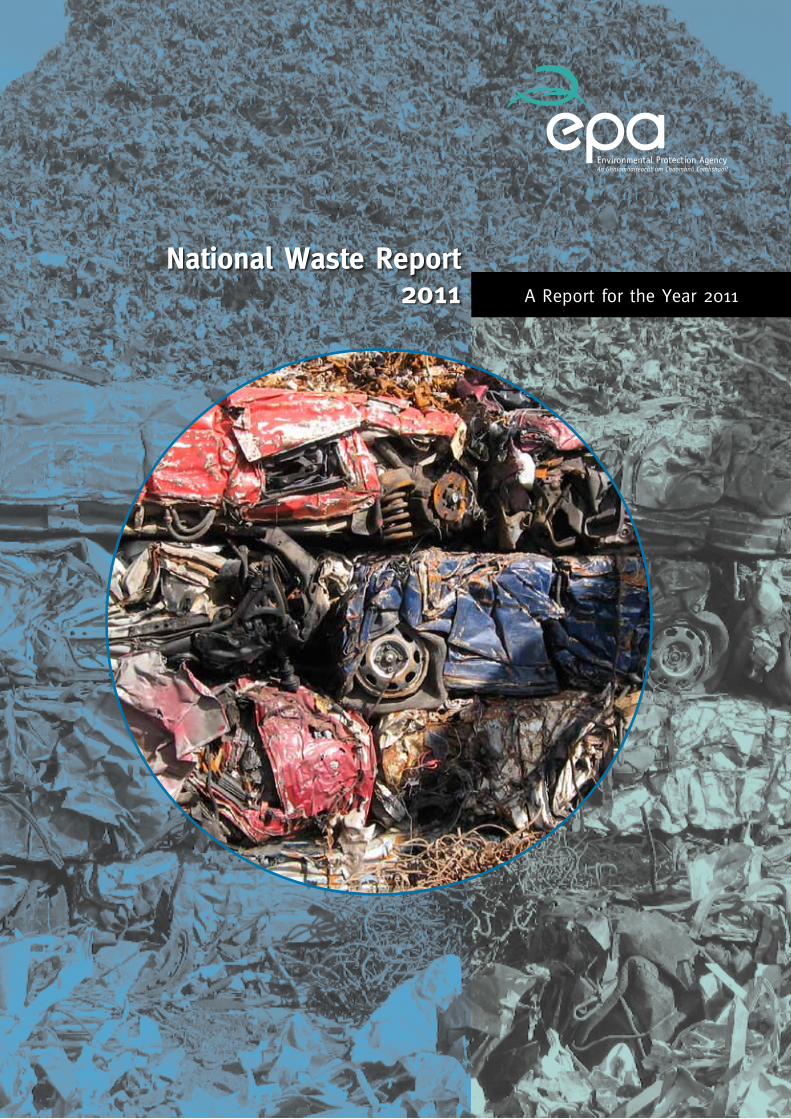
National Waste Report2011 A Report for the Year 2011
Environmental Protection Agency
The Environmental Protection Agency (EPA) isa statutory body responsible for protectingthe environment in Ireland. We regulate andpolice activities that might otherwise causepollution. We ensure there is solidinformation on environmental trends so thatnecessary actions are taken. Our priorities areprotecting the Irish environment andensuring that development is sustainable.
The EPA is an independent public bodyestablished in July 1993 under theEnvironmental Protection Agency Act, 1992.Its sponsor in Government is the Departmentof the Environment, Community and LocalGovernment.
OUR RESPONSIBILITIES LICENSING
We license the following to ensure that their emissionsdo not endanger human health or harm theenvironment:
n waste facilities (e.g., landfills, incinerators, wastetransfer stations);
n large scale industrial activities (e.g., pharmaceuticalmanufacturing, cement manufacturing, powerplants);
n intensive agriculture;
n the contained use and controlled release ofGenetically Modified Organisms (GMOs);
n large petrol storage facilities;
n waste water discharges;
n dumping at sea.
NATIONAL ENVIRONMENTAL ENFORCEMENT
n Conducting over 1200 audits and inspections of EPAlicensed facilities every year.
n Overseeing local authorities’ environmentalprotection responsibilities in the areas of - air,noise, waste, waste-water and water quality.
n Working with local authorities and the Gardaí tostamp out illegal waste activity by co-ordinating anational enforcement network, targeting offenders,conducting investigations and overseeingremediation.
n Prosecuting those who flout environmental law anddamage the environment as a result of their actions.
MONITORING, ANALYSING AND REPORTING ON THEENVIRONMENT
n Monitoring air quality and the quality of rivers,lakes, tidal waters and ground waters; measuringwater levels and river flows.
n Independent reporting to inform decision making bynational and local government.
REGULATING IRELAND’S GREENHOUSE GAS EMISSIONS
n Quantifying Ireland’s emissions of greenhouse gasesin the context of our Kyoto commitments
n Implementing the Emissions Trading Directive,involving over 100 companies who are majorgenerators of carbon dioxide in Ireland.
ENVIRONMENTAL RESEARCH AND DEVELOPMENT
n Co-ordinating research on environmental issues(including air and water quality, climate change,biodiversity, environmental technologies).
STRATEGIC ENVIRONMENTAL ASSESSMENT
n Assessing the impact of plans and programmes onthe Irish environment (such as waste managementand development plans).
ENVIRONMENTAL PLANNING, EDUCATION ANDGUIDANCE n Providing guidance to the public and to industry on
various environmental topics (including licenceapplications, waste prevention and environmentalregulations).
n Generating greater environmental awareness(through environmental television programmes andprimary and secondary schools’ resource packs).
PROACTIVE WASTE MANAGEMENT
n Promoting waste prevention and minimisationprojects through the co-ordination of the NationalWaste Prevention Programme, including input intothe implementation of Producer ResponsibilityInitiatives.
n Enforcing Regulations such as Waste Electrical andElectronic Equipment (WEEE) and Restriction ofHazardous Substances (RoHS) and substances thatdeplete the ozone layer.
n Developing a National Hazardous Waste ManagementPlan to prevent and manage hazardous waste.
MANAGEMENT AND STRUCTURE OF THE EPA
The organisation is managed by a full time Board,consisting of a Director General and four Directors.
The work of the EPA is carried out across four offices:
n Office of Climate, Licensing and Resource Use
n Office of Environmental Enforcement
n Office of Environmental Assessment
n Office of Communications and Corporate Services
The EPA is assisted by an Advisory Committee of twelvemembers who meet several times a year to discussissues of concern and offer advice to the Board.
EPA Inside Pages NEW_Blue Text 07/06/2013 10:12 Page 1
National Waste Report for 2011
ENVIRONMENTAL PROTECTION AGENCY An Ghníomhaireacht um Chaomhnú Comhshaoil
PO Box 3000, Johnstown Castle, Co. Wexford, Ireland
Telephone: +353 53 916 0600 Fax: +353 53 916 0699 Email: [email protected] Website: www.epa.ie
LoCall 1890 33 55 99
National Waste Prevention Programme
© Environmental Protection Agency 2013
All or part of this publication may be reproduced without further permission, provided the source is acknowledged.
National Waste Report for 2011
Published by the Environmental Protection Agency, Ireland
This document does not purport to be and should not be considered a legal interpretation of the legislation referred to herein.
Although every effort has been made to ensure the accuracy of the material contained in this publication, complete accuracy cannot be guaranteed. Neither the Environmental Protection Agency nor the authors accept any responsibility whatsoever for loss or damage occasioned, or claimed to have been occasioned, in part or in full as a consequence of any person acting, or refraining from acting, as a result of a matter contained in this publication. All or part of this publication may be reproduced without further permission, provided the source is acknowledged.
Authors:
Ms. Fiona McCoole (EPA), Dr. Isabelle Kurz (EPA), Mr. Michael McDonagh (EPA), Mr. Daniel O’Neill (RPS) & Dr. Jonathan Derham (EPA).
ISBN: 978-1-84095-476-0 03/13/250 Price: €20
Contents
TABLE OF CONTENTS
Acknowledgements .................................................................................................. i
List of terms ............................................................................................................. ii
1 Key conclusions, statistics and trends, progress on EU waste targets .......... 1
2 Introduction .................................................................................................... 9
3 Generation of municipal waste .................................................................... 15
4 Management of municipal waste ................................................................. 18
5 Biodegradable municipal waste ................................................................... 36
6 Municipal waste infrastructure ..................................................................... 44
7 Packaging waste ......................................................................................... 54
8 Waste electrical and electronic equipment .................................................. 58
9 End of life vehicles ...................................................................................... 60
10 Waste tyres ................................................................................................. 64
11 Construction and demolition waste ............................................................. 66
12 Hazardous waste ........................................................................................ 70
APPENDICES
Appendix A – Indicators ........................................................................................ 82
Appendix B – Household waste collected and brought ......................................... 83
Appendix C - Household waste collected at bring banks ...................................... 85
Appendix D – Household waste collected at civic amenity sites ........................... 86
Appendix E – Landfills in operation ....................................................................... 87
Appendix F – Closed landfills with associated waste infrastructure ...................... 90
Appendix G – Recovery and disposal operations ................................................. 91
Appendix H – Waste composition & biodegradability factors ................................ 92
Appendix I – Composted waste ............................................................................ 95
i
ACKNOWLEDGEMENTS
The Environmental Protection Agency (EPA) gratefully acknowledges all the local authorities and
private sector waste operators who co-operated by submitting waste data, answering validation
queries and facilitating audits.
The EPA also gratefully acknowledges the assistance of RPS Consulting Ltd, who worked on
behalf of the EPA in the collection, compilation and validation of the waste data submitted by local
authorities, recovery operators, hazardous waste treatment facilities and landfills.
The authors would like to acknowledge their colleagues in the Office of Climate Licensing and
Resource Use for their assistance in reviewing the report and providing information within their area
of expertise, colleagues in the Office of Environmental Enforcement for their data regarding
biodegradable municipal waste disposal to landfills, and colleagues in the Office of Environmental
Assessment for their assistance in producing maps.
The assistance of staff in a number of other organisations is also acknowledged, including the
Central Statistics Office, the Department of Environment, Community and Local Government, the
Economic and Social Research Institute, the European Recycling Platform, Greenstreets, the
National Transfrontier Shipment Office at Dublin City Council, the National Waste Collection Permit
Office at Offaly County Council, Repak, the Tyre Recovery Activity Compliance Scheme, the Tyre
Waste Management Scheme and WEEE Ireland.
Ms Fiona McCoole
Manager, Waste Statistics Team
ii
LIST OF TERMS
This list of terms is intended to assist understanding of this report, and does not purport to be a
legal interpretation of said terms.
An Annual Environmental Report (AER) must be submitted to the EPA each year by companies
with either waste or Integrated Pollution Prevention Control licences, providing summary
information on all aspects of the environmental performance of the licensed facility eg data on
emissions to air and water, waste management, resource consumption, objectives and targets,
ambient monitoring and complaints. AERs are made publicly available on the EPA website. Waste
collection permit (WCP) and waste permit (WP) holders are required to submit AERs to local
authorities under condition of permit.
2-bin or 3-bin system refers to a source segregated collection system where dry recyclables and
residual wastes are separately collected (2-bin system), or where dry recyclables, organics and
residuals are separately collected (3-bin system). The reference to ‘black bin’ in this document is a
reference to a single bin collection or to the residuals bin from a 2-bin or 3-bin system. The
reference to ‘green bin’ in this document is a reference to a dry recyclables collection, and ‘brown
bin’ is a reference to an organics bin collection.
Biodegradable (in the context of waste) means waste that is capable of undergoing anaerobic or
aerobic biological decomposition, such as food and garden waste, paper and cardboard etc.
Biodegradable municipal waste (BMW) means the biodegradable component of municipal waste,
and does not include biostabilised waste. Biodegradable municipal waste is typically composed of
food and garden waste, wood, paper, cardboard and textiles.
Biostabilised residual waste means residual BMW that has been treated to achieve an EPA
approved biodegradability stability standard1 prior to landfilling or alternative agreed use.
Biowaste under the terms of the Waste Framework Directive (2008/98/EC) means biodegradable
garden and park waste, food and kitchen waste from households, restaurants, caterers and retail
premises and comparable waste from food processing plants.
Commercial waste, in the context of this report, is a term used to describe the non-household
fraction of municipal waste, which is produced by commercial premises such as shops, offices and
restaurants, as well as municipal premises such as schools, hospitals etc. It also includes non-
process industrial waste arising from factory canteens, offices etc. Commercial waste is broadly
similar in composition to household waste, consisting of a mixture of paper and cardboard, plastics,
organics, metal and glass.
Construction and demolition (C&D) waste is all waste that arises from construction and
demolition activities (including excavated soil from contaminated sites). These wastes are listed in
Chapter 17 of the European Waste Catalogue (EWC).
CSO the Central Statistics Office.
DECLG the Department of the Environment, Community and Local Government.
Disposal means any operation which is not recovery even where the operation has as a secondary
consequence the reclamation of substances or energy. Annex I of the Waste Framework Directive
(Directive 2008/98/EC) sets out a non-exhaustive list of disposal operations.
EEE is electrical and electronic equipment.
1 http://www.epa.ie/pubs/advice/waste/municipalwaste/
iii
End of Life Vehicle (ELV) means a vehicle which is waste within the meaning of Article 1(a) of the
Waste Directive (refer to Directive 2000/53/EC on end-of life vehicles).
EPA the Environmental Protection Agency.
ESRI – the Economic and Social Research Institute.
EU - European Union.
European Waste Catalogue (EWC), now known as the List of Wastes (LoW), is a list of all waste types generated in the EU. The different types of waste are fully defined by a six-digit code, with two digits each for chapter, sub-chapter and waste type. The catalogue is available for download from the EPA website at: www.epa.ie/pubs/reports/waste/stats/epawastecataloguehazardouslist2002.pdf.html
Gross Domestic Product (GDP) & GNP (Gross National Product). Gross Domestic Product
(GDP) and Gross National Product (GNP) are closely related macroeconomic parameters. GDP
measures the total output of the economy in a period i.e. the value of work done by employees,
companies and self-employed persons. This work generates incomes but not all of the incomes
earned in the economy remain the property of residents (and residents may earn some income
abroad). The total income remaining with Irish residents is the GNP and it differs from GDP by the
net amount of incomes sent to or received from abroad.
Hazardous wastes are wastes that have the potential to cause harm to human health or the
environment. Any waste which displays one or more of the hazardous properties listed in Annex III
of the Waste Framework Directive (2008/98/EC) is defined as hazardous waste.
Household waste is defined as waste produced within the curtilage of a building/residence or self-
contained part of a building/premises used for the purposes of living accommodation.
Industrial waste is waste produced by industrial activity such as that of factories, mills and mines.
Non-process industrial waste (eg from site canteen, office, etc.) is similar in character to
commercial waste.
Inert waste is waste that does not undergo any significant physical, chemical or biological
transformations. Inert waste will not dissolve, burn or otherwise physically or chemically react,
biodegrade or adversely affect other matter with which it comes into contact in any way likely to
give rise to environmental pollution or harm human health.
An Integrated Pollution Prevention and Control (IPPC) licence is an authorisation issued and
enforced by the EPA for specific industrial and agricultural activities. An IPPC licence sets limits on
air and water emissions, waste and noise and requires that an activity must use the Best Available
Techniques (BAT).
An Integrated Waste Management Facility (IWMF) in the context of this report is one that
combines a landfill and other waste infrastructure such as civic amenity site, transfer station,
composting or other treatment facilities.
Kerbside collection is a common reference for the practice of collecting household or commercial
waste directly from its source, often, though not necessarily, from the pavement or front door.
Mechanical-biological treatment (MBT) means the treatment of residual municipal waste (black
bin) through a combination of manual and mechanical processing and biological stabilisation, in
order to stabilise and reduce the mass of waste that requires disposal.
Merchant operator. A commercial operator that accepts waste from third parties for treatment (as
opposed to an industrial activity with facilities for the treatment of waste arising from their own
processes, such as on-site incineration).
Metric tonnes are expressed as ‘t’ throughout this report. Mt = million tonnes.
iv
MDR - Mixed dry recyclables.
MFSU - manufacture, formulation, supply and use.
Municipal solid waste (MSW) or municipal waste means household waste as well as commercial
and other waste that, because of its nature or composition, is similar to household waste. It
excludes municipal sludges and effluents. In the context of this report municipal waste consists of
three main elements - household, commercial (including non-process industrial waste), and street
cleansing waste (street sweepings, street bins and municipal parks and cemeteries maintenance
waste, litter campaign material).
N/A – not applicable.
NACE - Nomenclature générale des activités économiques dans I`Union Européenne (general name for economic activities in the European Union).
NEC – not elsewhere classified.
NTFSO – National Transfrontier Shipment Office, Dublin City Council.
NWCPO – National Waste Collection Permit Office, Offaly County Council.
OEA – Office of Environmental Assessment, Environmental Protection Agency.
OEE – Office of Environmental Enforcement, Environmental Protection Agency.
Organic waste is biodegradable food, garden and landscaping waste, and where the context
permits, will also include industrial organic sludges (eg from the food and drink production sector).
Packaging is used to contain, protect and present goods. Virtually all packaging eventually
becomes waste. Packaging is made from such materials as cardboard, paper, glass, plastic, steel,
aluminium, wood, and composite materials such as those used in milk and juice cartons.
Pollutant Release and Transfer Register (PRTR) Regulations 2007. These Regulations require
that releases of pollutants and off-site transfers of waste by facilities operating in relevant industrial
sectors must be reported annually to the EPA. The EPA in turn reports this information to the
European E-PRTR website.
Preparing for reuse means checking, cleaning or repairing recovery operations, by which products
or components of products that have become waste are prepared so that they can be reused
without any other pre-processing.
Recovery means any operation the principal result of which is waste serving a useful purpose by
replacing other materials which would otherwise have been used to fulfil a particular function, or
waste being prepared to fulfil that function, in the plant or in the wider economy. Annex II of the
Waste Framework Directive (2008/98/EC) sets out a non-exhaustive list of recovery operations,
which includes material recovery (i.e. recycling), energy recovery (i.e. use a fuel (other than in
direct incineration) or other means to generate energy) and biological recovery (eg composting).
Recycling means any recovery operation by which waste materials are reprocessed into products,
materials or substances whether for the original or other purposes. It includes the reprocessing of
organic material but does not include energy recovery and the reprocessing into materials that are
to be used as fuels or for backfilling operations.
Refuse derived fuels (RDF) are fuels produced from waste through a number of different
processes such as mechanical separation, blending and compressing to increase the calorific value
of the waste. Such waste derived fuels can be comprised of paper, plastic and other combustible
wastes and can be combusted in a waste-to-energy plant, cement kiln or industrial furnace.
Residual waste means the fraction of collected waste remaining after a treatment or diversion
step, which generally requires further treatment or disposal.
v
Reuse means any operation by which products or components that are not waste are used again
for the same purpose for which they were conceived.
RoI – Republic of Ireland
SI (Statutory Instrument). An order, regulation, rule, scheme or bye-law made in exercise of a power conferred by statute.
tpa – tonnes per annum.
The Transfrontier Shipment of Waste (TFS) Regulations 2007 set out new notification
procedures, revised waste listings and enforcement provisions in relation to the export, import and
transit of waste shipments within the EU. The National TFS Office at Dublin City Council is the
competent authority for the implementation and enforcement of the TFS Regulations since 12th July
2007.
Treatment/pre-treatment includes, in relation to waste, any manual, thermal, physical, chemical or
biological processes that change the characteristics of waste in order to reduce its mass, or
hazardous nature or otherwise, to facilitate its handling, disposal or recovery.
Waste is defined as any substance or object which the holder discards, intends to discard or is
required to discard, under the Waste Framework Directive (2008/98/EC).
Waste management means the collection, transport, recovery and disposal of waste, including the
supervision of such operations and the after-care of disposal sites, and including actions taken as a
dealer or broker.
Waste producer means anyone whose activities produce waste (original waste producer) or
anyone who carries out pre-processing, mixing or other operations resulting in a change in the
nature or composition of this waste, under the Waste Framework Directive (2008/98/EC).
Waste electrical and electronic equipment (WEEE) refers to electrical and electronic equipment
which is waste within the meaning of Article 3(a) of the Waste Directive 2008/98/EC, including all
components, subassemblies and consumables which are part of the product at the time of
discarding.
Waste Framework Directive (WsFD) - Waste Directive 2008/98/EC of 19 November 2008.
WCP (Waste Collection Permit). A permit issued by a local authority for the collection of waste
under the Waste Management (Collection Permit) Regulations 2007, as amended.
WP (Waste Permit). A permit issued by a local authority to a facility for the transfer, storage or
treatment of waste under the Waste Management (Facility Permit and Registration) Regulations
2007, as amended.
1
1 KEY CONCLUSIONS, STATISTICS AND TRENDS, PROGRESS ON EU WASTE TARGETS
This section of the National Waste Report provides information on key conclusions, key statistics
and trends in the report, as well as information on Ireland’s progress in meeting EU waste
collection, recovery and diversion targets.
1.1 Key Conclusions
Municipal solid waste generation in Ireland has decreased by 17% since it peaked in 2007,
although the rate of decrease is slowing down. A decrease in personal consumption over this
period, which is linked to the economic recession, and its impact on household waste generation
appears to be a key contributor to the declining trend and occurred despite an increase in
population.
The percentage of municipal solid waste recovered is showing steady annual increases, and the
recycling rate for municipal waste is now equivalent to the EU27 norm (40%).
The increased production of combustible waste from municipal waste streams for use as a fuel
is contributing to increased recovery rates, as is the introduction of the first municipal waste
incinerator to the country’s infrastructure in late 2011. Increases in the landfill levy in 2011 and
2012 are also assisting in diverting waste from disposal to recovery options.
The bulk of municipal waste recovered is exported for recovery. Municipal waste streams
primarily exported for recovery are paper & cardboard, glass and metals for which there is
limited recovery infrastructure currently in the State. Municipal waste streams recovered within
the State are primarily organic wastes and wood waste, but it is expected that the use of
residual/treated residual municipal waste as a fuel will become more significant in future years.
The number of landfills accepting municipal waste for disposal is continuing to decrease, as is
the remaining licensed landfill disposal capacity. As a consequence of landfill distribution and
closure, significant inter-regional movement of waste is occurring.
With the exception of targets under the End of Life Vehicle Directive, the Republic of Ireland is
achieving its current EU obligations across a broad range of waste legislation (packaging, waste
electrical & electronic equipment, batteries). Some future targets remain at risk (end of life
vehicles, batteries, biodegradable municipal waste from landfill).
Ireland cannot rely on a recession to reduce generation of municipal solid waste. In the case of
the target for the diversion of biodegradable municipal waste from landfill, the decrease
contributed to Ireland meeting the 2010 target, but if waste generation increases with economic
growth future targets will be at risk. Efforts in waste prevention, diversion to recovery, the
development of necessary supporting infrastructure and the enforcement of the 2009 and 2013
food waste regulations will be key to meeting future targets.
2
The private sector dominates the municipal waste collection market, although Galway City
Council, Waterford County Council and Kilkenny Borough Council remain in the waste collection
market.
Local authorities are involved in the provision and operation of essential public waste recovery
infrastructure such as civic amenity and bring banks, which accounted for 16% of managed
household waste in 2011, emphasising the importance of this infrastructure and the need to
support it. With the private sector dominating the waste collection market it may make it difficult
for local authorities to fund investment of waste infrastructure going forward.
The lack of a national register of authorised waste facilities and their treatment capacities is an
ongoing data gap for the State. While there are national data registers for EPA licensed
activities and for waste collection permits, there is fractured information on waste facility permits
and on Certificate of Registration sites. There is a legal obligation under the Waste Statistics
Regulation to provide data biennially on the number and capacity of waste recovery and waste
incineration operations in the State, so the collation of this data is necessary.
The tonnage of construction and demolition waste collected has decreased by 83% since it
peaked at 17.8 Mt in 2007. This reflects the considerable effect of the economic downturn on
the construction & demolition sector.
The overall quantity of hazardous waste managed in 2011 was broadly similar to the quantity
managed in 2010. Nearly half of hazardous waste is exported for treatment (47%), while 22% is
treated at the site of generation (IPPC licensed facilities) and 31% is sent to commercial
hazardous waste treatment facilities within the State.
The importance of timely and accurate waste data from stakeholders in order to meet national
and EU reporting obligations cannot be over-emphasised. There are legal obligations to record
and report on waste management, therefore all stakeholders must ensure that sufficient
resources are given to data management and reporting.
1.2 Key statistics and trends
Waste stream Key statistics and trends compared to 2010
Municipal Waste
It is estimated that 2,823,242 t of municipal waste was generated in 2011, continuing the
downward trend since a peak in 2007.
Ireland’s municipal waste recovery rate increased by 5% to yield an overall recovery rate of
47%.
Ireland’s municipal waste recycling rate (excluding energy recovery) is 40%, the same as the
EU27.
Most municipal paper & cardboard, glass and metals are exported for recovery abroad as there
is limited recovery infrastructure within the State.
Most municipal organic waste (food and green waste) and wood waste is recovered within the
State (composted, used as a fuel).
3
Household Waste
The tonnage of household waste managed (1,406,576 t) compared to 2010.
The proportion of managed household waste recovered increased from 42% in 2010 to 47% in
2011. The proportion of managed household waste disposed to landfill decreased by 11% to
750,066 t.
An estimated 30% of occupied houses did not avail of, or were not offered, a kerbside collection
service (ranging from 2% to 63% across local authority areas), although it is acknowledged that
this is probably an overestimation due to incomplete information on apartment waste and on
household waste management practices such as bin-sharing.
The private sector collected 78% of household kerbside waste (up from 65% in 2010), reflecting
the fact that many local authorities have moved out of the household waste collection market.
Ninety-three private sector operators and 13 local authorities reported collecting household
waste at kerbside in 2011. The number of collectors operating in each local authority functional
area ranged from 2 to 14, with an average of 8 operators in the market in each functional area,
although the geographic spread of the service provided is not known.
An estimated 61% of households on a kerbside collection service were on a 2-bin service
(residual and mixed dry recyclable bin) in 2011, while 37% were a 3-bin service (residual, mixed
dry recyclable and organic bin) (up from 34% in 2010). A fourth bin for the segregated collection
of glass was offered in 18 of the 34 local authority functional areas by some operators (4,367 t
collected).
The separate kerbside collection of household organic waste (in 3-bin service) increased by
21% from 63,837 t in 2010 to 77,494 t in 2011.
Householders in three of the thirty-four local authority functional areas (Cork City, Leitrim and
Donegal) had no waste collection permit operators offering an organics kerbside collection
service (although this is an improvement from six areas without the service in 2010).
Commercial Waste
The quantity of commercial waste managed dropped by 2% on 2010 figures.
Commercial waste recovery increased from 45% in 2010 to 49% in 2011.
Commercial waste disposed to landfill was 568,770 t, a decrease of 10% from 2010.
Biodegradable Municipal Waste
The quantity of biodegradable municipal waste disposed at landfill was 771,551 t, a 10%
decrease compared to 2010. This is 161,551 t in excess of the second EU Landfill Directive
target (due July 2013). Preliminary 2012 data indicates that Ireland is on track to meet the 2013
target, but the 2016 target remains at risk, even more so should economic recovery lead to
increases in municipal waste generation.
A considerable tonnage of managed household and commercial organic waste is available but
not separately collected for treatment (estimated at 62% of household organic waste and 75%
of commercial organic waste).
Implementation and enforcement of the 2009 and 2013 Food Waste Regulations, which place
obligations on waste collectors to provide a food waste collection service and obligations on the
commercial sector and householders to segregate food waste and make it available for
separate collection, will be key to ensuring Ireland meets future Landfill Directive targets.
4
Waste Packaging
Ireland has surpassed the 2011 EU packaging recovery target of 60%, with a 79% recovery rate
reported for 2011.
Waste Electrical and Electronic Equipment
A total of 41,092 t of waste electrical and electronic equipment (WEEE) was collected for
recovery (down from 45,012 t in 2010) in 2011.
Household WEEE collected amounted to 7.6 kg per person, which exceeds the 4 kg per person
EU target.
The recovery rates for all categories of WEEE have been achieved.
End of Life Vehicles
Ireland is failing to meet the end of life vehicle (ELV) Directive targets which have been effective
since January 2006. Preliminary data for 2011 indicate that a reuse/recovery rate of 79% and a
reuse/recycling rate of 77% were achieved against targets of 85% and 80% respectively.
Waste Tyres A total of 19,092 t of waste tyres were managed in 2011. Of this, 54% were exported for
treatment. Of the tonnage treated within the State, 41% were chipped.
Waste Batteries
Ireland exceeded the 2011 Batteries Directive portable battery collection target as 29% portable
batteries were collected relative to tonnage placed on the market (25% was the target). We are
at risk however of failing to meet the 2016 collection target which is 45%.
Construction & Demolition Waste
Construction & demolition waste collected has decreased by 83% since a peak of 17.8 Mt in
2007. This reflects the considerable effect of the economic downturn on the construction &
demolition sector.
There was a 3% decrease in the reported quantity of C&D waste managed by recovery and
disposal facilities (2.5 Mt), compared with 2010 data.
Contaminated soil exported for treatment increased from 2,590 t in 2010 to 10,203 t in 2011,
although the overall tonnage managed is still significantly down on pre-2009 data which most
likely reflects the lack of land development and redevelopment projects since the economic
downturn.
Hazardous Waste
Hazardous waste arising in 2011 originated primarily from the pharmaceutical and chemical
industries.
The overall quantity of hazardous waste managed in 2011 is broadly similar to the quantity
managed in 2010. Of the total managed, 22% is treated on-site at industry, 31% is sent off-site
to a commercial hazardous waste facility for treatment, and 47% is exported for treatment.
There was a 12% decrease in the quantity of hazardous waste treated on-site at EPA-licensed
Integrated Pollution and Prevention Control facilities, compared to 2010 data; this is expected to
be due to reduced production at the facilities concerned.
There was a 6% increase in the quantity of hazardous waste treated at EPA-licensed
commercial hazardous waste treatment facilities, compared to 2010 data, which is largely
attributable to an increase in the treatment of waste oils and solvents.
There was a 4% increase in the quantity of hazardous waste exported for treatment in 2011
compared to 2010, mainly due to increases in the tonnage of solvents, thermal treatment and
combustion residues and WEEE exported.
5
Municipal Waste Infrastructure
Twenty-one landfills accepted municipal waste for disposal in 2011.
At the end of 2011 the remaining licensed national landfill capacity for municipal waste was
approx. 14.5 Mt (circa 11 years remaining life expectancy). As a consequence of landfill
distribution and closure, significant inter-regional movement of waste is occurring.
Local authorities reported 113 civic amenity sites and 1,891 bring banks in operation in 2011,
compared to 107 and 1,922 respectively in 2010.
Household waste brought to bring banks and civic amenity sites accounted for 16% of managed
household waste, which emphasises the importance of this infrastructure and the need to
support it.
Ireland’s first municipal waste incinerator commenced operations in October 2011.
The quantity of non-hazardous waste used as a fuel increased by 42% in 2011 compared to
2010.
The tonnage of refuse derived fuel (RDF) used as a fuel at cement kilns and incinerators at
home and abroad increased by 68% in 2011 compared to 2010, which contributed to increased
municipal recovery rates.
Twenty-six compost and anaerobic digestion facilities accepted municipal organic wastes2 for
recovery (compared to 24 in 2010); 11 accepted food waste for recovery (same as 2010).
1.3 Progress towards meeting EU recycling, recovery and diversion targets
Progress made towards meeting EU recycling, recovery and diversion targets arising from EU
Directives waste strategies is presented in Table 1. These targets are also the performance
indicators against which Ireland’s waste management performance will be measured under the
DECLG’s most recent waste management policy, ‘A Resource Opportunity’, published in July 2012.
With the exception of end of life vehicle targets, Ireland is well advanced towards achievement of all
of its EU obligations across a broad range of waste legislation. The End of Life Vehicle (ELV)
Directive targets are in place since January 2006, and there are higher targets coming into effect
from January 2015. Urgent action is needed to increase reuse/recovery/recycling of ELV materials,
and the DECLG will be engaging with producers and other stakeholders in this regard. The
increases in the landfill levy, and the removal of the exemption of the landfill levy for shredder
residue is likely to encourage the recovery of shredder residue and therefore increase ELV
recovery rates over time.
Ireland recorded a drop in biodegradable municipal waste (BMW) consigned to landfill in 2011 (as a
proportion of reduced tonnage of municipal waste landfilled), and so again met its first phase target
for the diversion of BMW from landfill. There are stricter BMW diversion targets in force for 2013
and 2016. Preliminary 2012 data indicates that Ireland is on track to meet the 2013 target, but the
2016 target remains at risk, even more so should economic recovery lead to increases in municipal
2 Paper & cardboard, food waste, edible oils & fats, green waste.
6
waste generation. The recent publication of the EU (Household Food Waste and Bio-Waste)
Regulations 2013 (S.I. No. 71 of 2013) are welcome, as the obligations imposed on waste
collectors to provide or arrange for the separate collection of household food waste should
contribute to increased diversion of household food waste from the residual bin from disposal to
recycling (eg composting) or energy recovery (eg anaerobic digestion). The enforcement of the
Waste Management (Food Waste) Regulations 2009, which place obligations on producers of food
waste in the commercial sector, is also vital.
vii
Table 1: Progress towards EU waste recycling, recovery and diversion targets
Directive Title Article Targets Current progress to
target in Ireland (2011)
Indicator
Target date Specifics
94/62/EC as
amended
Packaging
Directive 6(1) 31-12-2011
60% as a minimum by weight of packaging waste will be recovered or incinerated at waste
incineration plants with energy recovery. 79% Achieved
55% as a minimum by weight of packaging waste will be recycled. 71% Achieved
No later than 31st December 2011 the following minimum recycling targets for materials contained in packaging waste will be attained:
(i) 60% by weight for glass; 81% Achieved
(ii) 60% by weight for paper and board; 92% Achieved
(iii) 50% by weight for metals; 67% Achieved
(iv) 22.5% by weight for plastics, counting exclusively material that is recycled back into plastics; 48% Achieved
(v) 15% by weight for wood. 93% Achieved
2002/96/EC3
WEEE
Directive
5(5)
(31-12-2006)
31-12-20084
Separate collection of > 4kg of WEEE from private households per person per year. 7.6 kg Achieved
7(2)
For large household appliances and automatic dispensers:-
recovery shall be increased to a minimum of 80% by an average weight per
appliance; and
component, material and substance reuse and recycling shall be increased to a
minimum of 75% by an average weight per appliance.
83%
82%
Achieved
For IT, telecommunications and consumer equipment:-
the rate of recovery shall be increased to a minimum of 75% by an average weight
per appliance; and
component, material and substance reuse and recycling shall be increased to a
minimum of 65% by an average weight per appliance.
88%
87%
Achieved
For small household appliances, lighting equipment, electrical & electronic tools, toys, leisure and
sports equipment, monitoring and control instruments:-
the rate of recovery shall be increased to a minimum of 70% by an average weight
per appliance; and
component, material and substance reuse and recycling shall be increased to a
minimum of 50% by an average weight per appliance.
87%
87%
Achieved
For gas discharge lamps, the rate of component, material and substance reuse and recycling shall reach a minimum of 80% by weight of the lamps.
88% Achieved
2000/53/EC
End of Life
Vehicles
Directive
7(2)(a) 1-1-2006 Reuse and recovery to a minimum of 85% by average weight of vehicle and year. 79%
5 Not achieved
Reuse and recycling to a minimum of 80% by average weight of vehicle and year. 77%5 Not achieved
7(2)(b) 1-1-2015
Reuse and recovery to a minimum of 95% by average weight of vehicle and year. (79%)
5 Risk
Due January 2015
Reuse and recycling to a minimum of 85% by average weight of vehicle and year. (77%)5
Risk
Due January 2015
3 Amended targets for WEEE reuse, recovery and recycling are set down in the recast of the WEEE directive (Directive 2012/19/EU of 4 July 2012), which will enter into force in Ireland on 14 February 2014.
4 Ireland secured a two-year derogation.
5 Based on preliminary 2011 data analysis. Up-to-date recycling and recovery information on shredder residue arising from depolluted ELV shells exported in 2011 was not available at the time of publication.
viii
Directive Title Article Targets Current progress to
target in Ireland (2011)
Indicator
Target date Specifics
2006/66/EC Batteries
Directive
10(2)
31-12-11 Minimum 25% collection rate for batteries & accumulators. 29%6 Achieved
26-9-2016 Minimum 45% collection rate for batteries & accumulators. (29%) Risk
Due September 2016
12(4) 26-9-2011
Recycling processes shall achieve the following minimum recycling efficiencies:
(a) recycling of 65 % by average weight of lead-acid batteries and accumulators, including recycling of the lead content to the highest degree that is technically feasible while avoiding excessive costs;
To be reported to
Commission in June
2013
(b) recycling of 75 % by average weight of nickel-cadmium batteries and accumulators, including recycling of the cadmium content to the highest degree that is technically feasible while avoiding excessive costs; and
(c) recycling of 50 % by average weight of other waste batteries and accumulators.
1999/31/EC Landfill
Directive 5(2)
(16-7-2006)
16-7-20107
Biodegradable municipal waste going to landfills must be reduced to 75% of the total quantity (by weight) biodegradable municipal waste produced in 1995 (< 916,000 t) 771,551 t Achieved
(16-7-2009)
16-7-2013
Biodegradable municipal waste going to landfills must be reduced to 50% of the total quantity (by weight) biodegradable municipal waste produced in 1995 (< 610,000 t)
+ 161,551 t
(estimate)8
Risk
Due July 2013
16-7-2016
Biodegradable municipal waste going to landfills must be reduced to 35% of the total quantity (by weight) biodegradable municipal waste produced in 1995 (427,000 t)
+ 344,551 t
(estimate)8
- Risk -
Due July 2016
2008/98/EC
Waste
Framework
Directive
11(2)(a) 12-12-2020 Preparing for reuse and recycling of 50% by weight of household derived paper, metal, plastic & glass (includes metal and plastic estimates from household WEEE). 45%
9
On track
Due December 2020
11(2)(b) 12-12-2020 Preparing for reuse, recycling and other material recovery (incl. beneficial backfilling operations using waste as a substitute) of 70% by weight of C&D waste (excluding natural soils & stone) 97%
10 Achieved
29 12-12-2013 Establishment of a National Waste Prevention Programme (NWPP) NWPP established in
2004 Achieved
6 Based on information provided by the battery compliance schemes (WEEE Ireland and ERP Ireland) and verified by DECLG.
7 Ireland secured a four-year derogation on first and second targets.
8 Based on 2011 BMW to landfill, and assuming no increase in BMW to landfill (standstill).
9 Calculation method changed since 2010 to be based on household waste generated, rather than household waste managed.
10 Based on C&D managed data in 2011.
Full data due in NWR 2012
9
2 INTRODUCTION
The EPA’s National Waste Prevention Programme (NWPP) produces national statistics on waste
generation and management in the Republic of Ireland.11
The objective of the National Waste Report
(NWR) is to present the most up to date information available on waste management in Ireland, as
reported to the EPA. This report includes data on municipal waste, hazardous waste, construction &
demolition waste and also particular waste streams subject to Producer Responsibility Initiatives (eg
packaging, end of life vehicles) for calendar year 2011. This year the report includes a new chapter on
waste tyres.
The data collected for the NWR series is also used to report to the EU Commission on various
legislative reporting obligations such as EU Directives (packaging, waste electrical and electronic
equipment, end of life vehicles), the Waste Statistics Regulation (2150/2002/EC as amended) and
other reporting obligations such as Structural and Regional Indicators (eg the Sustainable
Development Indicator on Municipal Waste and the Regional Environmental Questionnaire).
2.1 National Waste Report survey approach
This NWR presents waste data for the calendar year 2011. Waste data was sought from the following
sources to collate the information presented:
Local authorities, including the National Transfrontier Shipment Office at Dublin City Council;
EPA licensed waste operators;
Local authority permitted waste operators;
EPA licensed Integrated Pollution and Prevention Control activities;
Compliance schemes and self-complying producers (for Producer Responsibility Initiatives).
The sources of all data cited are referenced throughout the report. The co-operation of all respondent
organisations is gratefully acknowledged and this report could not be produced without the provision of
their data. An estimated 7,000 data sets are mined (by EPA and data suppliers) to generate the
information distilled into this report.
All survey returns were desk-top validated and 34 data verification audits were carried out, covering 5
local authority functional areas and 29 waste operators. Data reconciliation visits were completed with
the WEEE and packaging compliance schemes. The EPA provided training workshops on completion
11
More information at www.nwpp.ie.
10
of the surveys, updated its online guidance manuals,12
and provided a helpline and dedicated e-mail
address for waste operators.
The collection of waste generation and management data for the State is a significant resource burden
on the waste industry, local authorities, the EPA and others, but is necessary in order to inform policy
as well as to provide timely and accurate data for legislative EU reporting requirements.
The EPA recognises that the multiplicity of waste reporting requirements, particularly in the first
quarter of each calendar year, is a burden on waste operators. The EPA uses existing data sources
where possible (such as waste collection and waste facility permit annual returns, Pollutant Release
and Transfer Returns (PRTR)). However, as data on source of waste are key to reporting on municipal
waste and because the complexity of EU reporting obligations requires specific data that may not be
available from these annual returns, the EPA needs more detailed information from particular
operators and especially those that are ‘end-handlers’ i.e., operators who undertake the final treatment
(disposal or recovery) at their facility, or who are the point of export of the waste.
The waste accounting method used in this and previous NWRs does not include material in transit or
temporary storage as it is neither disposed nor recovered in the calendar year. Totals appearing in this
report may vary by +/- 1 tonne due to statistical rounding.
2.2 National developments and issues
This section reports on key developments in national and EU policy and legislation since publication of
National Waste Report 2010 in February 2012.
2.2.1 National Waste Collection Permit Office (NWCPO)
Since 1st February 2012, the National Waste Collection Permit Office (NWPCO) at Offaly County
Council13 has been responsible for issuing all waste collection permits in the State. Prior to this, there
were ten nominated authorities in the State that had responsibility for issuing waste collection permits.
The EPA is co-operating with NWCPO with regard the development of their e-reporting system to lead
to efficiencies and improve the quality and availability of waste collection data.
2.2.2 Sustainable Development
In June 2012, the government published ‘Our Sustainable Future, a Framework for Sustainable
Development for Ireland.’14 The framework sets out the challenges that Ireland faces across a number
of policy areas, including sustainable consumption and production, at a time when people’s main
concern is economic recovery. The aim of the framework is to provide for the integration of sustainable
12
See www.wastesurvey.ie. 13
www.nwcpo.ie 14
www.environ.ie/en/Publications/Environment/Miscellaneous/FileDownLoad,30452,en.pdf
11
development into key areas of policy, to put in place effective implementation mechanisms and deliver
concrete measures. In the area of sustainable consumption and production, the measures set out are:
(i) Complete policy on waste management.
(ii) Ensure the effective implementation of resource efficiency initiatives in Ireland in line with the
EU Roadmap to a Resource Efficient Europe under Europe 2020.
(iii) Fully implement the Action Plan on Green Public Procurement, supporting the development of
the green economy in Ireland.
(iv) Relevant agencies (eg IDA, SEAI and EPA) should continue to offer an integrated suite of
resource efficiency programmes for business.
2.2.3 National Waste Management Policy
In July 2012 the DECLG published the government’s new waste management policy ‘A Resource
Opportunity – Waste Management Policy in Ireland’. The policy sets out a series of measures which
aim to move Ireland away from dependence on landfill for the treatment of municipal waste, and
through which waste will be reduced and the resources recovered from waste maximised.
The policy sets out measures and actions for all tiers of the waste hierarchy, namely prevention,
preparation for reuse, recycling, recovery and disposal. There are also policy measures and actions
for the regulation of household waste collection and compliance and enforcement. There will be an
annual review of performance under each policy heading, conducted by a National Compliance
Committee. Performance indicators will be the Producer Responsibility Initiative targets, mirroring
Table 1 (Chapter 1) of this document.
Also in July 2012 the DECLG published the Regulatory Impact Analysis on Household Waste
Collection.15 The analysis recommended that the Government preserves the current household waste
collection market structure and strengthens the regulatory regime which applies, which would include
mandated service levels including the provision of segregated waste collections. The policy of
retaining the current market structure will be reviewed in 2016.
In October 2012 the DECLG published ‘Putting People First – Action Programme for Effective Local
Government’.16 One of the actions under this programme is that the number of waste planning regions
will reduce from the existing ten to no more than three, taking account of the proposed new regional
assembly structure, i.e. an Eastern and Midlands Region, a Southern Region and a Connaught-Ulster
Region.17
15
www.environ.ie/en/Environment/RHLegislation/FileDownLoad,30784,en.pdf 16 www.environ.ie/en/PublicationsDocuments/FileDownLoad,31309,en.pdf 17
Note that where waste management planning regions are included in the tables and figures of this report, the proposed new structure is used.
12
2.2.4 European Union (Household Food Waste and Bio-Waste) Regulations 2013
In March 2013, the European Union (Household Food Waste and Bio-Waste) Regulations 2013 (S.I.
No. 71 of 2013) were published. These regulations are designed to promote the segregation and
recovery of household food waste and will complement the Waste Management (Food Waste)
Regulations (S.I. No. 508 of 2009) which require the segregation and recovery of food waste arising
from commercial premises. S.I. No. 71 of 2013 places obligations on waste collectors to have a
separate collection service for household food waste and places obligations on householders who
produce food waste to segregate it and make it available for separate collection. If successfully
implemented and enforced, these regulations will contribute to the achievement of future targets under
the Landfill Directive for the diversion of biodegradable municipal waste from disposal to landfill. It will
also increase Ireland’s household recycling rate as the food waste stream will be diverted to
composting and anaerobic digestion activities rather than being disposed to landfill.
2.2.5 EWC classification of mixed municipal waste exiting waste management facilities
A number of waste operators are baling municipal waste and exporting it for energy recovery. The
NTFSO at Dublin City Council has been engaging with the EPA on the appropriate European Waste
Catalogue (EWC) classification of material exiting EPA licensed activities, and in October 2012, the
EPA published a position paper on this topic. The paper identifies what is the minimum treatment
necessary to justify a reclassification of the waste code from EWC code 20 03 01 (mixed municipal
waste) to EWC code 19 12 (waste arising from mechanical treatment of waste (for example sorting,
crushing, compacting, pelletising not otherwise specified). The paper can be downloaded at
http://www.epa.ie/pubs/advice/waste/municipalwaste/epaviewpointonewcclassificationofmixedmunicip
alwaste.html.
2.2.6 National Implementation Plan for POPs
The Stockholm Convention on Persistent Organic Pollutants (POPs) is a global treaty that aims to
protect human health and the environment from POPs. The Convention includes several requirements
in the control of POPs including banning or restricting the production, use, import and export of POPs
and measures to reduce or eliminate their releases (including releases from stockpiles and wastes
containing POPs). The Convention entered into force for Ireland in 2010 and in accordance with
Article 7 of the Convention, Ireland is required to develop a National Implementation Plan on POPs for
the implementation of its obligations under the Convention. The EPA, as competent authority, has
prepared the National Implementation Plan18 in consultation with a number of public authorities,
national stakeholders and the public. The Plan was transmitted to the Stockholm Convention
Secretariat in November 2012.
18
www.epa.ie/pubs/reports/waste/haz/nationalimplementationplanonpops.html
13
The National Implementation Plan on POPs includes an assessment of POPs in Ireland and details
the measures put in place to protect human health and the environment from the POPs that are listed
under the Convention. The Plan also outlines further activities which will be carried out to support the
control of POPs. Implementation of measures outlined in the plan, which has commenced, involves
proactive engagement of a number of key stakeholders, particularly those waste contractors handling
material identified in the National Implementation Plan as containing/potentially containing, POPs.
2.3 EU developments and obligations
2.3.1 Waste Statistics Regulation
The Waste Statistics Regulation (EC 2150/2002 as amended) establishes a framework for the
production of EU statistics on the generation, recovery and disposal of waste. In addition to providing
a source of comparable and harmonised data on waste for all EU Member States, the Regulation also
enables tracking of Member States’ adherence to, and progress against, the fundamental principles
underpinning EU waste policy.
The Regulation requires each Member State to report biennially on waste generation, waste treatment
in the State, and the number and capacity of certain recovery and disposal operations in the State to
Eurostat (the Statistical Office of the European Communities). The EPA, in co-operation with the
Central Statistics Office, collates, verifies, analyses, and submits the datasets to Eurostat. The 2010
datasets were submitted to Eurostat in July 2012. Eurostat has published Waste Statistics Regulation
data for calendar years 2004, 2006, 2008 and 2010 to their website.19
2.3.2 WEEE Directive Recast
The Waste Electrical and Electronic Equipment Directive, originally published in 2003, was recast in
2012 (Directive 2012/19/EU of the European Parliament and of the Council of 4 July 2012 on waste
electrical and electronic equipment). The main implications of the recast WEEE Directive relate to the
collection targets to be achieved by all Member States and the open scope of products covered by the
Directive.
Electrical and electrical equipment is currently classified according to ten categories. This classification
will remain in place until 14 August 2018, after which all electrical and electronic products will be
included in the scope of the Directive (referred to as open scope), and will be classified according to
six categories. On the basis of average weight of EEE placed on the market in the three preceding
years, the collection targets are 45% in 2016 and 65% in 2019. Alternatively, 85% of WEEE generated
in the Member State can be collected in 2019. The Irish WEEE collection target for 2015 will depend
on the amount of household WEEE collected during 2012 to 2014. The WEEE recast must be
transposed into national legislation by 14 February 2014.
19
epp.eurostat.ec.europa.eu/portal/page/portal/waste/data/database
14
2.3.3 End of Waste Criteria
An End of Waste Regulation (EU No 1179/2012)20 for glass cullet was published in the Official Journal
of the European Union in December 2012, and will apply in Member States from 11 June 2013. The
Regulation establishes criteria determining when glass cullet ceases to be waste. The criteria place
limits on the amount of contaminants such as metals, organics and stones which can be contained in
the glass cullet, amongst other obligations. The End of Waste Regulation for scrap iron, steel and
aluminium has been in force since October 2011. Member States failed to reach agreement on
proposed EoW rules for copper and paper in July 2012 although EoW proposals for copper scrap
have been submitted to the Council of Ministers. Other waste streams being considered for EoW
legislation are plastics and biodegradable waste.
20 eur-lex.europa.eu/LexUriServ/LexUriServ.do?uri=OJ:L:2012:337:0031:0036:EN:PDF.
15
3 GENERATION OF MUNICIPAL WASTE
3.1 Quantities and trends
In the context of this report municipal waste consists of three main elements (i) household (ii)
commercial (including non-process industrial waste) and (iii) street cleansing waste (street sweepings,
street bins and municipal parks and cemeteries maintenance waste, litter campaign material).
In 2011, it is estimated that a total of 2,823,242 t of municipal waste was generated in Ireland (Table 2
and Figure 1), continuing the downward trend in municipal waste generation since it peaked in 2007.
The data for household waste generation includes estimates for uncollected household waste
(276,665 t; refer to Section 3.3.4). Municipal waste managed encompasses municipal waste that is
collected, brought directly to waste facilities and home composted; whereas municipal waste
generated also includes the uncollected household waste estimate. An analysis of the main
components of the managed household and commercial municipal streams is discussed in Sections
3.3 and 3.4 of this report.
Table 2: Municipal waste generation, 2006 2011
2006 2007 2008 2009 2010 2011
Household waste (t) 1,978,716 1,761,167 1,677,338 1,626,469 1,686,387
1,683,241
Commercial waste (t) 1,327,068 1,549,075 1,477,397 1,299,807 1,141,015 1,114,829
Cleansing waste (t) (78,822) (87,441) (69,546) 26,701 18,713 25,172
Total municipal waste (t) 3,384,606 3,397,683 3,224,281 2,952,977 2,846,115 2,823,242
% change on previous year’s tonnage
11.3 0.4 -5.1 -8.4 -3.6% -0.8%
(Source: Recovery organisations survey; landfill survey, local authority survey)
Cleansing waste comprises street sweepings, the content of municipal bins, parks and gardens waste.
Fly-tipped material has been assigned to either commercial or household waste categories depending
on description since 2009 and this explains the apparent drop in tonnage of such material since then.
Tracking this latter material over its full management cycle is challenging, as much of this waste is
merged with collected household waste at waste transfer and treatment facilities. Apart from street
sweepings (mixed litter and grit, water etc.), the remainder of this material has a similar character to
household and commercial wastes and is accordingly indistinguishable. The municipal landfill section
of this report (Section 10.1) identifies 25,172 t of street sweepings and parks maintenance waste
disposed of at landfill in 2011, though more was likely collected and co-mingled with household and
commercial streams for landfill.
16
Figure 1: Trends in municipal waste generation and GNP, 2006-201121
Figure 2 shows that there was a substantial drop in municipal waste generation between 2007 and
2011, although the rate of decrease is not as sharp since 2009. This decrease, while reflecting a
decrease in personal consumption, has taken place despite increasing population over the same
time period.
Figure 2: Trends in municipal waste generation, GNP, population and consumption, 2006-201122
21
CSO data on GNP.
22 CSO data on population, GNP and personal consumption.
17
3.2 Forecast for municipal waste generation
The Economic and Social Research Institute (ESRI) was commissioned by the EPA STRIVE research
programme to design and build a Sustainable Development Model for Ireland (ISus)23
that forecasts
national environmental emissions and resource use up to 2030, having regard to economic and social
developments. The ISus model is driven by the ERSI’s HERMES model, which projects economic
production and consumption per sector.
The tonnage of future streams of municipal waste is intricately linked to the performance of the
economy and its ability to move out of recession. Using the ISus model, it is possible to project future
tonnages of municipal waste generation for the period up to 2030 depending on the economic
recovery possibilities.
Using this model, it is anticipated that the total tonnage of municipal waste generated will increase by
approx. 830,000 t within the next 15 years (Figure 3), although generation in the period 2011 to 2016
is anticipated to be more or less static.
Figure 3: Predicted growth in municipal waste generation (ISus model)
While there may be sufficient management capacity in the immediate future, the predicted growth of
municipal waste within the coming decade will necessitate investment in waste management
infrastructure. In addition, waste prevention, resource efficiency and eco-design programmes must
become embedded, in order to ensure the decoupling of waste generation in Ireland from any future
economic growth.
23
For further information on the ISus model see www.esri.ie/research/research_areas/environment/isus/
18
4 MANAGEMENT OF MUNICIPAL WASTE
4.1 Quantities and trends
The quantity of municipal waste managed in 2011 (2,546,577t) indicates a 1% reduction on that
managed in 2010 (2,580,435 t). Disposal and recovery rates for the managed municipal waste
streams are shown in Table 3 and Figure 4. The quantity of municipal waste recovered in 2011
increased by 5% on that reported in 2010 (from 42% to 47%, as a proportion of waste generated),
while the landfill of municipal waste decreased by a corresponding amount. The total managed
municipal waste arisings comprised 1,406,576 t of household wastes, 1,114,829 t of commercial
wastes and 25,172 t of street cleansing wastes. The constituents of the commercial and household
waste streams are examined in greater detail later in this section.
Figure 4 illustrates trends in the recovery and disposal of municipal waste, together with population
growth between 2006 and 2011. The trends illustrated show that since 2007 there is an overall
decrease in municipal waste managed despite population growth.
Table 3: Disposal and recovery of managed municipal waste, 2011
Material Quantity
managed (t)24
Quantity disposed to landfill
(t)
National landfill
disposal rate (%)
Quantity recovered (t)
National recovery rate (%)
Total 2,546,577 1,344,008 53 1,202,569 47
(Source: Recovery organisations survey, local authority survey, landfill survey)
Figure 4: Trends in recovery and disposal of municipal waste, 2006 2011
24
This total doesn’t include estimates of uncollected waste (265,681 t).
19
Although Ireland is still very dependent on landfill for residual waste disposal (53%), the improved
recycling rate (i.e. energy recovery excluded) (40%) is the same as the EU 27 average25
(Figure 5).
Figure 5: Management of Irish municipal waste for 2011 in comparison with EU 27 municipal waste
Table 4 presents the breakdown of the municipal disposal data for 2011 and calculates the market
change since 2010, which is overall a decrease of 10% of municipal solid waste to landfill since 2010.
Notably the household waste stream is down by 11% on 2010 figures, while the commercial waste
stream disposed to landfill is down by 10% on 2010 figures.
Table 4: Change in landfill disposal of municipal waste components between 2010 and 2011
Household waste
disposed to landfill (t)
Commercial waste disposed
to landfill (including non-
process industrial) (t)
Street sweepings disposed to landfill
(t)
Total MSW disposed to
landfill (t)
2010 843,842 633,010 18,713 1,495,56526
2011 750,066 568,770 25,172 1,344,008
% change -11% -10% 35% -10%
25
epp.eurostat.ec.europa.eu/ for 2011 report year. 26
Not including 28,341 t of repatriated waste from historical illegal dumping in Northern Ireland, as this waste was not generated in 2010.
20
4.2 Municipal waste recovery
The following section presents information on recovery of the principal municipal waste streams
managed in Ireland, using data provided by the recovery organisations surveyed.
Table 5 shows that in 2011, approx. 27% of non-hazardous municipal waste recovery took place in
Ireland. Most municipal wood and organic waste was recovered in the State in 2011 (>97%), while
Ireland’s substantial reliance on recovery of municipal recyclables abroad continues (Table 6), in
particular for metals, paper and cardboard and glass, and to a lesser extent for plastic. The tonnage of
refuse derived fuel recovered in the State increased in 2011, although approx. 55% was sent abroad
for recovery. Indaver Carranstown commenced energy recovery of municipal waste towards the end of
2011, which led to an increase in energy recovery within the State.
Table 5: Non-hazardous municipal waste recovered in Ireland, 2010 and 2011 (not including imports)
Material27
2010 2011
Recovered in Ireland (t)
% recovered in Ireland
(compared to total recovery
of each material)
Recovered in Ireland
(t)
% recovered in Ireland
(compared to total recovery
of each material)
Wood 43,81928
99.8 29,765 100
Organic waste29
135,237 94.9 167,440 97.4
Refuse derived fuel30
45,948 48.8 71,387 45.1
Plastic 13,853 19.1 17,146 26.2
Glass 5,112 4.6 6,490 5.3
Paper and cardboard 4,919 0.9 2,197 0.4
Municipal residual/treated residual waste
0 0 37,063 100
Non-ferrous metals 50 0.8 0 -
Total 248,939 22.9 331,487 27.3
(Source: Recovery organisations survey, landfill survey)
27
All hazardous waste has been excluded from this table. See Section 9 for information on hazardous waste recovery. 28
Wood pallets are not classed as municipal waste. 29
Includes edible oils and fats. 30
Used as a fuel.
21
Table 6: Non-hazardous municipal waste recovered abroad, 2010 and 2011 (not including imports)
Material27
2010 2011
Recovered abroad (t)
% recovered abroad
(compared to total recovery
of each material)
Recovered abroad (t)
% recovered abroad
(compared to total recovery
of each material)
Ferrous metals 79,879 100 81,952 100
Other31
564 100 311 100
Mixed metals 10,070 100 0 -
Non-ferrous metals 6,048 99.2 5,317 100
Paper and cardboard 520,623 99.1 540,085 99.6
Glass 106,483 95.4 115,268 94.7
Plastic 58,758 80.9 48,367 73.8
Refuse derived fuel30
48,226 51.2 86,911 54.9
Organic waste33
7,241 5.1 4,450 2.6
Wood 76 0.2 0 -
Total 837,969 77.1 882,660 72.7
(Source: Recovery organisations survey)
Some waste materials are also imported into the State for recovery (Table 7). In 2011, a total of
112,059 t of waste was reported as imported into Ireland by operators that we survey for the National
Waste Report, comprising mainly plastic (57%), wood (15%) and non-ferrous metals (14%).
Table 7: Import of non-hazardous waste for recovery, 2010 and 2011
Material imported for recovery32
2010 (t) 2011 (t)
Plastic 61,952 63,619
Wood 8,012 16,948
Non-ferrous metals 18,552 16,223
Organic waste33
15,272 12,109
Ferrous metals 3,574 2,482
Tyres 859 611
C&D plasterboard 0 27
End of life vehicles 8 21
WEEE 0 18
Paper and cardboard 6 0
Total 108,234 112,059
(Source: Recovery organisations surveys)
31
Composites, mixed packaging. 32
This table includes some non-municipal, non-hazardous wastes imported for recovery (e.g. C&D, tyres). No hazardous waste imports included in this table. See Section 12.5 for information on hazardous waste imported for recovery. 33
Includes edible oils and fats.
22
Table 8 shows the destination of municipal non-hazardous recyclates exported for recovery in 2011.
The total exported was 882,660 t, a 5% increase on the tonnage exported in 2010. The principal
municipal waste exported is paper & cardboard (accounting for 61%). Paper & cardboard, glass,
metals, refuse derived fuel and plastic wastes account for 99% of municipal wastes exported for
treatment. In terms of trends since 2010, paper & cardboard export increased by 4%, glass export by
8% and refuse derived fuel by a significant 80%.
Table 8: Destination of municipal non-hazardous recyclable waste streams exported in 2011
Pa
pe
r &
ca
rdb
oa
rd (
t)
Gla
ss
(t)
Me
tals
(t)
Re
fus
e
de
riv
ed
fu
el
(t)
Pla
sti
c (
t)
Ed
ible
oils
&
fats
(t)
Oth
er
(t)3
4
To
tal
(t)
UK 153,907 78,251 58,955 40,623 4,437 25 336,197
China 161,313 266 161,579
Europe (unspecified)
147,739 8,953 3,751 287 160,729
Netherlands 27,440 28,064 16,287 124 71,915
Latvia 44,119 44,119
India 25,177 500 25,677
Denmark 25,674 25,674
Spain/ Portugal
10,731 14,736 120 25,587
Sweden 13,867 2,382 16,249
Asia (unspecified)
3,942 1,295 5,237
South Korea 2,746 388 3,134
Norway 2,575 2,575
Germany 63 1,054 13 1,130
Belgium 326 478 1 804
United Arab Emirates
727 727
Switzerland 514 514
Italy 462 462
Pakistan 268 268
Saudi Arabia 76 76
Unknown 6 6
Total 540,085 115,268 87,269 86,911 48,367 4,450 311 882,660
(Source: Recovery organisations survey)
The United Kingdom continues to be the principal initial destination (although a percentage of what is
exported to the UK is subsequently bulked and sent outside the UK for treatment). A total of 540,085 t
34
Composite and mixed packaging
23
of paper and cardboard was exported in 2011 for recovery (an increase on 2010), although it is
extremely difficult to report on the final country where actual recovery takes place as some recovery
operators provided the final destination to the EPA, and others provided the next destination (which is
pre-treatment only, eg bulking).
4.3 Household waste
4.3.1 Quantities and trends
The reported quantity of household waste managed (1,406,576 t) decreased by 1% from that reported
for 2010 (Table 9). The quantity of household waste managed is taken as the quantity of waste
reported as collected at kerbside and brought by householders to bring banks, civic amenity sites,
WEEE brought to retailers and to collection days and an estimate of home composted waste
(reference Appendix B). The quantity of household waste disposed to landfill is known from the landfill
surveys; and the quantity recovered is estimated as the difference between the quantity
collected/brought and disposed.
Of household waste managed in 2011, 79% was collected at kerbside, 18% was otherwise brought for
treatment (bring banks, civic amenity sites, directly to landfill, to retailers/collection days in the case of
WEEE) and 3% is the estimate of home composting.
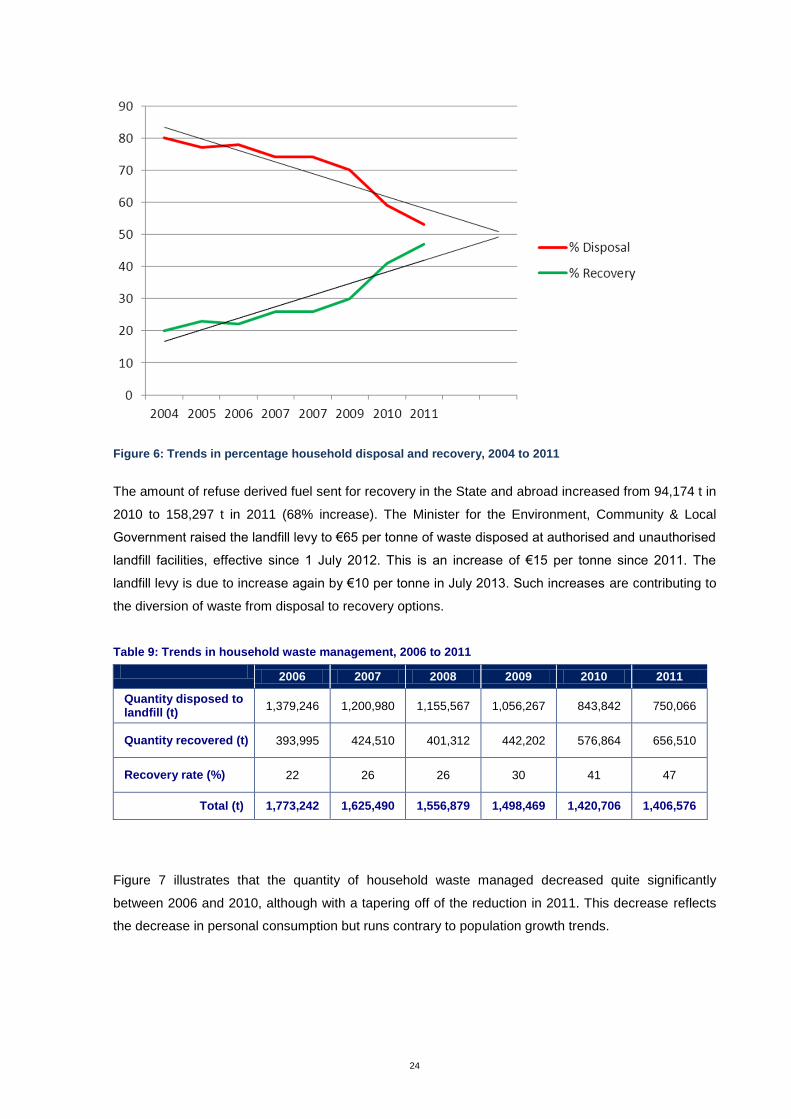
The estimated quantity of household waste recovered increased to 656,510 t. The recovery rate (at
47%) represents a 6% increase on that achieved in 2010. The continuing improvement in household
recovery rates and diversion of household waste from landfill is a very positive step and reflects the
collection of source segregated recyclables at kerbside (including biowaste) and a consistent stream
of dry recyclables from kerbside and bring centres (Figure 6). From current trends in Figure 6 it is
expected that the household waste recovery rate will exceed the disposal rate by the 2013 data report
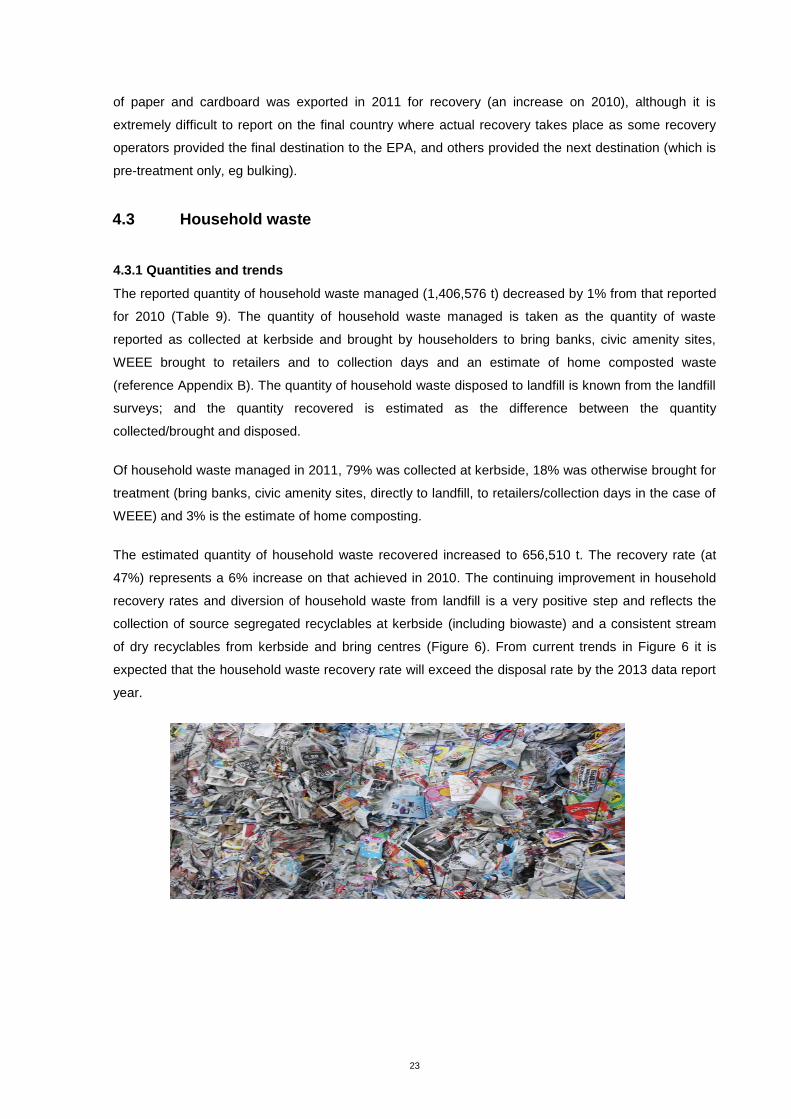
year.
24
Figure 6: Trends in percentage household disposal and recovery, 2004 to 2011
The amount of refuse derived fuel sent for recovery in the State and abroad increased from 94,174 t in
2010 to 158,297 t in 2011 (68% increase). The Minister for the Environment, Community & Local
Government raised the landfill levy to €65 per tonne of waste disposed at authorised and unauthorised
landfill facilities, effective since 1 July 2012. This is an increase of €15 per tonne since 2011. The
landfill levy is due to increase again by €10 per tonne in July 2013. Such increases are contributing to
the diversion of waste from disposal to recovery options.
Table 9: Trends in household waste management, 2006 to 2011
2006 2007 2008 2009 2010 2011
Quantity disposed to landfill (t)
1,379,246 1,200,980 1,155,567 1,056,267 843,842 750,066
Quantity recovered (t) 393,995 424,510 401,312 442,202 576,864 656,510
Recovery rate (%) 22 26 26 30 41 47
Total (t) 1,773,242 1,625,490 1,556,879 1,498,469 1,420,706 1,406,576
Figure 7 illustrates that the quantity of household waste managed decreased quite significantly
between 2006 and 2010, although with a tapering off of the reduction in 2011. This decrease reflects
the decrease in personal consumption but runs contrary to population growth trends.
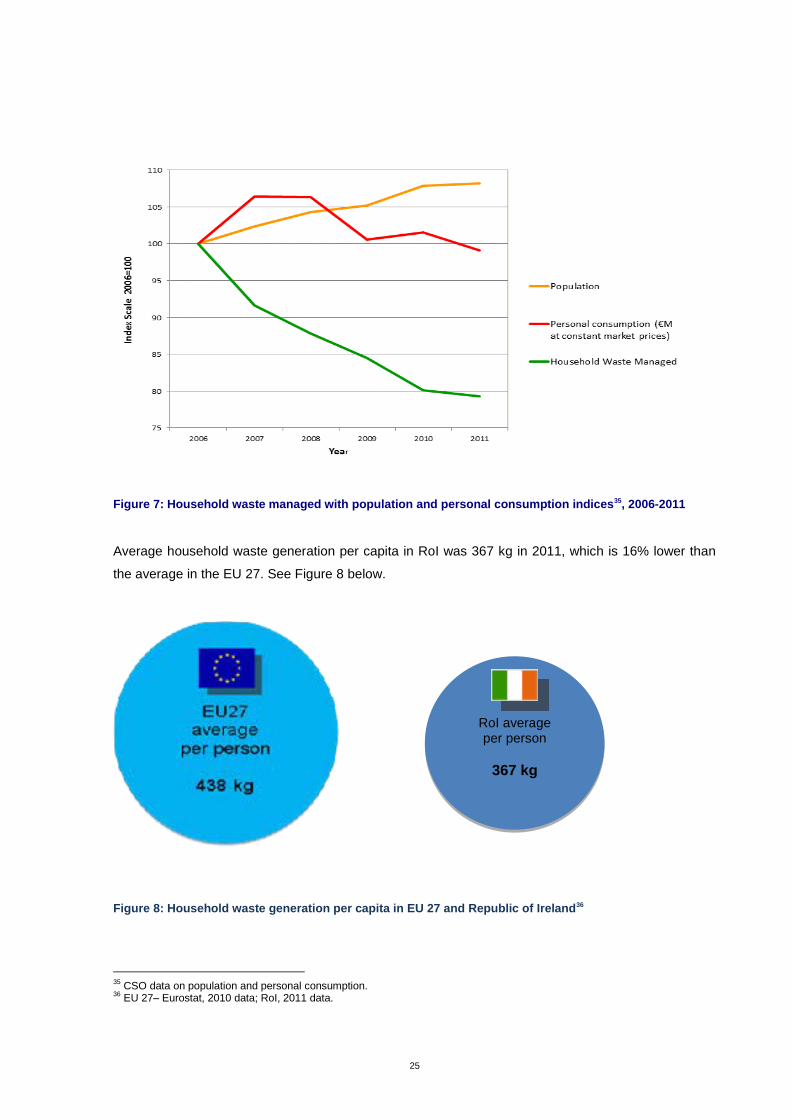
25
Figure 7: Household waste managed with population and personal consumption indices35, 2006-2011
Average household waste generation per capita in RoI was 367 kg in 2011, which is 16% lower than
the average in the EU 27. See Figure 8 below.
Figure 8: Household waste generation per capita in EU 27 and Republic of Ireland36
35
CSO data on population and personal consumption. 36
EU 27– Eurostat, 2010 data; RoI, 2011 data.
RoI average per person
367 kg
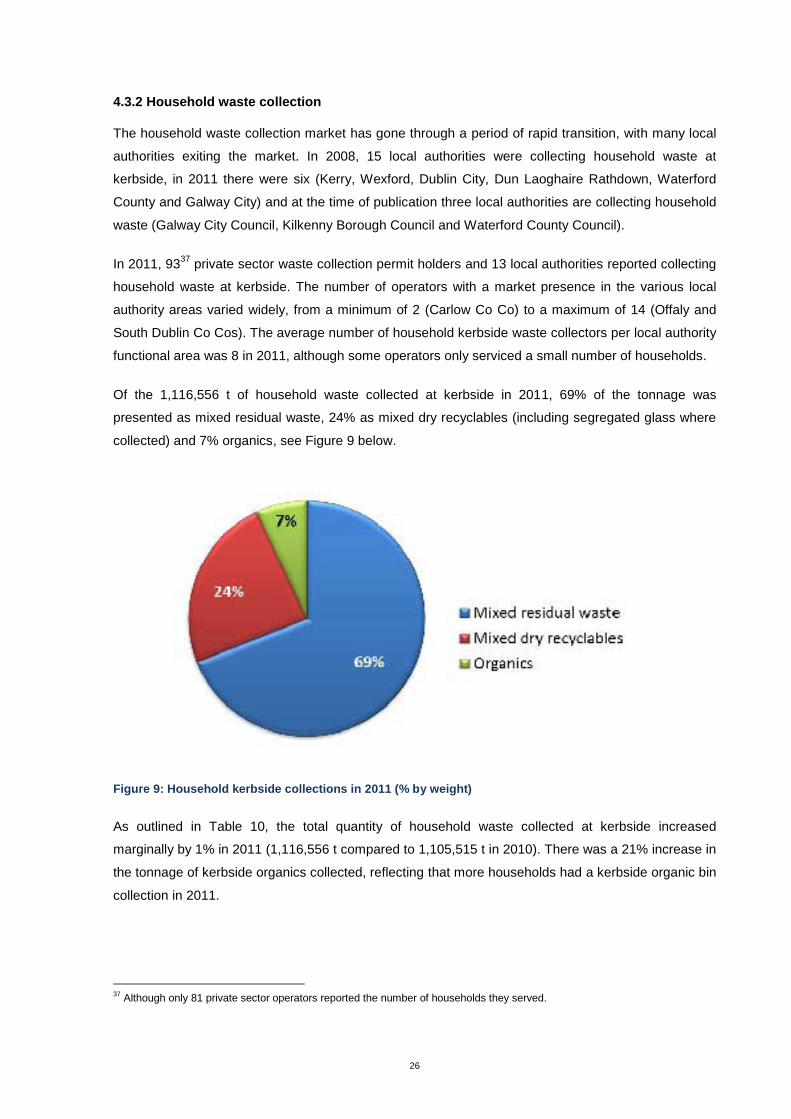
26
4.3.2 Household waste collection
The household waste collection market has gone through a period of rapid transition, with many local
authorities exiting the market. In 2008, 15 local authorities were collecting household waste at
kerbside, in 2011 there were six (Kerry, Wexford, Dublin City, Dun Laoghaire Rathdown, Waterford
County and Galway City) and at the time of publication three local authorities are collecting household
waste (Galway City Council, Kilkenny Borough Council and Waterford County Council).
In 2011, 9337
private sector waste collection permit holders and 13 local authorities reported collecting
household waste at kerbside. The number of operators with a market presence in the various local
authority areas varied widely, from a minimum of 2 (Carlow Co Co) to a maximum of 14 (Offaly and
South Dublin Co Cos). The average number of household kerbside waste collectors per local authority
functional area was 8 in 2011, although some operators only serviced a small number of households.
Of the 1,116,556 t of household waste collected at kerbside in 2011, 69% of the tonnage was
presented as mixed residual waste, 24% as mixed dry recyclables (including segregated glass where
collected) and 7% organics, see Figure 9 below.
Figure 9: Household kerbside collections in 2011 (% by weight)
As outlined in Table 10, the total quantity of household waste collected at kerbside increased
marginally by 1% in 2011 (1,116,556 t compared to 1,105,515 t in 2010). There was a 21% increase in
the tonnage of kerbside organics collected, reflecting that more households had a kerbside organic bin
collection in 2011.
37
Although only 81 private sector operators reported the number of households they served.
27
Table 10: Household kerbside collection tonnages, 2010 and 2011
Kerbside MRW
(t) Kerbside MDR (t)
Kerbside organics
(t)
Kerbside glass (t)
Total (t)
2010 773,321 264,170 63,836 4,188 1,105,515
2011 765,312 269,382 77,494 4,367 1,116,565
Difference -1% +2% +21% +4% +1%
A survey of the character and composition of collected household waste is available on the Waste
Characterisation section of the EPA website www.epa.ie, and summarised in Appendix F of this
report.
Summary information on household waste collection is shown in Appendix B.
CSO’s census data indicate that there were 1,705,394 occupied houses in the State in April 2011 (see
also Table 11). Waste collection permit holders and local authorities reported providing a household
kerbside collection service to 1,197,928 dwellings (approx. 70%), which was further broken down into:
26,631 households (2%) on a single bin (black bin) service only;
723,374 households (61%) on a 2-bin service only (residuals bin and dry recyclables bin); and
447,923 households (37%) on a 3-bin service (residuals bin, dry recyclables bin, and organics
bin).
These data imply that 30% of occupied houses in the State do not avail of, or are not offered, a
kerbside collection service. This is considered to be an overestimation for a number of reasons (i) not
all waste collection permit operators report accurately on the number of apartments they service,
therefore the number of households serviced is under-estimated (apartments accounted for 11% of
households in the State in 2011) (ii) it is difficult for operators who offer a ‘tag-a-bag’ service to
estimate the number of households that these customers represent (iii) many households share a
kerbside bin service with relatives/neighbours and this number of households is an unknown quantity
at present. Finally, other households may have a kerbside collection service available to them, but opt
to bring their waste to bring banks/civic amenity sites, and so while these households are not availing
of a collection service at kerbside, they are not illegally disposing of their waste.
28
Table 11: Percentage of occupied houses on a collection service
Housing stock 2011 CSO census data 1,994,845
Vacant dwellings 2011 CSO census data 289,451
Number of occupied houses 2011 CSO census data 1,705,394
Number of houses on a collection service 2011 Local authority data 1,197,928
% occupied houses on a collection service 70%
Figure 10 presents the relative proportions of the different household waste collection services. The
level of 2-bin and 3-bin penetration has been calculated using the number of household customers
served on a 2-bin or 3-bin as a fraction of the overall number of households with a collection service in
2011. The figures indicate that 98% of serviced households have at least a 2-bin service. It is thus
clear that 98% of collected household waste already meets the minimum EU Landfill Directive
(1999/31/EC) pre-treatment obligations in Article 6 (by virtue of the 2-bin system).
1-Bin only2%
2-Bin only61%
3-Bin37%
Figure 10: Proportion of households on kerbside waste collection services by bin service type
29
Table 12: Distribution and type of collection service providers for household waste
Service
provider(s) (private
sector = PS local
authority = LA)
Kerbside service provided Combined private and
local authority serviced38
Local authority area
MSW /
residual
MDR
(2nd bin)
Organic
(3rd bin)
Glass
(4th bin)
2-bin 3-bin
market
penetration market penetration
Carlow PS
61% 39%
Cavan PS
80% 8%
Clare PS
35% 62%
Cork City PS & LA
99% 0%
Cork County PS
99% 0%
Donegal PS
77% 0%
Dublin City PS & LA
38% 62%
Dun Laoghaire Rathdown
PS & LA
56% 43%
Fingal PS & LA
20% 80%
Galway City PS & LA
13% 87%
Galway County PS
82% 18%
Kerry PS & LA
86% 14%
Kildare PS & LA
64% 36%
Kilkenny PS & LA
90% 5%
Laois PS
38% 60%
Leitrim PS
100% 0%
Limerick City PS
53% 47%
Limerick County PS
52% 48%
Longford PS
67% 30%
Louth PS
68% 24%
Mayo PS
79% 19%
Meath PS
82% 1%
Monaghan PS
85% 13%
North Tipperary PS
74% 24%
Offaly PS
78% 19%
Roscommon PS
74% 26%
Sligo PS
94% 2%
South Dublin PS & LA
25% 74%
South Tipperary PS & LA
82% 16%
Waterford City PS & LA
10% 90%
Waterford County PS & LA
30% 70%
Westmeath PS
98% 1%
Wexford PS & LA
73% 27%
Wicklow PS
94% 5%
(Source: Local authority survey, CSO)
38
Calculations based on the number of households serviced with a 2-bin, 3-bin household waste kerbside collection as a fraction of the total number of households serviced with a kerbside waste collection. No information available for 2011 on the number of households serviced with a 4
th bin, only the tonnage collected.
30
Table 13 presents more detailed data on the collection of organics (household kerbside collections of
organic waste (brown bin) and organic waste brought by householders to civic amenity sites/bring
centres). There was a 21% increase in the tonnage of organic waste reported as collected at kerbside
(from 63, 837 t in 2010 to 77,494 t in 2011). Organic kerbside collections rolled out in a further three
local authority areas in 2011 (Cork County, Kilkenny and South Tipperary County Councils).
Table 13: Household organic wastes collected at kerbside and brought to civic amenity sites
Local authority area
2010 2011
Separate kerbside collection of household organic waste (brown
bins) (t)
Separate kerbside collection of household organic waste (brown
bins) (t)
Local authority Private sector Local authority Private sector
Carlow 0 907 0 376
Cavan 0 109 0 36
Clare 0 875 0 1,069
Cork City 0 0 0 0
Cork County 0 0 0 1,354
Donegal 0 0 0
Dublin City 15,894 132 15,572 1,103
Dun Laoghaire Rathdown 0 22 0 2,408
Fingal 15,701 1,567 12,673 5,444
Galway City 3,457 1,981 3,309 1,695
Galway County 0 1,172 0 1,962
Kerry 358 139 411 138
Kildare 0 4,322 208 3,959
Kilkenny 0 0 0 154
Laois 0 100 0 546
Leitrim 0 0 0 0
Limerick City 0 259 0 605
Limerick County 0 1,060 0 1,309
Longford 0 119 0 326
Louth 0 2,646 0 2,435
Mayo 0 579 0 865
Meath 0 160 0 144
Monaghan 0 421 0 411
North Tipperary 0 123 0 442
Offaly 0 130 0 456
Roscommon 0 103 0 514
Sligo 0 25 0 72
South Dublin 2,736 171 1,723 7,722
South Tipperary 0 0 0 523
Waterford City 3,083 751 349 2,897
Waterford County 1,853 335 1,752 442
Westmeath 0 1 0 12
Wexford 57 2,232 50 2,005
Wicklow 0 258 0 24
Sub-totals (t) 43,139 20,698 35,839 41,655
Totals separate kerbside collection (t)
63,837 77,494
Household organic waste collected at civic amenity sites & bring centres (t)
21,422 18,539
Totals kerbside collection plus civic amenity sites & bring centres (t)
85,259 96,034
(Source: Local authority survey)
31
There was negligible tonnage collected (<200 t) in five local council areas (Figure 11). An amount of
18,539 t of household organic waste (mainly green waste) was separately collected at civic amenity
sites in 2011 (a slight decrease on the 21,422 t reported in 2010).
By end 2011, thirty-one of the thirty-four local authority areas had at least two operators offering a
household kerbside organic bin collection, (although the data do not capture the extent to which the
service is offered over the geographical area of the functional area). The three local authority areas
without any organic bin kerbside service reported in 2011 were Cork City, Donegal and Leitrim. The
market penetration of the 3-bin service varied hugely (1% to 90%) across local authority areas where
the service was available (Tables 12 and 13).
Figure 11: Kerbside collection of household organic waste in 2011 by local authority area
32
4.3.3 Household waste brought to civic amenity sites and bring banks
Local authorities were surveyed to gather data on household waste brought to civic amenity sites and
bring banks. The quantity of household waste deposited at civic amenity sites and bring banks is
continuing to decrease since a peak in 2007/2008. Appendices C and D provide information on waste
types and respective quantities collected at bring banks and civic amenity sites by householders in
2011. Some civic amenity sites also accept waste for disposal in addition to recovery, eg mixed
residual waste and some hazardous waste. The proportion of overall household waste managed that
is accepted at bring banks and civic amenity sites was 16% in 2011, emphasising the importance of
such community infrastructure in the national waste management strategy.
4.3.4 Uncollected household waste
According to information provided by waste collection permit holders and local authorities in the
household waste collection market, approximately 70% of occupied Irish households availed of
kerbside collection in 2011. In some areas, participation rates (in a collection scheme) were as low as
37%; while in some of the larger urban centres, coverage was reported to be close to 100%. Part of
the low participation issue may have been due to no kerbside collection service being offered,
particularly in rural areas.
The amount of waste generated by households and not collected at kerbside was assessed by first
allowing a factor for bin-sharing on collection routes (EPA allowed for 2% bin-sharing at occupied
houses) and then multiplying the percentage of remaining occupied houses without kerbside waste
collection by an average value of waste produced per household. This waste may still have been
collected and entered the waste treatment chain. It may have been brought to civic amenity sites, to
bring banks or directly to landfills; or it may have been fly-tipped and transferred to waste treatment
facilities by local authority personnel. Moreover there is also a proportion that has been home
composted. To work out the amount of uncollected waste, the amount of waste composted at home
and the conventional ‘bin-type’ household waste brought to bring banks, civic amenity sites (other than
glass, bulky waste, some wood, C&D waste and WEEE), as well as that brought to landfills (including
fly-tipped) was subtracted from the amount of waste generated by households and not collected at
kerbside. In 2011, the national estimate of uncollected household waste was 276,665 t.
There will be an environment module in the Central Statistics Office’s Quarterly National Household
survey (QNHS) in late 2013. The QNHS is a large-scale, nationwide survey of households in the
State, designed to produce quarterly labour force estimates but also conducting special modules on
different social topics each quarter. The EPA is working with the CSO and other stakeholders to
include some household waste management questions in this module, in order to have a statistically
valid survey of household waste management behaviours to assist in the implementation and
evaluation of national waste policy. The module will seek to understand what options in respect of
waste management are available to, and availed of by households, including bin-sharing practices,
management of household hazardous wastes and home composting.
33
4.4 Commercial waste
Commercial waste as reported here is municipal waste collected from commercial premises (eg
shops, pubs and restaurants) as well as wastes arising from municipal premises such as schools and
hospitals, and non-process industrial waste (eg factory canteens and offices). After household waste,
this waste stream is the next largest component of municipal waste.
The EPA has validated data-sets on household waste collected at kerbside and brought to civic
amenity sites and bring banks, on household and commercial waste disposed to landfill and on overall
municipal waste recovered (eg material recovery facilities, mechanical treatment activities and
composters). The commercial waste recovered is estimated from analysis of these datasets.
In order to report on the BMW in MSW disposed, the breakdown of municipal waste into household
and commercial is required and has been reported by landfill operators on a quarterly basis since
2010. For recovery organisations accepting dry recyclables, the challenge is to distinguish between
commercial waste that is municipal in nature (i.e. similar to household) and non-municipal. Often
waste operators record wastes incoming as ‘commercial’ because they are from commercial
customers but the wastes are in fact production process wastes. The challenge is to have adequate
waste descriptions on the incoming weighbridge and knowledge of customers to provide this level of
detail. Such classifications impact on recycling and diversion figures for municipal wastes and thus on
target achievement.
It is hoped that, with the evolution of the NWCPO’s e-reporting system for waste collection permit
Annual Environmental Returns, commercial waste collection data as reported by collectors can be
used in future years. However, this will depend on local authorities undertaking a thorough validation
of the data.
The quantity of managed commercial waste in 2011 decreased by 2% compared to 2010 to 1,114,829
t. The recovery rate stands at 49% (Table 14 & Figure 12).
Table 14: Commercial waste management, 2006 to 2011
2006 2007 2008 2009 2010 2011
Quantity disposed to landfill (t)
601,372 813,818 758,178 640,737 633,010 568,770
Quantity recovered (t) 725,697 735,257 719,219 659,070 508,005 546,059
Recovery rate (%) 55% 48% 49% 51% 45% 49%
Total (t) 1,327,068 1,549,075 1,477,397 1,299,807 1,141,015 1,114,829
(Source: Recovery organisations survey, local authority survey, landfill survey)
34
Figure 12: Commercial waste generation and GNP, 2006 to 2011
Figure 13: Commercial waste disposal and recovery trend, 2004 to 2011
As evident from Figure 13, there has been no significant increase in relation to the proportion of
commercial waste recovered since 2004, which is a strong indicator of poor market behaviours.
The EPA published surveys on the character and composition of commercial waste in 2009 (Municipal
Waste Characterisation 2008 Surveys) and in 2010 (3rd
Bin Commercial Waste Bin Characterisation
35
Report). The results of the 2008 surveys are summarised in Appendix H and the full reports are
available for download from the Waste Characterisation section of the EPA website, www.epa.ie.
4.5 Recovery of municipal waste and economic performance
Figure 14 below tracks recovery of household and commercial waste from 2006 to 2011 along with
economic performance (gross national product). The tonnage of household waste recovered in
particular is of note, as it continues to increase despite poor economic performance since the
economic downturn commenced.
Figure 14: Recovery of household and commercial waste and economic performance
36
5 BIODEGRADABLE MUNICIPAL WASTE
5.1 Introduction
Biodegradable municipal waste (BMW) comprises those elements of the household, commercial
(including non-process industrial waste) and cleansing waste streams that will rot or degrade
biologically. The main constituents of the biodegradable proportion of municipal waste are typically
parks and garden waste, food waste, timber, paper, card and textiles.
There are two key pieces of EU legislation that deal with biodegradable waste. The first is the Landfill
Directive39
(1999/31/EC), which requires the diversion of biodegradable waste from landfill. The
second EU instrument is the Waste Framework Directive (2008/98/EC), Article 22 of which requires
Member States to take measures to encourage separate collection of biowaste (putrescible portion of
biodegradable wastes).
5.2 EU Landfill Directive
In relation to biodegradable municipal waste, the Landfill Directive sets limits on what can be sent to
landfill. These limitations (which are tied to the 1995 statistical base year for waste production in
Ireland40
) are phased, with each phase having a stricter obligation in relation to diversion. Ireland
negotiated with the EU Commission for a four-year extension to the first two compliance dates
specified in Article 5 (2006 to 2010, and 2009 to 2013 respectively). These obligations are
summarised in Table 15.
Table 15: Targets for biodegradable waste diversion from landfill (per Directive 1999/31/EC)41
Baseline Quantity BMW generated (t)
1995 1,220,840
Targets
Target year42
Landfill Directive target Maximum quantity allowed to be landfilled
(t, rounded)
2010 75% of quantity BMW generated in
1995 916,000
2013 50% of quantity BMW generated in
1995 610,000
2016 35% of quantity BMW generated in
1995 427,000
39
eur-lex.europa.eu/LexUriServ/LexUriServ.do?uri=OJ:L:1999:182:0001:0019:EN:PDF 40
National Waste Database Report 1995. EPA, 1996. 41
Revised in the National Waste Report 2008. 42
The Landfill Directive allows Ireland to avail of a derogation under Article 5 which postponed the 2006 and 2009 targets for 4 years.
37
5.3 Municipal biodegradable waste arisings
The EPA funded municipal waste characterisation study (2008)43
yields characterisation and
biodegradability factors for household and commercial waste streams. The summary results of this
study are presented for convenience in Appendix H. This characterisation work in addition to the
recent work undertaken on characterisation of outputs from waste treatment processes (Protocol for
the Evaluation of Biodegradable Municipal Waste to Landfill, EPA 2011) are essential to the
calculation of achievement of Landfill Directive targets as well as the assessment of greenhouse gas
emissions.
In determining the BMW content of a municipal waste stream, two general approaches may be used:
Where appropriate, EPA approved BMW factors can be used to calculate the BMW content of
the waste stream (Appendix H); or
With the agreement of the EPA, alternative BMW factors can be used for municipal waste
streams if they have been determined following a waste characterisation survey carried out in
accordance with this protocol.
BMW arisings in Ireland in 2011 are presented in Table 16. It is estimated that there was 1,789,054 t
of BMW in managed municipal solid waste (MSW) in 2011. The higher proportion of biodegradables in
the commercial waste stream means that the BMW arisings for this stream are broadly similar to the
household stream despite the significant difference in total tonnage managed for each.
Table 16: BMW in managed municipal waste streams for 2011
Municipal waste stream Tonnage managed BMW content
(refer Appendix H) BMW arisings 2011
Household 1,406,576 65% 914,274
Municipal sweepings & parks 25,172 65% 16,362
Commercial 1,114,829 77% 858,418
Total: 1,789,054
EPA municipal waste characterisation studies summarised in Appendix H indicate that organics (food
and garden waste) comprise approx. 23% by weight of the gross household bin waste stream and
27.5% by weight of the commercial bin. This equates to an estimate ‘available’ household organic
waste content of approx. 255,803 t in the kerbside collected waste stream, of which 96,034 t (38%) is
reported separately collected at kerbside and brought to civic amenity facilities (Table 13). The
potential available organic waste in commercial waste stream is 306,578 t.
Even if one factors in the home composting estimate (37,545 t, refer Appendix B) and the organic
waste delivered by households to civic amenity sites (18,539 t) there remains a conservative estimate
of approx. 122,225 t available organic waste in the managed household waste stream that is not
43
www.epa.ie/pubs/reports/waste/wastecharacterisation/.
38
separately collected at kerbside. It is accepted that not all of this potentially ‘available’ organic material
is suitable for brown-bin collection systems (eg food still in packaging). Nevertheless, greater
penetration of the third organics bin to householders across the State (currently estimated at only 37%
of householders that are on a kerbside collection service) would significantly cut into the available
material and divert it from landfill, and it is anticipated that the recently published household food
waste and biowaste regulations (S.I. No. 71 of 2013) will assist in this regard for 2013 and beyond.
It is difficult from available records to accurately estimate the proportion of the commercial bin that is
separately collected as organics. We know from Tables 5 and 6 that 171,890 t of municipal derived
organic wastes was recovered. Removing the household component (96,033 t collected at kerbside
and brought to civic amenity sites) leaves an estimated 75,857 t of source separated commercially
derived organic waste. It is therefore possible to suggest that an additional 230,721 t of commercial
derived organic waste (from the 306,578 t available) is not separately collected, though like household
waste not all of this is suitable or available for source separate collection (food waste in packaging).
That said, these results suggest that only 25% of the available commercial organic waste is collected
and therefore indicates that the 2009 Waste Management (Food Waste) Regulations which place
obligations on the commercial sector to segregate food waste have yet to result in appropriate
behavioural change.
5.4 BMW disposed to landfill
In order to assist Ireland’s obligations under the Landfill Directive (1999/31/EC), the EPA reviewed all
operational MSW landfill licences in 2009. New conditions were inserted into the licences limiting the
acceptance of BMW and requiring the determination of the biodegradable content of MSW sent to
landfill.
The landfill operator is required to report to the EPA on a quarterly basis the quantity of MSW and
BMW accepted at the landfill. The EPA has developed an easy to use web-based reporting system to
streamline the reporting of BMW data. This web-based system incorporates EPA approved BMW
factors necessary to calculate the BMW content of various municipal waste streams.44
The overall amount of BMW in MSW landfilled nationally in 2011 as reported by landfill operators to
the EPA was 771,551 t (which equates to 57% BMW in MSW). This is less than the Landfill Directive
target of 916,000 t. See Table 17 below.
An analysis of the types of MSW accepted for disposal during 2011 is shown in Table 18. When
compared to data available for the second half of 2010, there has been an approximate twenty-fold
increase in the tonnage of bio-stabilised residual waste sent to landfill, albeit from a very low base (an
increase from 971 tonnes pro-rata in 2010 to 19,080 tonnes in 2011). This indicates that there has
44 www.epa.ie/pubs/advice/waste/municipalwaste/
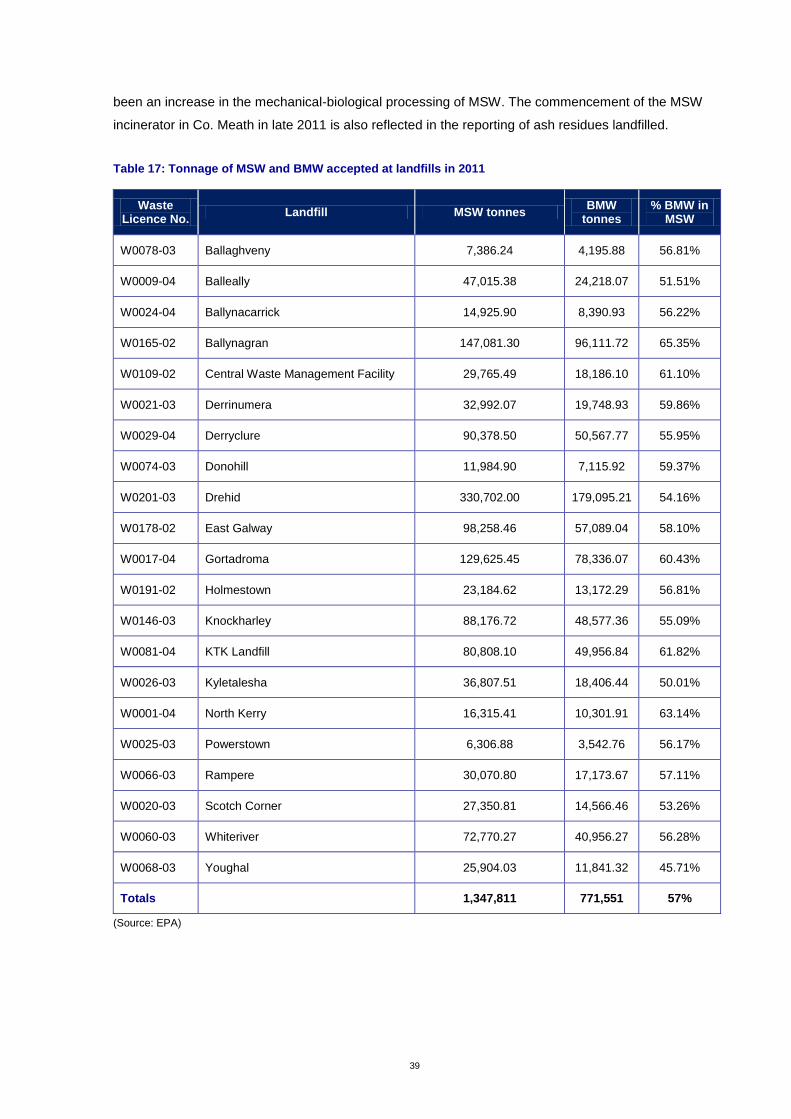
39
been an increase in the mechanical-biological processing of MSW. The commencement of the MSW
incinerator in Co. Meath in late 2011 is also reflected in the reporting of ash residues landfilled.
Table 17: Tonnage of MSW and BMW accepted at landfills in 2011
Waste Licence No.
Landfill MSW tonnes BMW
tonnes % BMW in
MSW
W0078-03 Ballaghveny 7,386.24 4,195.88 56.81%
W0009-04 Balleally 47,015.38 24,218.07 51.51%
W0024-04 Ballynacarrick 14,925.90 8,390.93 56.22%
W0165-02 Ballynagran 147,081.30 96,111.72 65.35%
W0109-02 Central Waste Management Facility 29,765.49 18,186.10 61.10%
W0021-03 Derrinumera 32,992.07 19,748.93 59.86%
W0029-04 Derryclure 90,378.50 50,567.77 55.95%
W0074-03 Donohill 11,984.90 7,115.92 59.37%
W0201-03 Drehid 330,702.00 179,095.21 54.16%
W0178-02 East Galway 98,258.46 57,089.04 58.10%
W0017-04 Gortadroma 129,625.45 78,336.07 60.43%
W0191-02 Holmestown 23,184.62 13,172.29 56.81%
W0146-03 Knockharley 88,176.72 48,577.36 55.09%
W0081-04 KTK Landfill 80,808.10 49,956.84 61.82%
W0026-03 Kyletalesha 36,807.51 18,406.44 50.01%
W0001-04 North Kerry 16,315.41 10,301.91 63.14%
W0025-03 Powerstown 6,306.88 3,542.76 56.17%
W0066-03 Rampere 30,070.80 17,173.67 57.11%
W0020-03 Scotch Corner 27,350.81 14,566.46 53.26%
W0060-03 Whiteriver 72,770.27 40,956.27 56.28%
W0068-03 Youghal 25,904.03 11,841.32 45.71%
Totals 1,347,811 771,551 57%
(Source: EPA)
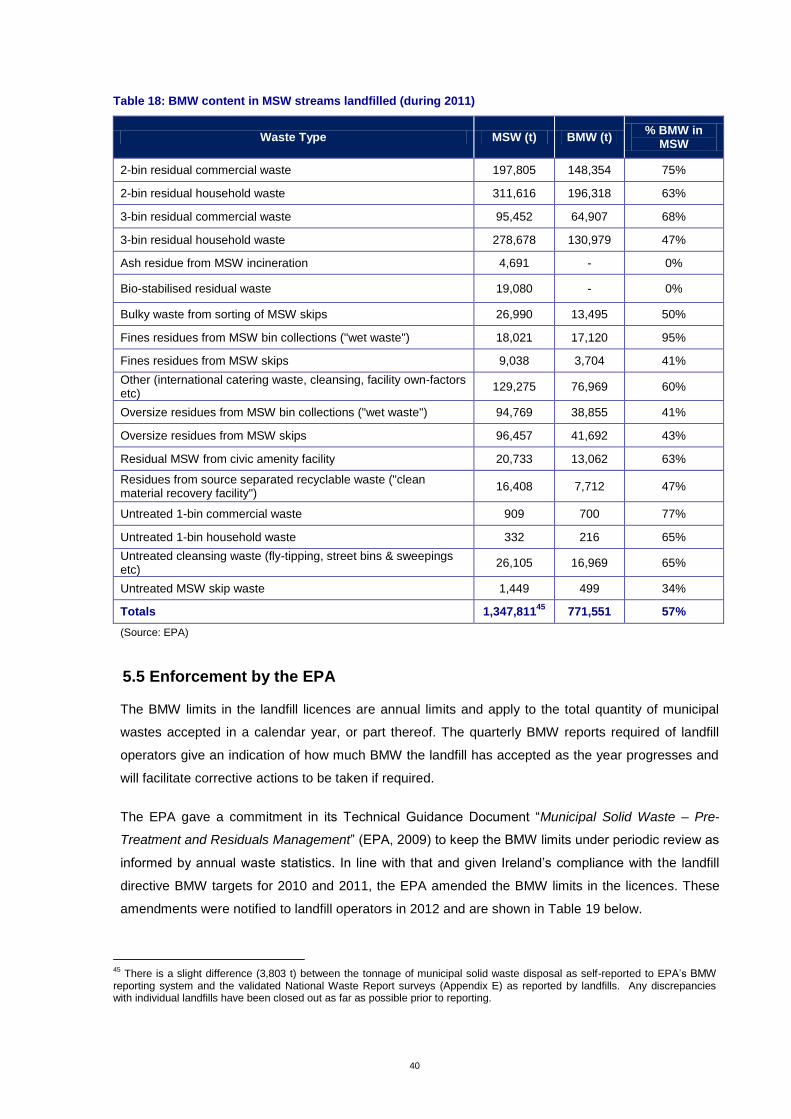
40
Table 18: BMW content in MSW streams landfilled (during 2011)
Waste Type MSW (t) BMW (t) % BMW in
MSW
2-bin residual commercial waste 197,805 148,354 75%
2-bin residual household waste 311,616 196,318 63%
3-bin residual commercial waste 95,452 64,907 68%
3-bin residual household waste 278,678 130,979 47%
Ash residue from MSW incineration 4,691 - 0%
Bio-stabilised residual waste 19,080 - 0%
Bulky waste from sorting of MSW skips 26,990 13,495 50%
Fines residues from MSW bin collections ("wet waste") 18,021 17,120 95%
Fines residues from MSW skips 9,038 3,704 41%
Other (international catering waste, cleansing, facility own-factors etc)
129,275 76,969 60%
Oversize residues from MSW bin collections ("wet waste") 94,769 38,855 41%
Oversize residues from MSW skips 96,457 41,692 43%
Residual MSW from civic amenity facility 20,733 13,062 63%
Residues from source separated recyclable waste ("clean material recovery facility")
16,408 7,712 47%
Untreated 1-bin commercial waste 909 700 77%
Untreated 1-bin household waste 332 216 65%
Untreated cleansing waste (fly-tipping, street bins & sweepings etc)
26,105 16,969 65%
Untreated MSW skip waste 1,449 499 34%
Totals 1,347,81145
771,551 57%
(Source: EPA)
5.5 Enforcement by the EPA
The BMW limits in the landfill licences are annual limits and apply to the total quantity of municipal
wastes accepted in a calendar year, or part thereof. The quarterly BMW reports required of landfill
operators give an indication of how much BMW the landfill has accepted as the year progresses and
will facilitate corrective actions to be taken if required.
The EPA gave a commitment in its Technical Guidance Document “Municipal Solid Waste – Pre-
Treatment and Residuals Management” (EPA, 2009) to keep the BMW limits under periodic review as
informed by annual waste statistics. In line with that and given Ireland’s compliance with the landfill
directive BMW targets for 2010 and 2011, the EPA amended the BMW limits in the licences. These
amendments were notified to landfill operators in 2012 and are shown in Table 19 below.
45
There is a slight difference (3,803 t) between the tonnage of municipal solid waste disposal as self-reported to EPA’s BMW reporting system and the validated National Waste Report surveys (Appendix E) as reported by landfills. Any discrepancies with individual landfills have been closed out as far as possible prior to reporting.
41
Table 19 Change in BMW limits in landfill licences
Time period Previous % BMW Limit New % BMW limit specified
in 2012
To 30 June 2013 47% 55%
1 July 2013 – 30 June 2016 30% 40%
From 1 July 2016 15% 15%
Figure 15 shows the tonnes of MSW and BMW landfilled per quarter versus Landfill Directive Targets
since the BMW limits came into force in the landfill licences.
The EPA will continue to assess the BMW reports received. Records and documentation will be
examined at waste facilities in order to look behind the system used in determining BMW content of
waste disposed of. Appropriate enforcement actions will be taken where necessary.
0
50,000
100,000
150,000
200,000
250,000
300,000
350,000
400,000
450,000
Q3 2010 Q4 2010 Q1 2011 Q2 2011 Q3 2011 Q4 2011
MSW tonnes
BMW tonnes
2016 onwards
2010/2011/2012
2013/2014/2015
Figure 15: Tonnage of MSW and BMW landfilled per quarter in 2011 versus Landfill Directive Targets
5.6 Future actions for biodegradable waste
The separate kerbside collection of household food and garden waste (in a 3-bin system) has
increased in recent years, and 77,494 t was collected from households in 2011. The separate
Ton
ne
s
42
collection of non-household municipal food waste was reported as 63,000 t in 2011, with 19,000 t of
green waste reported collected from non-household sources.46 The segregation of food waste by major
generators within the commercial sector has been a requirement since the obligations of the Waste
Management (Food Waste) Regulations 2009 came into effect on 1 July 2010.
In July 2012, the DECLG published a summary a Regulatory Impact Analysis on Household Waste
Collection,47 which recommended that the Government preserves the current household waste
collection market structure and strengthens the regulatory regime which applies, which would include
mandated service levels including the provision of segregated waste collections. The policy of
retaining the current market structure will be reviewed in 2016. The EU (Household Food Waste and
Bio-Waste) Regulations, published in March 2013, will place obligations on householders that produce
food waste to segregate it and present it for collection. The Regulations will also place obligations on
waste collectors to provide a food waste collection service for householders, on a phased basis
(based on population agglomerations) from July 2013 to July 2016. It is anticipated that following
implementation and enforcement of these Regulations that household food waste will be diverted from
landfill.
Source separated collections of biodegradable waste in themselves will not ensure that Ireland meets
the diversion targets set out in the EU Landfill Directive. For example, the residual bin from a three bin
household collection service can contain up to 47% biodegradables (by weight) (see Table H-1 of
Appendix H). Treatment of this biodegradable component of the residual waste will be essential in
order to meet the 2013 and 2016 Landfill Directive diversion obligations (see distance to target
estimates in Table 20). To date there has been reported growing development, and consistent
operation, of infrastructure to deal with the biodegradable component of the residual bin from
municipal waste collections (an increase from 971 t residual biostabilised in 2010 to 19,080 t in 2011).
Waste to energy incineration and refuse derived fuel use will certainly contribute, as will mechanical
biological treatment (MBT) processes.
The increasing landfill levy and the economic down-turn contributed in significant ways to Ireland’s
achievement of the first EU Landfill Directive diversion target (July 2010) for biodegradable waste
through significant decreases in municipal waste generation and quantity of residual waste consigned
to landfill. In order to ensure compliance with future EU targets (particularly as the economy recovers),
efforts in waste prevention, diversion to recovery and the development of necessary supporting
infrastructure must continue.
The Government increased the landfill levies from €50 per tonne in 2011, to €65 per tonne in 2012
and this is due to rise again in 2013 to €75 per tonne. This levy will make pre-treatment more cost
effective - particularly in respect of BMW - thereby reducing the quantities and costs of residual
disposal to landfill. Preliminary 2012 data indicates that Ireland is on track to meet the 2013 target, but
46
Source – waste collection permit annual returns, food waste (EWC 20 01 08) and green waste (20 02 01). 47
www.environ.ie/en/Environment/RHLegislation/FileDownLoad,30784,en.pdf
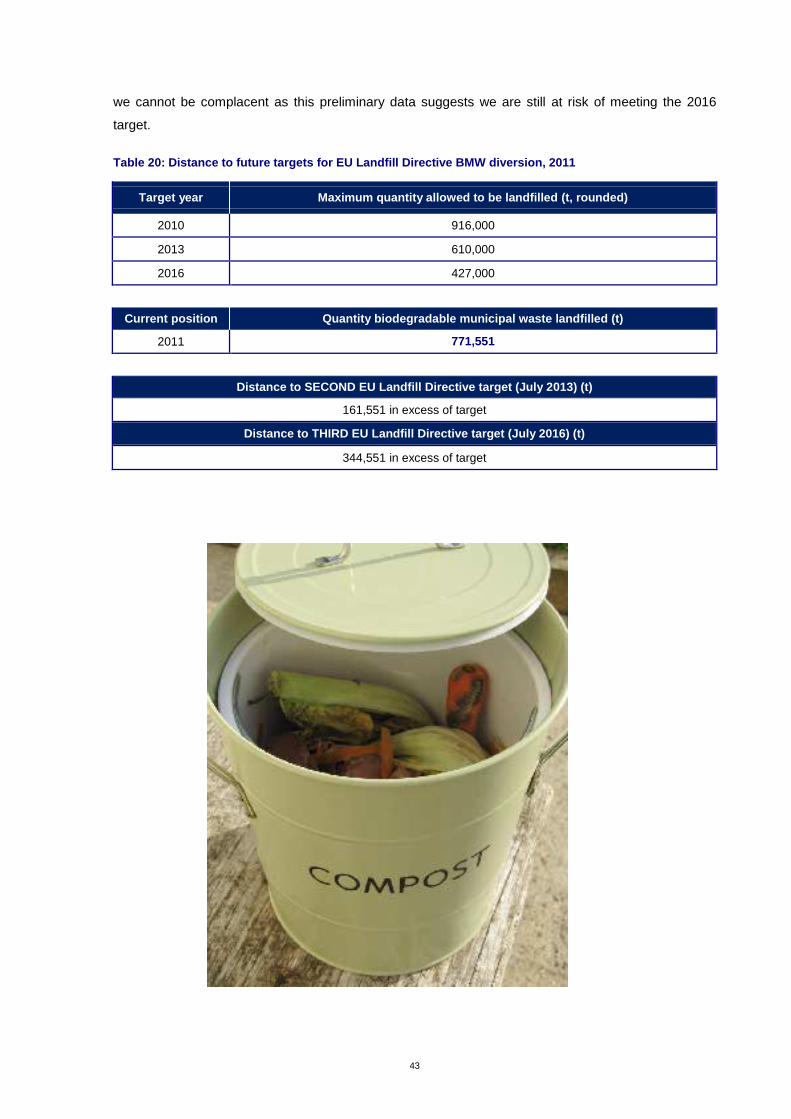
43
we cannot be complacent as this preliminary data suggests we are still at risk of meeting the 2016
target.
Table 20: Distance to future targets for EU Landfill Directive BMW diversion, 2011
Target year Maximum quantity allowed to be landfilled (t, rounded)
2010 916,000
2013 610,000
2016 427,000
Current position Quantity biodegradable municipal waste landfilled (t)
2011 771,551
Distance to SECOND EU Landfill Directive target (July 2013) (t)
161,551 in excess of target
Distance to THIRD EU Landfill Directive target (July 2016) (t)
344,551 in excess of target
44
6 MUNICIPAL WASTE INFRASTRUCTURE
6.1 Introduction
This section examines the provision of some key national waste infrastructure necessary for final
disposal and recovery of municipal wastes. Landfills at EPA IPPC licensed activities and other
industrial waste treatment infrastructure (such as on-site incinerators) are not dealt with as these are
not available to the general public, local authorities or merchant waste operators. Information on
national waste infrastructure and capacity cannot be easily accessed or reported for 2011 as there
currently is no central national register of authorised waste activities.
There are essentially three tiers of waste treatment authorisations. The EPA issue waste licences,
local authorities issue waste facility permits and the EPA and local authorities issue Certificates of
Registration (EPA issue Certificates of Registration to local authorities, and local authorities issue
them to the private sector). There is also the waste collection permitting regime, which has been the
responsibility of NWCPO at Offaly County Council since February 2012.
The EPA holds a register of licensed waste activities and certificates of registration issued to local
authorities. NWCPO maintains a register of waste collection permit holders. There is however no
complete register for local authority issued waste facility permits and certificates of registration. The
Waste Permit and Certificate of Registration Database (maintained on EPA’s website48
) is incomplete
as not all local authorities have been keeping the database up-to-date. A single (or linked) national
register(s) of waste treatment facilities and capacity in the State would significantly enhance national
and EU reporting obligations (e.g. Waste Statistics Regulation).
6.2 Municipal landfill
A total of 21 municipal landfills accepted 1,344,008 t of municipal solid waste (MSW) for disposal in
2011. The market share for merchant private and public sector landfill activities for municipal waste is
set out in Table 21.
48
See www.epa.ie/wastepermit/
45
Table 21: Market share of public and private landfills operating in 2011
Ye
ar:
20
11
Number of
merchant
MSW
landfills49
Household waste market
disposed to private sector
landfills
Commercial waste market
disposed to private sector
landfills
MSW disposal market
served by private sector
landfills
MSW recovery to
private sector landfill
Merchant national
landfill for industrial
waste served by
private sector (from Appendix E)
Merchant national landfill
disposal (all classes bar C&D and
Clonbulloge) served by
private sector (from Appendix E)
5 private sector
42% 74% 55% 99% 81% 56% 16 local
authority
(Source: Landfill survey)
Across all facilities, 8,008 t of municipal waste were recovered (composted/stabilised organics used for
cover, landscaping, etc.). Off-specification compost and trommel fines used for daily cover that do not
meet EPA stability standard are not classed as recovery.
Total residual municipal waste disposed to landfill in 2011 fell 10% on that disposed in 2010. The
1,344,008 t of municipal waste disposed in the MSW landfills consisted of 750,066 t of household
waste, 568,770 t of commercial waste and 25,172 t of municipal sweepings and parks waste
(Appendix E). Table 22 shows the breakdown of waste accepted at merchant private and public sector
landfills. A more detailed breakdown of waste accepted at all landfills in operation is also provided in
Appendix E. A list of closed landfills with waste infrastructure operational at the site in 2011
(composting facility, civic amenity site, waste transfer station) is provided in Appendix F.
6.3 Municipal landfill disposal capacity
At the end of 2011, the remaining capacity of fully consented MSW landfill capacity (i.e. with waste
licence and planning permission in place) was approximately 15 Mt nationally (Table 21). This
estimate includes one consented facility that has yet to commence waste acceptance operations
(Bottlehill Landfill in Cork County Council area (EPA licence register no. W0161-02)), and contributes
a potential 5.4 Mt to this national reserve capacity figure (i.e. over one third of remaining national
capacity).
A breakdown of MSW disposal capacity by landfill is shown in Table 23 and illustrated in Figure 16. Of
the resultant 15 Mt operational municipal landfill capacity nationally, 45% of this is owned by just four
private sector landfills (three of which are owned by one operator). If disposal to MSW landfill were to
continue at the 2011 rate of approximately 1.3 Mt per annum, this means that there is approximately
11 years consented municipal waste landfill capacity remaining, i.e. enough capacity to last to circa
49
Excluding Clonbullogue Ash Depository and Murphy Concrete Manufacturing Ltd.
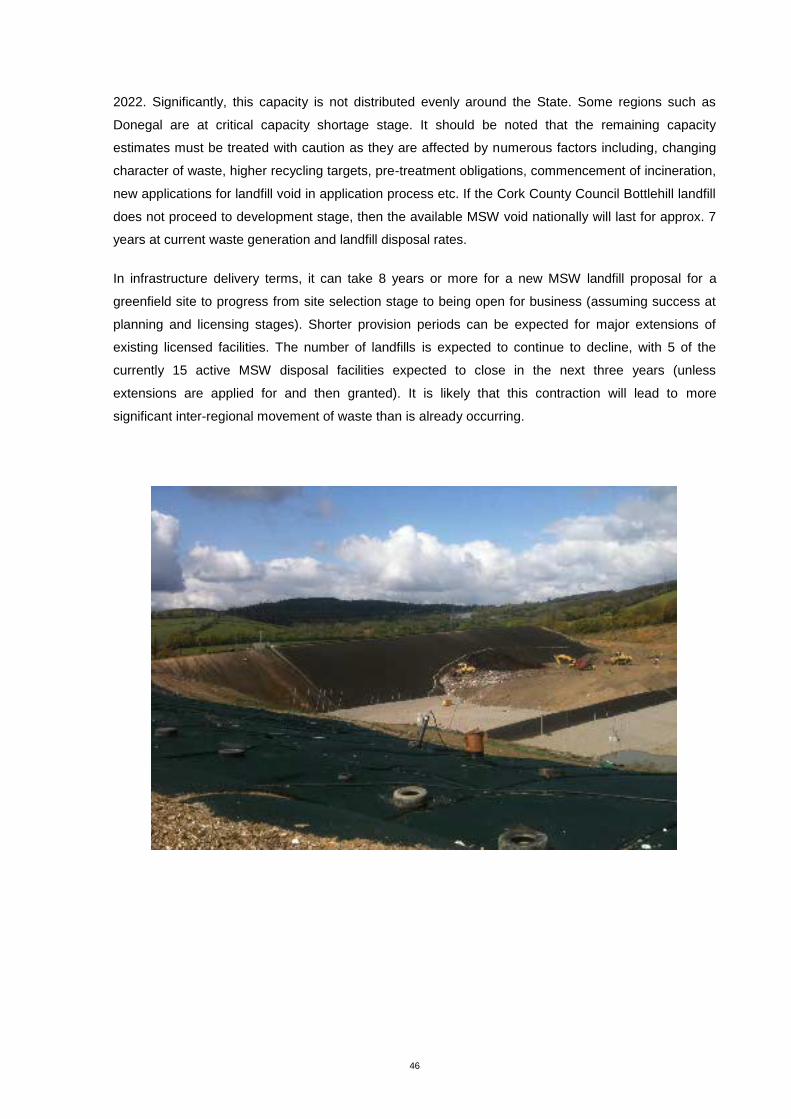
46
2022. Significantly, this capacity is not distributed evenly around the State. Some regions such as
Donegal are at critical capacity shortage stage. It should be noted that the remaining capacity
estimates must be treated with caution as they are affected by numerous factors including, changing
character of waste, higher recycling targets, pre-treatment obligations, commencement of incineration,
new applications for landfill void in application process etc. If the Cork County Council Bottlehill landfill
does not proceed to development stage, then the available MSW void nationally will last for approx. 7
years at current waste generation and landfill disposal rates.
In infrastructure delivery terms, it can take 8 years or more for a new MSW landfill proposal for a
greenfield site to progress from site selection stage to being open for business (assuming success at
planning and licensing stages). Shorter provision periods can be expected for major extensions of
existing licensed facilities. The number of landfills is expected to continue to decline, with 5 of the
currently 15 active MSW disposal facilities expected to close in the next three years (unless
extensions are applied for and then granted). It is likely that this contraction will lead to more
significant inter-regional movement of waste than is already occurring.
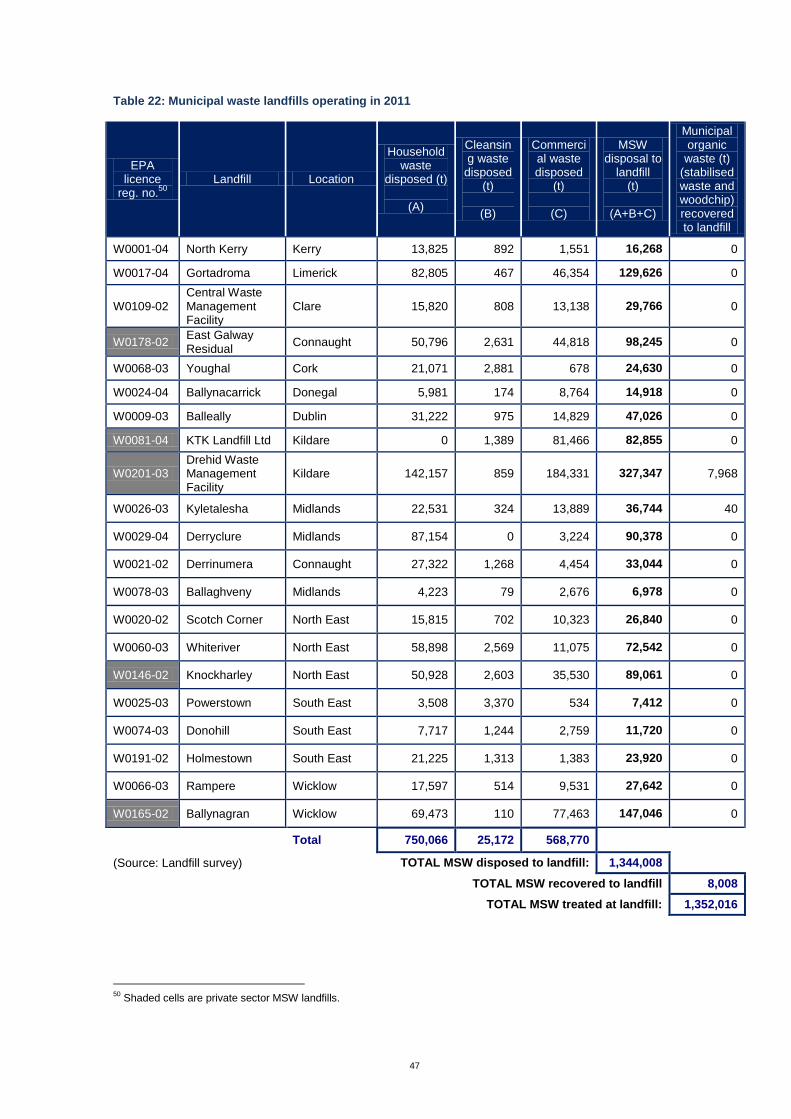
47
Table 22: Municipal waste landfills operating in 2011
EPA licence
reg. no.50
Landfill Location
Household waste
disposed (t)
(A)
Cleansing waste
disposed (t)
(B)
Commercial waste disposed
(t)
(C)
MSW disposal to
landfill (t)
(A+B+C)
Municipal organic waste (t)
(stabilised waste and woodchip) recovered to landfill
W0001-04 North Kerry Kerry 13,825 892 1,551 16,268 0
W0017-04 Gortadroma Limerick 82,805 467 46,354 129,626 0
W0109-02 Central Waste Management Facility
Clare 15,820 808 13,138 29,766 0
W0178-02 East Galway Residual
Connaught 50,796 2,631 44,818 98,245 0
W0068-03 Youghal Cork 21,071 2,881 678 24,630 0
W0024-04 Ballynacarrick Donegal 5,981 174 8,764 14,918 0
W0009-03 Balleally Dublin 31,222 975 14,829 47,026 0
W0081-04 KTK Landfill Ltd Kildare 0 1,389 81,466 82,855 0
W0201-03 Drehid Waste Management Facility
Kildare 142,157 859 184,331 327,347 7,968
W0026-03 Kyletalesha Midlands 22,531 324 13,889 36,744 40
W0029-04 Derryclure Midlands 87,154 0 3,224 90,378 0
W0021-02 Derrinumera Connaught 27,322 1,268 4,454 33,044 0
W0078-03 Ballaghveny Midlands 4,223 79 2,676 6,978 0
W0020-02 Scotch Corner North East 15,815 702 10,323 26,840 0
W0060-03 Whiteriver North East 58,898 2,569 11,075 72,542 0
W0146-02 Knockharley North East 50,928 2,603 35,530 89,061 0
W0025-03 Powerstown South East 3,508 3,370 534 7,412 0
W0074-03 Donohill South East 7,717 1,244 2,759 11,720 0
W0191-02 Holmestown South East 21,225 1,313 1,383 23,920 0
W0066-03 Rampere Wicklow 17,597 514 9,531 27,642 0
W0165-02 Ballynagran Wicklow 69,473 110 77,463 147,046 0
Total 750,066 25,172 568,770
(Source: Landfill survey) TOTAL MSW disposed to landfill: 1,344,008
TOTAL MSW recovered to landfill 8,008
TOTAL MSW treated at landfill: 1,352,016
50
Shaded cells are private sector MSW landfills.
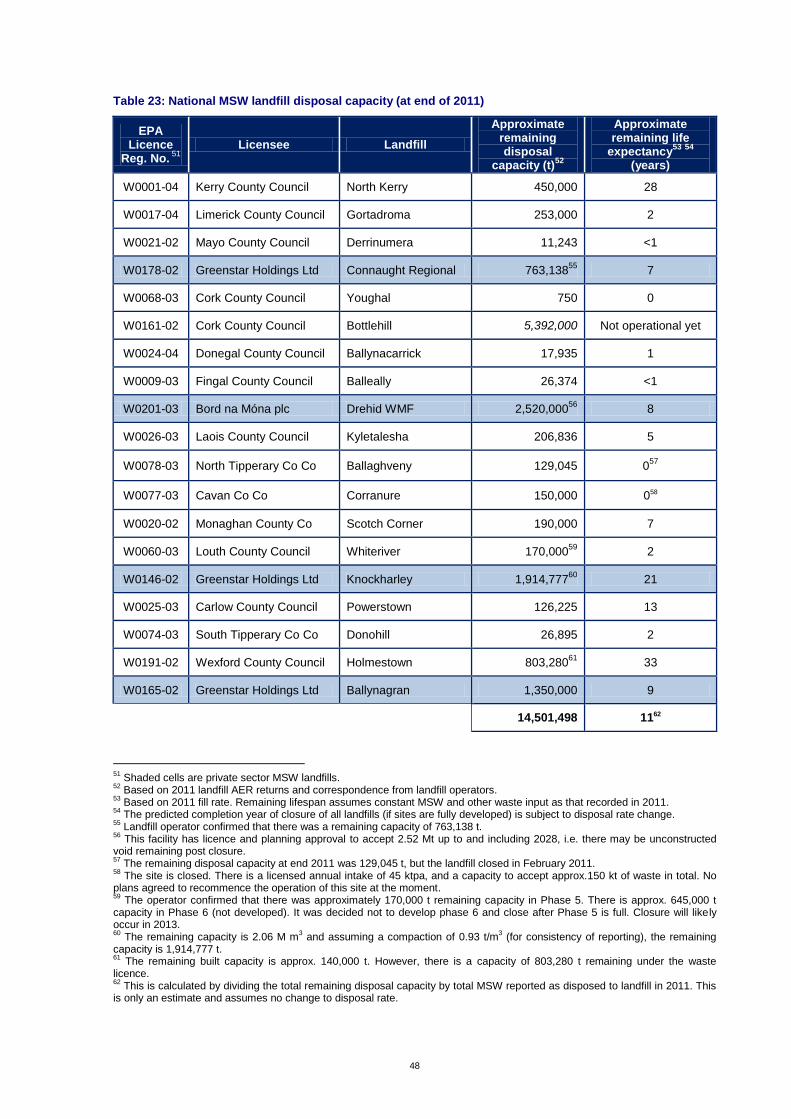
48
Table 23: National MSW landfill disposal capacity (at end of 2011)
EPA Licence
Reg. No. 51
Licensee Landfill
Approximate remaining disposal
capacity (t)52
Approximate remaining life
expectancy53
54
(years)
W0001-04 Kerry County Council North Kerry 450,000 28
W0017-04 Limerick County Council Gortadroma 253,000 2
W0021-02 Mayo County Council Derrinumera 11,243 <1
W0178-02 Greenstar Holdings Ltd Connaught Regional 763,13855
7
W0068-03 Cork County Council Youghal 750 0
W0161-02 Cork County Council Bottlehill 5,392,000 Not operational yet
W0024-04 Donegal County Council Ballynacarrick 17,935 1
W0009-03 Fingal County Council Balleally 26,374 <1
W0201-03 Bord na Móna plc Drehid WMF 2,520,00056
8
W0026-03 Laois County Council Kyletalesha 206,836 5
W0078-03 North Tipperary Co Co Ballaghveny 129,045 057
W0077-03 Cavan Co Co Corranure 150,000 058
W0020-02 Monaghan County Co Scotch Corner 190,000 7
W0060-03 Louth County Council Whiteriver 170,00059
2
W0146-02 Greenstar Holdings Ltd Knockharley 1,914,77760
21
W0025-03 Carlow County Council Powerstown 126,225 13
W0074-03 South Tipperary Co Co Donohill 26,895 2
W0191-02 Wexford County Council Holmestown 803,28061
33
W0165-02 Greenstar Holdings Ltd Ballynagran 1,350,000 9
14,501,498 1162
51
Shaded cells are private sector MSW landfills. 52
Based on 2011 landfill AER returns and correspondence from landfill operators. 53
Based on 2011 fill rate. Remaining lifespan assumes constant MSW and other waste input as that recorded in 2011. 54
The predicted completion year of closure of all landfills (if sites are fully developed) is subject to disposal rate change. 55
Landfill operator confirmed that there was a remaining capacity of 763,138 t. 56
This facility has licence and planning approval to accept 2.52 Mt up to and including 2028, i.e. there may be unconstructed void remaining post closure. 57
The remaining disposal capacity at end 2011 was 129,045 t, but the landfill closed in February 2011. 58
The site is closed. There is a licensed annual intake of 45 ktpa, and a capacity to accept approx.150 kt of waste in total. No plans agreed to recommence the operation of this site at the moment. 59
The operator confirmed that there was approximately 170,000 t remaining capacity in Phase 5. There is approx. 645,000 t capacity in Phase 6 (not developed). It was decided not to develop phase 6 and close after Phase 5 is full. Closure will likely occur in 2013. 60
The remaining capacity is 2.06 M m3 and assuming a compaction of 0.93 t/m
3 (for consistency of reporting), the remaining
capacity is 1,914,777 t. 61
The remaining built capacity is approx. 140,000 t. However, there is a capacity of 803,280 t remaining under the waste licence. 62
This is calculated by dividing the total remaining disposal capacity by total MSW reported as disposed to landfill in 2011. This is only an estimate and assumes no change to disposal rate.
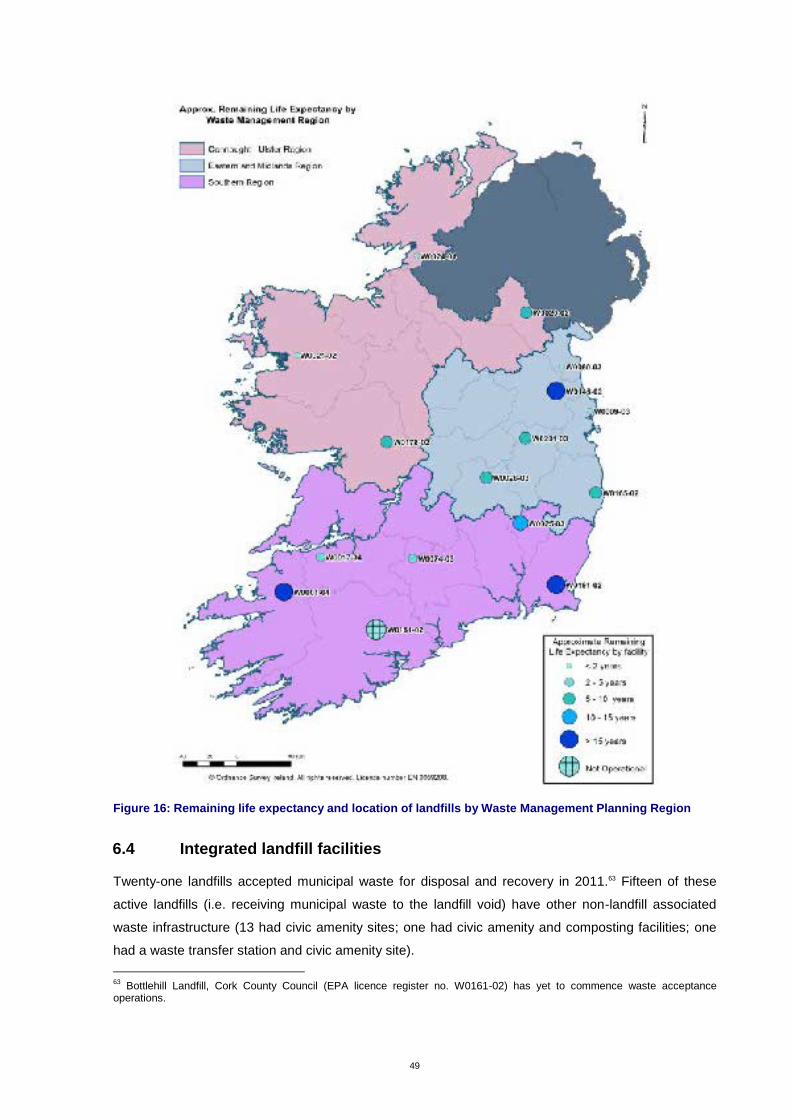
49
Figure 16: Remaining life expectancy and location of landfills by Waste Management Planning Region
6.4 Integrated landfill facilities
Twenty-one landfills accepted municipal waste for disposal and recovery in 2011.63 Fifteen of these
active landfills (i.e. receiving municipal waste to the landfill void) have other non-landfill associated
waste infrastructure (13 had civic amenity sites; one had civic amenity and composting facilities; one
had a waste transfer station and civic amenity site).
63
Bottlehill Landfill, Cork County Council (EPA licence register no. W0161-02) has yet to commence waste acceptance operations.
50
Twenty one landfills closed to landfill disposal activities were surveyed for this report and seventeen of
these had non-landfill associated waste infrastructure (16 civic amenity sites; 3 composting; and 2 had
associated transfer/baling operations transfer facilities) (see Appendix F). None of the private
municipal landfills offered civic amenity facilities, or reported composting on-site in 2011.
6.5 Hazardous waste landfill
Ireland currently has no dedicated hazardous waste landfill disposal facility. East Galway Residual
Landfill is licensed to accept certain types of asbestos waste for disposal but has not accepted any
such waste to date. KTK Landfill Limited previously accepted asbestos waste for disposal but such
acceptance has ceased at this facility since 2008.
Murphy Environmental Hollywood Ltd, operator of an industrial waste facility at The Naul, Co. Dublin
(W0129-02) has submitted an application for a licence review to the EPA, which includes the
development of a hazardous waste facility for the engineered landfill of contaminated soil and fly-ash
containing dangerous substances. This licence application is being processed by the EPA, and
planning permission has been granted by An Bord Pleanala.
6.6 Thermal treatment (including incineration)
Incineration of municipal waste
Commercial incineration of municipal waste commenced in late 2011 at Indaver Ireland’s
Carranstown, Co. Meath site (W0167-02), currently consented to treat up to 0.2 Mt per year.64 The
EPA has also granted waste licences65
for commercial incinerators to Indaver Ireland (Ringaskiddy,
Co. Cork (W0186-01)) and Dublin City Council (Poolbeg (W0232-01)). Construction at the Poolbeg
facility has halted, and has not commenced at the Ringaskiddy facility to date.
Use of waste as a fuel
In 2011 recovery operators reported that 259,429 t of non-hazardous waste was used as a fuel in
Ireland and abroad, a 42% increase compared to 2010 (Table 24).
The quantity of refuse derived fuel66 combusted in Ireland or exported for combustion in 2011 was up
68% on 2010. Within the State, Lagan Cement Ltd (P0487-05), Irish Cement Limited (P0030-04)
(Platin works, Drogheda) and Indaver Carranstown (W0167-02) all reported combustion of refuse
derived fuel in 2011. Quinn Cement Limited’s licence (IPPC Reg. No. 0378-02), granted in July 2012
includes authorisation for combustion of solid recovered fuel. Consented waste to energy capacity in
Ireland (merchant incineration and refuse derived fuel in cement kilns and other energy plants)
currently stands at 563,000 tpa.
64
A waste licence review for this facility is with the EPA for consideration, to increase the capacity to 220,000 t. 65
Further licence details at www.epa.ie. 66
Where reported by the waste recovery operator as EWC 19 12 10 (combustible waste (refuse derived fuel)).
51
Table 24: Non-hazardous waste used as a fuel, 2010 to 2011
Material Type Total (t)
2010
Total (t)
2011
Wood 69,310 43,71167
Refuse derived fuel 94,174 158,297
Other non-hazardous wastes
19,293 57,420
Total 182,777 259,429
(Source: Recovery organisations survey)
6.7 Biological treatment
The ‘Market Report on Irish Compost Production and Use’ (rX3, 2012) suggested a national
consented capacity for biological treatment of 412,700 tpa.
6.8 Civic amenity site and bring bank infrastructure
Table 25 presents the number of bring banks and civic amenity sites operational in each local
authority area between 2007 and 2011. Bring banks are unmanned, fixed receptacles for the deposit
of non-hazardous, dry recyclables such as glass and beverage cans. Civic amenity sites are manned,
permanent facilities for the reception of municipal (mainly household) residual and recyclable waste,
and in some cases hazardous waste.
The number of bring banks decreased from 1,922 in 2010 to 1,891 in 2011 and continues a
decreasing trend since a peak in 2008. The number of bring banks can fluctuate from year to year,
through consolidation of sites, availability of alternative outlets, or removal of bring banks due to illegal
dumping, public complaints or antisocial behaviour. The number of civic amenity sites increased from
107 to 113 between 2010 and 2011.
Household waste brought to bring banks and civic amenity sites accounted for 16% of managed
household waste, which emphasises the importance of this infrastructure and the need to support it,
although the tonnage of household waste being brought to such infrastructure is decreasing each
year. The factors influencing this could be less household waste generated, increased use of the dry
recyclables kerbside bin and collections for charity (eg scrap metal) diverting waste from civic amenity
sites.
67
Includes tonnage imported for use as a fuel.

52
Table 25: Number and tonnages collected at bring banks and civic amenity sites, 2008 2011
2008 2009 2010 2011
Number of bring banks 1,989 1,962 1,922 1,891
Collected at bring banks (t) 102,300 91,800 82,908 82,149
Number of civic amenity sites 96 107 107 113
Collected at civic amenity sites (t) 200,455 177,158 158,303 141,235
(Source: Local authority survey, WEEE and battery compliance schemes)
The number of bring banks and civic amenity sites in operation in 2011 by local authority functional
area are illustrated in Figure 17 below. For more information on waste accepted at bring banks and
civic amenity sites, refer to Appendices B and C.
6.9 Summary of key infrastructure and waste services indicators
Table 26: Summary of key waste infrastructure and waste services indicators
Summary of key waste infrastructure and waste services active in 2011
Active waste licences 19068
Active waste collection permits 4,00069
Active waste facility permits 63070
Local authority-authorised certificate of registration facilities 30470
EPA-authorised certificate of registration facilities 2,29368
IPPC facilities accepting municipal solid waste 968
Organic waste treatment facilities 50
Number of active merchant landfills for municipal solid waste disposal 1568
Organic waste treatment capacity 412,700 tpa 71
Waste to energy merchant incineration capacity 200,000 tpa72
Refuse derived fuel waste to energy capacity at cement plants 267,875 tpa68
Remaining disposal capacity at merchant municipal solid waste landfills 14 Mt68
68
Source – EPA. 69
Source – NWCPO. 70
Source - local authority RMCEI plans. 71
Source – “Market Report on Irish Compost Production and Use” (rx3, November 2012). Tonnage specified not limited to municipal waste. 72
EPA waste licence (W0167-02). Tonnage specified is not limited to municipal waste.
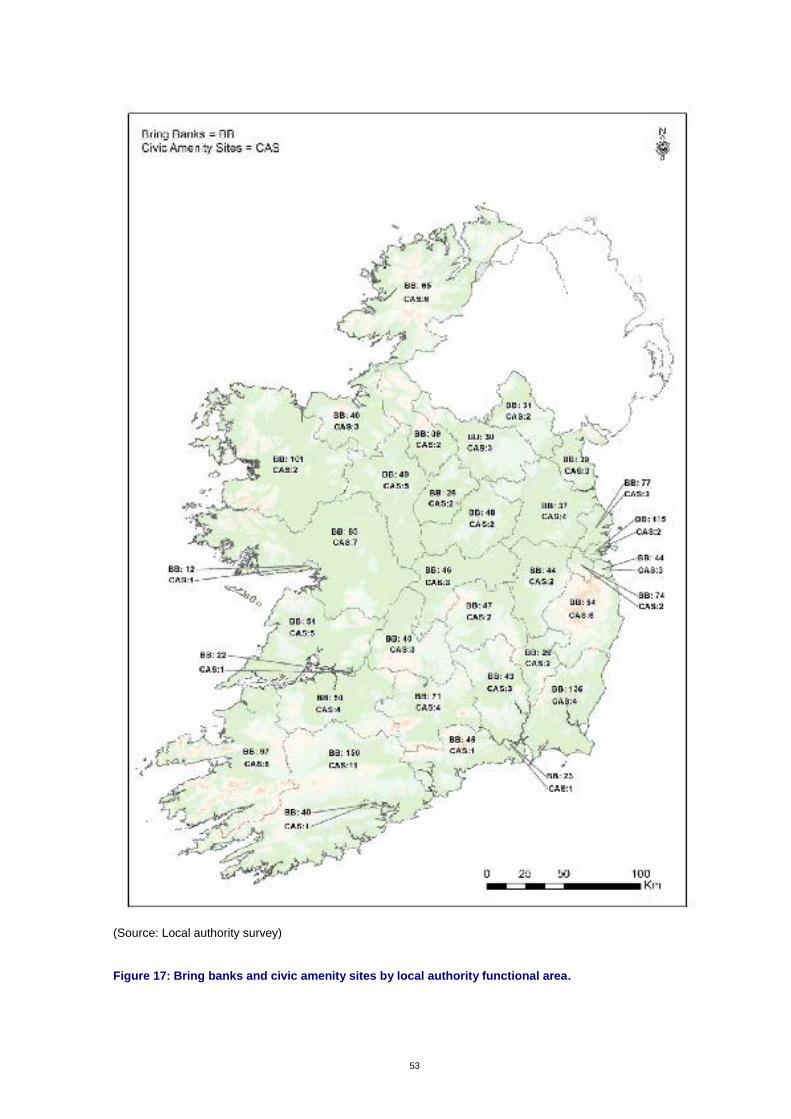
53
(Source: Local authority survey)
Figure 17: Bring banks and civic amenity sites by local authority functional area.
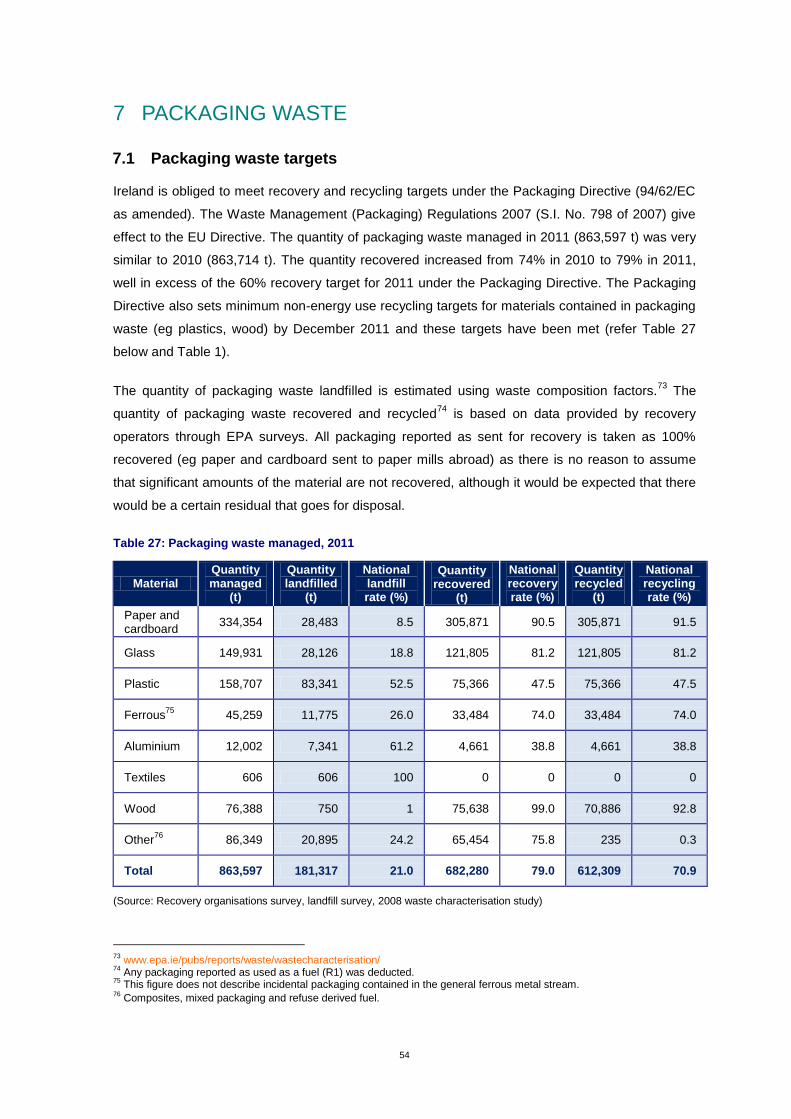
54
7 PACKAGING WASTE
7.1 Packaging waste targets
Ireland is obliged to meet recovery and recycling targets under the Packaging Directive (94/62/EC
as amended). The Waste Management (Packaging) Regulations 2007 (S.I. No. 798 of 2007) give
effect to the EU Directive. The quantity of packaging waste managed in 2011 (863,597 t) was very
similar to 2010 (863,714 t). The quantity recovered increased from 74% in 2010 to 79% in 2011,
well in excess of the 60% recovery target for 2011 under the Packaging Directive. The Packaging
Directive also sets minimum non-energy use recycling targets for materials contained in packaging
waste (eg plastics, wood) by December 2011 and these targets have been met (refer Table 27
below and Table 1).
The quantity of packaging waste landfilled is estimated using waste composition factors.73
The
quantity of packaging waste recovered and recycled74
is based on data provided by recovery
operators through EPA surveys. All packaging reported as sent for recovery is taken as 100%
recovered (eg paper and cardboard sent to paper mills abroad) as there is no reason to assume
that significant amounts of the material are not recovered, although it would be expected that there
would be a certain residual that goes for disposal.
Table 27: Packaging waste managed, 2011
Material Quantity managed
(t)
Quantity landfilled
(t)
National landfill rate (%)
Quantity recovered
(t)
National recovery rate (%)
Quantity recycled
(t)
National recycling rate (%)
Paper and cardboard
334,354 28,483 8.5 305,871 90.5 305,871 91.5
Glass 149,931 28,126 18.8 121,805 81.2 121,805 81.2
Plastic 158,707 83,341 52.5 75,366 47.5 75,366 47.5
Ferrous75
45,259 11,775 26.0 33,484 74.0 33,484 74.0
Aluminium 12,002 7,341 61.2 4,661 38.8 4,661 38.8
Textiles 606 606 100 0 0 0 0
Wood 76,388 750 1 75,638 99.0 70,886 92.8
Other76
86,349 20,895 24.2 65,454 75.8 235 0.3
Total 863,597 181,317 21.0 682,280 79.0 612,309 70.9
(Source: Recovery organisations survey, landfill survey, 2008 waste characterisation study)
73
www.epa.ie/pubs/reports/waste/wastecharacterisation/ 74
Any packaging reported as used as a fuel (R1) was deducted. 75
This figure does not describe incidental packaging contained in the general ferrous metal stream. 76
Composites, mixed packaging and refuse derived fuel.
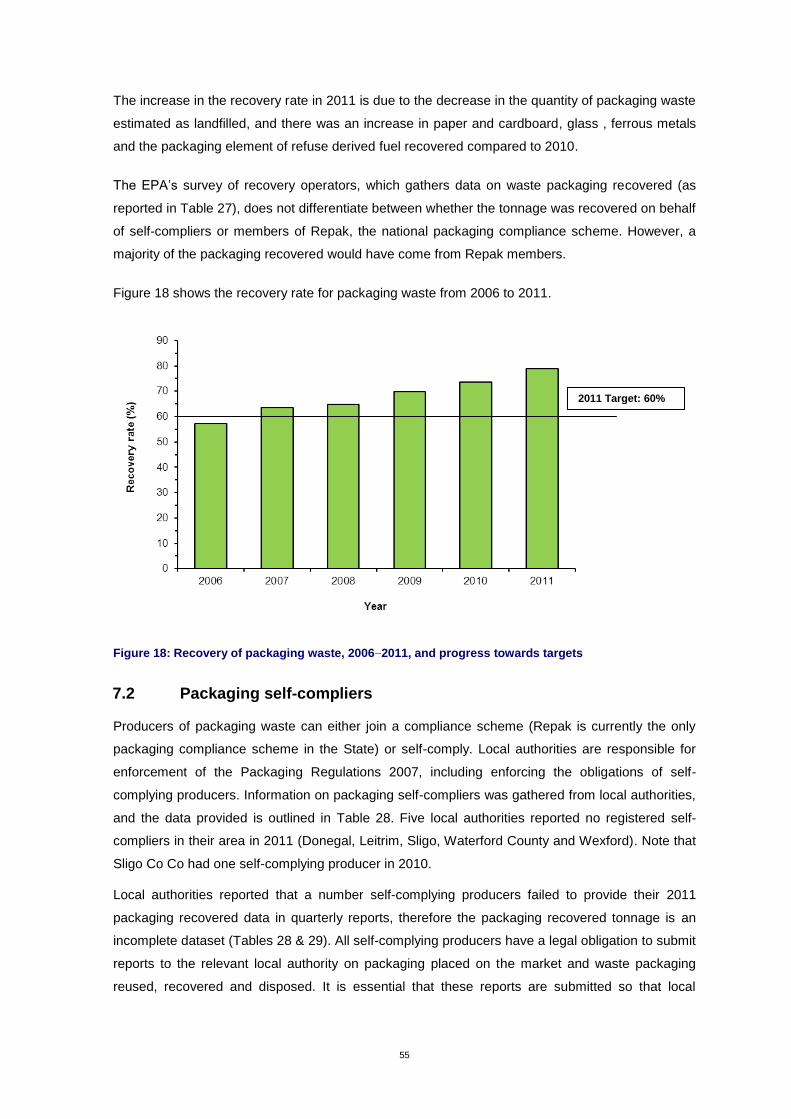
55
The increase in the recovery rate in 2011 is due to the decrease in the quantity of packaging waste
estimated as landfilled, and there was an increase in paper and cardboard, glass , ferrous metals
and the packaging element of refuse derived fuel recovered compared to 2010.
The EPA’s survey of recovery operators, which gathers data on waste packaging recovered (as
reported in Table 27), does not differentiate between whether the tonnage was recovered on behalf
of self-compliers or members of Repak, the national packaging compliance scheme. However, a
majority of the packaging recovered would have come from Repak members.
Figure 18 shows the recovery rate for packaging waste from 2006 to 2011.
Figure 18: Recovery of packaging waste, 2006 2011, and progress towards targets
7.2 Packaging self-compliers
Producers of packaging waste can either join a compliance scheme (Repak is currently the only
packaging compliance scheme in the State) or self-comply. Local authorities are responsible for
enforcement of the Packaging Regulations 2007, including enforcing the obligations of self-
complying producers. Information on packaging self-compliers was gathered from local authorities,
and the data provided is outlined in Table 28. Five local authorities reported no registered self-
compliers in their area in 2011 (Donegal, Leitrim, Sligo, Waterford County and Wexford). Note that
Sligo Co Co had one self-complying producer in 2010.
Local authorities reported that a number self-complying producers failed to provide their 2011
packaging recovered data in quarterly reports, therefore the packaging recovered tonnage is an
incomplete dataset (Tables 28 & 29). All self-complying producers have a legal obligation to submit
reports to the relevant local authority on packaging placed on the market and waste packaging
reused, recovered and disposed. It is essential that these reports are submitted so that local
2011 Target: 60%
56
authorities can determine whether self-complying producers are meeting their legal obligations with
regard to recovery and recycling targets.
Table 28: Packaging self-compliers registered in local authority areas in 2011
Local authority Number of companies
Number of premises
Packaging placed on the market (t)
Packaging recovered (t)
77
Carlow 1 1 4 2
Cavan 4 4 15,381 1,000
Clare 3 5 3,628 119
Cork City 2 2 28 70
Cork County 5 13 598 512
Donegal 0 0 0 0
Dublin City 18 21 3,256 2,018
Dun Laoghaire-Rathdown 7 8 2,015 1,277
Fingal 19 19 8,095 6,184
Galway City 4 10 338 207
Galway County 4 15 382 458
Kerry 2 3 268 5
Kildare 3 4 108 49
Kilkenny 3 3 251 148
Laois 1 1 21 10
Leitrim 0 0 0 0
Limerick City 1 3 25 14
Limerick County 4 5 6,928 1,031
Longford 3 3 112 83
Louth 4 5 450 285
Mayo 3 3 1,407 1,110
Meath 5 6 1,434 308
Monaghan 4 4 641 406
North Tipperary 1 3 17 10
Offaly 1 3 7 4
Roscommon 5 7 355 193
Sligo 0 0 0 0
South Dublin 23 23 10,870 4,487
South Tipperary 2 2 201 65
Waterford City 1 2 11 6
Waterford County 0 0 0 0
Westmeath 2 5 304 187
Wexford 0 0 0 0
Wicklow 4 4 507 175
Total 13978
187 57,462 20,423
(Source: Local authority survey)
77
Local authorities reported that some self-complying producers failed to provide all or some quarterly reports. 78
Representing 106 unique producers (some companies are registered in more than one local authority functional area).
57
Table 29 compares packaging self-complier data for 2009 to 2011, in terms of number of
companies and number of premises registered and the tonnage of packaging placed on the
market.
Table 29: Packaging self-compliers, 2009 to 2011
Year
Number of registered self-
complier companies
Number of premises
Packaging placed on the
market (t)
Packaging recovered (t)
2009 108 205 61,475 15,576
2010 106 181 45,387 20,196
2011 139 187 57,462 20,423
(Source: Local authority surveys)
58
8 WASTE ELECTRICAL AND ELECTRONIC EQUIPMENT
8.1 Introduction
The Waste Electrical and Electronic Equipment (WEEE) Directive (2002/96/EC) aims to prevent
the generation of WEEE and sets targets for the collection and treatment of WEEE in an
environmentally sound manner. The WEEE Regulations79
transpose the WEEE Directive into Irish
law, and obligations under the WEEE Regulations came into effect in Ireland in August 2005. The
data on WEEE collection and treatment in Ireland in 2011 are based on information supplied by
WEEE and other waste recovery operators, by the WEEE compliance schemes (WEEE Ireland
and European Recycling Platform (ERP)), and by self-complying producers of electrical and
electronic equipment (EEE).
8.2 WEEE collected, treated, exported and stored in 2011
Table 30 shows that 41,092 t of WEEE were collected in Ireland in 2011, which is markedly less
than the 45,012 t collected in 2010. The average amount of household WEEE collected from each
person living in the Republic of Ireland has fallen from more than 8 kg in 2010 to 7.6 kg in 2011.
However, this is still nearly double the target of 4 kg per person specified by the WEEE Directive.
The drop may in-fact reflect falling consumption of EEE rather than less recovery effort; as that
recovered will strongly reflect that placed on the market.
Table 30: WEEE collected, treated, exported and stored in 2011
Waste fridges
and freezers
Waste large household
appliances80
Waste TVs and
monitors
Waste lighting
equipment81
Other WEEE
82
Total WEEE
Collected (t) 5,971 13,604 6,651 665 14,202 41,092
Treated in RoI (t) 0 8,412 5,842 552 6,653 21,460
Exported to EU83
(t) 5,977 5,160 584 85 7,358 19,164
Exported to non-EU (t) 0 0 0 0 83 83
Total recovered (t) 5,190 10,989 5,708 560 12,311 34,759
Change in stock84 (t) -6 32 225 28 107 386
(Source: WEEE and other waste recovery organisations survey, WEEE producers)
79
Waste Management (Electrical and Electronic Equipment) Regulations, 2005 (S.I. No. 290 of 2005) and European Communities (Waste Electrical and Electronic Equipment) Regulations, 2011, as amended (S.I. No. 355 of 2011 as amended by S.I. No. 397 of 2011).
80
For example dishwashers, washing machines, cookers.
81
Includes all fluorescent lamps (including compact fluorescent lamps), high and low pressure gas discharge lamps, and equipment for the purpose of spreading or controlling light with the exception of household luminaires.
82
For example stereos, telephones, toys, vacuum cleaners, toasters, computers.
83
Exports to Northern Ireland amounted to 4,381 t in 2011. 84
The stock figure describes the difference of the national amount of WEEE collected and awaiting treatment between 1 January 2011 and 31 December 2012.
59
The collection and recovery of all types of WEEE other than Waste TVs and monitors decreased
between 2010 and 2011. The amounts of Waste lighting equipment and Waste large household
appliances decrease by 18% and 17%, respectively, whereas the collections of Waste fridges and
freezers and Other WEEE fell by 6%.
In 2011, the collection of pre-owned and used EEE for reuse (ie not waste) rose to 569 t. Again,
most of the material for reuse consisted of information and communication technology equipment
eg mobile phones and computers.
More than half of the total WEEE collected in 2011 was treated in Ireland before being exported to
other EU countries for further recovery. In 2011, 83 t of WEEE were transferred directly from
Ireland to the United States of America.
Since 31st December 2008, producers of EEE have been responsible for meeting targets for the
percentage recovery, and the percentage component, material and substance reuse and recycling
of WEEE sent for treatment. Estimated recovery and recycling percentages are summarised in
Table 1 of this report and suggest that in 2011 the Republic of Ireland met all WEEE treatment
targets set by EU and national legislation.
Consideration should be given to expected amendments to the EU Persistent Organic Pollutants
(POPs) Regulation which may affect recycling and recovery of WEEE. Separated plastics, resulting
from the treatment of WEEE, that contain specified brominated flame retardants above a certain
concentration threshold will be required to be managed as POPs waste in accordance with the EU
POPs Regulation.
60
9 END OF LIFE VEHICLES
9.1 The ELV Directive
Wastes arising from end-of-life vehicles (ELVs) can have many negative impacts upon the
environment. In 1997 the European Commission adopted a proposal for a directive aimed at
ensuring that the activities of vehicle dismantling and recycling are carried out in an
environmentally sound manner. The initial proposal suggested that the identification of clear
targets with regards to reuse, recycling and recovery of vehicles and their components be identified
and furthermore, producers should be encouraged to produce vehicles that provide a much higher
rate of recyclability upon end-of-life. This initial proposal eventually provided the foundation for
what would become the ELV Directive (2000/53/EC). The ELV Directive was transposed into
national law in 200685
and has since served as the strategic framework by which the collection,
storage, dismantling and treatment of ELVs is governed.
The directive sets recycling and recovery targets for ELVs and requires that appropriate treatment
systems are in place to remove hazardous materials (eg oil, antifreeze, batteries), and materials
which may be reused and recycled (eg metals, plastics, glass, tyres) from ELVs.
To ensure that ELV Directive targets are met, a number of steps must be taken not only at the end-
of-life stage of a vehicle, but also during the design phase. During the design phase,
manufacturers must ensure that the design of new vehicles supports the specific requirements
outlined in the ELV Directive with regards to dismantling, reuse and recycling of ELVs and their
components. The use of hazardous materials in the production of new vehicles is also strictly
controlled. By taking the end-of-life of a vehicle into consideration at the design stage, producers
can improve the recyclability of ELVs and thus ensure that ELV Directive targets are met.
The ELV Directive applies to vehicles used for the carriage of passengers with a maximum of eight
seats in addition to the driver’s seat, and to vehicles with a mass no greater than 3.5 t and used for
the carriage of goods. ELV legislation is covered under the ‘producer responsibility initiative’ set of
legislation and therefore producers have certain obligations. Vehicle manufacturers and
professional importers, who are responsible for placing vehicles on the market within the State, are
collectively defined as producers and as such, they are obliged to create a national collection
system to organise the collection, treatment and recovery of ELVs.
Each producer has to contract a network of authorised treatment facilities (ATFs), which must
accept ELVs from registered owners free of charge (provided that essential components of the
vehicle are not missing). ATFs are subject to a number of conditions and must hold a valid waste
85
Waste Management (ELV) Regulations 2006 (S.I. No. 282 of 2006), as amended by the Waste Management (ELV) (Amendment) Regulations 2010 (S.I. No. 142 of 2010), and by S.I. No. 661 of 2011 European Communities (End-of-Life Vehicles) (Amendment) Regulations 2011.
61
permit or, where deemed appropriate, a waste licence86
. Facilities must meet the minimum
technical requirements with regards to storage, appropriate treatment and recovery of ELVs. An
ATF is also required to keep records of the total weights of materials for reuse, recycling, recovery
and disposal that arise from the processing of ELVs.
ELVs must be discarded at an ATF; to do otherwise is an offence. When an ELV is deposited at an
ATF, a Certificate of Destruction (COD) is issued free of charge. All relevant information pertaining
to that COD is then noted on the National Vehicle Driver File (NVDF), which is maintained by the
Driver and Vehicle Computer Services Division of the Department of Transport, Tourism and Sport.
It is important to note that only ATFs can issue CODs. If the owner of an ELV does not receive a
COD they may still be held on record on the NVDF as the registered owner of that vehicle.
In August 2010, an online ELV processing system was introduced by the Driver Vehicle Computer
Services Division (DVCSD) of the Department of Transport. The online system gives ATFs the
ability to send ELVs notifications to the NVDF over the internet. The online system can be found at
www.motorelv.ie.
9.2 ELV Directive Targets
Each Member State is expected to meet the specific targets set out in the EU ELV Directive with
regards to the reuse, recycling and recovery of ELVs. The targets are:
(i) By 1 January 2006 a minimum of 80% reuse and recycling and a minimum of 85% reuse
and recovery; and
(ii) By 1 January 2015 a minimum 85% reuse and recycling and a minimum of 95% reuse and
recovery.
The EPA carries out a survey of ATFs and ELV shredder operators throughout Ireland on an
annual basis and uses the resulting information to build a dataset that is used to calculate rates of
reuse, recovery and recycling of ELVs arising in Ireland.
Local authorities reported to the EPA that 136 ATFs were authorised in 2011 (of which 126 were
operational). Three local authorities reported no ATFs operational in their functional areas in 2011
(Dun Laoghaire Rathdown, Longford and Waterford City).
The latest ELV data available is for calendar year 2010, where 158,237 ELVs were reported to
arise in Ireland. Information on tonnages reused, recycled and recovered from ELV dismantling
and depollution is summarised in Table 31.
86
The EPA, DECLG and local authorities are working together to ensure that unauthorised vehicle dismantlers in the State are subject to a system of inspections and sanctions that prevents their on-going operation without permits.
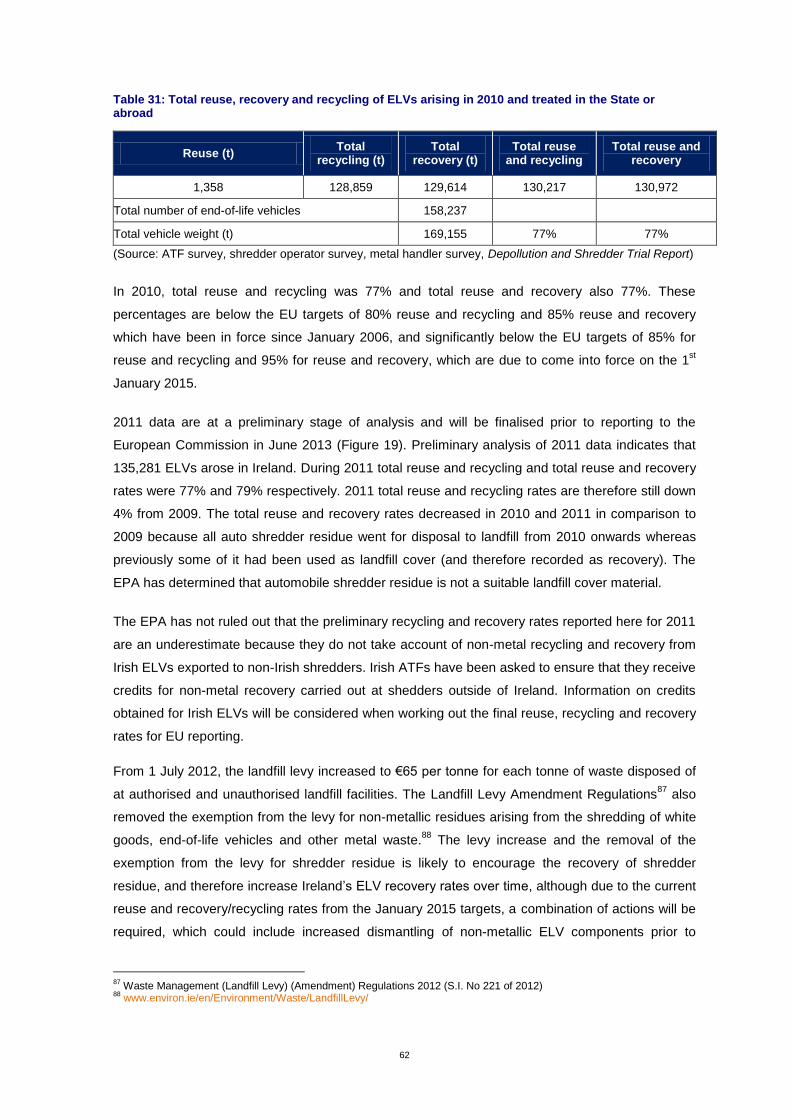
62
Table 31: Total reuse, recovery and recycling of ELVs arising in 2010 and treated in the State or abroad
Reuse (t) Total
recycling (t) Total
recovery (t) Total reuse
and recycling Total reuse and
recovery
1,358 128,859 129,614 130,217 130,972
Total number of end-of-life vehicles 158,237
Total vehicle weight (t) 169,155 77% 77%
(Source: ATF survey, shredder operator survey, metal handler survey, Depollution and Shredder Trial Report)
In 2010, total reuse and recycling was 77% and total reuse and recovery also 77%. These
percentages are below the EU targets of 80% reuse and recycling and 85% reuse and recovery
which have been in force since January 2006, and significantly below the EU targets of 85% for
reuse and recycling and 95% for reuse and recovery, which are due to come into force on the 1st
January 2015.
2011 data are at a preliminary stage of analysis and will be finalised prior to reporting to the
European Commission in June 2013 (Figure 19). Preliminary analysis of 2011 data indicates that
135,281 ELVs arose in Ireland. During 2011 total reuse and recycling and total reuse and recovery
rates were 77% and 79% respectively. 2011 total reuse and recycling rates are therefore still down
4% from 2009. The total reuse and recovery rates decreased in 2010 and 2011 in comparison to
2009 because all auto shredder residue went for disposal to landfill from 2010 onwards whereas
previously some of it had been used as landfill cover (and therefore recorded as recovery). The
EPA has determined that automobile shredder residue is not a suitable landfill cover material.
The EPA has not ruled out that the preliminary recycling and recovery rates reported here for 2011
are an underestimate because they do not take account of non-metal recycling and recovery from
Irish ELVs exported to non-Irish shredders. Irish ATFs have been asked to ensure that they receive
credits for non-metal recovery carried out at shedders outside of Ireland. Information on credits
obtained for Irish ELVs will be considered when working out the final reuse, recycling and recovery
rates for EU reporting.
From 1 July 2012, the landfill levy increased to €65 per tonne for each tonne of waste disposed of
at authorised and unauthorised landfill facilities. The Landfill Levy Amendment Regulations87
also
removed the exemption from the levy for non-metallic residues arising from the shredding of white
goods, end-of-life vehicles and other metal waste.88
The levy increase and the removal of the
exemption from the levy for shredder residue is likely to encourage the recovery of shredder
residue, and therefore increase Ireland’s ELV recovery rates over time, although due to the current
reuse and recovery/recycling rates from the January 2015 targets, a combination of actions will be
required, which could include increased dismantling of non-metallic ELV components prior to
87
Waste Management (Landfill Levy) (Amendment) Regulations 2012 (S.I. No 221 of 2012) 88
www.environ.ie/en/Environment/Waste/LandfillLevy/
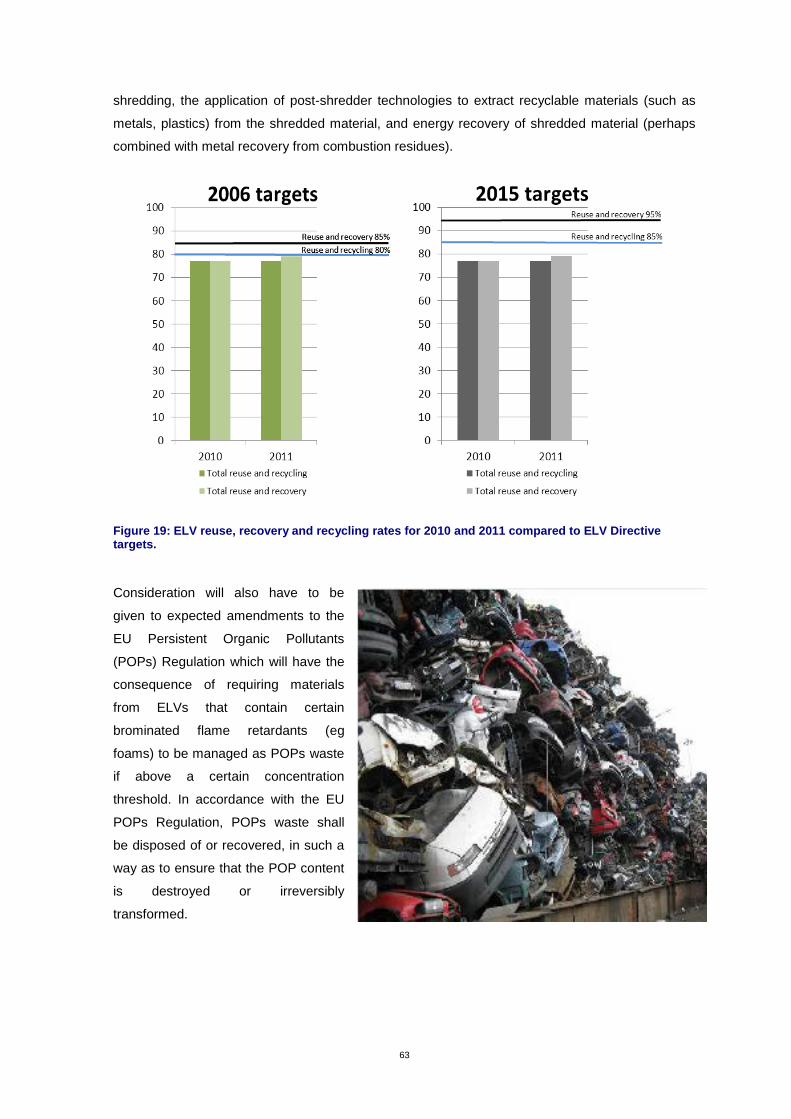
63
shredding, the application of post-shredder technologies to extract recyclable materials (such as
metals, plastics) from the shredded material, and energy recovery of shredded material (perhaps
combined with metal recovery from combustion residues).
Figure 19: ELV reuse, recovery and recycling rates for 2010 and 2011 compared to ELV Directive targets.
Consideration will also have to be
given to expected amendments to the
EU Persistent Organic Pollutants
(POPs) Regulation which will have the
consequence of requiring materials
from ELVs that contain certain
brominated flame retardants (eg
foams) to be managed as POPs waste
if above a certain concentration
threshold. In accordance with the EU
POPs Regulation, POPs waste shall
be disposed of or recovered, in such a
way as to ensure that the POP content
is destroyed or irreversibly
transformed.
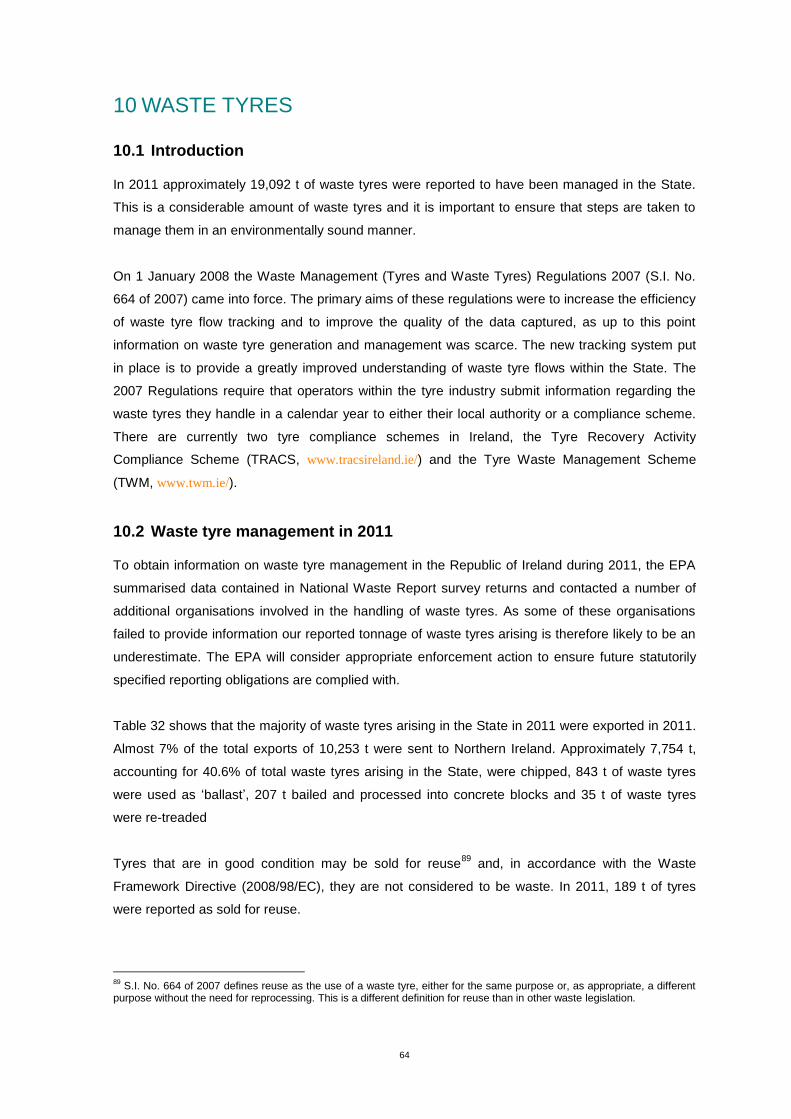
64
10 WASTE TYRES
10.1 Introduction
In 2011 approximately 19,092 t of waste tyres were reported to have been managed in the State.
This is a considerable amount of waste tyres and it is important to ensure that steps are taken to
manage them in an environmentally sound manner.
On 1 January 2008 the Waste Management (Tyres and Waste Tyres) Regulations 2007 (S.I. No.
664 of 2007) came into force. The primary aims of these regulations were to increase the efficiency
of waste tyre flow tracking and to improve the quality of the data captured, as up to this point
information on waste tyre generation and management was scarce. The new tracking system put
in place is to provide a greatly improved understanding of waste tyre flows within the State. The
2007 Regulations require that operators within the tyre industry submit information regarding the
waste tyres they handle in a calendar year to either their local authority or a compliance scheme.
There are currently two tyre compliance schemes in Ireland, the Tyre Recovery Activity
Compliance Scheme (TRACS, www.tracsireland.ie/) and the Tyre Waste Management Scheme
(TWM, www.twm.ie/).
10.2 Waste tyre management in 2011
To obtain information on waste tyre management in the Republic of Ireland during 2011, the EPA
summarised data contained in National Waste Report survey returns and contacted a number of
additional organisations involved in the handling of waste tyres. As some of these organisations
failed to provide information our reported tonnage of waste tyres arising is therefore likely to be an
underestimate. The EPA will consider appropriate enforcement action to ensure future statutorily
specified reporting obligations are complied with.
Table 32 shows that the majority of waste tyres arising in the State in 2011 were exported in 2011.
Almost 7% of the total exports of 10,253 t were sent to Northern Ireland. Approximately 7,754 t,
accounting for 40.6% of total waste tyres arising in the State, were chipped, 843 t of waste tyres
were used as ‘ballast’, 207 t bailed and processed into concrete blocks and 35 t of waste tyres
were re-treaded
Tyres that are in good condition may be sold for reuse89
and, in accordance with the Waste
Framework Directive (2008/98/EC), they are not considered to be waste. In 2011, 189 t of tyres
were reported as sold for reuse.
89
S.I. No. 664 of 2007 defines reuse as the use of a waste tyre, either for the same purpose or, as appropriate, a different purpose without the need for reprocessing. This is a different definition for reuse than in other waste legislation.
65
Table 32: Waste tyres treated and exported in 2011.
Waste tyre activity Tonnage (t) Percentage
Exported 10,253 53.7%
Chipped 7,754 40.6%
Ballast 843 4.4%
Baled 207 1.1%
Re-treaded 35 0.2%
Total 19,092 100%
(Source: National Waste Report survey returns)
66
11 CONSTRUCTION AND DEMOLITION WASTE
11.1 C&D waste collected in 2011
It is estimated that 3,003,691 t of construction and demolition (C&D) (hazardous and non-
hazardous) waste was collected in 2011, a decrease of 13% since 2010. The quantities of C&D
wastes arising has been decreasing since a peak in 2007, and is reflective of the economic
downturn and its effect on the construction sector. The bulk of the tonnage collected in 2011 was
made up of soil and stones (1,975,844 t), with the remaining 1,027,847 t consisting of other C&D
waste materials such as rubble, metals, timber, plastic, glass, wood and mixed C&D waste. Data
on C&D waste collected are derived from annual returns submitted by waste permit collection
holders. There were approximately 222 active waste collection permit holders authorised to collect
C&D waste in 2011.90
11.2 C&D waste treated in 2011
Information on the quantity of C&D waste treated (either recovered or disposed) in 2011 was
derived from the following sources:
(i) EPA licensed activities (landfills and waste treatment facilities).
(ii) Local authority permitted and Certificate of Registration facilities.
The quantity of C&D waste managed in 2011 (2,498,946 t) represented a 3% decrease on that
reported in 2010. In 2011, 2,358,714 t of C&D waste was estimated as recovered and 35,404 t (2%
of overall managed) was disposed at EPA licensed landfills (Tables 33 & 34).
Table 33 outlines the collection and management of the soil and stones (hazardous and non-
hazardous) element of C&D waste. In 2011, more soil and stone was reported as collected
(1,975,844 t)91
than was reported as managed (1,538,903 t).
90
It was not possible to get an accurate figure from the WCP e-reporting systems for 2011 data. 91
In 2011, approx. 149,787 t of C&D material was reported as accepted at EPA licensed landfills. Although this tonnage was reported as collected in 2011, it has been excluded here from both the 'waste collected’ and ‘waste managed' figures. These entries were deemed to be reused at the landfill and are not reported as waste.
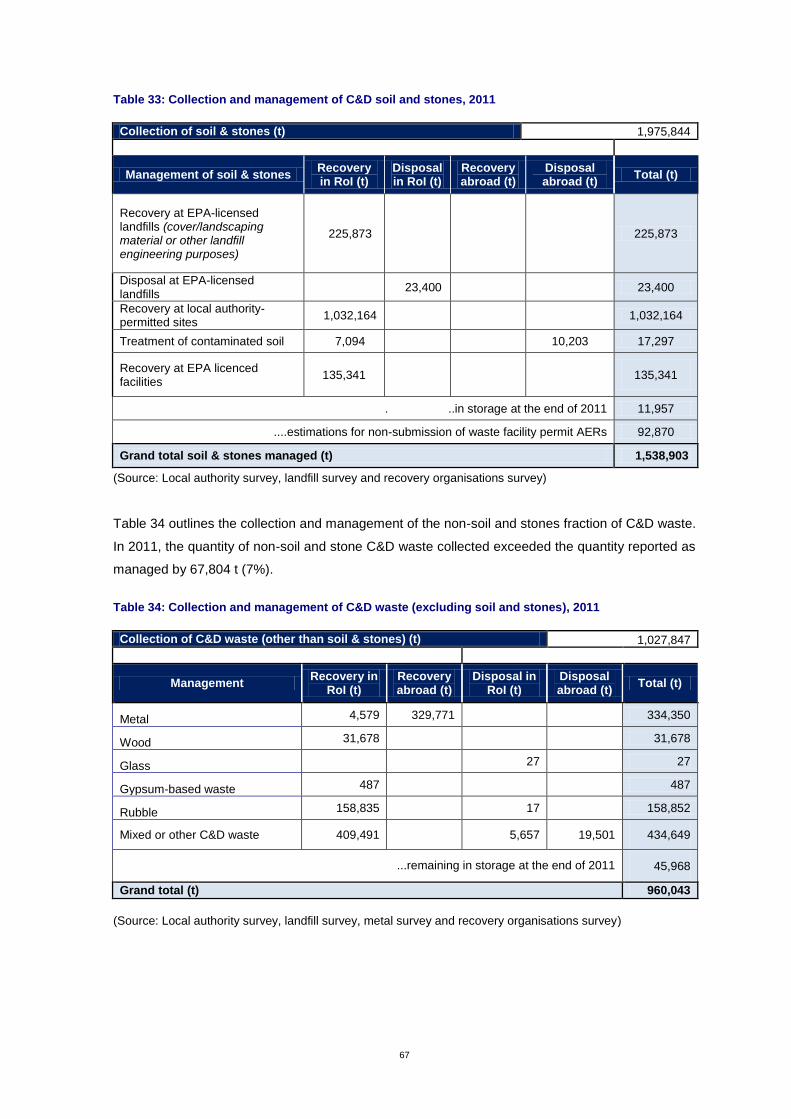
67
Table 33: Collection and management of C&D soil and stones, 2011
Collection of soil & stones (t) 1,975,844
Management of soil & stones Recovery in RoI (t)
Disposal in RoI (t)
Recovery abroad (t)
Disposal abroad (t)
Total (t)
Recovery at EPA-licensed landfills (cover/landscaping material or other landfill engineering purposes)
225,873
225,873
Disposal at EPA-licensed landfills
23,400
23,400
Recovery at local authority-permitted sites
1,032,164
1,032,164
Treatment of contaminated soil 7,094
10,203 17,297
Recovery at EPA licenced facilities
135,341
135,341
. ..in storage at the end of 2011 11,957
....estimations for non-submission of waste facility permit AERs 92,870
Grand total soil & stones managed (t) 1,538,903
(Source: Local authority survey, landfill survey and recovery organisations survey)
Table 34 outlines the collection and management of the non-soil and stones fraction of C&D waste.
In 2011, the quantity of non-soil and stone C&D waste collected exceeded the quantity reported as
managed by 67,804 t (7%).
Table 34: Collection and management of C&D waste (excluding soil and stones), 2011
Collection of C&D waste (other than soil & stones) (t) 1,027,847
Management Recovery in
RoI (t) Recovery abroad (t)
Disposal in RoI (t)
Disposal abroad (t)
Total (t)
Metal 4,579 329,771
334,350
Wood 31,678
31,678
Glass 27
27
Gypsum-based waste 487
487
Rubble 158,835
17
158,852
Mixed or other C&D waste 409,491
5,657 19,501 434,649
...remaining in storage at the end of 2011 45,968
Grand total (t) 960,043
(Source: Local authority survey, landfill survey, metal survey and recovery organisations survey)
68
11.3 C&D waste data anomalies
There is a discrepancy between the reported quantity of C&D waste collected and the reported
quantity of C&D waste treated (i.e. recovered or disposed). There was a gap of 0.4 Mt (21%) for
soil and stones fraction and a gap of 0.1 Mt (7%) for the non-soil and stones fraction, resulting in
an overall gap of just under 0.5 Mt.
Local authorities reported that there were 222 active waste facility permit holders authorised to
accept C&D waste in 2011. Of these, 184 submitted an AER to the local authorities, representing
an 83% reporting rate. Local authorities estimate that there may have been an additional 92,870 t
of C&D recovered at local authority permitted sites in 2011 based on the 38 non-reporting facilities.
This has been reflected in the tables above. Data gathered for the National Waste Report indicates
that waste treatment organisations had a net storage of 57,925 t of C&D waste at their facilities
during 2011. This figure has also been included in the total reported management of C&D figure
above.
A proportion of the gap between the reported collection of C&D waste and the reported disposal
and recovery of C&D waste may be attributable to C&D waste recovered at facilities authorised
under Certificate of Registration (CoR). Although AER data from local authority issued CoR sites
have been included in 2011 figures, data for CoR facilities authorised by the EPA are not included.
Current estimates for tonnage of C&D managed at EPA CoR sites are at present unreliable. It is
estimated that approx. 450,000 t of C&D waste is managed at EPA issued CoR sites. This is based
on a potential tonnage (minimum intake of 2,000 t per year) across 226 sites. EPA authorised CoR
sites (C&D classes) will be surveyed in future campaigns.
Gaps in the C&D dataset may also in part be attributed to a lack of attention to maintenance of
good records and the obligation on the sector to provide accurate data to the local authorities
annually. Most of the sites generating this waste stream and those receiving it do not have
weighbridges, so estimations are made (by carriers and recipients) which is not ideal for
reconciliation. The EPA is also aware that there is an issue with regard to the types of material that
the construction industry defines as waste, which may lead to secondary resources not being
properly accounted for. Any C&D waste collected in 2011 but in storage at the end of 2011 will not
be counted as treated (i.e. until it is either recovered or disposed so stockpiling of C&D waste can
affect the dataset. In Tables 31 and 32 above, data on C&D waste in storage is reported, although
this is only data from sites that the EPA surveys for National Waste Report, and as EPA does not
have storage data for all sites managing C&D waste this is considered to be an underestimate.
There is also the potential that waste collection permit holders may fail to properly account for
where the waste was collected (particularly in local authority areas with city and council
69
boundaries), which could potentially lead to errors in the reporting of the quantity of C&D waste
collected.
The importance of good record keeping by waste operators cannot be over emphasised. Additional
enforcement and data verification efforts by the local authorities may be necessary to ensure that
this happens. The importance of local authority validation of C&D collection and recovery data
cannot be over-emphasised as failure to do so can have a huge impact on the quality of the
national dataset. Desk-top validations of all AERs should be carried out by local authorities as a
minimum. A simple check to identify operators reporting very high tonnages of C&D waste (where
potentially the operator has reported in kilograms versus tonnes in error) should be queried.
70
12 HAZARDOUS WASTE
12.1 Introduction
Waste is classified as being hazardous when it displays properties (i.e. oxidising, explosive, flammable,
irritant, toxic etc.) that make it dangerous or potentially harmful to human health or the environment. A full
list of these properties is listed in Annex III of the Waste Directive 2008/98/EC, as transposed into
national legislation by the European Communities (Waste Directive) Regulation, 2011 (S.I. No. 126 of
2011).
Industry is the largest generator of hazardous waste in Ireland, giving rise to industrial solvents, sludges,
oils and chemicals. Households, small businesses, farms and the healthcare and construction sectors
also generate substantial quantities of hazardous waste such as lead-acid batteries, waste electrical and
electronic equipment, healthcare risk waste, solvent-based paints and varnishes, pesticides, waste oils
and asbestos.
Information on the management of hazardous waste in 2011 was compiled from three sources, based on
the location of treatment:
Data on hazardous waste treatment on-site at the industry where it was generated (which occurs
under EPA licence at companies mainly in the pharmachem sector) were obtained from licensee’s
Pollutant Release and Transfer Returns (PRTR) and Annual Environmental Reports.
Data on hazardous waste treatment at commercial facilities in Ireland were obtained by way of the
hazardous waste treatment survey, which was sent to facilities that are licensed by the EPA or
permitted by the local authority to treat hazardous wastes.
Data on the import and export of hazardous waste for treatment were provided by the National
Transfrontier Shipment Office (NTFSO) at Dublin City Council.
The total amount of hazardous waste managed in 2011 is presented in Table 35 and illustrated in Figure
20. The total amount of hazardous waste managed in 2011 is similar to that managed in 2010. Of the
total managed, 22% is treated on-site at industry, 31% is sent off-site to a commercial hazardous waste
facility for treatment, and 47% is exported for treatment.
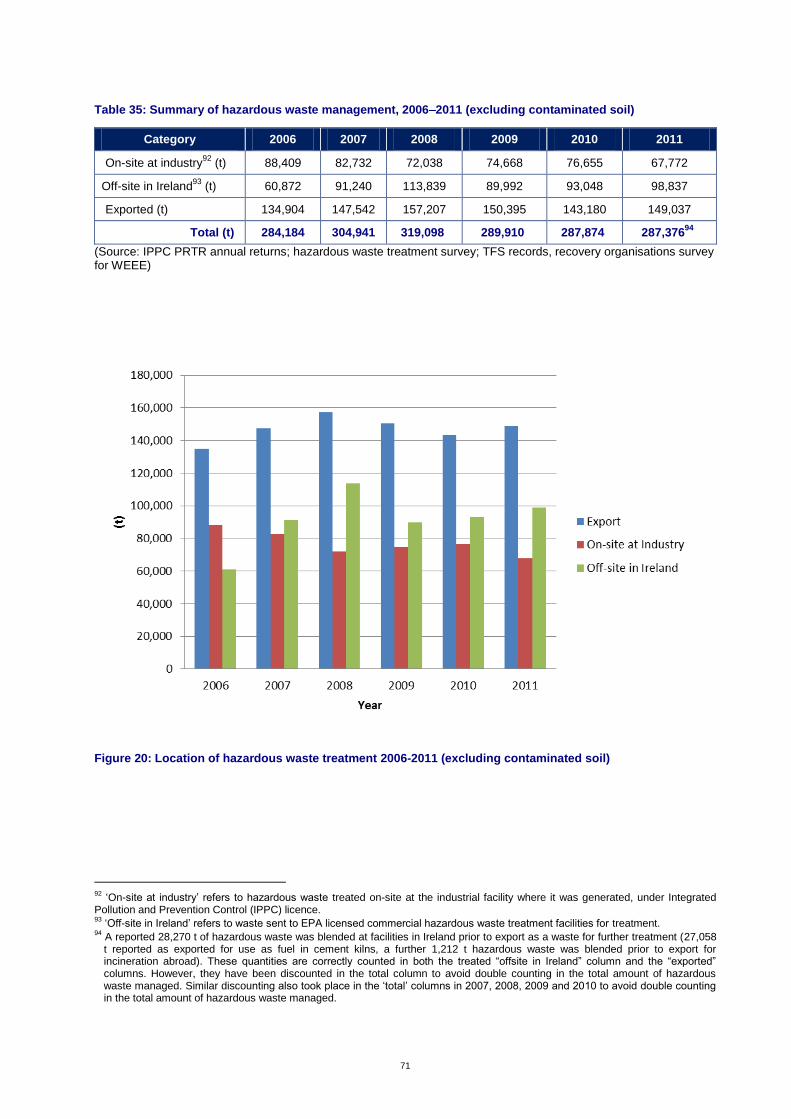
71
Table 35: Summary of hazardous waste management, 2006 2011 (excluding contaminated soil)
Category 2006 2007 2008 2009 2010 2011
On-site at industry92
(t) 88,409 82,732 72,038 74,668 76,655 67,772
Off-site in Ireland93
(t) 60,872 91,240 113,839 89,992 93,048 98,837
Exported (t) 134,904 147,542 157,207 150,395 143,180 149,037
Total (t) 284,184 304,941 319,098 289,910 287,874 287,37694
(Source: IPPC PRTR annual returns; hazardous waste treatment survey; TFS records, recovery organisations survey for WEEE)
Figure 20: Location of hazardous waste treatment 2006-2011 (excluding contaminated soil)
92
‘On-site at industry’ refers to hazardous waste treated on-site at the industrial facility where it was generated, under Integrated Pollution and Prevention Control (IPPC) licence. 93
‘Off-site in Ireland’ refers to waste sent to EPA licensed commercial hazardous waste treatment facilities for treatment. 94
A reported 28,270 t of hazardous waste was blended at facilities in Ireland prior to export as a waste for further treatment (27,058 t reported as exported for use as fuel in cement kilns, a further 1,212 t hazardous waste was blended prior to export for incineration abroad). These quantities are correctly counted in both the treated “offsite in Ireland” column and the “exported” columns. However, they have been discounted in the total column to avoid double counting in the total amount of hazardous waste managed. Similar discounting also took place in the ‘total’ columns in 2007, 2008, 2009 and 2010 to avoid double counting in the total amount of hazardous waste managed.
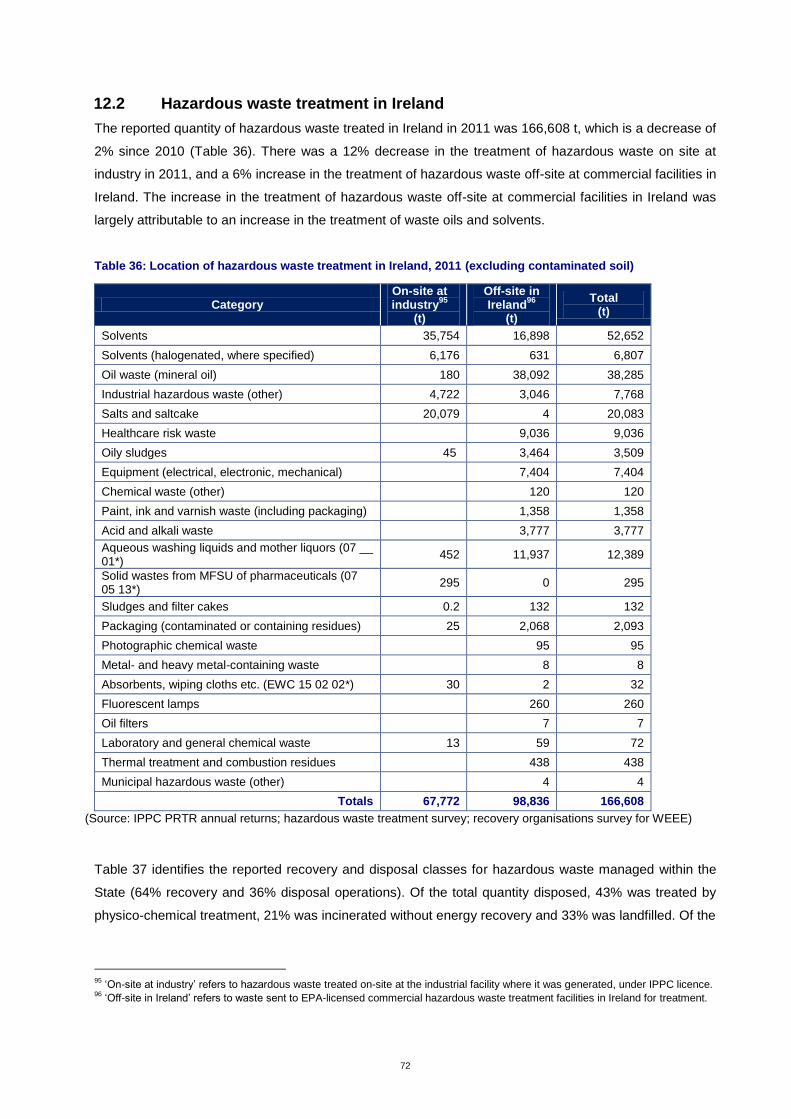
72
12.2 Hazardous waste treatment in Ireland
The reported quantity of hazardous waste treated in Ireland in 2011 was 166,608 t, which is a decrease of
2% since 2010 (Table 36). There was a 12% decrease in the treatment of hazardous waste on site at
industry in 2011, and a 6% increase in the treatment of hazardous waste off-site at commercial facilities in
Ireland. The increase in the treatment of hazardous waste off-site at commercial facilities in Ireland was
largely attributable to an increase in the treatment of waste oils and solvents.
Table 36: Location of hazardous waste treatment in Ireland, 2011 (excluding contaminated soil)
Category On-site at industry
95
(t)
Off-site in Ireland
96
(t)
Total (t)
Solvents 35,754 16,898 52,652
Solvents (halogenated, where specified) 6,176 631 6,807
Oil waste (mineral oil) 180 38,092 38,285
Industrial hazardous waste (other) 4,722 3,046 7,768
Salts and saltcake 20,079 4 20,083
Healthcare risk waste 9,036 9,036
Oily sludges 45 3,464 3,509
Equipment (electrical, electronic, mechanical) 7,404 7,404
Chemical waste (other) 120 120
Paint, ink and varnish waste (including packaging)
1,358 1,358
Acid and alkali waste 3,777 3,777
Aqueous washing liquids and mother liquors (07 __ 01*)
452 11,937 12,389
Solid wastes from MFSU of pharmaceuticals (07 05 13*)
295 0 295
Sludges and filter cakes 0.2 132 132
Packaging (contaminated or containing residues) 25 2,068 2,093
Photographic chemical waste 95 95
Metal- and heavy metal-containing waste 8 8
Absorbents, wiping cloths etc. (EWC 15 02 02*) 30 2 32
Fluorescent lamps 260 260
Oil filters 7 7
Laboratory and general chemical waste 13 59 72
Thermal treatment and combustion residues 438 438
Municipal hazardous waste (other) 4 4
Totals 67,772 98,836 166,608
(Source: IPPC PRTR annual returns; hazardous waste treatment survey; recovery organisations survey for WEEE)
Table 37 identifies the reported recovery and disposal classes for hazardous waste managed within the
State (64% recovery and 36% disposal operations). Of the total quantity disposed, 43% was treated by
physico-chemical treatment, 21% was incinerated without energy recovery and 33% was landfilled. Of the
95
‘On-site at industry’ refers to hazardous waste treated on-site at the industrial facility where it was generated, under IPPC licence. 96
‘Off-site in Ireland’ refers to waste sent to EPA-licensed commercial hazardous waste treatment facilities in Ireland for treatment.
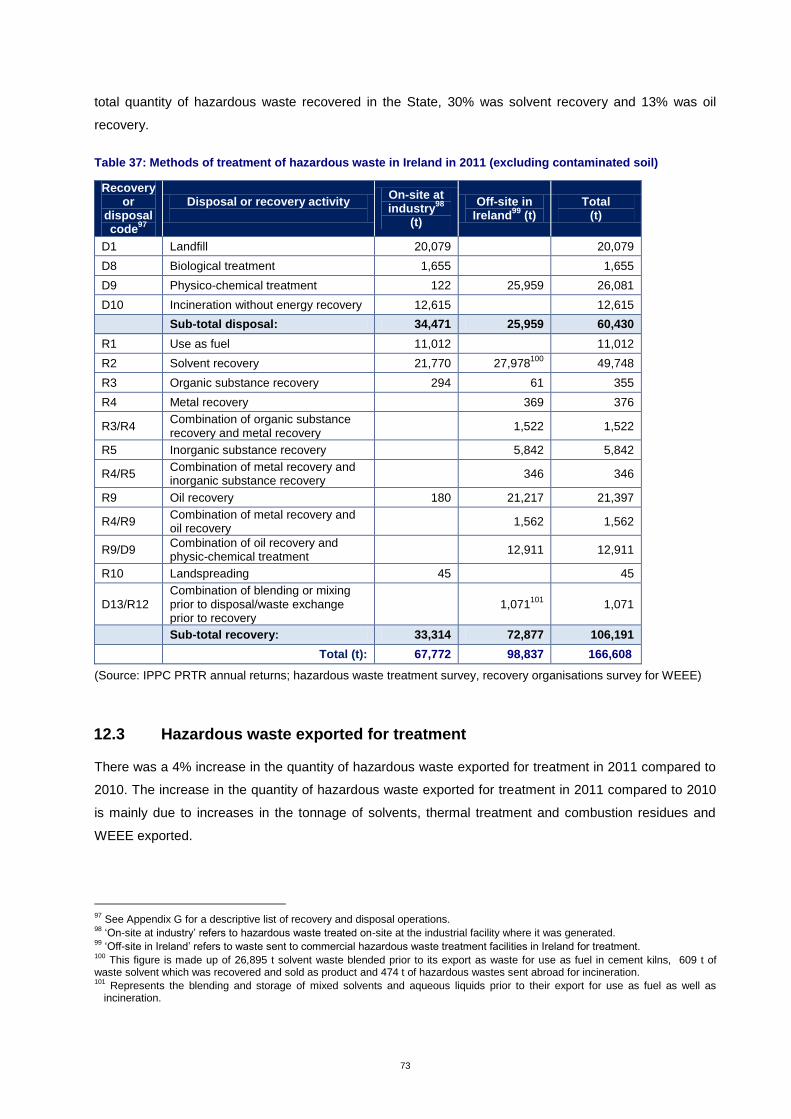
73
total quantity of hazardous waste recovered in the State, 30% was solvent recovery and 13% was oil
recovery.
Table 37: Methods of treatment of hazardous waste in Ireland in 2011 (excluding contaminated soil)
Recovery or
disposal code
97
Disposal or recovery activity
On-site at industry
98
(t)
Off-site in Ireland
99 (t)
Total (t)
D1 Landfill 20,079
20,079
D8 Biological treatment 1,655
1,655
D9 Physico-chemical treatment 122 25,959 26,081
D10 Incineration without energy recovery 12,615
12,615
Sub-total disposal: 34,471 25,959 60,430
R1 Use as fuel 11,012 11,012
R2 Solvent recovery 21,770 27,978100
49,748
R3 Organic substance recovery 294 61 355
R4 Metal recovery 369 376
R3/R4 Combination of organic substance recovery and metal recovery
1,522 1,522
R5 Inorganic substance recovery 5,842 5,842
R4/R5 Combination of metal recovery and inorganic substance recovery
346 346
R9 Oil recovery 180 21,217 21,397
R4/R9 Combination of metal recovery and oil recovery
1,562 1,562
R9/D9 Combination of oil recovery and physic-chemical treatment
12,911 12,911
R10 Landspreading 45 45
D13/R12 Combination of blending or mixing prior to disposal/waste exchange prior to recovery
1,071
101 1,071
Sub-total recovery: 33,314 72,877 106,191
Total (t): 67,772 98,837 166,608
(Source: IPPC PRTR annual returns; hazardous waste treatment survey, recovery organisations survey for WEEE)
12.3 Hazardous waste exported for treatment
There was a 4% increase in the quantity of hazardous waste exported for treatment in 2011 compared to
2010. The increase in the quantity of hazardous waste exported for treatment in 2011 compared to 2010
is mainly due to increases in the tonnage of solvents, thermal treatment and combustion residues and
WEEE exported.
97
See Appendix G for a descriptive list of recovery and disposal operations. 98
‘On-site at industry’ refers to hazardous waste treated on-site at the industrial facility where it was generated. 99
‘Off-site in Ireland’ refers to waste sent to commercial hazardous waste treatment facilities in Ireland for treatment. 100
This figure is made up of 26,895 t solvent waste blended prior to its export as waste for use as fuel in cement kilns, 609 t of waste solvent which was recovered and sold as product and 474 t of hazardous wastes sent abroad for incineration. 101
Represents the blending and storage of mixed solvents and aqueous liquids prior to their export for use as fuel as well as incineration.
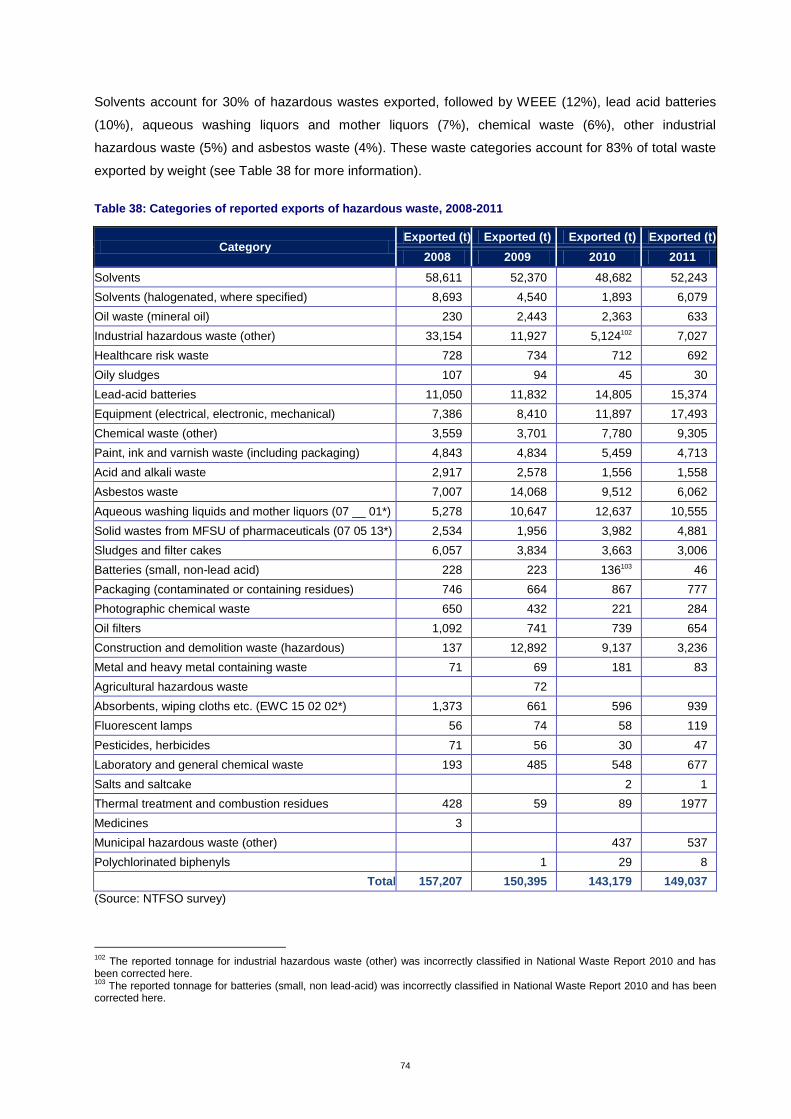
74
Solvents account for 30% of hazardous wastes exported, followed by WEEE (12%), lead acid batteries
(10%), aqueous washing liquors and mother liquors (7%), chemical waste (6%), other industrial
hazardous waste (5%) and asbestos waste (4%). These waste categories account for 83% of total waste
exported by weight (see Table 38 for more information).
Table 38: Categories of reported exports of hazardous waste, 2008-2011
Category Exported (t) Exported (t) Exported (t) Exported (t)
2008 2009 2010 2011
Solvents 58,611 52,370 48,682 52,243
Solvents (halogenated, where specified) 8,693 4,540 1,893 6,079
Oil waste (mineral oil) 230 2,443 2,363 633
Industrial hazardous waste (other) 33,154 11,927 5,124102 7,027
Healthcare risk waste 728 734 712 692
Oily sludges 107 94 45 30
Lead-acid batteries 11,050 11,832 14,805 15,374
Equipment (electrical, electronic, mechanical) 7,386 8,410 11,897 17,493
Chemical waste (other) 3,559 3,701 7,780 9,305
Paint, ink and varnish waste (including packaging) 4,843 4,834 5,459 4,713
Acid and alkali waste 2,917 2,578 1,556 1,558
Asbestos waste 7,007 14,068 9,512 6,062
Aqueous washing liquids and mother liquors (07 __ 01*) 5,278 10,647 12,637 10,555
Solid wastes from MFSU of pharmaceuticals (07 05 13*) 2,534 1,956 3,982 4,881
Sludges and filter cakes 6,057 3,834 3,663 3,006
Batteries (small, non-lead acid) 228 223 136103 46
Packaging (contaminated or containing residues) 746 664 867 777
Photographic chemical waste 650 432 221 284
Oil filters 1,092 741 739 654
Construction and demolition waste (hazardous) 137 12,892 9,137 3,236
Metal and heavy metal containing waste 71 69 181 83
Agricultural hazardous waste 72
Absorbents, wiping cloths etc. (EWC 15 02 02*) 1,373 661 596 939
Fluorescent lamps 56 74 58 119
Pesticides, herbicides 71 56 30 47
Laboratory and general chemical waste 193 485 548 677
Salts and saltcake 2 1
Thermal treatment and combustion residues 428 59 89 1977
Medicines 3
Municipal hazardous waste (other) 437 537
Polychlorinated biphenyls 1 29 8
Total 157,207 150,395 143,179 149,037
(Source: NTFSO survey)
102
The reported tonnage for industrial hazardous waste (other) was incorrectly classified in National Waste Report 2010 and has been corrected here. 103
The reported tonnage for batteries (small, non lead-acid) was incorrectly classified in National Waste Report 2010 and has been corrected here.
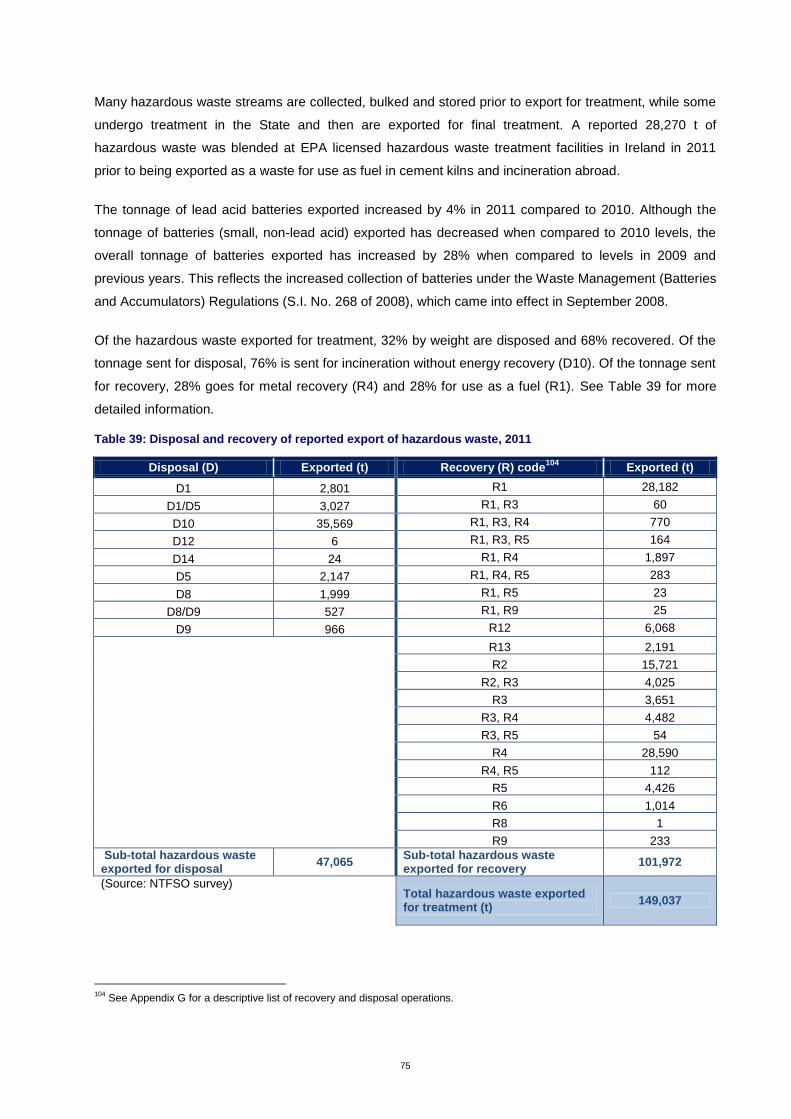
75
Many hazardous waste streams are collected, bulked and stored prior to export for treatment, while some
undergo treatment in the State and then are exported for final treatment. A reported 28,270 t of
hazardous waste was blended at EPA licensed hazardous waste treatment facilities in Ireland in 2011
prior to being exported as a waste for use as fuel in cement kilns and incineration abroad.
The tonnage of lead acid batteries exported increased by 4% in 2011 compared to 2010. Although the
tonnage of batteries (small, non-lead acid) exported has decreased when compared to 2010 levels, the
overall tonnage of batteries exported has increased by 28% when compared to levels in 2009 and
previous years. This reflects the increased collection of batteries under the Waste Management (Batteries
and Accumulators) Regulations (S.I. No. 268 of 2008), which came into effect in September 2008.
Of the hazardous waste exported for treatment, 32% by weight are disposed and 68% recovered. Of the
tonnage sent for disposal, 76% is sent for incineration without energy recovery (D10). Of the tonnage sent
for recovery, 28% goes for metal recovery (R4) and 28% for use as a fuel (R1). See Table 39 for more
detailed information.
Table 39: Disposal and recovery of reported export of hazardous waste, 2011
Disposal (D) Exported (t) Recovery (R) code104
Exported (t)
D1 2,801 R1 28,182
D1/D5 3,027 R1, R3 60
D10 35,569 R1, R3, R4 770
D12 6 R1, R3, R5 164
D14 24 R1, R4 1,897
D5 2,147 R1, R4, R5 283
D8 1,999 R1, R5 23
D8/D9 527 R1, R9 25
D9 966 R12 6,068
R13 2,191
R2 15,721
R2, R3 4,025
R3 3,651
R3, R4 4,482
R3, R5 54
R4 28,590
R4, R5 112
R5 4,426
R6 1,014
R8 1
R9 233
Sub-total hazardous waste exported for disposal
47,065 Sub-total hazardous waste exported for recovery
101,972
(Source: NTFSO survey)
Total hazardous waste exported for treatment (t)
149,037
104
See Appendix G for a descriptive list of recovery and disposal operations.
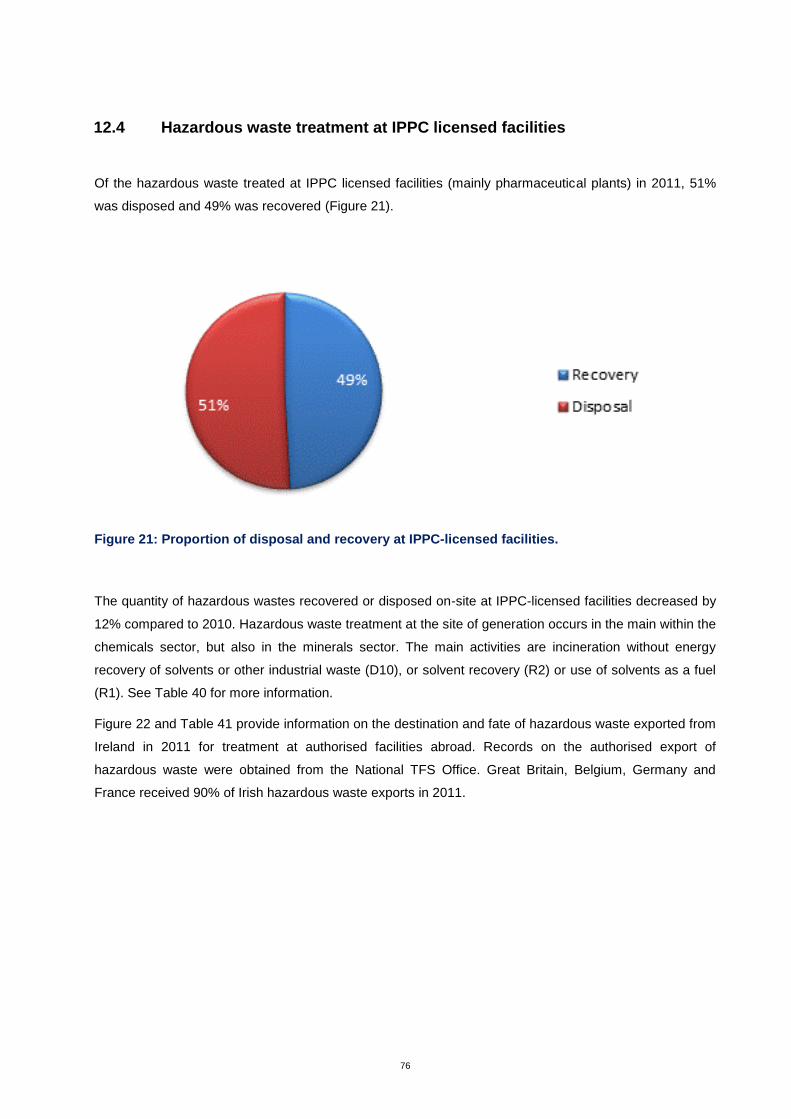
76
12.4 Hazardous waste treatment at IPPC licensed facilities
Of the hazardous waste treated at IPPC licensed facilities (mainly pharmaceutical plants) in 2011, 51%
was disposed and 49% was recovered (Figure 21).
Figure 21: Proportion of disposal and recovery at IPPC-licensed facilities.
The quantity of hazardous wastes recovered or disposed on-site at IPPC-licensed facilities decreased by
12% compared to 2010. Hazardous waste treatment at the site of generation occurs in the main within the
chemicals sector, but also in the minerals sector. The main activities are incineration without energy
recovery of solvents or other industrial waste (D10), or solvent recovery (R2) or use of solvents as a fuel
(R1). See Table 40 for more information.
Figure 22 and Table 41 provide information on the destination and fate of hazardous waste exported from
Ireland in 2011 for treatment at authorised facilities abroad. Records on the authorised export of
hazardous waste were obtained from the National TFS Office. Great Britain, Belgium, Germany and
France received 90% of Irish hazardous waste exports in 2011.
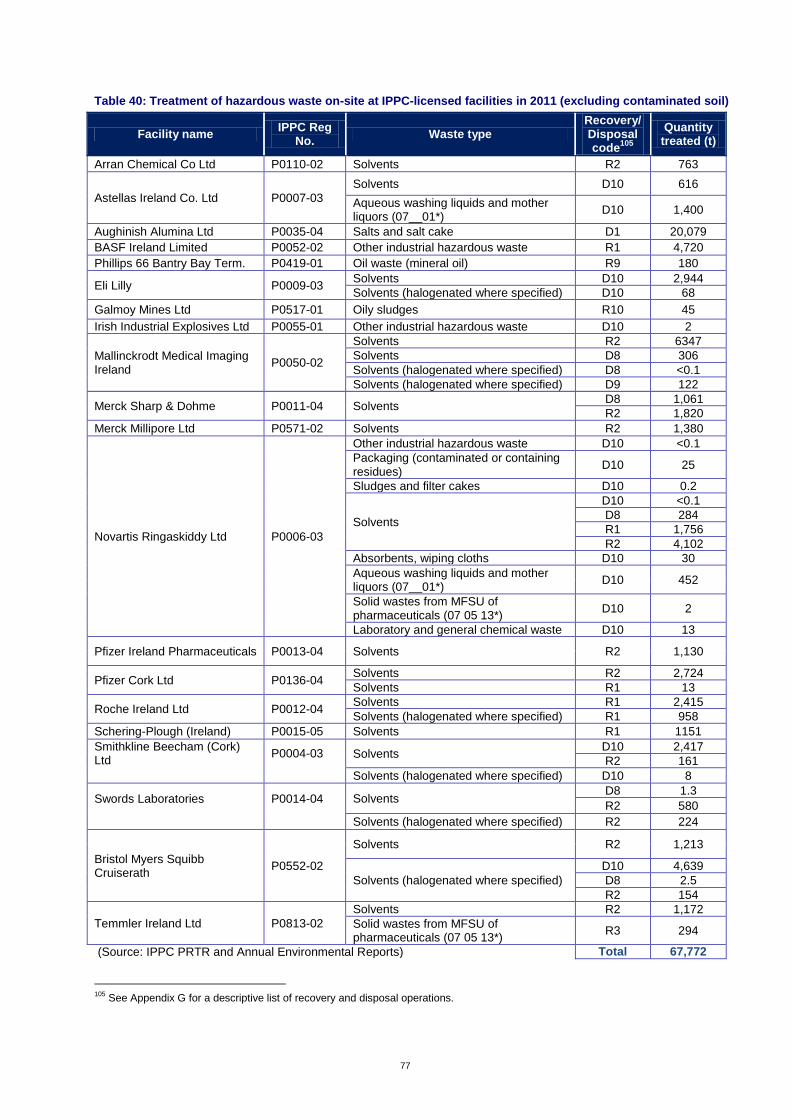
77
Table 40: Treatment of hazardous waste on-site at IPPC-licensed facilities in 2011 (excluding contaminated soil)
Facility name IPPC Reg
No. Waste type
Recovery/ Disposal code
105
Quantity treated (t)
Arran Chemical Co Ltd P0110-02 Solvents R2 763
Astellas Ireland Co. Ltd P0007-03
Solvents D10 616
Aqueous washing liquids and mother liquors (07__01*)
D10 1,400
Aughinish Alumina Ltd P0035-04 Salts and salt cake D1 20,079
BASF Ireland Limited P0052-02 Other industrial hazardous waste R1 4,720
Phillips 66 Bantry Bay Term. P0419-01 Oil waste (mineral oil) R9 180
Eli Lilly P0009-03 Solvents D10 2,944
Solvents (halogenated where specified) D10 68
Galmoy Mines Ltd P0517-01 Oily sludges R10 45
Irish Industrial Explosives Ltd P0055-01 Other industrial hazardous waste D10 2
Mallinckrodt Medical Imaging Ireland
P0050-02
Solvents R2 6347
Solvents D8 306
Solvents (halogenated where specified) D8 <0.1
Solvents (halogenated where specified) D9 122
Merck Sharp & Dohme P0011-04 Solvents D8 1,061
R2 1,820
Merck Millipore Ltd P0571-02 Solvents R2 1,380
Novartis Ringaskiddy Ltd P0006-03
Other industrial hazardous waste D10 <0.1
Packaging (contaminated or containing residues)
D10 25
Sludges and filter cakes D10 0.2
Solvents
D10 <0.1
D8 284
R1 1,756
R2 4,102
Absorbents, wiping cloths D10 30
Aqueous washing liquids and mother liquors (07__01*)
D10 452
Solid wastes from MFSU of pharmaceuticals (07 05 13*)
D10 2
Laboratory and general chemical waste D10 13
Pfizer Ireland Pharmaceuticals P0013-04 Solvents R2 1,130
Pfizer Cork Ltd P0136-04 Solvents R2 2,724
Solvents R1 13
Roche Ireland Ltd P0012-04 Solvents R1 2,415
Solvents (halogenated where specified) R1 958
Schering-Plough (Ireland) P0015-05 Solvents R1 1151
Smithkline Beecham (Cork) Ltd
P0004-03 Solvents D10 2,417
R2 161
Solvents (halogenated where specified) D10 8
Swords Laboratories P0014-04 Solvents D8 1.3
R2 580
Solvents (halogenated where specified) R2 224
Bristol Myers Squibb Cruiserath
P0552-02
Solvents R2 1,213
Solvents (halogenated where specified)
D10 4,639
D8 2.5
R2 154
Temmler Ireland Ltd P0813-02
Solvents R2 1,172
Solid wastes from MFSU of pharmaceuticals (07 05 13*)
R3 294
(Source: IPPC PRTR and Annual Environmental Reports) Total 67,772
105
See Appendix G for a descriptive list of recovery and disposal operations.
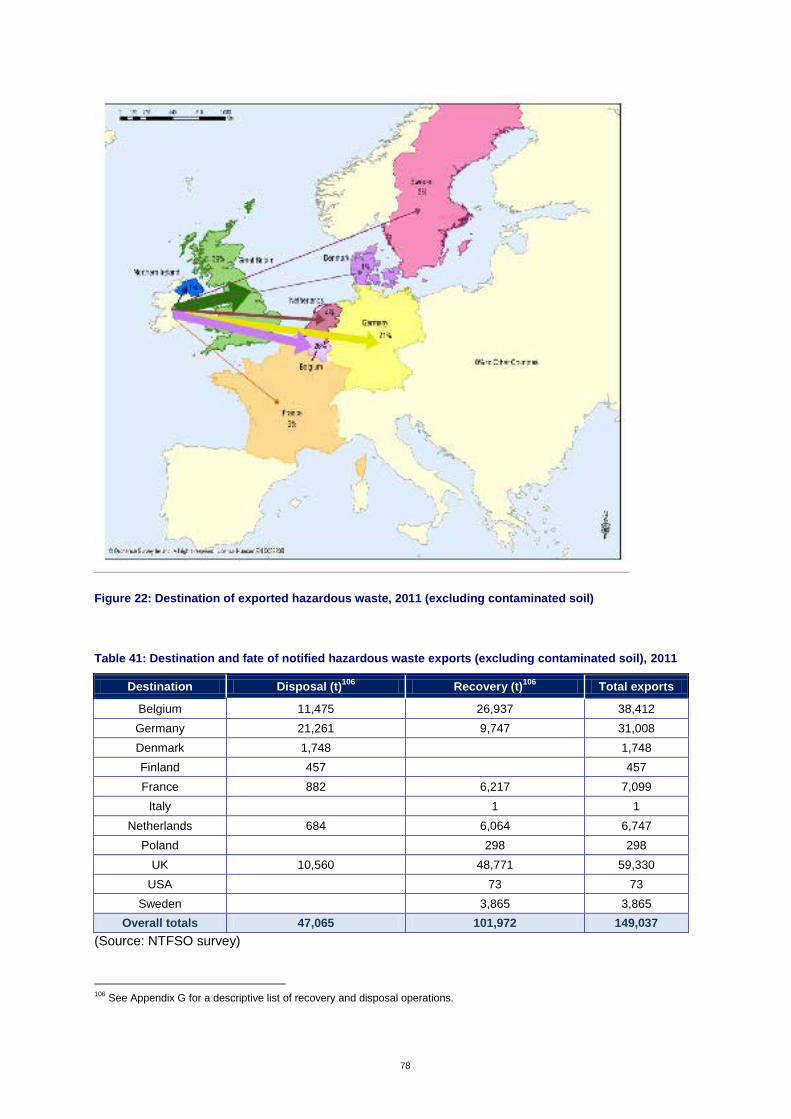
78
Figure 22: Destination of exported hazardous waste, 2011 (excluding contaminated soil)
Table 41: Destination and fate of notified hazardous waste exports (excluding contaminated soil), 2011
Destination Disposal (t)106
Recovery (t)106
Total exports
Belgium 11,475 26,937 38,412
Germany 21,261 9,747 31,008
Denmark 1,748
1,748
Finland 457
457
France 882 6,217 7,099
Italy
1 1
Netherlands 684 6,064 6,747
Poland
298 298
UK 10,560 48,771 59,330
USA
73 73
Sweden
3,865 3,865
Overall totals 47,065 101,972 149,037
(Source: NTFSO survey)
106
See Appendix G for a descriptive list of recovery and disposal operations.
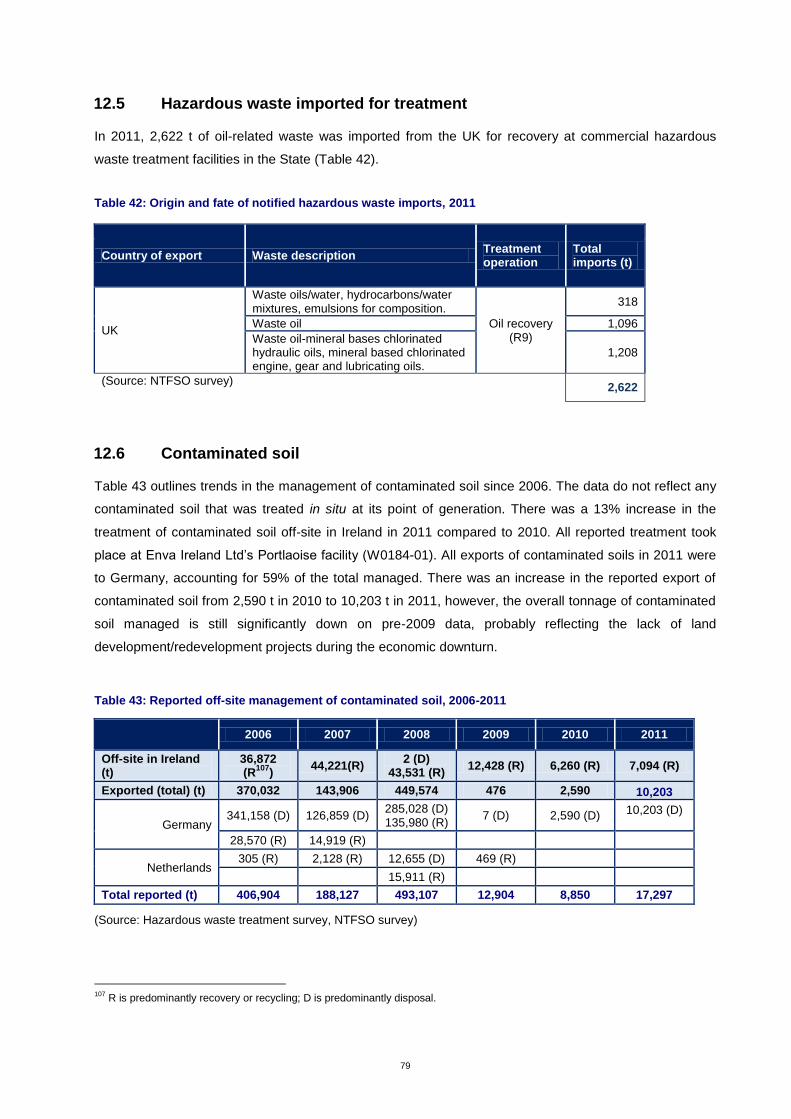
79
12.5 Hazardous waste imported for treatment
In 2011, 2,622 t of oil-related waste was imported from the UK for recovery at commercial hazardous
waste treatment facilities in the State (Table 42).
Table 42: Origin and fate of notified hazardous waste imports, 2011
Country of export Waste description Treatment operation
Total imports (t)
UK
Waste oils/water, hydrocarbons/water mixtures, emulsions for composition.
Oil recovery (R9)
318
Waste oil 1,096
Waste oil-mineral bases chlorinated hydraulic oils, mineral based chlorinated engine, gear and lubricating oils.
1,208
(Source: NTFSO survey)
2,622
12.6 Contaminated soil
Table 43 outlines trends in the management of contaminated soil since 2006. The data do not reflect any
contaminated soil that was treated in situ at its point of generation. There was a 13% increase in the
treatment of contaminated soil off-site in Ireland in 2011 compared to 2010. All reported treatment took
place at Enva Ireland Ltd’s Portlaoise facility (W0184-01). All exports of contaminated soils in 2011 were
to Germany, accounting for 59% of the total managed. There was an increase in the reported export of
contaminated soil from 2,590 t in 2010 to 10,203 t in 2011, however, the overall tonnage of contaminated
soil managed is still significantly down on pre-2009 data, probably reflecting the lack of land
development/redevelopment projects during the economic downturn.
Table 43: Reported off-site management of contaminated soil, 2006-2011
2006 2007 2008 2009 2010 2011
Off-site in Ireland (t)
36,872 (R
107)
44,221(R) 2 (D)
43,531 (R) 12,428 (R) 6,260 (R) 7,094 (R)
Exported (total) (t) 370,032 143,906 449,574 476 2,590 10,203
Germany 341,158 (D) 126,859 (D)
285,028 (D) 135,980 (R)
7 (D) 2,590 (D) 10,203 (D)
28,570 (R) 14,919 (R)
Netherlands 305 (R) 2,128 (R) 12,655 (D) 469 (R)
15,911 (R)
Total reported (t) 406,904 188,127 493,107 12,904 8,850 17,297
(Source: Hazardous waste treatment survey, NTFSO survey)
107
R is predominantly recovery or recycling; D is predominantly disposal.
80
12.7 National Hazardous Waste Management Plan
The EPA is currently reviewing the National Hazardous Waste Management Plan (NHWMP) for the
period 2013-2017 in accordance with Section 26 of the Waste Management Acts 1996 to 2012. The first
NHWMP was published in 2001 and was replaced by a second Plan in 2008.
The proposed NHWMP will set out the priority actions that should be undertaken within the period of the
Plan in relation to the prevention of hazardous waste; improved collection rates for certain categories of
hazardous waste; the steps that are required to improve Ireland’s self-sufficiency in hazardous waste
management and the management of legacy hazardous wastes contained in closed landfills. All of the
NHWMP recommendations are designed to reduce the environmental impact of hazardous waste.

81
APPENDICES
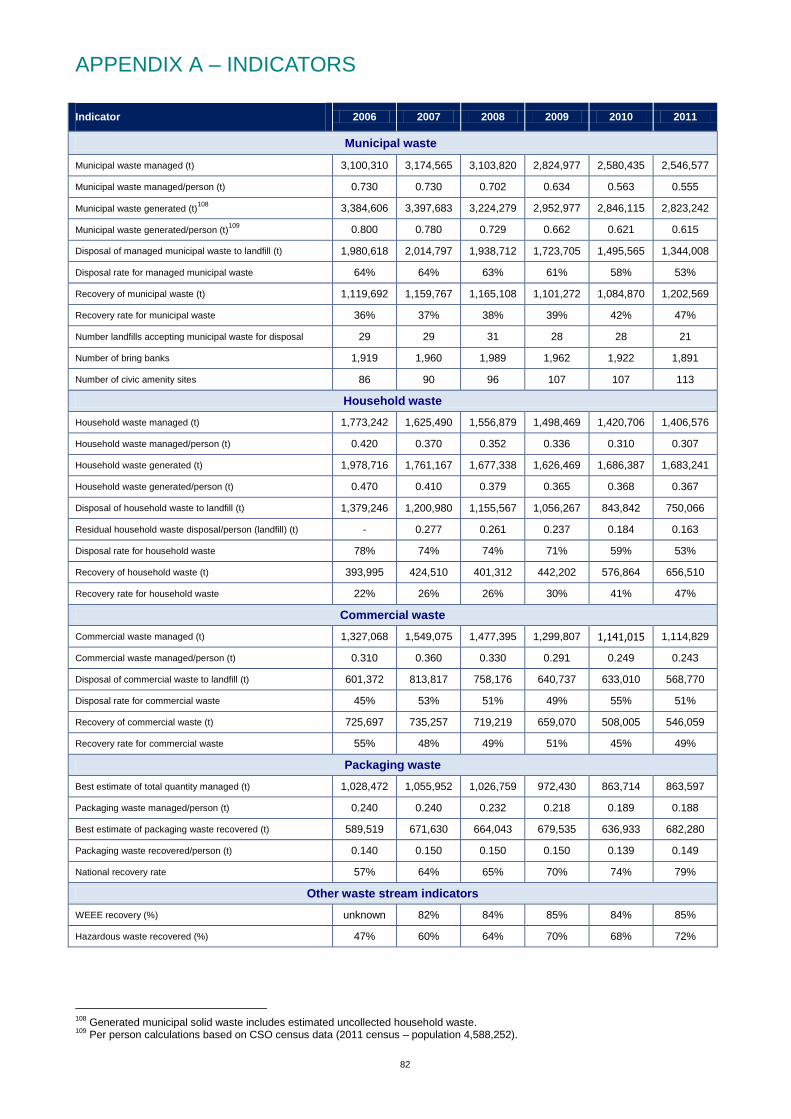
82
APPENDIX A – INDICATORS
Indicator 2006 2007 2008 2009 2010 2011
Municipal waste
Municipal waste managed (t) 3,100,310 3,174,565 3,103,820 2,824,977 2,580,435 2,546,577
Municipal waste managed/person (t) 0.730 0.730 0.702 0.634 0.563 0.555
Municipal waste generated (t)108
3,384,606 3,397,683 3,224,279 2,952,977 2,846,115 2,823,242
Municipal waste generated/person (t)109
0.800 0.780 0.729 0.662 0.621 0.615
Disposal of managed municipal waste to landfill (t) 1,980,618 2,014,797 1,938,712 1,723,705 1,495,565 1,344,008
Disposal rate for managed municipal waste 64% 64% 63% 61% 58% 53%
Recovery of municipal waste (t) 1,119,692 1,159,767 1,165,108 1,101,272 1,084,870 1,202,569
Recovery rate for municipal waste 36% 37% 38% 39% 42% 47%
Number landfills accepting municipal waste for disposal 29 29 31 28 28 21
Number of bring banks 1,919 1,960 1,989 1,962 1,922 1,891
Number of civic amenity sites 86 90 96 107 107 113
Household waste
Household waste managed (t) 1,773,242 1,625,490 1,556,879 1,498,469 1,420,706 1,406,576
Household waste managed/person (t) 0.420 0.370 0.352 0.336 0.310 0.307
Household waste generated (t) 1,978,716 1,761,167 1,677,338 1,626,469 1,686,387 1,683,241
Household waste generated/person (t) 0.470 0.410 0.379 0.365 0.368 0.367
Disposal of household waste to landfill (t) 1,379,246 1,200,980 1,155,567 1,056,267 843,842 750,066
Residual household waste disposal/person (landfill) (t) - 0.277 0.261 0.237 0.184 0.163
Disposal rate for household waste 78% 74% 74% 71% 59% 53%
Recovery of household waste (t) 393,995 424,510 401,312 442,202 576,864 656,510
Recovery rate for household waste 22% 26% 26% 30% 41% 47%
Commercial waste
Commercial waste managed (t) 1,327,068 1,549,075 1,477,395 1,299,807 1,141,015 1,114,829
Commercial waste managed/person (t) 0.310 0.360 0.330 0.291 0.249 0.243
Disposal of commercial waste to landfill (t) 601,372 813,817 758,176 640,737 633,010 568,770
Disposal rate for commercial waste 45% 53% 51% 49% 55% 51%
Recovery of commercial waste (t) 725,697 735,257 719,219 659,070 508,005 546,059
Recovery rate for commercial waste 55% 48% 49% 51% 45% 49%
Packaging waste
Best estimate of total quantity managed (t) 1,028,472 1,055,952 1,026,759 972,430 863,714 863,597
Packaging waste managed/person (t) 0.240 0.240 0.232 0.218 0.189 0.188
Best estimate of packaging waste recovered (t) 589,519 671,630 664,043 679,535 636,933 682,280
Packaging waste recovered/person (t) 0.140 0.150 0.150 0.150 0.139 0.149
National recovery rate 57% 64% 65% 70% 74% 79%
Other waste stream indicators
WEEE recovery (%) unknown 82% 84% 85% 84% 85%
Hazardous waste recovered (%) 47% 60% 64% 70% 68% 72%
108
Generated municipal solid waste includes estimated uncollected household waste. 109
Per person calculations based on CSO census data (2011 census – population 4,588,252).
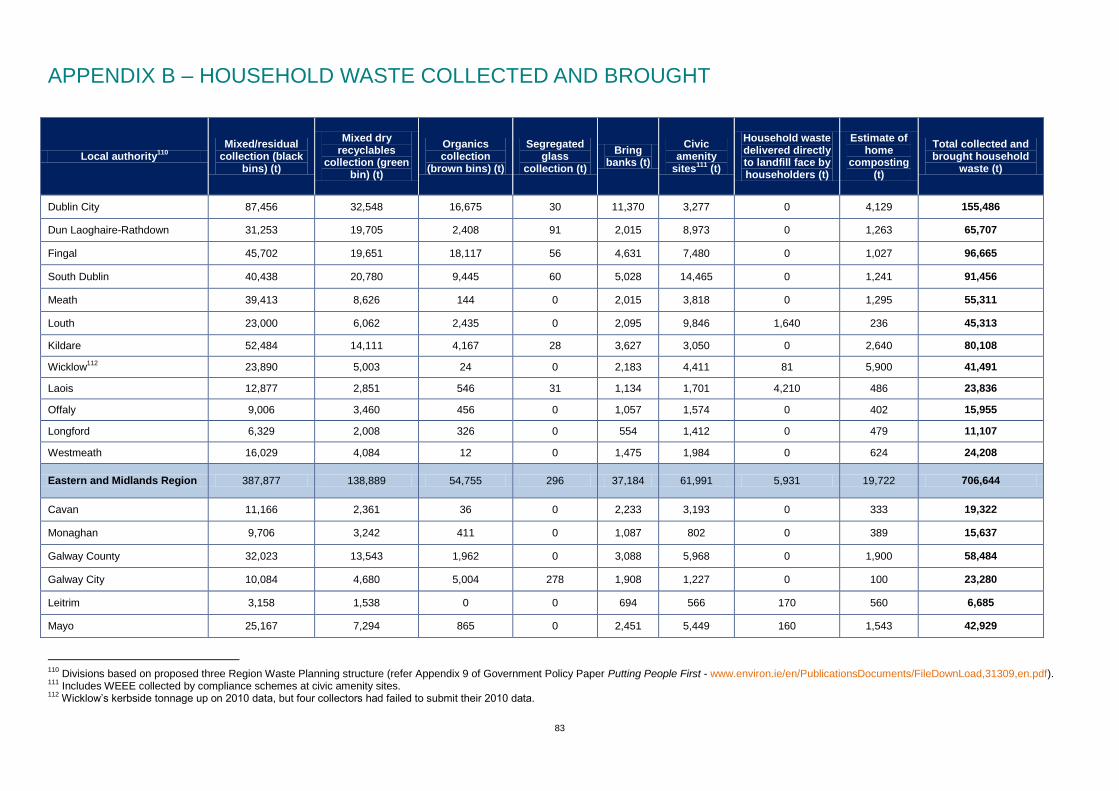
83
APPENDIX B – HOUSEHOLD WASTE COLLECTED AND BROUGHT
Local authority110
Mixed/residual
collection (black bins) (t)
Mixed dry recyclables
collection (green bin) (t)
Organics collection
(brown bins) (t)
Segregated glass
collection (t)
Bring banks (t)
Civic amenity
sites111
(t)
Household waste delivered directly to landfill face by householders (t)
Estimate of home
composting (t)
Total collected and brought household
waste (t)
Dublin City 87,456 32,548 16,675 30 11,370 3,277 0 4,129 155,486
Dun Laoghaire-Rathdown 31,253 19,705 2,408 91 2,015 8,973 0 1,263 65,707
Fingal 45,702 19,651 18,117 56 4,631 7,480 0 1,027 96,665
South Dublin 40,438 20,780 9,445 60 5,028 14,465 0 1,241 91,456
Meath 39,413 8,626 144 0 2,015 3,818 0 1,295 55,311
Louth 23,000 6,062 2,435 0 2,095 9,846 1,640 236 45,313
Kildare 52,484 14,111 4,167 28 3,627 3,050 0 2,640 80,108
Wicklow112
23,890 5,003 24 0 2,183 4,411 81 5,900 41,491
Laois 12,877 2,851 546 31 1,134 1,701 4,210 486 23,836
Offaly 9,006 3,460 456 0 1,057 1,574 0 402 15,955
Longford 6,329 2,008 326 0 554 1,412 0 479 11,107
Westmeath 16,029 4,084 12 0 1,475 1,984 0 624 24,208
Eastern and Midlands Region 387,877 138,889 54,755 296 37,184 61,991 5,931 19,722 706,644
Cavan 11,166 2,361 36 0 2,233 3,193 0 333 19,322
Monaghan 9,706 3,242 411 0 1,087 802 0 389 15,637
Galway County 32,023 13,543 1,962 0 3,088 5,968 0 1,900 58,484
Galway City 10,084 4,680 5,004 278 1,908 1,227 0 100 23,280
Leitrim 3,158 1,538 0 0 694 566 170 560 6,685
Mayo 25,167 7,294 865 0 2,451 5,449 160 1,543 42,929
110
Divisions based on proposed three Region Waste Planning structure (refer Appendix 9 of Government Policy Paper Putting People First - www.environ.ie/en/PublicationsDocuments/FileDownLoad,31309,en.pdf). 111
Includes WEEE collected by compliance schemes at civic amenity sites. 112
Wicklow’s kerbside tonnage up on 2010 data, but four collectors had failed to submit their 2010 data.
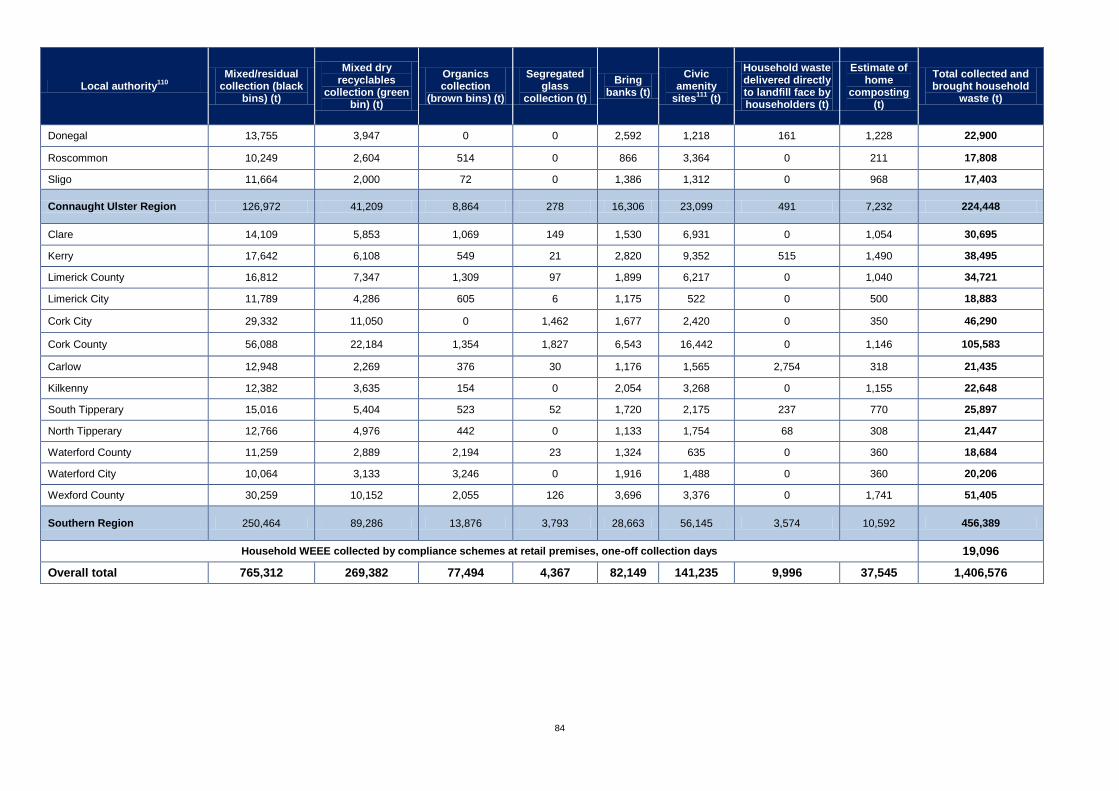
84
Local authority110
Mixed/residual
collection (black bins) (t)
Mixed dry recyclables
collection (green bin) (t)
Organics collection
(brown bins) (t)
Segregated glass
collection (t)
Bring banks (t)
Civic amenity
sites111
(t)
Household waste delivered directly to landfill face by householders (t)
Estimate of home
composting (t)
Total collected and brought household
waste (t)
Donegal 13,755 3,947 0 0 2,592 1,218 161 1,228 22,900
Roscommon 10,249 2,604 514 0 866 3,364 0 211 17,808
Sligo 11,664 2,000 72 0 1,386 1,312 0 968 17,403
Connaught Ulster Region 126,972 41,209 8,864 278 16,306 23,099 491 7,232 224,448
Clare 14,109 5,853 1,069 149 1,530 6,931 0 1,054 30,695
Kerry 17,642 6,108 549 21 2,820 9,352 515 1,490 38,495
Limerick County 16,812 7,347 1,309 97 1,899 6,217 0 1,040 34,721
Limerick City 11,789 4,286 605 6 1,175 522 0 500 18,883
Cork City 29,332 11,050 0 1,462 1,677 2,420 0 350 46,290
Cork County 56,088 22,184 1,354 1,827 6,543 16,442 0 1,146 105,583
Carlow 12,948 2,269 376 30 1,176 1,565 2,754 318 21,435
Kilkenny 12,382 3,635 154 0 2,054 3,268 0 1,155 22,648
South Tipperary 15,016 5,404 523 52 1,720 2,175 237 770 25,897
North Tipperary 12,766 4,976 442 0 1,133 1,754 68 308 21,447
Waterford County 11,259 2,889 2,194 23 1,324 635 0 360 18,684
Waterford City 10,064 3,133 3,246 0 1,916 1,488 0 360 20,206
Wexford County 30,259 10,152 2,055 126 3,696 3,376 0 1,741 51,405
Southern Region 250,464 89,286 13,876 3,793 28,663 56,145 3,574 10,592 456,389
Household WEEE collected by compliance schemes at retail premises, one-off collection days 19,096
Overall total 765,312 269,382 77,494 4,367 82,149 141,235 9,996 37,545 1,406,576
85
APPENDIX C
HOUSEHOLD WASTE COLLECTED AT BRING BANKS
Local authority area Paper &
cardboard (t)
Glass (t)
Aluminium cans (t)
Steel cans (t)
Plastic (t)
Composite packaging
(t)
Other113
(t) Total
(t)
Carlow 365 780 31 0 0 0 0 1,176
Cavan 167 1,242 58 39 720 8 0 2,233
Clare 0 1,286 44 0 183 0 16 1,530
Cork City 0 1,660 17 0 0 0 0 1,677
Cork County 198 5,939 134 235 24 0 13 6,543
Donegal 0 2,405 60 91 0 0 36 2,592
Dublin City 1,576 8,916 28 1 0 0 849 11,370
Dún Laoghaire-Rathdown 0 2,000 15 0 0 0 0 2,015
Fingal 0 4,613 18 0 0 0 0 4,631
Galway City 0 1,908 0 0 0 0 0 1,908
Galway County 0 2,991 58 39 0 0 0 3,088
Kerry 0 2,433 87 201 100 0 0 2,820
Kildare 0 3,597 30 0 0 0 0 3,627
Kilkenny 26 1,700 53 14 5 0 254 2,054
Laois 0 1,099 14 22 0 0 0 1,134
Leitrim 0 656 37 0 0 0 0 694
Limerick City 0 1,051 38 0 87 0 0 1,175
Limerick County 0 1,718 29 80 0 0 72 1,899
Longford 0 535 7 10 0 0 2 554
Louth 0 1,725 71 0 299 0 0 2,095
Mayo 0 2,352 100 0 0 0 0 2,451
Meath 0 1,994 22 0 0 0 0 2,015
Monaghan 0 1,047 41 0 0 0 0 1,087
North Tipperary 0 1,086 23 0 0 0 23 1,133
Offaly 0 991 23 42 0 0 0 1,057
Roscommon 0 822 43 0 0 0 1 866
Sligo 0 1,332 54 0 0 0 0 1,386
South Dublin 0 4,863 16 0 0 0 149 5,028
South Tipperary 68 1,600 52 0 0 0 0 1,720
Waterford County 0 1,324 0 0 0 0 0 1,324
Waterford City 0 1,885 30 0 0 0 0 1,916
Westmeath 0 1,460 15 0 0 0 0 1,475
Wexford 545 3,067 83 0 0 0 0 3,696
Wicklow 0 2,085 46 12 0 0 39 2,183
Total 2,946 74,161 1,378 785 1,417 8 1,454 82,149
113
Other = wood, green waste (e.g. Christmas trees), household hazardous waste collected at temporary bring centres.
86
APPENDIX D – HOUSEHOLD WASTE COLLECTED AT CIVIC AMENITY SITES
Local authority area
Mix
ed
resid
ual
waste
(t)
Org
anic
waste
(fo
od
& g
ard
en)
(t)
Mix
ed d
ry
recycla
ble
s
(t)
Pape
r, c
ard
&
mag
azin
es
(t)
Gla
ss (
t)
Meta
ls (
t)
Pla
stic (
t)
Com
posites
(eg
tetr
ap
ak)
(t)
C&
D (
DIY
)
(t)
Wood
114 (
t)
Batte
ries
115
(t)
Waste
min
era
l oils
& filt
ers
(t)
Waste
cookin
g o
r
veg.
oils
(t)
Pain
t &
varn
ish (
t)
WE
EE
116 (
t)
Bulk
y w
aste
(t
)
Househ
old
hazard
ous
waste
(t)
Oth
er1
17 (
t)
To
tal (t
)
Carlow 0 361 0 209 136 166 68 6 20 323 13 9.5 1.7 11.3 231 0 0.0 7.7 1,565
Cavan 1419 265 0 374 140 138 205 9 129 204 3 1.6 0.8 3.0 245 57 0.0 0.2 3,193
Clare 2035 730 0 646 1010 504 340 11 160 564 17 32.2 0.5 35.2 547 300 0.0 0.0 6,931
Cork City 992 216 0 176 33 86 34 0 0 151 4 7.5 0.0 18.2 701 0 0.9 0.0 2,420
Cork County 3931 1464 366 1711 946 1013 233 0 1800 1420 39 31.3 17.4 124.1 1691 1652 0.5 1.7 16,442
Donegal 0 2 0 234 224 112 100 1 0 0 0 5.8 2.0 20.5 325 191 1.6 0.0 1,218
Dublin City 0 108 157 56 184 62 23 0 457 186 3 1.8 0.0 311.8 627 1096 0.0 4.1 3,277
Dun Laoghaire-Rathdown 280 4001 0 767 446 310 147 15 332 543 23 14.2 4.1 130.1 656 1303 0.0 1.6 8,973
Fingal 0 1084 0 431 540 352 86 6 1058 969 26 26.2 3.9 187.2 1242 1464 2.7 1.4 7,480
Galway County 1914 385 218 498 280 1183 158 0 713 149 18 16.0 0.0 78.0 329 0 6.1 23.3 5,968
Galway City 0 0 0 0 16 34 3 0 0 316 4 10.1 0.0 40.2 804 0 0.0 0.0 1,227
Kerry 6898 366 238 722 218 251 116 0 9 24 2 11.5 0.7 2.6 490 0 0.0 1.4 9,352
Kildare 2233 16 0 273 58 157 33 0 12 0 5 3.4 0.0 0.0 58 89 73.9 39.0 3,050
Kilkenny 1698 0 0 298 87 69 69 9 0 38 0 3.8 0.5 23.0 177 795 1.9 0.0 3,268
Laois 0 194 0 468 202 208 220 2 4 31 1 12.2 0.3 8.5 279 0 51.2 17.7 1,701
Leitrim 0 15 0 88 28 33 18 3 0 0 0 1.4 0.0 33.2 74 272 0.0 0.6 566
Limerick County 2062 483 0 534 209 329 247 5 933 524 12 6.7 8.6 121.3 570 135 0.0 36.5 6,217
Limerick City 0 0 0 121 0 0 0 0 0 0 13 2.2 1.8 42.3 308 0 0.0 34.4 522
Longford 342 203 110 147 35 73 78 4 26 80 3 0.0 0.0 3.7 172 135 0.0 0.0 1,412
Louth 895 2702 0 1966 595 454 598 0 136 1725 16 5.8 3.5 3.6 746 0 0.0 9,846
Mayo 3242 37 0 635 208 301 126 12 33 263 16 15.2 3.3 29.8 488 0 24.5 14.8 5,449
Meath 217 729 132 610 365 250 153 16 126 320 14 4.8 2.7 38.6 725 101 9.7 4.4 3,818
Monaghan 221 0 0 0 86 47 0 0 226 0 8 5.8 0.8 1.8 206 0 0.0 0.6 802
North Tipperary 362 2 0 416 206 95 94 5 0 133 7 10.6 0.0 0.0 342 79 0.0 0.6 1,754
Offaly 187 301 0 326 100 142 84 11 19 199 0 2.6 0.0 51.0 105 42 0.0 4.9 1,574
Roscommon 1672 2 95 615 145 185 86 0 101 149 5 3.8 0.6 28.9 275 0 0.0 1.3 3,364
Sligo 0 509 0 221 81 63 47 6 51 43 2 0.0 3.0 0.0 277 0 10.7 0.0 1,312
South Dublin 3582 1941 0 259 99 345 11 0 798 66 14 43.6 0.9 33.7 787 6483 0.0 14,465
South Tipperary 805 0 111 145 94 164 32 0 143 265 1 2.9 0.0 1.8 318 70 0.3 23.0 2,175
Waterford County 115 52 92 0 39 21 0 0 0 44 0 2.0 1.3 2.9 197 67 0.0 1.2 635
Waterford City 310 826 0 24 16 11 0 0 0 0 1 2.5 0.5 7.0 289 0 0.0 1.6 1,488
Westmeath 0 517 0 437 132 140 83 15 0 255 17 7.2 1.0 0.0 349 32 0.0 0.0 1,984
Wexford 2082 0 15 358 163 241 85 8 0 10 14.0 1.6 0.0 389 0 9.5 0.0 3,376
Wicklow 108 0 0 1735 866 279 417 60 0 0 4 9.9 5.0 54.3 841 0 7.7 23.7 4,411
Total (t) 37,601 17,511 1,534 15,502 7,986 7,817 3,996 203 7,286 8,984 304 328 67 1,448 15,860 14,362 201 246 141,235
114
75% of which (in t) is home improvement/DIY source. 115
80% of which (in t) are lead acid. 116
Compliance scheme data for household WEEE collected at civic amenity sites. 117
Other = tyres, aerosols, gas cylinders, books, miscellaneous recyclables, etc.
87
APPENDIX E – LANDFILLS IN OPERATION
Local authority
/ Operator Facility name
Waste licence Reg No.
Total waste
accepted in 2010
(t)
Total waste
accepted in 2011
(t)
DISPOSAL118
RECOVERY
Household waste
(t)
Commercial waste
119
(t)
Industrial waste
(t)
C & D waste
(t)
Municipal sweepings
& parks (t)
C & D waste
(t)
Organic waste
120
(t)
Other wastes
121
(t)
1 Carlow County Council
Powerstown Landfill
W0025-03 13,663 10,146 3,508 534 1,997 0 3,370 737 0 0
2 Cavan County Council
Corranure Landfill
W0077-04 12,231 154 0 0 0 0 0 154 0 0
3 Clare County Council
Central Waste Management Facility
W0109-02 28,826 36,346 15,820 13,138 928 0 808 4,632 0 1,021
4 Cork County Council
Youghal Landfill W0068-03 58,965 25,911 21,071 678 192 0 2,881 1,089 0 0
5 Cork County Council
Derryconnell Landfill Site
W0089-02 4,225 0 0 0 0 0 0 0 0 0
6 Donegal County Council
Ballynacarrick Landfill
W0024-04 31,565 16,170 5,981 8,764 1,251 0 174 0 0 0
7 Fingal County Council
Balleally Landfill W0009-03 97,726 89,503 31,222 14,829 7,351 0 975 35,126 0 0
8 Kerry County Council
North Kerry Landfill
W0001-04 21,276 16,504 13,825 1,551 0 0 892 0 0 236
9 Kilkenny County Council
Dunmore Landfill
W0030-02 1,470 0 0 0 0 0 0 0 0 0
10 Laois County Council
Kyletalesha Landfill
W0026-03 58,289 43,720 22,531 13,889 39 3 324 6,895 40 0
118
Fly-tipped waste accepted for disposal in 2011=13,700 t (compared to 14,958 t in 2010 and 16,573 t in 2009). This tonnage is reported within the household and commercial waste columns. 119
Includes non-process industrial waste. 120
‘Organic’ category is made up of compost, bio-stabilised waste. 121
‘Other’ category includes timber, wood chip recovered at landfill sites.
88
Local authority
/ Operator Facility name
Waste licence Reg No.
Total waste
accepted in 2010
(t)
Total waste
accepted in 2011
(t)
DISPOSAL118
RECOVERY
Household waste
(t)
Commercial waste
119
(t)
Industrial waste
(t)
C & D waste
(t)
Municipal sweepings
& parks (t)
C & D waste
(t)
Organic waste
120
(t)
Other wastes
121
(t)
11 Limerick County Council
Gortadroma W0017-04 117,138 135,487 82,805 46,354 368 0 467 5,493 0 0
12 Louth County Council
Whiteriver W0060-03 41,664 120,381 58,898 11,075 2,700 377 2,569 43,026 0 1,737
13 Mayo County Council
Derrinumera Landfill
W0021-02 35,244 33,859 27,322 4,454 5 0 1,268 168 0 643
14 Mayo County Council
Rathroeen Landfill
W0067-02 649 1,354 0 0 931 0 0 39 0 384
15 Monaghan County Council
Scotch Corner Landfill
W0020-02 33,789 27,430 15,815 10,323 528 0 702 0 62 0
16 North Tipperary County Council
Ballaghveny Landfill
W0078-03 17,044 9,770 4,223 2,676 461 2,331 79 0 0 0
17 Offaly County Council
Derryclure Landfill
W0029-04 51,332 110,123 87,154 3,224 205 4,666 0 14,874 0 0
18 Roscommon County Council
Ballaghaderreen Landfill
W0059-03 48,779 16,800 0 0 0 0 0 16,800 0 0
19 South Dublin County Council
Arthurstown Landfill
W0004-04 255,379 33,438 0 0 0 0 0 33,438 0 0
20 South Tipperary County Council
Donohill Landfill W0074-03 15,271 17,281 7,717 2,759 223 0 1,244 467 0 4,871
21 Westmeath County Council
Ballydonagh Landfill
W0028-03 23,993 0 0 0 0 0 0 0 0 0
22 Wexford County Council
Holmestown Landfill
W0191-02 33,782 24,120 21,225 1,383 0 0 1,313 84 0 116
23 Wicklow County Council
Rampere Landfill
W0066-03 31,630 38,825 17,597 9,531 283 0 514 10,900 0 0
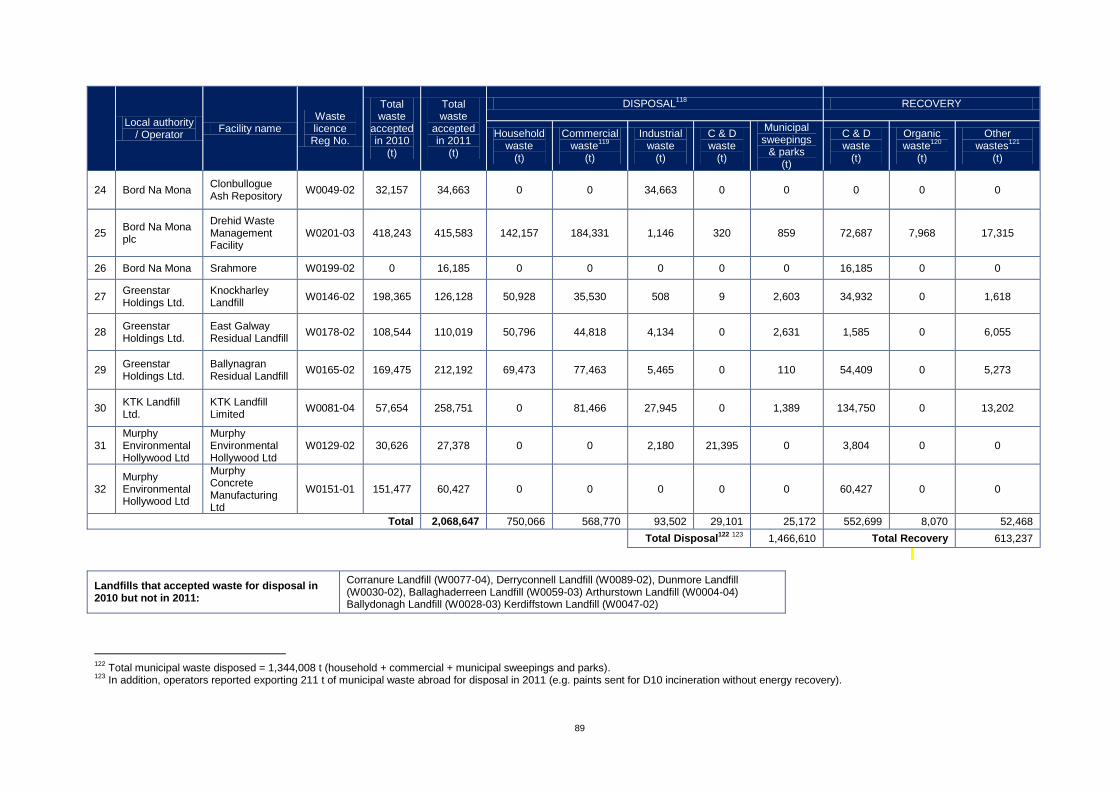
89
Local authority
/ Operator Facility name
Waste licence Reg No.
Total waste
accepted in 2010
(t)
Total waste
accepted in 2011
(t)
DISPOSAL118
RECOVERY
Household waste
(t)
Commercial waste
119
(t)
Industrial waste
(t)
C & D waste
(t)
Municipal sweepings
& parks (t)
C & D waste
(t)
Organic waste
120
(t)
Other wastes
121
(t)
24 Bord Na Mona Clonbullogue Ash Repository
W0049-02 32,157 34,663 0 0 34,663 0 0 0 0 0
25 Bord Na Mona plc
Drehid Waste Management Facility
W0201-03 418,243 415,583 142,157 184,331 1,146 320 859 72,687 7,968 17,315
26 Bord Na Mona Srahmore W0199-02 0 16,185 0 0 0 0 0 16,185 0 0
27 Greenstar Holdings Ltd.
Knockharley Landfill
W0146-02 198,365 126,128 50,928 35,530 508 9 2,603 34,932 0 1,618
28 Greenstar Holdings Ltd.
East Galway Residual Landfill
W0178-02 108,544 110,019 50,796 44,818 4,134 0 2,631 1,585 0 6,055
29 Greenstar Holdings Ltd.
Ballynagran Residual Landfill
W0165-02 169,475 212,192 69,473 77,463 5,465 0 110 54,409 0 5,273
30 KTK Landfill Ltd.
KTK Landfill Limited
W0081-04 57,654 258,751 0 81,466 27,945 0 1,389 134,750 0 13,202
31 Murphy Environmental Hollywood Ltd
Murphy Environmental Hollywood Ltd
W0129-02 30,626 27,378 0 0 2,180 21,395 0 3,804 0 0
32 Murphy Environmental Hollywood Ltd
Murphy Concrete Manufacturing Ltd
W0151-01 151,477 60,427 0 0 0 0 0 60,427 0 0
Total 2,068,647 750,066 568,770 93,502 29,101 25,172 552,699 8,070 52,468
Total Disposal122
123
1,466,610 Total Recovery 613,237
Landfills that accepted waste for disposal in 2010 but not in 2011:
Corranure Landfill (W0077-04), Derryconnell Landfill (W0089-02), Dunmore Landfill (W0030-02), Ballaghaderreen Landfill (W0059-03) Arthurstown Landfill (W0004-04) Ballydonagh Landfill (W0028-03) Kerdiffstown Landfill (W0047-02)
122
Total municipal waste disposed = 1,344,008 t (household + commercial + municipal sweepings and parks). 123
In addition, operators reported exporting 211 t of municipal waste abroad for disposal in 2011 (e.g. paints sent for D10 incineration without energy recovery).
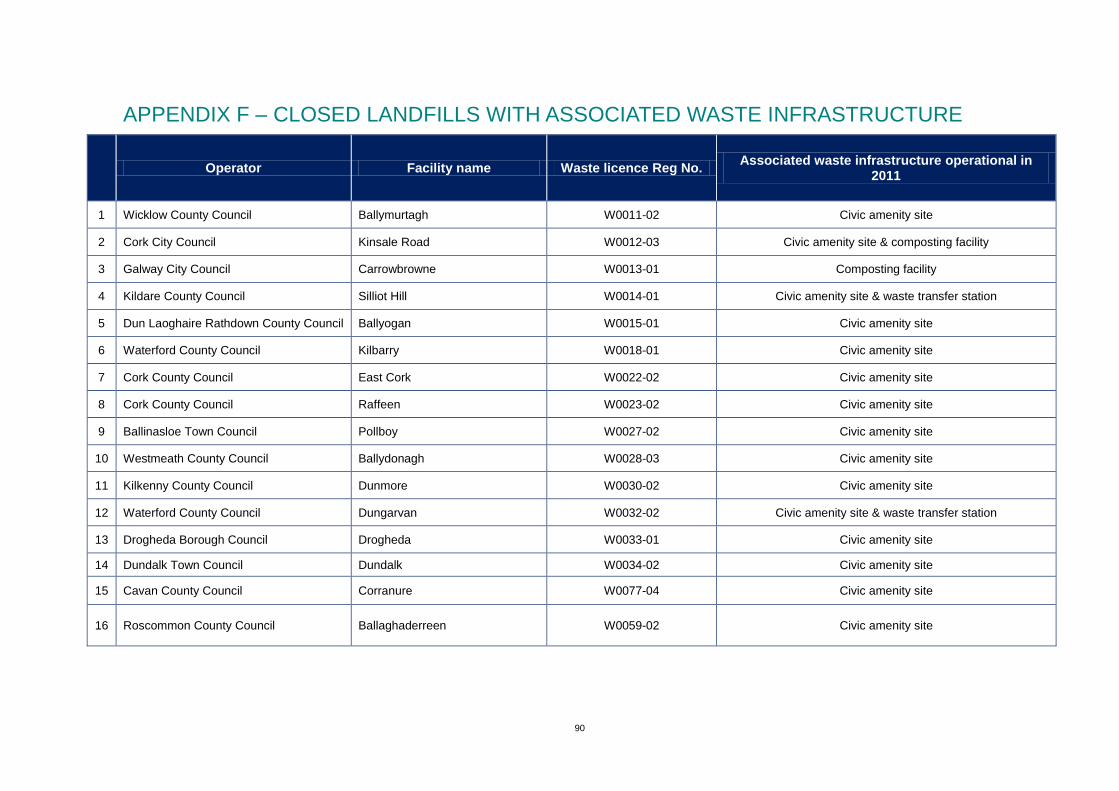
90
APPENDIX F – CLOSED LANDFILLS WITH ASSOCIATED WASTE INFRASTRUCTURE
Operator Facility name Waste licence Reg No.
Associated waste infrastructure operational in 2011
1 Wicklow County Council Ballymurtagh W0011-02 Civic amenity site
2 Cork City Council Kinsale Road W0012-03 Civic amenity site & composting facility
3 Galway City Council Carrowbrowne W0013-01 Composting facility
4 Kildare County Council Silliot Hill W0014-01 Civic amenity site & waste transfer station
5 Dun Laoghaire Rathdown County Council Ballyogan W0015-01 Civic amenity site
6 Waterford County Council Kilbarry W0018-01 Civic amenity site
7 Cork County Council East Cork W0022-02 Civic amenity site
8 Cork County Council Raffeen W0023-02 Civic amenity site
9 Ballinasloe Town Council Pollboy W0027-02 Civic amenity site
10 Westmeath County Council Ballydonagh W0028-03 Civic amenity site
11 Kilkenny County Council Dunmore W0030-02 Civic amenity site
12 Waterford County Council Dungarvan W0032-02 Civic amenity site & waste transfer station
13 Drogheda Borough Council Drogheda W0033-01 Civic amenity site
14 Dundalk Town Council Dundalk W0034-02 Civic amenity site
15 Cavan County Council Corranure W0077-04 Civic amenity site
16 Roscommon County Council Ballaghaderreen W0059-02 Civic amenity site
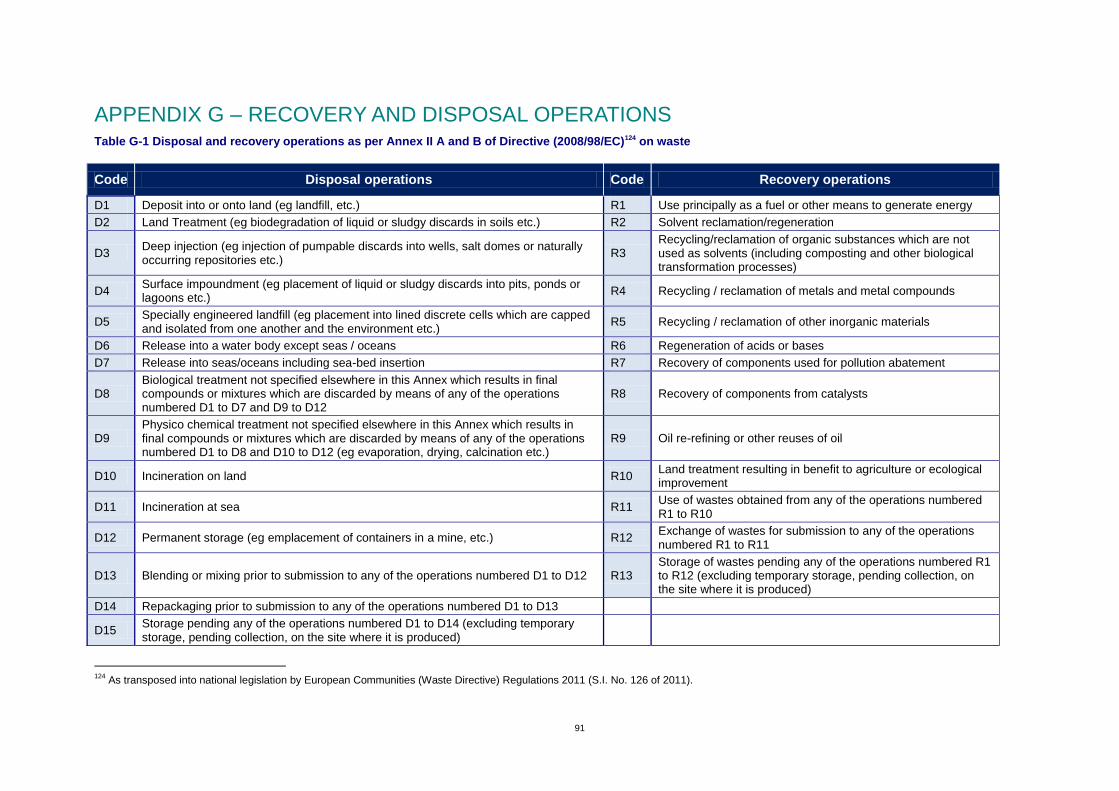
91
APPENDIX G – RECOVERY AND DISPOSAL OPERATIONS Table G-1 Disposal and recovery operations as per Annex II A and B of Directive (2008/98/EC)124 on waste
124
As transposed into national legislation by European Communities (Waste Directive) Regulations 2011 (S.I. No. 126 of 2011).
Code Disposal operations Code Recovery operations
D1 Deposit into or onto land (eg landfill, etc.) R1 Use principally as a fuel or other means to generate energy
D2 Land Treatment (eg biodegradation of liquid or sludgy discards in soils etc.) R2 Solvent reclamation/regeneration
D3 Deep injection (eg injection of pumpable discards into wells, salt domes or naturally occurring repositories etc.)
R3 Recycling/reclamation of organic substances which are not used as solvents (including composting and other biological transformation processes)
D4 Surface impoundment (eg placement of liquid or sludgy discards into pits, ponds or lagoons etc.)
R4 Recycling / reclamation of metals and metal compounds
D5 Specially engineered landfill (eg placement into lined discrete cells which are capped and isolated from one another and the environment etc.)
R5 Recycling / reclamation of other inorganic materials
D6 Release into a water body except seas / oceans R6 Regeneration of acids or bases
D7 Release into seas/oceans including sea-bed insertion R7 Recovery of components used for pollution abatement
D8 Biological treatment not specified elsewhere in this Annex which results in final compounds or mixtures which are discarded by means of any of the operations numbered D1 to D7 and D9 to D12
R8 Recovery of components from catalysts
D9 Physico chemical treatment not specified elsewhere in this Annex which results in final compounds or mixtures which are discarded by means of any of the operations numbered D1 to D8 and D10 to D12 (eg evaporation, drying, calcination etc.)
R9 Oil re-refining or other reuses of oil
D10 Incineration on land R10 Land treatment resulting in benefit to agriculture or ecological improvement
D11 Incineration at sea R11 Use of wastes obtained from any of the operations numbered R1 to R10
D12 Permanent storage (eg emplacement of containers in a mine, etc.) R12 Exchange of wastes for submission to any of the operations numbered R1 to R11
D13 Blending or mixing prior to submission to any of the operations numbered D1 to D12 R13 Storage of wastes pending any of the operations numbered R1 to R12 (excluding temporary storage, pending collection, on the site where it is produced)
D14 Repackaging prior to submission to any of the operations numbered D1 to D13
D15 Storage pending any of the operations numbered D1 to D14 (excluding temporary storage, pending collection, on the site where it is produced)
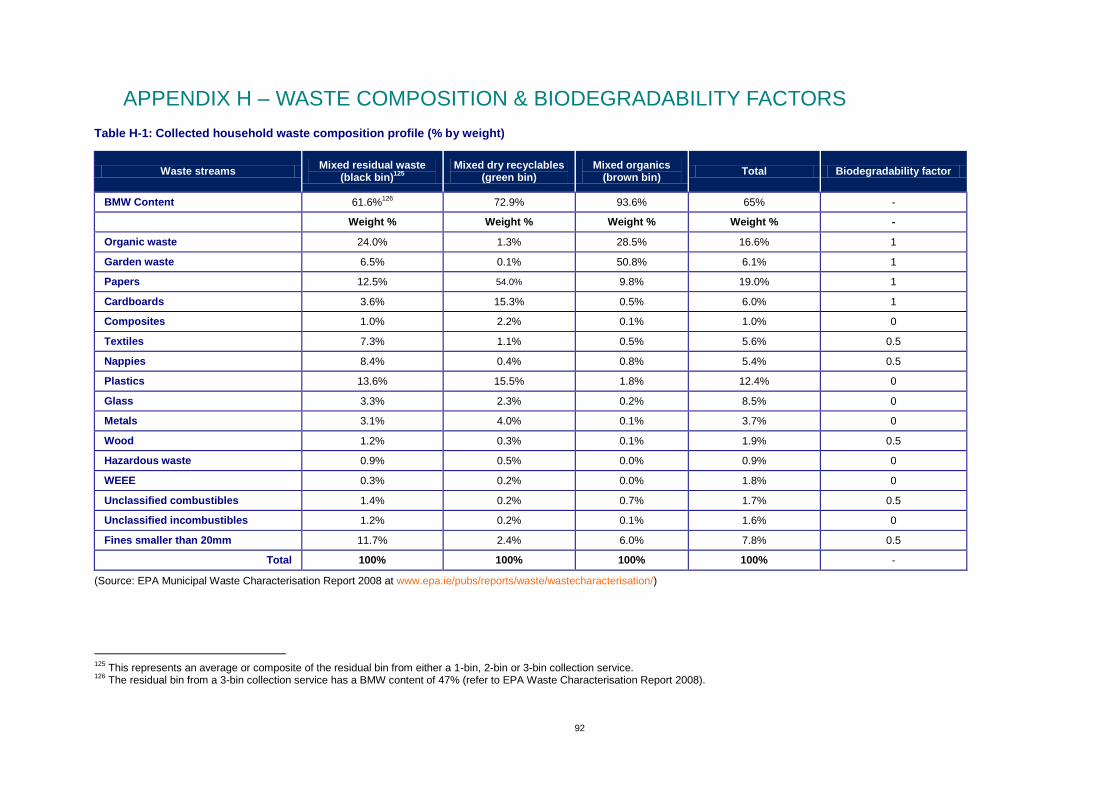
92
APPENDIX H – WASTE COMPOSITION & BIODEGRADABILITY FACTORS
Table H-1: Collected household waste composition profile (% by weight)
Waste streams Mixed residual waste
(black bin)125
Mixed dry recyclables
(green bin) Mixed organics
(brown bin) Total Biodegradability factor
BMW Content 61.6%126
72.9% 93.6% 65% -
Weight % Weight % Weight % Weight % -
Organic waste 24.0% 1.3% 28.5% 16.6% 1
Garden waste 6.5% 0.1% 50.8% 6.1% 1
Papers 12.5% 54.0% 9.8% 19.0% 1
Cardboards 3.6% 15.3% 0.5% 6.0% 1
Composites 1.0% 2.2% 0.1% 1.0% 0
Textiles 7.3% 1.1% 0.5% 5.6% 0.5
Nappies 8.4% 0.4% 0.8% 5.4% 0.5
Plastics 13.6% 15.5% 1.8% 12.4% 0
Glass 3.3% 2.3% 0.2% 8.5% 0
Metals 3.1% 4.0% 0.1% 3.7% 0
Wood 1.2% 0.3% 0.1% 1.9% 0.5
Hazardous waste 0.9% 0.5% 0.0% 0.9% 0
WEEE 0.3% 0.2% 0.0% 1.8% 0
Unclassified combustibles 1.4% 0.2% 0.7% 1.7% 0.5
Unclassified incombustibles 1.2% 0.2% 0.1% 1.6% 0
Fines smaller than 20mm 11.7% 2.4% 6.0% 7.8% 0.5
Total 100% 100% 100% 100% -
(Source: EPA Municipal Waste Characterisation Report 2008 at www.epa.ie/pubs/reports/waste/wastecharacterisation/)
125
This represents an average or composite of the residual bin from either a 1-bin, 2-bin or 3-bin collection service. 126
The residual bin from a 3-bin collection service has a BMW content of 47% (refer to EPA Waste Characterisation Report 2008).

93
Table H-2 Composition and biodegradability factors for commercial wastes
Waste streams Mixed residual
waste (black bin)
Mixed dry recyclables (green bin)
Total Biodegradability
factor
BMW content 75.00% 85.10% (est) 77.00% -
Weight % Weight % Weight % -
Organic waste 42.20% 11.80% 27.40% 1
Garden waste 0.20% 0.00% 0.10% 1
Papers 25.50% 24.20% 24.80% 1
Cardboards 4.00% 48.60% 25.80% 1
Composites 3.40% 0.70% 2.10% 0
Textiles 4.90% 0.60% 2.80% 0.5
Nappies 0.00% 0.00% 0.00% 0.5
Plastics 10.80% 5.30% 8.10% 0
Glass 1.70% 6.80% 4.20% 0
Metals 2.10% 0.90% 1.50% 0
Wood 0.40% 0.00% 0.20% 0.5
Hazardous waste 3.00% 0.90% 1.90% 0
WEEE 0.20% 0.00% 0.10% 0
Unclassified combustibles
0.40% 0.10% 0.30% 0.5
Unclassified incombustibles
0.20% 0.00% 0.10% 0
Fines smaller than 20mm
1.00% 0.10% 0.60% 0.5
Total 100% 100% 100% -
(Source: EPA Municipal Waste Characterisation Reports, www.epa.ie/whatwedo/resource/municipal/)
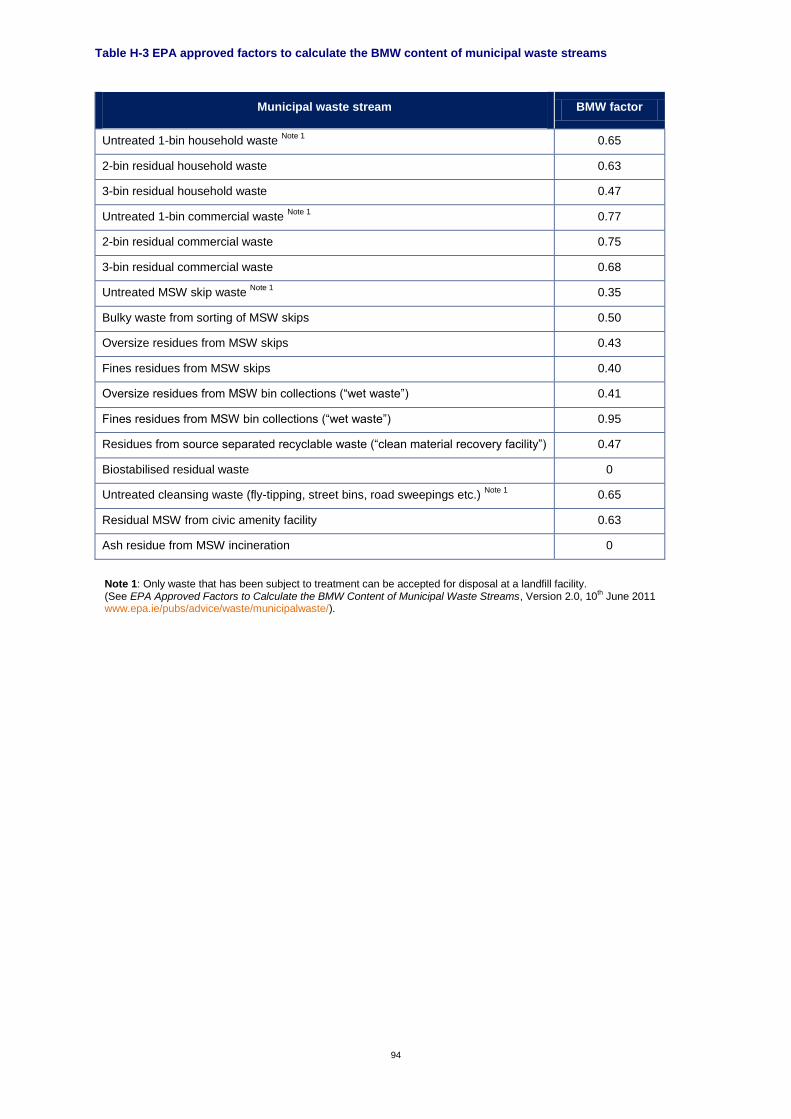
94
Table H-3 EPA approved factors to calculate the BMW content of municipal waste streams
Municipal waste stream BMW factor
Untreated 1-bin household waste Note 1
0.65
2-bin residual household waste 0.63
3-bin residual household waste 0.47
Untreated 1-bin commercial waste Note 1
0.77
2-bin residual commercial waste 0.75
3-bin residual commercial waste 0.68
Untreated MSW skip waste Note 1
0.35
Bulky waste from sorting of MSW skips 0.50
Oversize residues from MSW skips 0.43
Fines residues from MSW skips 0.40
Oversize residues from MSW bin collections (“wet waste”) 0.41
Fines residues from MSW bin collections (“wet waste”) 0.95
Residues from source separated recyclable waste (“clean material recovery facility”) 0.47
Biostabilised residual waste 0
Untreated cleansing waste (fly-tipping, street bins, road sweepings etc.) Note 1
0.65
Residual MSW from civic amenity facility 0.63
Ash residue from MSW incineration 0
Note 1: Only waste that has been subject to treatment can be accepted for disposal at a landfill facility. (See EPA Approved Factors to Calculate the BMW Content of Municipal Waste Streams, Version 2.0, 10
th June 2011
www.epa.ie/pubs/advice/waste/municipalwaste/).
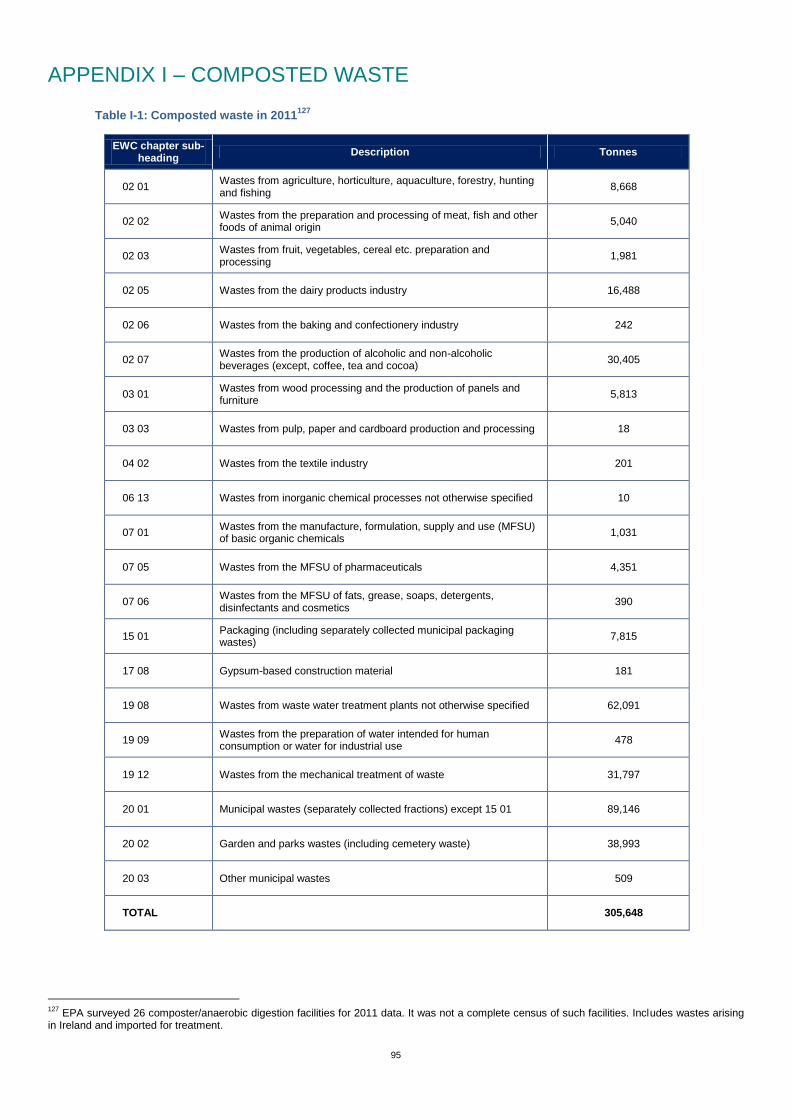
95
APPENDIX I – COMPOSTED WASTE
Table I-1: Composted waste in 2011127
EWC chapter sub-heading
Description Tonnes
02 01 Wastes from agriculture, horticulture, aquaculture, forestry, hunting and fishing
8,668
02 02 Wastes from the preparation and processing of meat, fish and other foods of animal origin
5,040
02 03 Wastes from fruit, vegetables, cereal etc. preparation and processing
1,981
02 05 Wastes from the dairy products industry 16,488
02 06 Wastes from the baking and confectionery industry 242
02 07 Wastes from the production of alcoholic and non-alcoholic beverages (except, coffee, tea and cocoa)
30,405
03 01 Wastes from wood processing and the production of panels and furniture
5,813
03 03 Wastes from pulp, paper and cardboard production and processing 18
04 02 Wastes from the textile industry 201
06 13 Wastes from inorganic chemical processes not otherwise specified 10
07 01 Wastes from the manufacture, formulation, supply and use (MFSU) of basic organic chemicals
1,031
07 05 Wastes from the MFSU of pharmaceuticals 4,351
07 06 Wastes from the MFSU of fats, grease, soaps, detergents, disinfectants and cosmetics
390
15 01 Packaging (including separately collected municipal packaging wastes)
7,815
17 08 Gypsum-based construction material 181
19 08 Wastes from waste water treatment plants not otherwise specified 62,091
19 09 Wastes from the preparation of water intended for human consumption or water for industrial use
478
19 12 Wastes from the mechanical treatment of waste 31,797
20 01 Municipal wastes (separately collected fractions) except 15 01 89,146
20 02 Garden and parks wastes (including cemetery waste) 38,993
20 03 Other municipal wastes 509
TOTAL
305,648
127
EPA surveyed 26 composter/anaerobic digestion facilities for 2011 data. It was not a complete census of such facilities. Includes wastes arising in Ireland and imported for treatment.
An Ghníomhaireacht um Chaomhnú Comhshaoil
Is í an Gníomhaireacht um ChaomhnúComhshaoil (EPA) comhlachta reachtúil achosnaíonn an comhshaol do mhuintir na tírego léir. Rialaímid agus déanaimid maoirsiú arghníomhaíochtaí a d'fhéadfadh truailliú achruthú murach sin. Cinntímid go bhfuil eolascruinn ann ar threochtaí comhshaoil ionas gonglactar aon chéim is gá. Is iad na príomh-nithe a bhfuilimid gníomhach leo nácomhshaol na hÉireann a chosaint aguscinntiú go bhfuil forbairt inbhuanaithe.
Is comhlacht poiblí neamhspleách í anGhníomhaireacht um Chaomhnú Comhshaoil(EPA) a bunaíodh i mí Iúil 1993 faoin Acht fánnGníomhaireacht um Chaomhnú Comhshaoil1992. Ó thaobh an Rialtais, is í an RoinnComhshaoil, Pobal agus Rialtais Áitiúil.
ÁR bhFREAGRACHTAÍ CEADÚNÚ
Bíonn ceadúnais á n-eisiúint againn i gcomhair na nitheseo a leanas chun a chinntiú nach mbíonn astuithe uathuag cur sláinte an phobail ná an comhshaol i mbaol:
n áiseanna dramhaíola (m.sh., líonadh talún,loisceoirí, stáisiúin aistrithe dramhaíola);
n gníomhaíochtaí tionsclaíocha ar scála mór (m.sh.,déantúsaíocht cógaisíochta, déantúsaíochtstroighne, stáisiúin chumhachta);
n diantalmhaíocht;
n úsáid faoi shrian agus scaoileadh smachtaitheOrgánach Géinathraithe (GMO);
n mór-áiseanna stórais peitreail;
n scardadh dramhuisce;
n dumpáil mara.
FEIDHMIÚ COMHSHAOIL NÁISIÚNTA
n Stiúradh os cionn 2,000 iniúchadh agus cigireachtde áiseanna a fuair ceadúnas ón nGníomhaireachtgach bliain
n Maoirsiú freagrachtaí cosanta comhshaoil údarásáitiúla thar sé earnáil - aer, fuaim, dramhaíl,dramhuisce agus caighdeán uisce
n Obair le húdaráis áitiúla agus leis na Gardaí chunstop a chur le gníomhaíocht mhídhleathachdramhaíola trí comhordú a dhéanamh ar líonraforfheidhmithe náisiúnta, díriú isteach ar chiontóirí,stiúradh fiosrúcháin agus maoirsiú leigheas nabhfadhbanna.
n An dlí a chur orthu siúd a bhriseann dlí comhshaoilagus a dhéanann dochar don chomhshaol marthoradh ar a ngníomhaíochtaí.
MONATÓIREACHT, ANAILÍS AGUS TUAIRISCIÚ ARAN GCOMHSHAOL n Monatóireacht ar chaighdeán aeir agus caighdeáin
aibhneacha, locha, uiscí taoide agus uiscí talaimh;leibhéil agus sruth aibhneacha a thomhas.
n Tuairisciú neamhspleách chun cabhrú le rialtaisnáisiúnta agus áitiúla cinntí a dhéanamh.
RIALÚ ASTUITHE GÁIS CEAPTHA TEASA NA HÉIREANN n Cainníochtú astuithe gáis ceaptha teasa na
hÉireann i gcomhthéacs ár dtiomantas Kyoto.
n Cur i bhfeidhm na Treorach um Thrádáil Astuithe, abhfuil baint aige le hos cionn 100 cuideachta atáina mór-ghineadóirí dé-ocsaíd charbóin in Éirinn.
TAIGHDE AGUS FORBAIRT COMHSHAOIL n Taighde ar shaincheisteanna comhshaoil a
chomhordú (cosúil le caighdéan aeir agus uisce,athrú aeráide, bithéagsúlacht, teicneolaíochtaícomhshaoil).
MEASÚNÚ STRAITÉISEACH COMHSHAOIL
n Ag déanamh measúnú ar thionchar phleananna aguschláracha ar chomhshaol na hÉireann (cosúil lepleananna bainistíochta dramhaíola agus forbartha).
PLEANÁIL, OIDEACHAS AGUS TREOIR CHOMHSHAOIL n Treoir a thabhairt don phobal agus do thionscal ar
cheisteanna comhshaoil éagsúla (m.sh., iarratais archeadúnais, seachaint dramhaíola agus rialacháinchomhshaoil).
n Eolas níos fearr ar an gcomhshaol a scaipeadh (trícláracha teilifíse comhshaoil agus pacáistíacmhainne do bhunscoileanna agus domheánscoileanna).
BAINISTÍOCHT DRAMHAÍOLA FHORGHNÍOMHACH
n Cur chun cinn seachaint agus laghdú dramhaíola tríchomhordú An Chláir Náisiúnta um ChoscDramhaíola, lena n-áirítear cur i bhfeidhm nadTionscnamh Freagrachta Táirgeoirí.
n Cur i bhfeidhm Rialachán ar nós na treoracha maidirle Trealamh Leictreach agus Leictreonach Caite agusle Srianadh Substaintí Guaiseacha agus substaintí adhéanann ídiú ar an gcrios ózóin.
n Plean Náisiúnta Bainistíochta um DramhaílGhuaiseach a fhorbairt chun dramhaíl ghuaiseach asheachaint agus a bhainistiú.
STRUCHTÚR NA GNÍOMHAIREACHTA
Bunaíodh an Ghníomhaireacht i 1993 chun comhshaolna hÉireann a chosaint. Tá an eagraíocht á bhainistiúag Bord lánaimseartha, ar a bhfuil Príomhstiúrthóiragus ceithre Stiúrthóir.
Tá obair na Gníomhaireachta ar siúl trí ceithre Oifig:
n An Oifig Aeráide, Ceadúnaithe agus ÚsáideAcmhainní
n An Oifig um Fhorfheidhmiúchán Comhshaoil
n An Oifig um Measúnacht Comhshaoil
n An Oifig Cumarsáide agus Seirbhísí Corparáide
Tá Coiste Comhairleach ag an nGníomhaireacht lecabhrú léi. Tá dáréag ball air agus tagann siad le chéilecúpla uair in aghaidh na bliana le plé a dhéanamh archeisteanna ar ábhar imní iad agus le comhairle athabhairt don Bhord.
EPA Inside Pages NEW_Blue Text 07/06/2013 10:12 Page 2
Headquarters, PO Box 3000Johnstown Castle EstateCounty Wexford, Ireland
Ceanncheathrú, Bosca Poist 3000Eastát Chaisleán Bhaile SheáinContae Loch Garman, Éire
T:+353 53 916 0600F:+353 53 916 0699
Regional InspectorateMcCumiskey House, RichviewClonskeagh Road, Dublin 14, Ireland
Cigireacht Réigiúnach, Teach Mhic ChumascaighDea-Radharc, Bóthar Cluain SceachBaile Átha Cliath 14, Éire
T:+353 1 268 0100F:+353 1 268 0199
Regional InspectorateInniscarra, County Cork, Ireland
Cigireacht Réigiúnach, Inis CaraContae Chorcaí, Éire
T:+353 21 487 5540F:+353 21 487 5545
Regional InspectorateJohn Moore Road, CastlebarCounty Mayo, Ireland
Cigireacht Réigiúnach, Bóthar Sheán de MórdhaCaisleán an Bharraigh, Contae Mhaigh Eo, Éire
T:+353 94 904 8400F:+353 94 902 1934
Regional InspectorateSeville Lodge, Callan Road,Kilkenny, Ireland
Cigireacht Réigiúnach, Lóiste Sevilla,Bóthar Challainn, Cill Chainnigh, Éire
T:+353 56 779 6700F:+353 56 779 6798
Regional InspectorateThe Glen, Monaghan, Ireland
Cigireacht Réigiúnach, An GleannMuineachán, Éire
T:+353 47 77600F:+353 47 84987
E: [email protected] W: www.epa.ieLo Call: 1890 33 55 99
Printed on an environmentally friendly paper stock