Embed Size (px)
Citation preview
Nationalpark Hunsrück-Hochwald, 2014-05-05 An EnMAP Preparatory Flight Campaign
EnMAP Flight Campaigns Technical Report
Henning Buddenbaum, Sandra Dotzler, Joachim Hill
Recommended citation of the report:
Buddenbaum, H., Dotzler, S.; Hill, J. (2015) Nationalpark Hunsrück-Hochwald, 2014-05-05 - An EnMAP Preparatory Flight Campaign, EnMAP Flight Campaigns Technical Report, GFZ Data Services. DOI: http://doi.org/10.2312/enmap.2015.005 Supplementary datasets:
Buddenbaum, H., Dotzler, S.; Hill, J. (2015) Nationalpark Hunsrück-Hochwald, 2014-05-05 - An EnMAP Preparatory Flight Campaign (Datasets), GFZ Data Services. DOI: http://doi.org/10.5880/enmap.2015.005
Imprint
EnMAP Consortium
GFZ Data Services
Telegrafenberg D-14473 Potsdam
Published in Potsdam, Germany October 2015
http://doi.org/10.2312/enmap.2015.005
Nationalpark Hunsrück-Hochwald, 2014-05-05 An EnMAP Preparatory Flight Campaign
EnMAP Flight Campaigns Technical Report
Henning Buddenbaum, Sandra Dotzler, Joachim Hill
University of Trier, Environmental Remote Sensing and Geoinformatics, Trier, Germany

EnMAP Technical Report Nationalpark Hunsrück-Hochwald, 2014-05-05 – doi:10.2312/enmap.2015.005 4
Table of Contents
Abstract ................................................................................................................................................... 5
1 Introduction ..................................................................................................................................... 6
2 Data Acquisition .............................................................................................................................. 7
Campaign 2014-05-05: ........................................................................................................................ 8
3 Data Processing and Products ......................................................................................................... 9
Hyperspectral airborne data ............................................................................................................... 9
4 File Description .............................................................................................................................. 13
4.1 File Format ............................................................................................................................. 13
4.2 Data content and structure ................................................................................................... 13
5 Data quality/Accuracy ................................................................................................................... 13
6 Additional data .............................................................................................................................. 13
7 Dataset Contact ............................................................................................................................. 14
8 Acknowledgements ....................................................................................................................... 14
9 References ..................................................................................................................................... 15
EnMAP Technical Report Nationalpark Hunsrück-Hochwald, 2014-05-05 – doi:10.2312/enmap.2015.005 5
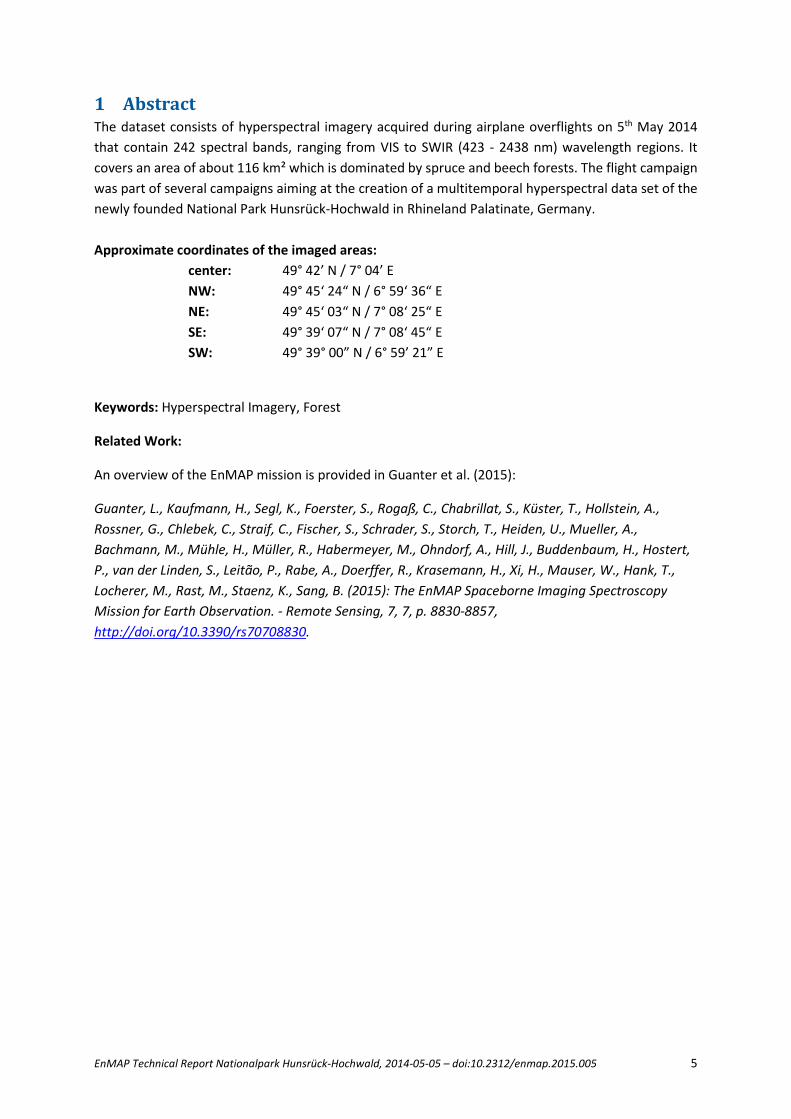
1 Abstract The dataset consists of hyperspectral imagery acquired during airplane overflights on 5th May 2014 that contain 242 spectral bands, ranging from VIS to SWIR (423 - 2438 nm) wavelength regions. It covers an area of about 116 km² which is dominated by spruce and beech forests. The flight campaign was part of several campaigns aiming at the creation of a multitemporal hyperspectral data set of the newly founded National Park Hunsrück-Hochwald in Rhineland Palatinate, Germany. Approximate coordinates of the imaged areas:
center: 49° 42’ N / 7° 04’ E NW: 49° 45‘ 24“ N / 6° 59‘ 36“ E
NE: 49° 45‘ 03“ N / 7° 08‘ 25“ E SE: 49° 39‘ 07“ N / 7° 08‘ 45“ E SW: 49° 39° 00” N / 6° 59’ 21” E
Keywords: Hyperspectral Imagery, Forest
Related Work:
An overview of the EnMAP mission is provided in Guanter et al. (2015):
Guanter, L., Kaufmann, H., Segl, K., Foerster, S., Rogaß, C., Chabrillat, S., Küster, T., Hollstein, A., Rossner, G., Chlebek, C., Straif, C., Fischer, S., Schrader, S., Storch, T., Heiden, U., Mueller, A., Bachmann, M., Mühle, H., Müller, R., Habermeyer, M., Ohndorf, A., Hill, J., Buddenbaum, H., Hostert, P., van der Linden, S., Leitão, P., Rabe, A., Doerffer, R., Krasemann, H., Xi, H., Mauser, W., Hank, T., Locherer, M., Rast, M., Staenz, K., Sang, B. (2015): The EnMAP Spaceborne Imaging Spectroscopy Mission for Earth Observation. - Remote Sensing, 7, 7, p. 8830-8857, http://doi.org/10.3390/rs70708830.
EnMAP Technical Report Nationalpark Hunsrück-Hochwald, 2014-05-05 – doi:10.2312/enmap.2015.005 6
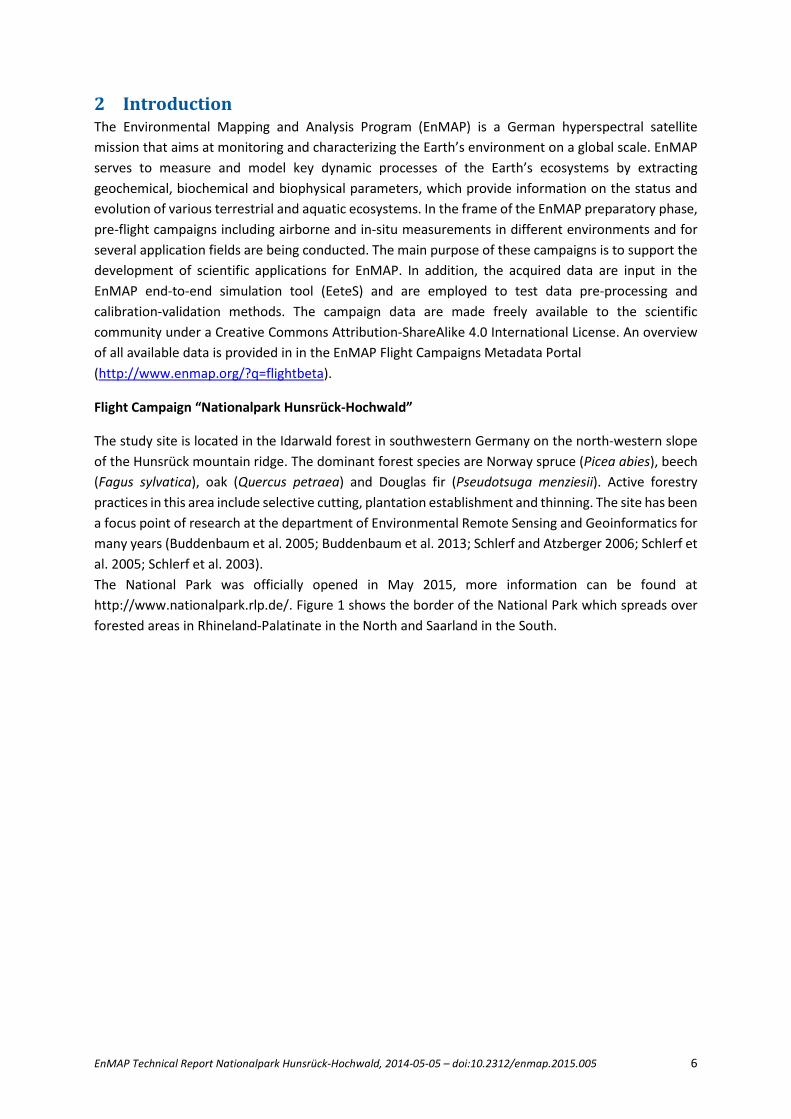
2 Introduction The Environmental Mapping and Analysis Program (EnMAP) is a German hyperspectral satellite mission that aims at monitoring and characterizing the Earth’s environment on a global scale. EnMAP serves to measure and model key dynamic processes of the Earth’s ecosystems by extracting geochemical, biochemical and biophysical parameters, which provide information on the status and evolution of various terrestrial and aquatic ecosystems. In the frame of the EnMAP preparatory phase, pre-flight campaigns including airborne and in-situ measurements in different environments and for several application fields are being conducted. The main purpose of these campaigns is to support the development of scientific applications for EnMAP. In addition, the acquired data are input in the EnMAP end-to-end simulation tool (EeteS) and are employed to test data pre-processing and calibration-validation methods. The campaign data are made freely available to the scientific community under a Creative Commons Attribution-ShareAlike 4.0 International License. An overview of all available data is provided in in the EnMAP Flight Campaigns Metadata Portal (http://www.enmap.org/?q=flightbeta).
Flight Campaign “Nationalpark Hunsrück-Hochwald”
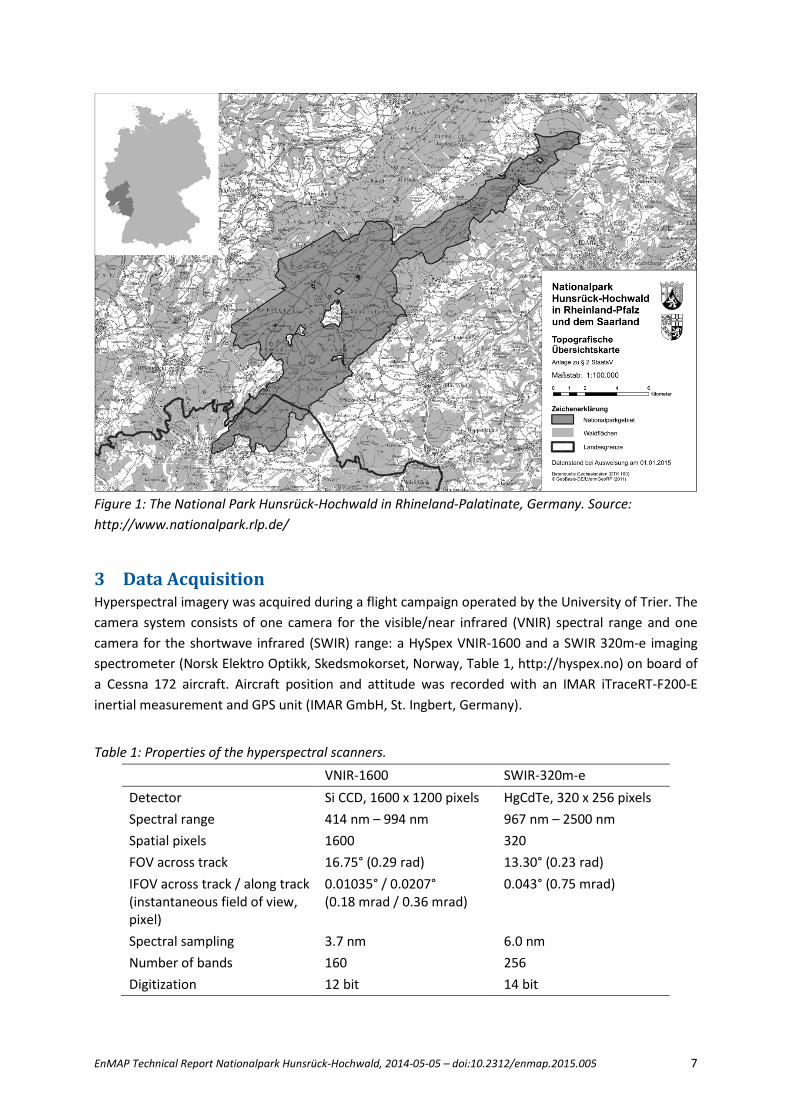
The study site is located in the Idarwald forest in southwestern Germany on the north-western slope of the Hunsrück mountain ridge. The dominant forest species are Norway spruce (Picea abies), beech (Fagus sylvatica), oak (Quercus petraea) and Douglas fir (Pseudotsuga menziesii). Active forestry practices in this area include selective cutting, plantation establishment and thinning. The site has been a focus point of research at the department of Environmental Remote Sensing and Geoinformatics for many years (Buddenbaum et al. 2005; Buddenbaum et al. 2013; Schlerf and Atzberger 2006; Schlerf et al. 2005; Schlerf et al. 2003). The National Park was officially opened in May 2015, more information can be found at http://www.nationalpark.rlp.de/. Figure 1 shows the border of the National Park which spreads over forested areas in Rhineland-Palatinate in the North and Saarland in the South.
EnMAP Technical Report Nationalpark Hunsrück-Hochwald, 2014-05-05 – doi:10.2312/enmap.2015.005 7
Figure 1: The National Park Hunsrück-Hochwald in Rhineland-Palatinate, Germany. Source: http://www.nationalpark.rlp.de/
3 Data Acquisition Hyperspectral imagery was acquired during a flight campaign operated by the University of Trier. The camera system consists of one camera for the visible/near infrared (VNIR) spectral range and one camera for the shortwave infrared (SWIR) range: a HySpex VNIR-1600 and a SWIR 320m-e imaging spectrometer (Norsk Elektro Optikk, Skedsmokorset, Norway, Table 1, http://hyspex.no) on board of a Cessna 172 aircraft. Aircraft position and attitude was recorded with an IMAR iTraceRT-F200-E inertial measurement and GPS unit (IMAR GmbH, St. Ingbert, Germany).
Table 1: Properties of the hyperspectral scanners.
VNIR-1600 SWIR-320m-e Detector Si CCD, 1600 x 1200 pixels HgCdTe, 320 x 256 pixels Spectral range 414 nm – 994 nm 967 nm – 2500 nm Spatial pixels 1600 320 FOV across track 16.75° (0.29 rad) 13.30° (0.23 rad) IFOV across track / along track (instantaneous field of view, pixel)
0.01035° / 0.0207° (0.18 mrad / 0.36 mrad)
0.043° (0.75 mrad)
Spectral sampling 3.7 nm 6.0 nm Number of bands 160 256 Digitization 12 bit 14 bit
EnMAP Technical Report Nationalpark Hunsrück-Hochwald, 2014-05-05 – doi:10.2312/enmap.2015.005 8
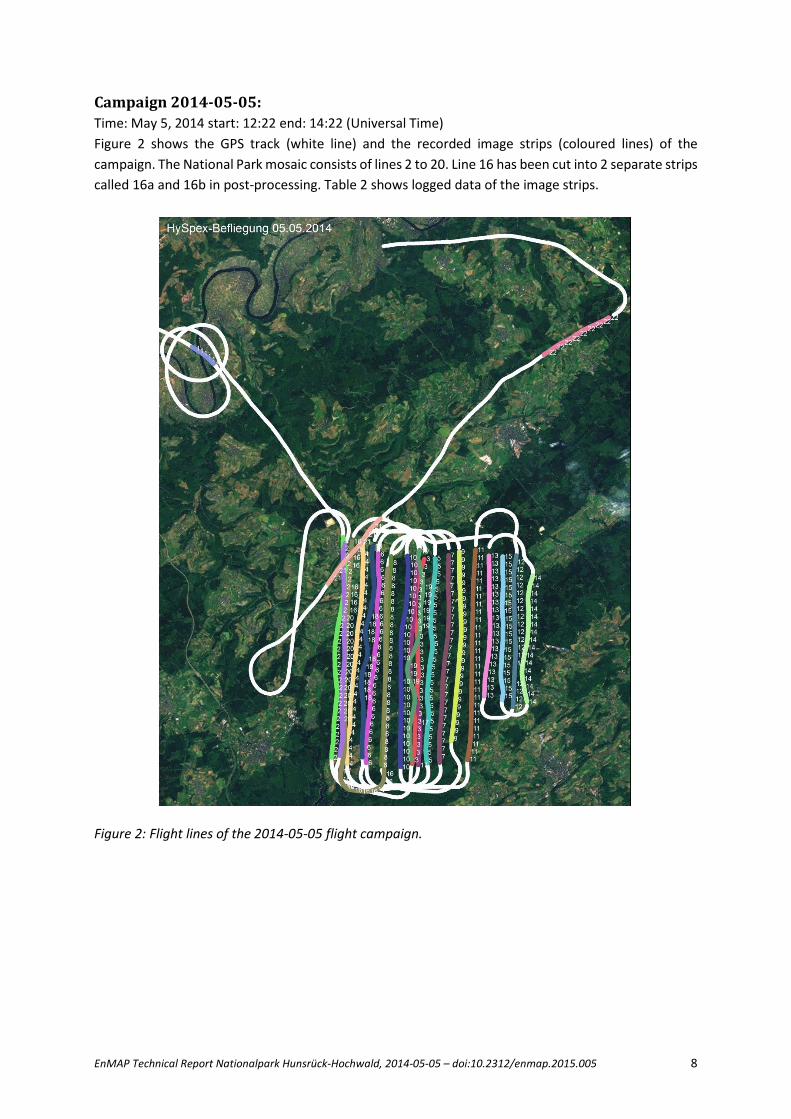
Campaign 2014-05-05: Time: May 5, 2014 start: 12:22 end: 14:22 (Universal Time) Figure 2 shows the GPS track (white line) and the recorded image strips (coloured lines) of the campaign. The National Park mosaic consists of lines 2 to 20. Line 16 has been cut into 2 separate strips called 16a and 16b in post-processing. Table 2 shows logged data of the image strips.
Figure 2: Flight lines of the 2014-05-05 flight campaign.
EnMAP Technical Report Nationalpark Hunsrück-Hochwald, 2014-05-05 – doi:10.2312/enmap.2015.005 9
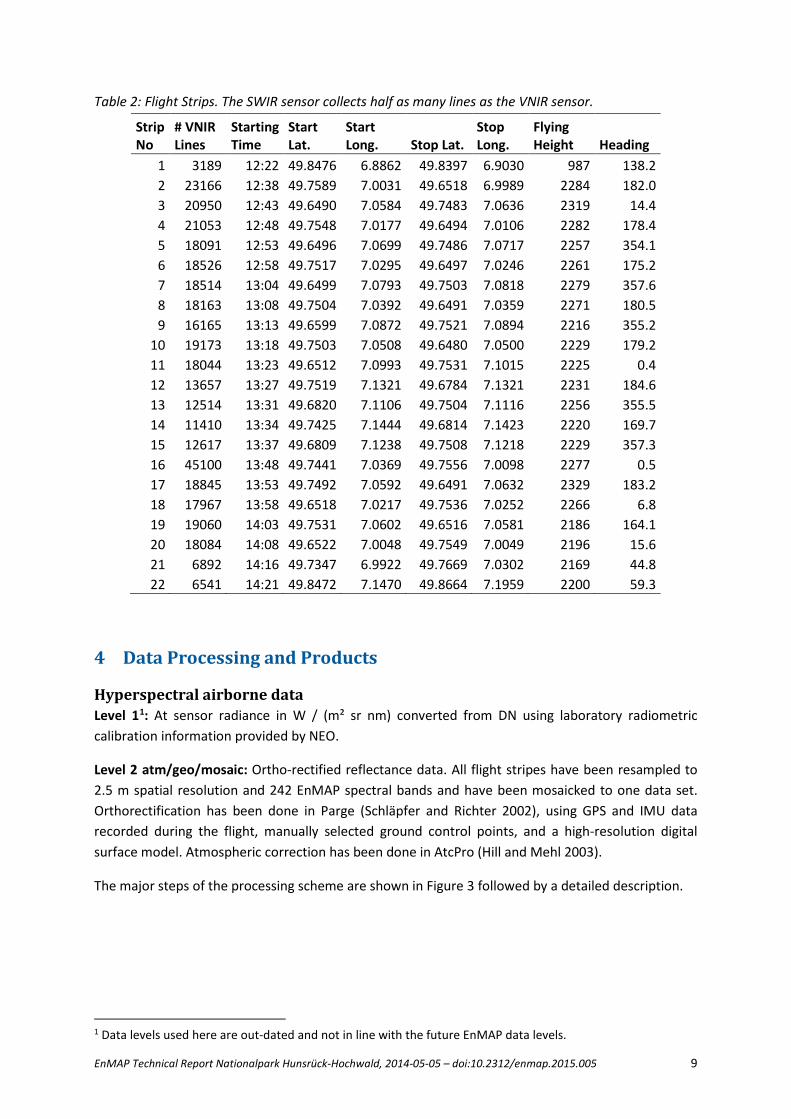
Table 2: Flight Strips. The SWIR sensor collects half as many lines as the VNIR sensor.
Strip No
# VNIR Lines
Starting Time
Start Lat.
Start Long. Stop Lat.
Stop Long.
Flying Height Heading
1 3189 12:22 49.8476 6.8862 49.8397 6.9030 987 138.2 2 23166 12:38 49.7589 7.0031 49.6518 6.9989 2284 182.0 3 20950 12:43 49.6490 7.0584 49.7483 7.0636 2319 14.4 4 21053 12:48 49.7548 7.0177 49.6494 7.0106 2282 178.4 5 18091 12:53 49.6496 7.0699 49.7486 7.0717 2257 354.1 6 18526 12:58 49.7517 7.0295 49.6497 7.0246 2261 175.2 7 18514 13:04 49.6499 7.0793 49.7503 7.0818 2279 357.6 8 18163 13:08 49.7504 7.0392 49.6491 7.0359 2271 180.5 9 16165 13:13 49.6599 7.0872 49.7521 7.0894 2216 355.2
10 19173 13:18 49.7503 7.0508 49.6480 7.0500 2229 179.2 11 18044 13:23 49.6512 7.0993 49.7531 7.1015 2225 0.4 12 13657 13:27 49.7519 7.1321 49.6784 7.1321 2231 184.6 13 12514 13:31 49.6820 7.1106 49.7504 7.1116 2256 355.5 14 11410 13:34 49.7425 7.1444 49.6814 7.1423 2220 169.7 15 12617 13:37 49.6809 7.1238 49.7508 7.1218 2229 357.3 16 45100 13:48 49.7441 7.0369 49.7556 7.0098 2277 0.5 17 18845 13:53 49.7492 7.0592 49.6491 7.0632 2329 183.2 18 17967 13:58 49.6518 7.0217 49.7536 7.0252 2266 6.8 19 19060 14:03 49.7531 7.0602 49.6516 7.0581 2186 164.1 20 18084 14:08 49.6522 7.0048 49.7549 7.0049 2196 15.6 21 6892 14:16 49.7347 6.9922 49.7669 7.0302 2169 44.8 22 6541 14:21 49.8472 7.1470 49.8664 7.1959 2200 59.3
4 Data Processing and Products
Hyperspectral airborne data Level 11: At sensor radiance in W / (m² sr nm) converted from DN using laboratory radiometric calibration information provided by NEO.
Level 2 atm/geo/mosaic: Ortho-rectified reflectance data. All flight stripes have been resampled to 2.5 m spatial resolution and 242 EnMAP spectral bands and have been mosaicked to one data set. Orthorectification has been done in Parge (Schläpfer and Richter 2002), using GPS and IMU data recorded during the flight, manually selected ground control points, and a high-resolution digital surface model. Atmospheric correction has been done in AtcPro (Hill and Mehl 2003).
The major steps of the processing scheme are shown in Figure 3 followed by a detailed description.
1 Data levels used here are out-dated and not in line with the future EnMAP data levels.
EnMAP Technical Report Nationalpark Hunsrück-Hochwald, 2014-05-05 – doi:10.2312/enmap.2015.005 10
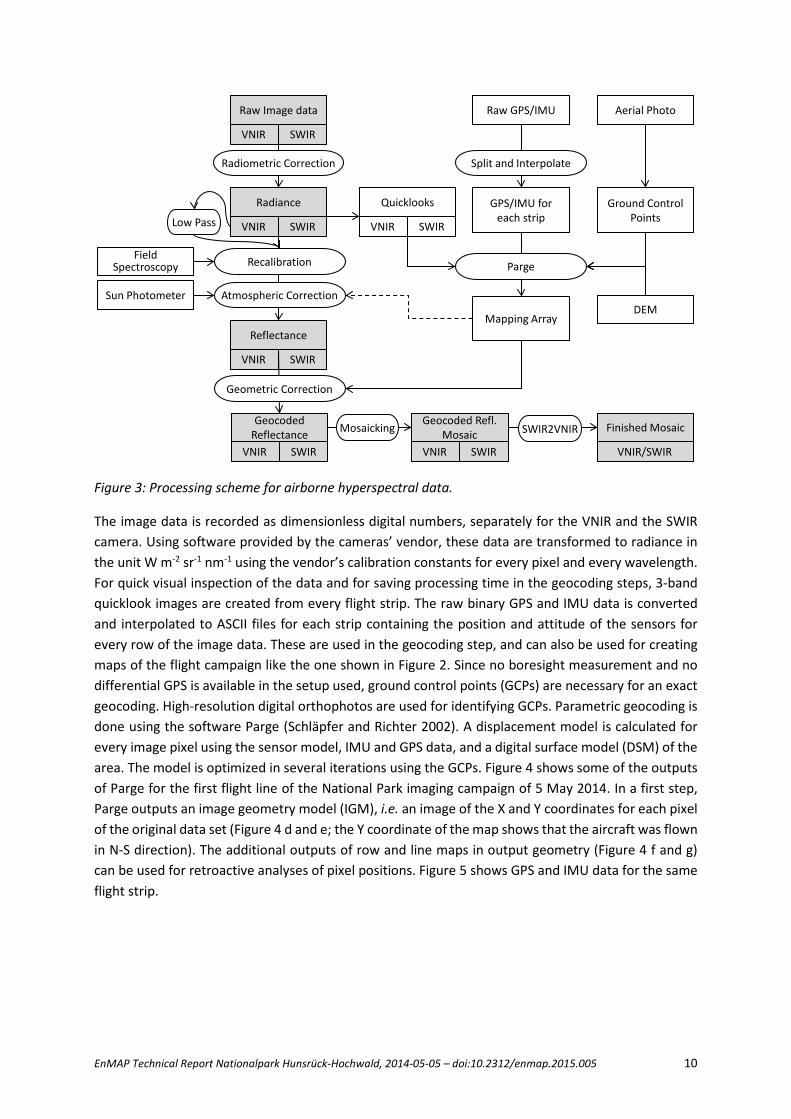
Figure 3: Processing scheme for airborne hyperspectral data.
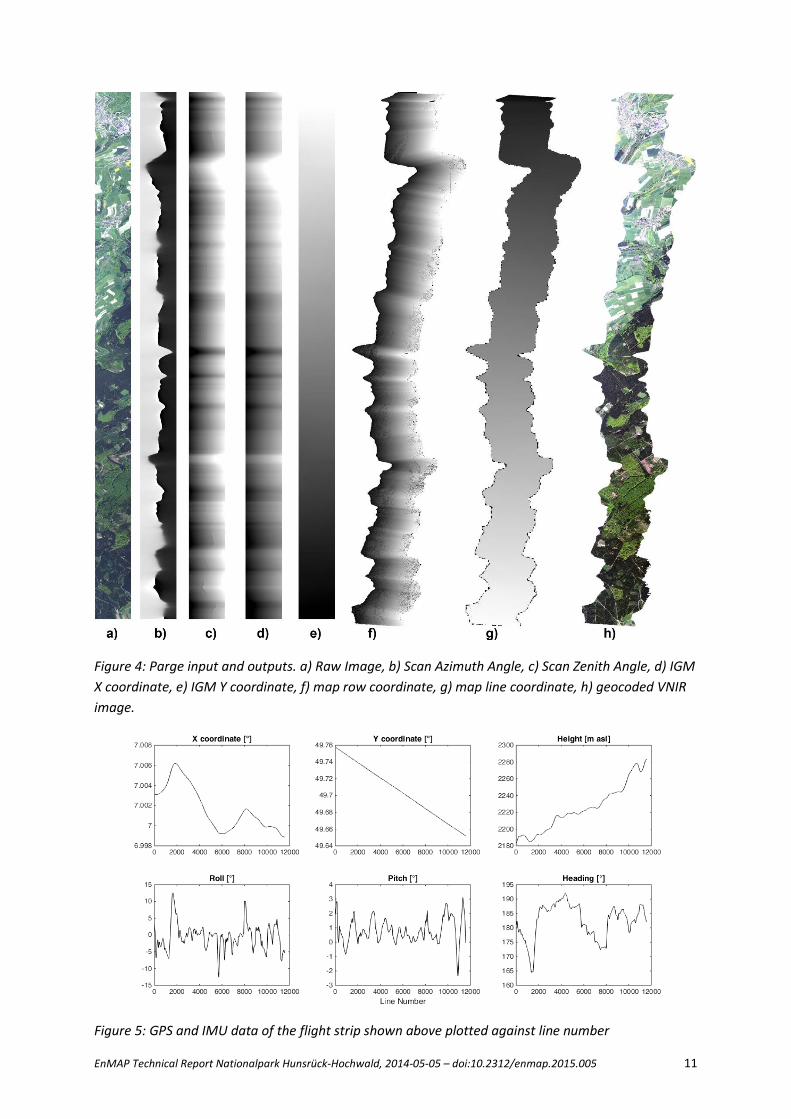
The image data is recorded as dimensionless digital numbers, separately for the VNIR and the SWIR camera. Using software provided by the cameras’ vendor, these data are transformed to radiance in the unit W m-2 sr-1 nm-1 using the vendor’s calibration constants for every pixel and every wavelength. For quick visual inspection of the data and for saving processing time in the geocoding steps, 3-band quicklook images are created from every flight strip. The raw binary GPS and IMU data is converted and interpolated to ASCII files for each strip containing the position and attitude of the sensors for every row of the image data. These are used in the geocoding step, and can also be used for creating maps of the flight campaign like the one shown in Figure 2. Since no boresight measurement and no differential GPS is available in the setup used, ground control points (GCPs) are necessary for an exact geocoding. High-resolution digital orthophotos are used for identifying GCPs. Parametric geocoding is done using the software Parge (Schläpfer and Richter 2002). A displacement model is calculated for every image pixel using the sensor model, IMU and GPS data, and a digital surface model (DSM) of the area. The model is optimized in several iterations using the GCPs. Figure 4 shows some of the outputs of Parge for the first flight line of the National Park imaging campaign of 5 May 2014. In a first step, Parge outputs an image geometry model (IGM), i.e. an image of the X and Y coordinates for each pixel of the original data set (Figure 4 d and e; the Y coordinate of the map shows that the aircraft was flown in N-S direction). The additional outputs of row and line maps in output geometry (Figure 4 f and g) can be used for retroactive analyses of pixel positions. Figure 5 shows GPS and IMU data for the same flight strip.
Raw Image data
VNIR SWIR
Radiometric Correction
Radiance
VNIR SWIR
Atmospheric Correction
Reflectance
VNIR SWIR
RecalibrationField Spectroscopy
Sun Photometer
Raw GPS/IMU
Split and Interpolate
GPS/IMU for each strip
Quicklooks
VNIR SWIR
DEM
Aerial Photo
Parge
Mapping Array
Ground Control Points
Geocoded Reflectance
VNIR SWIR
Geometric Correction
Finished Mosaic
VNIR/SWIR
Geocoded Refl. Mosaic
VNIR SWIR
Mosaicking SWIR2VNIR
Low Pass
EnMAP Technical Report Nationalpark Hunsrück-Hochwald, 2014-05-05 – doi:10.2312/enmap.2015.005 11
Figure 4: Parge input and outputs. a) Raw Image, b) Scan Azimuth Angle, c) Scan Zenith Angle, d) IGM X coordinate, e) IGM Y coordinate, f) map row coordinate, g) map line coordinate, h) geocoded VNIR image.
Figure 5: GPS and IMU data of the flight strip shown above plotted against line number
EnMAP Technical Report Nationalpark Hunsrück-Hochwald, 2014-05-05 – doi:10.2312/enmap.2015.005 12
The atmospheric correction is done using AtCPro, an in-house developed software for radiative transfer modelling based on the 5S code by Tanré et al. (1990). The mapping array can be used in the atmospheric correction to link the not yet geometrically corrected image to the digital elevation model for corrections of illumination and for water vapour estimation. This is not done yet for the HySpex data.
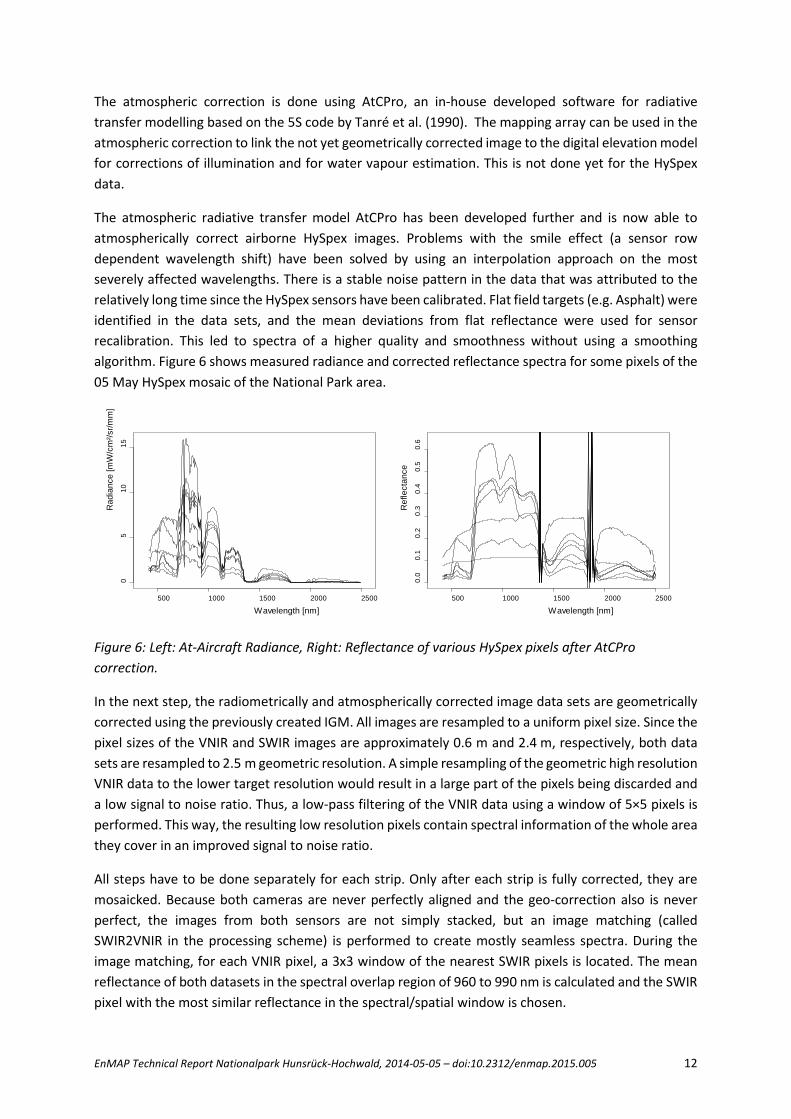
The atmospheric radiative transfer model AtCPro has been developed further and is now able to atmospherically correct airborne HySpex images. Problems with the smile effect (a sensor row dependent wavelength shift) have been solved by using an interpolation approach on the most severely affected wavelengths. There is a stable noise pattern in the data that was attributed to the relatively long time since the HySpex sensors have been calibrated. Flat field targets (e.g. Asphalt) were identified in the data sets, and the mean deviations from flat reflectance were used for sensor recalibration. This led to spectra of a higher quality and smoothness without using a smoothing algorithm. Figure 6 shows measured radiance and corrected reflectance spectra for some pixels of the 05 May HySpex mosaic of the National Park area.
Figure 6: Left: At-Aircraft Radiance, Right: Reflectance of various HySpex pixels after AtCPro correction.
In the next step, the radiometrically and atmospherically corrected image data sets are geometrically corrected using the previously created IGM. All images are resampled to a uniform pixel size. Since the pixel sizes of the VNIR and SWIR images are approximately 0.6 m and 2.4 m, respectively, both data sets are resampled to 2.5 m geometric resolution. A simple resampling of the geometric high resolution VNIR data to the lower target resolution would result in a large part of the pixels being discarded and a low signal to noise ratio. Thus, a low-pass filtering of the VNIR data using a window of 5×5 pixels is performed. This way, the resulting low resolution pixels contain spectral information of the whole area they cover in an improved signal to noise ratio.
All steps have to be done separately for each strip. Only after each strip is fully corrected, they are mosaicked. Because both cameras are never perfectly aligned and the geo-correction also is never perfect, the images from both sensors are not simply stacked, but an image matching (called SWIR2VNIR in the processing scheme) is performed to create mostly seamless spectra. During the image matching, for each VNIR pixel, a 3x3 window of the nearest SWIR pixels is located. The mean reflectance of both datasets in the spectral overlap region of 960 to 990 nm is calculated and the SWIR pixel with the most similar reflectance in the spectral/spatial window is chosen.
500 1000 1500 2000 2500
05
1015
Wavelength [nm]
Rad
ianc
e [m
W/c
m²/s
r/mm
]
500 1000 1500 2000 2500
0.0
0.1
0.2
0.3
0.4
0.5
0.6
Wavelength [nm]
Ref
lect
ance
EnMAP Technical Report Nationalpark Hunsrück-Hochwald, 2014-05-05 – doi:10.2312/enmap.2015.005 13
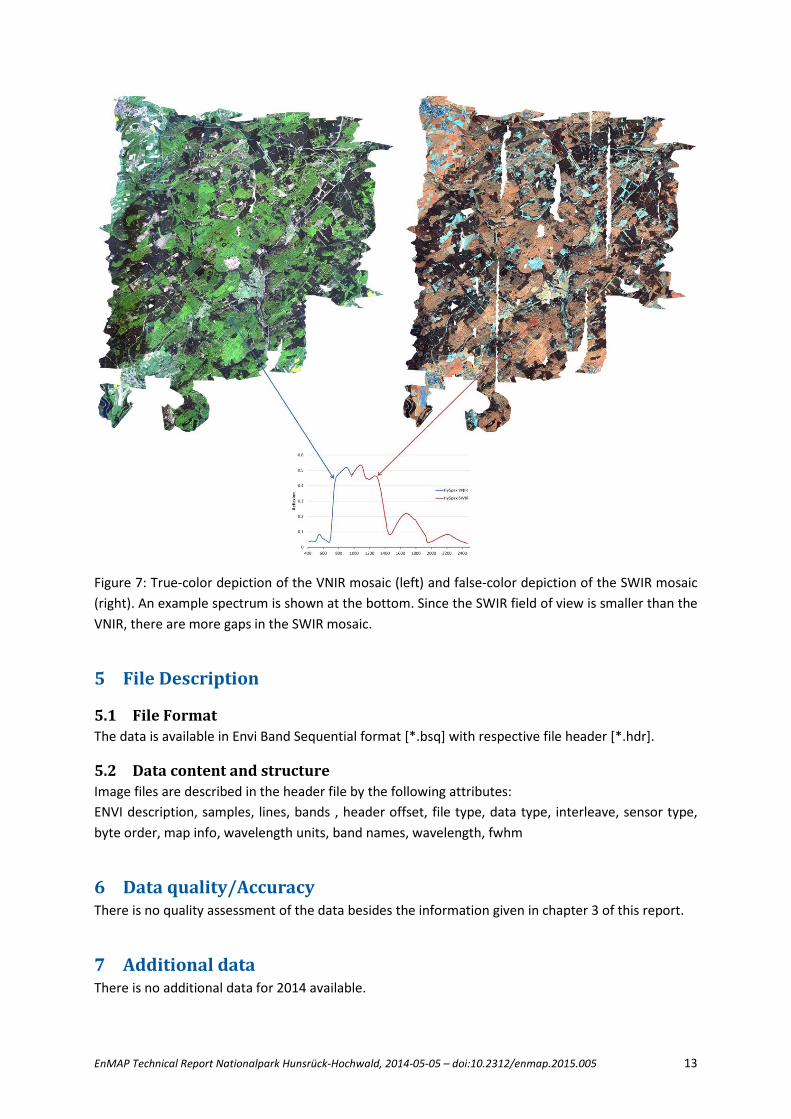
Figure 7: True-color depiction of the VNIR mosaic (left) and false-color depiction of the SWIR mosaic (right). An example spectrum is shown at the bottom. Since the SWIR field of view is smaller than the VNIR, there are more gaps in the SWIR mosaic.
5 File Description
5.1 File Format The data is available in Envi Band Sequential format [*.bsq] with respective file header [*.hdr].
5.2 Data content and structure Image files are described in the header file by the following attributes: ENVI description, samples, lines, bands , header offset, file type, data type, interleave, sensor type, byte order, map info, wavelength units, band names, wavelength, fwhm
6 Data quality/Accuracy There is no quality assessment of the data besides the information given in chapter 3 of this report.
7 Additional data There is no additional data for 2014 available.

EnMAP Technical Report Nationalpark Hunsrück-Hochwald, 2014-05-05 – doi:10.2312/enmap.2015.005 14
8 Dataset Contact Henning Buddenbaum Email: [email protected] Phone: +49 (0) 651 201 4729
Joachim Hill Email: [email protected] Phone: +49 (0) 651 201 4591
9 Acknowledgements We would like to thank the Fliegerclub Region Trier and our Pilot Sven Fischer. The flight was supported within the framework of the EnMAP project [Contract No. 50 EE 1258] by the German Aerospace Center (DLR) and the Federal Ministry of Economic Affairs and Energy.
EnMAP Technical Report Nationalpark Hunsrück-Hochwald, 2014-05-05 – doi:10.2312/enmap.2015.005 15
10 References Buddenbaum, H., Schlerf, M., & Hill, J. (2005). Classification of coniferous tree species and age classes
using hyperspectral data and geostatistical methods. International Journal of Remote Sensing, 26, 5453-5465. http://doi.org/10.1080/01431160500285076.
Buddenbaum, H., Seeling, S., & Hill, J. (2013). Fusion of full-waveform lidar and imaging spectroscopy remote sensing data for the characterization of forest stands. International Journal of Remote Sensing, 34, 4511-4524. http://doi.org/ 10.1080/01431161.2013.776721.
Guanter, L., Kaufmann, H., Segl, K., Foerster, S., Rogaß, C., Chabrillat, S., Küster, T., Hollstein, A., Rossner, G., Chlebek, C., Straif, C., Fischer, S., Schrader, S., Storch, T., Heiden, U., Mueller, A., Bachmann, M., Mühle, H., Müller, R., Habermeyer, M., Ohndorf, A., Hill, J., Buddenbaum, H., Hostert, P., van der Linden, S., Leitão, P., Rabe, A., Doerffer, R., Krasemann, H., Xi, H., Mauser, W., Hank, T., Locherer, M., Rast, M., Staenz, K., Sang, B. (2015): The EnMAP Spaceborne Imaging Spectroscopy Mission for Earth Observation. - Remote Sensing, 7, 7, p. 8830-8857. http://doi.org/10.3390/rs70708830.
Hill, J., & Mehl, W. (2003). Geo- und radiometrische Aufbereitung multi- und hyperspektraler Daten zur Erzeugung langjähriger kalibrierter Zeitreihen. Photogrammetrie - Fernerkundung - Geoinformation, 2003, 7-14
Schläpfer, D., & Richter, R. (2002). Geo-atmospheric processing of airborne imaging spectrometry data. Part 1: Parametric orthorectification. International Journal of Remote Sensing, 23, 2609 - 2630. http://doi.org/10.1080/01431160110115825.
Schlerf, M., & Atzberger, C. (2006). Inversion of a forest reflectance model to estimate structural canopy variables from hyperspectral remote sensing data. Remote Sensing of Environment, 100, 281-294. http://doi.org/10.1016/j.rse.2005.10.006.
Schlerf, M., Atzberger, C., & Hill, J. (2005). Remote sensing of forest biophysical variables using HyMap imaging spectrometer data. Remote Sensing of Environment, 95, 177-194. http://doi.org/10.1016/j.rse.2004.12.016.
Schlerf, M., Hill, J., Bärisch, S., & Atzberger, C. (2003). Einfluss der spektralen und räumlichen Auflösung von Fernerkundungsdaten bei der Nadelwaldklassifikation. Photogrammetrie - Fernerkundung - Geoinformation, 2003, 27-34
Tanré, D., Deroo, C., Duhaut, P., Herman, M., Morcrette, J.J., Perbos, J., & Deschamps, P.Y. (1990). Technical note Description of a computer code to simulate the satellite signal in the solar spectrum: the 5S code. International Journal of Remote Sensing, 11, 659-668. http://doi.org/10.1080/01431169008955048.