Embed Size (px)
Citation preview
sigmaNo 1/2011
Natural catastrophes and man-made disasters in 2010: a year of devastating and costly events
1 Executive summary
2 Overview of catastrophes in 2010
9 2010 – the year of devastating earthquakes
14 Tables for reporting year 2010
32 Tables showing the major losses 1970–2010
34 Terms and selection criteria
Published by:Swiss Reinsurance Company LtdEconomic Research & ConsultingP.O. Box 8022 ZurichSwitzerland
Telephone +41 43 285 2551Fax +41 43 282 0075E-mail: [email protected]
New York Office:55 East 52nd Street40th FloorNew York, NY 10055
Telephone +1 212 317 5400Fax +1 212 317 5455
Hong Kong Office:18 Harbour Road, WanchaiCentral Plaza, 61st FloorHong Kong, SAR
Telephone + 852 25 82 5703Fax + 852 25 11 6603
Authors:Lucia BevereTelephone +41 43 285 9279
Dr Brian RogersTelephone +41 43 285 2733
Dr Balz GrollimundTelephone +41 43 285 5758
Managing editor:Thomas Hess, Head of Economic Research & Consulting, is responsible for the sigma series.
The editorial deadline for this study was 28 February 2011.
sigma is available in English (original language), German, French, Spanish, Chinese and Japanese.
sigma is available on Swiss Re’s website: www.swissre.com/sigma
The internet version may contain slightly updated information.
Translations:CLS Communication
Graphic design and production:Swiss Re Logistics / Media Production
© 2011Swiss Reinsurance Company LtdAll rights reserved.
The entire content of this sigma edition is subject to copyright with all rights reserved. The information may be used for private or internal purposes, provided that any copyright or other proprietary notices are not removed. Electronic reuse of the data published in sigma is prohibited.
Reproduction in whole or in part or use for any public purpose is permitted only with the prior written approval of Swiss Re Economic Research & Consulting and if the source reference “Swiss Re, sigma No 1/2011” is indicated. Courtesy copies are appreciated.
Although all the information used in this study was taken from reliable sources, Swiss Reinsurance Company does not accept any responsibility for the accuracy or com-prehensiveness of the information given. The information provided is for informational purposes only and in no way constitutes Swiss Re’s position. In no event shall Swiss Re be liable for any loss or damage arising in connection with the use of this information.
Order no: 270_0111_en
1Swiss Re, sigma No 1/2011
Catastrophes claimed nearly 304 000 victims and cost insurers approximately USD 43bn in 2010
Natural catastrophes and man-made disasters claimed nearly 304 000 victims and resulted in economic losses of close to USD 218bn in 2010. The cost to insurers was more than USD 43bn. In terms of insured losses, 2010 ranks as the seventh highest year since 1970, when sigma began collecting catastrophe data. Compared to 2009, insured losses were more than 60% higher in 2010, but still below 2005, the year that insured losses soared after Hurricanes Katrina, Wilma and Rita struck the US.
In 2010, 304 catastrophic events occurred, consisting of 167 natural catastrophes and 137 man-made disasters.
Of the nearly 304 000 people who were victims of catastrophic events in 2010, more than 222 000 died in the massive earthquake that struck Haiti in January. The heat wave and wildfires that affected Russia in the summer claimed nearly 56 000 victims due to the combination of the smoke and record high temperatures.
In terms of economic losses, natural catastrophes and man-made disasters cost society approximately USD 218bn in 2010, versus USD 68bn in 2009. Asia suffered the high-est economic losses, totalling approximately USD 75bn.
Natural catastrophes cost the global insurance industry roughly USD 40bn in 2010, while man-made disasters triggered additional claims of more than USD 3bn. By com-parison, overall insured losses totalled USD 27bn in 2009. Despite notably higher than average earthquake losses, overall catastrophe claims in 2010 were roughly in line with the 10-year average due to unusually modest US hurricane losses. Insured losses were highest in North America, where they exceeded USD 15bn.
Earthquakes losses accounted for almost one-third of all insured losses in 2010. The earthquake in Chile cost the industry USD 8bn and claimed 562 lives, while the New Zealand earthquake cost insurers more than USD 4bn but resulted in no fatalities. Win-ter storm Xynthia in northwestern Europe led to insured losses of USD 2.8bn, killing 64 people. Other significant events include a major US storm that caused more than USD 2bn of insured losses and the floods in Australia, which, in 2010, triggered ap-proximately USD 2bn in claims.
A special chapter on earthquakes in this edition of sigma reveals that the number of fatalities and insured losses from earthquakes are rising because population growth and higher population density, especially in urban areas, exposes more people to a sin-gle damaging earthquake. Many of the rapidly growing urban areas with high popula-tion densities are located in seismically active areas. Due to this, the probability for earthquakes with a high death toll continuously increases, although the seismic threat itself remains unchanged.
Improved building standards that are strictly enforced, along with good infrastructure and efficient disaster relief efforts have helped mitigate the negative consequences of earthquakes.
2010 was a year of extreme weather events, such as floods of unprecedented scale – in terms of the territory affected and damage suffered – and devastating earthquakes that ranked among the deadliest, costliest and most powerful in history.
Prevention, mitigation and risk avoidance with measures such as hazard mapping or comprehensive building codes are the most important steps for dealing with catas-trophes. But not all risks can be avoided, so preparing for the financial aspects of risks is a key element of any disaster-prone country or region.
Catastrophes killed nearly 304 000 peo-ple in 2010. Insured losses rose more than 60% to USD 43bn.
Over 300 catastrophic events occurred in 2010.
The earthquake that struck Haiti and the summer heat wave in Russia killed more than 222 000 and nearly 56 000 people respectively.
Catastrophes cost society approximately USD 218bn in 2010.
Insured losses were USD 43bn; natural catastrophes cost insurers roughly USD 40bn, while man-made disasters account-ed for more than USD 3bn.
Earthquakes accounted for almost one-third of insured losses in 2010.
Earthquake fatalities and insured losses are rising because of higher population densities and because populations are growing in seismically active areas.
Building standards that are strictly enforced, solid infrastructures and disaster relief efforts are essential.
Prevention, mitigation, and risk avoidance are important, but financial preparation is also key.
Executive summary
Swiss Re, sigma No 1/20112
Overview of catastrophes in 2010
More than 300 catastrophic events occurred in 2010
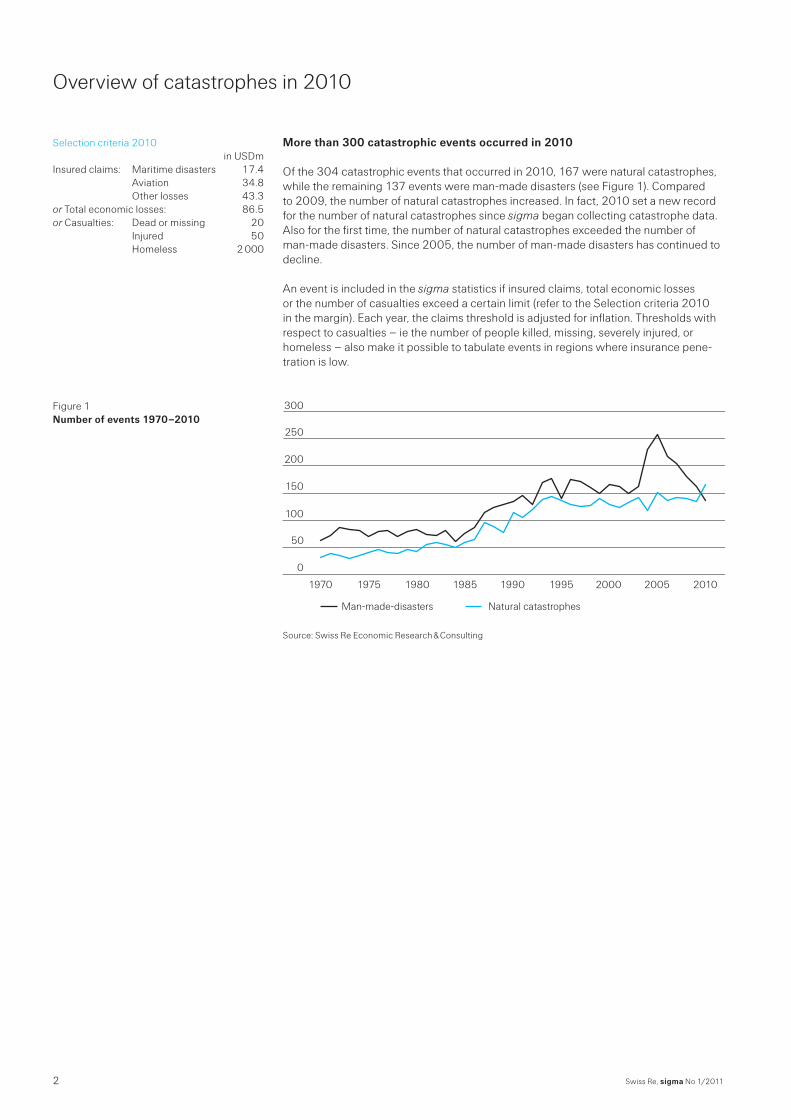
Of the 304 catastrophic events that occurred in 2010, 167 were natural catastrophes, while the remaining 137 events were man-made disasters (see Figure 1). Compared to 2009, the number of natural catastrophes increased. In fact, 2010 set a new record for the number of natural catastrophes since sigma began collecting catastrophe data. Also for the first time, the number of natural catastrophes exceeded the number of man-made disasters. Since 2005, the number of man-made disasters has continued to decline.
An event is included in the sigma statistics if insured claims, total economic losses or the number of casualties exceed a certain limit (refer to the Selection criteria 2010 in the margin). Each year, the claims threshold is adjusted for inflation. Thresholds with respect to casualties – ie the number of people killed, missing, severely injured, or homeless – also make it possible to tabulate events in regions where insurance pene-tration is low.
0
50
100
150
200
250
300
201020052000199519901985198019751970
Man-made-disasters Natural catastrophes
Source: Swiss Re Economic Research & Consulting
Selection criteria 2010 in USDmInsured claims: Maritime disasters 17.4 Aviation 34.8 Other losses 43.3or Total economic losses: 86.5or Casualties: Dead or missing 20 Injured 50 Homeless 2 000
Figure 1Number of events 1970–2010
3Swiss Re, sigma No 1/2011
Nearly304000peoplearoundtheworldwerevictimsofcatastrophes
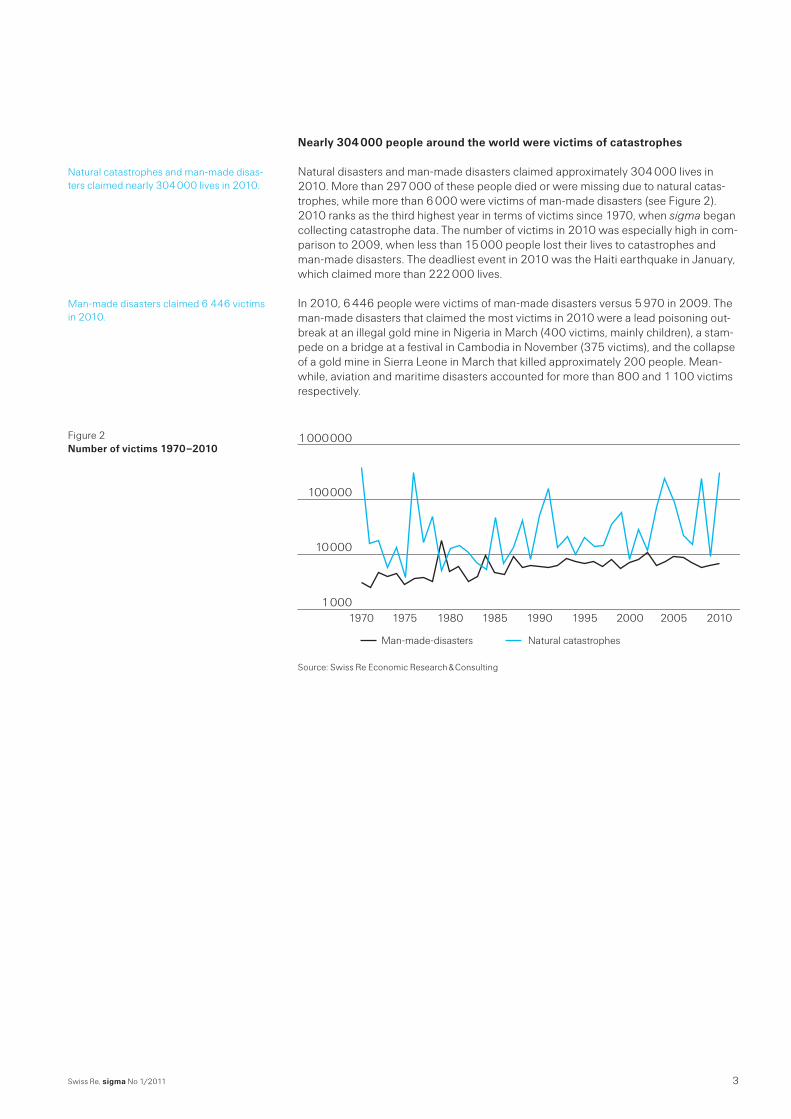
Natural disasters and man-made disasters claimed approximately 304 000 lives in 2010. More than 297 000 of these people died or were missing due to natural catas-trophes, while more than 6 000 were victims of man-made disasters (see Figure 2). 2010 ranks as the third highest year in terms of victims since 1970, when sigma began collecting catastrophe data. The number of victims in 2010 was especially high in com-parison to 2009, when less than 15 000 people lost their lives to catastrophes and man-made disasters. The deadliest event in 2010 was the Haiti earthquake in January, which claimed more than 222 000 lives.
In 2010, 6 446 people were victims of man-made disasters versus 5 970 in 2009. The man-made disasters that claimed the most victims in 2010 were a lead poisoning out-break at an illegal gold mine in Nigeria in March (400 victims, mainly children), a stam-pede on a bridge at a festival in Cambodia in November (375 victims), and the collapse of a gold mine in Sierra Leone in March that killed approximately 200 people. Mean-while, aviation and maritime disasters accounted for more than 800 and 1 100 victims respectively.
1970 1975 1980 1985 1990 1995 2000 2005 2010
Man-made-disasters Natural catastrophes
1 000 000
100 000
10 000
1 000
Source: Swiss Re Economic Research & Consulting
Natural catastrophes and man-made disas-ters claimed nearly 304 000 lives in 2010.
Man-made disasters claimed 6 446 victims in 2010.
Figure 2Numberofvictims1970–2010
Swiss Re, sigma No 1/20114
Overview of catastrophes in 2010
Total economic losses were estimated at approximately USD 218bn
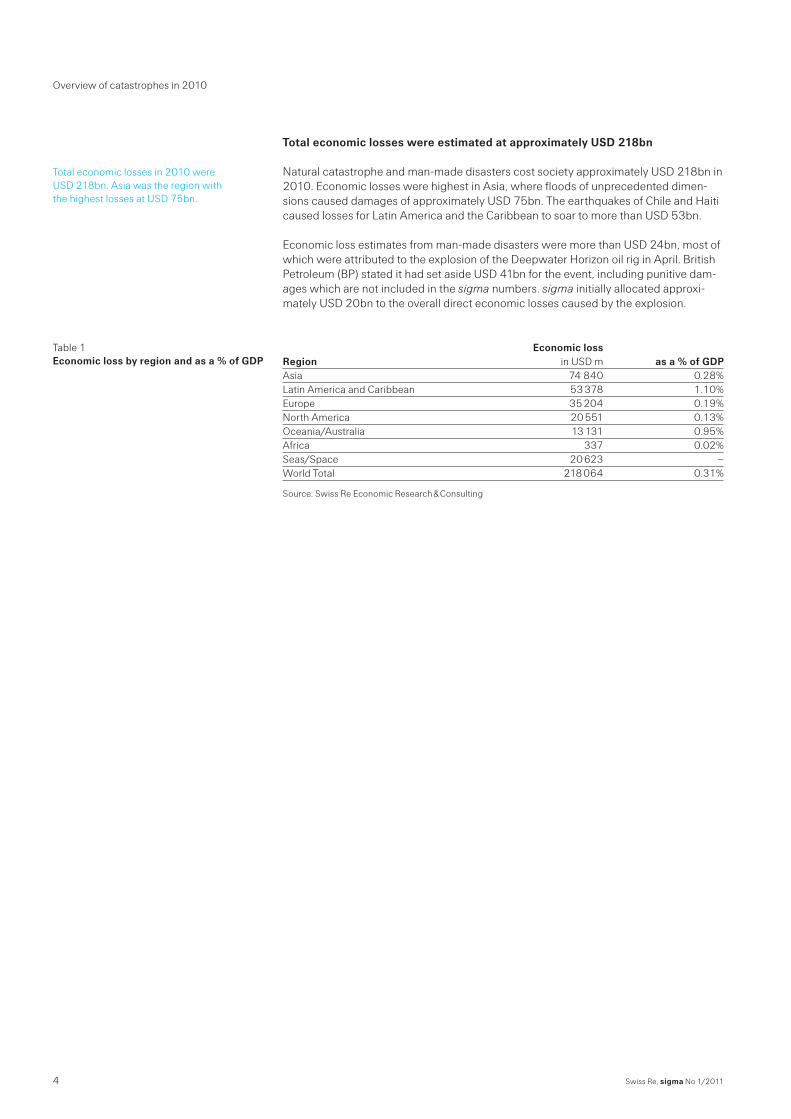
Natural catastrophe and man-made disasters cost society approximately USD 218bn in 2010. Economic losses were highest in Asia, where floods of unprecedented dimen-sions caused damages of approximately USD 75bn. The earthquakes of Chile and Haiti caused losses for Latin America and the Caribbean to soar to more than USD 53bn.
Economic loss estimates from man-made disasters were more than USD 24bn, most of
which were attributed to the explosion of the Deepwater Horizon oil rig in April. British Petroleum (BP) stated it had set aside USD 41bn for the event, including punitive dam-ages which are not included in the sigma numbers. sigma initially allocated approxi-mately USD 20bn to the overall direct economic losses caused by the explosion.
Economic lossRegion in USD m as a % of GDPAsia 74 840 0.28%Latin America and Caribbean 53 378 1.10%Europe 35 204 0.19%North America 20 551 0.13%Oceania/Australia 13 131 0.95%Africa 337 0.02%Seas/Space 20 623 –World Total 218 064 0.31%
Source: Swiss Re Economic Research & Consulting
Total economic losses in 2010 were USD 218bn. Asia was the region with the highest losses at USD 75bn.
Table 1Economic loss by region and as a % of GDP
5Swiss Re, sigma No 1/2011
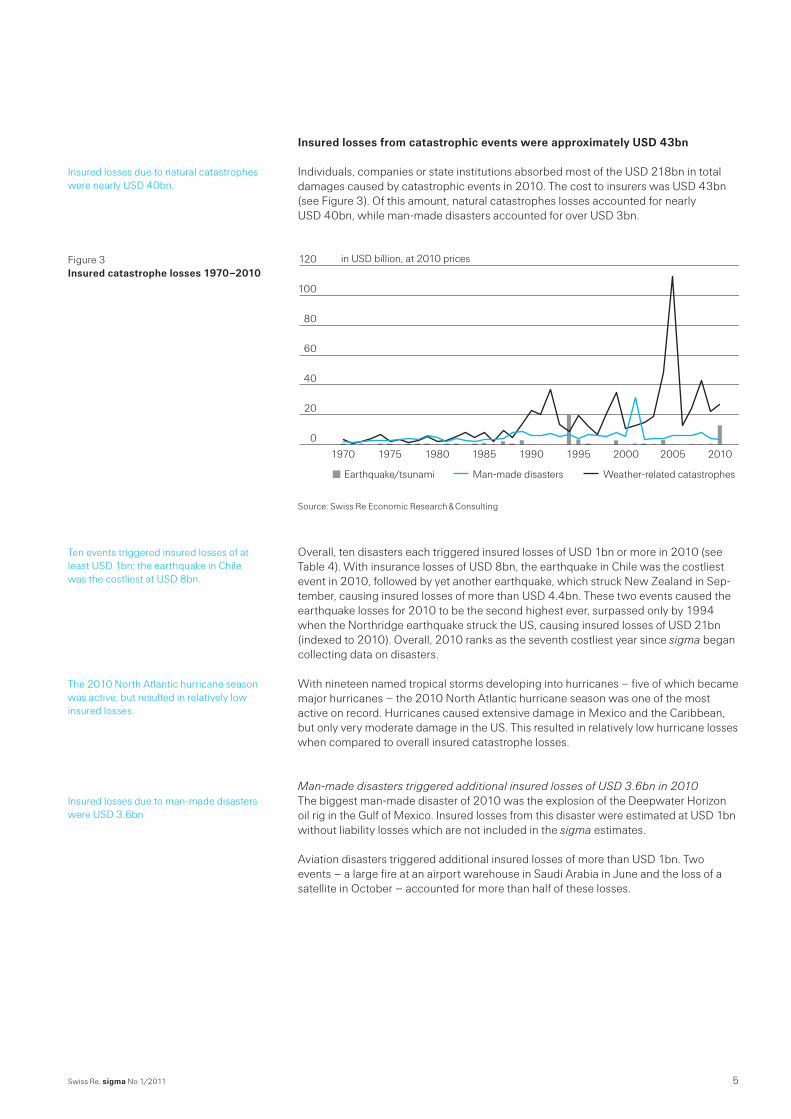
Insured losses from catastrophic events were approximately USD 43bn
Individuals, companies or state institutions absorbed most of the USD 218bn in total damages caused by catastrophic events in 2010. The cost to insurers was USD 43bn (see Figure 3). Of this amount, natural catastrophes losses accounted for nearly USD 40bn, while man-made disasters accounted for over USD 3bn.
0
20
40
60
80
100
120
201020052000199519901985198019751970 0
20000
40000
60000
80000
100000
120000
201020052000199519901985198019751970
in USD billion, at 2010 prices
Earthquake/tsunami Man-made disasters Weather-related catastrophes
Source: Swiss Re Economic Research & Consulting
Overall, ten disasters each triggered insured losses of USD 1bn or more in 2010 (see Table 4). With insurance losses of USD 8bn, the earthquake in Chile was the costliest event in 2010, followed by yet another earthquake, which struck New Zealand in Sep-tember, causing insured losses of more than USD 4.4bn. These two events caused the earthquake losses for 2010 to be the second highest ever, surpassed only by 1994 when the Northridge earthquake struck the US, causing insured losses of USD 21bn (indexed to 2010). Overall, 2010 ranks as the seventh costliest year since sigma began collecting data on disasters.
With nineteen named tropical storms developing into hurricanes – five of which became major hurricanes – the 2010 North Atlantic hurricane season was one of the most active on record. Hurricanes caused extensive damage in Mexico and the Caribbean, but only very moderate damage in the US. This resulted in relatively low hurricane losses when compared to overall insured catastrophe losses.
Man-madedisasterstriggeredadditionalinsuredlossesofUSD3.6bnin2010 The biggest man-made disaster of 2010 was the explosion of the Deepwater Horizon
oil rig in the Gulf of Mexico. Insured losses from this disaster were estimated at USD 1bn without liability losses which are not included in the sigma estimates.
Aviation disasters triggered additional insured losses of more than USD 1bn. Two events – a large fire at an airport warehouse in Saudi Arabia in June and the loss of a satellite in October – accounted for more than half of these losses.
Insured losses due to natural catastrophes were nearly USD 40bn.
Figure 3Insured catastrophe losses 1970–2010
Ten events triggered insured losses of at least USD 1bn; the earthquake in Chile was the costliest at USD 8bn.
The 2010 North Atlantic hurricane season was active, but resulted in relatively low insured losses.
Insured losses due to man-made disasters were USD 3.6bn
Swiss Re, sigma No 1/20116
Overview of catastrophes in 2010
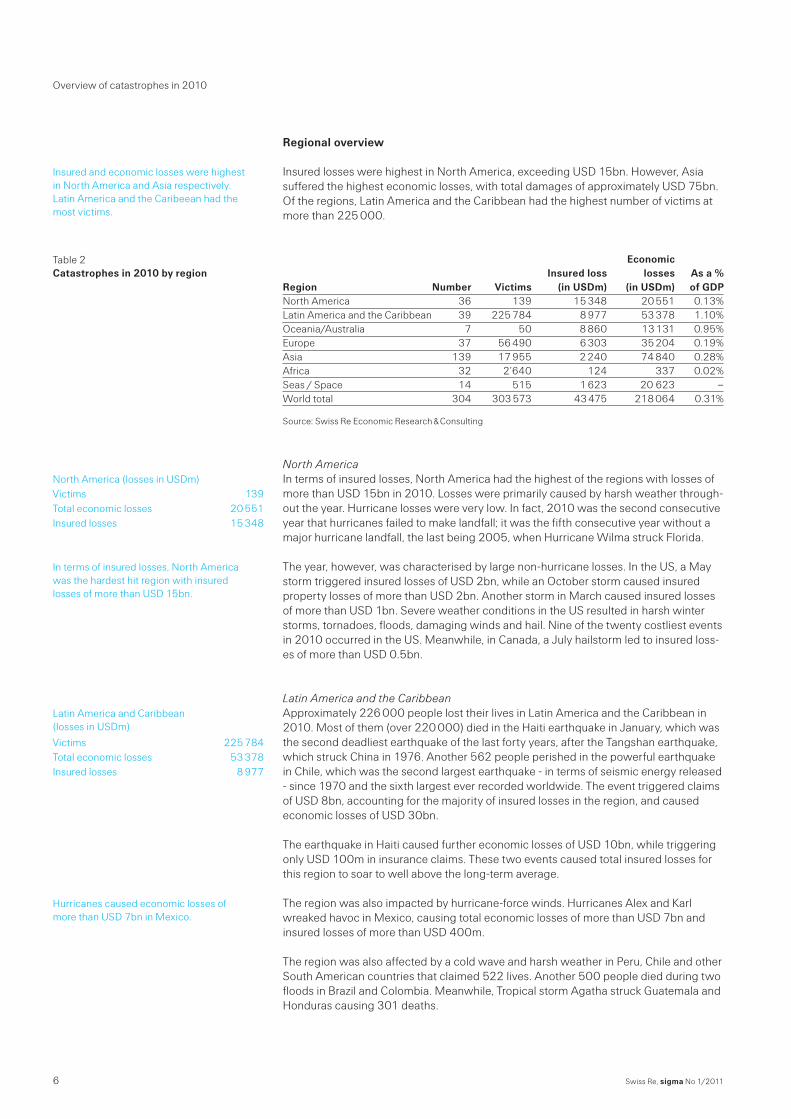
Regional overview
Insured losses were highest in North America, exceeding USD 15bn. However, Asia suffered the highest economic losses, with total damages of approximately USD 75bn. Of the regions, Latin America and the Caribbean had the highest number of victims at more than 225 000.
Economic Insured loss losses As a % Region Number Victims (in USDm) (in USDm) of GDPNorth America 36 139 15 348 20 551 0.13%Latin America and the Caribbean 39 225 784 8 977 53 378 1.10%Oceania/Australia 7 50 8 860 13 131 0.95%Europe 37 56 490 6 303 35 204 0.19%Asia 139 17 955 2 240 74 840 0.28%Africa 32 2’640 124 337 0.02%Seas / Space 14 515 1 623 20 623 –World total 304 303 573 43 475 218 064 0.31%
Source: Swiss Re Economic Research & Consulting
NorthAmerica In terms of insured losses, North America had the highest of the regions with losses of
more than USD 15bn in 2010. Losses were primarily caused by harsh weather through-out the year. Hurricane losses were very low. In fact, 2010 was the second consecutive year that hurricanes failed to make landfall; it was the fifth consecutive year without a major hurricane landfall, the last being 2005, when Hurricane Wilma struck Florida.
The year, however, was characterised by large non-hurricane losses. In the US, a May storm triggered insured losses of USD 2bn, while an October storm caused insured property losses of more than USD 2bn. Another storm in March caused insured losses of more than USD 1bn. Severe weather conditions in the US resulted in harsh winter storms, tornadoes, floods, damaging winds and hail. Nine of the twenty costliest events in 2010 occurred in the US. Meanwhile, in Canada, a July hailstorm led to insured loss-es of more than USD 0.5bn.
LatinAmericaandtheCaribbean Approximately 226 000 people lost their lives in Latin America and the Caribbean in
2010. Most of them (over 220 000) died in the Haiti earthquake in January, which was the second deadliest earthquake of the last forty years, after the Tangshan earthquake, which struck China in 1976. Another 562 people perished in the powerful earthquake in Chile, which was the second largest earthquake - in terms of seismic energy released - since 1970 and the sixth largest ever recorded worldwide. The event triggered claims of USD 8bn, accounting for the majority of insured losses in the region, and caused economic losses of USD 30bn.
The earthquake in Haiti caused further economic losses of USD 10bn, while triggering only USD 100m in insurance claims. These two events caused total insured losses for this region to soar to well above the long-term average.
The region was also impacted by hurricane-force winds. Hurricanes Alex and Karl wreaked havoc in Mexico, causing total economic losses of more than USD 7bn and insured losses of more than USD 400m.
The region was also affected by a cold wave and harsh weather in Peru, Chile and other South American countries that claimed 522 lives. Another 500 people died during two floods in Brazil and Colombia. Meanwhile, Tropical storm Agatha struck Guatemala and Honduras causing 301 deaths.
Insured and economic losses were highest in North America and Asia respectively. Latin America and the Caribeean had the most victims.
Table 2Catastrophes in 2010 by region
North America (losses in USDm)Victims 139Total economic losses 20 551Insured losses 15 348
In terms of insured losses, North America was the hardest hit region with insured losses of more than USD 15bn.
Latin America and Caribbean (losses in USDm)
Victims 225 784Total economic losses 53 378Insured losses 8 977
Hurricanes caused economic losses of more than USD 7bn in Mexico.
7Swiss Re, sigma No 1/2011
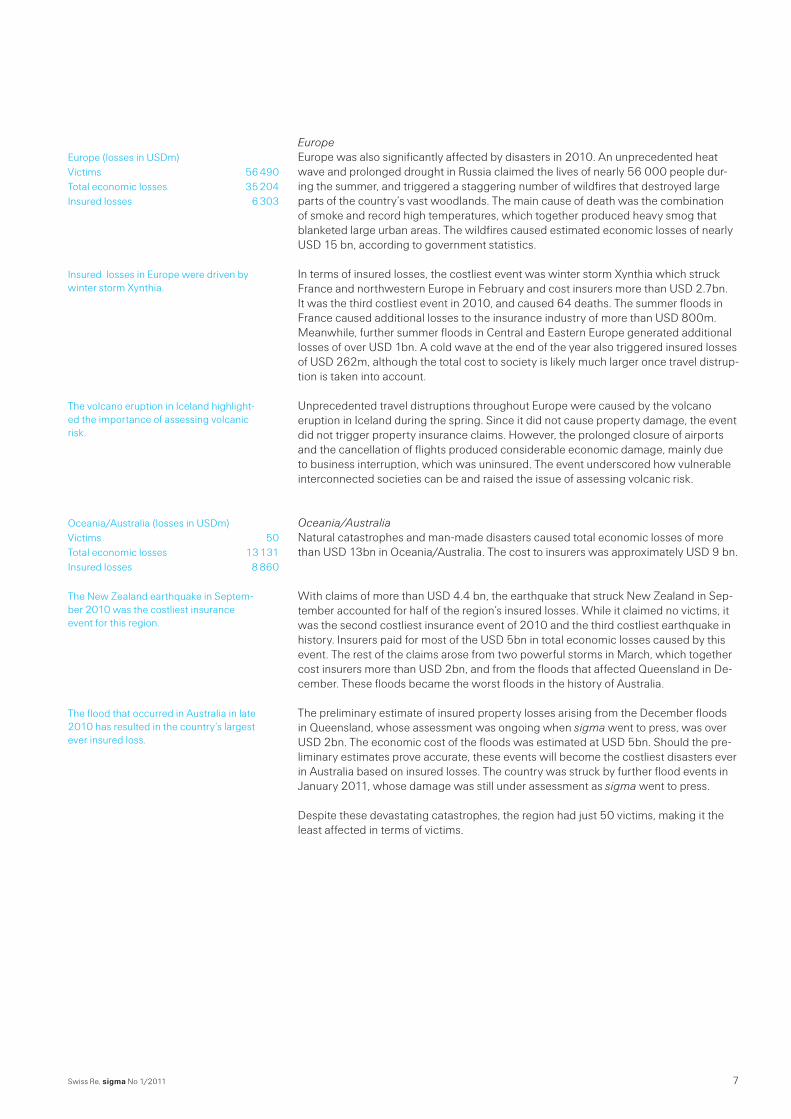
Europe Europe was also significantly affected by disasters in 2010. An unprecedented heat
wave and prolonged drought in Russia claimed the lives of nearly 56 000 people dur-ing the summer, and triggered a staggering number of wildfires that destroyed large parts of the country’s vast woodlands. The main cause of death was the combination of smoke and record high temperatures, which together produced heavy smog that blanketed large urban areas. The wildfires caused estimated economic losses of nearly USD 15 bn, according to government statistics.
In terms of insured losses, the costliest event was winter storm Xynthia which struck France and northwestern Europe in February and cost insurers more than USD 2.7bn. It was the third costliest event in 2010, and caused 64 deaths. The summer floods in France caused additional losses to the insurance industry of more than USD 800m. Meanwhile, further summer floods in Central and Eastern Europe generated additional losses of over USD 1bn. A cold wave at the end of the year also triggered insured losses of USD 262m, although the total cost to society is likely much larger once travel distrup-tion is taken into account.
Unprecedented travel distruptions throughout Europe were caused by the volcano
eruption in Iceland during the spring. Since it did not cause property damage, the event did not trigger property insurance claims. However, the prolonged closure of airports and the cancellation of flights produced considerable economic damage, mainly due to business interruption, which was uninsured. The event underscored how vulnerable interconnected societies can be and raised the issue of assessing volcanic risk.
Oceania/Australia (losses in USDm) Oceania/Australia Natural catastrophes and man-made disasters caused total economic losses of more
than USD 13bn in Oceania/Australia. The cost to insurers was approximately USD 9 bn.
With claims of more than USD 4.4 bn, the earthquake that struck New Zealand in Sep-tember accounted for half of the region’s insured losses. While it claimed no victims, it was the second costliest insurance event of 2010 and the third costliest earthquake in history. Insurers paid for most of the USD 5bn in total economic losses caused by this event. The rest of the claims arose from two powerful storms in March, which together cost insurers more than USD 2bn, and from the floods that affected Queensland in De-cember. These floods became the worst floods in the history of Australia.
The preliminary estimate of insured property losses arising from the December floods in Queensland, whose assessment was ongoing when sigma went to press, was over USD 2bn. The economic cost of the floods was estimated at USD 5bn. Should the pre-liminary estimates prove accurate, these events will become the costliest disasters ever in Australia based on insured losses. The country was struck by further flood events in January 2011, whose damage was still under assessment as sigma went to press.
Despite these devastating catastrophes, the region had just 50 victims, making it the least affected in terms of victims.
Europe (losses in USDm)Victims 56 490Total economic losses 35 204Insured losses 6 303
Insured losses in Europe were driven by winter storm Xynthia.
The volcano eruption in Iceland highlight-ed the importance of assessing volcanic risk.
Victims 50Total economic losses 13 131Insured losses 8 860
The New Zealand earthquake in Septem-ber 2010 was the costliest insurance event for this region.
The flood that occurred in Australia in late 2010 has resulted in the country’s largest ever insured loss.
Swiss Re, sigma No 1/20118
Australia’s floods highlight the need for comprehensive flood insurance
Since the early 1970s, the provision of personal lines flood insurance has been debated in Australia. For many years, flood damage from overflowing rivers was explicitly ex-cluded from standard Australian insurance policies on the basis that the exposure was difficult to assess. Furthermore, as “storm” damage is usually covered, the insurance industry often found itself paying for losses when floods were triggered by storms, as the distinction between wind, rainfall/flash flood damage and overflow damage is diffi-cult to prove and political pressure can be substantial. For this reason, some insurance companies began to offer comprehensive flood coverage in 2010. Given the pressure on the industry to pay claims, the industry has decided to work with the Insurance Council of Australia to increase flood coverage and to harmonise the terms and condi-tions of flood policies.
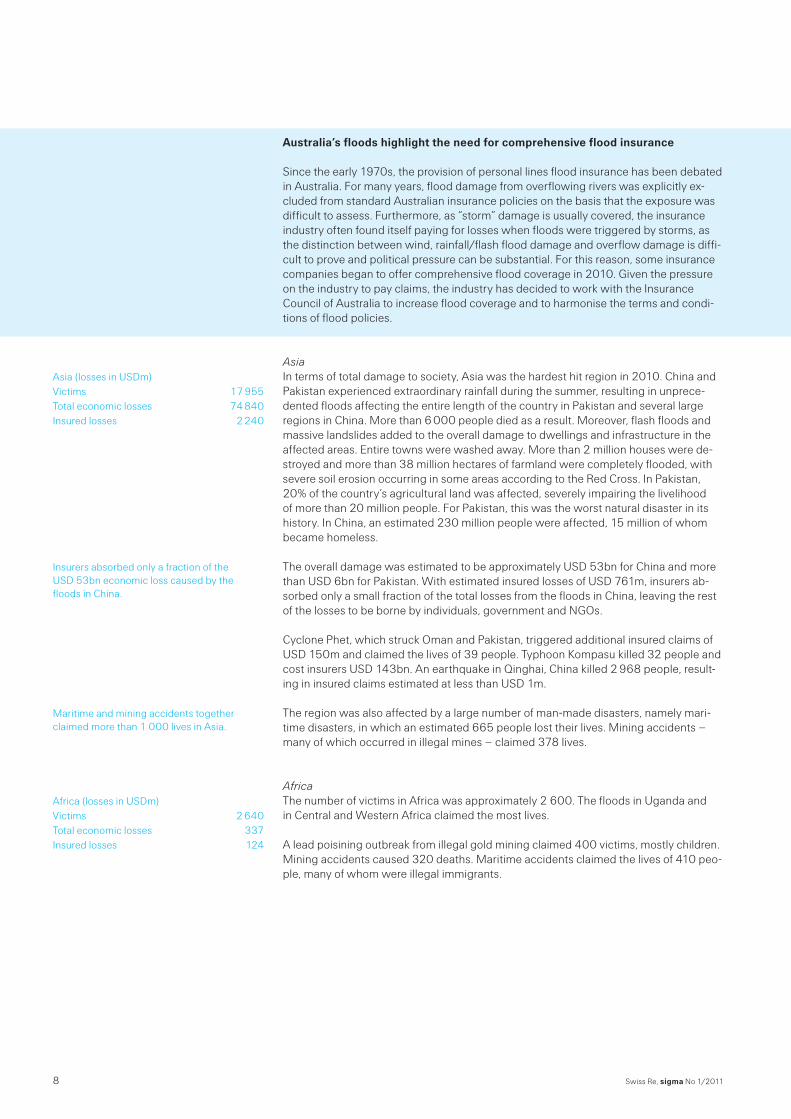
Asia In terms of total damage to society, Asia was the hardest hit region in 2010. China and
Pakistan experienced extraordinary rainfall during the summer, resulting in unprece-dented floods affecting the entire length of the country in Pakistan and several large regions in China. More than 6 000 people died as a result. Moreover, flash floods and massive landslides added to the overall damage to dwellings and infrastructure in the affected areas. Entire towns were washed away. More than 2 million houses were de-stroyed and more than 38 million hectares of farmland were completely flooded, with severe soil erosion occurring in some areas according to the Red Cross. In Pakistan, 20% of the country’s agricultural land was affected, severely impairing the livelihood of more than 20 million people. For Pakistan, this was the worst natural disaster in its history. In China, an estimated 230 million people were affected, 15 million of whom became homeless.
The overall damage was estimated to be approximately USD 53bn for China and more than USD 6bn for Pakistan. With estimated insured losses of USD 761m, insurers ab-sorbed only a small fraction of the total losses from the floods in China, leaving the rest of the losses to be borne by individuals, government and NGOs.
Cyclone Phet, which struck Oman and Pakistan, triggered additional insured claims of USD 150m and claimed the lives of 39 people. Typhoon Kompasu killed 32 people and cost insurers USD 143bn. An earthquake in Qinghai, China killed 2 968 people, result-ing in insured claims estimated at less than USD 1m.
The region was also affected by a large number of man-made disasters, namely mari-time disasters, in which an estimated 665 people lost their lives. Mining accidents – many of which occurred in illegal mines – claimed 378 lives.
Africa The number of victims in Africa was approximately 2 600. The floods in Uganda and
in Central and Western Africa claimed the most lives.
A lead poisining outbreak from illegal gold mining claimed 400 victims, mostly children. Mining accidents caused 320 deaths. Maritime accidents claimed the lives of 410 peo-ple, many of whom were illegal immigrants.
Asia (losses in USDm)Victims 17 955Total economic losses 74 840Insured losses 2 240
Insurers absorbed only a fraction of the USD 53bn economic loss caused by the floods in China.
Maritime and mining accidents together claimed more than 1 000 lives in Asia.
Africa (losses in USDm)Victims 2 640Total economic losses 337Insured losses 124
9Swiss Re, sigma No 1/2011
2010 – the year of devastating earthquakes
The year’s biggest earthquakes
Some of the most devastating earthquakes in history occurred in 2010. In fact, nearly 76% of the approximately 297 000 fatalities caused by natural disasters in 2010 were at-tributed to earthquakes. The most notable of these events in terms of their impact on so-ciety were in Chile (MW 8.8), Indonesia(MW 7.8 and MW 7.0), Mexico (MW 7.2), New Zea-land (MW 7.0), and Haiti (MW 7.0). The Haiti earthquake, which struck in January 2010, was by far the most deadly, claiming more than 220 000 lives – more than 2% of the Car-ibbean nation’s population. In contrast, the five other earthquakes combined claimed ap-proximately 1100 victims.
From a seismological point of view, the Haiti and New Zealand events were similar. Both had a moment magnitude (MW) of 7.0, and each produced a similar amount of seismic energy, thought to be the equivalent of 475 kilotonnes of explosives. Both events also exposed roughly 1 000 km2 of land to severe shaking for roughly 1 minute. By comparison, the Chile event released roughly 500 times the energy of the Haiti event. It was also 500 times more powerful than the New Zealand event, subjecting an area of roughly 100 000 km2 to severe shaking for up to 3 minutes.
In terms of economic losses, the six aforementioned earthquakes generated damages of more than USD 46bn. The Chile event resulted in the largest economic loss – USD 30bn – which is 15% of the nation’s GDP.
Long-term trends in earthquake activity
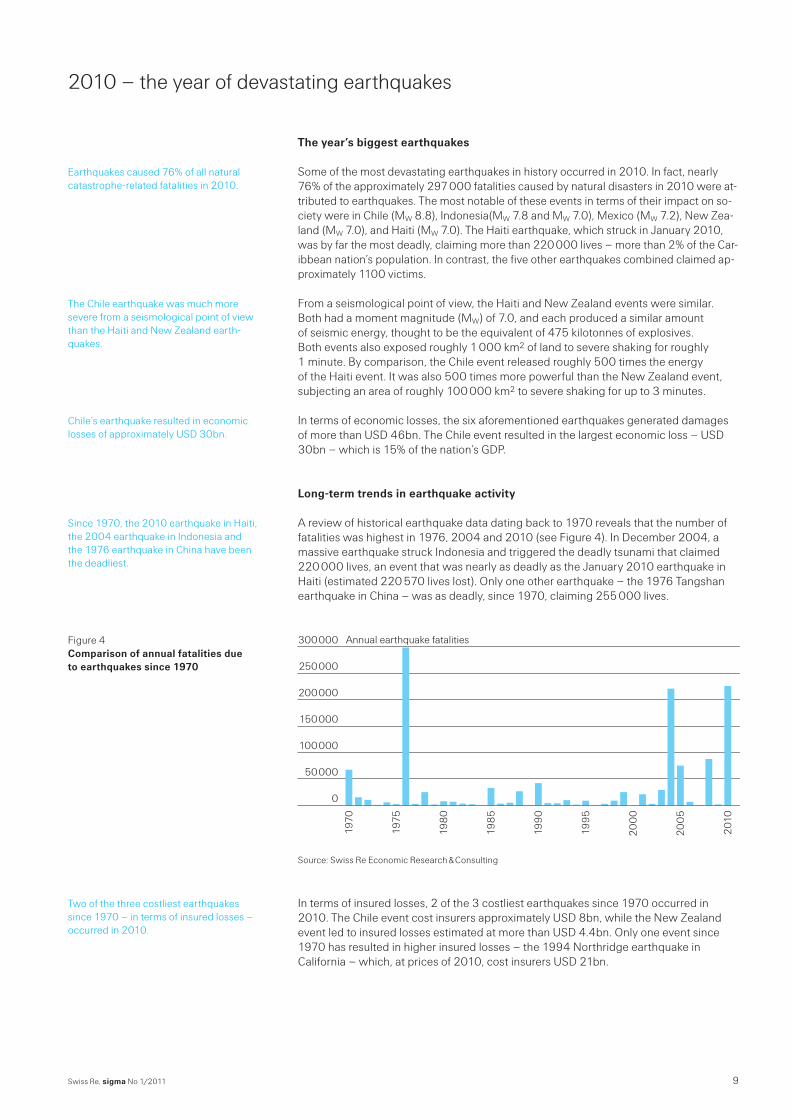
A review of historical earthquake data dating back to 1970 reveals that the number of fatalities was highest in 1976, 2004 and 2010 (see Figure 4). In December 2004, a massive earthquake struck Indonesia and triggered the deadly tsunami that claimed 220 000 lives, an event that was nearly as deadly as the January 2010 earthquake in Haiti (estimated 220 570 lives lost). Only one other earthquake – the 1976 Tangshan earthquake in China – was as deadly, since 1970, claiming 255 000 lives.
0
50 000
100 000
150 000
200 000
250 000
300 000
2010
200
5
200
0
199
5
199
0
198
5
198
0
1975
1970
Annual earthquake fatalities
Source: Swiss Re Economic Research & Consulting
In terms of insured losses, 2 of the 3 costliest earthquakes since 1970 occurred in 2010. The Chile event cost insurers approximately USD 8bn, while the New Zealand event led to insured losses estimated at more than USD 4.4bn. Only one event since 1970 has resulted in higher insured losses – the 1994 Northridge earthquake in California – which, at prices of 2010, cost insurers USD 21bn.
Earthquakes caused 76% of all natural catastrophe-related fatalities in 2010.
The Chile earthquake was much more severe from a seismological point of view than the Haiti and New Zealand earth-quakes.
Chile’s earthquake resulted in economic losses of approximately USD 30bn.
Since 1970, the 2010 earthquake in Haiti, the 2004 earthquake in Indonesia and the 1976 earthquake in China have been the deadliest.
Figure 4Comparison of annual fatalities due to earthquakes since 1970
Two of the three costliest earthquakes since 1970 – in terms of insured losses – occurred in 2010.
Swiss Re, sigma No 1/201110
2010 – the year of devastating earthquakes
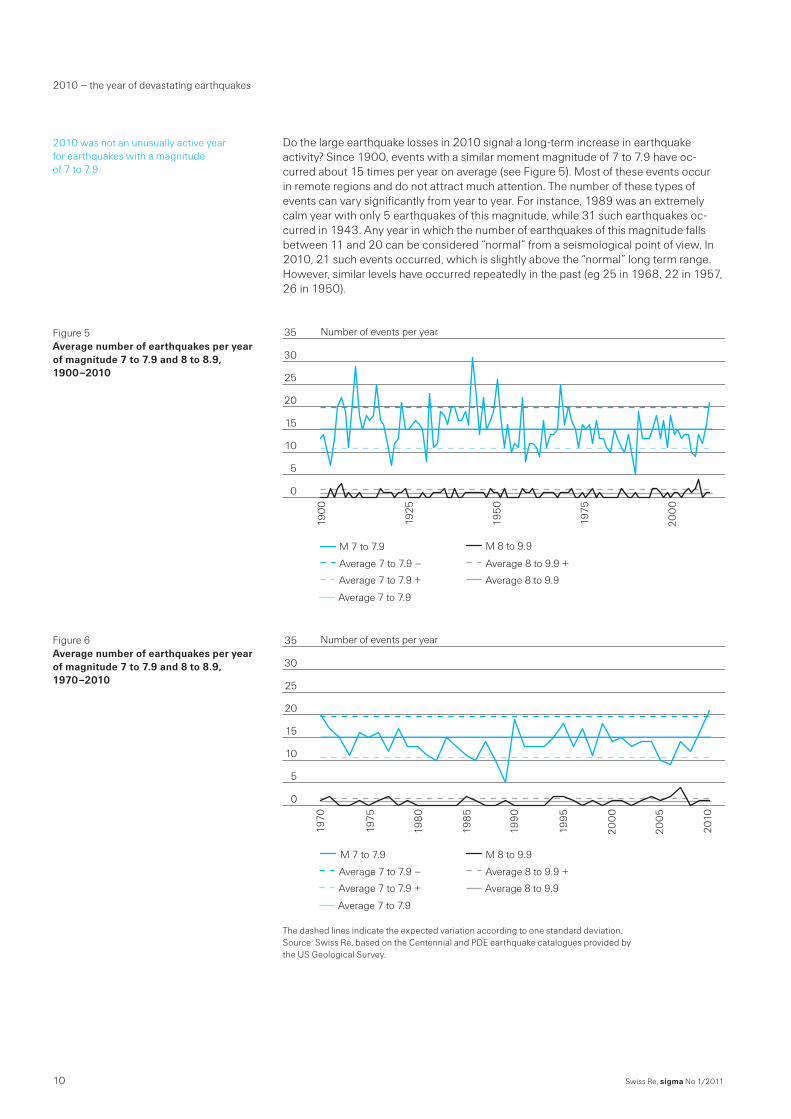
Do the large earthquake losses in 2010 signal a long-term increase in earthquake activity? Since 1900, events with a similar moment magnitude of 7 to 7.9 have oc-curred about 15 times per year on average (see Figure 5). Most of these events occur in remote regions and do not attract much attention. The number of these types of events can vary significantly from year to year. For instance, 1989 was an extremely calm year with only 5 earthquakes of this magnitude, while 31 such earthquakes oc-curred in 1943. Any year in which the number of earthquakes of this magnitude falls between 11 and 20 can be considered “normal” from a seismological point of view. In 2010, 21 such events occurred, which is slightly above the “normal” long term range. However, similar levels have occurred repeatedly in the past (eg 25 in 1968, 22 in 1957, 26 in 1950).
Number of events per year
0
5
10
15
20
25
30
35
M 8 to 9.9M 7 to 7.9
200
0
1975
195
0
1925
190
0
Average 7 to 7.9 –
Average 7 to 7.9 +
Average 7 to 7.9
Average 8 to 9.9 +
Average 8 to 9.9
Number of events per year
0
5
10
15
20
25
30
35
M 8 to 9.9M 7 to 7.9
2010
200
5
200
0
199
5
199
0
198
5
198
0
1975
1970
Average 7 to 7.9 –
Average 7 to 7.9 +
Average 7 to 7.9
Average 8 to 9.9 +
Average 8 to 9.9
The dashed lines indicate the expected variation according to one standard deviation. Source: Swiss Re, based on the Centennial and PDE earthquake catalogues provided by
the US Geological Survey.
2010 was not an unusually active year for earthquakes with a magnitude of 7 to 7.9.
Figure 5Average number of earthquakes per year of magnitude 7 to 7.9 and 8 to 8.9, 1900–2010
Figure 6Average number of earthquakes per year of magnitude 7 to 7.9 and 8 to 8.9, 1970–2010
11Swiss Re, sigma No 1/2011
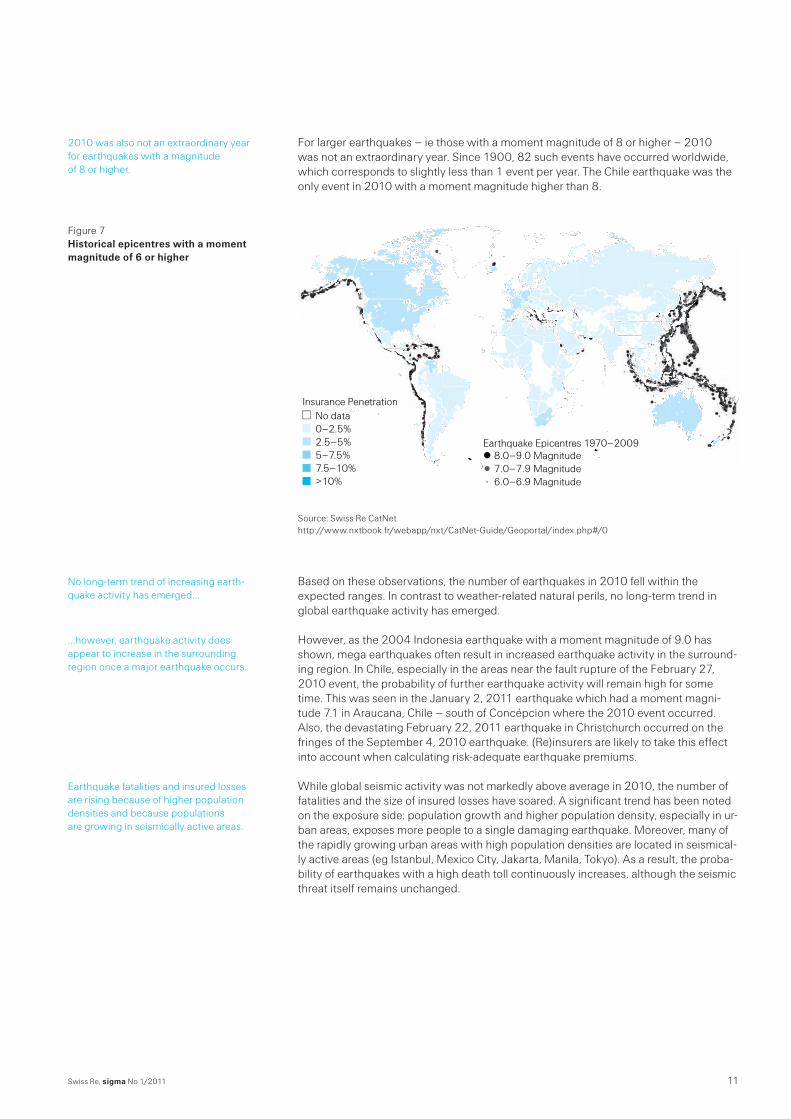
For larger earthquakes – ie those with a moment magnitude of 8 or higher – 2010 was not an extraordinary year. Since 1900, 82 such events have occurred worldwide, which corresponds to slightly less than 1 event per year. The Chile earthquake was the only event in 2010 with a moment magnitude higher than 8.
No data0–2.5%2.5–5%5–7.5%7.5–10%>10%
Insurance Penetration
Earthquake Epicentres 1970–20098.0–9.0 Magnitude7.0–7.9 Magnitude6.0–6.9 Magnitude
Source: Swiss Re CatNet http://www.nxtbook.fr/webapp/nxt/CatNet-Guide/Geoportal/index.php#/0
Based on these observations, the number of earthquakes in 2010 fell within the expected ranges. In contrast to weather-related natural perils, no long-term trend in global earthquake activity has emerged.
However, as the 2004 Indonesia earthquake with a moment magnitude of 9.0 has shown, mega earthquakes often result in increased earthquake activity in the surround-ing region. In Chile, especially in the areas near the fault rupture of the February 27, 2010 event, the probability of further earthquake activity will remain high for some time. This was seen in the January 2, 2011 earthquake which had a moment magni-tude 7.1 in Araucana, Chile – south of Concépcion where the 2010 event occurred. Also, the devastating February 22, 2011 earthquake in Christchurch occurred on the fringes of the September 4, 2010 earthquake. (Re)insurers are likely to take this effect into account when calculating risk-adequate earthquake premiums.
While global seismic activity was not markedly above average in 2010, the number of fatalities and the size of insured losses have soared. A significant trend has been noted on the exposure side: population growth and higher population density, especially in ur-ban areas, exposes more people to a single damaging earthquake. Moreover, many of the rapidly growing urban areas with high population densities are located in seismical-ly active areas (eg Istanbul, Mexico City, Jakarta, Manila, Tokyo). As a result, the proba-bility of earthquakes with a high death toll continuously increases, although the seismic threat itself remains unchanged.
2010 was also not an extraordinary year for earthquakes with a magnitude of 8 or higher.
Figure 7Historical epicentres with a moment magnitude of 6 or higher
No long-term trend of increasing earth-quake activity has emerged...
...however, earthquake activity does appear to increase in the surrounding region once a major earthquake occurs.
Earthquake fatalities and insured losses are rising because of higher population densities and because populations are growing in seismically active areas.
Swiss Re, sigma No 1/201112
While the deadliest earthquakes typically occur in emerging market countries, the cost-liest earthquakes in terms of insured losses occur much more often in industrialised re-gions. The costliest earthquakes for insurers over the past 20 years were in Northridge, California (1994), Concépcion, Chile (2010), Darfield, New Zealand (2010) and Kobe, Japan (1995). A few factors contributed to the large insurance and overall economic losses – eg property exposure and values are increasing around urban areas, leading to an increased potential for large financial losses from a single earthquake. Also, in many markets such as Chile, earthquake insurance penetration is increasing. Therefore, the insurance industry carries an increasing portion of the financial burden to the overall economy. And finally, the increasing technological com plexity of industrial processes makes damages to industrial facilities more difficult and costly to fix.
Fortunately, the death toll in industrialised countries has not risen along with insured earthquake losses. Continuously improved building standards that are strictly enforced, along with good infrastructure and efficient disaster relief efforts have helped mitigate the negative consequences of disasters in these countries. The relatively low number of deaths from the earthquakes in Chile and New Zealand in 2010 is certainly testimony to this.
Lessons learned
As with any large catastrophic event, the earthquakes in 2010 provided a unique learn-ing experience and offered invaluable insights. For example, effective loss prevention measures, such as earthquake-resistant building designs, are one of the key reasons why the Chile earthquake (562 deaths) did not result in more fatalities. This is striking given that the event, which had a moment magnitude of 8.8, was the second largest earthquake - in terms of seismic energy released - since 1970 and the sixth largest ever recorded worldwide. The existence of stringent building codes and their rigorous appli-cation in New Zealand proved very effective in saving lives in the September 4, 2010 earthquake. It is too early to determine to what degree this is also applicable to the Feb-ruary 22, 2011 earthquake in Christchurch.
The insurance industry has become a key enabler of post-disaster financing in industrial-ised countries. Insurers are paying more than one quarter of the total economic cost of the Chile event, and the proportion is even higher in New Zealand. The bulk of the insur-ance loss in Chile was carried by international (re)insurance companies. The correspond-ing inflow of capital serves to stimulate the Chilean economy via the reconstruction ef-forts without putting a large burden on the local insurance industry.
Meanwhile, the devastating event in Haiti reveals that proper prevention- and disaster management remains a challenge in emerging market countries. Given that these coun-tries have virtually no earthquake insurance market, what can be done to reduce the im-pact of a future earthquake on the population? More comprehensive and stringent building standards should be implemented during reconstruction, especially in hgh risk areas. Swiss Re developed an earthquake hazard map for Haiti immediately following the event that has served as the basis for such decisions (see Box).
The deadliest earthquakes tend to occur in emerging market countries, while the costliest earthquakes tend to occur in industrialised regions.
Improved building standards that are strictly enforced, solid infrastructures and disaster relief efforts help mitigate the negative effects of earth-quakes.
The earthquakes in Chile and New Zealand underscored the importance of stringent building codes that are strictly enforced.
Insurance has become a key pillar for post-disaster financing.
Proper prevention- and post- disaster manage-ment remains a challenge in the emerging market countries.
2010 – the year of devastating earthquakes
13Swiss Re, sigma No 1/2011
An earthquake hazard map for Haiti The powerful earthquake that struck Haiti on January 12 lasted less than a minute,
but the devastation it left behind will impact the country for years to come. To support reconstruction efforts, Swiss Re issued a preliminary seismic hazard map for Haiti based on the available data.
An estimated three million people in Haiti were affected by the earthquake, more than 220 000 people lost their lives, and hundreds of thousands were left without shelter af-ter their homes collapsed.
Haiti sits on a seismically active zone and has a history of earthquakes. Disaster can strike again at any time. Constructing an infrastructure that is better equipped to withstand future quakes will be critical to protecting lives and assets. Earthquake hazard maps are important tools to build this first line of defence. They highlight varying threat levels across Haiti and – as more refined data becomes available – help officials appro priately apply earthquake-resistant building standards for buildings, bridges, roads, utilities, and other structures.
Swiss Re’s seismic hazard map for Haiti was revised using its in-house risk models. It uses colour coding to illustrate the risk for potential ground shaking intensities across the country. The map is only indicative of current threat levels. It will be updated as soon as more in-depth research becomes available.
Features and potential use The preliminary hazard maps can be used to highlight regional hazard differences
within Haiti. The maps also allow comparisons of the hazard levels in Haiti to other regions of the world.
The maps contain more in-depth fault information than previously developed maps for the same region and therefore provide a more detailed picture of hazard varia-tions across Haiti. This includes preliminary seismological findings gathered after the 2010 Enriquillo fault event.
The maps can support reconstruction efforts in Haiti until more sophisticated maps are available.
For more details, refer to http://media.swissre.com/documents/ Earthquake_Haiti_Factsheet.pdf
For the insurance industry, the events in New Zealand and Chile highlighted the impor-tance of secondary loss agents – ie losses that do not directly result from the ground shaking. These losses significantly contribute to overall losses, but are not sufficiently considered in earthquake risk models. In Chile, the tsunami following the earthquake re-sulted in a large number of fatalities and led to significant insurance losses. In New Zea-land, an effect known as liquefaction played a major part in the unfolding of the overall financial loss. Liquefaction is a phenomenon whereby soil substantially loses strength in response to earthquake shaking, causing it to behave like a liquid. If liquefaction occurs under a building or a highway, severe structural damage will also usually occur. In New Zealand, many property owners not only have to repair or rebuild their homes, but also must restore the land itself. The cost of this is substantial and has exceeded the predic-tion of available earthquake risk models.
The size of insurance claims stemming from industrial exposure in Chile has also come as a surprise and warrants a review of the way the insurance industry assesses and mod-els certain industrial risks. This is especially true for business interruption covers, which compensate companies for loss of profits due to damages to their production facilities. Roughly half of the total insurance payout to industrial facilities in Chile was made for business interruption claims. In certain industry segments, such as pulp and paper, business interruption claims comprise two-thirds of total insurance claims. Large business interruption losses were also observed after previous earthquakes in Japan, where the electronics industry was impacted, and in Turkey, where the automotive industry filed sig-nificant business interruption claims.
Secondary loss agents have increased in importance due to the events in Chile and New Zealand.
The earthquake in Chile has highlighted the need for insurers to better assess and model certain industrial risks.
Swiss Re, sigma No 1/201114
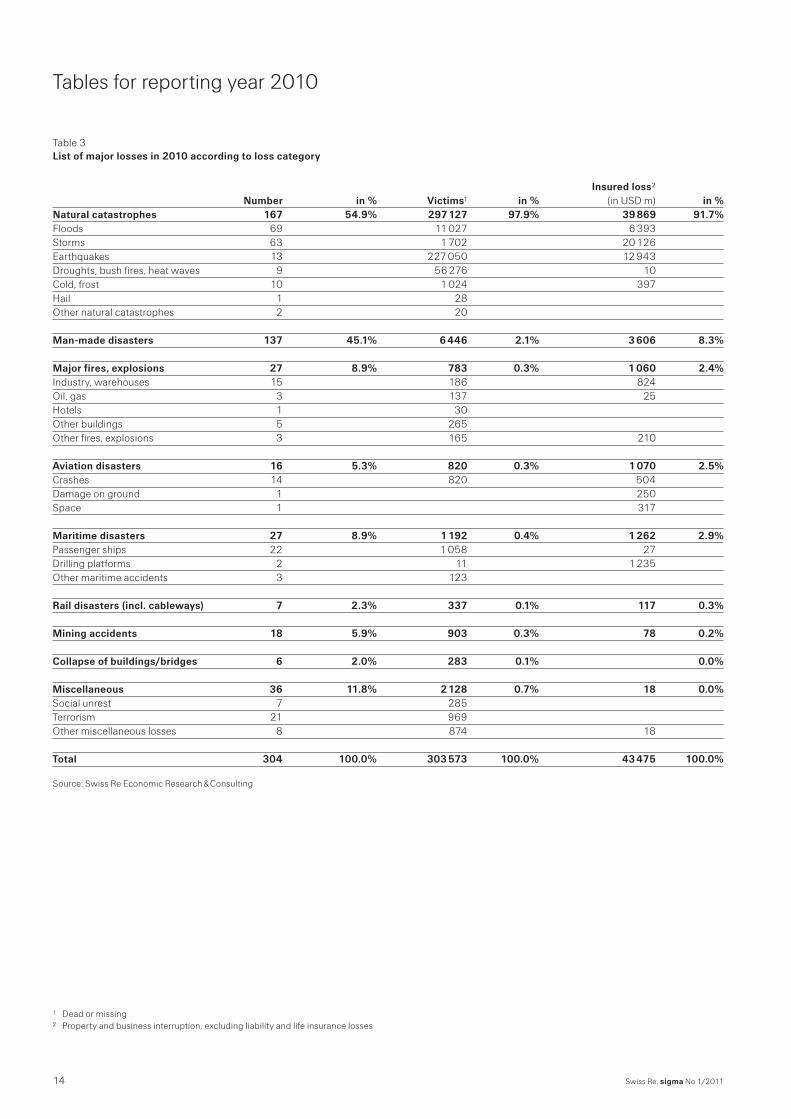
Table 3List of major losses in 2010 according to loss category
Insured loss2 Number in % Victims1 in % (in USD m)2 in %Natural catastrophes 167 54.9% 297 127 97.9% 39 869 91.7%Floods 69 11 027 6 393Storms 63 1 702 20 126Earthquakes 13 227 050 12 943Droughts, bush fires, heat waves 9 56 276 10Cold, frost 10 1 024 397Hail 1 28 Other natural catastrophes 2 20 Man-made disasters 137 45.1% 6 446 2.1% 3 606 8.3%
Major fires, explosions 27 8.9% 783 0.3% 1 060 2.4%Industry, warehouses 15 186 824 Oil, gas 3 137 25 Hotels 1 30 Other buildings 5 265 Other fires, explosions 3 165 210 Aviation disasters 16 5.3% 820 0.3% 1 070 2.5%Crashes 14 820 504 Damage on ground 1 250 Space 1 317 Maritime disasters 27 8.9% 1 192 0.4% 1 262 2.9%Passenger ships 22 1 058 27 Drilling platforms 2 11 1 235 Other maritime accidents 3 123 Rail disasters (incl. cableways) 7 2.3% 337 0.1% 117 0.3% Mining accidents 18 5.9% 903 0.3% 78 0.2% Collapse of buildings/bridges 6 2.0% 283 0.1% 0.0% Miscellaneous 36 11.8% 2 128 0.7% 18 0.0%Social unrest 7 285 Terrorism 21 969 Other miscellaneous losses 8 874 18 Total 304 100.0% 303 573 100.0% 43 475 100.0%
Source: Swiss Re Economic Research & Consulting
1 Dead or missing2 Property and business interruption, excluding liability and life insurance losses
Tables for reporting year 2010
15Swiss Re, sigma No 1/2011
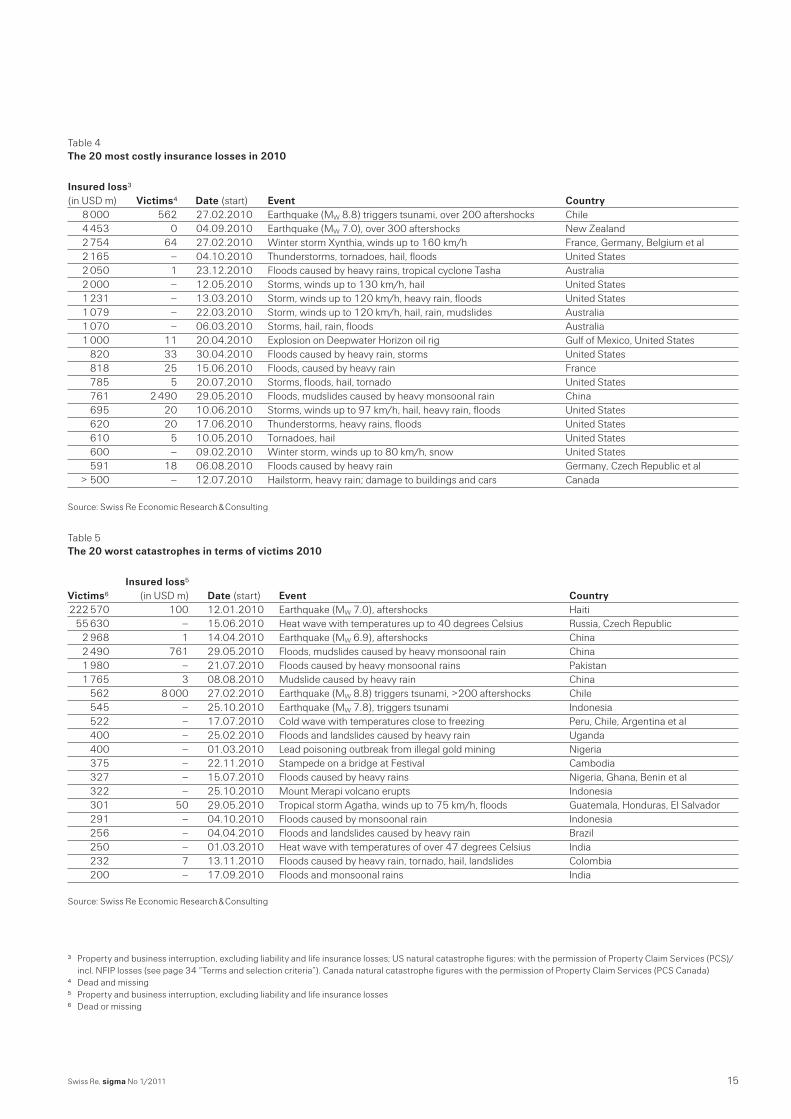
Table 4The 20 most costly insurance losses in 2010
Insured loss3 (in USD m) Victims4 Date (start) Event Country 8 000 562 27.02.2010 Earthquake (MW 8.8) triggers tsunami, over 200 aftershocks Chile 4 453 0 04.09.2010 Earthquake (MW 7.0), over 300 aftershocks New Zealand 2 754 64 27.02.2010 Winter storm Xynthia, winds up to 160 km/h France, Germany, Belgium et al 2 165 – 04.10.2010 Thunderstorms, tornadoes, hail, floods United States 2 050 1 23.12.2010 Floods caused by heavy rains, tropical cyclone Tasha Australia 2 000 – 12.05.2010 Storms, winds up to 130 km/h, hail United States 1 231 – 13.03.2010 Storm, winds up to 120 km/h, heavy rain, floods United States 1 079 – 22.03.2010 Storm, winds up to 120 km/h, hail, rain, mudslides Australia 1 070 – 06.03.2010 Storms, hail, rain, floods Australia 1 000 11 20.04.2010 Explosion on Deepwater Horizon oil rig Gulf of Mexico, United States 820 33 30.04.2010 Floods caused by heavy rain, storms United States 818 25 15.06.2010 Floods, caused by heavy rain France 785 5 20.07.2010 Storms, floods, hail, tornado United States 761 2 490 29.05.2010 Floods, mudslides caused by heavy monsoonal rain China 695 20 10.06.2010 Storms, winds up to 97 km/h, hail, heavy rain, floods United States 620 20 17.06.2010 Thunderstorms, heavy rains, floods United States 610 5 10.05.2010 Tornadoes, hail United States 600 – 09.02.2010 Winter storm, winds up to 80 km/h, snow United States 591 18 06.08.2010 Floods caused by heavy rain Germany, Czech Republic et al > 500 – 12.07.2010 Hailstorm, heavy rain; damage to buildings and cars Canada
Source: Swiss Re Economic Research & Consulting
Table 5The 20 worst catastrophes in terms of victims 2010
Insured loss5 Victims6 (in USD m) Date (start) Event Country 222 570 100 12.01.2010 Earthquake (MW 7.0), aftershocks Haiti 55 630 – 15.06.2010 Heat wave with temperatures up to 40 degrees Celsius Russia, Czech Republic 2 968 1 14.04.2010 Earthquake (MW 6.9), aftershocks China 2 490 761 29.05.2010 Floods, mudslides caused by heavy monsoonal rain China 1 980 – 21.07.2010 Floods caused by heavy monsoonal rains Pakistan 1 765 3 08.08.2010 Mudslide caused by heavy rain China 562 8 000 27.02.2010 Earthquake (MW 8.8) triggers tsunami, >200 aftershocks Chile 545 – 25.10.2010 Earthquake (MW 7.8), triggers tsunami Indonesia 522 – 17.07.2010 Cold wave with temperatures close to freezing Peru, Chile, Argentina et al 400 – 25.02.2010 Floods and landslides caused by heavy rain Uganda 400 – 01.03.2010 Lead poisoning outbreak from illegal gold mining Nigeria 375 – 22.11.2010 Stampede on a bridge at Festival Cambodia 327 – 15.07.2010 Floods caused by heavy rains Nigeria, Ghana, Benin et al 322 – 25.10.2010 Mount Merapi volcano erupts Indonesia 301 50 29.05.2010 Tropical storm Agatha, winds up to 75 km/h, floods Guatemala, Honduras, El Salvador 291 – 04.10.2010 Floods caused by monsoonal rain Indonesia 256 – 04.04.2010 Floods and landslides caused by heavy rain Brazil 250 – 01.03.2010 Heat wave with temperatures of over 47 degrees Celsius India 232 7 13.11.2010 Floods caused by heavy rain, tornado, hail, landslides Colombia 200 – 17.09.2010 Floods and monsoonal rains India
Source: Swiss Re Economic Research & Consulting
3 Property and business interruption, excluding liability and life insurance losses; US natural catastrophe figures: with the permission of Property Claim Services (PCS)/incl. NFIP losses (see page 34 “Terms and selection criteria”). Canada natural catastrophe figures with the permission of Property Claim Services (PCS Canada)
4 Dead and missing5 Property and business interruption, excluding liability and life insurance losses6 Dead or missing
Swiss Re, sigma No 1/201116
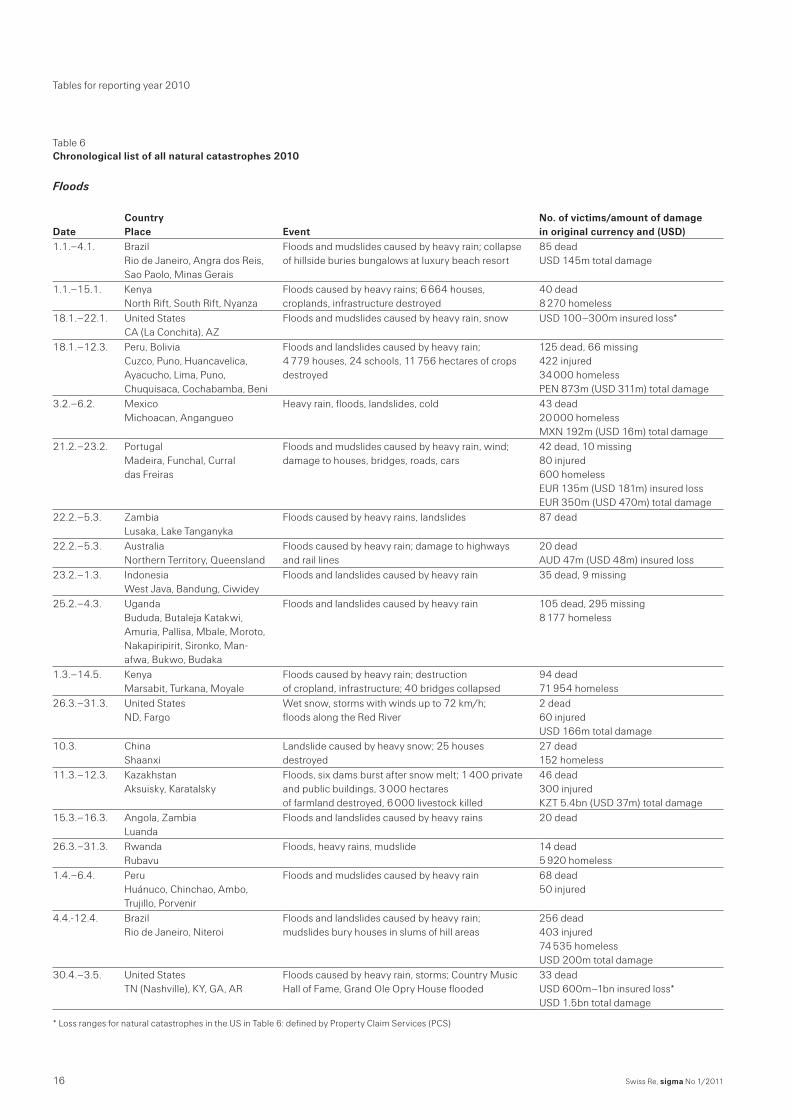
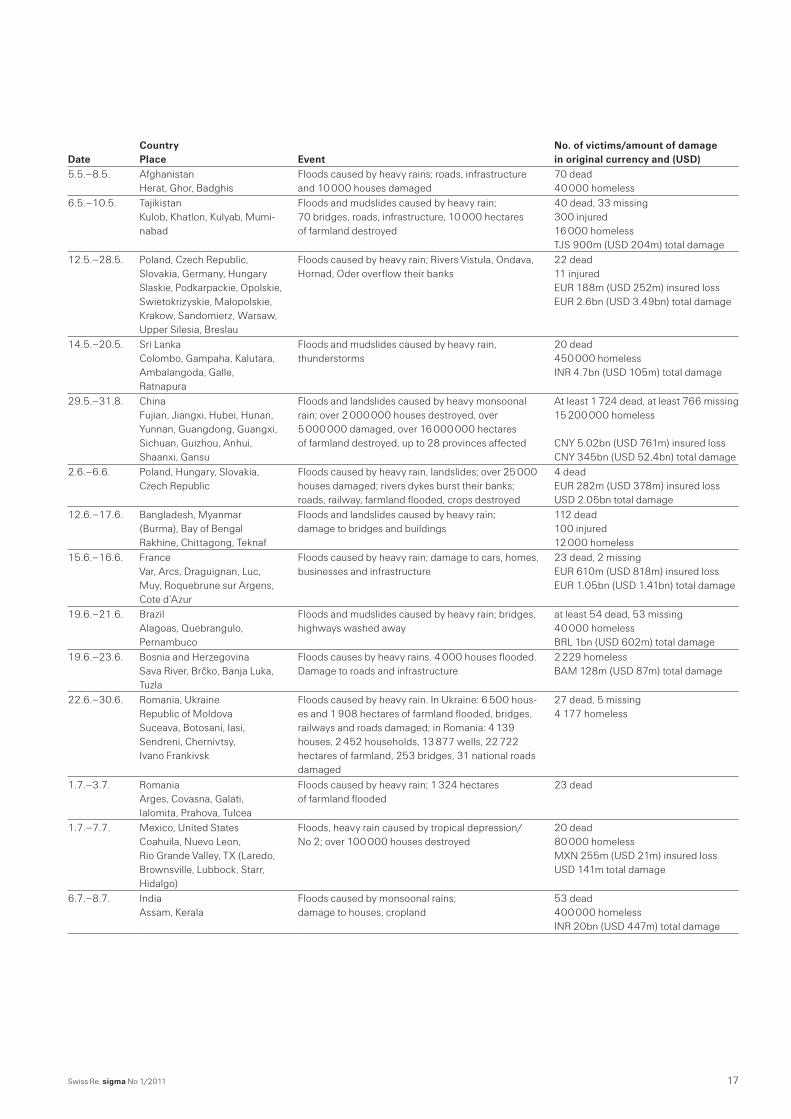
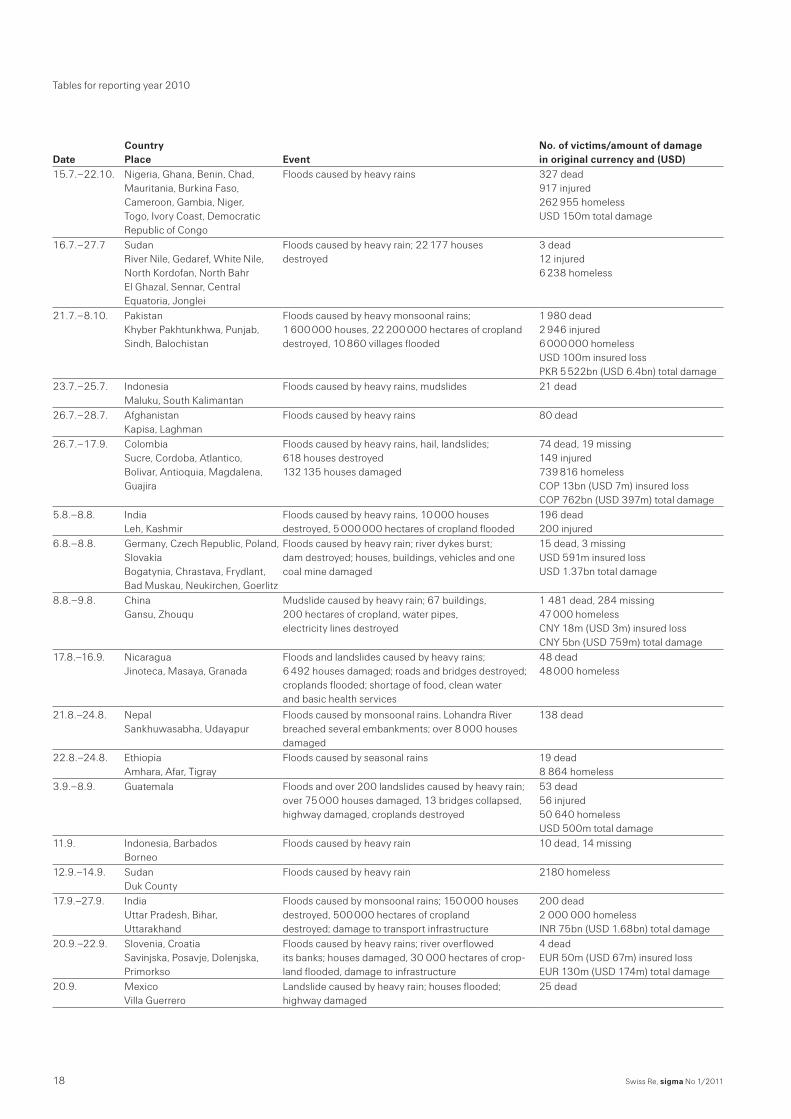
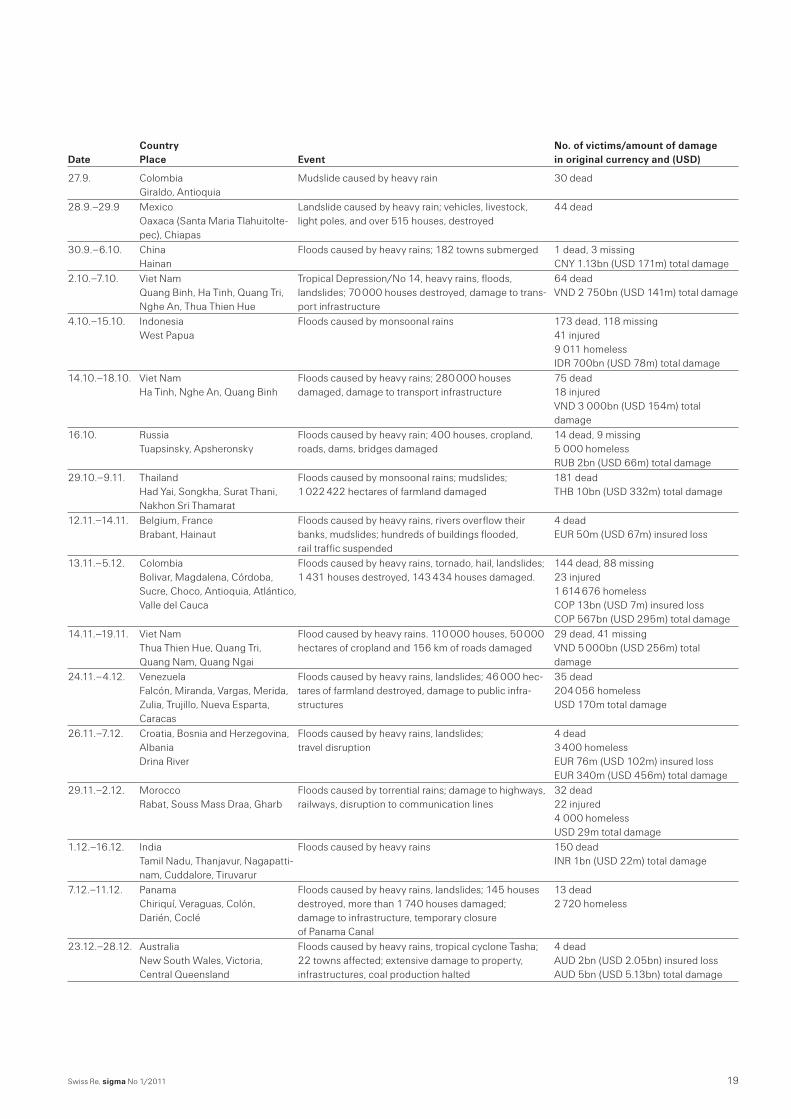
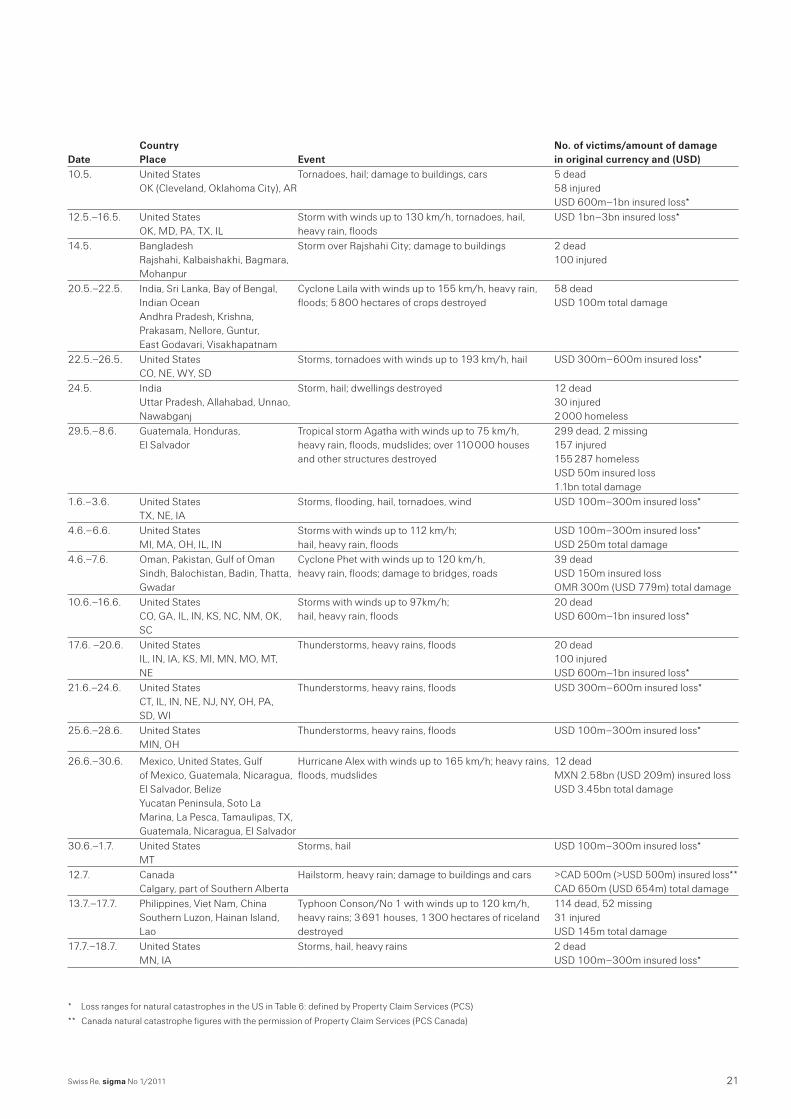
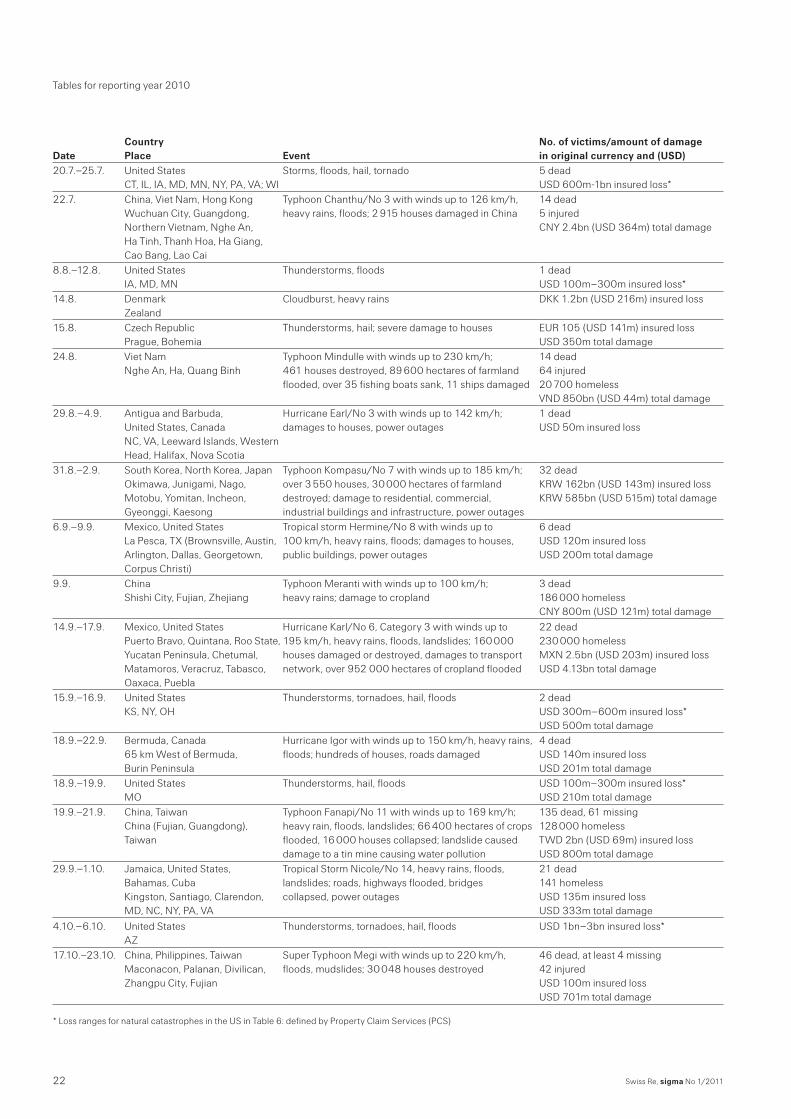
Table 6Chronological list of all natural catastrophes 2010
Floods
Date
Country Place
Event
No. of victims/amount of damage in original currency and (USD)
1.1.–4.1.
BrazilRio de Janeiro, Angra dos Reis, Sao Paolo, Minas Gerais
Floods and mudslides caused by heavy rain; collapse of hillside buries bungalows at luxury beach resort
85 deadUSD 145m total damage
1.1.–15.1. KenyaNorth Rift, South Rift, Nyanza
Floods caused by heavy rains; 6 664 houses, croplands, infrastructure destroyed
40 dead8 270 homeless
18.1.–22.1. United States CA (La Conchita), AZ
Floods and mudslides caused by heavy rain, snow USD 100–300m insured loss*
18.1.–12.3.
Peru, BoliviaCuzco, Puno, Huancavelica, Ayacucho, Lima, Puno, Chuquisaca, Cochabamba, Beni
Floods and landslides caused by heavy rain; 4 779 houses, 24 schools, 11 756 hectares of crops destroyed
125 dead, 66 missing 422 injured 34 000 homeless PEN 873m (USD 311m) total damage
3.2.–6.2.
Mexico Michoacan, Angangueo
Heavy rain, floods, landslides, cold
43 dead 20 000 homeless MXN 192m (USD 16m) total damage
21.2.–23.2.
Portugal Madeira, Funchal, Curral das Freiras
Floods and mudslides caused by heavy rain, wind; damage to houses, bridges, roads, cars
42 dead, 10 missing 80 injured 600 homeless EUR 135m (USD 181m) insured loss EUR 350m (USD 470m) total damage
22.2.–5.3. Zambia Lusaka, Lake Tanganyka
Floods caused by heavy rains, landslides 87 dead
22.2.–5.3. Australia Northern Territory, Queensland
Floods caused by heavy rain; damage to highways and rail lines
20 dead AUD 47m (USD 48m) insured loss
23.2.–1.3. Indonesia West Java, Bandung, Ciwidey
Floods and landslides caused by heavy rain 35 dead, 9 missing
25.2.–4.3.
Uganda Bududa, Butaleja Katakwi, Amuria, Pallisa, Mbale, Moroto, Nakapiripirit, Sironko, Man-afwa, Bukwo, Budaka
Floods and landslides caused by heavy rain
105 dead, 295 missing 8 177 homeless
1.3.–14.5. Kenya Marsabit, Turkana, Moyale
Floods caused by heavy rain; destruction of cropland, infrastructure; 40 bridges collapsed
94 dead 71 954 homeless
26.3.–31.3.
United States ND, Fargo
Wet snow, storms with winds up to 72 km/h; floods along the Red River
2 dead 60 injured USD 166m total damage
10.3. China Shaanxi
Landslide caused by heavy snow; 25 houses destroyed
27 dead 152 homeless
11.3.–12.3.
Kazakhstan Aksuisky, Karatalsky
Floods, six dams burst after snow melt; 1 400 private and public buildings, 3 000 hectares of farmland destroyed, 6 000 livestock killed
46 dead 300 injured KZT 5.4bn (USD 37m) total damage
15.3.–16.3. Angola, Zambia Luanda
Floods and landslides caused by heavy rains 20 dead
26.3.–31.3. Rwanda Rubavu
Floods, heavy rains, mudslide 14 dead 5 920 homeless
1.4.–6.4.
Peru Huánuco, Chinchao, Ambo, Trujillo, Porvenir
Floods and mudslides caused by heavy rain
68 dead 50 injured
4.4.-12.4.
Brazil Rio de Janeiro, Niteroi
Floods and landslides caused by heavy rain; mudslides bury houses in slums of hill areas
256 dead 403 injured 74 535 homeless USD 200m total damage
30.4.–3.5.
United States TN (Nashville), KY, GA, AR
Floods caused by heavy rain, storms; Country Music Hall of Fame, Grand Ole Opry House flooded
33 dead USD 600m–1bn insured loss* USD 1.5bn total damage
Tables for reporting year 2010
* Loss ranges for natural catastrophes in the US in Table 6: defined by Property Claim Services (PCS)
17Swiss Re, sigma No 1/2011
Date
Country Place
Event
No. of victims/amount of damage in original currency and (USD)
5.5.–8.5. Afghanistan Herat, Ghor, Badghis
Floods caused by heavy rains; roads, infrastructure and 10 000 houses damaged
70 dead 40 000 homeless
6.5.–10.5.
Tajikistan Kulob, Khatlon, Kulyab, Mumi-nabad
Floods and mudslides caused by heavy rain; 70 bridges, roads, infrastructure, 10 000 hectares of farmland destroyed
40 dead, 33 missing 300 injured 16 000 homeless TJS 900m (USD 204m) total damage
12.5.–28.5.
Poland, Czech Republic, Slovakia, Germany, Hungary Slaskie, Podkarpackie, Opols kie, Swietokrizyskie, Malopols kie, Krakow, Sandomierz, Warsaw, Upper Silesia, Breslau
Floods caused by heavy rain; Rivers Vistula, Ondava, Hornad, Oder overflow their banks
22 dead 11 injured EUR 188m (USD 252m) insured loss EUR 2.6bn (USD 3.49bn) total damage
14.5.–20.5.
Sri Lanka Colombo, Gampaha, Kalutara, Ambalangoda, Galle, Ratnapura
Floods and mudslides caused by heavy rain, thunderstorms
20 dead 450 000 homeless INR 4.7bn (USD 105m) total damage
29.5.–31.8.
China Fujian, Jiangxi, Hubei, Hunan, Yunnan, Guangdong, Guangxi, Sichuan, Guizhou, Anhui, Shaanxi, Gansu
Floods and landslides caused by heavy monsoonal rain; over 2 000 000 houses destroyed, over 5 000 000 damaged, over 16 000 000 hectares of farmland destroyed, up to 28 provinces affected
At least 1 724 dead, at least 766 missing 15 200 000 homeless CNY 5.02bn (USD 761m) insured loss CNY 345bn (USD 52.4bn) total damage
2.6.–6.6.
Poland, Hungary, Slovakia, Czech Republic
Floods caused by heavy rain, landslides; over 25 000 houses damaged; rivers dykes burst their banks; roads, railway, farmland flooded, crops destroyed
4 dead EUR 282m (USD 378m) insured loss USD 2.05bn total damage
12.6.–17.6.
Bangladesh, Myanmar (Burma), Bay of Bengal Rakhine, Chittagong, Teknaf
Floods and landslides caused by heavy rain; damage to bridges and buildings
112 dead 100 injured 12 000 homeless
15.6.–16.6.
France Var, Arcs, Draguignan, Luc, Muy, Roquebrune sur Argens, Cote d’Azur
Floods caused by heavy rain; damage to cars, homes, businesses and infrastructure
23 dead, 2 missing EUR 610m (USD 818m) insured loss EUR 1.05bn (USD 1.41bn) total damage
19.6.–21.6.
Brazil Alagoas, Quebrangulo, Pernambuco
Floods and mudslides caused by heavy rain; bridges, highways washed away
at least 54 dead, 53 missing 40 000 homeless BRL 1bn (USD 602m) total damage
19.6.–23.6.
Bosnia and Herzegovina Sava River, Brčko, Banja Luka, Tuzla
Floods causes by heavy rains. 4 000 houses flooded. Damage to roads and infrastructure
2 229 homeless BAM 128m (USD 87m) total damage
22.6.–30.6.
Romania, Ukraine Republic of Moldova Suceava, Botosani, Iasi, Sendreni, Chernivtsy, Ivano Frankivsk
Floods caused by heavy rain. In Ukraine: 6 500 hous-es and 1 908 hectares of farmland flooded, bridges, railways and roads damaged; in Romania: 4 139 houses, 2 452 households, 13 877 wells, 22 722 hectares of farmland, 253 bridges, 31 national roads damaged
27 dead, 5 missing 4 177 homeless
1.7.–3.7.
Romania Arges, Covasna, Galati, Ialomita, Prahova, Tulcea
Floods caused by heavy rain; 1 324 hectares of farmland flooded
23 dead
1.7.–7.7.
Mexico, United States Coahuila, Nuevo Leon, Rio Grande Valley, TX (Laredo, Brownsville, Lubbock, Starr, Hidalgo)
Floods, heavy rain caused by tropical depression/ No 2; over 100 000 houses destroyed
20 dead 80 000 homeless MXN 255m (USD 21m) insured loss USD 141m total damage
6.7.–8.7.
India Assam, Kerala
Floods caused by monsoonal rains; damage to houses, cropland
53 dead 400 000 homeless INR 20bn (USD 447m) total damage
Swiss Re, sigma No 1/201118
Tables for reporting year 2010
Date
Country Place
Event
No. of victims/amount of damage in original currency and (USD)
15.7.–22.10.
Nigeria, Ghana, Benin, Chad, Mauritania, Burkina Faso, Cameroon, Gambia, Niger, Togo, Ivory Coast, Democratic Republic of Congo
Floods caused by heavy rains
327 dead 917 injured 262 955 homeless USD 150m total damage
16.7.–27.7
Sudan River Nile, Gedaref, White Nile, North Kordofan, North Bahr El Ghazal, Sennar, Central Equatoria, Jonglei
Floods caused by heavy rain; 22 177 houses destroyed
3 dead 12 injured 6 238 homeless
21.7.–8.10.
Pakistan Khyber Pakhtunkhwa, Punjab, Sindh, Balochistan
Floods caused by heavy monsoonal rains; 1 600 000 houses, 22 200 000 hectares of cropland destroyed, 10 860 villages flooded
1 980 dead 2 946 injured 6 000 000 homeless USD 100m insured loss PKR 5 522bn (USD 6.4bn) total damage
23.7.–25.7. Indonesia Maluku, South Kalimantan
Floods caused by heavy rains, mudslides 21 dead
26.7.–28.7. Afghanistan Kapisa, Laghman
Floods caused by heavy rains 80 dead
26.7.–17.9.
Colombia Sucre, Cordoba, Atlantico, Bolivar, Antioquia, Magdalena, Guajira
Floods caused by heavy rains, hail, landslides; 618 houses destroyed 132 135 houses damaged
74 dead, 19 missing 149 injured 739 816 homeless COP 13bn (USD 7m) insured loss COP 762bn (USD 397m) total damage
5.8.–8.8. India Leh, Kashmir
Floods caused by heavy rains, 10 000 houses destroyed, 5 000 000 hectares of cropland flooded
196 dead 200 injured
6.8.–8.8.
Germany, Czech Republic, Poland, Slovakia Bogatynia, Chrastava, Frydlant, Bad Muskau, Neukirchen, Goerlitz
Floods caused by heavy rain; river dykes burst; dam destroyed; houses, buildings, vehicles and one coal mine damaged
15 dead, 3 missing USD 591m insured loss USD 1.37bn total damage
8.8.–9.8.
China Gansu, Zhouqu
Mudslide caused by heavy rain; 67 buildings, 200 hectares of cropland, water pipes, electricity lines destroyed
1 481 dead, 284 missing 47 000 homeless CNY 18m (USD 3m) insured loss CNY 5bn (USD 759m) total damage
17.8.–16.9.
Nicaragua Jinoteca, Masaya, Granada
Floods and landslides caused by heavy rains; 6 492 houses damaged; roads and bridges destroyed; croplands flooded; shortage of food, clean water and basic health services
48 dead 48 000 homeless
21.8.–24.8.
Nepal Sankhuwasabha, Udayapur
Floods caused by monsoonal rains. Lohandra River breached several embankments; over 8 000 houses damaged
138 dead
22.8.–24.8. Ethiopia Amhara, Afar, Tigray
Floods caused by seasonal rains 19 dead 8 864 homeless
3.9.–8.9.
Guatemala
Floods and over 200 landslides caused by heavy rain; over 75 000 houses damaged, 13 bridges collapsed, highway damaged, croplands destroyed
53 dead 56 injured 50 640 homeless USD 500m total damage
11.9. Indonesia, Barbados Borneo
Floods caused by heavy rain 10 dead, 14 missing
12.9.–14.9. Sudan Duk County
Floods caused by heavy rain 2180 homeless
17.9.–27.9.
India Uttar Pradesh, Bihar, Uttarakhand
Floods caused by monsoonal rains; 150 000 houses destroyed, 500 000 hectares of cropland destroyed; damage to transport infrastructure
200 dead 2 000 000 homeless INR 75bn (USD 1.68bn) total damage
20.9.–22.9.
Slovenia, Croatia Savinjska, Posavje, Dolenjska, Primorkso
Floods caused by heavy rains; river overflowed its banks; houses damaged, 30 000 hectares of crop-land flooded, damage to infrastructure
4 dead EUR 50m (USD 67m) insured loss EUR 130m (USD 174m) total damage
20.9. Mexico Villa Guerrero
Landslide caused by heavy rain; houses flooded; highway damaged
25 dead
19Swiss Re, sigma No 1/2011
Date
Country Place
Event
No. of victims/amount of damage in original currency and (USD)
27.9. Colombia Giraldo, Antioquia
Mudslide caused by heavy rain 30 dead
28.9.–29.9
Mexico Oaxaca (Santa Maria Tlahuitolte-pec), Chiapas
Landslide caused by heavy rain; vehicles, livestock, light poles, and over 515 houses, destroyed
44 dead
30.9.–6.10. China Hainan
Floods caused by heavy rains; 182 towns submerged 1 dead, 3 missing CNY 1.13bn (USD 171m) total damage
2.10.–7.10.
Viet Nam Quang Binh, Ha Tinh, Quang Tri, Nghe An, Thua Thien Hue
Tropical Depression/No 14, heavy rains, floods, landslides; 70 000 houses destroyed, damage to trans-port infrastructure
64 dead VND 2 750bn (USD 141m) total damage
4.10.–15.10.
Indonesia West Papua
Floods caused by monsoonal rains
173 dead, 118 missing 41 injured 9 011 homeless IDR 700bn (USD 78m) total damage
14.10.–18.10.
Viet Nam Ha Tinh, Nghe An, Quang Binh
Floods caused by heavy rains; 280 000 houses damaged, damage to transport infrastructure
75 dead 18 injured VND 3 000bn (USD 154m) total damage
16.10.
Russia Tuapsinsky, Apsheronsky
Floods caused by heavy rain; 400 houses, cropland, roads, dams, bridges damaged
14 dead, 9 missing 5 000 homeless RUB 2bn (USD 66m) total damage
29.10.–9.11.
Thailand Had Yai, Songkha, Surat Thani, Nakhon Sri Thamarat
Floods caused by monsoonal rains; mudslides; 1 022 422 hectares of farmland damaged
181 dead THB 10bn (USD 332m) total damage
12.11.–14.11.
Belgium, France Brabant, Hainaut
Floods caused by heavy rains, rivers overflow their banks, mudslides; hundreds of buildings flooded, rail traffic suspended
4 dead EUR 50m (USD 67m) insured loss
13.11.–5.12.
Colombia Bolivar, Magdalena, Córdoba, Sucre, Choco, Antioquia, Atlántico, Valle del Cauca
Floods caused by heavy rains, tornado, hail, landslides; 1 431 houses destroyed, 143 434 houses damaged.
144 dead, 88 missing 23 injured 1 614 676 homeless COP 13bn (USD 7m) insured loss COP 567bn (USD 295m) total damage
14.11.–19.11.
Viet Nam Thua Thien Hue, Quang Tri, Quang Nam, Quang Ngai
Flood caused by heavy rains. 110 000 houses, 50 000 hectares of cropland and 156 km of roads damaged
29 dead, 41 missing VND 5 000bn (USD 256m) total damage
24.11.–4.12.
Venezuela Falcón, Miranda, Vargas, Merida, Zulia, Trujillo, Nueva Esparta, Caracas
Floods caused by heavy rains, landslides; 46 000 hec-tares of farmland destroyed, damage to public infra-structures
35 dead 204 056 homeless USD 170m total damage
26.11.–7.12.
Croatia, Bosnia and Herzegovina, Albania Drina River
Floods caused by heavy rains, landslides; travel disruption
4 dead 3 400 homeless EUR 76m (USD 102m) insured loss EUR 340m (USD 456m) total damage
29.11.–2.12.
Morocco Rabat, Souss Mass Draa, Gharb
Floods caused by torrential rains; damage to highways, railways, disruption to communication lines
32 dead 22 injured 4 000 homeless USD 29m total damage
1.12.–16.12.
India Tamil Nadu, Thanjavur, Nagapatti-nam, Cuddalore, Tiruvarur
Floods caused by heavy rains
150 dead INR 1bn (USD 22m) total damage
7.12.–11.12.
Panama Chiriquí, Veraguas, Colón, Darién, Coclé
Floods caused by heavy rains, landslides; 145 houses destroyed, more than 1 740 houses damaged; damage to infrastructure, temporary closure of Panama Canal
13 dead 2 720 homeless
23.12.–28.12.
Australia New South Wales, Victoria, Central Queensland
Floods caused by heavy rains, tropical cyclone Tasha; 22 towns affected; extensive damage to property, infrastructures, coal production halted
4 dead AUD 2bn (USD 2.05bn) insured loss AUD 5bn (USD 5.13bn) total damage
Swiss Re, sigma No 1/201120
Tables for reporting year 2010
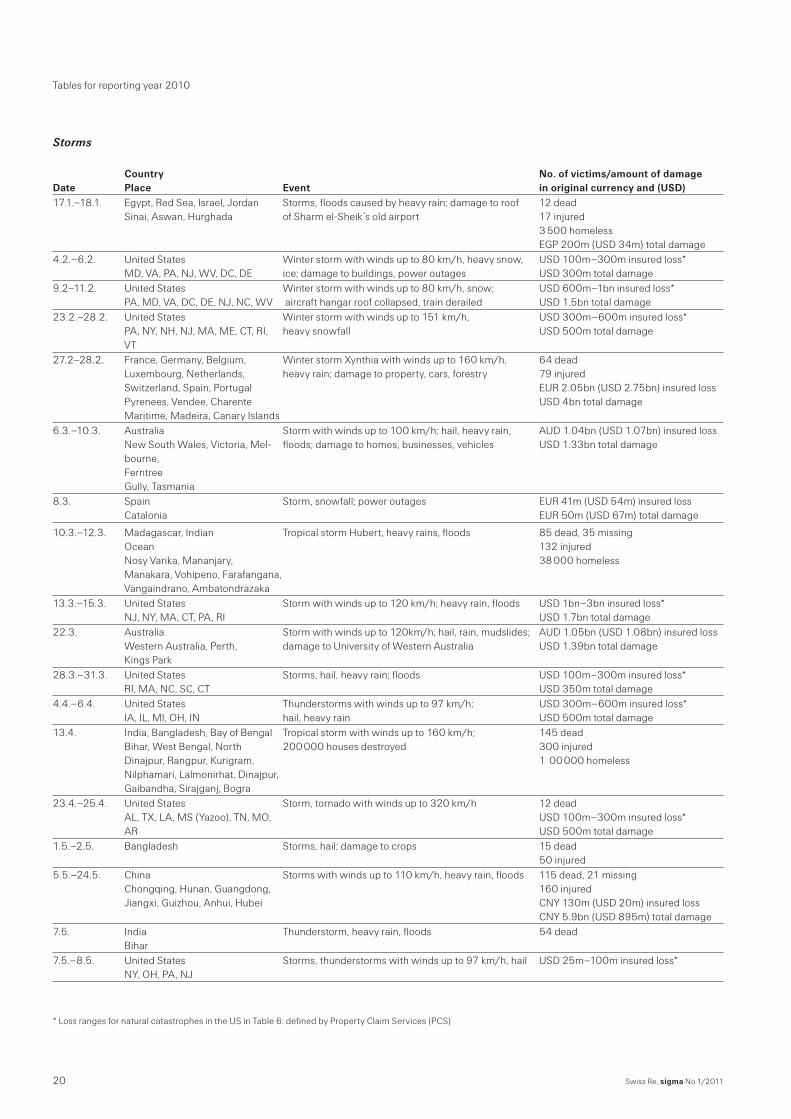
Storms
Date
Country Place
Event
No. of victims/amount of damage in original currency and (USD)
17.1.–18.1.
Egypt, Red Sea, Israel, Jordan Sinai, Aswan, Hurghada
Storms, floods caused by heavy rain; damage to roof of Sharm el-Sheik’s old airport
12 dead 17 injured 3 500 homeless EGP 200m (USD 34m) total damage
4.2.–6.2. United States MD, VA, PA, NJ, WV, DC, DE
Winter storm with winds up to 80 km/h, heavy snow, ice; damage to buildings, power outages
USD 100m–300m insured loss* USD 300m total damage
9.2–11.2. United States PA, MD, VA, DC, DE, NJ, NC, WV
Winter storm with winds up to 80 km/h, snow; aircraft hangar roof collapsed, train derailed
USD 600m–1bn insured loss* USD 1.5bn total damage
23.2.–28.2.
United States PA, NY, NH, NJ, MA, ME, CT, RI, VT
Winter storm with winds up to 151 km/h, heavy snowfall
USD 300m–600m insured loss* USD 500m total damage
27.2–28.2.
France, Germany, Belgium, Luxembourg, Netherlands, Switzerland, Spain, Portugal Pyrenees, Vendee, Charente Maritime, Madeira, Canary Islands
Winter storm Xynthia with winds up to 160 km/h, heavy rain; damage to property, cars, forestry
64 dead 79 injured EUR 2.05bn (USD 2.75bn) insured loss USD 4bn total damage
6.3.–10.3.
Australia New South Wales, Victoria, Mel-bourne, Ferntree Gully, Tasmania
Storm with winds up to 100 km/h; hail, heavy rain, floods; damage to homes, businesses, vehicles
AUD 1.04bn (USD 1.07bn) insured loss USD 1.33bn total damage
8.3. Spain Catalonia
Storm, snowfall; power outages EUR 41m (USD 54m) insured loss EUR 50m (USD 67m) total damage
10.3.–12.3.
Madagascar, Indian Ocean Nosy Varika, Mananjary, Manakara, Vohipeno, Farafangana, Vangaindrano, Ambatondrazaka
Tropical storm Hubert, heavy rains, floods
85 dead, 35 missing 132 injured 38 000 homeless
13.3.–15.3. United States NJ, NY, MA, CT, PA, RI
Storm with winds up to 120 km/h; heavy rain, floods USD 1bn–3bn insured loss* USD 1.7bn total damage
22.3.
Australia Western Australia, Perth, Kings Park
Storm with winds up to 120km/h; hail, rain, mudslides; damage to University of Western Australia
AUD 1.05bn (USD 1.08bn) insured loss USD 1.39bn total damage
28.3.–31.3. United States RI, MA, NC, SC, CT
Storms, hail, heavy rain; floods USD 100m–300m insured loss* USD 350m total damage
4.4.–6.4. United States IA, IL, MI, OH, IN
Thunderstorms with winds up to 97 km/h; hail, heavy rain
USD 300m–600m insured loss* USD 500m total damage
13.4.
India, Bangladesh, Bay of Bengal Bihar, West Bengal, North Dinajpur, Rangpur, Kurigram, Nilphamari, Lalmonirhat, Dinajpur, Gaibandha, Sirajganj, Bogra
Tropical storm with winds up to 160 km/h; 200 000 houses destroyed
145 dead 300 injured 1 00 000 homeless
23.4.–25.4.
United StatesAL, TX, LA, MS (Yazoo), TN, MO, AR
Storm, tornado with winds up to 320 km/h
12 deadUSD 100m–300m insured loss* USD 500m total damage
1.5.–2.5. Bangladesh Storms, hail; damage to crops 15 dead 50 injured
5.5.–24.5.
China Chongqing, Hunan, Guangdong, Jiangxi, Guizhou, Anhui, Hubei
Storms with winds up to 110 km/h, heavy rain, floods
115 dead, 21 missing 160 injured CNY 130m (USD 20m) insured loss CNY 5.9bn (USD 895m) total damage
7.5. India Bihar
Thunderstorm, heavy rain, floods 54 dead
7.5.–8.5. United States NY, OH, PA, NJ
Storms, thunderstorms with winds up to 97 km/h, hail USD 25m–100m insured loss*
* Loss ranges for natural catastrophes in the US in Table 6: defined by Property Claim Services (PCS)
21Swiss Re, sigma No 1/2011
Date
Country Place
Event
No. of victims/amount of damage in original currency and (USD)
10.5.
United States OK (Cleveland, Oklahoma City), AR
Tornadoes, hail; damage to buildings, cars
5 dead 58 injured USD 600m–1bn insured loss*
12.5.–16.5. United States OK, MD, PA, TX, IL
Storm with winds up to 130 km/h, tornadoes, hail, heavy rain, floods
USD 1bn–3bn insured loss*
14.5.
Bangladesh Rajshahi, Kalbaishakhi, Bagmara, Mohanpur
Storm over Rajshahi City; damage to buildings
2 dead 100 injured
20.5.–22.5.
India, Sri Lanka, Bay of Bengal, Indian Ocean Andhra Pradesh, Krishna, Prakasam, Nellore, Guntur, East Godavari, Visakhapatnam
Cyclone Laila with winds up to 155 km/h, heavy rain, floods; 5 800 hectares of crops destroyed
58 dead USD 100m total damage
22.5.–26.5. United States CO, NE, WY, SD
Storms, tornadoes with winds up to 193 km/h, hail USD 300m–600m insured loss*
24.5.
India Uttar Pradesh, Allahabad, Unnao, Nawabganj
Storm, hail; dwellings destroyed
12 dead 30 injured 2 000 homeless
29.5.–8.6.
Guatemala, Honduras, El Salvador
Tropical storm Agatha with winds up to 75 km/h, heavy rain, floods, mudslides; over 110 000 houses and other structures destroyed
299 dead, 2 missing 157 injured 155 287 homeless USD 50m insured loss 1.1bn total damage
1.6.–3.6. United States TX, NE, IA
Storms, flooding, hail, tornadoes, wind USD 100m–300m insured loss*
4.6.–6.6. United States MI, MA, OH, IL, IN
Storms with winds up to 112 km/h; hail, heavy rain, floods
USD 100m–300m insured loss* USD 250m total damage
4.6.–7.6.
Oman, Pakistan, Gulf of Oman Sindh, Balochistan, Badin, Thatta, Gwadar
Cyclone Phet with winds up to 120 km/h, heavy rain, floods; damage to bridges, roads
39 dead USD 150m insured loss OMR 300m (USD 779m) total damage
10.6.–16.6.
United States CO, GA, IL, IN, KS, NC, NM, OK, SC
Storms with winds up to 97km/h; hail, heavy rain, floods
20 dead USD 600m–1bn insured loss*
17.6. –20.6.
United States IL, IN, IA, KS, MI, MN, MO, MT, NE
Thunderstorms, heavy rains, floods
20 dead 100 injured USD 600m–1bn insured loss*
21.6.–24.6.
United States CT, IL, IN, NE, NJ, NY, OH, PA, SD, WI
Thunderstorms, heavy rains, floods
USD 300m–600m insured loss*
25.6.–28.6. United States MIN, OH
Thunderstorms, heavy rains, floods USD 100m–300m insured loss*
26.6.–30.6.
Mexico, United States, Gulf of Mexico, Guatemala, Nicaragua, El Salvador, Belize Yucatan Peninsula, Soto La Marina, La Pesca, Tamaulipas, TX, Guatemala, Nicaragua, El Salvador
Hurricane Alex with winds up to 165 km/h; heavy rains, floods, mudslides
12 dead MXN 2.58bn (USD 209m) insured loss USD 3.45bn total damage
30.6.–1.7. United States MT
Storms, hail USD 100m–300m insured loss*
12.7. Canada Calgary, part of Southern Alberta
Hailstorm, heavy rain; damage to buildings and cars >CAD 500m (>USD 500m) insured loss**CAD 650m (USD 654m) total damage
13.7.–17.7.
Philippines, Viet Nam, China Southern Luzon, Hainan Island, Lao
Typhoon Conson/No 1 with winds up to 120 km/h, heavy rains; 3 691 houses, 1 300 hectares of riceland destroyed
114 dead, 52 missing 31 injured USD 145m total damage
17.7.–18.7. United States MN, IA
Storms, hail, heavy rains 2 dead USD 100m–300m insured loss*
* Loss ranges for natural catastrophes in the US in Table 6: defined by Property Claim Services (PCS)
** Canada natural catastrophe figures with the permission of Property Claim Services (PCS Canada)
Swiss Re, sigma No 1/201122
Tables for reporting year 2010
Date
Country Place
Event
No. of victims/amount of damage in original currency and (USD)
20.7.–25.7. United States CT, IL, IA, MD, MN, NY, PA, VA; WI
Storms, floods, hail, tornado 5 dead USD 600m-1bn insured loss*
22.7.
China, Viet Nam, Hong Kong Wuchuan City, Guangdong, Northern Vietnam, Nghe An, Ha Tinh, Thanh Hoa, Ha Giang, Cao Bang, Lao Cai
Typhoon Chanthu/No 3 with winds up to 126 km/h, heavy rains, floods; 2 915 houses damaged in China
14 dead 5 injured CNY 2.4bn (USD 364m) total damage
8.8.–12.8. United States IA, MD, MN
Thunderstorms, floods 1 dead USD 100m–300m insured loss*
14.8. Denmark Zealand
Cloudburst, heavy rains DKK 1.2bn (USD 216m) insured loss
15.8. Czech Republic Prague, Bohemia
Thunderstorms, hail; severe damage to houses EUR 105 (USD 141m) insured loss USD 350m total damage
24.8.
Viet Nam Nghe An, Ha, Quang Binh
Typhoon Mindulle with winds up to 230 km/h; 461 houses destroyed, 89 600 hectares of farmland flooded, over 35 fishing boats sank, 11 ships damaged
14 dead 64 injured 20 700 homeless VND 850bn (USD 44m) total damage
29.8.–4.9.
Antigua and Barbuda, United States, Canada NC, VA, Leeward Islands, Western Head, Halifax, Nova Scotia
Hurricane Earl/No 3 with winds up to 142 km/h; damages to houses, power outages
1 dead USD 50m insured loss
31.8.–2.9.
South Korea, North Korea, Japan Okimawa, Junigami, Nago, Motobu, Yomitan, Incheon, Gyeonggi, Kaesong
Typhoon Kompasu/No 7 with winds up to 185 km/h; over 3 550 houses, 30 000 hectares of farmland destroyed; damage to residential, commercial, industrial buildings and infrastructure, power outages
32 dead KRW 162bn (USD 143m) insured loss KRW 585bn (USD 515m) total damage
6.9.–9.9.
Mexico, United States La Pesca, TX (Brownsville, Austin, Arlington, Dallas, Georgetown, Corpus Christi)
Tropical storm Hermine/No 8 with winds up to 100 km/h, heavy rains, floods; damages to houses, public buildings, power outages
6 dead USD 120m insured loss USD 200m total damage
9.9.
China Shishi City, Fujian, Zhejiang
Typhoon Meranti with winds up to 100 km/h; heavy rains; damage to cropland
3 dead 186 000 homeless CNY 800m (USD 121m) total damage
14.9.–17.9.
Mexico, United States Puerto Bravo, Quintana, Roo State, Yucatan Peninsula, Chetumal, Matamoros, Veracruz, Tabasco, Oaxaca, Puebla
Hurricane Karl/No 6, Category 3 with winds up to 195 km/h, heavy rains, floods, landslides; 160 000 houses damaged or destroyed, damages to transport network, over 952 000 hectares of cropland flooded
22 dead 230 000 homeless MXN 2.5bn (USD 203m) insured loss USD 4.13bn total damage
15.9.–16.9.
United States KS, NY, OH
Thunderstorms, tornadoes, hail, floods
2 dead USD 300m–600m insured loss* USD 500m total damage
18.9.–22.9.
Bermuda, Canada 65 km West of Bermuda, Burin Peninsula
Hurricane Igor with winds up to 150 km/h, heavy rains, floods; hundreds of houses, roads damaged
4 dead USD 140m insured loss USD 201m total damage
18.9.–19.9. United States MO
Thunderstorms, hail, floods USD 100m–300m insured loss* USD 210m total damage
19.9.–21.9.
China, Taiwan China (Fujian, Guangdong), Taiwan
Typhoon Fanapi/No 11 with winds up to 169 km/h; heavy rain, floods, landslides; 66 400 hectares of crops flooded, 16 000 houses collapsed; landslide caused damage to a tin mine causing water pollution
135 dead, 61 missing 128 000 homeless TWD 2bn (USD 69m) insured loss USD 800m total damage
29.9.–1.10.
Jamaica, United States, Bahamas, Cuba Kingston, Santiago, Clarendon, MD, NC, NY, PA, VA
Tropical Storm Nicole/No 14, heavy rains, floods, landslides; roads, highways flooded, bridges collapsed, power outages
21 dead 141 homeless USD 135m insured loss USD 333m total damage
4.10.–6.10. United States AZ
Thunderstorms, tornadoes, hail, floods USD 1bn–3bn insured loss*
17.10.–23.10.
China, Philippines, Taiwan Maconacon, Palanan, Divilican, Zhangpu City, Fujian
Super Typhoon Megi with winds up to 220 km/h, floods, mudslides; 30 048 houses destroyed
46 dead, at least 4 missing 42 injured USD 100m insured loss USD 701m total damage
* Loss ranges for natural catastrophes in the US in Table 6: defined by Property Claim Services (PCS)
23Swiss Re, sigma No 1/2011
Date
Country Place
Event
No. of victims/amount of damage in original currency and (USD)
21.10.–24.10. United States TX
Thunderstorms, tornado with wind up to 217 km/h; floods, hail
USD 25m–100m insured loss*
22.10.
Myanmar (Burma) Magway, Mandalay, Sagaing, Kyaukpyu, Minbya, Myanaung, Myebon, Pauktaw
Cyclone Giri with winds up to 177 km/h; heavy rains, tidal waves; 20 380 houses, 16 185 hectares of riceland destroyed; damage to infrastructure
45 dead, at least 10 missing 49 injured 81 000 homeless USD 57m total damage
26.10. United States IL, IN, KY, MN, OH, WI
Storms with winds up to 129 km/h, hail, floods, tornadoes
USD 300m–600m insured loss*
30.10.–6.11.
Saint Lucia, Saint Vincent and The Grenadines, Barbados, Trinidad and Tobago, Haiti
Hurricane Tomas/No 11, heavy rains, landslides
55 dead USD 588m total damage
31.10.–2.1.
Italy Veneto, Toscana, Ligura, Valle d’Aosta, Lombardia, Friuli, Sicilia
Storms, floods, mudslides due to heavy rains, rivers overflow their banks; train derailed, houses destroyed, railways, roads damaged
3 dead 5 injured EUR 650m (USD 872m) total damage
31.10.–3.11. India Andhra Pradesh
Cyclone Jal with winds up to 100 km/h; heavy rains, floods; damage to crops and transport infrastructure
22 dead
29.11.–1.12.
United States MS, SC, GA
Storms, tornadoes
1 dead USD 25m–100m insured loss* USD 100m total damage
17.12.–22.12. United States CA
Storms, hail, floods USD 100m–300m insured loss*
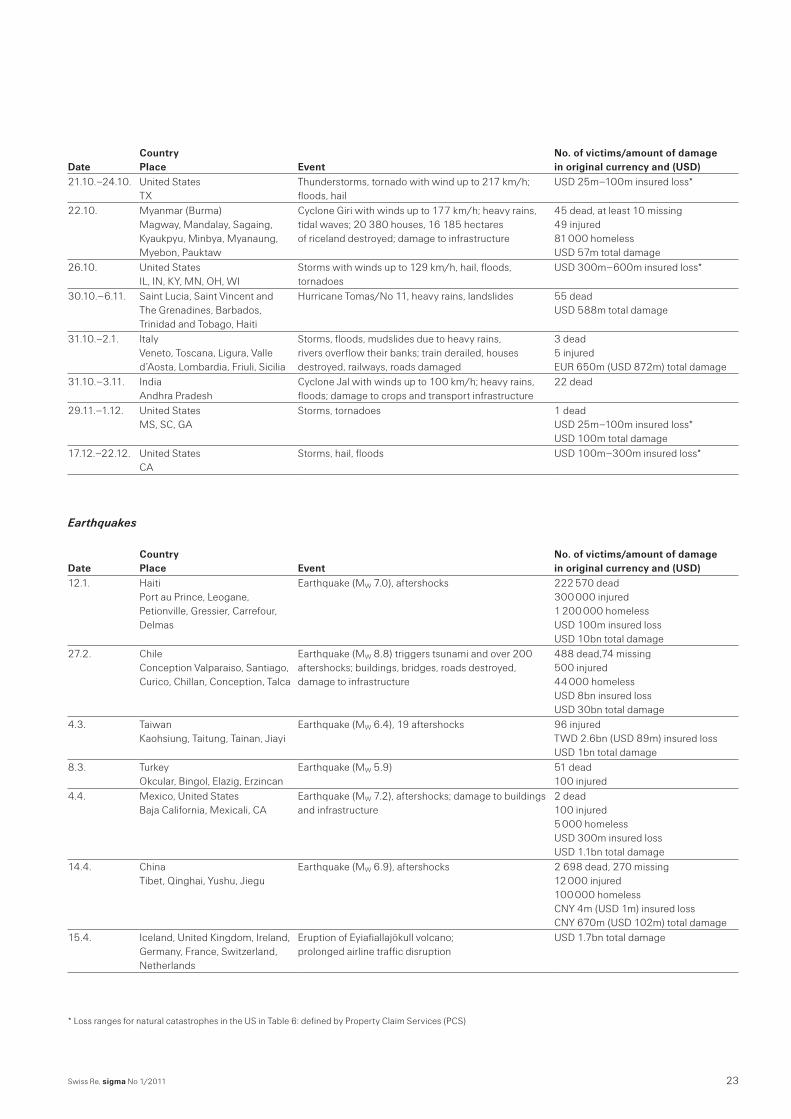
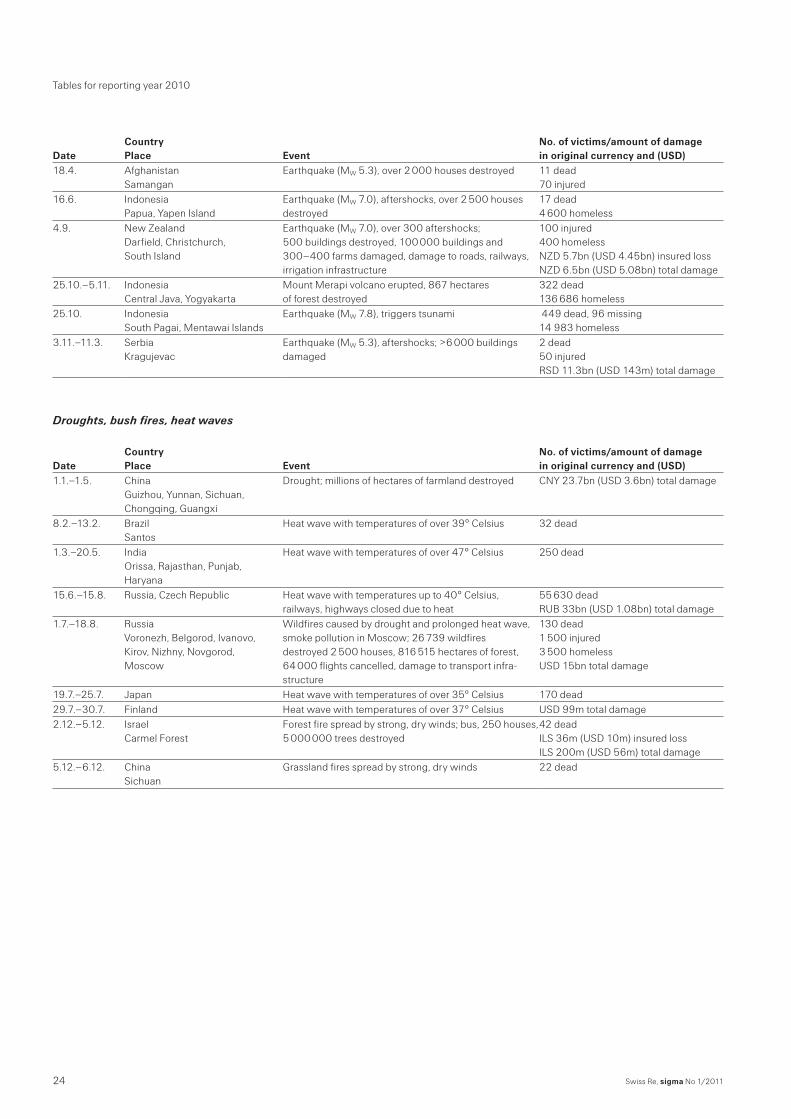
Earthquakes
Date
Country Place
Event
No. of victims/amount of damage in original currency and (USD)
12.1.
Haiti Port au Prince, Leogane, Petionville, Gressier, Carrefour, Delmas
Earthquake (MW 7.0), aftershocks
222 570 dead 300 000 injured 1 200 000 homeless USD 100m insured loss USD 10bn total damage
27.2.
Chile Conception Valparaiso, Santiago, Curico, Chillan, Conception, Talca
Earthquake (MW 8.8) triggers tsunami and over 200 aftershocks; buildings, bridges, roads destroyed, damage to infrastructure
488 dead,74 missing 500 injured 44 000 homeless USD 8bn insured loss USD 30bn total damage
4.3.
Taiwan Kaohsiung, Taitung, Tainan, Jiayi
Earthquake (MW 6.4), 19 aftershocks
96 injured TWD 2.6bn (USD 89m) insured loss USD 1bn total damage
8.3. Turkey Okcular, Bingol, Elazig, Erzincan
Earthquake (MW 5.9) 51 dead 100 injured
4.4.
Mexico, United States Baja California, Mexicali, CA
Earthquake (MW 7.2), aftershocks; damage to buildings and infrastructure
2 dead 100 injured 5 000 homeless USD 300m insured loss USD 1.1bn total damage
14.4.
China Tibet, Qinghai, Yushu, Jiegu
Earthquake (MW 6.9), aftershocks
2 698 dead, 270 missing 12 000 injured 100 000 homeless CNY 4m (USD 1m) insured loss CNY 670m (USD 102m) total damage
15.4.
Iceland, United Kingdom, Ireland, Germany, France, Switzerland, Netherlands
Eruption of Eyiafiallajökull volcano; prolonged airline traffic disruption
USD 1.7bn total damage
* Loss ranges for natural catastrophes in the US in Table 6: defined by Property Claim Services (PCS)
Swiss Re, sigma No 1/201124
Tables for reporting year 2010
Date
Country Place
Event
No. of victims/amount of damage in original currency and (USD)
18.4. Afghanistan Samangan
Earthquake (MW 5.3), over 2 000 houses destroyed 11 dead 70 injured
16.6. Indonesia Papua, Yapen Island
Earthquake (MW 7.0), aftershocks, over 2 500 houses destroyed
17 dead 4 600 homeless
4.9.
New Zealand Darfield, Christchurch, South Island
Earthquake (MW 7.0), over 300 aftershocks; 500 buildings destroyed, 100 000 buildings and 300–400 farms damaged, damage to roads, railways, irrigation infrastructure
100 injured 400 homeless NZD 5.7bn (USD 4.45bn) insured loss NZD 6.5bn (USD 5.08bn) total damage
25.10.–5.11. Indonesia Central Java, Yogyakarta
Mount Merapi volcano erupted, 867 hectares of forest destroyed
322 dead 136 686 homeless
25.10. Indonesia South Pagai, Mentawai Islands
Earthquake (MW 7.8), triggers tsunami 449 dead, 96 missing 14 983 homeless
3.11.–11.3.
Serbia Kragujevac
Earthquake (MW 5.3), aftershocks; >6 000 buildings damaged
2 dead 50 injured RSD 11.3bn (USD 143m) total damage
Droughts, bush fires, heat waves
Date
Country Place
Event
No. of victims/amount of damage in original currency and (USD)
1.1.–1.5.
China Guizhou, Yunnan, Sichuan, Chongqing, Guangxi
Drought; millions of hectares of farmland destroyed
CNY 23.7bn (USD 3.6bn) total damage
8.2.–13.2. Brazil Santos
Heat wave with temperatures of over 39° Celsius 32 dead
1.3.–20.5.
India Orissa, Rajasthan, Punjab, Haryana
Heat wave with temperatures of over 47° Celsius
250 dead
15.6.–15.8. Russia, Czech Republic Heat wave with temperatures up to 40° Celsius, railways, highways closed due to heat
55 630 dead RUB 33bn (USD 1.08bn) total damage
1.7.–18.8.
Russia Voronezh, Belgorod, Ivanovo, Kirov, Nizhny, Novgorod, Moscow
Wildfires caused by drought and prolonged heat wave, smoke pollution in Moscow; 26 739 wildfires destroyed 2 500 houses, 816 515 hectares of forest, 64 000 flights cancelled, damage to transport infra-structure
130 dead 1 500 injured 3 500 homeless USD 15bn total damage
19.7.–25.7. Japan Heat wave with temperatures of over 35° Celsius 170 dead29.7.–30.7. Finland Heat wave with temperatures of over 37° Celsius USD 99m total damage2.12.–5.12.
Israel Carmel Forest
Forest fire spread by strong, dry winds; bus, 250 houses, 5 000 000 trees destroyed
42 dead ILS 36m (USD 10m) insured loss ILS 200m (USD 56m) total damage
5.12.–6.12. China Sichuan
Grassland fires spread by strong, dry winds 22 dead
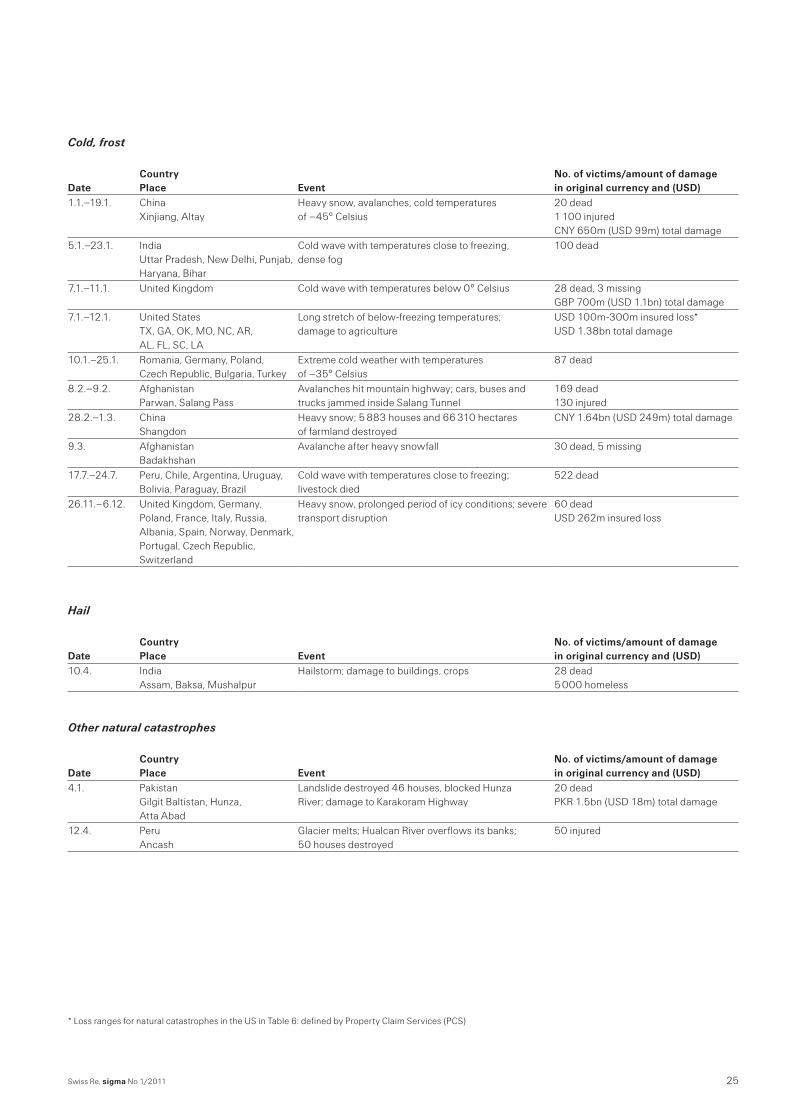
25Swiss Re, sigma No 1/2011
Cold, frost
Date
Country Place
Event
No. of victims/amount of damage in original currency and (USD)
1.1.–19.1.
China Xinjiang, Altay
Heavy snow, avalanches, cold temperatures of –45° Celsius
20 dead 1 100 injured CNY 650m (USD 99m) total damage
5.1.–23.1.
India Uttar Pradesh, New Delhi, Punjab, Haryana, Bihar
Cold wave with temperatures close to freezing, dense fog
100 dead
7.1.–11.1. United Kingdom Cold wave with temperatures below 0° Celsius 28 dead, 3 missing GBP 700m (USD 1.1bn) total damage
7.1.–12.1.
United States TX, GA, OK, MO, NC, AR, AL, FL, SC, LA
Long stretch of below-freezing temperatures; damage to agriculture
USD 100m-300m insured loss* USD 1.38bn total damage
10.1.–25.1. Romania, Germany, Poland, Czech Republic, Bulgaria, Turkey
Extreme cold weather with temperatures of –35° Celsius
87 dead
8.2.–9.2. Afghanistan Parwan, Salang Pass
Avalanches hit mountain highway; cars, buses and trucks jammed inside Salang Tunnel
169 dead 130 injured
28.2.–1.3. China Shangdon
Heavy snow; 5 883 houses and 66 310 hectares of farmland destroyed
CNY 1.64bn (USD 249m) total damage
9.3. Afghanistan Badakhshan
Avalanche after heavy snowfall 30 dead, 5 missing
17.7.–24.7. Peru, Chile, Argentina, Uruguay, Bolivia, Paraguay, Brazil
Cold wave with temperatures close to freezing; livestock died
522 dead
26.11.–6.12.
United Kingdom, Germany, Poland, France, Italy, Russia, Albania, Spain, Norway, Denmark, Portugal, Czech Republic, Switzerland
Heavy snow, prolonged period of icy conditions; severe transport disruption
60 dead USD 262m insured loss
Hail
Date
Country Place
Event
No. of victims/amount of damage in original currency and (USD)
10.4. India Assam, Baksa, Mushalpur
Hailstorm; damage to buildings, crops 28 dead 5 000 homeless
Other natural catastrophes
Date
Country Place
Event
No. of victims/amount of damage in original currency and (USD)
4.1.
Pakistan Gilgit Baltistan, Hunza, Atta Abad
Landslide destroyed 46 houses, blocked Hunza River; damage to Karakoram Highway
20 dead PKR 1.5bn (USD 18m) total damage
12.4. Peru Ancash
Glacier melts; Hualcan River overflows its banks; 50 houses destroyed
50 injured
* Loss ranges for natural catastrophes in the US in Table 6: defined by Property Claim Services (PCS)
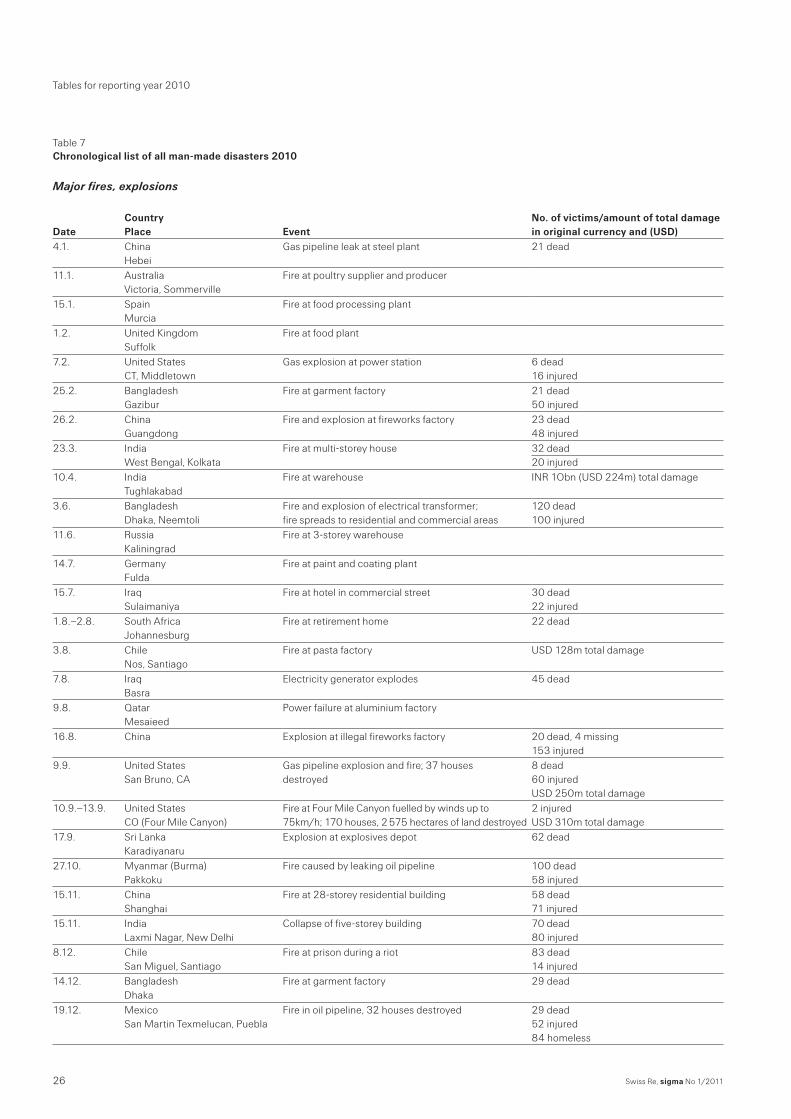
Swiss Re, sigma No 1/201126
Tables for reporting year 2010
Table 7Chronological list of all man-made disasters 2010
Major fires, explosions
Date
Country Place
Event
No. of victims/amount of total damage in original currency and (USD)
4.1. China Hebei
Gas pipeline leak at steel plant 21 dead
11.1. Australia Victoria, Sommerville
Fire at poultry supplier and producer
15.1. Spain Murcia
Fire at food processing plant
1.2. United Kingdom Suffolk
Fire at food plant
7.2. United States CT, Middletown
Gas explosion at power station 6 dead 16 injured
25.2. Bangladesh Gazibur
Fire at garment factory 21 dead 50 injured
26.2. China Guangdong
Fire and explosion at fireworks factory 23 dead 48 injured
23.3. India West Bengal, Kolkata
Fire at multi-storey house 32 dead20 injured
10.4. India Tughlakabad
Fire at warehouse INR 1Obn (USD 224m) total damage
3.6. Bangladesh Dhaka, Neemtoli
Fire and explosion of electrical transformer; fire spreads to residential and commercial areas
120 dead 100 injured
11.6. Russia Kaliningrad
Fire at 3-storey warehouse
14.7. Germany Fulda
Fire at paint and coating plant
15.7. Iraq Sulaimaniya
Fire at hotel in commercial street 30 dead 22 injured
1.8.–2.8. South Africa Johannesburg
Fire at retirement home 22 dead
3.8. Chile Nos, Santiago
Fire at pasta factory USD 128m total damage
7.8. Iraq Basra
Electricity generator explodes 45 dead
9.8. Qatar Mesaieed
Power failure at aluminium factory
16.8. China Explosion at illegal fireworks factory 20 dead, 4 missing 153 injured
9.9.
United States San Bruno, CA
Gas pipeline explosion and fire; 37 houses destroyed
8 dead 60 injured USD 250m total damage
10.9.–13.9. United States CO (Four Mile Canyon)
Fire at Four Mile Canyon fuelled by winds up to 75km/h; 170 houses, 2 575 hectares of land destroyed
2 injured USD 310m total damage
17.9. Sri Lanka Karadiyanaru
Explosion at explosives depot 62 dead
27.10. Myanmar (Burma) Pakkoku
Fire caused by leaking oil pipeline 100 dead 58 injured
15.11. China Shanghai
Fire at 28-storey residential building 58 dead 71 injured
15.11. India Laxmi Nagar, New Delhi
Collapse of five-storey building 70 dead 80 injured
8.12. Chile San Miguel, Santiago
Fire at prison during a riot 83 dead 14 injured
14.12. Bangladesh Dhaka
Fire at garment factory 29 dead
19.12.
Mexico San Martin Texmelucan, Puebla
Fire in oil pipeline, 32 houses destroyed
29 dead 52 injured 84 homeless
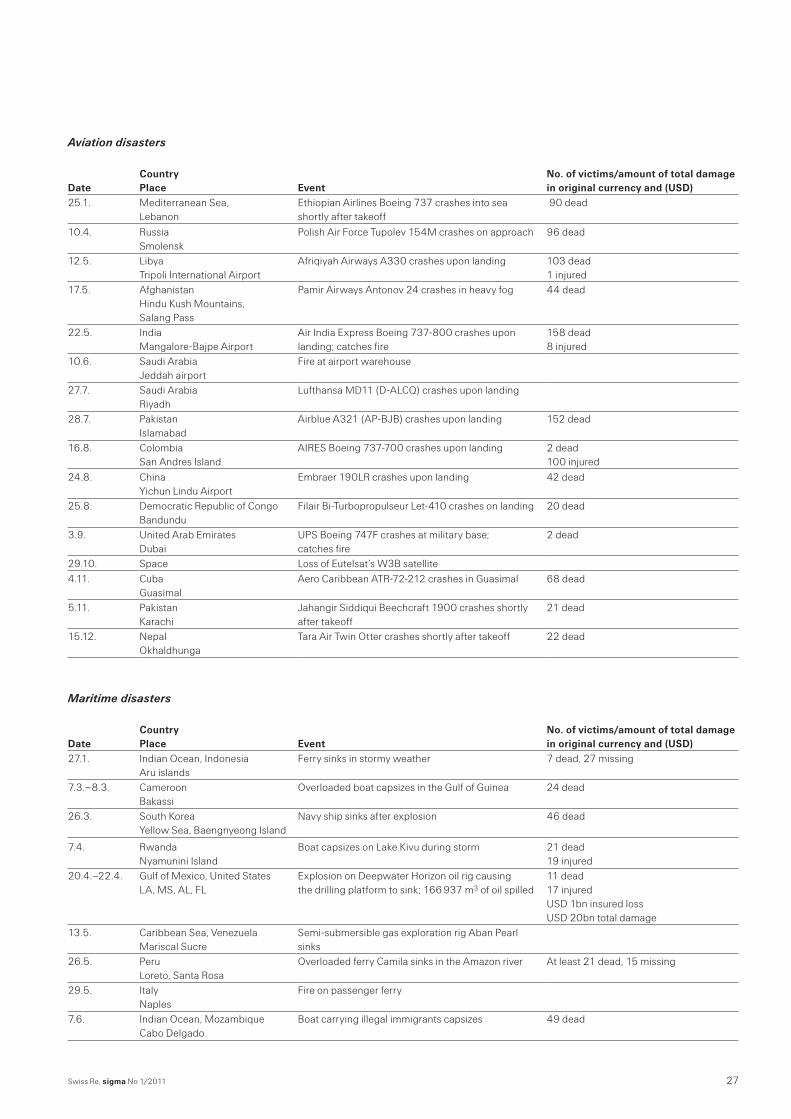
27Swiss Re, sigma No 1/2011
Aviation disasters
Date
Country Place
Event
No. of victims/amount of total damage in original currency and (USD)
25.1. Mediterranean Sea, Lebanon
Ethiopian Airlines Boeing 737 crashes into sea shortly after takeoff
90 dead
10.4. Russia Smolensk
Polish Air Force Tupolev 154M crashes on approach 96 dead
12.5. Libya Tripoli International Airport
Afriqiyah Airways A330 crashes upon landing 103 dead 1 injured
17.5.
Afghanistan Hindu Kush Mountains, Salang Pass
Pamir Airways Antonov 24 crashes in heavy fog
44 dead
22.5. India Mangalore-Bajpe Airport
Air India Express Boeing 737-800 crashes upon landing; catches fire
158 dead 8 injured
10.6. Saudi Arabia Jeddah airport
Fire at airport warehouse
27.7. Saudi Arabia Riyadh
Lufthansa MD11 (D-ALCQ) crashes upon landing
28.7. Pakistan Islamabad
Airblue A321 (AP-BJB) crashes upon landing 152 dead
16.8. Colombia San Andres Island
AIRES Boeing 737-700 crashes upon landing 2 dead 100 injured
24.8. China Yichun Lindu Airport
Embraer 190LR crashes upon landing 42 dead
25.8. Democratic Republic of Congo Bandundu
Filair Bi-Turbopropulseur Let-410 crashes on landing 20 dead
3.9. United Arab Emirates Dubai
UPS Boeing 747F crashes at military base; catches fire
2 dead
29.10. Space Loss of Eutelsat’s W3B satellite 4.11. Cuba
GuasimalAero Caribbean ATR-72-212 crashes in Guasimal 68 dead
5.11. Pakistan Karachi
Jahangir Siddiqui Beechcraft 1900 crashes shortly after takeoff
21 dead
15.12. Nepal Okhaldhunga
Tara Air Twin Otter crashes shortly after takeoff 22 dead
Maritime disasters
Date
Country Place
Event
No. of victims/amount of total damage in original currency and (USD)
27.1. Indian Ocean, Indonesia Aru islands
Ferry sinks in stormy weather 7 dead, 27 missing
7.3.–8.3. Cameroon Bakassi
Overloaded boat capsizes in the Gulf of Guinea 24 dead
26.3. South Korea Yellow Sea, Baengnyeong Island
Navy ship sinks after explosion 46 dead
7.4. Rwanda Nyamunini Island
Boat capsizes on Lake Kivu during storm 21 dead 19 injured
20.4.–22.4.
Gulf of Mexico, United States LA, MS, AL, FL
Explosion on Deepwater Horizon oil rig causing the drilling platform to sink; 166 937 m3 of oil spilled
11 dead 17 injured USD 1bn insured loss USD 20bn total damage
13.5. Caribbean Sea, Venezuela Mariscal Sucre
Semi-submersible gas exploration rig Aban Pearl sinks
26.5. Peru Loreto, Santa Rosa
Overloaded ferry Camila sinks in the Amazon river At least 21 dead, 15 missing
29.5. Italy Naples
Fire on passenger ferry
7.6. Indian Ocean, Mozambique Cabo Delgado
Boat carrying illegal immigrants capsizes 49 dead
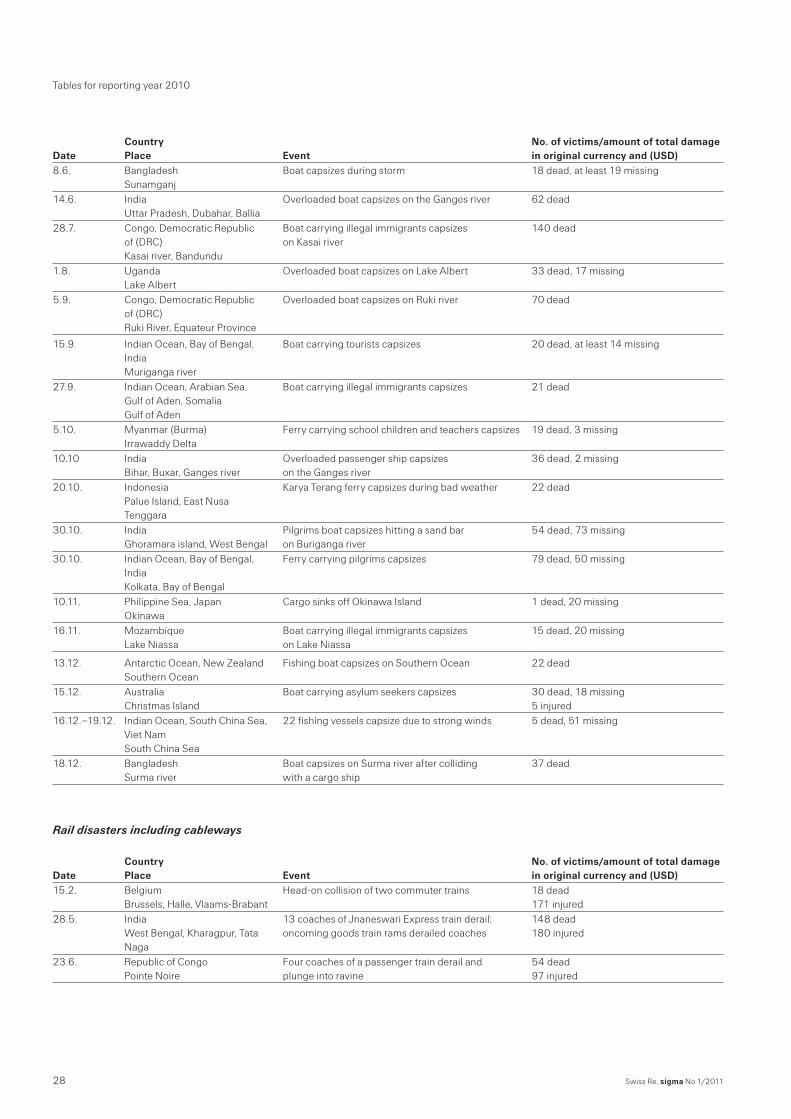
Swiss Re, sigma No 1/201128
Tables for reporting year 2010
Date
Country Place
Event
No. of victims/amount of total damage in original currency and (USD)
8.6. Bangladesh Sunamganj
Boat capsizes during storm 18 dead, at least 19 missing
14.6. India Uttar Pradesh, Dubahar, Ballia
Overloaded boat capsizes on the Ganges river 62 dead
28.7.
Congo, Democratic Republic of (DRC) Kasai river, Bandundu
Boat carrying illegal immigrants capsizes on Kasai river
140 dead
1.8. Uganda Lake Albert
Overloaded boat capsizes on Lake Albert 33 dead, 17 missing
5.9.
Congo, Democratic Republic of (DRC) Ruki River, Equateur Province
Overloaded boat capsizes on Ruki river
70 dead
15.9.
Indian Ocean, Bay of Bengal, India Muriganga river
Boat carrying tourists capsizes
20 dead, at least 14 missing
27.9.
Indian Ocean, Arabian Sea, Gulf of Aden, Somalia Gulf of Aden
Boat carrying illegal immigrants capsizes
21 dead
5.10. Myanmar (Burma) Irrawaddy Delta
Ferry carrying school children and teachers capsizes 19 dead, 3 missing
10.10 India Bihar, Buxar, Ganges river
Overloaded passenger ship capsizes on the Ganges river
36 dead, 2 missing
20.10.
Indonesia Palue Island, East Nusa Tenggara
Karya Terang ferry capsizes during bad weather
22 dead
30.10. India Ghoramara island, West Bengal
Pilgrims boat capsizes hitting a sand bar on Buriganga river
54 dead, 73 missing
30.10.
Indian Ocean, Bay of Bengal, India Kolkata, Bay of Bengal
Ferry carrying pilgrims capsizes
79 dead, 50 missing
10.11. Philippine Sea, Japan Okinawa
Cargo sinks off Okinawa Island 1 dead, 20 missing
16.11. Mozambique Lake Niassa
Boat carrying illegal immigrants capsizes on Lake Niassa
15 dead, 20 missing
13.12. Antarctic Ocean, New Zealand Southern Ocean
Fishing boat capsizes on Southern Ocean 22 dead
15.12. Australia Christmas Island
Boat carrying asylum seekers capsizes 30 dead, 18 missing 5 injured
16.12.–19.12.
Indian Ocean, South China Sea, Viet Nam South China Sea
22 fishing vessels capsize due to strong winds
5 dead, 51 missing
18.12. Bangladesh Surma river
Boat capsizes on Surma river after colliding with a cargo ship
37 dead
Rail disasters including cableways
Date
Country Place
Event
No. of victims/amount of total damage in original currency and (USD)
15.2. Belgium Brussels, Halle, Vlaams-Brabant
Head-on collision of two commuter trains 18 dead 171 injured
28.5.
India West Bengal, Kharagpur, Tata Naga
13 coaches of Jnaneswari Express train derail: oncoming goods train rams derailed coaches
148 dead 180 injured
23.6. Republic of Congo Pointe Noire
Four coaches of a passenger train derail and plunge into ravine
54 dead 97 injured
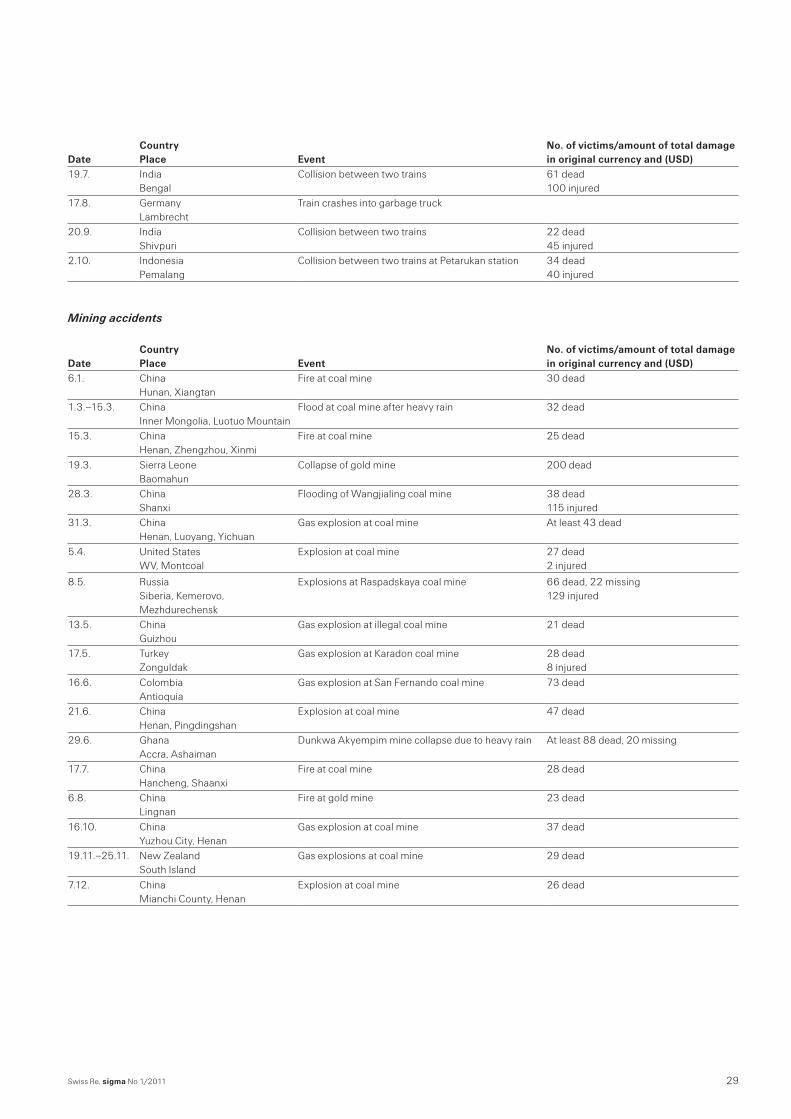
29Swiss Re, sigma No 1/2011
Date
Country Place
Event
No. of victims/amount of total damage in original currency and (USD)
19.7. India Bengal
Collision between two trains 61 dead 100 injured
17.8. Germany Lambrecht
Train crashes into garbage truck
20.9. India Shivpuri
Collision between two trains 22 dead 45 injured
2.10. Indonesia Pemalang
Collision between two trains at Petarukan station 34 dead 40 injured
Mining accidents
Date
Country Place
Event
No. of victims/amount of total damage in original currency and (USD)
6.1. China Hunan, Xiangtan
Fire at coal mine 30 dead
1.3.–15.3. China Inner Mongolia, Luotuo Mountain
Flood at coal mine after heavy rain 32 dead
15.3. China Henan, Zhengzhou, Xinmi
Fire at coal mine 25 dead
19.3. Sierra Leone Baomahun
Collapse of gold mine 200 dead
28.3. China Shanxi
Flooding of Wangjialing coal mine 38 dead 115 injured
31.3. China Henan, Luoyang, Yichuan
Gas explosion at coal mine At least 43 dead
5.4. United States WV, Montcoal
Explosion at coal mine 27 dead 2 injured
8.5.
Russia Siberia, Kemerovo, Mezhdurechensk
Explosions at Raspadskaya coal mine
66 dead, 22 missing 129 injured
13.5. China Guizhou
Gas explosion at illegal coal mine 21 dead
17.5. Turkey Zonguldak
Gas explosion at Karadon coal mine 28 dead 8 injured
16.6. Colombia Antioquia
Gas explosion at San Fernando coal mine 73 dead
21.6. China Henan, Pingdingshan
Explosion at coal mine 47 dead
29.6. Ghana Accra, Ashaiman
Dunkwa Akyempim mine collapse due to heavy rain At least 88 dead, 20 missing
17.7. China Hancheng, Shaanxi
Fire at coal mine 28 dead
6.8. China Lingnan
Fire at gold mine 23 dead
16.10. China Yuzhou City, Henan
Gas explosion at coal mine 37 dead
19.11.–25.11. New Zealand South Island
Gas explosions at coal mine 29 dead
7.12. China Mianchi County, Henan
Explosion at coal mine 26 dead
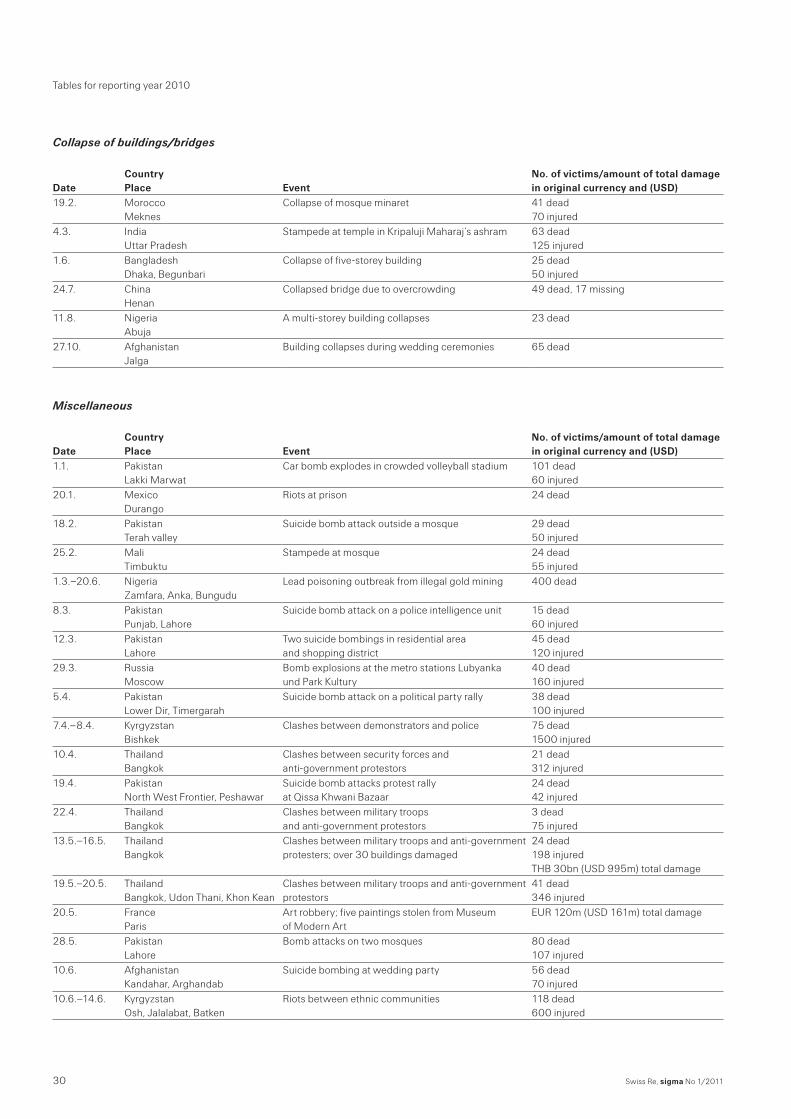
Swiss Re, sigma No 1/201130
Tables for reporting year 2010
Collapse of buildings/bridges
Date
Country Place
Event
No. of victims/amount of total damage in original currency and (USD)
19.2. Morocco Meknes
Collapse of mosque minaret 41 dead 70 injured
4.3. India Uttar Pradesh
Stampede at temple in Kripaluji Maharaj’s ashram 63 dead 125 injured
1.6. Bangladesh Dhaka, Begunbari
Collapse of five-storey building 25 dead 50 injured
24.7. China Henan
Collapsed bridge due to overcrowding 49 dead, 17 missing
11.8. Nigeria Abuja
A multi-storey building collapses 23 dead
27.10. Afghanistan Jalga
Building collapses during wedding ceremonies 65 dead
Miscellaneous
Date
Country Place
Event
No. of victims/amount of total damage in original currency and (USD)
1.1. Pakistan Lakki Marwat
Car bomb explodes in crowded volleyball stadium 101 dead 60 injured
20.1. Mexico Durango
Riots at prison 24 dead
18.2. Pakistan Terah valley
Suicide bomb attack outside a mosque 29 dead 50 injured
25.2. Mali Timbuktu
Stampede at mosque 24 dead 55 injured
1.3.–20.6. Nigeria Zamfara, Anka, Bungudu
Lead poisoning outbreak from illegal gold mining 400 dead
8.3. Pakistan Punjab, Lahore
Suicide bomb attack on a police intelligence unit 15 dead 60 injured
12.3. Pakistan Lahore
Two suicide bombings in residential area and shopping district
45 dead 120 injured
29.3. Russia Moscow
Bomb explosions at the metro stations Lubyanka und Park Kultury
40 dead 160 injured
5.4. Pakistan Lower Dir, Timergarah
Suicide bomb attack on a political party rally 38 dead 100 injured
7.4.–8.4. Kyrgyzstan Bishkek
Clashes between demonstrators and police 75 dead 1500 injured
10.4. Thailand Bangkok
Clashes between security forces and anti-government protestors
21 dead 312 injured
19.4. Pakistan North West Frontier, Peshawar
Suicide bomb attacks protest rally at Qissa Khwani Bazaar
24 dead 42 injured
22.4. Thailand Bangkok
Clashes between military troops and anti-government protestors
3 dead 75 injured
13.5.–16.5.
Thailand Bangkok
Clashes between military troops and anti-government protesters; over 30 buildings damaged
24 dead 198 injured THB 30bn (USD 995m) total damage
19.5.–20.5. Thailand Bangkok, Udon Thani, Khon Kean
Clashes between military troops and anti-government protestors
41 dead 346 injured
20.5. France Paris
Art robbery; five paintings stolen from Museum of Modern Art
EUR 120m (USD 161m) total damage
28.5. Pakistan Lahore
Bomb attacks on two mosques 80 dead 107 injured
10.6. Afghanistan Kandahar, Arghandab
Suicide bombing at wedding party 56 dead 70 injured
10.6.–14.6. Kyrgyzstan Osh, Jalalabat, Batken
Riots between ethnic communities 118 dead 600 injured
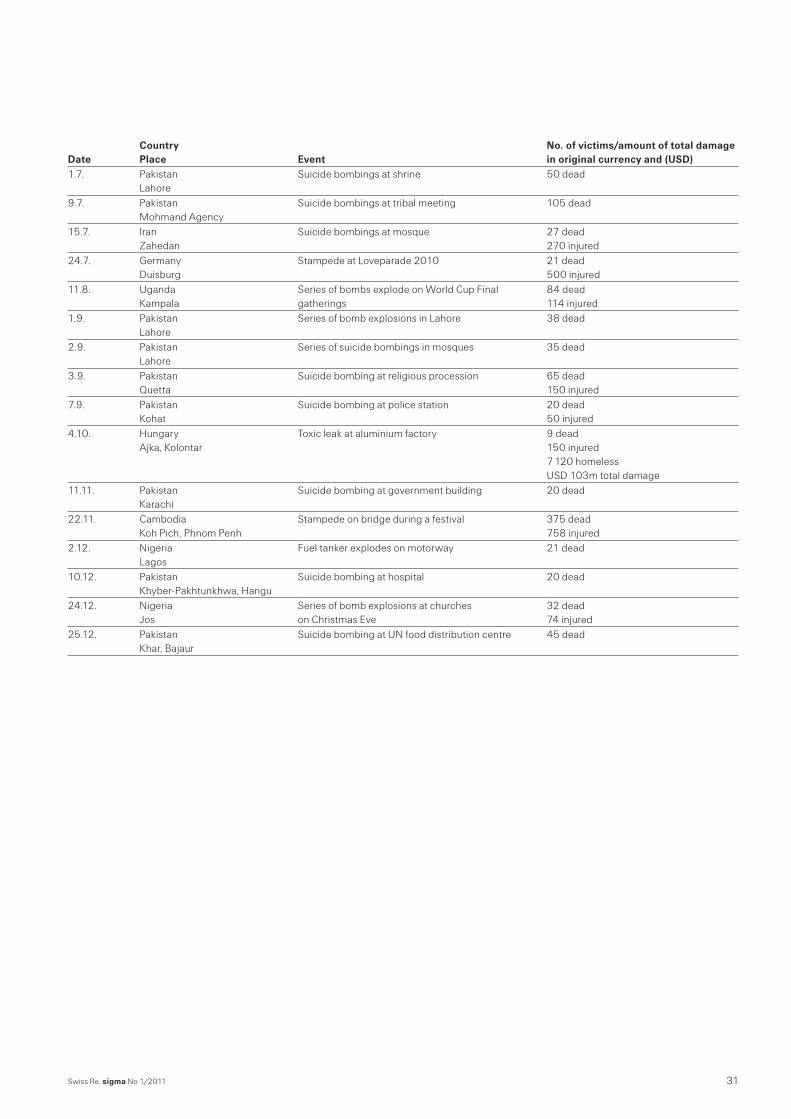
31Swiss Re, sigma No 1/2011
Date
Country Place
Event
No. of victims/amount of total damage in original currency and (USD)
1.7. Pakistan Lahore
Suicide bombings at shrine 50 dead
9.7. Pakistan Mohmand Agency
Suicide bombings at tribal meeting 105 dead
15.7. Iran Zahedan
Suicide bombings at mosque 27 dead 270 injured
24.7. Germany Duisburg
Stampede at Loveparade 2010 21 dead 500 injured
11.8. Uganda Kampala
Series of bombs explode on World Cup Final gatherings
84 dead 114 injured
1.9. Pakistan Lahore
Series of bomb explosions in Lahore 38 dead
2.9. Pakistan Lahore
Series of suicide bombings in mosques 35 dead
3.9. Pakistan Quetta
Suicide bombing at religious procession 65 dead 150 injured
7.9. Pakistan Kohat
Suicide bombing at police station 20 dead 50 injured
4.10.
Hungary Ajka, Kolontar
Toxic leak at aluminium factory
9 dead 150 injured 7 120 homeless USD 103m total damage
11.11. Pakistan Karachi
Suicide bombing at government building 20 dead
22.11. Cambodia Koh Pich, Phnom Penh
Stampede on bridge during a festival 375 dead 758 injured
2.12. Nigeria Lagos
Fuel tanker explodes on motorway 21 dead
10.12. Pakistan Khyber-Pakhtunkhwa, Hangu
Suicide bombing at hospital 20 dead
24.12. Nigeria Jos
Series of bomb explosions at churches on Christmas Eve
32 dead 74 injured
25.12. Pakistan Khar, Bajaur
Suicide bombing at UN food distribution centre 45 dead
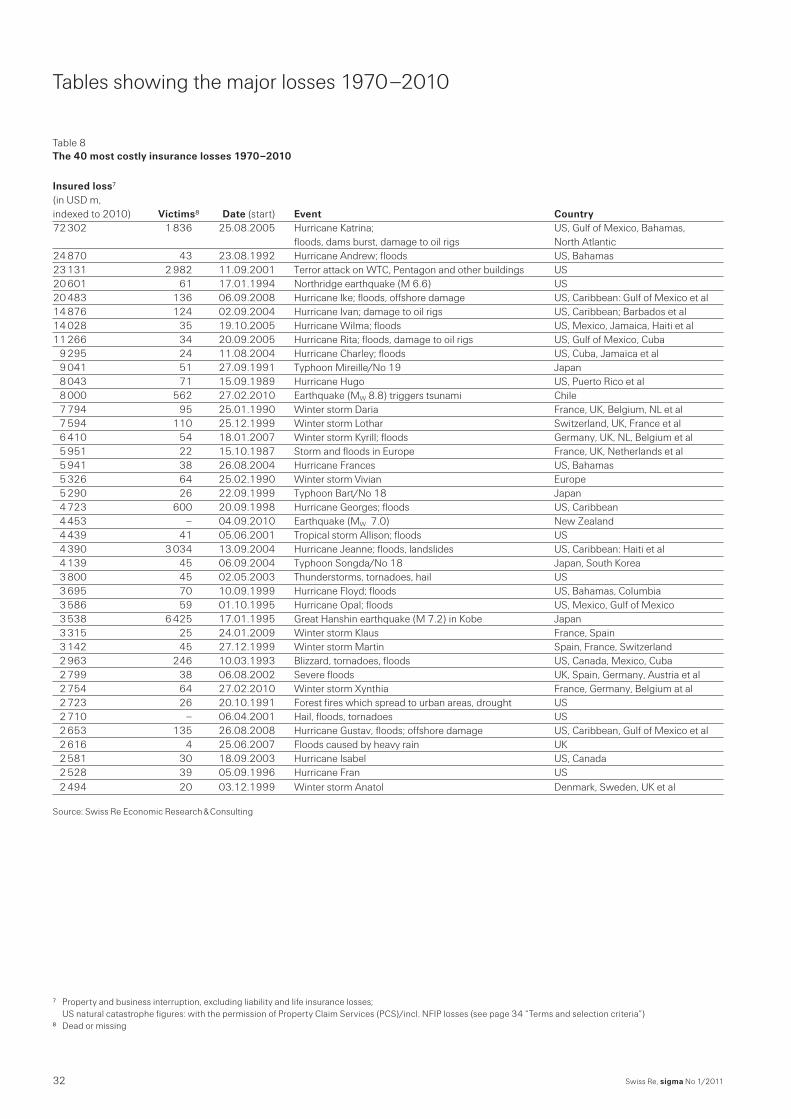
Swiss Re, sigma No 1/201132
Tables showing the major losses 1970 –2010
Table 8The 40 most costly insurance losses 1970–2010
Insured loss7(in USD m, indexed to 2010) Victims8 Date (start) Event Country 72 302 1 836 25.08.2005 Hurricane Katrina; US, Gulf of Mexico, Bahamas, floods, dams burst, damage to oil rigs North Atlantic 24 870 43 23.08.1992 Hurricane Andrew; floods US, Bahamas 23 131 2 982 11.09.2001 Terror attack on WTC, Pentagon and other buildings US 20 601 61 17.01.1994 Northridge earthquake (M 6.6) US 20 483 136 06.09.2008 Hurricane Ike; floods, offshore damage US, Caribbean: Gulf of Mexico et al 14 876 124 02.09.2004 Hurricane Ivan; damage to oil rigs US, Caribbean; Barbados et al 14 028 35 19.10.2005 Hurricane Wilma; floods US, Mexico, Jamaica, Haiti et al 11 266 34 20.09.2005 Hurricane Rita; floods, damage to oil rigs US, Gulf of Mexico, Cuba 9 295 24 11.08.2004 Hurricane Charley; floods US, Cuba, Jamaica et al 9 041 51 27.09.1991 Typhoon Mireille/No 19 Japan 8 043 71 15.09.1989 Hurricane Hugo US, Puerto Rico et al 8 000 562 27.02.2010 Earthquake (MW 8.8) triggers tsunami Chile 7 794 95 25.01.1990 Winter storm Daria France, UK, Belgium, NL et al 7 594 110 25.12.1999 Winter storm Lothar Switzerland, UK, France et al 6 410 54 18.01.2007 Winter storm Kyrill; floods Germany, UK, NL, Belgium et al 5 951 22 15.10.1987 Storm and floods in Europe France, UK, Netherlands et al 5 941 38 26.08.2004 Hurricane Frances US, Bahamas 5 326 64 25.02.1990 Winter storm Vivian Europe 5 290 26 22.09.1999 Typhoon Bart/No 18 Japan 4 723 600 20.09.1998 Hurricane Georges; floods US, Caribbean 4 453 – 04.09.2010 Earthquake (MW 7.0) New Zealand 4 439 41 05.06.2001 Tropical storm Allison; floods US 4 390 3 034 13.09.2004 Hurricane Jeanne; floods, landslides US, Caribbean: Haiti et al 4 139 45 06.09.2004 Typhoon Songda/No 18 Japan, South Korea 3 800 45 02.05.2003 Thunderstorms, tornadoes, hail US 3 695 70 10.09.1999 Hurricane Floyd; floods US, Bahamas, Columbia 3 586 59 01.10.1995 Hurricane Opal; floods US, Mexico, Gulf of Mexico 3 538 6 425 17.01.1995 Great Hanshin earthquake (M 7.2) in Kobe Japan 3 315 25 24.01.2009 Winter storm Klaus France, Spain 3 142 45 27.12.1999 Winter storm Martin Spain, France, Switzerland 2 963 246 10.03.1993 Blizzard, tornadoes, floods US, Canada, Mexico, Cuba 2 799 38 06.08.2002 Severe floods UK, Spain, Germany, Austria et al 2 754 64 27.02.2010 Winter storm Xynthia France, Germany, Belgium at al 2 723 26 20.10.1991 Forest fires which spread to urban areas, drought US 2 710 – 06.04.2001 Hail, floods, tornadoes US 2 653 135 26.08.2008 Hurricane Gustav, floods; offshore damage US, Caribbean, Gulf of Mexico et al 2 616 4 25.06.2007 Floods caused by heavy rain UK 2 581 30 18.09.2003 Hurricane Isabel US, Canada 2 528 39 05.09.1996 Hurricane Fran US 2 494 20 03.12.1999 Winter storm Anatol Denmark, Sweden, UK et al
Source: Swiss Re Economic Research & Consulting
7 Property and business interruption, excluding liability and life insurance losses;US natural catastrophe figures: with the permission of Property Claim Services (PCS)/incl. NFIP losses (see page 34 “Terms and selection criteria”)
8 Dead or missing
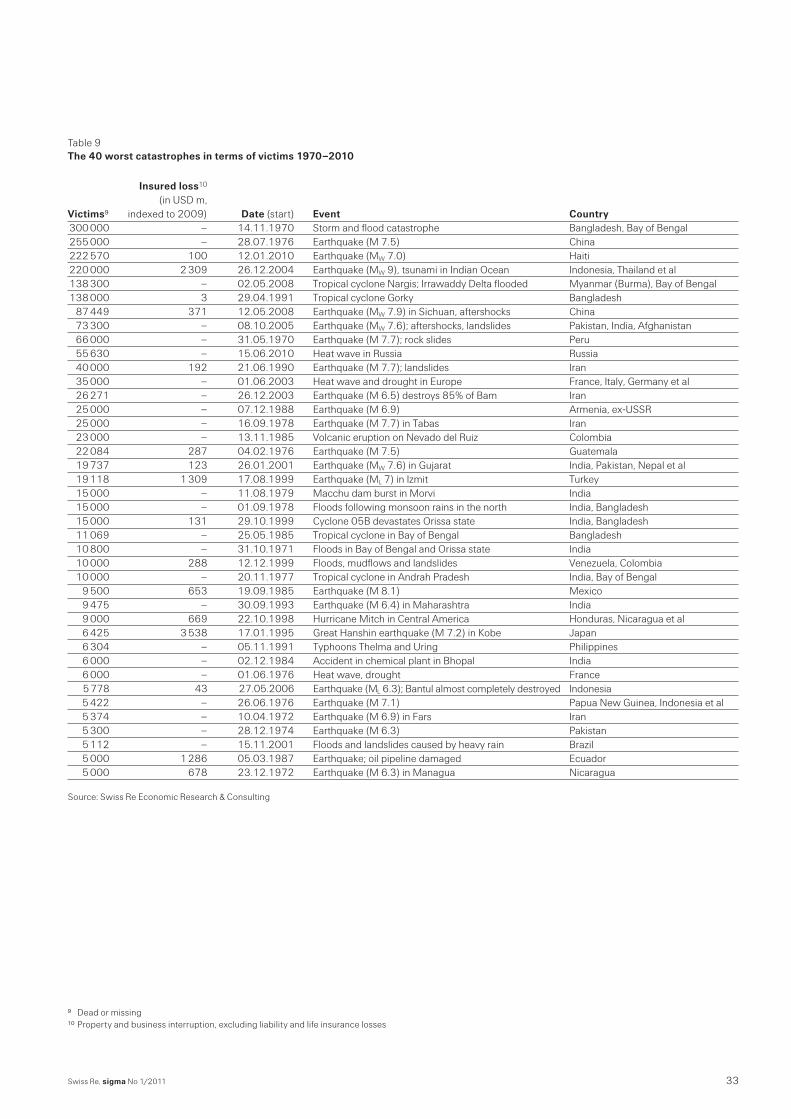
33Swiss Re, sigma No 1/2011
Table 9The 40 worst catastrophes in terms of victims 1970–2010
Insured loss10
(in USD m, Victims9 indexed to 2009)10 Date (start) Event Country 300 000 – 14.11.1970 Storm and flood catastrophe Bangladesh, Bay of Bengal 255 000 – 28.07.1976 Earthquake (M 7.5) China 222 570 100 12.01.2010 Earthquake (MW 7.0) Haiti 220 000 2 309 26.12.2004 Earthquake (MW 9), tsunami in Indian Ocean Indonesia, Thailand et al 138 300 – 02.05.2008 Tropical cyclone Nargis; Irrawaddy Delta flooded Myanmar (Burma), Bay of Bengal 138 000 3 29.04.1991 Tropical cyclone Gorky Bangladesh 87 449 371 12.05.2008 Earthquake (MW 7.9) in Sichuan, aftershocks China 73 300 – 08.10.2005 Earthquake (MW 7.6); aftershocks, landslides Pakistan, India, Afghanistan 66 000 – 31.05.1970 Earthquake (M 7.7); rock slides Peru 55 630 – 15.06.2010 Heat wave in Russia Russia 40 000 192 21.06.1990 Earthquake (M 7.7); landslides Iran 35 000 – 01.06.2003 Heat wave and drought in Europe France, Italy, Germany et al 26 271 – 26.12.2003 Earthquake (M 6.5) destroys 85% of Bam Iran 25 000 – 07.12.1988 Earthquake (M 6.9) Armenia, ex-USSR 25 000 – 16.09.1978 Earthquake (M 7.7) in Tabas Iran 23 000 – 13.11.1985 Volcanic eruption on Nevado del Ruiz Colombia 22 084 287 04.02.1976 Earthquake (M 7.5) Guatemala 19 737 123 26.01.2001 Earthquake (MW 7.6) in Gujarat India, Pakistan, Nepal et al 19 118 1 309 17.08.1999 Earthquake (ML 7) in Izmit Turkey 15 000 – 11.08.1979 Macchu dam burst in Morvi India 15 000 – 01.09.1978 Floods following monsoon rains in the north India, Bangladesh 15 000 131 29.10.1999 Cyclone 05B devastates Orissa state India, Bangladesh 11 069 – 25.05.1985 Tropical cyclone in Bay of Bengal Bangladesh 10 800 – 31.10.1971 Floods in Bay of Bengal and Orissa state India 10 000 288 12.12.1999 Floods, mudflows and landslides Venezuela, Colombia 10 000 – 20.11.1977 Tropical cyclone in Andrah Pradesh India, Bay of Bengal 9 500 653 19.09.1985 Earthquake (M 8.1) Mexico 9 475 – 30.09.1993 Earthquake (M 6.4) in Maharashtra India 9 000 669 22.10.1998 Hurricane Mitch in Central America Honduras, Nicaragua et al 6 425 3 538 17.01.1995 Great Hanshin earthquake (M 7.2) in Kobe Japan 6 304 – 05.11.1991 Typhoons Thelma and Uring Philippines 6 000 – 02.12.1984 Accident in chemical plant in Bhopal India 6 000 – 01.06.1976 Heat wave, drought France 5 778 43 27.05.2006 Earthquake (ML 6.3); Bantul almost completely destroyed Indonesia 5 422 – 26.06.1976 Earthquake (M 7.1) Papua New Guinea, Indonesia et al 5 374 – 10.04.1972 Earthquake (M 6.9) in Fars Iran 5 300 – 28.12.1974 Earthquake (M 6.3) Pakistan 5 112 – 15.11.2001 Floods and landslides caused by heavy rain Brazil 5 000 1 286 05.03.1987 Earthquake; oil pipeline damaged Ecuador 5 000 678 23.12.1972 Earthquake (M 6.3) in Managua Nicaragua
Source: Swiss Re Economic Research & Consulting
9 Dead or missing10 Property and business interruption, excluding liability and life insurance losses
Swiss Re, sigma No 1/201134
Terms and selection criteria
Naturalcatastrophes The term “natural catastrophe” refers to an event caused by natural forces. Such an
event generally results in a large number of individual losses involving many insurance policies. The scale of the losses resulting from a catastrophe depends not only on the severity of the natural forces concerned, but also on man-made factors, such as build-ing design or the efficiency of disaster control in the afflicted region. In this sigma study, natural catastrophes are subdivided into the following categories: floods, storms, earth-quakes, droughts/forest fires/heat waves, cold waves/frost, hail, tsunami and other natural catastrophes.
Man-madedisasters This study categorises as “man-made” or “technical” disasters major events associated
with human activities. Generally, a large object in a very limited space is affected, which is covered by a small number of insurance policies. War, civil war and war-like events are excluded. sigma subdivides man-made disasters into the following categories: ma-jor fires and explosions, aviation and space disasters, shipping disasters, rail disasters, mining accidents, collapse of buildings/bridges and miscellaneous (including terrorism). In Tables 6 and 7 (pages 16–31), all major natural catastrophes and man-made dis-asters and the associated losses are listed chronologically.
Totallosses For the purposes of the present sigma study, total losses are all the financial losses
directly attributable to a major event, ie damage to buildings, infrastructure, vehicles etc. The term also includes losses due to business interruption as a direct consequence of the property damage. A figure identified as “total damage” or “economic loss” includes all damage, insured and uninsured. Total loss figures do not include indirect financial losses – ie loss of earnings by suppliers due to disabled businesses, estimated shortfalls in gross domestic product, and non-economic losses, such as loss of reputa-tion or impaired quality of life.
Generally, total (or economic) losses are estimated and communicated in very different ways. As a result, they are not directly comparable and should be seen only as an indi-cation of the general order of magnitude.
Insuredlosses “Losses” refer to all insured losses except liability. Leaving aside the liability losses, on
one hand, allows a relatively swift assessment of the insurance year; on the other hand, however, it tends to understate the cost of man-made disasters. Life insurance losses are also not included.
NFIPflooddamageintheUS The sigma catastrophe database also includes flood damage covered by the National
Flood Insurance Program (NFIP) in the US, provided that it fulfils the sigma selection criteria.
A natural catastrophe is caused by natural forces.
A man-made or technical disaster is triggered by human activities.
Losses due to property damage and business interruption that are directly attributable to major events are included in this study.
The amount of the total losses is a general indication only.
The term “losses” refer to insured losses, but do not include liability.
NFIP flood damage in the US is included.
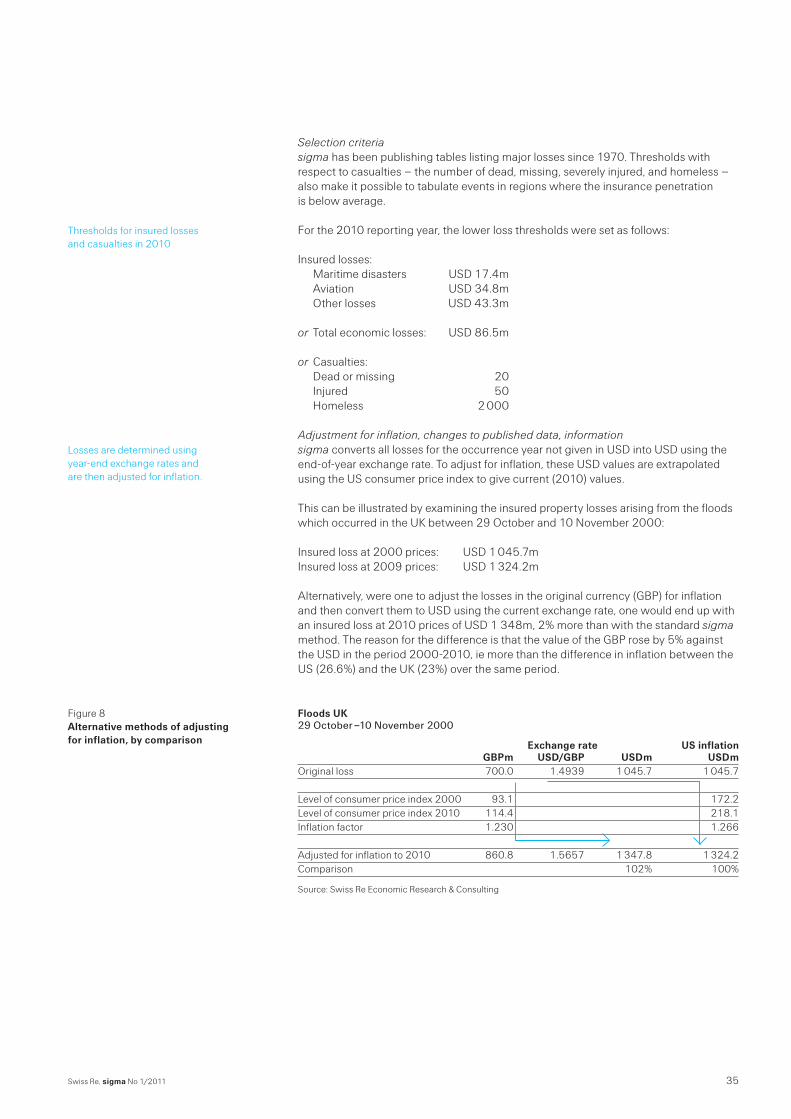
35Swiss Re, sigma No 1/2011
Selectioncriteria sigma has been publishing tables listing major losses since 1970. Thresholds with
respect to casualties – the number of dead, missing, severely injured, and homeless – also make it possible to tabulate events in regions where the insurance penetration is below average.
For the 2010 reporting year, the lower loss thresholds were set as follows:
Insured losses: Maritime disasters USD 17.4m Aviation USD 34.8m Other losses USD 43.3m
or Total economic losses: USD 86.5m
or Casualties: Dead or missing 20 Injured 50 Homeless 2 000
Adjustmentforinflation,changestopublisheddata,information sigma converts all losses for the occurrence year not given in USD into USD using the
end-of-year exchange rate. To adjust for inflation, these USD values are extrapolated using the US consumer price index to give current (2010) values.
This can be illustrated by examining the insured property losses arising from the floods which occurred in the UK between 29 October and 10 November 2000:
Insured loss at 2000 prices: USD 1 045.7m Insured loss at 2009 prices: USD 1 324.2m
Alternatively, were one to adjust the losses in the original currency (GBP) for inflation and then convert them to USD using the current exchange rate, one would end up with an insured loss at 2010 prices of USD 1 348m, 2% more than with the standard sigma method. The reason for the difference is that the value of the GBP rose by 5% against the USD in the period 2000-2010, ie more than the difference in inflation between the US (26.6%) and the UK (23%) over the same period.
Floods UK29 October –10 November 2000
Exchange rate US inflation GBP m USD/GBP USD m USD m
Original loss 700.0 1.4939 1 045.7 1 045.7 Level of consumer price index 2000 93.1 172.2Level of consumer price index 2010 114.4 218.1Inflation factor 1.230 1.266 Adjusted for inflation to 2010 860.8 1.5657 1 347.8 1 324.2Comparison 102% 100%
Source: Swiss Re Economic Research & Consulting
Thresholds for insured losses and casualties in 2010
Losses are determined using year-end exchange rates and are then adjusted for inflation.
Figure 8Alternative methods of adjusting for inflation, by comparison
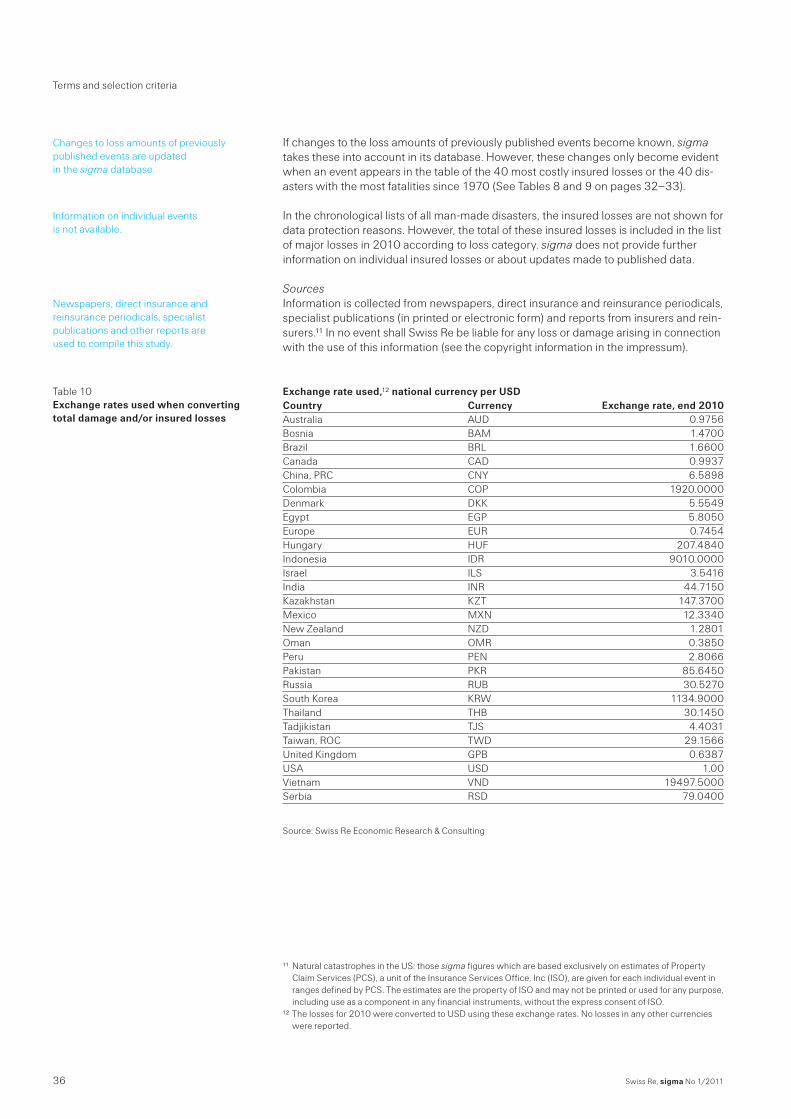
Swiss Re, sigma No 1/201136
Terms and selection criteria
If changes to the loss amounts of previously published events become known, sigma takes these into account in its database. However, these changes only become evident when an event appears in the table of the 40 most costly insured losses or the 40 dis-asters with the most fatalities since 1970 (See Tables 8 and 9 on pages 32–33).
In the chronological lists of all man-made disasters, the insured losses are not shown for data protection reasons. However, the total of these insured losses is included in the list of major losses in 2010 according to loss category. sigma does not provide further information on individual insured losses or about updates made to published data.
Sources Information is collected from newspapers, direct insurance and reinsurance periodicals,
specialist publications (in printed or electronic form) and reports from insurers and rein-surers.11 In no event shall Swiss Re be liable for any loss or damage arising in connection with the use of this information (see the copyright information in the impressum).
Exchange rate used,12 national currency per USDCountry Currency Exchange rate, end 2010Australia AUD 0.9756Bosnia BAM 1.4700Brazil BRL 1.6600Canada CAD 0.9937China, PRC CNY 6.5898Colombia COP 1920.0000Denmark DKK 5.5549Egypt EGP 5.8050Europe EUR 0.7454Hungary HUF 207.4840Indonesia IDR 9010.0000Israel ILS 3.5416India INR 44.7150Kazakhstan KZT 147.3700Mexico MXN 12.3340New Zealand NZD 1.2801Oman OMR 0.3850Peru PEN 2.8066Pakistan PKR 85.6450Russia RUB 30.5270South Korea KRW 1134.9000Thailand THB 30.1450Tadjikistan TJS 4.4031Taiwan, ROC TWD 29.1566United Kingdom GPB 0.6387USA USD 1.00Vietnam VND 19497.5000Serbia RSD 79.0400
Source: Swiss Re Economic Research & Consulting
11 Natural catastrophes in the US: those sigma figures which are based exclusively on estimates of Property Claim Services (PCS), a unit of the Insurance Services Office, Inc (ISO), are given for each individual event in ranges defined by PCS. The estimates are the property of ISO and may not be printed or used for any purpose, including use as a component in any financial instruments, without the express consent of ISO.
12 The losses for 2010 were converted to USD using these exchange rates. No losses in any other currencies were reported.
Changes to loss amounts of previously published events are updated in the sigma database.
Information on individual events is not available.
Newspapers, direct insurance and reinsurance periodicals, specialist publications and other reports are used to compile this study.
Table 10Exchange rates used when converting total damage and/or insured losses
Recent sigma publications
2011 No 1 Natural catastrophes and man-made disasters in 2010: a year of devastating and costly events
2010 No 1 Natural catastrophes and man-made disasters in 2009: catastrophes claim fewer victims, insured losses fall
No 2 World insurance in 2009: premiums dipped, but industry capital improved No 3 Regulatory issues in insurance No 4 The impact of inflation on insurers No 5 Insurance investment in a challenging global environment No 6 Microinsurance – risk protection for 4 billion people
2009 No 1 Scenario analysis in insurance No 2 Natural catastrophes and man-made disasters in 2008:
North America and Asia suffer heavy losses No 3 World insurance in 2008: life premiums fall in the industrialised countries – strong
growth in the emerging economies No 4 The role of indices in transferring insurance risks to the capital markets No 5 Commercial liability: a challenge for businesses and their insurers
2008 No 1 Natural catastrophes and man-made disasters in 2007: high losses in Europe No 2 Non-life claims reserving: improving on a strategic challenge No 3 World insurance in 2007: emerging markets leading the way No 4 Innovative ways of financing retirement No 5 Insurance in the emerging markets: overview and prospects for Islamic insurance
2007 No 1 Insurance in emerging markets: sound development; greenfield for agricultural insurance No 2 Natural catastrophes and man-made disasters in 2006: low insured losses No 3 Annuities: a private solution to longevity risk No 4 World insurance in 2006: premiums came back to “life” No 5 Bancassurance: emerging trends, opportunities and challenges No 6 To your health: diagnosing the state of healthcare and the global private
medical insurance industry
2006 No 1 Getting together: globals take the lead in life insurance M & A No 2 Natural catastrophes and man-made disasters 2005:
high earthquake casualties, new dimension in windstorm losses No 3 Measuring underwriting profitability of the non-life insurance industry No 4 Solvency II: an integrated risk approach for European insurers No 5 World insurance in 2005: moderate premium growth, attractive profitability No 6 Credit and surety: solidifying commitments No 7 Securitization – new opportunities for insurers and investors
2005 No 1 Natural catastrophes and man-made disasters in 2004:
more than 300 000 fatalities, record insured losses No 2 World insurance 2004: growing premiums and stronger balance sheets No 3 Insurersʼ cost of capital and economic value creation:
principles and practical implications No 4 Innovating to insure the uninsurable No 5 Insurance in emerging markets: focus on liability developments
Swiss Reinsurance Company LtdEconomic Research & ConsultingMythenquai 50/60P.O. Box8022 ZurichSwitzerland
Telephone +41 43 285 2551Fax +41 43 282 [email protected]