Embed Size (px)
Citation preview
MEMORANDUM REPORT
NOVEMBER 1979
NATURAL GAMMA RAY/
NEUTRON POROSITY
LOGGING
SOUTH FLORIDA WATER MANAGEMENT DISTRICT
A MEMORANDUM REPORT
NOVEMBER, 1979
SOUTH FLORIDA WATER MANAGEMENT DISTRICT NATURAL GAMMA RAY/NEUTRON POROSITY LOGGING
by
Michael P. Brown and
Steven Anderson Groundwater Division
Resource Planning Department South Florida Water Management District
West Palm Beach, Florida 33402
TABLE OF CONTENTS
Page
INTRODUCTION........................................................... 1
NATURAL GAMMA RAY LOGS................................................. 1
NATURAL GAMMA RAY EQUIPMENT DESCRIPTION.............................. 2
GAMMA RAY CALIBRATION PRINCIPLES..................................... 5
NEUTRON POROSITY LOGS.................................................. 5
NEUTRON POROSITY EQUIPMENT DESCRIPTION............................... 8
NEUTRON POROSITY CALIBRATION PRINCIPLES.............................. 8
NUCLEAR LOGGING STATISTICAL VARIATIONS............................... 9
API CALIBRATION TEST PITS............................................. 9
NATURAL GAMMA RAY API TEST PIT CALIBRATION PROCEDURES............... 11
NEUTRON POROSITY API TEST PIT CALIBRATION PROCEDURES................ 13
CALIBRATION RESULTS....................................................15
SELECTED REFERENCES....................................................25
ILLUSTRATIONS
Figure No. Page
1 TYPICAL LEVELS OF GAMMA RADIATION ASSOCIATED WITH VARIOUS ROCK TYPES (TAKEN FROM DRESSERATLAS, 1974)........................................... 3
2 TYPCIAL GAMMA AND NEUTRON RESPONSES FOR DIFFERENTLITHOLOGIES (TAKEN FROM DRESSER ATLAS, 1974).......... 4
3 SETUP FOR THE GAMMA RAY CALIBRATOR (TAKEN FROMG.O.I., 1978).......................................... 6
4 STANDARD FIELD CALIBRATION RECORDING................. 7
5 STANDARD NEUTRON POROSITY FIELD CALIBRATOR(MODIFIED G.O.I., 1977)............................... 10
6 GAMMA RAY CALIBRATION PIT (TAKEN FROM A.P.I.,1971)................................................... 12
ILLUSTRATIONS Continued.
Figure No. Page
7 NEUTRON LOG CALIBRATION PIT (TAKEN FROMAPI, 1971)............................... ............... 14
8 NATURAL GAMMA RAY RUN #1 IN THE GAMMA RAY APITEST PIT, UNIVERSITY OF HOUSTON........................16
9 NATURAL GAMMA RAY RUN #2 IN THE GAMMA RAY APITEST PIT, UNIVERSITY OF HOUSTON........................17
10 NATURAL GAMMA RAY CALIBRATION USING THE G.O.I.GAMMA RAY FIELD CALIBRATOR..............................18
11 NEUTRON POROSITY TEST RUN #1 IN THE API TESTPIT.......................................................20
12 NEUTRON POROSITY TEST RUN #2 IN THE API TESTPIT....................................................... 21
13 NEUTRON POROSITY RESPONSES WITH THE PROBESTATIONARY AT THE CENTER OF EACH TEST PITMEDIA.................................................... 22
14 NEUTRON POROSITY CALIBRATION USING THE G.O.I.FIELD CALIBRATOR........................................ 23
15 TYPE NEUTRON LOG RESPONSE WITH API TEST PITMEASUREMENTS SUPERIMPOSED ON CURVE (MODIFIEDFROM G.O.I., 1977)...................................... 24
NUCLEAR LOGGING
Introduction
Nuclear logging, also known as radiation logging, comprises methods
of measuring the intensity of either induced or natural radiations emitted
by the formation. Nuclear logs have a fundamental advantage over most
other logs - they can be made in either cased or open holes filled with
any type of fluid. Four major types of nuclear logging are employed in
groundwater resources investigations:
(1) Natural Gamma Ray
(2) Neutron Gamma
(3) Neutron Porosity
(4) Gamma Gamma Density
Our discussion will be restricted to natural gamma ray and neutron porosity
logging.
Natural Gamna Ray Logs
All substances are assemblages of atoms. Each atom comprises a nucleus,
made up of neutrons and protons packed together with electrons revolving
around the nucleus. The arrangement of neutrons and protons in the atoms
of certain elements is unstable, occasionally a natural rearrangement occurs
during which protons and neutrons are ejected from the nucleus and energy
is emitted in the form of gamma rays. Virtually all rocks contain radio-
active elements, commonly uranium, thorium and potassium.
Mechanical and chemical erosion (weathering), principally of igneous
rocks, forms the major portion of sedimentary clastic formations (e.g.,
sandstones and shales). These acidic rocks originally contain the major
portion of the earth's potassium and a large fraction of the uranium.
-1-
In south Florida, carbonate rocks were developed by either direct
precipitation from sea water, or from calcareous marine skeletal matter.
Pure carbonate sediments have low radioactivity. When magnesium ions
in migrating groundwaters cause dolomitization, slightly higher radioactive
levels are often observed. Also, phosphorites abundant in south Florida's
Miocene and younger sediments have high radioactivity.
Figure 1 shows the level of radiation normally associated with various
rock types. The length of the line denotes the intensity range in API
Gamma Ray Units. The vertical width of the line increases with the frequency
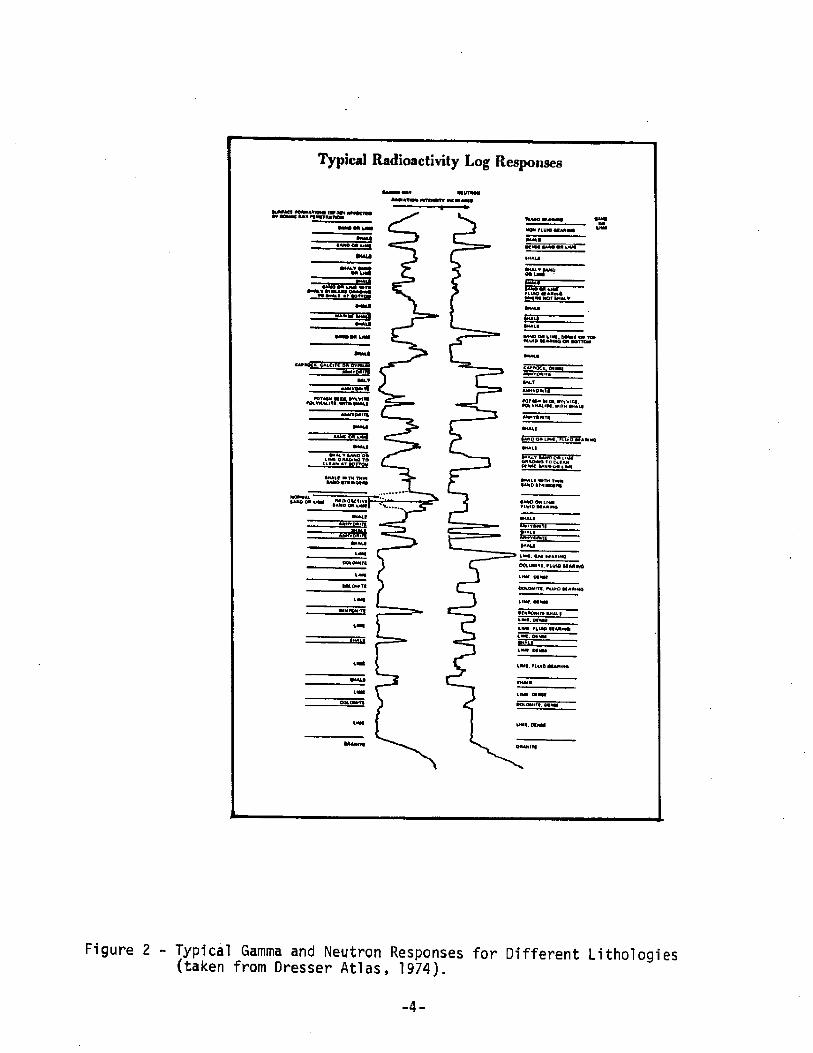
of occurrence. Figure 2 shows assorted gamma ray responses "idealized" for
different lithologies.
The primary application to date of the natural gamma ray log is: (1)
lithology identification and stratigraphic correlation; (2) as an index to
permeability in clay formations; and (3) for use in monitoring changes in
well screens due to plugging.
Natural Gamma Ray Equipment Description
The SFWMD Groundwater Division's Research Geophysical Logger utilizes
a Gearhart-Owen 1-11/16 inch O.D., gamma ray, casing collar locator (ccl),
Neutron Porosity Tool. The electronics are all solid state and most of
the circuit functions are performed by high temperature rated integrated
circuits mounted in field replaceable modules. The detector is a high
sensitivity scintillation type with a sodium iodide crystal emitting light
pulses optically coupled to a photomultiplier tube where a pulse of electrical
current amplified about 1 X 10® times, is produced. This pulse is sent to
the surface equipment (ratemeter module) where the pulses are integrated
over a preset time constant and a DC-voltage output is used to drive the
recorder pen to reflect the formation's natural gamma radiation intensity in
counts per second (cps).-2-
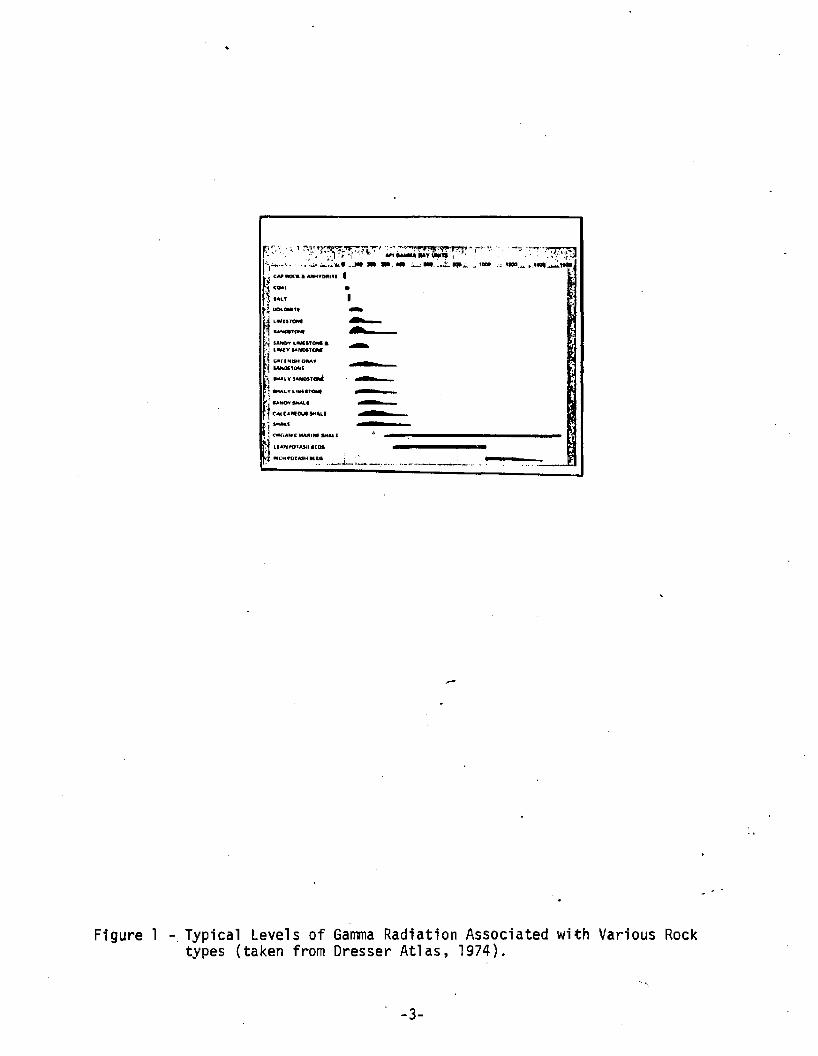
Figure 1 - Typical Levels of Gamma Radiation Associated with Various Rocktypes (taken from Dresser Atlas, 1974).
Typical Radioactivity Log Responses
■m in
Figure 2 - Typical Gamma and Neutron Responses for Different Lithologies(taken from Dresser Atlas, 1974).
-4-
Gamma Ray Calibration Principles
The purpose of calibration is simply to adjust the recorded tool response
{counts per second) in terms of "API Gamma Ray Units". The API Gamma Ray
unit is an industry standard, which has been set up in order to standardize
logs obtained by different logging instruments, relating the logs to a
standard environment. The standard environment is the gamma ray test pit
at the University of Houston. We will discuss the API test pit later.
Field calibration of the gamma ray tool is accomplished by the use of a
Gearhart-Owen Gamma Ray calibrator, factory adjusted, to give a response
equivalent to 100 API units. The gamma ray calibrator provides a spacing
of 48 inches between a Cs^7 100 curie source and the detector (Figure 3)
which increases the count rate by 100 API units. Recorded with all gamma
ray logs for calibration purposes is gamma background (detector 20' from
any source and 5' above land surface on time drive) and background plus
source standard (Figure 4). The difference between background and background
plus source standard equals 100 API gamma ray units.
Neutron Porosity Logs
The neutron porosity log is often a standard counterpart of the natural
gamma ray log. Neutron logs respond to the fundamental formation property
of hydrogen richness. Upon entering the borehole with the neutron source
bombarding the formation, neutrons undergo a continuous de-energizing
process. This energy reduction occurs when neutrons emitted from the source
collide with nucleus of borehole and formation elements. A neutron loses
some of its total kinetic energy each time it is involved in either an
elastic or inelastic collision. Energy loses are a function of the angle
of collision and the relative mass of the struck nucleus. Since hydrogen atoms
are both relatively abundant and nearly equal in mass to the neutron, they are
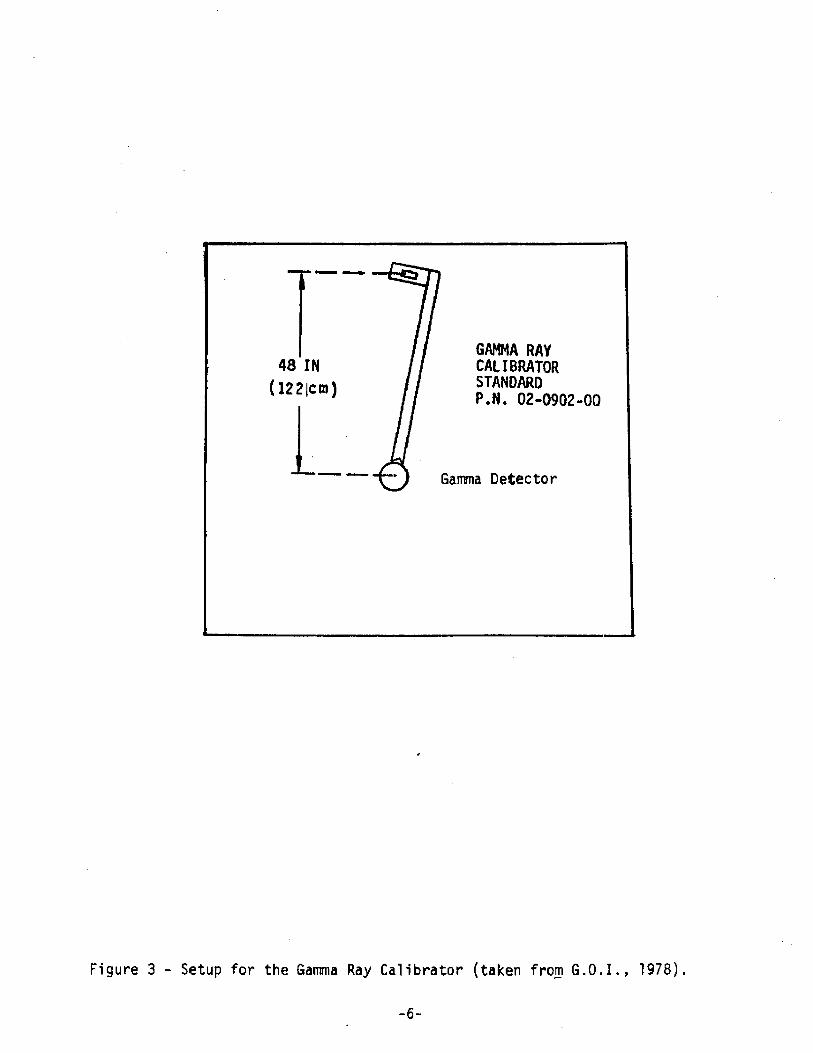
Figure 3 - Setup for the Gamma Ray Calibrator (taken from G.O.I., 1978).
-6-
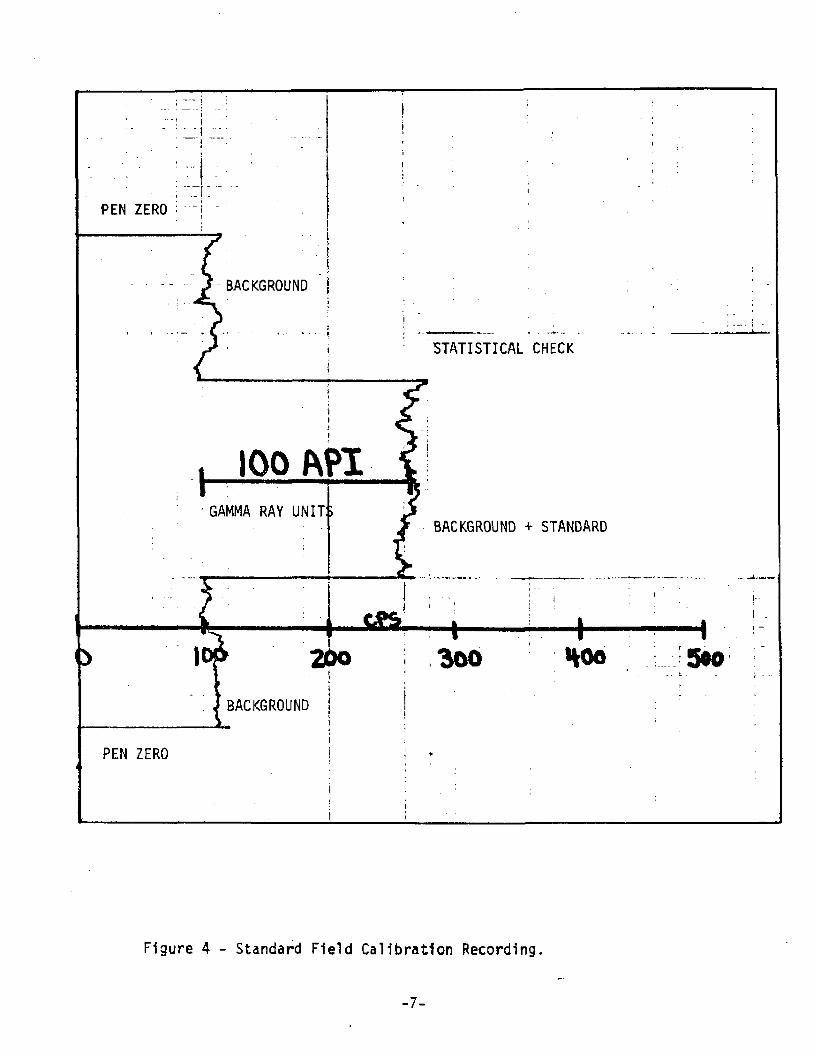
Figure 4 - Standard Field Calibration Recording.
-7-
primarily responsible for reducing high energy neutrons to their thermal
state- If all of the formations's hydrogen is contained in the form of
liquids (H2 0),and if these liquids completely occupy the total pore volume,
hydrogen richness is an index to porosity.
The primary application of the neutron porosity log is for: (1) lithologic
identification and stratigraphic correlation, (2) porosity or total water
content of the formation which may include pore water between mineral grains,
bound or absorbed water in clay, or even crystallization water in gypsum.
Neutron Porosity Equipment Description
The Groundwater Division's neutron porosity tool is connected to the
natural gamma ray tool enabling the two surveys to be made simultaneously.
The source for the neutron tool is a 3 curie Am24iBe with a neutron emission
of about 10 X 10® per second at 4.5 Mev. The detector is spaced 13.0 inches
from the source and is a He3 filled type which responds only to thermal
neutrons and is relatively insensitive to gamma radiation. As with the gamma
ray tool, the pulse is sent to the surface equipment where the pulses are
integrated over a preset time constant. The DC voltage output is used to
drive the recorder pen reflecting the formation's porosity by the relation:
uncorrected porosity^______ 1intensity (cps)
Neutron Porosity Calibration Principles
The neutron porosity calibration procedures are similar to the gamma ray
calibration. API units have been adopted by the industry to calibrate the
neutron tool. As discussed previously, API calibration is based on the tool
response in a controlled logging environment which is the neutron calibration
test pit maintained by the University of Houston, Texas.
The Division's neutron tool is calibrated in the field with a secondary
standard which was calibrated against the tool response in the API neutron
calibration test pit, University of Houston. The neutron field calibrator
consists of a plastic sleeve 26 inches long having a 8.5 inch O.D. and a
5.5 inch I.D. The field calibrator is placed over the tool as shown in
Figure 5; this will provide a known response equivalent to 1000 API neutron
units at 19% limestone porosity. On all neutron logs calibration curves
are provided with the 1000 API neutron unit response and 0 API response.
A linear function is assumed 1n this procedure.
Nuclear Logging Statistical Variations
The nature of radioactive emissions are quite random, thus a count rate
(cps) measurement of the occurrences will always be less than 100% accurate.
These time variations in emission account for the "statistical nature" of
radioactive logs. In both gamma ray and neutron logging an averaging (time
constant) circuit is used to minimize statistical fluctuations by increasing
the overall "response time" and to limit the rate at which the system can
make accurate measurements.
A statistical check will demonstrate the magnitude of statistical
variations that can be expected on a particular log (Figure 4). This type
of check is recorded for a time span at which the sonde remains stationary
with all dial settings (t.c., c/s, sen., etc.) at the same setting as when
the log was run.
API Calibration Test Pits
In order to provide standard units for natural gamma-ray and neutron
porosity measurements, the American Petroleum Institute (API) in 1948 adopted
the terms "API Gamma-Ray Unit" and "API Neutron Unit". This recommended
practice is the result of a conclusion reached by a large segment of the
-9-
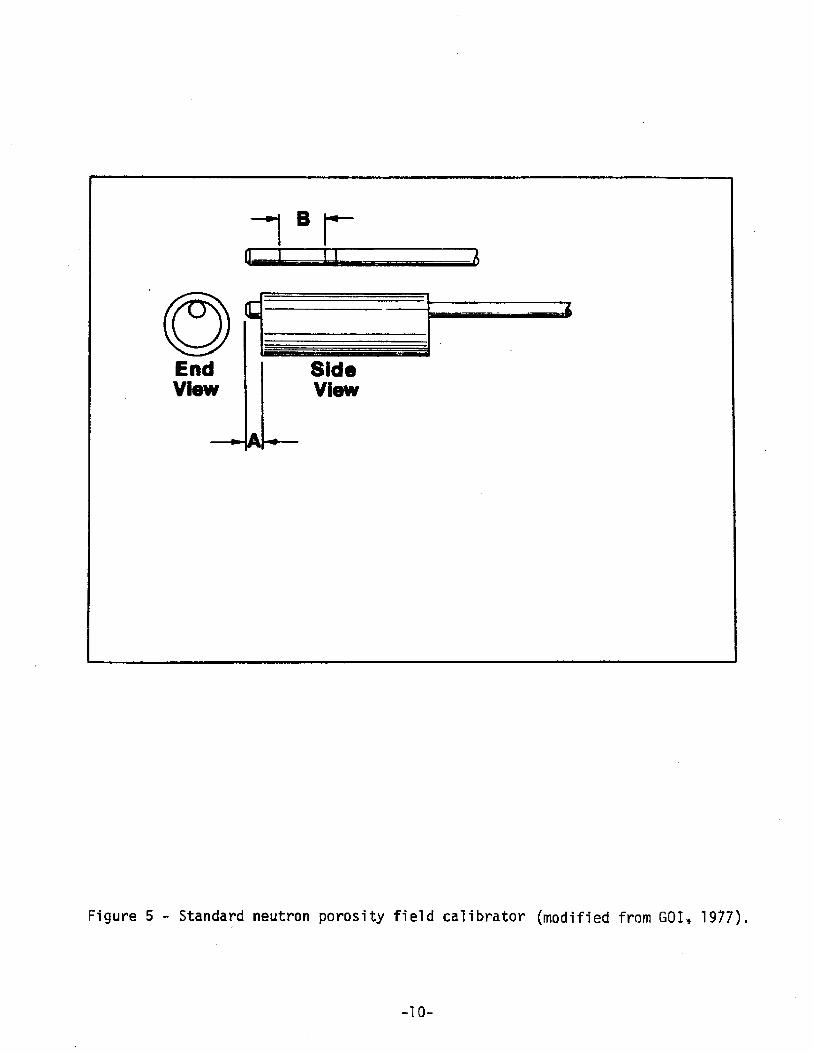
Figure 5 - Standard neutron porosity field calibrator (modified from GOI, 1977).
oil industry. The recommended practice was proposed to provide the basis
for standardizing nuclear log units for presentation, including means
for reporting adequately and uniformly the data that should accompany
each log to facilitate correct interpretation and use.
The API nuclear calibration facility is located on the campus of the
University of Houston, Houston, Texas. Operation of the facility is a
function of the University, and funds for operation and maintenance are
obtained from fees paid by users of the facility to the University.
Natural Gamma Ray API Test Pit Calibration Procedures
In order to provide a standard unit for gamma ray log measurements,
the API has adopted the term "API Ganma Ray Unit". One API Gamma-Ray Unit
is defined as 1/200 of the difference in log deflection between the zones
of low and high radiation in the gamma-ray calibration pit.
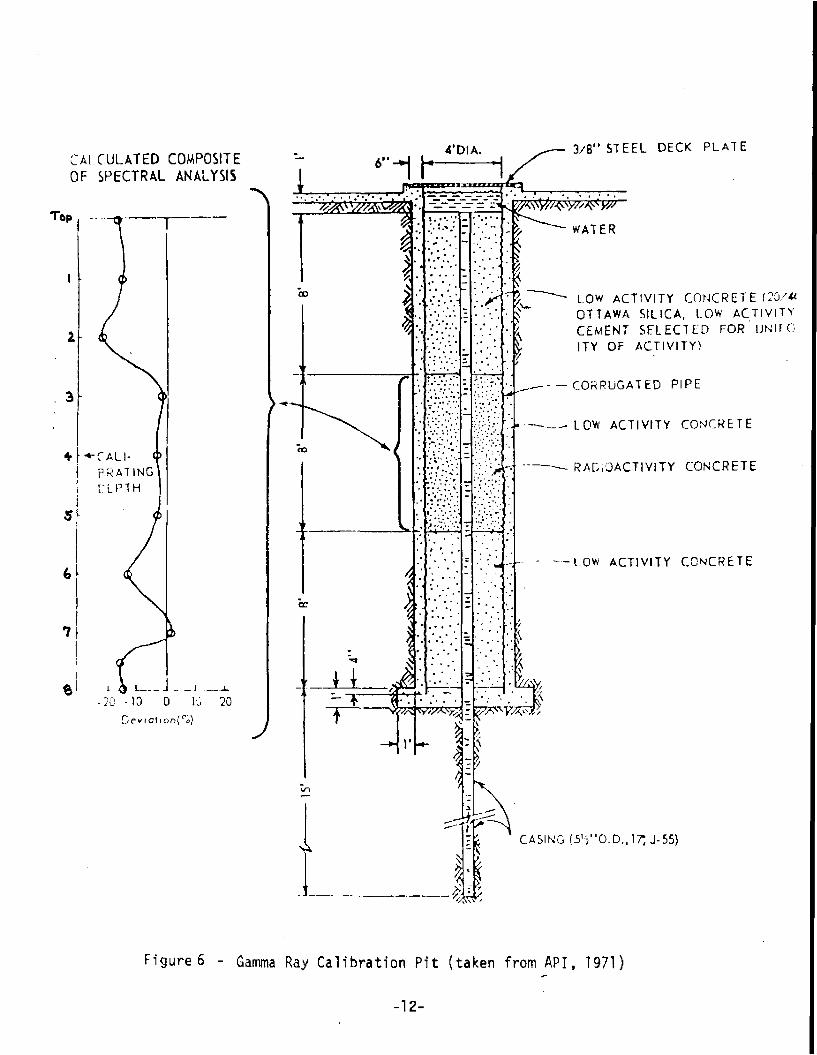
The design of the gamma-ray calibration pit is shown in Figure 6.
This pit is 4 ft. in diameter, 25 ft. deep, and is filled with three 8 ft.
thick zones of concrete. Five and one-half inch casing extends through
the 3 concrete sections and 15 ft. below the bottom of the pit. The top
and bottom concrete zones in the pit are of very low-radioactivity concrete
equal in radiation to approximately twice that of an average scale.
The calibration procedures include:
(1) A record of calibration using the field calibrator before and
after calibration runs in the pit.
(2) Two decentralized runs of the gamma-ray logging tool made in
the pit from top to bottom.
(3) The logging tool is stopped for a reading opposite the center
of the radioactive-concrete section.
-11-
CALCULATED COMPOSITE OF SPECTRAL ANALYSIS
Figure 6 - Gamma Ray Calibration Pit (taken from API, 1971)
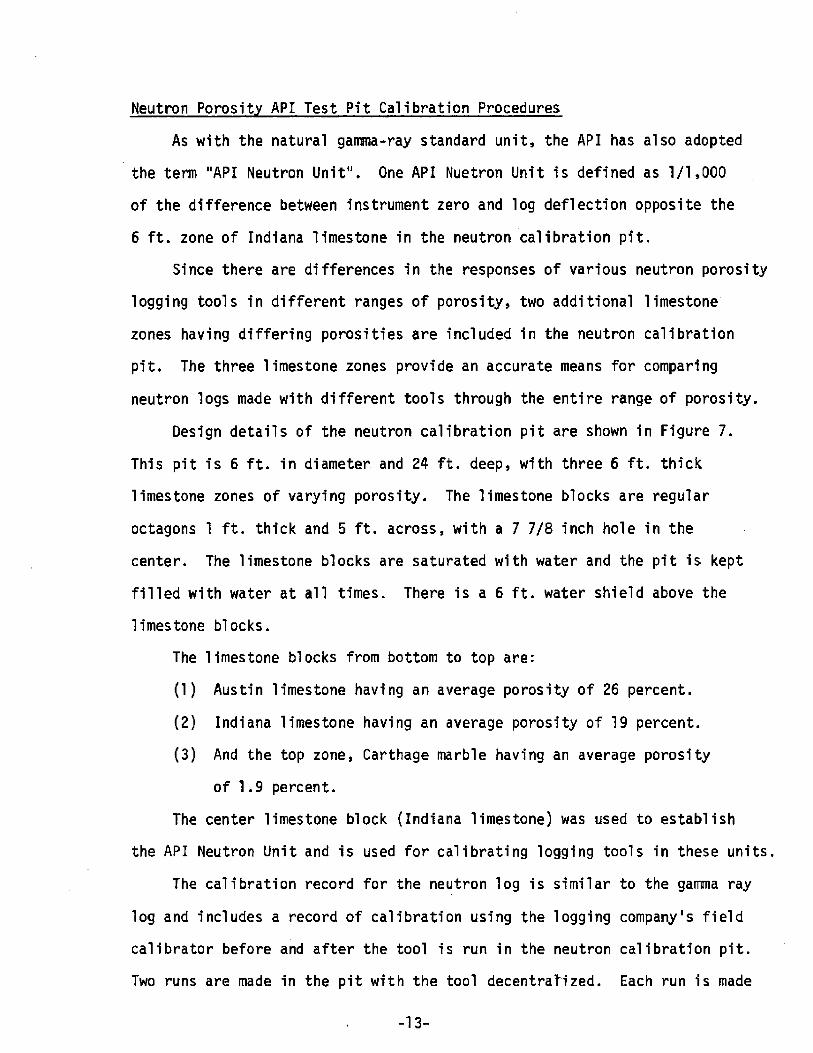
Neutron Porosity API Test Pit Calibration Procedures
As with the natural gamma-ray standard unit, the API has also adopted
the term "API Neutron Unit”. One API Nuetron Unit Is defined as 1/1,000
of the difference between instrument zero and log deflection opposite the
6 ft. zone of Indiana limestone in the neutron calibration pit.
Since there are differences in the responses of various neutron porosity
logging tools in different ranges of porosity, two additional limestone
zones having differing porosities are included in the neutron calibration
pit. The three limestone zones provide an accurate means for comparing
neutron logs made with different tools through the entire range of porosity.
Design details of the neutron calibration pit are shown in Figure 7.
This pit is 6 ft. in diameter and 24 ft. deep, with three 6 ft. thick
limestone zones of varying porosity. The limestone blocks are regular
octagons 1 ft. thick and 5 ft. across, with a 7 7/8 inch hole in the
center. The limestone blocks are saturated with water and the pit is kept
filled with water at all times. There is a 6 ft. water shield above the
limestone blocks.
The limestone blocks from bottom to top are:
(1) Austin limestone having an average porosity of 26 percent.
(2) Indiana limestone having an average porosity of 19 percent.
(3) And the top zone, Carthage marble having an average porosity
of 1.9 percent.
The center limestone block (Indiana limestone) was used to establish
the API Neutron Unit and is used for calibrating logging tools in these units.
The calibration record for the neutron log is similar to the gamma ray
log and includes a record of calibration using the logging company's field
calibrator before and after the tool is run in the neutron calibration pit.
Two runs are made in the pit with the tool decentralized. Each run is made
-13-

Figure 7 - Neutron Log Calibration Pit (taken from API, 1971)
-14-

from the bottom of the pit to the top and includes a recording of
instrument zero, the three zones of limestone blocks, the water shield
and a second instrument zero. During the calibration run, when the tool
is opposite the center of the Indiana limestone zone it should be stopped
for a calibration reading.
Calibration Results
The following figures show results for the natural gamma ray and neutron
porosity tests runs in the API test pits at the University of Houston. These
surveys were made on June 6, 1979 by logging operators, Michael P. Brown
and Steven Anderson assisted by Herman D. Collette, Research and Development,
Gearhart-Owen Industries. These runs were made under the guidelines described
in "Recommended Practice for Standard Calibration and Format for Nuclear
Logs", 1974. Two line speeds of lO'/min. and 25' min. were chosen to
produce logs that best resemble line speeds used under field conditions.
Figures 8 and 9 show natural gamma ray test runs at line speeds of
25'/min. and lO'/min. respectively. Both runs were made at a time constant
of 3. As can be observed in these figures, the deflection starting at
approximately 7 ft. is caused by the high radioactive concrete. The difference
between the low radioactive concrete baseline and the high radioactive
concrete baseline equals 200 API gamma ray units. The API scale at the top
of the log was produced using this method. The cps scale is our internal
calibration. Run #1 (Figure 8) has an average 1.20 cps/API where Run #2
(Figure 9) has a 1.17 cps/API, a difference of .03 cps/API or a 2.5% change
between the two runs.
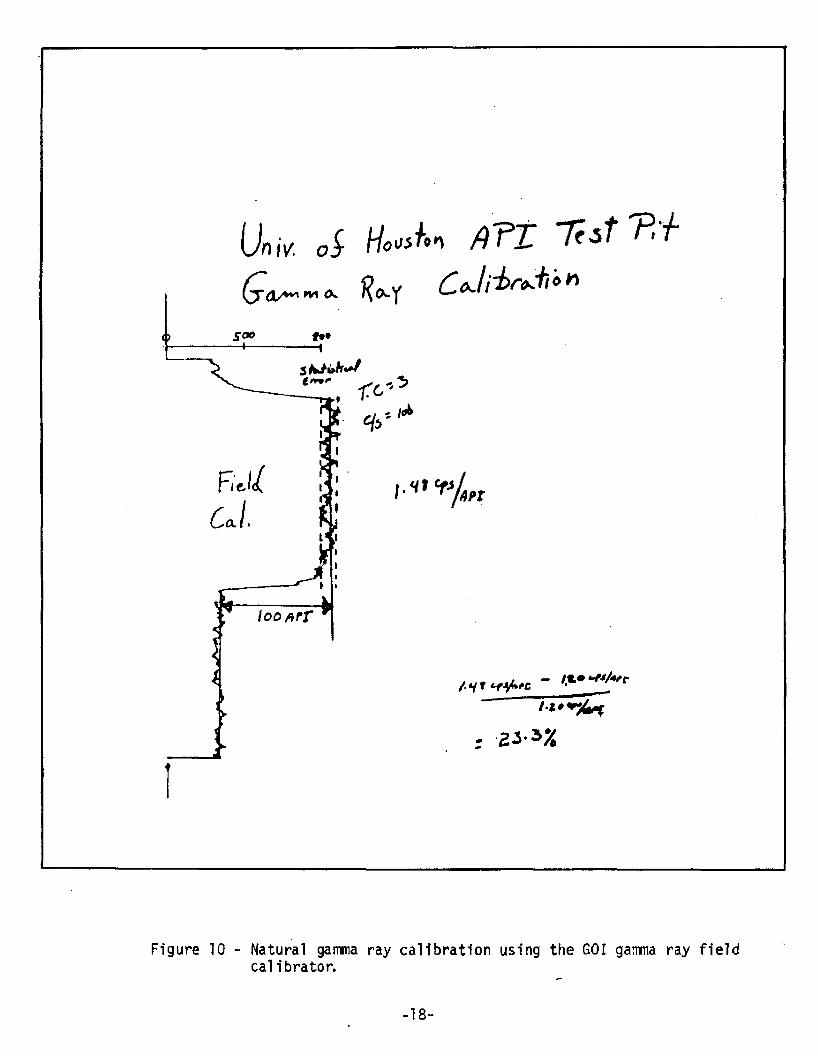
Figure 10 shows natural gamma ray calibration using the G0I field
calibrator. Results show the difference between background and background
plus standard equal to 100 API units having a 1.48 cps/API. The difference
-15-
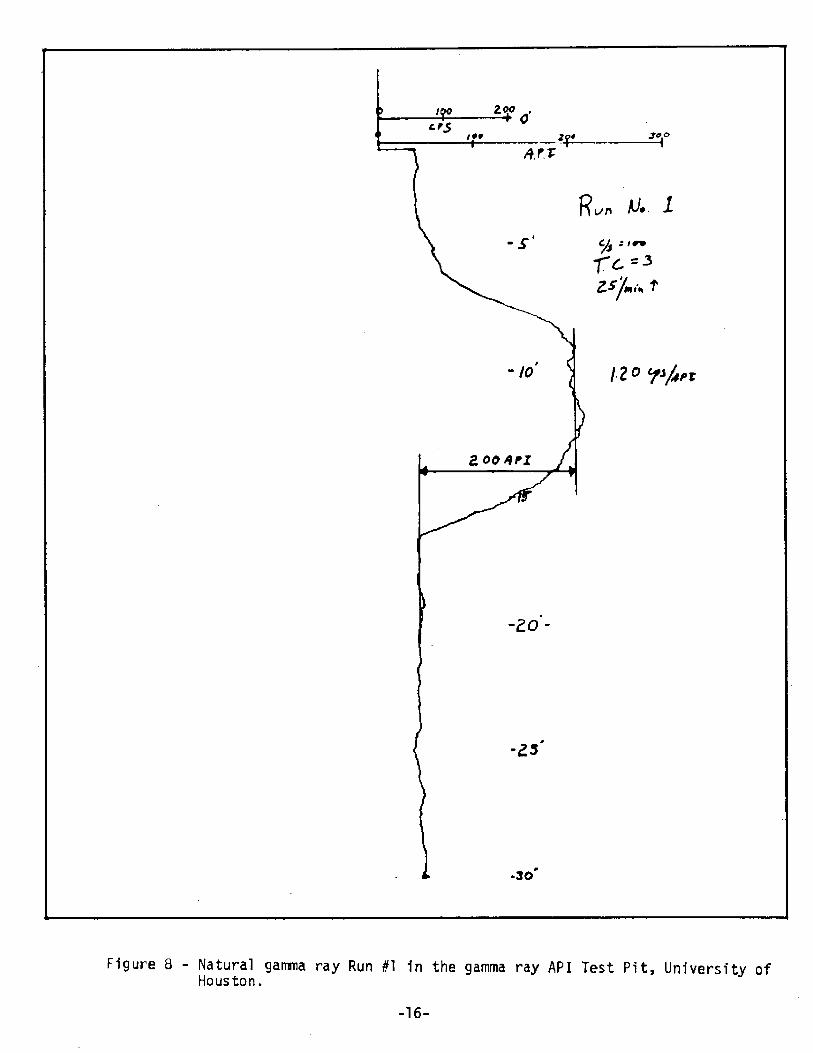
Figure 8 - Natural gamma ray Run #1 1n the gamma ray API Test Pit, University of Houston.
-16-
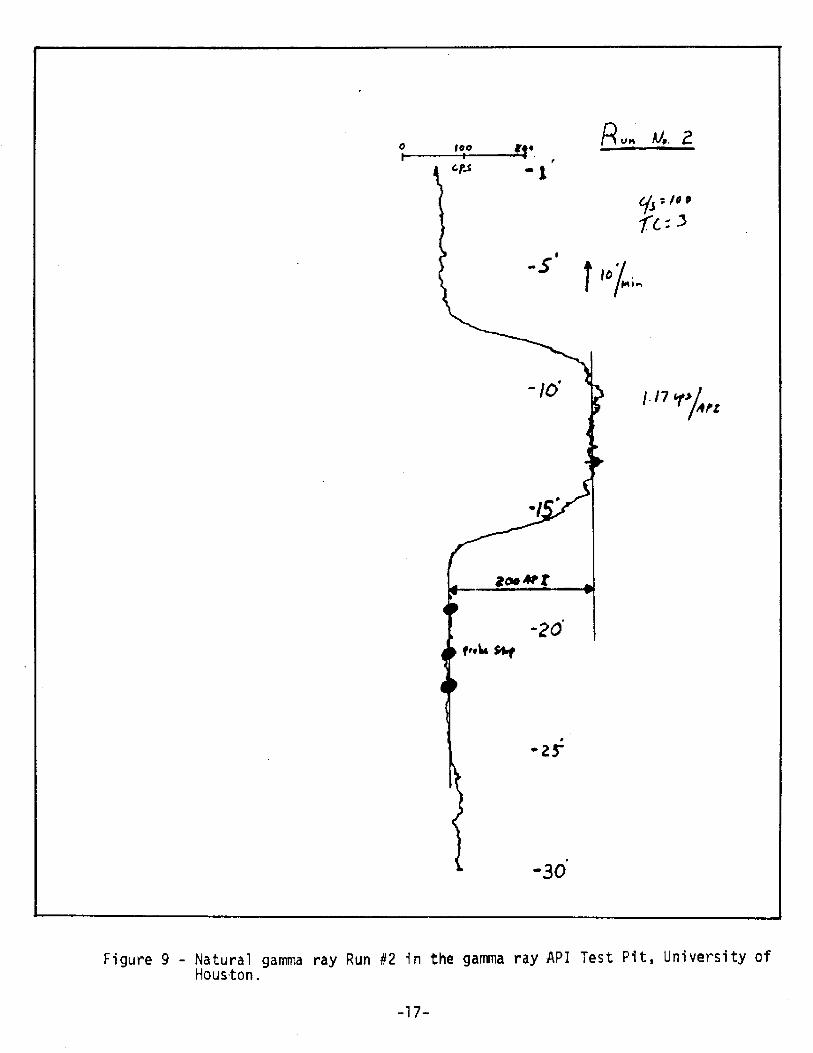
Figure 9 - Natural gamma ray Run #2 in the gamma ray API Test Pit, University of Houston.
-17-
ULi* cS HW* PiTt T'*fP.+ g A____ _ J ? * y
-
* * v / m
/ . t j f c f^ fc - /*.• » + *A ? c
t f + * M
z 2 3 ^ %
Figure 10 - Natural gamna ray calibration using the 601 gamra ray field cal ibrator.

between the field calibrator calibration and test pit calibration is
22.3%. This is not very significant considering a specified GOI
calibration error for this equipment of 25% (personal communication, GOI,
1979). Also, knowing the difference between the two calibrations a user
can correct logs to the correct test pit API unit. This type of correction
would only serve a purpose if a comparison or correlation is required
between this equipment's tool response and that of another type of calibrated
equipment.
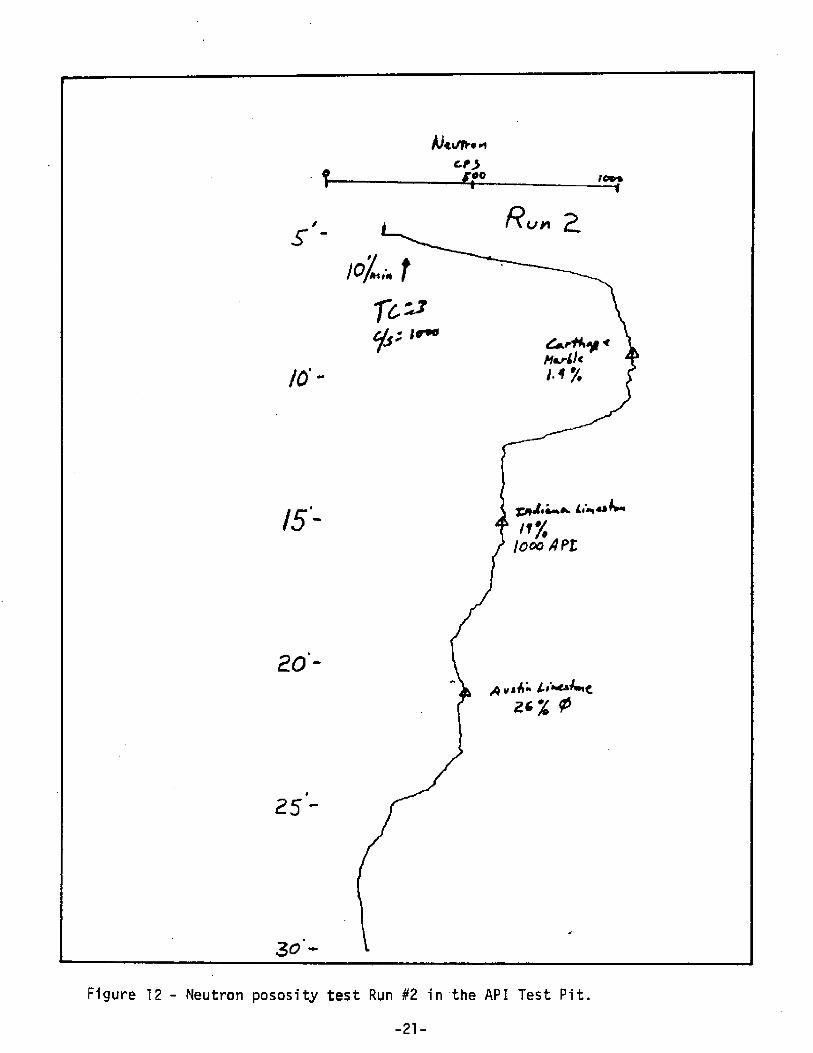
Figure 11 and 12 present neutron porosity test runs at line speeds of
25'/min. and lO'/min. logged at time constants of 2 and 3 respectively.
These surveys reflect deflections controlled by porosities of the different
test pit borehole media as described earlier (remember, porosity is inversely
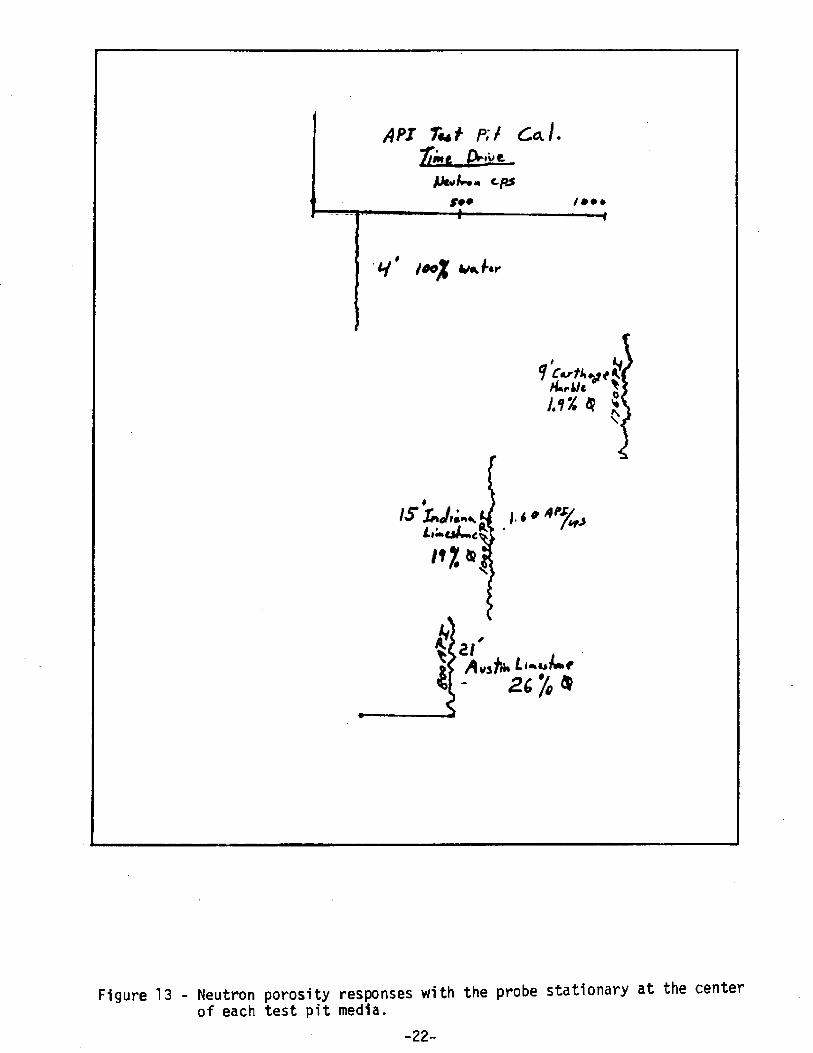
proportional to intensity). Figure 13 shows neutron intensities with the sonde
held stationary at the center of each media during which the chart recorder
was set in time drive. As can be observed, the Indian limestone at 15'
gives a neutron response of 1.60 API/cps, Figure 14 shows the calibration
using the GOI field calibrator. The response for this calibration is 1.67
API/cps having a difference between the test pit calibration and field
calibrator calibration of .07 API/cps or a 4.3% change.
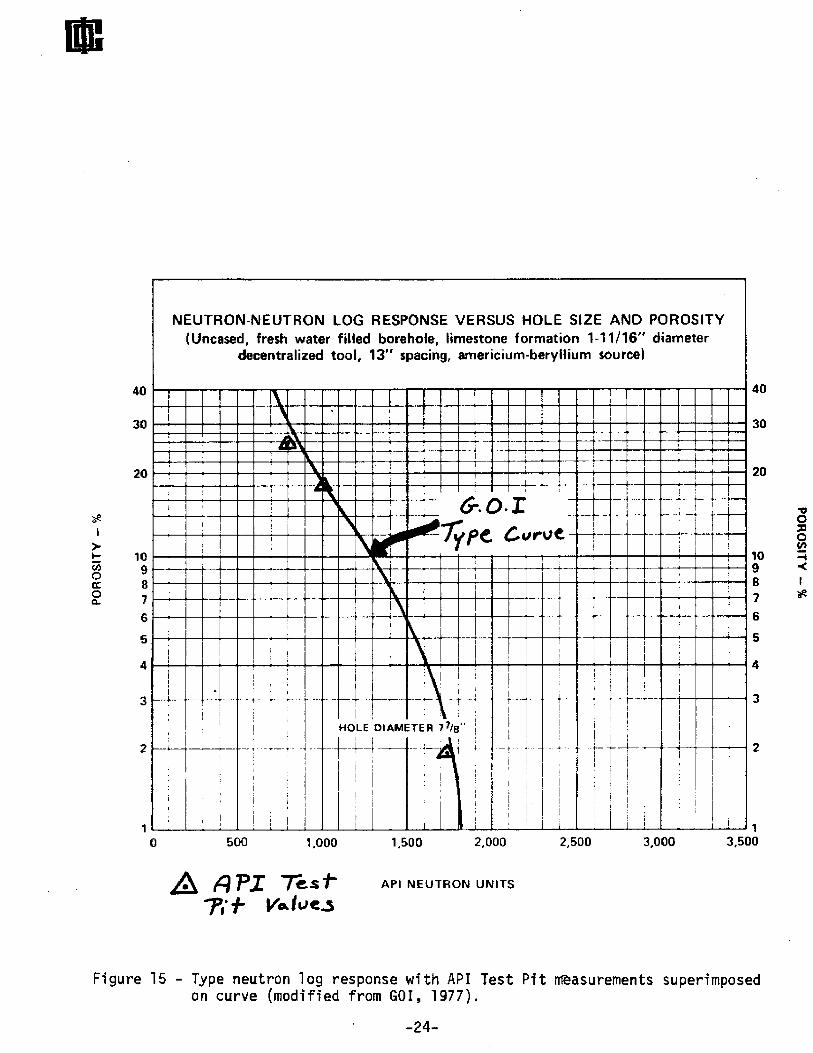
Figure 15 shows the type neutron log response for a GOI 1-1 1/16"
decentralized tool. Superimposed on this curve are the points measured in
the different porosity media of the test pit. As can be observed from
this figure, the data collected during the neutron test runs in the API
calibration pit are essentially the same as shown on the type curve.

C/n/V. 0 $
Ti /Hovs-k* f l f l T e s t
/jro- ~ti
[Jcvh-o^ 'forasi/yt n
goo IOOO
/?*» V. 1
Figure 11 - Neutron porosity test Run #1 in the API Test Pit.
- 20 -
t------------------
Figure 1 2 - Neutron pososity test Run #2 in the API Test Pit.
-21-
APT T**t P'J Co.!.
/ J t C fiS *#•--- 1------- --1
V ! • » %
„ ' (j
HirWi J]/.?% « 5<
V .
> n < > .
Figure 13 - Neutron porosity responses with the probe stationary at the center of each test pit media.
-22-

Figure 14
£ O t > ^—
t
— I
I . t o - U 7
“ u 5 — -- * - 3 *
- Neutron porosity calibration using the GOI field calibrator.
-23-
PO
RO
SIT
Y
i i
A f l P J 7 e s f - API NEUTRON UNITS7
Figure 15 - Type neutron log response with API Test Pit measurements superimposed on curve (modified from GOI, 1977).
SELECTED REFERENCES
American Petroleum Institute, 1971. Recommended Practice for StandardCalibration and Format for Nuclear Logs, API, RP 33, 3rd Edition, 13A.
Dresser Atlas, 1974. Log Review 1, Dresser Industries, Inc., pp. 8-1 through 8-21.
Gearhart-Owen Industries, Inc., 1977. Formation Evaluation Data Handbook, Gearhart-Owen Second Edition, Ft. Worth, Texas, 240 p.
Gearhart-Owen Industries, Inc., 1977. Gamma Neutron System, Gearhart-Owen, Fort Worth, Texas.
Guyod, H., 1972. Application of Borehole Geophysics to the Investigation and Development of Groundwater Resources, Water Resources Bulletin,Vol. 8, No. 1, pp. 161-174.
Hilchie, D. W., 1978. Applied Openhole Log Interpretation for Interpretation for Geologists and Engineers, Douglas W. Hilchie Inc., Golden, Colorado.
Keys, W. S., MacCary, L. M., 1971. Application of Borehole Geophysics to Water Resources Investigations, U. S. Geological Survey, Technical Water Resources Investigations, Book 2, Chap. El, 126 pp.