Embed Size (px)
Citation preview

http://pesd.stanford.edu/
Natural Gas and GeopoliticsNatural Gas and Geopolitics
CeSSACeSSA
David G. VictorDavid G. VictorProgram on Energy & Sustainable DevelopmentProgram on Energy & Sustainable Development
Stanford UniversityStanford University

Program on Energy and Sustainable Development - http://pesd.stanford.edu/ 2
Overview of the StudyOverview of the Study
• Collaboration between the James A. Baker III Institute for Public Policy, Rice University and Program on Energy and Sustainable Development, Stanford University
• Research partners conducted seven historical case studies
• New book fromCambridge University Press �
• New study: demand for gas in China and India

Program on Energy and Sustainable Development - http://pesd.stanford.edu/ 3
Gas Resources and Potential Demand
White: where the lights are on, satellite imageryBlue ���� Red : Gas resources, with increasing size (USGS)

Program on Energy and Sustainable Development - http://pesd.stanford.edu/ 4
Overview of this PresentationOverview of this Presentation
1. Changing roles for governments
• Winning suppliers are rich in gas and governance
2. Supply security and gas cartels• Few interruptions• Gas cartel unlikely
3. Gas markets in the future
• Chinese and Indian demand
• Major regulatory and political risks

Program on Energy and Sustainable Development - http://pesd.stanford.edu/ 5
Atlantic LNGQatargas LNG
Arun LNG
TransMed
YABOG
GasBol
GasAndes
The Belarus Connector
Bluestream
KKKTurkmenistan Export Routes
0 3,000 6,0001,500 Kilometers
ExistingProposed
International Gas Trade Projects: Lessons from Hist ory

Program on Energy and Sustainable Development - http://pesd.stanford.edu/ 6
1. 1. Changing Roles for GovernmentsChanging Roles for Governments
• “Old World”
• State-owned enterprises
• Tightly regulated monopolies
• Oil-indexed gas prices
• “New World”
• Private operators, financing, and contracting
• Contestable, multiple markets
• Gas-on-gas competition

Program on Energy and Sustainable Development - http://pesd.stanford.edu/ 7
From States to MarketsFrom States to Markets
1970 2000
State
Hybrid
Private
Yabog(Bolivia�Argentina)
1972
Arun(Indonesia
LNG� Japan)1978
Transmed(Algeria� Italy)
1983
QatargasLNG�
Japan1996
Belarus Connector
1996
GasBol1998
Turkmenistan ���� Iran
1997
Trinidad LNG1999
Bluestream(Russia�Turkey)
2002
GasAndes1997
Con
trol
ove
r ke
y ga
s en
terp
rises

Program on Energy and Sustainable Development - http://pesd.stanford.edu/ 8
^
Hibiscus
South Seg
Dolphin
Loran
Teak
Caribbean Sea
Venezuela
Trinidad
Tobago
AtlanticOcean
Gulf of Paria
Columbus Channel
Point Fortin
62°W
62°W
61°W
61°W
60°W
60°W
10°N 10°N
11°N 11°N
^ LNG Facilities
Gas PipelinesExisting
Proposed
Gas_Fields ]0 50 10025 Kilometers
Confidence for Investors:The Success of Trinidad and Failure of Venezuela
Program on Energy and Sustainable Development - http://pesd.stanford.edu/ 9
-2,000
-1,500
-1,000
-500
0
500
1,000
1,500
2,000
2006 2010 2014 2018 2022 2026 2030 2034 2038
BC
M
Central, South America North America Europe Russia
Other FSU Middle East North Africa Other Africa
South Asia China Asia Pacific Importers Asia Pacific Exporters
Projected Gas Trade Between RegionsProjected Gas Trade Between Regions
Source: Baker Institute World Gas Trade Model (BIWGTM)
Russia
Middle East
N. America
Europe

Program on Energy and Sustainable Development - http://pesd.stanford.edu/ 10
0
20
40
60
80
100
120
140
BC
M
2004 2012 2020
U.S.Europe
Projected US and European LNG ImportsProjected US and European LNG Imports
Source: BIWGTM, Base Case Results

Program on Energy and Sustainable Development - http://pesd.stanford.edu/ 11
2. 2. Supply SecuritySupply Security
• Rising attention to “gas security”
• How many interruptions? And by whom?
• Could a gas cartel form?

Program on Energy and Sustainable Development - http://pesd.stanford.edu/ 12
Gas Trade InterruptionsGas Trade Interruptions
1. U.S. Govt. (1981) disallows Algerian shipments in retaliation to price demands.2. YABOG (1987). Argentina refuses to take or pay for full Bolivian shipments.3. GasBol (2001). Brazil refuses full volumes contracted from Bolivia 4. Qatargas (1998). Japan demands price reductions.5. Bluestream (2002). Turkey demands price and volume reductions for Russian gas.
User
1. Russia (1997-1998). Gazprom refuses to transport Turkmen gas to Europe.2. Ukraine (mid-1990s) disputes with Gazprom over volumes and payments for gas
shipments.3. Gazprom (2004) cuts supplies to Belarus (and to Europe via Belarus Connector) in
pricing dispute with Belarus.4. Gazprom (2005-2006) cuts supplies to Ukraine during a pricing dispute but tries to
keep supplies flowing to Europe through cross-Ukraine pipelines.
Transit Country
1. Algeria (1981 to 1983). “Gas Battle” with Italy, the United States and others.2. Arun (2001). Civil unrest in Aceh disrupts shipments.3. GasAndes (2004). Argentine government curtails shipments to Chile.
Supplier
Examples from 7 Case StudiesInitiating Party

Program on Energy and Sustainable Development - http://pesd.stanford.edu/ 13
A Gas Cartel Is UnlikelyA Gas Cartel Is Unlikely
Others35%
UAE4%
Saudi Arabia4%
Qatar7%
Iran15%
Russia32%
United States3%
Distribution of Proved Gas Reserves Implies Concentration
US EIA; Proved gas reserves (2002)

Program on Energy and Sustainable Development - http://pesd.stanford.edu/ 14
3. 3. Gas Markets in the FutureGas Markets in the Future
• Will supplies materialize?
• Incredible governments, politicized resources
• Will demand materialize?
• Will CO2 regulation help gas? • Emerging gas markets in China and India

Program on Energy and Sustainable Development - http://pesd.stanford.edu/ 15
Uncertain Supplies: The Russian CaseUncertain Supplies: The Russian Case
0
100
200
300
400
500
600
700
1974 1978 1982 1986 1990 1994 1998 2002 2006 2010 2014 2018
BC
M
Urengoyskoye
YamburgskoyeMedvezh'yeZapalyarnoe
DeficitTotal Production
Source: IEA 2002, Stern, J.P. 2005

Program on Energy and Sustainable Development - http://pesd.stanford.edu/ 16
Credibility: The ‘Commitment Problem’Credibility: The ‘Commitment Problem’
1. State supplies credibility• “Old World” : state provides capital, enforcer, gua rantor
(e.g. Transmed)
• “New World”: credibility through transparency, rep utation
• “Real” World: one-off deals, erratic credibility
2. Realign incentives• Partner with locals ���� political leverage AND exposure
3. Engage international institutions?• Provide capital and leverage broader relationship ( e.g.
GasBol)
• External accounts
Program on Energy and Sustainable Development - http://pesd.stanford.edu/ 17
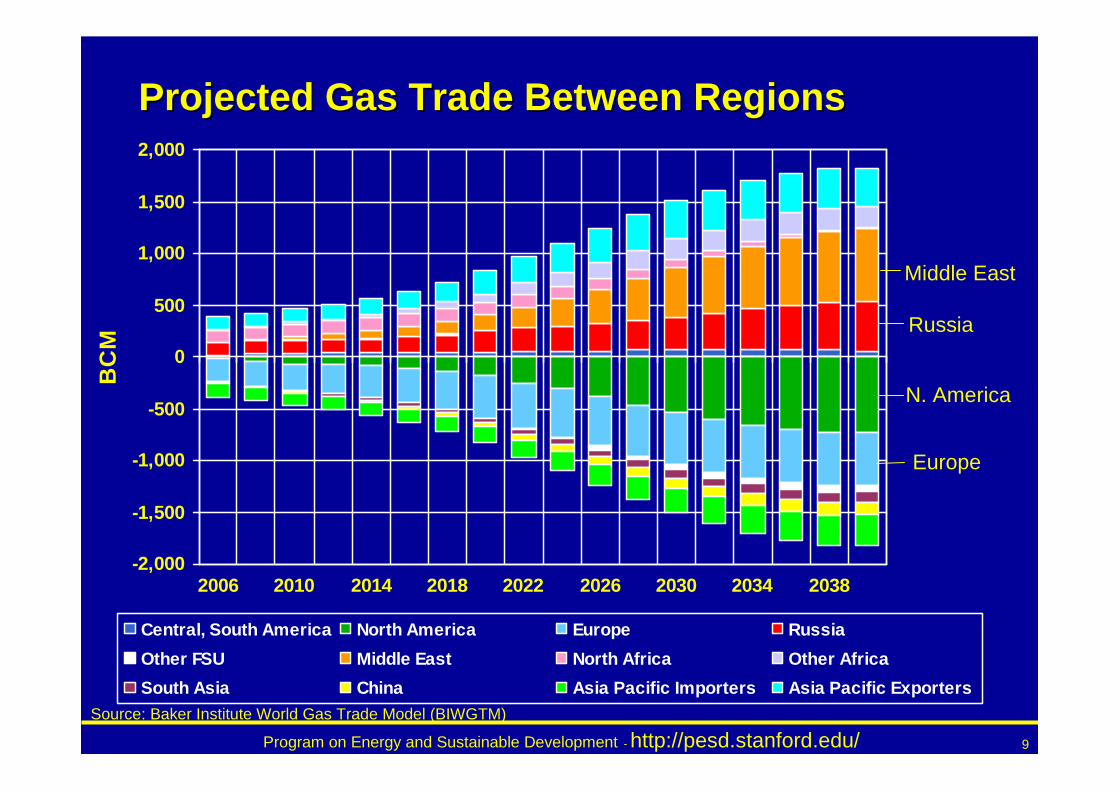
Gas Output versus Gas Reserves in 2004
10
100
1000
Billion C
ubic Metres
0.1
1
10
100
1000
10000
0.1 1 10 100 1000 10000 100000Billion Cubic Metres
Mill
ion
Cub
ic
Met
res
per
day
Chevron
ExxonMobilShellTotal
Apache
Gazprom
Pemex
Petrobras
PdVsaONGCSaudiAramcoPetronas
Statoil ADNOC
Sonantrach
NNPC
BP
KPC
NIOC
NOCs, b=0.56
IOCs, b=0.8
Majors, b=0.81
Data Source: The Energy Intelligence Top 100: Ranki ng the World’s Oil Companies. Energy Intelligence, 2006.
Note: NOCs are marked by red (NOCs from PESD’s study are open circles);
IOCs are marked by blue (the major IOCs are open circ les);

Program on Energy and Sustainable Development - http://pesd.stanford.edu/ 18
NOCs: “Dead” Gas versus Country’s Gas Reserves per capit a, 2004
Data Source: PIW (2006), BP (2006), WB (2006). Note : “Dead” oil was estimated on the base of regressio n equation for IOC’s Majors (PESD, 2007);
Average share of "dead" gas in total gas reserves f or NOCs is 46% and median is 65%. In 2004 Gazprom own s 68% of the gas stock and produced
93% of total gas in Russia, while the independent p roducers own only 30% of the gas stock and 7% of the production.
1
10
100
1,000
10,000
100,000
1,000,000
0.1 1.0 10.0 100.0 1000.0 10000.0
Country's Gas Reserves per Capita, Mcm per capita
"Dea
d" G
as, M
illio
ns B
arre
ls o
f oil
equi
vale
nt
ADNOC
CPC
EGPC
INOC
Kazmunaigas
KPC
NIOC
PdVSA
Pertamina
Qatar Petroleum
RosneftSaudi Aramco
Gazprom
CNOOC
PetroChina
Sinopec

Program on Energy and Sustainable Development - http://pesd.stanford.edu/ 19
0
100
200
300
400
500
600
700
2002 2010 2020 2030
BC
M
Will Demand Materialize?Will Demand Materialize?
Projected European Gas Consumption
Source: IEA-WEO 2004
ElectricPower
Residential /Commercial
Industry

Program on Energy and Sustainable Development - http://pesd.stanford.edu/ 20
Changing Projections for the Total Energy Changing Projections for the Total Energy Mix in 2020Mix in 2020
0%
20%
40%
60%
80%
100%
EIA 2002 EIA 2004 EIA 2006
Other
Nuclear
Gas
Oil
Coal
Program on Energy and Sustainable Development - http://pesd.stanford.edu/ 21
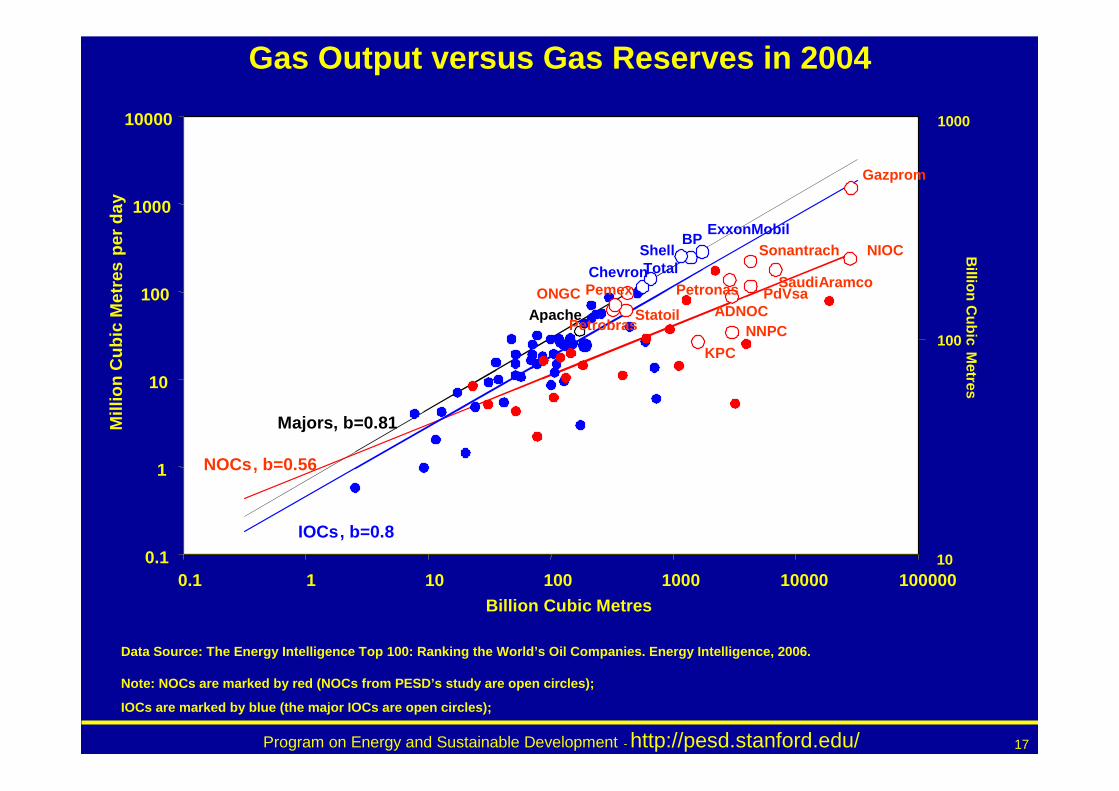
MARKAL model focuses on three major demand centers MARKAL model focuses on three major demand centers in Chinain China
Beijing
Shanghai
Guangdong
0
20
40
60
80
100
120
140
160
180
2000 2005 2010 2020
bcm
Source: ERI projections natural gas demand
50% of 170 bcm total gas demand (high estimate) by 2020

Program on Energy and Sustainable Development - http://pesd.stanford.edu/ 22
Demand for natural gas in the three regions is Demand for natural gas in the three regions is highly sensitive to environmental constrainthighly sensitive to environmental constraint
R= Reference case
P = Plausible scenario, imposed 40% decrease in SO 2
A = Aggressive scenario, 75% decrease in SO2
83 bcm
35 bcm
R P A R P A R P A R P A0
10
20
30
40
50
60
70
80
90
BC
M
Guangdong
Beijing
Shanghai
R P A2000 2005 2010 2015 2020
R= Reference case
P = Plausible scenario, imposed 40% decrease in SO 2
A = Aggressive scenario, 75% decrease in SO2

Program on Energy and Sustainable Development - http://pesd.stanford.edu/ 23
0
50000
100000
150000
200000
250000
300000
350000
400000
kt
Guangdong CO 2emissions by sector
R P A
2000 2005 2010 2015 2020
R P A R P A R P A
=1082816Aggressive
431511Plausible
202020152010Million tons
CO2 emissions savings
Transportation Residential Industrial Power plants
R P A
ReferencePlausible
Aggressive
Implications for COImplications for CO 22: : Do CODo CO22 emissions decrease?emissions decrease?
Program on Energy and Sustainable Development - http://pesd.stanford.edu/ 24
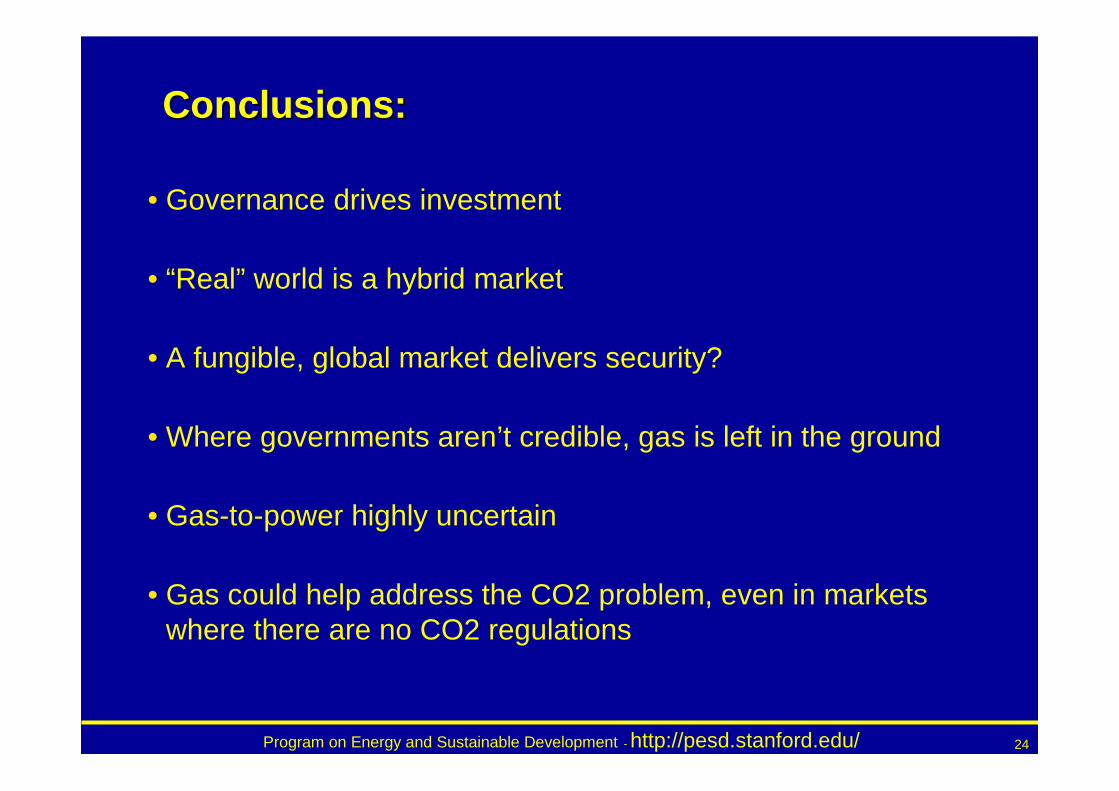
Conclusions:Conclusions:
• Governance drives investment
• “Real” world is a hybrid market
• A fungible, global market delivers security?
• Where governments aren’t credible, gas is left in the ground
• Gas-to-power highly uncertain
• Gas could help address the CO2 problem, even in markets where there are no CO2 regulations