Embed Size (px)
Citation preview

Natural Gas and Renewables: The Coal to Gas and Renewables Switch is on!
October 2011
Whitepaper available online: http://www.dbcca.com/research
Carbon Counter widget available for download at: www.Know-The-Number.com

Climate Change Investment Research
2 Natural Gas and Renewables: The Coal to Gas and Renewables Switch is On!
Mark Fulton, Editor Managing Director Global Head of Climate Change Investment Research New York
Nils Mellquist, Lead Author Vice President Senior Research Analyst New York
Bruce M. Kahn, Ph.D. Director Senior Investment Analyst New York Camilla Sharples Assistant Vice President New York
Jake Baker Associate New York Lucy Cotter Associate London
Reid Capalino Analyst New York
Executive Summary
3 Natural Gas and Renewables: The Coal to Gas and Renewables Switch is On!
Natural Gas and Renewables Thesis – Share of Electricity Generation will Increase In late 2010, DBCCA published an analysis concluding that (1) natural gas and renewable energy can play complementary roles in displacing coal-fired generation and lowering greenhouse gases (GHGs) emissions from the US electricity sector through 2030; and (2) at present a gas and renewables combination represents the most logical, politically acceptable, and economically feasible low-carbon energy pathway for the United States. On the supply side, the shale gas revolution remains front and center of this energy transition and continues to gather momentum. Evidence that the Thesis is Occurring Since we last published, data shows that there has been:
• An increase of 2 percentage points in share of the US electricity mix coming from renewables (chiefly wind) from 2009 to mid-2011.
• If we adjust for the substantial short-run burst in generation from hydropower during this period (due to melting of an unusually large snowpack in the Pacific Northwest), then we believe the ongoing share of natural gas generation in the US electricity mix is also up by roughly 2 percentage points.
• Last year we forecast 60 GW of coal retirements by 2020 and another 92 GW between 2020 and 2030. We are maintaining our capacity replacement model and leaving the forecast unchanged. Since then, there has been a wave of analysis from the likes of the Edison Electric Institute (EEI) and IHS CERA (among others) analyzing the aggregate image of EPA regulations on coal retirements. Among studies that have been published in the last six months, coal retirements projected between 2010 and 2020 range between 35 GW on the low side to 101 GW on the high side.1
What’s New Compared to Our November 2010 Report? This report takes a more granular and shorter-term view, assessing the immediate and nearer term market fundamentals and investment consequences of our long-term thesis including a greater focus on the environmental issues associated with natural gas and a revised capacity addition/retirement forecast. In brief,
• We see more needed scrutiny on the environmental issues associated with shale gas and scope for clear improvement in environmental performance and practices over the next 18 months, which we view as likely.
• We also calculate the source-to-use greenhouse gas emissions (GHGs) from natural gas - even when produced from shales - to be 47% below the source-to-use GHG emissions from coal.2
• Finally, our long term forecast now calls for an even larger role for gas and renewables and a smaller contribution for nuclear power from 2020-2030 due to a sharp change in sentiment and changes in fundamentals in 1H11 stemming from the Fukushima disaster, which have recast nuclear energy as more costly and risky.
Nuclear Now Less Likely Nuclear energy—never a big option in our US model—is even less of a pathway option going forward. Like renewable energy—nuclear energy requires significant subsidies to compete in energy markets. The knock-on impact resulting from the tragic events in Japan and the Fukushima disaster—which triggered a fast start 90 day review of the US nuclear fleet, some project cancellations and greater regulatory scrutiny which will almost certainly extend the timeline for capacity additions through 2020 and beyond—will be exacerbated by the stark contrast in new build costs for nuclear energy versus other sources. In August 2011 the Nuclear Regulatory Commission (NRC) shared the findings of its 90 day study with
1 Staying Power, Can US Coal Plants Dodge Retirement for Another Decade? (Ayaka Jones and Patricia Dioro), IHS Cera, April 2011; Potential Impacts of Environmental Regulation on the US Generation Fleet, EEI and ICF, (Steven Fine, Shanyn Fitzgerald, and Jesse Ingram), January 2011 2 For a full discussion of the life-cycle GHG profile of shale gas relative to coal, see DBCCA’s August 2011 white paper, Comparing Life-Cycle Greenhouse Gas Emissions from Natural Gas and Coal, available at www.dbcca.com/dbcca/EN/investment-research/investment_research_2376.jsp.

Executive Summary
4 Natural Gas and Renewables: The Coal to Gas and Renewables Switch is On!
Congress. Overall, the Task Force found that continued operation and continued licensing activities do not pose an imminent risk to human health and safety. The Task Force, however, also proposed a number of regulatory and permitting modifications to improve nuclear energy’s risk profile, which will be an added cost. Accordingly, we have adjusted our long-term supply/demand model and see more limited growth in terms of capacity additions and larger plant retirements post 2020, owing to fewer 20-year life extensions and the impact of the cooling tower regulation by both the EPA and state regulators. Natural gas and renewables, as opposed to coal, fill the void from our reduction in nuclear energy growth.
Gas Environmental Issues Under Scrutiny, but Manageable with Improved Industry Practices We acknowledged in 2010 that there could be environmental challenges with natural gas—both for waste water disposal from extraction and lifecycle GHG emissions—without the implementation of best practices and improvements in regulatory oversight. But we believed then and continue to believe today that the challenges are manageable. In the interim, year-to-date through 2011, there has been heightened focused across all fronts on the environmental issues associated with gas and it appears as if the issues are now getting the full attention that they deserve from multiple stakeholders—from the President to producers to environmental advocates. For our part, we recently conducted a rigorous top-down life-cycle analysis (LCA) of natural gas versus coal generation applying the very latest (April 2011) upstream emission factors for natural gas extraction and conclude that from source to use electricity generated from natural gas is 47% cleaner than coal. (Please see: Comparing Life-Cycle Greenhouse Gas Emissions from Natural Gas and Coal, DBCCA, August 2011).3
Economics and Jobs Our natural gas and renewables thesis is rooted in economics. And here, both the levelized cost of energy (LCOE) and total cash cost of electricity generated from gas and renewables compared to other energy sources, has improved even more over the past six months. Spot natural gas prices have remained stable, although the longer dated 2020 forwards have increased in response to Fukushima and expectations of an eventual increase for natural gas demand as coal-fired capacity is retired. Nevertheless, the overnight $/kW installed capacity prices for gas have remained stable. Meanwhile, solar and wind capacity prices have contracted significantly since year-end 2010 due to oversupply and improved learning curves. Accordingly, natural gas and renewables saw the largest capacity additions in the power sector in 2010, according to the Energy Information Administration (EIA), a trend we expect to continue. Our companion paper to this research update, Repowering America: Creating Jobs (DBCCA, October 2011), looks at the job implications of our power market forecasts.4
3 http://www.dbcca.com/dbcca/EN/investment-research/investment_research_2376.jsp
We expect around 7.9 million net new job years to be created by 2030, leading to almost 500,000 net new jobs in place in 2030 as compared with 2010.
4 Report available at www.dbcca.com/dbcca/EN/investment_research.jsp

Table of Contents
5 Natural Gas and Renewables: The Coal to Gas and Renewables Switch is On!
Page
Executive Summary………………………………………………….......................
3
List of Tables and Exhibits………………………………………………..............
6
A Low-Risk Approach to a Low-Carbon Fuel Mix …………………………….
9
Recent Trends………………………………………………………………………
16
Economics: Investment Implications of Fuel Switching…………………….
31
Coal Retirements and Gas–Displacement Potential…………………………
44
Policy………………………………………………………………………………….
51
Appendix: Environmental Issues with Shale Gas…………………………….
56

List of Tables and Exhibits
6 Natural Gas and Renewables: The Coal to Gas and Renewables Switch is On!
Page
Table 1. DBCCA Electricity Supply Mix Forecast
11
Table 2. Global Distribution of Shale Gas Resources
17
Table 3. Quarterly Share Shift from Coal to Gas and Renewables, 2005-2011
21
Table 4. Proposed LNG Projects in US
30
Table 5. LCOE and “fully-loaded cash costs” by energy technology
32
Table 6. Coal-to-Gas Fuel/Asset Switch Decision Tree Matrix
33
Table 7. Drivers of Change in Cost-Reducing Factors for Solar PV
41
Table 8. LCOE of Solar PV by Market and Technology: 2011 vs. 2016
42
Table 9. Coal Retirement Forecasts
45
Table 10. “At Risk” Coal Generation and Adjacent Under-Utilized Gas Capacity
47
Table 11. DBCCA Coal and Gas Generation Forecast, 2009-2030
49
Table 12. “Burner-tip” Reductions in CO2 Emissions from Coal-to-Gas Switch
49
Table 13. Energy Use Impacts on Health, Safety, Security, and Environment
52

List of Tables and Exhibits
7 Natural Gas and Renewables: The Coal to Gas and Renewables Switch is On!
Page
Exhibit 1. DBCCA vs. EIA Electricity Supply Mix Forecasts, 2020 and 2030
12
Exhibit 2. US Electricity Generation and Retail Cost by Technology, 1930-2010
13
Exhibit 3. YoY Change in Natural Gas Generation, 2009-2010
17
Exhibit 4. Natural Gas and Coal Net Power Generation, Jan-April 2010 and Jan-April 2011 (YoY % Change)
18
Exhibit 5. Natural Gas and Coal Net Power Generation, Jan-April 2010 and Jan-April 2011 (YoY Change, GWh)
19
Exhibit 6. Natural gas and coal generation: rolling monthly production Jan 2008-April 2011
20
Exhibit 7. Fully Delivered Coal versus Gas Spread, Feb 2005 – Aug 2011
21
Exhibit 8. US Electricity Sector New Capacity Additions 2010
22
Exhibit 9. Natural Gas Prices – Henry Hub vs. 2020 Futures, May 2008 – Mar 2011
23
Exhibit 10. M&A and Joint Venture Activity Funding Drilling Programs, 2001-2011 Q1
24
Exhibit 11. Index of Natural Gas Production Volumes vs. Rig Count, Jan 2005 – Jan 2011
25
Exhibit 12. Ratio of Natural Gas Production Volumes vs. Rig Count, Jan 2005 – Jan 2011
26
Exhibit 13. Days to Drill a Shale Gas Well, 2009 – 2011 Q3
26
Exhibit 14. The “Gas Manufacturing” Model of Shale Production
27
Exhibit 15. Oil and Gas Price Differential (WTI and Henry Hub), 2002-2011
28
Exhibit 16. Power Sector Capital Spend on New Capacity and Environmental Retrofits, 2010-2030
35
Exhibit 17. Projected Additions of Solar and Wind Capacity, 2010-2030I
36
Exhibit 18. Grid Parity from Two Different Points of View – Consumer and Investor/Utility
37
Exhibit 19. U.S. Electricity Generation and Retail Cost by Technology, 1930 – 2010
39

List of Tables and Exhibits
8 Natural Gas and Renewables: The Coal to Gas and Renewables Switch is On!
Exhibit 20. Levelized Cost of Energy (LCOE) for Various Technologies, 2011 Q2
39
Exhibit 21. Solar PV’s LCOE Trend, 1978-2009 (and projections to 2020)
40
Exhibit 22. Decomposing the fall in Solar PV Manufacturing Costs, 1979-2001
40
Exhibit 23. How Government Incentives Lower the Cost of Renewables
43
Exhibit 24. Map of “at risk” US coal plants
46
Exhibit 25. Map of gas-fired plants adjacent to “at risk” US coal plants
46
Exhibit 26. Increasing gas-fired capacity factors to cover loss of coal generation
48
Exhibit 27. Non-GHG Emissions Reductions from Coal-to-Gas Switch
50
Exhibit 28. “Train Wreck” Timeline for EPA Compliance
53
Exhibit 29. Comparing Lifecycle GHG Emissions of Gas and Coal with a 21 GWP for
57
Exhibit 30. Comparing Lifecycle GHG Emissions of Gas and Coal with a 100 GWP for Methane
58
Exhibit 31. Water Use in Hydraulic Fracturing Operations
60
Exhibit 32. EPA’s “Fundamental Research Questions” for the Hydraulic Fracturing Water Lifecycle
60

A Low-Risk Approach to a Low-Carbon Fuel Mix
9 Natural Gas and Renewables: The Coal to Gas and Renewables Switch is On!
1. A Low-Risk Approach to a Low-Carbon Fuel Mix Summary • Our November 2010 report, Natural Gas and Renewables: a Secure Low-Carbon Energy Plan for the United States,5
• A coal-to-gas fuel switch is a key factor in achieving this fuel mix shift, along with significant expansion of wind and solar. Nuclear energy now declines modestly, reflecting the post-Fukushima environment. Notably, better utilization of the existing natural gas power generation can achieve about two-thirds of the increase in the natural gas fuel mix shift.
argues that deploying a combination of natural gas and renewable energy constitutes a low-risk strategy for dramatically reducing CO2 emissions from the power sector over the next 20 years. Over the same period we envisage more than a halving of coal’s contribution.
• There are no fundamental or technical barriers inhibiting this fuel mix shift from happening at a systems level. • An aging coal fleet, declining solar PV costs, cheap and abundant shale gas supplies, and EPA regulation are catalysts
for this energy transition. We view 2012-2015 as being the key transition years from coal to gas-fired generation.
The Low Carbon Pathway Our 2010 report introduced a model illustrating the reductions in CO2 emissions necessary to put the US on a significantly lower long-term emissions trajectory. In order to do that we took a practical view of what we believe can be seen as a low risk approach to the electricity sector generation fuel mix based on known technology and ease of deployment. In effect, this analytical framework looks at the power system issues around low carbon deployment and what can actually be done rather than wishful thinking. We tackle the economics and policy drivers of the low carbon pathway in the next section of this study and demonstrate that the low carbon pathway we are showing is a least cost approach and indeed can be driven by those economics, even in the absence of an explicit price on carbon, which we view as unlikely at least over the next few years. EPA regulation of Hazardous Air Pollutants (HAPs), however, is important in our thesis longer term (see the Policy section later in this report). Abundant and sustainably managed extraction of shale gas supplies are a core part of the energy future that we envision. We primarily focused on what the power sector can deliver in terms of emissions reductions in 2020 and 2030. We chose the power sector because it is the largest source of CO2 emissions and is the subject of regulation from federal agencies. We chose these two time periods because 2020 is the near-term planning horizon for utilities and also matches the capital stock runoff of many of the older coal plants. And 2030 is when a sizable share of today’s most productive coal, nuclear and natural gas generation fleet will be retiring or close to retiring, and will need to be replaced. Our base case modeling assumption is pragmatic and rooted in comprehensive industry fundamental analysis. We have taken a fresh look and updated our 2010 modeling assumptions to account for changes in energy fundamentals that have taken effect in 1H11. In our revised forecast, renewables and natural gas gain share through 2030, just as before. Nuclear energy, however, loses share from 2020 to 2030 given our belief that the technology will be less socially acceptable and will face greater regulatory scrutiny and higher costs in response to the Fukushima disaster in Japan. Efficient coal plants remain viable, although aging and inefficient coal units are retired and replaced with incremental natural gas capacity additions and a step-up in the utilization rate of the existing fleet because there is surplus capacity and high reserve margins in the US power system. We also anticipate that energy efficiency, operational improvements and demand side management programs play a complementary role and restrict aggregate growth in electricity demand, limiting
5 To access full document: www.dbcca.com/dbcca/EN/investment-research/investment_research_2358.jsp.

A Low-Risk Approach to a Low-Carbon Fuel Mix
10 Natural Gas and Renewables: The Coal to Gas and Renewables Switch is On!
the compound annual growth rate of electricity consumption to just 0.7% from 2009 through 2030 versus the EIA’s projection of 1%. Based on our new estimates of electricity generation by fuel type (see below), switching coal to natural gas and renewable energy with a modest decrease in nuclear energy is achievable and could lead to a 31% reduction in CO2 emissions from the US power sector by 2020 and a 41% reduction by 2030 compared to a 2005 baseline at the “burner tip,” or point of combustion.6
Compared with our 2010 study, these forecasts see a modest increase in 2020 and 2030 emissions (versus a 2005 baseline) due to a diminished role for nuclear energy. Sector emissions increase by two percentage points in 2020 and 2030 relative to our modeling last year. This year we also introduce a new life-cycle analysis (LCA) framework into our modeling, which more completely captures electricity sector emissions from source to use. Based on this methodology, power sector emissions decrease by 23% and 31% compared to a 2005 baseline as shown in Table 1 below. The eight percentage point difference in 2020 and ten percentage point difference in 2030 using the LCA framework is due to the fact that natural gas-fired generation has relatively higher upstream GHG emissions than coal-fired generation, although there are commercially available technologies that could reduce this footprint.
Nevertheless, of all the options, the coal to gas fuel switch is a practical lower carbon alternative over the next 20 years for the US power sector. This fuel mix would put the US electricity sector roughly at the midpoint of the 80% aggregate reductions in CO2 emissions required by 2050 compared to a 2005 baseline. By way of comparison, the Waxman-Markey American Clean Energy and Security Act (ACES Act—H.R. 2454) had proposed economy wide emissions reductions of 17% by 2020 and 83% by 2050 compared to 2005 baseline emissions. And the Obama Administration made a Copenhagen Accord pledge to reduce greenhouse gas emissions in the range of 17% below 2005 levels by 2020 using regulatory tools already available to Federal agencies. We estimate changes in the US electricity supply mix for 2020 and 2030 driven by the underlying assumptions of baseload coal retirements, new builds of gas and renewables and utilization improvement in natural gas generation, which achieves a 41% reduction in CO2 emissions from 2005 at the burner tip and 31% reduction based across coal and gas lifecycle from extraction, transportation to combustion. As illustrated in Table 1 below the three large changes in fuel mix between 2010 and 2030 that impact this emissions reduction are: 1) a 25 percentage point reduction in the supply of electricity from coal; 2) a 14 percentage point increase in the supply from natural gas; and 3) a 14 percentage point increase in the supply of electricity from wind and solar.
6 Note: a 40% reduction is still below the 51-64% reduction range (vs a 2005 baseline) necessary to remain on a 450 ppm climate stabilization target to avert an average global temperature increase of 2 degrees centigrade. However, such a reduction leaves room for technology leapfrogging and more drastic reductions from 2030 to 2050 from technologies and actions that are not feasible today.

A Low-Risk Approach to a Low-Carbon Fuel Mix
11 Natural Gas and Renewables: The Coal to Gas and Renewables Switch is On!
Table 1: DBCCA Electricity Supply Mix Forecast
US Electricity Supply (% total kWh) 2005A 2010A 2020E 2030E Comment
Coal traditional 50% 45% 32% 20% Reduced to meet emissions target and comply with EPA regulation
Coal CCS 0% 0% 0% 1% Limited deployment 2020-2030 with government R&D support
Natural gas 19% 24% 32% 38% Coal to gas fuel switch, underutilized assets, strong new build
Natural gas CCS 0% 0% 0% 0% No deployment, assume that gas CCS is viable post 2030 and cheaper $/MWh than coal
Petroleum 3% 1% 0% 0% No additions; existing capital stock remains for reliability but hardly used
Nuclear 19% 19% 20% 17% "Uprates" and new builds unable to keep up with retirements; Fukushima impact
Wind and solar (intermittent) 0% 3% 9% 17% Large capacity additions to comply with RPS; improved cost competitiveness
Baseload renewables (geothermal & hydro) 7% 8% 7% 7% Share decreases modestly as only very limited new
builds Total 100% 100% 100% 100% Renewables share total (intermittent and baseload) 9% 11% 16% 24% Doubling of share 2010 to 2030 due to wind and
solar additions to meet RPS
Electricity Demand (kWh) 4,055 3,784 3,978 4,322 0.7% CAGR growth due to energy efficiency and operational improvements
CO2 emissions (mn metric tons @ burner tip) 2,397 2,200 1,655 1,407 Emissions reduced substantially due to the coal to
gas fuel switch and build-up in renewables CO2 emissions (mn metric tons; full lifecycle) 3,026 2,654 2,342 2,096 Gas has relatively higher upstream GHGs than coal,
which reduces full life-cycle impact of GHG reduction % CO2 emissions reduction vs. 2005 @ burner tip -12% -31% -41%
% CO2 emissions reduction vs. 2005 @ full lifecycle (LCA) -12% -23% -31%
Source: EIA, DBCCA analysis 2011 Our low carbon fuel mix forecast is clearly not a consensus view when contrasted to the EIA’s base case generation mix forecast for 2020 and 2030. As illustrated in Exhibit 1 below the EIA expects coal to maintain share through 2030 at about 43%, whereas we are much more optimistic about growth in natural gas generation in particular but also growth in renewables.

A Low-Risk Approach to a Low-Carbon Fuel Mix
12 Natural Gas and Renewables: The Coal to Gas and Renewables Switch is On!
Exhibit 1: DBCCA vs. EIA Electricity Supply Mix Forecasts, 2020 and 2030 (% MWh)
DBCCA Forecast EIA Forecast
Source: EIA, DBCCA analysis, 2011.
These fuel mix estimates are supported by a detailed fundamental assessment of the power generation sector (please refer to page 68 of our November 2010 report for a full assessment)7
. The conclusions from this analysis are:
Nuclear energy maintains share through 2020 because of the expected success of the Department of Energy’s (DOE) loan program and regulatory support in the US Southeast, where regulators see nuclear power as an important contributor to the state and local economies and hedge to the coal-dominated supply mix. But nuclear energy loses modest share between 2020 and 2030 due to more stringent regulatory requirements, high capital costs and accelerated retirements due to EPA regulation of cooling water intake structures. This also reflects an expected change in attitudes and cost following the Fukushima disaster, which has put nuclear energy under considerably more pressure and tougher regulatory scrutiny given the tail risk.
Renewables grow substantially, encouraged by state renewable portfolio standards (RPS) and renewed incentives that are added cost issues now, but, a reduction in learning curve capital costs (for solar and CSP) will reduce these costs over time and drive deployment. We believe that integration issues will still keep renewables penetration at a measured pace to 2030 as the smart grid and transmission infrastructure scale up.
Carbon capture and storage (CCS) is assumed to be an extremely modest contributor to emissions reductions through 2030. We reach this conclusion because there are only a very few demonstration facilities on the ground today and barriers are substantial8
. CCS scale-up faces a wide range of regulatory, cost allocation, liability and technical challenges that as a practical matter will be difficult to overcome. We believe that on a $/MW basis it will be more economic to apply CCS retrofits to natural gas plants than to retrofit post combustion coal plants with CCS.
7 Natural Gas and Renewables: A Secure Low-Carbon Future Energy Plan for the US, DB Climate Change Advisors (Mark Fulton and Nils Mellquist), November 2010. Available at www.dbcca.com/dbcca/EN/investment-research/investment_research_2358.jsp. 8 As an example of how infeasible coal carbon capture and storage (CCS) projects are at this time, American Electric Power announced on 7/17/11 that it was canceling its CCS demonstration project in West Virginia. See: http://www.aep.com/newsroom/newsreleases/?id=1704
45%32%
21%
24%32%
39%
19%20%
17%
10% 16% 23%
2%
0%
10%
20%
30%
40%
50%
60%
70%
80%
90%
100%
2009A 2020E 2030E
Coal Natural gas Nuclear Renewables Other
A Low-Risk Approach to a Low-Carbon Fuel Mix
13 Natural Gas and Renewables: The Coal to Gas and Renewables Switch is On!
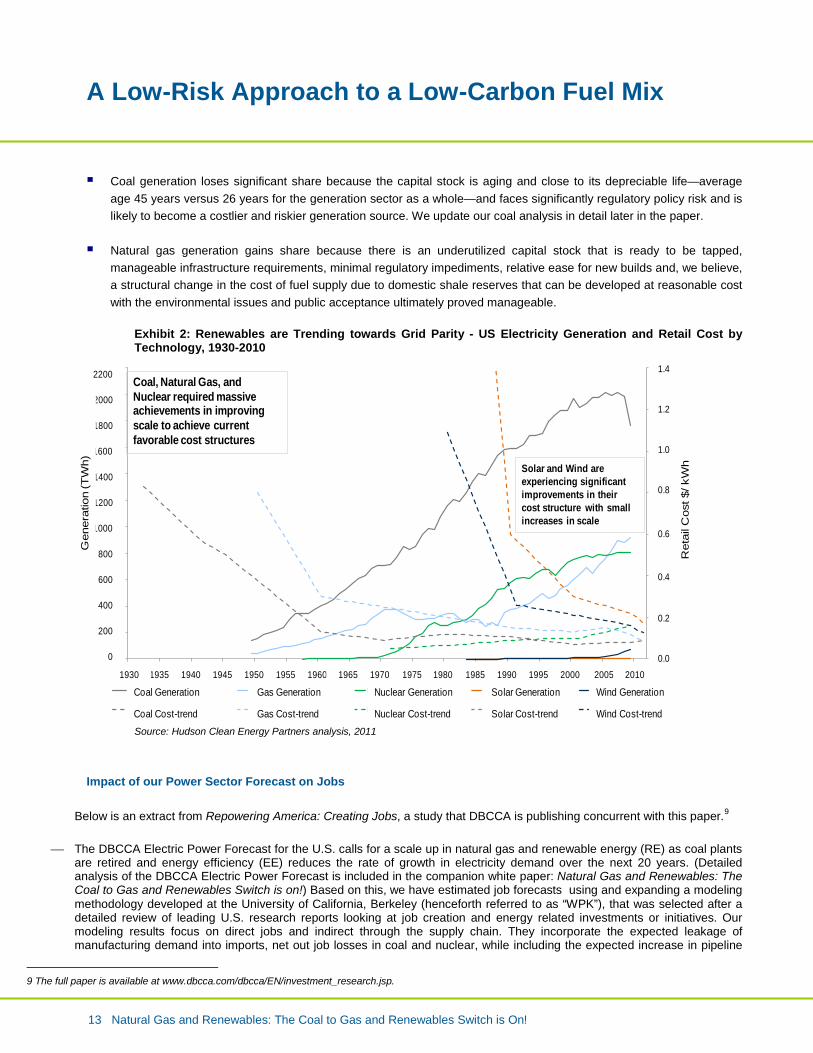
Coal generation loses significant share because the capital stock is aging and close to its depreciable life—average age 45 years versus 26 years for the generation sector as a whole—and faces significantly regulatory policy risk and is likely to become a costlier and riskier generation source. We update our coal analysis in detail later in the paper.
Natural gas generation gains share because there is an underutilized capital stock that is ready to be tapped, manageable infrastructure requirements, minimal regulatory impediments, relative ease for new builds and, we believe, a structural change in the cost of fuel supply due to domestic shale reserves that can be developed at reasonable cost with the environmental issues and public acceptance ultimately proved manageable.
Exhibit 2: Renewables are Trending towards Grid Parity - US Electricity Generation and Retail Cost by Technology, 1930-2010
Source: Hudson Clean Energy Partners analysis, 2011
Impact of our Power Sector Forecast on Jobs
Below is an extract from Repowering America: Creating Jobs, a study that DBCCA is publishing concurrent with this paper.9
The DBCCA Electric Power Forecast for the U.S. calls for a scale up in natural gas and renewable energy (RE) as coal plants are retired and energy efficiency (EE) reduces the rate of growth in electricity demand over the next 20 years. (Detailed analysis of the DBCCA Electric Power Forecast is included in the companion white paper: Natural Gas and Renewables: The Coal to Gas and Renewables Switch is on!) Based on this, we have estimated job forecasts using and expanding a modeling methodology developed at the University of California, Berkeley (henceforth referred to as “WPK”), that was selected after a detailed review of leading U.S. research reports looking at job creation and energy related investments or initiatives. Our modeling results focus on direct jobs and indirect through the supply chain. They incorporate the expected leakage of manufacturing demand into imports, net out job losses in coal and nuclear, while including the expected increase in pipeline
9 The full paper is available at www.dbcca.com/dbcca/EN/investment_research.jsp.
0.0
0.2
0.4
0.6
0.8
1.0
1.2
1.4
0
200
400
600
800
1,000
1,200
1,400
1,600
1,800
2,000
2,200
1930 1935 1940 1945 1950 1955 1960 1965 1970 1975 1980 1985 1990 1995 2000 2005 2010Re
tail
Cost
($/k
Wh)
Gen
erat
ion
(TW
h)
Coal Generation Gas Generation Nuclear Generation Solar Generation Wind Generation
Coal Cost Trend Gas Cost Trend Nuclear Cost Trend Solar Cost Trend Wind Cost Trend
Coal, Natural Gas, and Nuclear required massive achievements in improving scale to achieve current favorable cost structures
Solar and Wind are experiencing significant improvements in their cost structure with small increases in scale
0
200
400
600
800
1000
1200
1400
1600
1800
2000
2200
Gen
erat
ion
(TW
h)
0.0
0.2
0.4
0.6
0.8
1.0
1.2
1.4
Ret
ail C
ost $
/ kW
h1935 1940 1945 1950 1955 1960 19651930 1970 1975 1980 1985 1990 1995 20001965 2005 2010
Coal Generation
Coal Cost-trend
Gas Generation
Gas Cost-trend
Nuclear Generation
Nuclear Cost-trend
Solar Generation
Solar Cost-trend
Wind Generation
Wind Cost-trend

A Low-Risk Approach to a Low-Carbon Fuel Mix
14 Natural Gas and Renewables: The Coal to Gas and Renewables Switch is On!
and transmission related infrastructure that will be required. They do not attempt to adjust for either induced spending that comes from energy efficiency savings nor potential reductions in spending due to the cost of implementing the power supply mix switch. They also assume a phasing out of oil for electricity generation, a modest introduction of coal CCS, and retirement of existing older coal plants as new cleaner gas power plants are commissioned. The results are based on the use of proven technologies for all new power supply investment
Over the period 2010-2030, we expect around 7.9 million cumulative net job-years of direct and indirect employment (see table below) to be created as a result of this electricity supply forecast outlook. Around 64% of these jobs would be related to the construction, installation and manufacturing (CIM) phase of these new investments, the balance associated with the operations, maintenance, fuel processing (O&M) phase and energy efficiency (EE) related initiatives.
As a result, by 2020 and extending out to 2030, there are around 500,000 net new jobs in place compared with the start, 2010. Once the large CIM phase is over, what remains are permanent jobs related to the operations, maintenance and fuel processing (O&M) of the new power supply sources, the newly installed gas and power lines infrastructure, and related the indirect jobs these create in the supply chain. These total about 40% of the 486,000 net new jobs in 2030. As expected, the ongoing job creation impact of O&M is much less than the jobs created in the CIM phase, but this increase in permanent job creation is meaningful.
There is not yet a universally accepted standard of how to report job growth estimates associated with cleaner energy investments. When cumulative job-years figures are reported this gives the largest jobs growth estimate over a forecast period – which is much different than looking at the increase in new full-time jobs in place in a particular year, such as at the end of the forecast period. In terms of our own research, it is possible to simultaneously report “7.9 million cumulative job-years created” or “486,000 jobs created”. The difference is that the “7.9 million job-years” figure is the cumulative total of all jobs (defined as full-time employment for 1 year) created over the 20 year forecast period, while the latter “486,000 jobs” figure is an end point or final year estimate of new full-time employment in place vs. the starting point of the forecast10
The job creation multipliers for solar and wind were adjusted so as to reflect the high import content of many of the manufacturing components used. In the case of solar, we have assumed around 60% of the manufactured components are imported and for wind around 40% (based on industry analysis estimates). However, it is important to note that the majority of the installation work of the components and structures and ongoing O&M work created cannot be exported and remains onshore.
. Both jobs outcomes are important and certainly in terms of an economic stimulus, the CIM phase provides a sizeable impact over the forecast period, which is what the U.S. economy needs right now.
Our forecasts also capture the job creation impact of constructing the new gas pipelines and power transmission lines that will be needed as a result of our energy supply outlook through to 2030. We expect that around 30,000 miles of new power transmission lines will need to be built and a 10-12% expansion in the current gas pipeline infrastructure.
After deriving aggregate jobs growth forecasts for RE, new gas power, and EE related initiatives, the next step of drilling down to an occupational breakdown is a more involved exercise and requires a number of assumptions about the occupational make-up of the RE, EE, gas and coal power supply sectors. The reason for this is that the current labor market data supplied by the U.S. Bureau of Labor Statistics (BLS) does not provide explicit occupational data on the RE, EE, gas and coal power supply sectors. As a result, like other researchers, to do this step we have used a number of surveys and research on occupations in the cleaner energy sectors to construct our own hybrid breakdowns for the occupational make-up of the RE, EE, gas and coal power supply sectors and applied these to the current BLS occupational data. In 2012, this task will become somewhat easier to do once the BLS publishes its own new survey reports on the green economy, which will include details on many of the RE sectors that we have looked at in this report.
Looking at the occupational breakdown in terms of numbers, we see that manufacturing and production is the largest sector for growth even after import leakage, with construction and installation along with maintenance then the next most significant. These are mostly skilled occupations. Supporting sectors like engineering, technical services and indeed administrative jobs all feature as well.
10 In terms of the model, this is the number of job-years in that particular year. A job-year of employment is defined as full-time employment for one person during one year (measured by a standard 2,080 hrs of employment/year).
A Low-Risk Approach to a Low-Carbon Fuel Mix
15 Natural Gas and Renewables: The Coal to Gas and Renewables Switch is On!
In terms of occupations that are truly new, unique and specifically the result of new investments in RE and EE initiatives, in reality there are few of these. Investments related to the cleaner energy economy largely create new demand for workers across a wide range of existing occupations, few of which are truly unique and specific to the cleaner energy economy. There are some new skills in demand, like for a wind turbine technician, solar PV installer, or energy auditor, but the rest of the work required to design, build and operate a RE power system, build a new gas power plant, create more EE appliances and buildings, build new gas pipelines and power transmission lines, can all be done using the current workforce and their existing skill sets. .. With the U.S. economy needing increased job creation now, these new cleaner energy related investments hold the potential for creating new jobs immediately and do not require large numbers of people to be re-trained or re-skilled to do this work. The majority of the work can be done by people who already have the required skills and training.
The truly complex area of estimating the total economy wide impact on job creation from energy efficiency (EE) initiatives and changes to the power supply system comes in the area of “induced” jobs. Energy cost savings free up spending elsewhere in the economy, in turn creating even more jobs. Although the model used does attempt to quantify this for EE (estimating around an additional 140,000 new jobs by 2030 – see Appendix), it does not attempt to quantify the full costs of the power switch over 20 years. Whilst the forecast gas to coal switch looks economically viable on many measures and renewable energy costs continue to fall, potential price movements in all types of fuel options are very uncertain; if the costs are high this would reduce spending elsewhere, offsetting the efficiency job gains the model may otherwise be forecasting. As a result, we have not included in our results either induced EE job creation or the potential cost of the power supply switch for end-users.
Our paper is not a full Cost-Benefit analysis, which would require a full general equilibrium model that also included the environmental externality costs to be truly inclusive. A discussion of the advantages and drawbacks of this approach versus the more targeted type of analysis that we have done can be found in range of papers, in particular between the Heritage Foundation and PERI. 11
.
There is also a discussion around the topic of labor productivity. From our perspective we agree with many of the points made by PERI, namely, that a general equilibrium model has many challenges when tackling such a complex system. In particular, weighing up the future relative cost, as discussed above, is highly uncertain. The more direct approach we have taken of using a partial yet comprehensive model can identify specific job outcomes more transparently.
In summary our research indicates there will be strong job growth for a wide range of well-paid existing occupations, like construction, manufacturing, engineering, and related professional services and further shows:
RE and low carbon sources can generate more jobs per unit of delivered energy than traditional fossil-fuel based sources
Amongst the RE technologies, at this time solar PV creates the most jobs per unit of electricity output Switching from coal to gas delivers more new ongoing gas jobs per GW added than those lost from
removing one GW of coal powered capacity. Energy efficiency measures can be economically the least costly way to create jobs, reducing the need for
additional new energy supply sources (be they RE, traditional fossil fuel plants, or low carbon sources).
11 See Heritage Foundation, 2009, “The PERI Report on Clean Energy: The Wrong Question and a Misleading Result”; PERI, 2009, “Clean Energy Investments, Jobs, and U.S. Economic Well-Being: A Third Response to Heritage Foundation Critics” for more detail.

Recent Trends in Electricity Markets
16 Natural Gas and Renewables: The Coal to Gas and Renewables Switch is On!
2. Recent Trends in Electricity Markets Summary
• The latest EIA data for electricity markets are through the second quarter 2011. • Coal-fired power generation has seen a four percentage point drop since the end of 2009 where we based our previous
analysis. • Wind and solar are up two percentage points. • Hydroelectric generation is up three percentage points but reflects the exceptional snowpack in the Rocky Mountain
states and Pacific Northwest in 2011 after a dry 2010 which accounts for the large increase. • Therefore, although on a national level natural gas is down one percentage point in 2Q11 from year-end 2009, when
normalized for hydro and given dramatic increases in gas-fired generation in many regions already, we believe gas will likely increase by around two percentage points over the next twelve months to about 26% of total US supply.
Supply/Demand Trends: Coal to Gas Fuel Switching in the US has Accelerated Natural gas is probably the world’s most plentiful and most evenly distributed hydrocarbon energy resource with great implications for coal/oil substitution and energy security. The largest component of this supply is in unconventional gas—e.g. sandstones and shale plays—as well as hydrates in all rock types. Importantly, natural gas is the fossil fuel with the lowest carbon footprint, which means that it will become more valuable in a carbon constrained world. The United States is “the Saudi Arabia of natural gas” in terms of resources in place, and has rapidly become the global laboratory for extracting shale gas, which has attracted significant foreign direct investment. Productivity gains, a competitive industry structure, enabling infrastructure and supply chain partners have allowed shale gas to scale rapidly in the US. The EIA forecasts shale gas to increase to between 46% and 57% of total US domestic production by 2035 compared to 15% in 2010.12
Every two years since 1965, the US Potential Gas Committee has released an estimate of US gas reserves. In April, 2011, their most recent study showed producible gas reserves increasing 3% since 2008. The supply increase of 61 trillion cubic feet (tcf) is one of the larger increases reported by the committee in its 46-year history. The natural gas resource estimate now stands at 1,898 tcf (83 years of annual supply), its highest estimate ever.13 The EIA also recently completed an initial assessment of global shale resource plays and concluded that shale gas resources are available in other world regions (see Table 2 below).14
The EIA’s analysis estimates that the technically recoverable resource in Europe is approximately 624 trillion cubic feet, compared with 862 trillion cubic feet in the US. Although estimates of shale resources in regions with little history of industrial activity are highly uncertain as are the economics of extraction, the potential is certainly large and illustrates the likelihood of greater use of natural gas in the future, given its versatility as an energy feedstock. We expect US Exploration and Production (E&P) and services companies to turn to Europe and China and develop test wells since these companies have been the leaders in shale development.
12 http://www.eia.doe.gov/forecasts/aeo/ 13 http://www.potentialgas.org/ 14 http://www.eia.doe.gov/todayinenergy/detail.cfm?id=811

Recent Trends in Electricity Markets
17 Natural Gas and Renewables: The Coal to Gas and Renewables Switch is On!
Table 2: Global Distribution of Shale Gas Resources Country Recoverable Shale (TCF) Multiple (#years) 2010 Gas
Use China 1,275 406.x
Poland 187 394.x France 180 120.x
US 862 38.x Germany 8 3.x
Source: EIA, DBCCA Analysis 2011
Underlying Power Sector Use of Natural Gas is Increasing in the US while Coal Use is on the Wane
The investment thesis that we introduced in November 2010 is that natural gas and renewable energy can play complementary roles in reducing greenhouse gas emissions from the US electricity sector by displacing coal-fired generation through 2030. To recap, we view this as the most logical, politically acceptable and economically feasible energy pathway for the United States. Year-end 2010 data showed a favorable comparison to 2009 with natural-gas fired generation posting significant ~40% and ~30% increases respectively in the coal-dominant Midwest and Southeast, due to favorable gas to coal pricing dynamics. The most recent actual generation statistics from the EIA are through 2Q11. Broadly speaking, gas and renewable generation have continued to show steady increases with their share gains coming at the expense of coal generation. Updated figures from the EIA and incremental analysis in 1H11 suggest that this is beginning to take place at an accelerating rate in a number of regions. In 2010, natural-gas fired electricity generation increased 7% year-over-year versus 2009 at a national level – an increase of 61 GWh. Increases in individual regions of the US ranged from 6.7 GWh (a 13% increase) in New England to 11 GWh (an increase of 39%) in the Midwest.
Exhibit 3: YoY Change in Natural Gas Generation, 2009-2010 (%)
Source: EIA, DBCCA Analysis 2011 The 2010 and 2011 comparison (year-to-date through April 2011) show that this trend has continued, although the aggregate national data is skewed by a sharp decrease in gas generation in the Pacific Northwest due to the hydrology cycle. In looking at the data, we caution that drawing firm investment conclusions from aggregate data at the national level
7%
39%
29%
13%
0%
5%
10%
15%
20%
25%
30%
35%
40%
45%
US Total Midwest South East New England

Recent Trends in Electricity Markets
18 Natural Gas and Renewables: The Coal to Gas and Renewables Switch is On!
can be misleading with respect to what is actually happening on a fundamental basis. This is because there is no singular national US electricity grid but rather three large electricity “islands”: the Eastern Interconnect, the Western Interconnect, and ERCOT – the latter of which serves most of Texas. Each of these grid systems is limited by its geography, connectivity and supply stack of generation resources. In addition, the states west of the Rocky Mountains are heavily impacted by the annual snowpack which affects the hydrology cycle. In years with heavy snow pack as we had in 1H11, hydro electricity runs at higher than normalized utilization rates and generally displaces gas. That is why the year-to-date 2011 natural gas generation data for the west shows dramatic reductions year-over-year, which influences the +3.6% year-over-year increase at a national level. In other words, under a more normalized scenario, we believe that gas would have been up by 5-6% versus coal. And when we look at discrete regions, particularly in the coal-dominated regions, it is clear that gas has been a relative winner YTD in 2011 as shown in Exhibits 4 and 5 below.
Exhibit 4: Natural Gas and Coal Net Power Generation, Jan-April 2010 and Jan-April 2011 (YoY % Change)
Source: EIA, DBCCA Analysis 2011 As shown above, year-to-date through April 2011, coal generation decreased ~5% on a national level, including a dramatic 28% decrease in New England. For its part, the EIA’s July 2011 updated Short-term Energy Outlook forecasts that EIA projects that coal consumption in the electric power sector will fall by 2.5% in 2011, as electricity demand remains flat and generation from natural gas and renewable energy sources increases.15
15 http://www.eia.gov/steo/#Coal
-80% -60% -40% -20% 0% 20% 40% 60% 80% 100% 120%
West South Central
West North Central
East South Central
Mountain
East North Central
South Atlantic
Middle Atlantic
New England
Pacific Contiguous
Coal
Natural Gas
Recent Trends in Electricity Markets
19 Natural Gas and Renewables: The Coal to Gas and Renewables Switch is On!
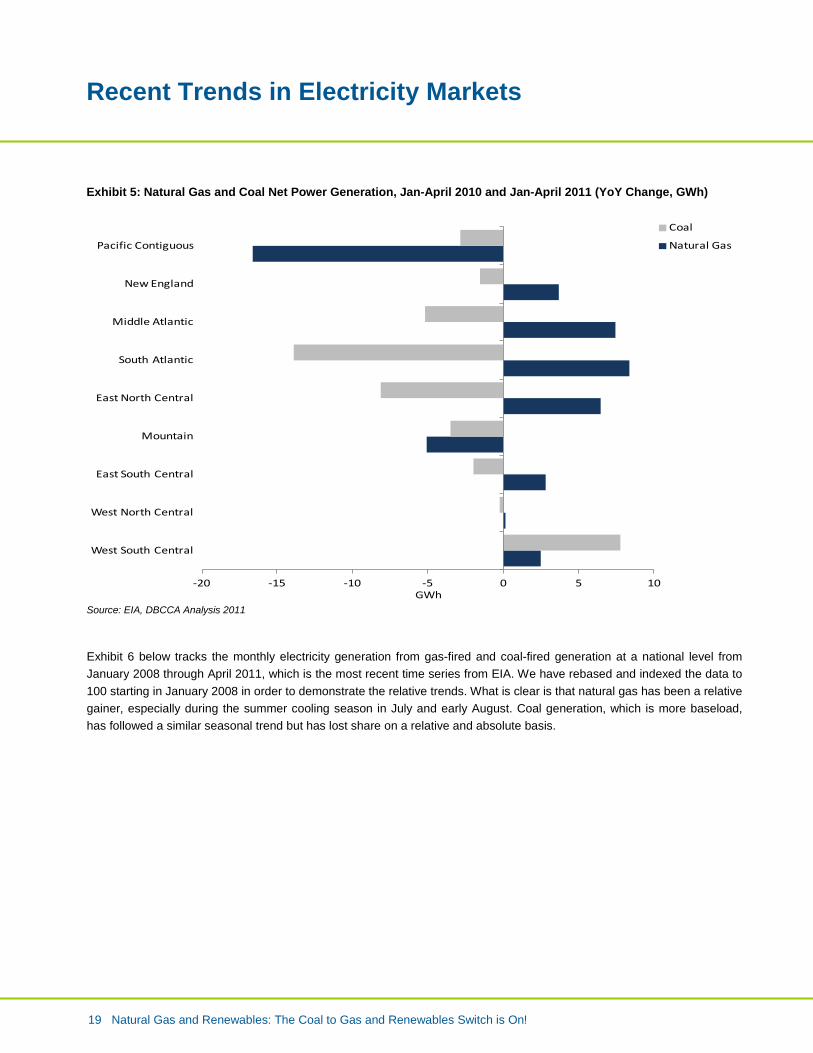
Exhibit 5: Natural Gas and Coal Net Power Generation, Jan-April 2010 and Jan-April 2011 (YoY Change, GWh)
Source: EIA, DBCCA Analysis 2011
Exhibit 6 below tracks the monthly electricity generation from gas-fired and coal-fired generation at a national level from January 2008 through April 2011, which is the most recent time series from EIA. We have rebased and indexed the data to 100 starting in January 2008 in order to demonstrate the relative trends. What is clear is that natural gas has been a relative gainer, especially during the summer cooling season in July and early August. Coal generation, which is more baseload, has followed a similar seasonal trend but has lost share on a relative and absolute basis.
-20 -15 -10 -5 0 5 10
West South Central
West North Central
East South Central
Mountain
East North Central
South Atlantic
Middle Atlantic
New England
Pacific Contiguous
GWh
Coal
Natural Gas

Recent Trends in Electricity Markets
20 Natural Gas and Renewables: The Coal to Gas and Renewables Switch is On!
Exhibit 6: Natural gas and coal generation: rolling monthly production Jan 2008-April 2011 (most recent data)
*Note: Data indexed to a base of 100. Source: EIA, DBCCA analysis 2011
Contribution from Renewables: Accelerating From Low Base Over the past twelve months the contribution of intermittent renewable energy to US electricity supply has increased substantially from a small base with wind and solar now accounting for 4% of total electricity supply in 2Q11 compared to 2% in the beginning of 2011, a doubling of share in terms of percentage point contribution. Additions of large supplies of wind energy from the 2009 American Recovery and Reinvestment Act (ARRA) stimulus plan, which includes the Section 1603 Treasury grants (a hugely successful program that provides for up to 30% of the capital cost of new investment, but expires at the end of 2011), along with strong state RPS incentive for solar appear to be behind the large uptick. And baseload renewables—biomass, geothermal and hyrdro—have also posted large gains, with the share increasing from 8% at the beginning of 2010 to 11% as of 2Q11. This has been driven in large part by a substantial year-over-year rise in hydropower generation (+38% January to April 2011 versus the same period in 2010) due to higher precipitation and heavy snowpack compared to 2010, which was abnormally dry. Importantly, hydro power is very state specific and most common in the West, where Washington, Oregon and California account for more than half of total domestic hydro capacity. Since this region has little coal or alternative power generation sources, incremental hydro supply typically displaces natural gas demand and vice versa. In total, we estimate the net average natural gas displacement by hydropower generation was more than 1.0 bcf/d during the first half of 2011 versus the same period in 2010. These trends can be seen clearly in Table 3 below. We expect hydro generation trends to normalize later this year. Finally, looking at quarterly EIA actual data for total US electricity generation through 2Q11 and then applying our forecast through yearend 2011 we point out that the contribution of coal is expected to decrease by seven percentage points in 4Q2011 compared to 1Q2010. Natural gas, on the other hand, is expected to see a four percentage point increase over the same time period.
020406080
100120140160180
Jan-
08
Mar
-08
May
-08
Jul-0
8
Sep-
08
Nov-
08
Jan-
09
Mar
-09
May
-09
Jul-0
9
Sep-
09
Nov-
09
Jan-
10
Mar
-10
May
-10
Jul-1
0
Sep-
10
Nov-
10
Jan-
11
Mar
-11
Gas Coal

Recent Trends in Electricity Markets
21 Natural Gas and Renewables: The Coal to Gas and Renewables Switch is On!
Table 3: Quarterly Share Shift from Coal to Gas and Renewables Accelerating, 2005-2011
US Electricity Supply (% total kWh)
2005A 1Q10A 2Q10A 3Q10A 4Q10A 2010A 1Q11A 2Q11A 3Q11E 4Q11E 2011E
Coal traditional 50% 48% 44% 44% 44% 45% 47% 43% 42% 41% 43%
Coal CCS 0% 0% 0% 0% 0% 0% 0% 0% 0% 0% 0%
Natural gas 19% 20% 23% 28% 24% 24% 21% 22% 26% 26% 26%
Natural gas CCS 0% 0% 0% 0% 0% 0% 0% 0% 0% 0% 0%
Petroleum 3% 1% 1% 1% 1% 1% 1% 1% 1% 1% 1% Nuclear
19% 20% 20% 18% 21% 19% 20% 20% 19% 20% 20%
Wind & Solar 0% 2% 3% 2% 3% 3% 2% 4% 4% 4% 3%
Baseload renewable* 7% 8% 9% 7% 8% 8% 9% 11% 9% 8% 9%
Other 2% 0% 0% 0% 0% 0% 0% 0% 0% 0% 0% Total 100% 100% 100% 100% 100% 100% 100% 100% 100% 100% 100%
Source: EIA, DBCCA analysis 2011 As we have long argued, we expect this fuel switching to continue based on the fully delivered $/MWh price differentials between natural gas and coal, which currently favor natural gas generation. This is based on the decision tree framework that electricity generators use in deciding which fuel generation is at the margin the most economic to dispatch into the electricity grid. As is clear, since 2009 gas has remained economically a more attractive option compared to coal on a fully delivered $/MWh basis. This explains why coal inventories have accumulated at power plants and why gas utilization rates have increased.
Exhibit 7: Fully Delivered Coal versus Gas Spread, Feb 2005 – Aug 2011 ($/MWh)
*Note: Data adjusted to take into account the relative thermal efficiencies of gas and coal-fired generators.
0
20
40
60
80
100
120
Feb-05May-05Aug-05Nov-05Feb-06May-06Aug-06Nov-06Feb-07May-07Aug-07Nov-07Feb-08May-08Aug -08Nov-08Feb-09May-09Aug-09Nov-09Feb-10May-10Aug-10Nov-10Feb-11May-11Aug-11
NYMEX gas NYMEX delivered coal

Recent Trends in Electricity Markets
22 Natural Gas and Renewables: The Coal to Gas and Renewables Switch is On!
Source: Bloomberg, Deutsche Bank, DBCCA analysis 2011
Impact of EPA Regulation We gained a first look at how pending EPA regulation is affecting (and will continue to affect) producer behavior and wholesale market pricing in the recent May 2011 PJM 2014/2015 auction, which ties to the compliance period for Utility Maximum Achievable Control Technology (MACT) regulation. The sharp 16% year-over-year reduction of coal generator capacity (6,900 MW) bidding into the auction reflects expectations of higher fixed costs for EPA compliance. The difference was substantially offset by nearly 3,500 MW of synthetic supply in the form of demand response resources, which are characterized by their asset efficiency and low capex requirements. Of note, capacity prices in the different parts of PJM levelized and converged substantially, a reflection of significant reduction in forecast load growth and also an increase in capacity prices in the coal-dominant non-MAAC region, which covers such areas as western PA, western MD, OH, IN, MI, KY and VA, where it is clear that the markets are anticipating a reduction in coal supply due to EPA action. We foresee continued EPA regulation of HAPs over the coming years (see the following Policy section for more details). Capital investment trends in the power sector continue to be dominated by natural gas and renewables, which supports our belief that these will be the fastest growing generation sources going forward. In 2010, the US added ~19,000 MW of new generating capacity, of which ~6,500 MW was natural gas and ~4,500 MW was wind energy16
. There was also a large amount of coal generation added as well, which reflects what we think will likely be the last wave of meaningful capital investment in coal-fired generation and was concentrated in plants that have been in development for several years in states such as Texas, Missouri, and Arkansas (see Exhibit 8 below).
Exhibit 8: US Electricity Sector New Capacity Additions 2010 (MW)
Source: EIA and DBCCA Analysis 2011
We believe that the coal additions that we saw in 2010 will continue into 2011 as there are currently about 7GW of coal generation under construction according to SNL and Velocity Suite data bases. But 2011 is likely to be the last year of meaningful coal capacity additions, in our view, since ~63% of the power plants that have received permits to move into construction—e.g. the backlog—are for natural gas and wind. In addition, new coal generation is increasingly unpopular among the general public. On July 21, 2011, The Sierra Club announced a partnership with Bloomberg Philanthropies with
16 Note, in 2009 more than 10,000 MW of wind capacity was added.
6,4415,461
4,343
18,883
0
2,000
4,000
6,000
8,000
10,000
12,000
14,000
16,000
18,000
20,000
Natural Gas Coal Wind US Total
MW

Recent Trends in Electricity Markets
23 Natural Gas and Renewables: The Coal to Gas and Renewables Switch is On!
a goal of advocating for the retirement of one third of the nation’s aging coal fleet by 2020, replacing it with clean energy. The partnership includes a $50 million commitment over four years to the Beyond Coal Campaign that will fuel the Sierra Club’s effort to clean the air and end the coal era.17
Forthcoming EPA regulations focused on non-carbon pollutants will, we believe, lead to as much as 60,000 MW of coal generation retirements in the US by 2020. Assuming a $6/MMBtu gas price, it will be more economic to build new gas-fired generation than new coal plants (see further discussion below on gas).
Natural Gas Pricing Trends: Significant Regional Differences
Fossil fuel commodity prices have been volatile year-to-date in 2011. Coal and oil, in particular, have seen sharp price swings due to geopolitical, weather considerations and sentiment regarding the global economy. Natural gas is different from gas and coal in two respects: 1) It is a regional commodity, and infrastructure and storage limitations create large price variations from country to country; and 2) It is a flexible resource used in power generation, industrial manufacturing, transportation and commercial and residential heating, whereas coal and oil are used predominantly in power generation and transportation, respectively. In this respect, natural gas demand at the sector level is extremely sensitive to relative prices of substitute fuels. Since 2009, US spot natural gas prices have been fairly stable by historic standards in the ~$3-5/MMBtu price range, which has triggered increased usage in power generation and industrial manufacturing. Interestingly, post Fukushima long dated futures, as measured by the 2020 contract have been more elevated than spot prices, although they too have fallen from ~$9/MMBtu in 2009 to $7.50/MMBtu. The 2020 strip is above our normalized price expectation of $6/MMBtu. We believe that this is a reflection that market participants are still skeptical of shale economics on the one hand while also believing that there will be increased demand for natural gas over the next 10 years on the other, particularly in the power generation sector. Importantly, most natural gas contracts are less than five years in duration so there is really not much liquidity in the longer dated contracts, which tend to reflect speculator sentiment more than physical hedging. Long date coal futures, have been essentially flat since Fukushima.
Exhibit 9: Natural Gas Prices - Long-dated 2020 Futures Have Been Elevated Despite Falling Spot Prices
Source: Bloomberg, DBCCA Analysis 2011
17 http://www.mikebloomberg.com/index.cfm?objectid=4D1722F5-C29C-7CA2-FCB6385366A49867
0
20
40
60
80
100
120
140
May
-08
Jun-
08Ju
l-08
Sep-
08Oc
t-08
Dec-0
8Jan
-09
Mar
-09
Apr-0
9M
ay-0
9Ju
l-09
Aug-0
9Se
p-09
Nov-0
9De
c-09
Feb-
10M
ar-1
0Ap
r-10
Jun-
10Ju
l-10
Aug-1
0Oc
t-10
Nov-1
0Jan
-11
Feb-
11M
ar-1
1
Henry Hub Spot 2020 Futures
May 2008 = 100 Base
Recent Trends in Electricity Markets
24 Natural Gas and Renewables: The Coal to Gas and Renewables Switch is On!
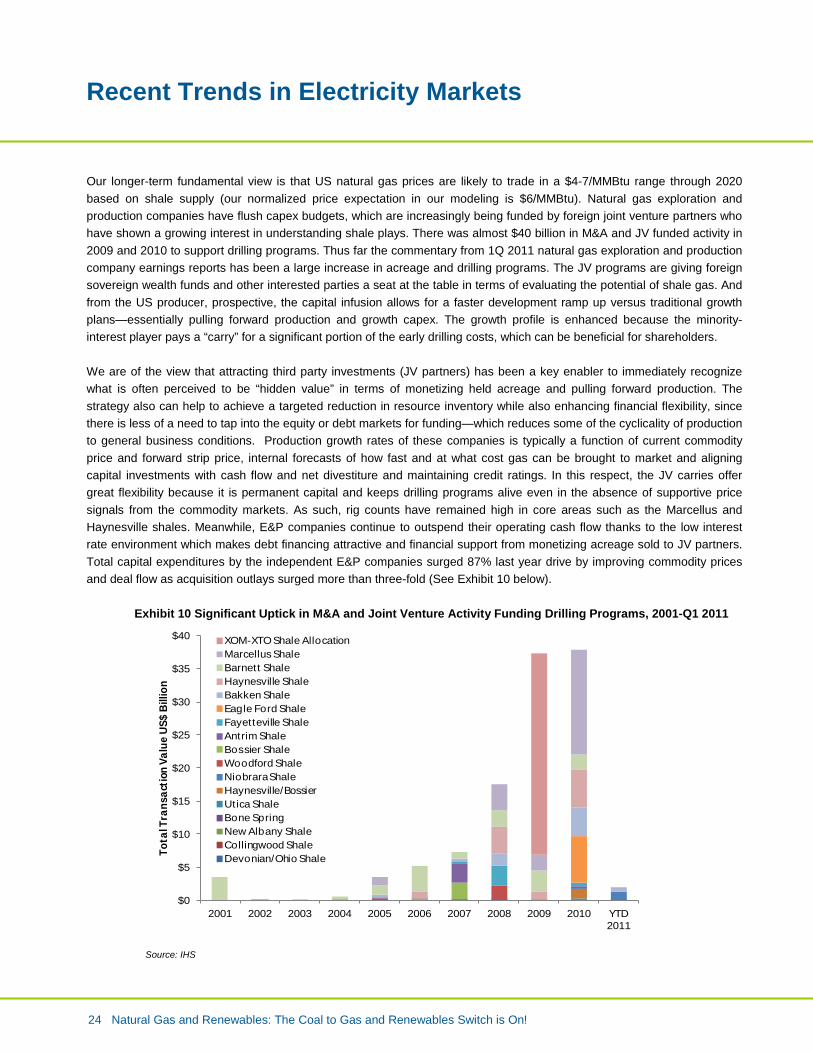
Our longer-term fundamental view is that US natural gas prices are likely to trade in a $4-7/MMBtu range through 2020 based on shale supply (our normalized price expectation in our modeling is $6/MMBtu). Natural gas exploration and production companies have flush capex budgets, which are increasingly being funded by foreign joint venture partners who have shown a growing interest in understanding shale plays. There was almost $40 billion in M&A and JV funded activity in 2009 and 2010 to support drilling programs. Thus far the commentary from 1Q 2011 natural gas exploration and production company earnings reports has been a large increase in acreage and drilling programs. The JV programs are giving foreign sovereign wealth funds and other interested parties a seat at the table in terms of evaluating the potential of shale gas. And from the US producer, prospective, the capital infusion allows for a faster development ramp up versus traditional growth plans—essentially pulling forward production and growth capex. The growth profile is enhanced because the minority-interest player pays a “carry” for a significant portion of the early drilling costs, which can be beneficial for shareholders. We are of the view that attracting third party investments (JV partners) has been a key enabler to immediately recognize what is often perceived to be “hidden value” in terms of monetizing held acreage and pulling forward production. The strategy also can help to achieve a targeted reduction in resource inventory while also enhancing financial flexibility, since there is less of a need to tap into the equity or debt markets for funding—which reduces some of the cyclicality of production to general business conditions. Production growth rates of these companies is typically a function of current commodity price and forward strip price, internal forecasts of how fast and at what cost gas can be brought to market and aligning capital investments with cash flow and net divestiture and maintaining credit ratings. In this respect, the JV carries offer great flexibility because it is permanent capital and keeps drilling programs alive even in the absence of supportive price signals from the commodity markets. As such, rig counts have remained high in core areas such as the Marcellus and Haynesville shales. Meanwhile, E&P companies continue to outspend their operating cash flow thanks to the low interest rate environment which makes debt financing attractive and financial support from monetizing acreage sold to JV partners. Total capital expenditures by the independent E&P companies surged 87% last year drive by improving commodity prices and deal flow as acquisition outlays surged more than three-fold (See Exhibit 10 below).
Exhibit 10 Significant Uptick in M&A and Joint Venture Activity Funding Drilling Programs, 2001-Q1 2011
Source: IHS
$0
$5
$10
$15
$20
$25
$30
$35
$40
2001 2002 2003 2004 2005 2006 2007 2008 2009 2010 YTD 2011
Tota
l Tra
nsac
tion
Val
ue U
S$ B
illio
n
XOM-XTO Shale AllocationMarcellus ShaleBarnett ShaleHaynesville ShaleBakken ShaleEagle Ford ShaleFayetteville ShaleAntrim ShaleBossier ShaleWoodford ShaleNiobrara ShaleHaynesville/BossierUtica ShaleBone SpringNew Albany ShaleCollingwood ShaleDevonian/Ohio Shale

Recent Trends in Electricity Markets
25 Natural Gas and Renewables: The Coal to Gas and Renewables Switch is On!
Supply Trends Point to Gas “Manufacturing” Model
All of the major gas exploration & production companies have emphasized the productivity improvements in disclosures over the past six months. And the data support this assertion. For example, evaluating the EIA’s Form 914 data which tracks monthly national production figures for gas, gross withdrawals—e.g. production, which includes gas that is vented, flared, or removed in processing—reached a record 77.93 bcf/day in March 2011 (the most recent data point). This is a record monthly production number going back to 1980. Fascinatingly, gas production has remained steady even in the face of a declining number of dedicated drilling wells directed toward gas. For example, gas drilling rigs have decreased from an August 2008 peak of 1,606 units to 880 rigs as of March 2011, a decline of ~45%. Yet, production over that same point period (Bcf/day) has increased by ~10%. The trend can clearly be seen in Exhibit 11 below, which plots the relationship between domestic natural gas production and rig count (January 2005 index base of 100). This is a clear indication of significant productivity improvements in drilling programs.
Exhibit 11: Production Volumes have Increased while Rig Counts have Decreased (Index base = 100)
Source: Bloomberg, DBCCA Analysis 2011
Looked at differently, the ratio of production (Bcf/day) to rig count has stabilized over the past two years at ~10 as illustrated in Exhibit 12 below.
0
20
40
60
80
100
120
140
160
Jan-
05Ju
n-05
Nov-
05Ap
r-06
Sep-
06Fe
b-07
Jul-0
7De
c-07
May
-08
Oct
-08
Mar
-09
Aug-
09Ja
n-10
Jun-
10No
v-10
Gas Rig Count
BCF/day

Recent Trends in Electricity Markets
26 Natural Gas and Renewables: The Coal to Gas and Renewables Switch is On!
Exhibit 12: Ratio of Natural Gas Production (bcf) to Rig Count
Source: Bloomberg, DBCCA Analysis 2011
Accordingly, there is a strong productivity story emerging in the shale plays. Pad drilling programs can cover large resource plays from a relatively minor one acre footprint. And on top of that the upstream services companies have been able to significantly reduce the number of days it takes to drill shale wells (see Exhibit 13 below).
Exhibit 13: Shale Production becoming More Efficient - Days to Drill a Shale Gas Well, 2009 – Q3 2011
Source: QEP Resources, DBCCA Analysis 2011
In addition, all-in finding and development (F&D) and lease operating costs have dropped precipitously over the past three years. According to Range Resources—a large operator in the Marcellus Shale—lease operating costs have declined to 0.65 per mcfe in 2011 from 0.99 in 2008 and F&D costs have fallen to $0.71 from an average of $2 per mcfe in 2008, suggesting cash breakevens of less than $2 per mcfe. This is why there is so much drilling activity even with gas below $5/MMBtu. Learning curve improvements have meant that drillers are making money at these prices and can continue to
0
5
10
15
20
25
30
Jan-
05
Jul-0
5
Jan-
06
Jul-0
6
Jan-
07
Jul-0
7
Jan-
08
Jul-0
8
Jan-
09
Jul-0
9
Jan-
10
Jul-1
0
Jan-
11
Ratio BCF/rig count
Ratio BCF/rig count
66
3732
0
10
20
30
40
50
60
70
2009 2010 2011 YTD

Recent Trends in Electricity Markets
27 Natural Gas and Renewables: The Coal to Gas and Renewables Switch is On!
redeploy more capital into future drilling programs. Hedging in the $5-6 range has allowed many producers to make money in low commodity price environment. In general gas wells can generate ~75% IRRs assuming 5 bcfe production and $4 NYMEX.
These data points raise several interesting questions. 1) Why has production increased with a decline in drilling rigs? 2) Why has production increased amid flat demand and low gas prices?
There are no simple answers to these questions. However, as with any fast growing industry, the economy of scale benefits and “learning curves” coupled with a hyper competitive industry structure has improved the capital efficiency of gas production. In particular, the industry has become particularly adept at overcoming challenges. In this regard “technology” broadly speaking has been trumping “geology” and the decline curves inherent in shale plays. So-called walking rigs, pad drilling programs that can reach up to 5,000 acres from a single acre drilling multiple wells, and technology such as micro-seismic monitoring have all added to the productivity story.
Exhibit 14: The “Gas Manufacturing” Model of Shale Production
Source: DBCCA Analysis 2011
The second question is why has drilling activity increased with gas prices low by historical standards? This is a more complicated issue and has to do with industry structure. The North American gas market is “islanded” which is to say that unlike oil there is not—at least for now—an enabling global infrastructure to allow seamless import and export in response to supply/demand and price signals, such as the case with the global oil markets, for example. However, with many E&P players sitting on low cost basis acreage with F&D costs below $2 MMBtu, they can still make money in a $4-5/MMBtu gas environment. And also, drilling programs are being funded by the roll-off of higher hedges and JV “carry” from foreign partners who are pulling forward production as was discussed previously. The net impact of these fundamental trends is that natural gas prices have been depressed, especially relative to oil prices. As a consequence, exploration and production companies have expanded horizontal drilling programs for natural gas liquids and oil given the favorable price differentials. However, even with drilling programs moving more toward wet gas plays, there has still been a supply overhang. Of note, on an MMBtu equivalent basis, oil is at an all time high relative to gas, which measures the energy equivalent spread premium on a $/MMBtu basis between US WTI oil and natural gas at Henry Hub (see Exhibit 14 below).
•Establishing horizontal cement sheath integrity
•Stimulation planning, optimization and placement
•Enhancing long term conductivity
•Optimizing f racture treatments
•Reducing water costs through recycling and evaporation
•Accelerating shale experience
•Determining lease values
•Designing a well plan
•Evaluating the reservoir
•Targeting the sweet spot
•Managing the horizontal borehole
• Increasing drilling ef f iciencies
Completion & Production Environmental Efficiency &
ExpertiseExploration and
planning Evaluation Drilling

Recent Trends in Electricity Markets
28 Natural Gas and Renewables: The Coal to Gas and Renewables Switch is On!
Exhibit 15: Oil and Gas Price Differential (WTI and Henry Hub), 2002-2011 ($/MMBtu)
Source: Bloomberg, DBCCA Analysis 2011
Impact on Transportation Sector
Exhibit 15 above tells us is that the arbitrage conditions are ripe for compression and should encourage new sources of demand for natural gas, particularly as a substitute for diesel used in hubs and spoke vehicle networks such as ports, urban bus routes and refuse hauling. We have seen this most notably in the garbage truck market in the US, where we estimate that compressed natural gas vehicles (CNG) now have about a 22% penetration rate which could more than double in the next 5 years given the favorable economics. We also expect that there will be some large fleet conversions for heavy trucks on routes where there is enabling infrastructure. Natural gas penetration in the US is currently less than 1% of the vehicle fleet but growing rapidly. According to Westport Innovations, a leading player in heavy duty natural gas engines, there is an immediate payback on new lease options for Paccar trucks given the favorable lease life $/gallon equivalent of $2.10 for CNG compared to $3.60 for diesel. On a leased basis, this translates into a savings of $650 per month, which is why truck operators are opting for natural gas rigs in corridors where there is adequate infrastructure. Netting this out there is an argument that supports increased demand for natural gas in the US for transportation fuel since it is a domestically secure and economically attractive resource, especially relative to the oil price differential. We believe that there could potentially be as much as 2-3 mn barrels per day of US domestic oil demand that could be substituted with natural gas in the transportation sector or ~10-15% of total domestic oil demand. The following factors would be supportive of increasing longer-dated gas prices into the $5-7 MMBtu range, which in turn should encourage more drilling activity: 1. Mix shift to “oilier” production plays: The last 18 months have been characterized by a change in producer
behavior, with incrementally more drilling rigs directed toward natural gas liquids plays. Once producers convert to drilling wells that produce $10-17/mcfe units (i.e. thousand cubic feet equivalent unit, which combines the output for all products) they may be less inclined to go back to drilling dry gas wells without a stronger forward price signal. Drilling has persisted to-date because of JV carriers and held-to-production (HDP) status, in which the lease holding rights require that drilling commence within a prescribed period, a so-called “use it” or “lose it” provision. Hence, for
-4
-2
0
2
4
6
8
10
12
14
16
Sep-01 Oct-02 Nov-03 Dec-04 Jan-06 Feb-07 Mar-08 Apr-09 May-10

Recent Trends in Electricity Markets
29 Natural Gas and Renewables: The Coal to Gas and Renewables Switch is On!
contractual reasons drilling activity has persisted despite abundant supply and discouraging price signals in the spot market.
2. Export infrastructure 2015-2020: The conversion of US liquefaction import facilities to liquefied natural gas (LNG) export facilities by 2015 will open up new, global market opportunities, and may lead to more convergence in longer-dated gas contracts between the US and European markets. However, we would caution that these export terminals are costly to build and face significant permitting and approval timelines so it remains to be seen how much export capacity actually develops. Liquefaction plants require large footprints as shown below.
3. Other factors: Future demand pull for US natural gas may also eventually come from the following sources given the fuel’s ubiquity and usefulness: 1) continued rise in industrial demand as a feedstock for plastics given its favorable pricing relative to oil-based naphtha prices; 2) potential momentum in adoption of heavy vehicles to compressed natural gas (CNG) given the rapid payback in conversions with $4+ gallon diesel (as discussed above); 3) continuing and accelerating shift from coal to natural-gas fired electricity, which is our core thesis and 4) impact of first wave of US gas-to-liquids (GTL) plants, which are set to come on line by 2015-2016 and are being spearheaded by Shell and Sasol18
.
Will the US Export Gas? The “shale gale” has meaningfully changed the global natural supply/demand balance. To put this into perspective, the US has increased production by ~10 bcf/day over the past four years, a level comparable to the gas supply from all of Qatar. If US shale supply were its own country, it would be the world’s third largest natural gas supplier. Only four years ago the consensus expectation was that the US would increasingly depend on LNG cargoes to fill in the gap from dwindling offshore production. Consequently, there was a large infrastructure buildup and the US added about a dozen LNG off-loading and gasification terminals in the US over the past decade. But now with the capacity utilization rates in many of these facilities at 10% or less, there has been a move to convert these facilities so they can export gas to markets in Europe and Asia that are willing to pay a higher price, since the structure of natural gas contracts in those markets is indexed to oil prices. In May 2011, Cheniere Energy Partners received approval from the US Department of Energy (DOE) to export gas from its Sabine Pass Liquefaction facility. The approval was significant because the DOE determined reversed a long held policy that prohibited export of natural gas for domestic security reason. In granting the export license the DOE appears to have agreed with Chenier’s argument that domestic natural gas capacity will exceed US demand by 11.0 Bcf/d in 2015, 19.9 Bcf/d in 2025 and 28.7 Bcf/d in 2035, meaning that the volumes of gas potentially exported from the facility would be insufficient to influence the domestic pricing structure of the US gas markets on its own. 19
Other LNG players are looking to do the same. If this infrastructure is indeed built it would be an important step toward developing a global gas market with tighter price parity between the different regions. Natural gas markets are regional compared to other energy markets due to infrastructure limitations, which limit price arbitrage opportunities. Historically for the past 40 years, long-term gas contract have been indexed to oil. This has been especially true in continental Europe and Asia. Therefore, the widening divergence between US spot natural gas and LNG cargoes on the one hand and spot oil prices on the other over the past 18 months has accentuated the differences in regional pricing. With the US awash with domestic gas most LNG cargoes have gone to Europe, China and Japan where they have been able to undercut oil-linked “take or pay” contracts. A trend to monitor is the influence of LNG cargoes in disrupting the traditional oil-linked contract structure. Moreover, shale gas is likely to go global over the next 5 years as the US begins to export gas. In effect this would change the global pricing dynamics and break the hammerlock that oil has exerted on natural gas pricing dynamics, particularly in Europe and Asia.
18 Sasol and Shell, the two large players in gas to liquids (GTL) have started to develop plays in North America. In December 2010, Sasol agreed to pay $1 billion to Talisman Energy for a 50% stake in its Montney Shale play in British Columbia, Canada. Sasol believes that the resource play offers an important hedge and option value in the North America market. 19 Sabine Pass Liquefaction, LLC DOE/FE Order No. 2961 May 20, 2011, Page 16

Recent Trends in Electricity Markets
30 Natural Gas and Renewables: The Coal to Gas and Renewables Switch is On!
Table 4: Proposed US LNG Projects Filed for regulatory approval Project Location Company Start-Up Size (bcf/d) Size (mpta) Sabine Pass LA, US Gulfcoast 2015 1 8
Lake Charles LA, US Gulfcoast TBD 2 16
Freeport LNG TX, US Golfcoast 2015 1.4 11.2
Kitimat LNG British Columbia, Canada
2015 0.7 5.6
LNG Export Cooperative
British Columbia, Canada
2014 0.12 1
Subtotal 5.22 41.8
Proposed projects under consideration Cove Point MD, US Eastcoast Dominion 2015 TBD TBD
Jordan Cove OR, US Westcoast Fort Chicago/Energy
2016 TBD TBD
Prince Rupert British Columbia, Canada
Shell N/A 1.5 ~12
Total ~50+ Source: Citi, DBCCA, 2011

Economics: Investment Implications of Fuel Switching
31 Natural Gas and Renewables: The Coal to Gas and Renewables Switch is On!
3. Economics: Investment Implications of Fuel Switching Summary
• Levelized cost of electricity (LCOE) is a narrow measure for comparing electricity generation costs across technologies
but an important starting point. • In our work we build on a LCOE framework by adding system integration and known environmental retrofit costs to reach
what we call “total cash” costs. • We then apply the fully loaded “total cash” cost framework to look at the economics of deploying renewables, nuclear
energy and the coal to gas fuel switch, layering on top of that the fundamental factors that influence the investment decision at an operating level and therefore the switch using a decision tree matrix.
• We expect a prolonged investment cycle in the power sector driven by the intersection of economics, policy and the infrastructure requirements that come with a changing fuel mix.
In Table 5 below we present a model that assesses some of the fully loaded cash costs represented in the previous Exhibit that are often excluded from analysis. What we have done for now is concentrate on fully loaded cash costs, which represents LCOE, infrastructure costs and regulated externalities. Our estimates are general figures for the US market as a whole. These costs borne by specific assets will vary depending on location, electricity market structure, regulatory structure, fuel on the margin, natural resources along with a host of many other variables. We look at the unsubsidized costs for both old assets and new builds.
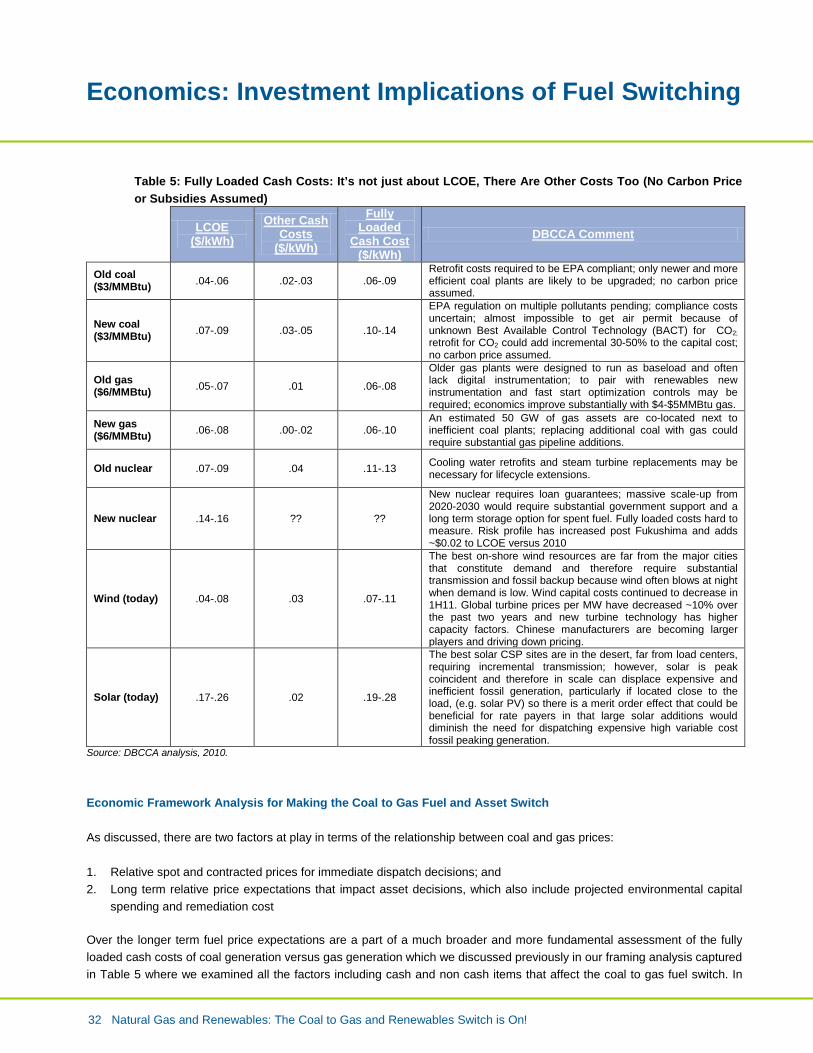
Economics: Investment Implications of Fuel Switching
32 Natural Gas and Renewables: The Coal to Gas and Renewables Switch is On!
Table 5: Fully Loaded Cash Costs: It’s not just about LCOE, There Are Other Costs Too (No Carbon Price or Subsidies Assumed)
LCOE
($/kWh) Other Cash
Costs ($/kWh)
Fully Loaded
Cash Cost ($/kWh)
DBCCA Comment
Old coal ($3/MMBtu) .04-.06
.02-.03
.06-.09
Retrofit costs required to be EPA compliant; only newer and more efficient coal plants are likely to be upgraded; no carbon price assumed.
New coal ($3/MMBtu) .07-.09 .03-.05 .10-.14
EPA regulation on multiple pollutants pending; compliance costs uncertain; almost impossible to get air permit because of unknown Best Available Control Technology (BACT) for CO2; retrofit for CO2 could add incremental 30-50% to the capital cost; no carbon price assumed.
Old gas ($6/MMBtu) .05-.07 .01 .06-.08
Older gas plants were designed to run as baseload and often lack digital instrumentation; to pair with renewables new instrumentation and fast start optimization controls may be required; economics improve substantially with $4-$5MMBtu gas.
New gas ($6/MMBtu) .06-.08 .00-.02 .06-.10
An estimated 50 GW of gas assets are co-located next to inefficient coal plants; replacing additional coal with gas could require substantial gas pipeline additions.
Old nuclear .07-.09 .04 .11-.13 Cooling water retrofits and steam turbine replacements may be necessary for lifecycle extensions.
New nuclear .14-.16 ?? ??
New nuclear requires loan guarantees; massive scale-up from 2020-2030 would require substantial government support and a long term storage option for spent fuel. Fully loaded costs hard to measure. Risk profile has increased post Fukushima and adds ~$0.02 to LCOE versus 2010
Wind (today) .04-.08 .03 .07-.11
The best on-shore wind resources are far from the major cities that constitute demand and therefore require substantial transmission and fossil backup because wind often blows at night when demand is low. Wind capital costs continued to decrease in 1H11. Global turbine prices per MW have decreased ~10% over the past two years and new turbine technology has higher capacity factors. Chinese manufacturers are becoming larger players and driving down pricing.
Solar (today) .17-.26 .02 .19-.28
The best solar CSP sites are in the desert, far from load centers, requiring incremental transmission; however, solar is peak coincident and therefore in scale can displace expensive and inefficient fossil generation, particularly if located close to the load, (e.g. solar PV) so there is a merit order effect that could be beneficial for rate payers in that large solar additions would diminish the need for dispatching expensive high variable cost fossil peaking generation.
Source: DBCCA analysis, 2010. Economic Framework Analysis for Making the Coal to Gas Fuel and Asset Switch As discussed, there are two factors at play in terms of the relationship between coal and gas prices: 1. Relative spot and contracted prices for immediate dispatch decisions; and 2. Long term relative price expectations that impact asset decisions, which also include projected environmental capital
spending and remediation cost
Over the longer term fuel price expectations are a part of a much broader and more fundamental assessment of the fully loaded cash costs of coal generation versus gas generation which we discussed previously in our framing analysis captured in Table 5 where we examined all the factors including cash and non cash items that affect the coal to gas fuel switch. In

Economics: Investment Implications of Fuel Switching
33 Natural Gas and Renewables: The Coal to Gas and Renewables Switch is On!
Table 6 below, we take a look at the factors that contribute to both a fuel switch (change in utilization rates) and an asset switch (retire and rebuild) under different pricing scenarios. We assume a constant $3/MMBtu price for coal and then look at how this compares to natural gas prices at $4/MMBtu, $6/MMBtu (our normalized expectation based on the forward curves) and $8/MMBtu. These pricing assumptions are then applied to three different categories of generation scenarios which are:
1. Partially or fully depreciated coal or natural gas plant 2. Depreciated coal plant that spends incremental capex for environmental control remediation to comply with forthcoming
EPA regulations (CO2 control is excluded) 3. A new build coal or gas plant that is compliant with forthcoming EPA regulation
Table 6: Coal to Gas Fuel and Asset Switch Decision Tree Matrix and Commodity Price Sensitivity Coal/gas scenarios
1 2 3
Power generation type ($/MMBtu fuel)
Existing coal/gas plant LCOE
Depreciated coal plant EPA retrofit fully loaded cash cost
New build coal/gas scrubbed EPA compliant plant fully loaded cash cost
Comment
Coal @ $3.00 0.04-0.06 0.06-0.09 0.10-0.14 Coal fully loaded cash costs rise with greater EPA compliance
Gas @ $4.00 0.03-0.05 n/a 0.05-0.07 At $4/MMBtu, gas displaces coal across all scenarios
Fuel Switch Yes Yes Yes Hedge a carbon price
Asset Switch Yes Yes Yes Hedge a carbon price; build new gas assets to replace inefficient coal
Gas @ $6.00 0.05-0.07 n/a 0.06-0.10 At $6/MMBtu, only old unscrubbed coal beats gas on LCOE but not based on fully loaded cash cost
Fuel Switch 0.05-0.07 Yes Yes
Asset Switch No Yes Yes Hedge a carbon price; build new gas assets to replace inefficient coal
Gas @ $8.00 0.06-0.08 n/a 0.07-0.09 At $8/MMBtu, old coal beats gas on LCOE and new EPA compliant builds are breakeven with gas
Fuel Switch No Yes Selectively Hedge a carbon price; dispatch efficient gas assets
Asset Switch No Yes Selectively Hedge a carbon price; build new gas assets to replace inefficient coal
Source: DBCCA analysis, 2010

Economics: Investment Implications of Fuel Switching
34 Natural Gas and Renewables: The Coal to Gas and Renewables Switch is On!
As is clear, environmental retrofit costs weigh heavily in this decision tree analysis for coal generation with costs increasing by 50%. The key incremental costs for existing uncontrolled coal units are adding scrubbers and selective catalytic reduction (SCRs) systems in light of the EPA Transport and hazardous air pollutants (HAP) rules. Other costs include the possible addition of carbon injection and bag-houses to control for Mercury. Other huge capital costs that have to be weighed in the decision tree analysis include the possible replacement of cooling towers and “dry” landfills for coal ash disposal. So there may be large layers of capital costs piling up on coal units. Given the size of these potential investments, the effective age of the unit becomes quite important since the costs are amortized over the remaining useful life of the asset. Age and efficiency are therefore important determinants of whether it makes sense to upgrade coal assets to be environmentally compliant with more restrictive EPA regulations or retire the asset and rebuild with natural gas-fired generation. We update our analysis of EPA regulation in the Policy section of this report, showing there is continuing momentum on this front. On top of this, we do believe that the utility industry uses a “shadow” carbon price in their long-term integrated resource planning (IRP) analysis in anticipation of some regulatory action in the next several years.
Our base case normalized long term expectation for natural gas is $6/MMBtu and is highlighted in the green section of the matrix above. Such a long term gas view means that the only time coal is cheaper than gas in this hypothetical is comparing old coal to old gas on a current LCOE basis. Older gas plants are cheaper than coal retrofits under a variety of natural gas pricing assumptions ($4-$8/MMBtu range) since they do not require costly capital equipment additions and cheaper versus new fully scrubbed and EPA compliant new coal plants, which face high environmental control costs and are difficult to permit. Investment Implications The investment implications of our lower carbon future energy pathway are fairly straightforward to identify, but that does not diminish their likely impact. We have framed what we believe to be a least cost strategy for lowering emissions that centers on a coal to natural gas shift—driven in large part by improving the utilization rate of existing natural gas plants—in combination with increased penetrations of renewables and a modest build up in nuclear energy in the short run but a decline from 2020 onward. However, the sheer size of the US electricity sector and magnitude of the spending required to move forward along this pathway will have major implications for many companies and a diverse set of industries. In our model we capture the capital stock turnover implications of retiring 152 GW of coal capacity. We forecast that as these units are retired the utilization rate of the natural gas fleet will increase and where necessary new capacity additions will come from the next generation of natural gas power plants, which are being designed by the leading original equipment manufacturers (OEMs) for fast start and quick ramps with a minimal environmental emissions footprint to meet the cycling requirements that will eventually be necessary with greater fractions of intermittent wind and solar additions into the grid system. We also modeled the projected impact of state renewable portfolio standard (RPS) programs to see how many wind and solar capacity additions would be necessary to achieve the 2025 targets of about 486 TWh on a national basis, which is the compliance period for all the programs that we analyzed. Based on our model, the largest increases in capital spending for new generation occur between 2016 and 2020 with the buildup in renewables, new nuclear and natural gas generation to replace coal. In addition, as we discuss on pages 45-49 below, we believe significant value will also accrue to natural gas power plants that are currently underutilized and co-located within reasonable proximity to old coal plants. Prolonged capital investment cycle: We expect a prolonged investment cycle in the power sector driven by the intersection of economics, policy and the infrastructure requirements that come with a changing fuel mix. As we discuss in more detail in the next Policy section of this paper, regulation efforts will add hugely to US power sector capital spending.

Economics: Investment Implications of Fuel Switching
35 Natural Gas and Renewables: The Coal to Gas and Renewables Switch is On!
We estimate that cumulative total capacity additions and environmental retrofits to coal units will lead to an incremental cumulative generation capex of $931 billion between 2011 and 2030, with the peak spending occurring in 2020.
Exhibit 16: Annual Power Sector Capital Spend on New Capacity and Environmental Retrofits, 2010-2030 ($bn)
Source: DBCCA analysis, 2011.
Renewables and transmission will post significant growth Within our generation forecast, wind and solar capacity additions have the largest growth rate from 2010 through 2030 from a small base due to state government support for renewable portfolio standard (RPS) mandates and targets. Combined, wind and solar accounted for just 3% of total electricity supply in 2010 and we expect their combined share to increase to 17% by 2030. We forecast total installed capacity to increase from 41 GW in 2010 to 134 GW in 2020 and 273 GW in 2030. Transmission grid improvements need building out to accommodate renewables and are expected to require $41 billion in investment through 2020, and $158 billion by 2030. We expect that at least 32,000 miles of transmission lines will be built by 202020. Capital investment in new gas generation to replace retiring coal fleet totals $39 billion between 2010 and 2030, resulting in 30 GW of cumulative natural gas additions from 2010-2020 and 61 GW of cumulative additions from 2020 to 2030. Evidence continues to mount that long term fuel switch that we envision is happening now. The American Public Power Association (APPA) April 2011 Generating Capacity update report shows that three zero-emitting forms of renewable energy—wind, water, and solar—account for the majority of capacity additions.21
And as we showed earlier in the Recent Trends section of this paper, the contribution of wind and solar to total US supply has increased by 2 percentage points to 4% of total electricity supply from the beginning of 2010 through 2Q11.
20 ITC Holdings Corp 2010 Investor Day Slides, p.7 21 APPA Report on New Generating Capacity: 2011 Update, p. 3
$0
$10
$20
$30
$40
$50
$60
$70

Economics: Investment Implications of Fuel Switching
36 Natural Gas and Renewables: The Coal to Gas and Renewables Switch is On!
Exhibit 17: Installed Solar and Wind Capacity Projected to Increase Substantially, 2010-2030 (GW)
Source: DBCCA analysis, 2011
Defining Grid Parity The key cost question for renewable energy systems is whether they cost more to deploy than fossil fuel-based systems, and in particular gas-fired systems. To grasp the significance of renewable generators achieving so-called “grid parity” – where the cost of renewable electricity will be equivalent to the cost of fossil-based electricity – it is necessary to define its precise meaning. The European Photovoltaic Industry Association (EPIA) helpfully distinguishes between two types of grid parity:
• Dynamic Grid Parity (i.e. retail grid parity): For a particular market segment in a particular country (e.g. California’s residential electricity market), the moment when a customer-side-of-the-meter renewable generator supplies long-term revenues equal to the long-term cost of installing, financing, operating, and maintaining the system.
• Generation Value Competitiveness (i.e. wholesale grid parity): From the point of view of an investor or utility in a particular country, the moment when adding renewable capacity to the generation portfolio becomes as attractive as adding a conventional (i.e. fossil fuel-based) generator.
For the case of solar PV, Exhibit 18 below illustrates the two concepts of grid parity:
38.6
107.0
183.0
2
27
90
(10)10 30 50 70 90
110 130 150 170 190 210 230 250
2010A 2020E 2030E
Wind capacity GW Solar capacity GW

Economics: Investment Implications of Fuel Switching
37 Natural Gas and Renewables: The Coal to Gas and Renewables Switch is On!
Exhibit 18: Grid Parity from Two Different Points of View – Electricity Consumer and Investor/Utility
Dynamic (i.e. retail) Grid Parity
Generation Value Competitiveness (i.e. wholesale
grid parity)
Source: European Photovoltaic Industry Association, September 2011
While the goalposts for grid parity will often move differently from the consumer perspective than they will from the investor/utility perspective (e.g. in response to increased rise capital costs for new coal-fired plants), declining LCOEs for renewable hastens the achievement of grid parity from both perspectives.
Historical Cost Trends for Energy Generating Technologies Exhibit 19 below illustrates long-term cost trends for five major energy generating technologies. Two central points emerge. First, the low cost of thermal (i.e. coal and natural gas) and nuclear power – frequently described as an innate quality of these technologies – is in fact the result of massive investment in scale-up over multiple decades. Second, scale-up of wind and solar energy is enabling a similar downward cost trajectory – but with costs declining at a much faster rate. Exhaustive energy cost analyses confirm this point. From 1902-2006 the capital cost of a subcritical pulverized coal plant decreased by 45% (from $3.49/W to $1.93/W); from 1975-2003 the capital cost of a solar PV cell has decreased by 97%. In other words, relative to coal, solar PV has taken less than one-third of the time to achieve twice the reduction in installed cost. Moreover, from 2003-2011 the cost of producing a solar cell has declined another 66% (to roughly $1/W). Since the capital cost of PV cells accounts for 35-45% of the levelized cost of a PV system, such cost reductions translate into a substantially lower LCOE for solar PV.

Economics: Investment Implications of Fuel Switching
38 Natural Gas and Renewables: The Coal to Gas and Renewables Switch is On!
Exhibit 19: U.S. Electricity Generation and Retail Cost by Technology, 1930 – 2010
Source: Hudson Clean Energy Partners analysis, 2011
Snapshot of where Costs for Renewables are Now (without any tax credits or subsidies) Excluding the impact of any investment/production tax credits, feed-in tariffs, or other subsidies, the figure below zeroes in on how the levelized cost of electricity (LCOE) from renewables compares with the cost of renewables from conventional sources as of 2011 Q2. The data underlying this exhibit come from projects around the world, and hence incorporate resource or market conditions that may vary from those found in the US. Also worth noting are the standard caveats – discussed more fully in our Economics section above - that (1) the LCOE for any technology will be a range estimate that is aggregated from multiple projects that differ in their exact physical and financial characteristics; (2) for renewable energy systems that depend on geography-specific resource availabilities, variance in LCOE will be significantly greater than for conventional technologies; and (3) new-build LCOE figures exclude costs such as those arising from system integration or eventual environmental retrofit. These limitations qualify but do not undermine the usefulness of LCOE as a metric to gauge the competitiveness of individual generation technologies. Ignoring geothermal – which is competitive with thermal electricity sources but also highly location-dependent – the exhibit below suggests different takeaways for the current economic competitiveness of wind and solar PV. Steady decreases in wind turbine costs (e.g. to $1.27 million/MW in H2 2011, a 19% decrease from 2007-2008) have enabled a growing number of wind projects to generate electricity a cost competitive with that from coal and only slightly above that from natural gas.22
This highly encouraging development for renewable energy bolsters the status of wind power as viable choice for new generation capacity in certain markets; it is important to recall, however, that investors and utilities who evaluate such investments do so in the context of a particular location within a particular market at a particular time. What enables a wind project in one location to reach wholesale grid parity – class 7 wind speeds, inexpensive debt, and a turbine supply contract signed amid a short-lived period of over-supply – may not be available to wind projects generally. Such limitations strengthen the case for maintaining policy support for wind power as the industry continues to scale over the next few years – thereby extending the opportunity for wholesale grid parity to a broader number of potential wind project investments.
22 Bloomberg New Energy Finance, Wind Turbine Price Index, February 14 2011.
0.0
0.2
0.4
0.6
0.8
1.0
1.2
1.4
0
200
400
600
800
1,000
1,200
1,400
1,600
1,800
2,000
2,200
1930 1935 1940 1945 1950 1955 1960 1965 1970 1975 1980 1985 1990 1995 2000 2005 2010
Reta
il Co
st ($
/kW
h)
Gene
ratio
n (T
Wh)
Coal Generation Gas Generation Nuclear Generation Solar Generation Wind Generation
Coal Cost Trend Gas Cost Trend Nuclear Cost Trend Solar Cost Trend Wind Cost Trend
Coal, Natural Gas, and Nuclear required massive achievements in improving scale to achieve current favorable cost structures
Solar and Wind are experiencing significant improvements in their cost structure with small increases in scale
0
200
400
600
800
1000
1200
1400
1600
1800
2000
2200
Gen
erat
ion
(TW
h)
0.0
0.2
0.4
0.6
0.8
1.0
1.2
1.4
Ret
ail C
ost $
/ kW
h
1935 1940 1945 1950 1955 1960 19651930 1970 1975 1980 1985 1990 1995 20001965 2005 2010
Coal Generation
Coal Cost-trend
Gas Generation
Gas Cost-trend
Nuclear Generation
Nuclear Cost-trend
Solar Generation
Solar Cost-trend
Wind Generation
Wind Cost-trend
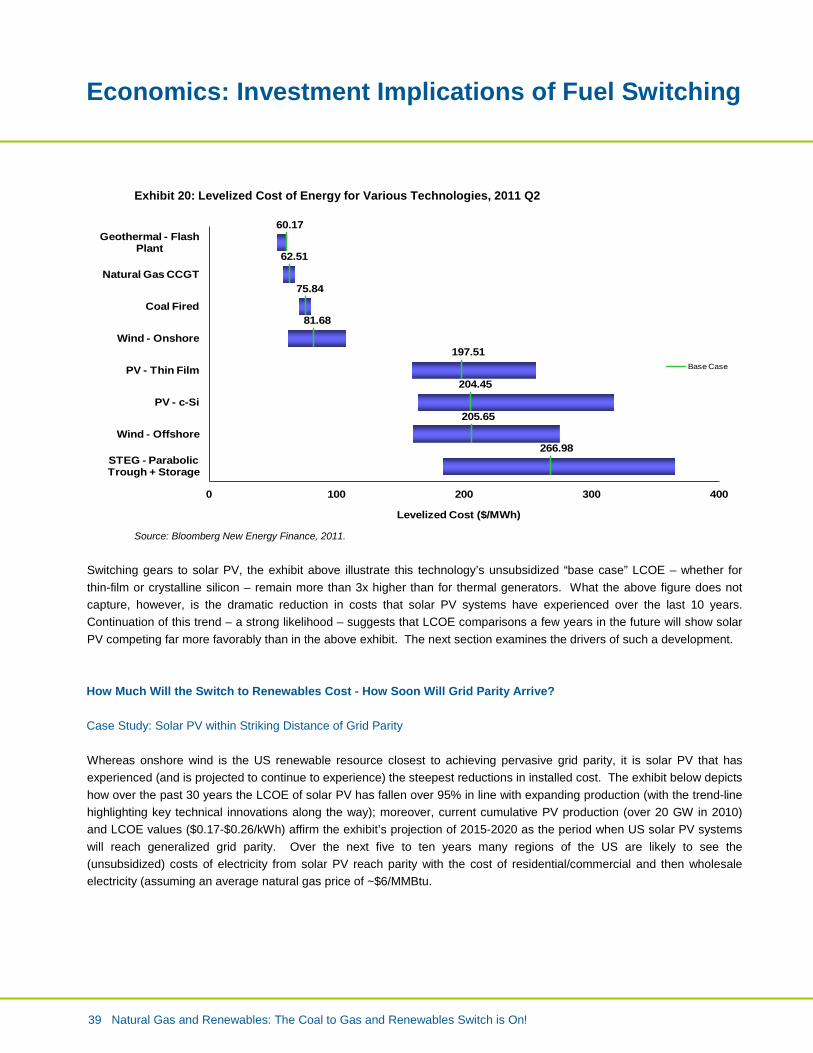
Economics: Investment Implications of Fuel Switching
39 Natural Gas and Renewables: The Coal to Gas and Renewables Switch is On!
Exhibit 20: Levelized Cost of Energy for Various Technologies, 2011 Q2
Source: Bloomberg New Energy Finance, 2011.
Switching gears to solar PV, the exhibit above illustrate this technology’s unsubsidized “base case” LCOE – whether for thin-film or crystalline silicon – remain more than 3x higher than for thermal generators. What the above figure does not capture, however, is the dramatic reduction in costs that solar PV systems have experienced over the last 10 years. Continuation of this trend – a strong likelihood – suggests that LCOE comparisons a few years in the future will show solar PV competing far more favorably than in the above exhibit. The next section examines the drivers of such a development.
How Much Will the Switch to Renewables Cost - How Soon Will Grid Parity Arrive? Case Study: Solar PV within Striking Distance of Grid Parity
Whereas onshore wind is the US renewable resource closest to achieving pervasive grid parity, it is solar PV that has experienced (and is projected to continue to experience) the steepest reductions in installed cost. The exhibit below depicts how over the past 30 years the LCOE of solar PV has fallen over 95% in line with expanding production (with the trend-line highlighting key technical innovations along the way); moreover, current cumulative PV production (over 20 GW in 2010) and LCOE values ($0.17-$0.26/kWh) affirm the exhibit’s projection of 2015-2020 as the period when US solar PV systems will reach generalized grid parity. Over the next five to ten years many regions of the US are likely to see the (unsubsidized) costs of electricity from solar PV reach parity with the cost of residential/commercial and then wholesale electricity (assuming an average natural gas price of ~$6/MMBtu.
81.68
75.84
62.51
60.17
197.51
204.45
205.65
266.98
0 100 200 300 400
STEG - Parabolic Trough + Storage
Wind - Offshore
PV - c-Si
PV - Thin Film
Wind - Onshore
Coal Fired
Natural Gas CCGT
Geothermal - Flash Plant
Levelized Cost ($/MWh)
Base Case

Economics: Investment Implications of Fuel Switching
40 Natural Gas and Renewables: The Coal to Gas and Renewables Switch is On!
Exhibit 21: Solar PV’s LCOE Trend, 1978-2009 (and projections to 2020)
* Assumes annual production grows at 35%; cost projections based on 18% progress ratio. Source: Dr. Emmanuel Sachs, 1366 Technologies, 2009. Based on G.F. Nemet, 2006, “Beyond the learning curve: factors influencing cost reductions in photovoltaics,” Energy Policy 34(17): 3218-3232.
There are many influences driving the reduction in levelized cost for solar PV; chief among them is the decline in cost for manufacturing PV modules (modules accounting for 45-60% of the total installed cost for a PV system). From 1979-2001 the average manufacturing cost of solar PV modules declined from $25.30/W to $3.68/W (and as of Q3 2011 is roughly $1/W); the figure below breaks down the causes behind that decline, with larger plant sizes (i.e. economies of scale in production), increases in solar cell efficiency, and lower Silicon prices accounting for 85% of the decline.
Exhibit 22: Decomposing the fall in Solar PV Manufacturing Costs, 1979-2001 (2002$/W)
*Si refers to Silicon; efficiency refers to solar cell efficiency; yield refers to manufacturing yield (defined as the ratio of the number of usable modules after the completion of production the number of modules at the beginning of production), poly-x-stal refers to polycrystalline silicon (as opposed to monocrystalline silicon). Source: G.F. Nemet, University of Wisconsin-Madison, June 2007, “Learning curves for photovoltaics,” International Energy Agency.
2009

Economics: Investment Implications of Fuel Switching
41 Natural Gas and Renewables: The Coal to Gas and Renewables Switch is On!
Progress on each of the above factors respond to different drivers – market trends, R&D, technology spillovers from other industries, and learning-by-doing among them. Critical to note is the role that expected future demand – by virtue of how it influences a manufacturer’s access to capital, hence its potential scale of plant production – exerts on the cost trend for solar PV production. Scale is important because (1) spreading fixed equipment and overhead costs over a greater quantity of output can reduce total per-unit costs; (2) high volumes are often necessary to justify investment in advanced manufacturing equipment; and (3) larger scale, hence higher volumes, enable more opportunities for learning-by-doing. The tremendous growth in the scale of solar manufacturing over even just the last decade – from around 100 MW of global production capacity in 2000 to over 50,000 MW today – has driven the downward trajectory of solar costs. From the perspective of solar PV manufacturers, coming down the cost curve for solar PV-grid parity is less a matter of surmounting technical obstacles than of investing to expand production capacity in a manner that balances risk with uncertain future payoffs. By increasing the scale at which solar producers can profitably manufacture, policies to make those payoffs more certain (e.g. by stabilizing market demand) can thus contribute strongly to lowering the levelized costs of renewables – a point discussed in more detail below.
Table 7: Drivers of change in cost-reducing factors for solar PV
*Lbd is Learning-by-doing. Source: G.F. Nemet, 2006, “Beyond the learning curve: factors influencing cost reductions in photovoltaics,” Energy Policy 34(17): 3218-3232.
Solar PV: Grid Parity by 2016? The Rationale for Maintaining Incentives in the Near-Term For many regions of the US, within 5-7 years retail grid parity (in the sense of “dynamic grid parity” for an electricity consumer) is likely to arrive for solar PV. The probable drivers of such a development are shrinking margins for solar manufacturers, declining raw material prices, lower processing costs, and rising productivity effects (particularly for balance-of-system and installation work). By 2016 the cost of electricity from solar PV is likely to be equal to or below the cost of grid-based electricity for over half of US residential and commercial electricity consumers (particularly in the Northeast, California, and other regions with power prices above the national average). The table below, adapted from Raymond James, projects a cost framework for how solar PV grid parity will be achieved.
Factor Cost Impact Driver of change in each factorPlant size 43% Expected future demandEfficiency 30% R&D, some lbd for lab-to-market
Silicon cost 12%Scale of solar manufacturing and spillover benefit from IT industry
Wafer size 3% Strong lbdSi use 3% Lbd, but spillover for wire-sawsYield 2% Strong lbdPoly share 2% New processes, lbd possibleOther factors 5% Not examined

Economics: Investment Implications of Fuel Switching
42 Natural Gas and Renewables: The Coal to Gas and Renewables Switch is On!
Table 8: LCOE of Solar PV by Market Sector and Technology, 2011 and 2016
2011 2016 Crystalline CdTe Crystalline CdTe CIGS ($/Watt) Module Cost $1.12 $0.75 $0.63 $0.48 $0.50 Benchmark ASP $1.43 $1.28 $0.73 $0.63 $0.70 Commercial BoS cost $2.10 $2.25 $1.50 $1.60 $1.53 Commercial all-in system cost $3.53 $3.53 $2.23 $2.23 $2.23 Residential BoS cost $3.80 n/a $2.80 n/a $2.83 Residential all-in system cost $5/23 n/a $3.53 n/a $3.53 ($/kWh) Commercial LCOE $0.13-$0.17 $0.08-$0.09 Avg. Commercial power price $0.10 $0.10 Grid parity? No Yes Residential LCOE $0.20 $0.13-
$0.17 $0.13-$0.17
Avg. Residential power price $0.12 n/a $0.13-$0.17
n/a $0.13-$0.17
Grid parity? No Yes Yes
* ASP is Average Selling Price. BoS is Balance of System. CdTe is Cadmium Telluride. CIGS is Copper Indium Gallium Selenide. 2016 projections assume 2-3% annualized increase in the U.S. average residential electricity price. Source: DBCCA analysis and Raymond James, “Solar Roadmap. 2016: How mainstream could PV Economics become Within 5 Years?” Sep 7 2011
The 2016 scenario above depicts solar PV achieving grid parity in the strictest sense – supplying electricity at a cost equivalent to conventional sources without the benefit of any public subsidies. For solar PV and other renewable technologies, however, the likelihood of achieving subsidy-free grid parity will be greatly strengthened by maintaining existing incentives over the next 5-10 years. By firming expectations about future market demand, federal subsidies such as the 1603 investment tax credit (and state subsidies such as the California Solar Initiative rebate program) create incentives for manufacturers or renewable technologies to invest in cost-reducing activities. Providing such incentives is critical for catalyzing the investment in new plant, processes, and technologies needed to lower costs and enable renewable energy systems – in the near-term – to compete with conventional sources of electricity. Such investment is causing the cost of renewable energy sources to follow the same path traversed by conventional energy technologies (i.e. scale-up leading to lower levelized costs) – only at a much faster rate. The key takeaway for policymakers is that cost-parity between renewable and traditional energy technologies – hence a sunset on the need for continued subsidies – is within sight.

Economics: Investment Implications of Fuel Switching
43 Natural Gas and Renewables: The Coal to Gas and Renewables Switch is On!
Exhibit 23: How Government Incentives Lower the Cost of Renewables
Source: DBCCA analysis, 2011, and G.F. Nemet, University of Wisconsin-Madison, June 2007, “Learning curves for photovoltaics,” International Energy Agency.
ExExpectations about future demand for renewable energy
Incentives to invest in scalingproduction capacity and other cost-reducing activities
LCOE cost trends and competitiveness of renewable technologies
By stabilizing market expectations (and perceptions of risk), public incentives can increase the scale of renewable energy manufacturing – hence reduce the cost of renewable energy

Coal Retirements and Gas Displacement Potential
44 Natural Gas and Renewables: The Coal to Gas and Renewables Switch is On!
4. Coal Retirements and Gas Displacement Potential Summary
• Our 2010 research indicated 60 GW of coal retirements by 2020 and 92 GW by 2030. We still believe that as much as
~45% of the current coal fleet will be retired over the next 20 years because of the environmental and economic superiority of natural-gas fired generation.
• Since we published our research in 2010, recent research has supported our 60 GW figure by 2020. Consulting firm ICF International said that it expects as much as 20% of coal capacity to be retired by 2020 with the share of natural gas generation doubling by 202023
• The funding of the Sierra Club by Bloomberg for $50 million over the next four years to fight new plants also shows the difficulty of getting new coal capacity built.
. Our view remains that natural gas and renewables capacity additions and an improvement in the utilization rate of the existing natural gas fleet will make up for the bulk of lost coal generation.
• We have analyzed the potential for natural gas-fired generation to replace unscrubbed coal units in the two regions with most at risk coal generation—MISO and SERC—and believe that ~96% of the lost coal generation could be absorbed by increasing the utilization rate of natural gas plants that are located close to those coal facilities.
• The environmental benefits of switching from coal to gas are substantial. The EPA estimates that the value of the air quality improvements from its forthcoming regulation will total between $59 billion to $140 billion per year. According to the EPA, Americans will get $5-$13 in health benefits for every dollar spent to reduce air pollution.24
Coal Retirement Trends: The Long Term View In our research in 2010, we identified 60 GW of inefficient coal generation and retired this capacity between now and 2020. We then identified a further 92 GW that we expect will be retired between 2020 and 2030. We identify the age and efficiency (Btu/KWh) of the coal units that we retire as expressed by “heat rate” in the Table 9 below. Given the long lead times required to retrofit plants, the bulk of the retire/retrofit decisions on the part of regulated utilities is likely occur in 2H11 and 2012, we believe. Already, YTD in 2011, we have seen significant announcements from the likes of American Electric Power (AEP) and Duke Energy, among others announcing planned coal retirements.25 AEP stated on its 2Q11 earnings call on July 29, 2011 that it is committed to “prematurely shuttering 6,000 MW because of the current activities going on at the EPA.”26 We would note that since we published our report in November 2010 there have been a number of other reports that have tackled the issue out through 2020. One of the more thorough reports, in our view, was published by the Edison Electric Institute (EEI) for its members and concluded that 56 to 72 GW of coal-fired power generation is likely to retire by 2020.27
We believe the findings in this report should carry particular weight for investors because it reflects the non-partisan findings of 31 members who all agreed on the assumptions and conclusions despite their varied generation portfolio profiles. In other words the process was sober and deliberate and was designed to avoid any particular agenda or policy spin on the part of its members. From our perspective, we remain comfortable with our 60 GW retirement forecast by 2020 as shown in Table 9 below.
23 ICF Q211 Integrated Energy Outlook, August 2011 24 http://www.epa.gov/airquality/powerplanttoxics/ 25 On 6/9/11 American Electric Power (AEP) announced that it would shut down 5 coal plants and spend billions of dollars to comply with EPA Regulations. And on 5/30/11 and 7/20/11 Duke Energy announced plans to close three coal plants, again citing the impact of pending EPA regulations. 26 7/29/11 earnings call transcript accessed from Thomson Reuters Streetevents 27 Potential Impacts of Environmental Regulation in the US Generation Fleet, Edison Electric Institute and ICF International, January 2011

Coal Retirements and Gas Displacement Potential
45 Natural Gas and Renewables: The Coal to Gas and Renewables Switch is On!
Table 9: Coal Retirement Forecasts by Capacity (GW)
Future Coal Retirements Total GW Average Unit Age % Reduction vs. 2010
Average Unit Heat Rate
2010-2020 Period (DBCCA) 60 62 18% 16,990
2010-2020 Period (EEI/ICF) 56-101 N/A 17-30% N/A
2020-2030 Period (DBCCA) 92 47 27% 12,654
Source: Ventyx, EEI/ICF, DBCCA analysis 2010 Regional impact of the coal to gas fuel switch: Proximity Analysis of How Gas Can Pick up the Slack from Coal In our research this year, we conducted a modeling exercise, identifying “at risk” coal plants in the two North American Electric Reliability Corporation (NERC) regions that we deemed to be most likely impacted by EPA regulation—namely Reliability First Corporation (RFC) and Southeastern Electric Reliability Council (SERC)—and therefore where we believe the coal to gas fuel switch is likely to be most accentuated. We then mapped existing gas assets that are geospatially in proximity to those “at risk” coal assets. Our investment thesis is that these gas assets should see their asset values increase as coal units are retired. In doing our study we considered the following rules and regulations: Clean Air Transport Rule and National Ambient Air Quality Standards (CATR/NAAQS)—covering SO2, NOx,
particulate matter (PM) and Ozone Maximum Achievable Control Technology (MACT)—covering Hg, acid gasses and toxins Our simple criteria definition of “at risk” coal-powered generator units mapped units that:
1. Had no NOx, SOx or HG controls in place as of yearend 2010 2. Units with NOx controls in place as of yearend 2010 but no Sox controls, and <800 MW in nameplate capacity
(Please see subsequent Policy section for a timeline of when these EPA regulations take effect)
The national totals from this quantitative analysis identified ~35 GW in aggregate representing 312 units at 148 plants. Note, this is a smaller subset of the 60 GW of coal units that we expect to retire by 2020 since it only looks at unscrubbed units rather than the efficiency and age, which are the factors that lead us to believe that 60GW or ~17% of the coal capital stock will be retired by 2020.

Coal Retirements and Gas Displacement Potential
46 Natural Gas and Renewables: The Coal to Gas and Renewables Switch is On!
Exhibit 24: “At risk” coal plants located primarily in the Midwest and Southeast
Source: SNL, NREL and DBCCA analysis 2011 Exhibit 25: Many gas plants not geographically close to “at risk” coal plants
Source: SNL, NREL and DBCCA analysis 2011

Coal Retirements and Gas Displacement Potential
47 Natural Gas and Renewables: The Coal to Gas and Renewables Switch is On!
In evaluating the opportunity set of natural gas plants, we observed the following: There are ~570 natural gas combined cycle plants in the continental U.S., of which data was available for 418 Due to transmission constraints, our analysis only leverages and exposes natural gas assets that are “electrically”
connected to the “at risk” coal plants and the load centers served by the coal plants A proximity analysis was used as a proxy for electrical connectivity. All natural gas combined cycle plants within 25 miles of one or more “at risk” coal plants were identified with a few exclusions.28
The criteria yielding the following results:
Out of 148 (35 GW) “at risk” coal plants identified, 32 (19 GW) plants had at least one proximate (<25 mile) NG-CC plant
Conversely, out of 418 NG-CC plants with data, only 60 (38 GW) were within 25 miles of at least one of the “at risk” coal plants
Table 10: Significant Coal Generation is at Risk – But Nearby Gas Plants Can Pick Up Some of the Slack
Total “At Risk” Coal “At Risk” Coal w/ Proximate NGCC
Proximate NGCC Plants
# of plants
148 32 60
# of GW 35 19 38 2010 Generation (mn MWh)
~306 ~32 ~113
Source: SNL Financial, DBCCA Analysis 2011 After identifying the co-located gas and coal plants we then sought to identify an “upper bound” of how much utilization increase the natural gas plant cohort could feasibly deliver to make up for the coal plants being taken offline due to retirements. To determine this we did the following: 1. Compared the 2010 hourly dispatch of aggregate neighboring NGCC plants to each of the “at risk” coal plants; 2. For each hour, we estimated the potential increase in NGCC utilization based on the unused, or spare, capacity of
the NGCC plants and the utilization rates of the “at risk” coal plants 3. To estimate the potential increase during the annual “peak” we did the same analysis above for just the peak 100
hours of demand during the year. Conclusion from the Study: Electric System Can Absorb the Coal to Gas Switch In 2010, the 32 (19 GW) “at risk” coal plants with at least one proximate NG-CC plant generated a total of ~32 TWh The unused capacity of the 60 (~38 GW) proximate NG-CC plants were sufficiently correlated with the “at risk” coal
profile to fulfill ~31 TWh (96% of the generation from the “at risk” coal plants) In other words, even after considering hourly utilization patterns, the analysis showed that the 60 NG-CC plants can
increase their annual generation by 31 TWh (+27%) to compensate for potential coal retirements If this increase were to occur, the average annual capacity factor of the 60 proximate NG-CC plants would increase
from 33% to 41% During the average peak 100 hours of coal generation, the unused capacity of the proximate NG-CC plants would be
sufficient to meet all of the peaking needs in 2010 The potential increases in generation or capacity factors vary by region as shown in Exhibit x below
28 Exclusions to this rule included: steam turbines and combustion turbines (future analysis may include these for peaking needs); plants <25 MW (data is unavailable)and other exclusions made based on data quality

Coal Retirements and Gas Displacement Potential
48 Natural Gas and Renewables: The Coal to Gas and Renewables Switch is On!
Exhibit 26: Gas plants have ample room to increase capacity factors to cover loss in coal generation
Source: SNL Financial, NREL, DBCCA Analysis 2011 Outlook to 2030 In our long term modeling through 2030, we have built upon the framework analysis discussed above and taken a pragmatic approach to the fuel switch based on our fundamental analysis of the power sector. 8% of the contribution to our 2030 estimated coal to gas fuel switch comes from an improvement in utilization rate of the existing gas assets as illustrated in Table 11 below. While this is about twice the estimate of The Congressional Research report’s 2010 constrained analysis29, we believe it is feasible as it incorporates known pipeline expansions already underway and the need for relatively modest incremental pipeline capacity additions compared to what is currently planned30. Importantly, since we first did this modeling in 2010, the pace of pipeline capacity additions has accelerated. The US natural gas pipeline system may grow ~4,600 miles this year, according to the EIA, which would make it the biggest year-over-year gain since at least 1998. The balance of the contribution comes from new builds of natural gas power plants, of which we now expect 28 GW by 2020 and 81 GW by 2030. According to the American Public Power Association, there are currently 15 GW of natural gas-fired generation under construction, representing ~41% of generation capacity under construction in the US.31
29 Displacing Coal with Generation from Existing Natural Gas-Fired Power Plants, Congressional Research Service, January 2010 30 As of 2010 there were an estimated 40,000 of natural gas pipeline miles under construction according to Quanta Services and Underground Construction Magazine. This incremental pipeline supply should cover the expected ~3 Tcf of annual natural gas demand through 2030 from our fuel switch estimate based on the infrastructure requirements. 31 APPA Report on New Generating Capacity: 2011 Update, p. 4
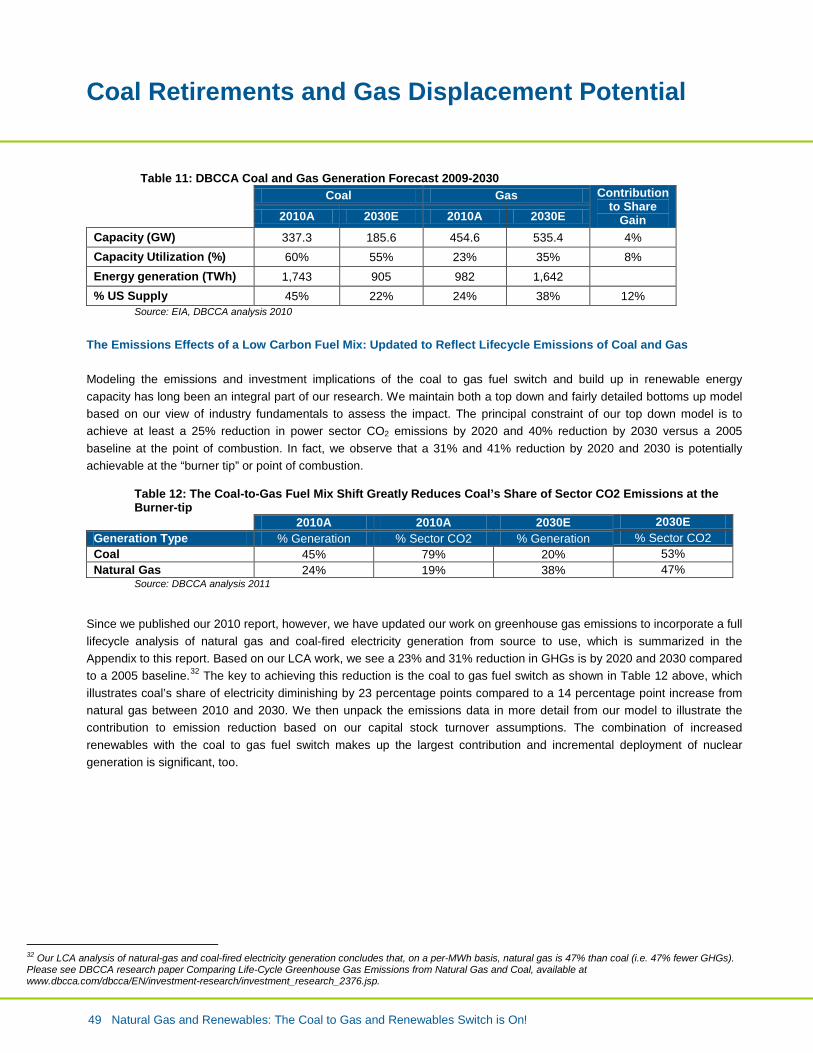
Coal Retirements and Gas Displacement Potential
49 Natural Gas and Renewables: The Coal to Gas and Renewables Switch is On!
Table 11: DBCCA Coal and Gas Generation Forecast 2009-2030 Coal Gas Contribution
to Share Gain 2010A 2030E 2010A 2030E
Capacity (GW) 337.3 185.6 454.6 535.4 4% Capacity Utilization (%) 60% 55% 23% 35% 8% Energy generation (TWh) 1,743 905 982 1,642 % US Supply 45% 22% 24% 38% 12%
Source: EIA, DBCCA analysis 2010
The Emissions Effects of a Low Carbon Fuel Mix: Updated to Reflect Lifecycle Emissions of Coal and Gas Modeling the emissions and investment implications of the coal to gas fuel switch and build up in renewable energy capacity has long been an integral part of our research. We maintain both a top down and fairly detailed bottoms up model based on our view of industry fundamentals to assess the impact. The principal constraint of our top down model is to achieve at least a 25% reduction in power sector CO2 emissions by 2020 and 40% reduction by 2030 versus a 2005 baseline at the point of combustion. In fact, we observe that a 31% and 41% reduction by 2020 and 2030 is potentially achievable at the “burner tip” or point of combustion.
Table 12: The Coal-to-Gas Fuel Mix Shift Greatly Reduces Coal’s Share of Sector CO2 Emissions at the Burner-tip
2010A 2010A 2030E 2030E Generation Type % Generation % Sector CO2 % Generation % Sector CO2 Coal 45% 79% 20% 53% Natural Gas 24% 19% 38% 47%
Source: DBCCA analysis 2011 Since we published our 2010 report, however, we have updated our work on greenhouse gas emissions to incorporate a full lifecycle analysis of natural gas and coal-fired electricity generation from source to use, which is summarized in the Appendix to this report. Based on our LCA work, we see a 23% and 31% reduction in GHGs is by 2020 and 2030 compared to a 2005 baseline.32
The key to achieving this reduction is the coal to gas fuel switch as shown in Table 12 above, which illustrates coal’s share of electricity diminishing by 23 percentage points compared to a 14 percentage point increase from natural gas between 2010 and 2030. We then unpack the emissions data in more detail from our model to illustrate the contribution to emission reduction based on our capital stock turnover assumptions. The combination of increased renewables with the coal to gas fuel switch makes up the largest contribution and incremental deployment of nuclear generation is significant, too.
32 Our LCA analysis of natural-gas and coal-fired electricity generation concludes that, on a per-MWh basis, natural gas is 47% than coal (i.e. 47% fewer GHGs). Please see DBCCA research paper Comparing Life-Cycle Greenhouse Gas Emissions from Natural Gas and Coal, available at www.dbcca.com/dbcca/EN/investment-research/investment_research_2376.jsp.

Coal Retirements and Gas Displacement Potential
50 Natural Gas and Renewables: The Coal to Gas and Renewables Switch is On!
Exhibit 27: Coal-to-Gas Switch Reduces More than Just GHG Emissions (% reduction)
*PM refers to Particulate Matter Source: EIA, DBCCA Analysis 2011
100% 100%
80%
60%
47%
0%
10%
20%
30%
40%
50%
60%
70%
80%
90%
100%
SOx PM NOx CO2 at burner tip
CO2 LCA
Redu
ced
Emiss
ions
per
KW
h,
Switc
h fr
om C
oal t
o Ga
s

Policy
51 Natural Gas and Renewables: The Coal to Gas and Renewables Switch is On!
5. Policy Summary • Policy is important to our power market thesis. For renewables while LCOE costs are higher than fossil fuels today they
are declining rapidly—particularly true for solar PV—this is well understood and we revisit the key drivers. Federal renewable energy policy in the US looks set to remain volatile in the short term given political considerations. And since we last wrote the short term environment and outlook for renewables has if anything become tougher and more difficult. State and local programs, mandates and incentives can still remain supportive, particular in states with binding penalties for noncompliance with renewable portfolio targets.
• For natural gas-fired power generation the key question is the cost comparison to coal. Here, there are two elements of policy in play: 1) regulating health-related general pollutants; and 2) regulating CO2. The key role in 1) is the EPA and this can significantly impact coal costs and we expect to proceed over time, while the key to 2) is either Congressional legislation or EPA regulation—the current driver—and represents a key potential cost that is likely to influence power markets since the investment decision of dealing with general pollutants cannot be made without also factoring in the potential costs for carbon regulation.
• Currently, there has been Congressional pushback to delay the EPA’s implementation of GHG regulation and some coal generators have pushed back publicly at the aggressive timeline of EPA implementation of the HAPs. However, given that the EPA is acting under court order to enforce the Clean Air Act we don’t expect significant delay. As a practical matter, a delay in the EPA enforcing GHG regulation is not that relevant in investment decisions because the unit by unit decisions on coal retirements that power generators are making today incorporate the comprehensive impacts of all known and expected regulation.
• The EPA’s recently announced revisions to the Cross-State Air Pollution Rule (CSAPR) do little to undermine the economic logic of a coal-to-gas switch. The EPA has recently proposed to (1) increase the emission budgets for coal-fired plants in 10 states covered under the CSAPR; and (2) delay the January 1 2012 deadline for CSAPR compliance, deciding that companies will now have until 2H12 or 1H13 to demonstrate compliance. While perhaps modestly prolonging the economic competitiveness of a few coal-fired units, such changes leave intact the economic incentive for utilities to base investment decisions on forthcoming regulations, including for GHGs. The new CSARP regime thus does little to undermine the incentive for utilities to swap coal and coal assets for gas and gas assets.
EPA Regulatory Action: An Important Fuel-Switch Driver, No Way Out for Coal-Generators The state of policy needs to be addressed since it is a key regulatory driver for the electricity sector. The US electricity sector is in the early stages of a profound period of change and capital stock turnover driven by the enforcement of EPA regulation, which is now at a critical inflection point and is the driving factor influencing long-term asset investment decisions. The implementation of the policy will persist for the next 10 years and is at the heart of our core investment thesis. Coal-fired power generation is the dominant source of US electricity supply today, providing about 43% of total electricity as of 2Q11. Coal’s large share is because it has historically been the cheapest source of electricity because the US has massive domestic coal reserves, and the human health and environmental damages associated with coal have been under priced. The fundamentals of coal-fired generation units explains their resilience to both regulation and competitive pressures: although coal plants have high upfront capital costs, their variable generation costs have historically been very low due to cheap and abundant domestic coal supplies. However, the coal fleet is now aging, inefficient relative to alternatives such as natural gas and lacking in control equipment to meet EPA regulations. Finally, the environmental, health and safety aspects of coal generation are relatively high compared to other sources of energy as shown in Table 13 below.

Policy
52 Natural Gas and Renewables: The Coal to Gas and Renewables Switch is On!
Table 13: Energy Use Affects Health, Safety, Security and the Environment
Source: DBCCA analysis, 2011
Failure of Waxman-Markey Cap-and-Trade in 2010 Has Divided Utility Industry In 2010 when there was a possibility of comprehensive national climate change legislation, the utility industry reached a consensus around policy. Over the past six to twelve months, however, as it has become clear that the EPA will be the vehicle for regulating climate change – not a bill passed by Congress – the gloves have come off. Electric generators unsurprisingly are divided in how they are responding to the onset of EPA regulation. There has been ample saber rattling from the coal generators most impacted on the one hand arguing for more time to prepare for the EPA timeline while natural gas and nuclear generators with the most to gain believe that the impact of regulation is manageable. This is because there are major impacts in terms of winners and losers. Coal generators now face a “perfect storm” of federal and state regulatory and legislative action focused on hazardous air pollutants and GHGs from coal-fired power plants, which we expect can reduce coal’s share of electricity to 32% by 2020 and 22% by 2030, as coal-fired generation becomes less economic by our reasoning relative to natural gas-fired generation and renewables ramp up. A series of court decisions that have been in the works for some time and large budget appropriations during the first two years of the Obama administration have given the EPA greater authority and a clear mandate to effectuate long overdue levels of regulatory restrictions on coal power plants under a compressed timeframe. Mercury and acid gases are part of the “hazardous air pollutant” (HAPs) regulations that will likely require what the EPA calls maximum available control technology (MACT) for all coal units. This particular regulation is the focal point of decision making for coal-generators since it cuts across the other regulations, too, and requires a unit by unit assessment. MACT sets required performance standards equal to the best 12% of operating plants. Broadly for mercury this will require about a 90% removal rate, although sub-categorizations could lower this number for some plants and raise it for others. Other upcoming regulations
Fuel Health Concerns Safety Concerns Energy Security Concerns
Environmental Concerns
Oil / Petroleum High High Very High Very High
Coal Very High High Low Very High
Nuclear Medium High Low Medium
Natural Gas Low HighMedium /
MediumLow
Hydro Very Low Medium Very Low Low
Bioenergy Very Low Low Very Low Medium
Geothermal Very Low Low Very Low Low
Wind Low Very Low Very Low Very Low
Solar Very Low Very Low Very Low Low

Policy
53 Natural Gas and Renewables: The Coal to Gas and Renewables Switch is On!
include (1) the Cross-State Air Pollution Rule (CSAPR) - formerly called the Clean Air Interstate Rule (CAIR) - which will limit emissions trading for sulfur dioxide emissions, (2) new rules on coal-combustion residuals such as ash disposal; (3) new rules on cooling water intake structures and (4) new source review permitting. For a more complete definition of the terms referenced in Exhibit 28 below please see the EPA’s Terms of Environment (www.epa.gov/OCEPAterms/).
Exhibit 28: The “Train Wreck” Timeline for Compliance with Forthcoming EPA Regulations
* CAIR (the Clean Air Interstate Rule) is now known as the Cross-State Air Pollution Rule (CSAPR), or Clean Air Transport Rule (CATR). In September 2011, President Obama decided to maintain the current NAAQS standard for ozone. Source: Exelon Corp.
2011 is the key turning point on regulation and it is clear that those generators and suppliers most affected are trying their best to dig in their heels in what looks to be a losing battle. The issue most at stake is timing and an attempt to be given more time to comply, given the complexity of the alphabet soup of EPA regulations and the impact that they will have in the aggregate on long term investment decisions. Coal-fired generators have argued that meeting the 2014 deadline for HAP compliance is infeasible given the long lead times to procure the equipment and technology needed to retrofit coal plants and have been pushing for more time. On this score, the first half of 2011 marked a sharp increase in lobbying activity from coal-dominated utilities to more than 90 congressional offices in an effort to stall the implementation of EPA rules, according to Bloomberg News.33
33 Coal Lobby Spending Jumps 76% Fighting US Air-Pollution rules, Bloomberg News, June 6, 2011 (Jim Snyder and Kim Chipman)
Meanwhile, House subcommittee Chair Representative Ed Whitfield (R-KY) has promised to introduce a bill to delay the Utility MACT with support of large coal utilities such as American Electric Power (AEP). In addition, US Representative John Dingell (D-MI) has proposed extending the comment period from 60 to 120 days (through

Policy
54 Natural Gas and Renewables: The Coal to Gas and Renewables Switch is On!
September 2011) to allow industry to respond to EPA’s proposed CSAPR regulations before final rule making occurs in November 2011. In response to pressure from the Democratic representative, EPA did flex a bit and announced on June 21, 2011 a 30-day extension of the comment period for the proposed Utility MACT standard to allow the industry an extra month to respond. More recently, the EPA has proposed to (1) increase the emission budgets for coal-fired plants in 10 states covered under the CSAPR; and (2) delay the January 1 2012 deadline for CSAPR compliance, deciding that companies will now have until 2H12 or 1H13 to demonstrate compliance. Proposed changes to state emission budgets will affect roughly 2-3% of the 1,000 facilities covered under CSAPR (i.e. 20-30 plants); depending on the pollutant in question (e.g. SOx vs. NOx), the new larger emissions budgets allow 1-4% more emissions nationwide. While perhaps modestly prolonging the economic competitiveness of a few coal-fired units, such changes leave intact the economic incentive for utilities to base investment decisions on forthcoming regulations, including for GHGs. The new CSARP regime thus does little to undermine the incentive for utilities to swap coal and coal assets for gas and gas assets. With respect to the EPA’s extended deadline for CSAPR compliance, we still expect the schedule for implementation of both the Utility MACT and CSAPR rules to largely follow the guidelines under the Clean Air Act (CAA) of three years, plus an additional year if needed. We do believe that if a utility should be unable to comply with EPA deadlines, EPA will allow additional discretion on a case-by-case basis to extend the process for a reasonable time, if extenuating circumstances provide justification. Both the one-year extension and any further discretion are decided at the local and state levels.
Deadlines for MACT and CSAPR compliance are unlikely to be severely pushed back because a delay of the Clean Air Act (CAA) which is governing EPA regulation requires a change in legislation or a declaration from the President that enforcement of regulation would jeopardize the nation’s national security—again not likely. Moreover, the CAA is very clear on statutory deadlines; compliance is required three years from publication of the final rules, although there may be some flexibility for an extra year extension on a case-by-case basis. Therefore, we remain unconvinced that industry and Congress will be able to change the EPA’s mandate during the comment period, seeking tweaks to EPA’s proposed regulation. Comments from industry would need to be very persuasive and heavily supported from data proving the EPA’s assumptions are wrong. Given the relatively short window for comment, we do not see this as an issue. With this fight likely ending, attention has now been turned to questions over job losses and higher electricity prices. The American Coalition for Clean Coal Electricity—an advocacy group supported by coal generators—released analysis on June 8, 2011 based on a study conducted by NERA Economic Consulting that showed that the combination of MACT and CSAPR would result in the closing of 48 GW of coal plants, an increase in electricity costs of ~$18 billion per year and a ~12% increase in average national electricity prices by 2016 with some coal regions seeing an increase of as much as ~24%.34 Building on the release of this report, American Electric Power (AEP) disclosed on June 8, 2011 that its preliminary plans for complying with EPA regulations would entail retiring 6,000 MW of coal-fired generation, upgrading or installing scrubbers on 10,100 MW, repurposing 1,070 of coal-generation to be natural-gas units and building 1,220 MW of new gas-fired generation. AEP stated that it would be able to comply with EPA regulation but cautioned that the result would be the loss of 600 power plant jobs and a “sudden increase in electricity rates and impacts on state economies will be significant at a time when people and states are still struggling.”35
AEP would clearly like to delay the implementation of EPA policy. However, given the momentum, we view this as unlikely.
34 http://www.americaspower.org/news/new-analysis-finds-epas-power-plant-regulations-would-increase-electricity-costs-lose-jobs-1 35 http://www.aep.com/investors/newsreleases/?id=1697

Policy
55 Natural Gas and Renewables: The Coal to Gas and Renewables Switch is On!
The consequences of EPA regulation on jobs and electricity prices are important. However, our research runs contrary to AEP’s assertion. As we showed earlier, we see the potential for existing gas-fired generation to make up for as much as ~96% of the loss in coal-fired generation in the MISO and SERC regions that are most impacted by EPA regulation with very modest incremental infrastructure costs. The jobs issue, however, is more complicated. Because of their complexity, coal units require larger numbers of employees per MW than gas units. Therefore, on a comparable basis new gas units require fewer employees than a coal unit. But this is largely a distributional issue. When adding the net additions to renewables and gas jobs to the losses from shuttered coal facilities, we believe there is more than a one to one offset. Importantly, for the economy in aggregate the job creation benefits from shale gas are likely to eclipse any losses from coal retirements. The number of jobs per trillion cubic feet (TCF) of gas varies from state to state, but we estimate nationally is about 50,000 new jobs for every TCF of gas production. This number is roughly 3x the number of jobs from an equivalent amount of coal production.36
To put this into context, if we see US annual demand for natural gas increase to about 30 TCF over the next 20 years from 24 TCF today, this would equate to approximately 300,000 high paying jobs.
Finally, we would note that we continue to think the market broadly underestimates the potential for significant reductions in electricity consumption due to demand side management and energy efficiency programs and the soup to nuts ramifications of the shale gas revolution, which is likely to put a lid on natural gas prices and therefore power prices37
. When all is said and done the net impact to the consumer and to the economy of coal retirements on electricity prices and jobs is not likely to be as dire as the coal industry would have one believe. Lew Hay, Chairman and CEO of Next Era Energy, a leading natural-gas and renewables power generator has a similar view as illustrated by comments on the company’s first quarter 2011 earnings call.
“I don’t believe that replacing 50-year old fossil plants with new, more efficient units will be the train wreck we have been hearing so much about. Nor do I believe that putting pollution controls on many of the remaining plants is all that terrible. As an aside, it is interesting to note that two-thirds of our nation’s coal fleet is without meaningful pollution controls. While there is no free lunch, the cost of this upgrade to that nation’s generation fleet is likely to be far less than the costliest predictions.”38
36 Cambridge Energy Research Associates (CERA) and IHS Global Insight estimate that in 2008 the natural gas industry contributed $385 billion to the US economy, supporting more than 2.8 million jobs (including 620,000 direct jobs). Please see: The Contributions of the Natural Gas Industry to the US National and State Economies, IHS Global Insight, September 2009, p. 9 37 In our 2010 report, we estimate that the impact on generation cost from the fuel mix shift that we envision to be less than 2% per year through 2030. This is based on an assumption of stable gas prices and an increase in the utilization rate of existing gas assets. Please see: Natural Gas and Renewables: A Secure Low Carbon Future Energy Plan for the US (DBCCA, November 2010), p. 30 38 NextEra Resources, 1Q11 Corporate Earnings Report
Appendix: Environmental Issues with Shale Gas
56 Natural Gas and Renewables: The Coal to Gas and Renewables Switch is On!
Appendix Summary • In this section we assess the environmental risks associated with natural gas production and shale drilling in particular,
which have gained increased attention in 1H11. Production of shale gas raises three major environmental issues: (1) volume of freshwater use (as the average shale play uses anywhere from 2-5 million gallons of water per well); (2) water quality (i.e. contamination of surface aquifers from the chemical contained in “fracking fluid”) and treatment of wastewater; and (3) how shale production affects the life-cycle greenhouse gas emissions of natural gas. Of these, the water quality and GHG issues are generally considered to be the most serious. We touch on the water quality issue, which we think can be managed through better well-casing techniques and other industry best practices, and then tackle the GHG footprint issue in great depth concluding that the GHG footprint of electricity from shale gas is about 47% less than coal.
• Overcoming these challenges is critical to the future evolution of natural gas as a lower carbon power generation resource. The most influential and critical challenge facing regulators and industry is public perception, particularly the process of hydraulic fracturing. The EPA and Obama administration have taken steps to provide more oversight at the national level. However, we believe that states will continue to be the epicenter of drilling regulation because of the politics, property rights and water rights which are very region, state, and even county specific.
• The issues most at play are water use/quality, well design and construction (particularly through the aquifers), air quality, local community impact and GHG emissions, particularly methane. We believe that the industry must tackle these challenges forcefully and head-on. There is clearly room for improvement in terms of environmental best practices on the part of operators, as well as for appropriate strengthening of state and federal regulatory standards. We saw evidence of some improvement in 2010, particularly with respect to water recycling in the Marcellus Shale. But we believe 2011-2013 will be the crucial period for the industry to get its house in order driven by greater public awareness of the issues, top down pressure from the Obama administration and renewed focus on operational excellence and environmental performance from drillers.
• Importantly, we see no technical reasons that will impede shale gas from being extracted safely and responsibly with a minimal environmental footprint. Diffusing industry best practices with respect to well-casing, disclosure of chemicals used in fracking fluid, and wastewater disposal will be critical to ensuring that shale gas production proceeds in a safe and environmentally-friendly way.
• Even with a $4-5/MMBtu natural gas price, there is no reason for the industry to cut corners on environmental performance. Credible estimates suggest that state-of-the art environmental best practices add as little as nothing to at most $0.50/MMBtu to the cost of production.
Environmental Impacts of Shale Gas: Greenhouse Gases and Water
Recent questions about the environmental risks posed by the production of natural gas have focused on two issues that must both be factually and responsibly addressed: 1) the adequacy of current technology and regulation to ensure the safe disposal of waste water produced during the extraction of natural gas, particularly from wells that have been completed using horizontal fracturing in areas lacking Class II deep water injection disposal wells, and 2) the comparison of GHGs emitted during the life-cycles of natural gas and coal.
Greenhouse Gases
In early 2011, the U.S. Environmental Protection Agency (EPA) released documents with upwardly revised greenhouse gas emissions factors from natural gas production, prompting several researchers and journalists to question the greenhouse

Appendix: Environmental Issues with Shale Gas
57 Natural Gas and Renewables: The Coal to Gas and Renewables Switch is On!
gas advantages of natural gas over coal on a life-cycle basis. Consequently, we embarked on a deep dive analysis of the EPA revisions and conducted our own life-cycle GHG comparison between coal and gas. The EPA’s updated emissions estimates from natural gas systems have raised questions surrounding emissions throughout the natural gas life-cycle. Much of the difference in the EPA’s new and old estimates comes from methane emissions in the field production stage of gas extraction. Methane (CH4), the main component of natural gas, has a much shorter atmospheric life than CO2 (~12 years compared to 50-200 years for CO2), but is about 25 times more potent in trapping heat on a 100-year basis.39
The estimates of total methane emitted by US natural gas systems have roughly doubled in the EPA’s new study – a change that we estimate increases life-cycle greenhouse gas emissions from natural gas combined-cycle plants by around 10% using a 100-year time span, the convention most commonly used by EPA and the Intergovernmental Panel on Climate Change (IPCC). These groups are also discussing alternative metrics such as a 20-year global warming potential (GWP), where the IPCC estimates methane’s climate forcing effect to be about 72 times that of CO2.
DB Climate Change Advisors’ lifecycle analysis concludes that the new EPA revisions make gas ~11% less clean (kg CO2e/MWh) in the electricity sector but still 47% cleaner than coal. Further research and analysis is needed on the life-cycle greenhouse gas intensity of both fuels so that clean energy policies are properly calibrated to incentivize investment decisions given the rapidly evolving role of shale gas.
Exhibit 29: Comparing Lifecycle GHG Emissions of Gas and Coal with a 21 GWP for Methane (kg CO2e/MWh)
*Methane here has a Global Warming Potential (GWP) of 21. Source: EPA, ICF International, DB Climate Change Advisors analysis 2011
The analysis is sensitive to the global warming potential (GWP) chosen for methane. Since methane is a much larger component of the gas life-cycle, the GWP chosen has a much larger effect on gas than coal. Going from a GWP of 21 to a GWP of 25 or 33 does not change the comparison greatly, but going to the 20 year GWP of 72 increases life-cycle
39 IPCC: Changes in Atmospheric Constituents and in Radiative Forcing. http://www.ipcc.ch/pdf/assessment-report/ar4/wg1/ar4-wg1-chapter2.pdf, p. 141
0
200
400
600
800
1,000
1,200
Natural Gas 2010 Natural Gas 2011 Coal
kg CO
2e/M
Wh
Methane
Non-Combustion CO2
Upstream Combustion
Fuel Combustion
582
1,103
523
53% less than coal 47% less than coal

Appendix: Environmental Issues with Shale Gas
58 Natural Gas and Renewables: The Coal to Gas and Renewables Switch is On!
emissions for natural gas by 34 percent and for coal by only 7 percent. At the GWP of 72, the gas power plant emissions are 35% lower than coal. One recent report has suggested the use of a new 20 year GWP of 105 developed by Shindell et al. Even at this value, the GHG emissions from the gas-fired plant are 26% below that from the coal plant than coal (see Exhibit 30 below).
Exhibit 30: Comparing Lifecycle GHG Emissions of Gas and Coal with a 100 GWP for Methane (kg CO2e/MWh)
Source: EPA, ICF International, DB Climate Change Advisors Analysis 2011
The conclusion of our top-down LCA of natural gas and coal-based generation using publicly available data shows that the EPA’s recent revision of methane emissions increases the LCA for natural gas by about 11% from estimates based on the earlier values. Our conclusion is that, on average, natural gas-fired power generation emits significantly fewer GHGs compared to coal-fired power generation. Life-cycle emissions for natural gas generation using new EPA estimates are 47 percent lower than for coal-based generation when using a GWP of 25. Nevertheless, methane, despite its shorter lifetime than carbon dioxide, is of concern as a GHG. Compared to coal-fired generation, methane emissions, including a large venting component, comprise a much larger share of natural-gas generation’s GHGs. And while measurement of upstream emissions and public disclosure of those emissions still has room for improvement, methane emissions during the production, processing, transport, storage, and distribution of natural gas
0
200
400
600
800
1,000
1,200
Natural Gas 2010 Natural Gas 2011 Coal
kg C
O2e
/MW
h
Methane
Non-Combustion CO2
Upstream Combustion
Fuel Combustion
582
1,103
523

Appendix: Environmental Issues with Shale Gas
59 Natural Gas and Renewables: The Coal to Gas and Renewables Switch is On!
can be mitigated now at moderately low cost using existing technologies and best practices. Such capture potential presents a commercial and investment opportunity that would further improve the life-cycle GHG footprint of natural gas. Compliance with New EPA Rules Will Improve GHG Performance of Shale Gas Further While the above analysis suggests shale gas to be significantly more climate-friendly than coal in the status quo, compliance with new EPA regulations will likely extend this benefit even further. In April 2011 the EPA proposed new rules intended to curb emissions from oil and gas drilling sites. Transmission pipelines, storage tanks, and other equipment are to be out-fitted with new controls that reduce emission of methane by 25%. Curtailing such “fugitive” methane emissions will help to minimize the biggest GHG risk of shale production and move the life-cycle GHG emission of shale gas closer to those from conventional gas.
Water Issues: Smart Regulation and Best Practices are the Keys to Success Hydraulic fracturing (or “fracking”) is the completion technique used to stimulate deep lateral shale wells. This technique has been used by the oil and gas industry since the 1940s and has become a key enabler of natural gas development programs worldwide. The process is used for deep horizontal lateral well completions and involves forcing fluids consisting of about 99% water and sand, along with a small amount of special-purpose additives. Normally, a hydraulic fracturing operation is only performed once in the life of a well, which then produces gas for 30-70 years, albeit at declining rates of production. On averaging, “frack jobs” occur more than 1.5 miles below the surface and are separated from shallow groundwater formation by thousands of feet of impenetrable rock. In addition, multiple layers of steel casing and cement surround the wellbore creating further layers of protection. The controversy has been around the chemical ingredients used in fracturing, waste water treatment and disposal, and impact on drinking water, since waste water can contain heavy metals. EPA “Hydraulic Fracturing Study” In 2010, the EPA allocated $1.9 million to a “Hydraulic Fracturing Study” that will assess the potential impacts to drinking water resources from fracking of natural gas shales. The EPA’s scoping work for this study identified a range of consequences for drinking water quality that emerge at each step of hydraulic fracturing operations. Having identified the key potential impacts on water quality, the EPA’s science advisers then identified a series of “fundamental research questions” that the EPA study will seek to answer.

Appendix: Environmental Issues with Shale Gas
60 Natural Gas and Renewables: The Coal to Gas and Renewables Switch is On!
Exhibit 31: Water Use in Hydraulic Fracturing Operations
Source: EPA, “Draft Hydraulic Fracturing Study Plan,” February 7 2011, Figure 7
Exhibit 32: EPA’s “Fundamental Research Questions” for the Hydraulic Fracturing Water Lifecycle
Source: EPA, “Draft Hydraulic Fracturing Study Plan,” February 7 2011, Figure 1

Appendix: Environmental Issues with Shale Gas
61 Natural Gas and Renewables: The Coal to Gas and Renewables Switch is On!
The EPA’s study is still in the comment/scoping period; a lead contractor will likely not be appointed until late 2011, with research occurring throughout 2012 and a final report being published sometime in 2014. It is thus too early to speculate as what recommendations the EPA may endorse in the final report. Notable State Laws – Texas, Pennsylvania, and (most likely) New York In discussing health and environmental regulation the US natural gas industry has traditionally indicated a strong preference for state as opposed to federal regulation. Over the long term, however, a federal regulatory solution indeed may be a more sensible approach as it will enforce minimum standards for protection of drinking water resources floor of drinking water protection in the more than 30 states where oil and gas production occurs. This will potentially harmonize regulations governing fracking and wastewater disposal, activities that currently are monitored by often under-staffed and inexperienced state departments of Environmental Protection. Comprehensive federal regulation, however, may not be forthcoming in the near-term. In its absence several states have been stepping forward to implement or propose intelligent regulation of the shale gas industry. Prominent examples of such efforts include:
• Texas’ Mandatory Disclosure Law: On June 20, 2011 Texas Governor Rick Perry signed legislation that requires drillers to disclose the chemicals they use in their fracking fluids. Beginning in January 2012, such disclosures will be posted on a public website (www.fracfocus.org). While Wyoming, Arkansas, and several other states require varying degrees of disclosure, Texas is the first state to codify such requirements in a statute.
• Pennsylvania’s Proposed Reforms: On October 3, 2011, Pennsylvania Governor Tom Corbett proposed legislation to enact several recommendations of the Marcellus Shale Advisory Commission. The core of these recommendations include (1) new standards for unconventional wells, such as increasing well setback distances for wells drilled near streams, rivers, private water wells, or public water systems; (2) stronger bonding requirements for gas operators; (3) heightened authority for the Pennsylvania Department of Environmental Protection to revoke or withhold permits for operators who are violating laws; and (4) and new authority for local communities to levy an “impact fee” (up to a potential total of $160,000 per well) to help defray any costs the community bears as a result of drilling activity. While not yet law, Governor Corbett’s proposals are notable because (1) similar to Texas (which sits atop the Barnett and Haynesville Shales), Pennsylvania (which sits atop some of the thickest portions of the Marcellus Shale) is ground-zero for the “shale gas revolution” in the US; and (2) similar to Texas governor Rick Perry, Governor Corbett is a Republican. Such developments breed optimism that, in the absence of new federal regulation, states will step forward to ensure that America’s shale gas resources are developed in a way that balances economic, energy security, public health and environmental needs.
• New York State: About to Set a New Environmental Standard on Shale Gas? Unlike Texas or Pennsylvania, New York has few regions that qualify as traditional oil-and-gas country. In this sense how New York regulates extraction of its shale gas resources may be a bellwether for other shale-rich states (e.g. Delaware, New Jersey, etc.) decide to proceed on the issue. Under an Executive Memorandum signed by former Gov. David A. Paterson, New York State currently prohibits fracking. Since 2009, however, the state’s Department of Environmental Conservation (DEC) has been studying whether fracking can be done in a manner that adequately protects New York State’s water supply, species habitats, and other ecological resources.

Appendix: Environmental Issues with Shale Gas
62 Natural Gas and Renewables: The Coal to Gas and Renewables Switch is On!
The administration of Governor Andrew Cuomo has now drafted regulation that will authorize DEC to grant fracking permits so long as the practice is not carried out (1) within the Syracuse, Catskill/Delaware, or Croton watersheds (the latter two supply water for New York City’s reservoirs); (2) on primary aquifers (a major source of groundwater in New York State); (3) on certain state-protected lands (e.g. “heritage site” conservation areas); (4) within 2,000 feet of bodies that supply public drinking water; (5) in floodplains; or (6) within 500 feet of a private water well (unless waivered by a landholder. The period for public comment on New York’s draft fracking regulations runs until December 12, 2011. We expect final rules to be approved in 1H12. Once implemented, New York's oversight regime for fracking is likely to be the most rigorous in the nation and set a “gold standard” that other states may choose to adopt. We believe that the oversight regime New York eventually adopts is likely to judiciously balance the goals of economic development, environmental stewardship, and energy security.
Industry Reforms We have seen a large change in industrial process over the course of 2010-2011, particularly in the Marcellus shale, in response to greater regulatory oversight. In particular, producers have moved toward centralized water systems, including recovery of water discharged from coal mines. Recycling is also now running 90-100% in many instances, reducing water truck activity. Large producers such as Range Resources have pioneered water recycling and reuse, including disclosures of fracturing chemicals on a well-by-well basis starting in mid 2010.
As many states lack mandatory disclosure requirements of the kind in Texas or Wyoming, the Ground Water Protection Council and the Interstate Oil and Gas Compact Commission have created a voluntary hydraulic fracturing registry. The registry is state-based and is a system that allows the public to obtain critical information about the hydraulic fracturing process, including information about water usage, water quality and chemical and additive usage. We have seen that there has been much more voluntary disclosure of chemicals on the part of industry, which recognizes that public perception is crucial for the future of natural gas. Information regarding the “ingredients” used in fracking can be found at www.fracfocus.org. We view the registry as a first step in a necessary series of actions to increase the transparency surrounding hydraulic fracturing so that public can be assured that operators are acting in the best interest of the community and the environment as they develop shale plays. The registry provides the public and other interested stakeholders with links to detailed chemical information and risk data. In addition, the registry provides an overview of regulations, including those governing well design, construction, water sourcing, surface chemical handling and produced fluid handling and disposal.
Presidential Leadership On March 30, 2011, President Obama published a Blueprint for a Secure Energy Future, emphasizing an expanded role for natural gas with the caveat that “these resources, when developed with appropriate safeguards to protect public health, will play a critical role in domestic energy production in the coming decades.”40
Clearly environmental issues and public acceptance are a concern. In his energy plan the President called on the Secretary of Energy to establish a subcommittee to examine fracking issues and identify by August 2011 any immediate steps that can be taken to improve safety and environmental performance. In early May, US Energy Secretary Chu tasked the Secretary of Energy Advisory Board (SEAB) to establish a Natural Gas Subcommittee to make recommendations to improve the safety and environmental performance of natural gas hydraulic fracturing from shale formation.
40 Blueprint for a Secure Energy Future, The White House, March 2011, p. 9
Appendix: Environmental Issues with Shale Gas
63 Natural Gas and Renewables: The Coal to Gas and Renewables Switch is On!
In early June 2011, the SEAB held a two day panel meeting in Washington, DC. Senior management from a number of gas companies testified, including Aubrey McClendon from Chesapeake Energy, Steve Mueller from Southwestern Energy and Jim Hackett from Anadarko. The committee also heard testimony from the environmental community and state regulators. These meetings were part of the Subcommittee’s ongoing review of natural gas production – which will culminate in two sets of recommendations to improve the safety and environmental performance of hydraulic fracturing. In an August 2011 interim report the SEAB issued recommendations on immediate steps to improve the safety and environmental performance of hydraulic fracturing. In six months, the Board is set to develop advice for federal and state agencies on how to best protect public health. Therefore, we should see more progress in terms of moving the ball forward on environmental issues over the rest of 2011 and into 2012. We believe the following impact is likely to emerge from the findings and recommendations of the taskforce:
More Rigorous Rules for Drilling on Federal Land While the Advisory Board Task Force’s recommendations will serve as a useful blueprint, companies will not be required to incorporate the recommendation into their current permit applications. However, the recommendations will likely inform the Department of Interior as it considers issuing rules for new permits on federal public lands. We believe that Interior will use these recommendations as they develop new rules and likely take the lead on establishing regulatory frameworks for drilling.
Best-Management Practices (BMPs) The Panel will be examining the ability for these current practices to be improved and applied across-the-board. Emphasis was on well construction, water management, and surface impact, for which industry-created BMPs currently exist from the American Petroleum Institute (API)41
. The committee emphasized that they will use these hearings, as well as other information to look at areas where BMPs could be improved. We would expect that this will be an area of strong emphasis when the Board completes its 90-day review.
Database Disclosure All stakeholders were generally positive on creating a national database where the public could gain information on chemical composition of frack fluid, flow-back water, geological description, well-size, and air emissions. Chairman John Deutch was receptive to the climate-change argument and agreed that all air emissions (not just carbon dioxide) should be measured and considered, especially methane. It would make sense then for disclosure to be an area of strong emphasis when the Board completes its 90-day review. Environmentalists were interested in including lawsuits associated with the wells in the database, but the committee was not as receptive to this idea.
Chemical Measuring Despite the state regulators’ concerns about operator’s property and privacy rights - there was debate over whether states had the jurisdiction to collect chemical compositions - the SEAB committee seemed receptive to gathering that data, even from operations on private land. The committee spoke positively (as did environmentalists and industry) about Wyoming’s required disclosure regulations, and had positive feedback about the website www.fracfocus.com.
Recognition of Regional Differences Industry representatives repeatedly stated that regulations should not be uniform for all states, due to the geological, weather, and other differences in shale locations. Environmentalists emphasized the importance of federal regulations; however, the committee seemed skeptical of their reasoning.
Technology and R&D Improvement
41 Freeing up Energy, American Petroleum Institute, July 2010

Appendix: Environmental Issues with Shale Gas
64 Natural Gas and Renewables: The Coal to Gas and Renewables Switch is On!
The panel will likely continue to focus on technological improvements to limit the impact of the drilling process. For example, the panel heard from both industry and environmentalists on the benefit of multi-well pads from both an efficiency and “limited footprint” perspective. Multi-well pads reduce truck loads and new road construction, which environmentalists were also concerned with. This is part of the efficiency and productivity gains that we discussed earlier in the report.
Bottom line: Three key themes emerged from the interim panel discussion: 1. States best positioned to regulate: State regulators argued they are best positioned to protect their states from
potential environmental consequences of hydraulic fracturing processes. Because each shale play is heterogeneous it is difficult to formulate regulation at the national level. A concern was whether it would be possible for the EPA to create federal regulations that balance state economic and public health and safety interests with the environment.
2. Standards may be preferable to best practices. Industry senior management stated that developing best practices is difficult due to the fast-paced evolution and rapid innovation in the fracking process, which continues to be refined with faster cycle times and enhanced productivity. One of the recommendations from the SEAB may be to recommend that the federal government with the help of environmental advocates, industry and state regulators develop standards for well casing design and testing and air pollution at the federal level, allowing states to keep primacy on most other issues, striking a fair balance.
3. Image problem. A recurring theme in the SEAB meeting was that industry and regulators must do a better job conveying the message that fracking—when undertaken with appropriate safety procedures, proper well casing design, and water management/recycling—can simultaneously provide economic benefits to states and help the environment, by displacing energy sources such as coal that have a greater environmental footprint.

Disclaimer
65 Natural Gas and Renewables: The Coal to Gas and Renewables Switch is On!
DB Climate Change Advisors is the brand name for the institutional climate change investment division of Deutsche Asset Management, the asset management arm of Deutsche Bank AG. In the US, Deutsche Asset Management relates to the asset management activities of Deutsche Bank Trust Company Americas, Deutsche Investment Management Americas Inc. and DWS Trust Company; in Canada, Deutsche Asset Management Canada Limited (Deutsche Asset Management Canada Limited is a wholly owned subsidiary of Deutsche Investment Management Americas Inc); in Germany and Luxembourg: DWS Investment GmbH, DWS Investment S.A., DWS Finanz-Service GmbH, Deutsche Asset Management Investmentgesellschaft mbH, and Deutsche Asset Management International GmbH; in Denmark, Finland, Iceland, Norway and Sweden, Deutsche Asset Management International GmbH ; in Australia, Deutsche Asset Management (Australia) Limited (ABN 63 116 232 154); in Hong Kong, Deutsche Asset Management (Hong Kong) Limited; in Japan, Deutsche Asset Management Limited (Japan); in Singapore, Deutsche Asset Management (Asia) Limited (Company Reg. No. 198701485N) and in the United Kingdom, Deutsche Alternative Asset Management (UK) Limited (formerly known as RREEF Limited), Deutsche Alternative Asset Management (Global) Limited (formerly known as RREEF Global Advisers Limited), and Deutsche Asset Management (UK) Limited; in addition to other regional entities in the Deutsche Bank Group.
This material is intended for informational purposes only and it is not intended that it be relied on to make any investment decision. It does not constitute investment advice or a recommendation or an offer or solicitation and is not the basis for any contract to purchase or sell any security or other instrument, or for Deutsche Bank AG and its affiliates to enter into or arrange any type of transaction as a consequence of any information contained herein. Neither Deutsche Bank AG nor any of its affiliates, gives any warranty as to the accuracy, reliability or completeness of information which is contained in this document. Except insofar as liability under any statute cannot be excluded, no member of the Deutsche Bank Group, the Issuer or any officer, employee or associate of them accepts any liability (whether arising in contract, in tort or negligence or otherwise) for any error or omission in this document or for any resulting loss or damage whether direct, indirect, consequential or otherwise suffered by the recipient of this document or any other person.
The views expressed in this document constitute Deutsche Bank AG or its affiliates’ judgment at the time of issue and are subject to change. This document is only for professional investors. This document was prepared without regard to the specific objectives, financial situation or needs of any particular person who may receive it. The value of shares/units and their derived income may fall as well as rise. Past performance or any prediction or forecast is not indicative of future results. No further distribution is allowed without prior written consent of the Issuer.
The forecasts provided are based upon our opinion of the market as at this date and are subject to change, dependent on future changes in the market. Any prediction, projection or forecast on the economy, stock market, bond market or the economic trends of the markets is not necessarily indicative of the future or likely performance. For Investors in the United Kingdom: Issued in the United Kingdom by Deutsche Asset Management (UK) Limited of One Appold Street, London, EC2A 2UU. Authorised and regulated by the Financial Services Authority. This document is a “non-retail communication” within the meaning of the FSA’s Rules and is directed only at persons satisfying the FSA’s client categorisation criteria for an eligible counterparty or a professional client. This document is not intended for and should not be relied upon by a retail client.
When making an investment decision, potential investors should rely solely on the final documentation relating to the investment or service and not the information contained herein. The investments or services mentioned herein may not be appropriate for all investors and before entering into any transaction you should take steps to ensure that you fully understand the transaction and have made an independent assessment of the appropriateness of the transaction in the light of your own objectives and circumstances, including the possible risks and benefits of entering into such transaction. You should also consider seeking advice from your own advisers in making this assessment. If you decide to enter into a transaction with us you do so in reliance on your own judgment. For Investors in Australia: In Australia, Issued by Deutsche Asset Management (Australia) Limited (ABN 63 116 232 154), holder of an Australian Financial Services License. This information is only available to persons who are professional, sophisticated, or wholesale investors under the Corporations Act. An investment with Deutsche Asset Management is not a deposit with or any other type of liability of Deutsche Bank AG ARBN 064 165 162, Deutsche Asset Management (Australia) Limited or any other member of the Deutsche Bank AG Group. The capital value of and performance of an investment with Deutsche Asset Management is not guaranteed by Deutsche Bank AG, Deutsche Asset Management (Australia) Limited or any other member of the Deutsche Bank Group. Deutsche Asset Management (Australia) Limited is not an Authorised Deposit taking institution under the Banking Act 1959 nor regulated by the Australian Prudential Authority. Investments are subject to investment risk, including possible delays in repayment and loss of income and principal invested. For Investors in Hong Kong: Interests in the funds may not be offered or sold in Hong Kong or other jurisdictions, by means of an advertisement, invitation or any other document, other than to Professional Investors or in circumstances that do not constitute an offering to the public. This document is therefore for the use of Professional Investors only and as such, is not approved under the Securities and Futures Ordinance (SFO) or the Companies Ordinance and shall not be distributed to non-Professional Investors in Hong Kong or to anyone in any other jurisdiction in which such distribution is not authorised. For the purposes of this statement, a Professional investor is defined under the SFO. For Investors in MENA region: This information has been provided to you by Deutsche Bank AG Dubai (DIFC) branch, an Authorised Firm regulated by the Dubai Financial Services Authority. It is solely directed at Market Counterparties or Professional Clients of Deutsche Bank AG Dubai (DIFC) branch, which meets the regulatory criteria as established by the Dubai Financial Services Authority and may not be delivered to or acted upon by any other person. I-024661-1.1