Embed Size (px)
Citation preview

Natural Gas Delivery Plan 4th Quarter 2020 - 2030
MICHIGAN PUBLIC SERVICE COMMISSION Consumers Energy Company
Case No.: U-20650 Exhibit No.: A-36 (CCD-1)
Page: 1 of 112 Witness: CCDegenfelder
Date: December 2019
4th Quarter 2020 - 2030
Natural Gas Delivery Plan
Page 2 of 112
Table of Contents Table of Figures ..........................................................................................................................................................5
List of Tables ...............................................................................................................................................................8
Acronyms ....................................................................................................................................................................9
I. Consumers Energy Natural Gas System ............................................................................................................ 11
A. Overview ..................................................................................................................................................... 11
B. References .................................................................................................................................................. 12
II. Executive Summary ........................................................................................................................................... 13
A. Overview ..................................................................................................................................................... 13
B. Supply ......................................................................................................................................................... 15
C. Compression ............................................................................................................................................... 16
D. Transmission ............................................................................................................................................... 16
E. Distribution ................................................................................................................................................. 17
F. Operational Capabilities ............................................................................................................................. 17
III. Consumers Energy Natural Gas Delivery Plan .................................................................................................. 19
A. Vision Statement ........................................................................................................................................ 19
B. Objectives ................................................................................................................................................... 19
C. Objectives and Goals .................................................................................................................................. 19
D. Alignment with Headline Metrics, Objectives, and 10-Year Outcomes ..................................................... 23
E. “Future Back” Scenario Modeling .............................................................................................................. 24
F. Asset Focus and Changes in the Plan ......................................................................................................... 26
IV. Pipeline Supply .................................................................................................................................................. 28
A. Overview of Pipeline Gas Commodity Cost Trends .................................................................................... 28
B. Implications for Our System and Pipeline Supply vs. Total Customer Cost Trade-Off ............................... 29
C. Ongoing Refinement of Pipeline Supply ..................................................................................................... 30
D. References .................................................................................................................................................. 31
V. Storage Asset Plan ............................................................................................................................................ 32
A. Storage Asset Description .......................................................................................................................... 32
B. Storage Asset Management ....................................................................................................................... 33
C. Storage Well Integrity Program .................................................................................................................. 38
1. Well Inspections ......................................................................................................................................... 38
MICHIGAN PUBLIC SERVICE COMMISSION Consumers Energy Company
Case No.: U-20650 Exhibit No.: A-36 (CCD-1)
Page: 2 of 112 Witness: CCDegenfelder
Date: December 2019

4th Quarter 2020 - 2030
Natural Gas Delivery Plan
Page 3 of 112
2. Well Rehabilitation ..................................................................................................................................... 39
3. New Well Drilling ........................................................................................................................................ 39
4. Well Plugging .............................................................................................................................................. 39
D. Storage Asset Plan ...................................................................................................................................... 40
E. Storage Asset Financials ............................................................................................................................. 41
VI. Compression Asset Plan .................................................................................................................................... 42
A. Compression Asset Description .................................................................................................................. 42
B. Compression Asset Management............................................................................................................... 46
C. Compression Asset Plan ............................................................................................................................. 53
D. Compression Asset Financials .................................................................................................................... 58
VII. Transmission Asset Plan .................................................................................................................................... 59
A. Transmission Asset Description .................................................................................................................. 59
B. Transmission Asset Management .............................................................................................................. 61
C. Transmission Asset Plan and Financials ..................................................................................................... 68
D. References .................................................................................................................................................. 68
VIII. Distribution Asset Plan ...................................................................................................................................... 70
A. Distribution Asset Description .................................................................................................................... 70
B. Distribution Asset Management ................................................................................................................ 73
1. Overview of Our Current Main and Service Remediation Program (i.e., EIRP) .......................................... 73
2. Overview of Distribution Services and Vintage Service Replacement Program ........................................ 75
3. Acceleration of vintage material remediation ........................................................................................... 78
4. Additional benefits to customers ............................................................................................................... 78
5. Acceleration approach ............................................................................................................................... 78
6. Introduction to and recommendation for regulator stations, odorizers and stands ................................. 82
7. Leak Remediation ....................................................................................................................................... 84
C. Distribution Asset Financials ...................................................................................................................... 87
D. References .................................................................................................................................................. 88
IX. Gas Safety Enhancements ................................................................................................................................. 89
A. Gas Safety Management System ................................................................................................................ 89
B. Gas Technical Information Excellence ........................................................................................................ 91
X. Lost and Unaccounted for Gas .......................................................................................................................... 92
A. Overview of Lost and Unaccounted for Gas ............................................................................................... 92
MICHIGAN PUBLIC SERVICE COMMISSION Consumers Energy Company
Case No.: U-20650 Exhibit No.: A-36 (CCD-1)
Page: 3 of 112 Witness: CCDegenfelder
Date: December 2019
4th Quarter 2020 - 2030
Natural Gas Delivery Plan
Page 4 of 112
B. Gas Measurement Software ....................................................................................................................... 95
C. Factors Contributing to Gas Loss ................................................................................................................ 96
D. Cycle (Portion) Billing Impacts on Distribution and System LAUF .............................................................. 97
E. Outline for LAUF Monitoring and Control Improvements ......................................................................... 97
XI. Gas Demand Response ..................................................................................................................................... 99
XII. Operational Capabilities .................................................................................................................................. 100
A. People – Talent and Workforce Approach ............................................................................................... 100
B. Process – Operational Excellence ............................................................................................................. 101
C. Technology – Digital Approach ................................................................................................................. 103
XIV. Financial Summary .......................................................................................................................................... 108
A. Benefits of the Integrated System Plan .................................................................................................... 108
B. Financial profile ........................................................................................................................................ 108
XV. Closing ............................................................................................................................................................. 112
MICHIGAN PUBLIC SERVICE COMMISSION Consumers Energy Company
Case No.: U-20650 Exhibit No.: A-36 (CCD-1)
Page: 4 of 112 Witness: CCDegenfelder
Date: December 2019

4th Quarter 2020 - 2030
Natural Gas Delivery Plan
Page 5 of 112
Table of Figures Figure 1: Typical Natural Gas System Layout
Figure 2A: Distribution Mileage by Material
Figure 2B: Distribution Mileage by Pressure
Figure 2C: Distribution Mileage by Installation Year
Figure 3: Average Residential Customer Bill History and Forecast
Figure 4: Net-Zero and Methane (CH4) Emissions Goal
Figure 5: Natural Gas Delivery Plan Objectives, Headline Metrics, Goals and 10-year Outcomes
Figure 6: Approach to “Future Back” Scenario Modeling
Figure 7: Extreme Modeling Range
Figure 8: Scenario Modeling
Figure 9: Historical Winter (withdrawal season) Average Daily Henry Hub Prices
Figure 10: Monthly GCR Billing Factor Price for Consumers Energy and Others
Figure 11: Interstate pipeline subscription and availability as of September 2019
Figure 12: Map of Michigan with Storage Feld and Compressor Station Locations
Figure13: Maximum Delivery Rates by Number of Facility Wells (i.e., wells for injection and withdrawal) by Storage Field
Figure 14: Daily Storage Field Injections and Withdrawals by Field from Jan. 2013-Sep. 2019 (mmcF)
Figure 15: Gas Supply by Storage Field During Winter (example from polar vortex of 2013-2014)
Figure 16: Storage Gas Supply on Highest Storage Usage and Polar Vortex Peak Day (2013-2014)
Figure 17: Breakdown of Storage Wells by Logging History (current vs. outdated or missing)
Figure 18: Storage Well Integrity Program Overview
Figure 19: Storage Capital Investment Plan
Figure 20: Map of Compressor Stations
Figure 21: Summary of Installed hp
Figure 22: Installed hp per Bcf of Gas Delivered
Figure 23: 2018 Average Utilization by Compressor Unit
Figure 24: 2019 Average Utilization by Compressor Stations
Figure 25: 2019 Monthly Compression Demand Schedule
Figure 26: 2019 Demand Schedule vs. Installed hp at Sample Storage & Transmission Compressor Station
Figure 27: 2019 Demand Schedule vs. Installed hp
Figure 28: Five-Year System Average ROR
Figure 29: Compression Fleet Optimization (2014 – 2025)
MICHIGAN PUBLIC SERVICE COMMISSION Consumers Energy Company
Case No.: U-20650 Exhibit No.: A-36 (CCD-1)
Page: 5 of 112 Witness: CCDegenfelder
Date: December 2019
4th Quarter 2020 - 2030
Natural Gas Delivery Plan
Page 6 of 112
Figure 30: Maximum Daily Flow and Cyclic Capacities for Storage Fields Supported by Muskegon River (i.e., at Marion)
Figure 31: Compression Capital Investment Plan
Figure 32: Map of Transmission System
Figure 33: Transmission Pipeline by Decade of Installation
Figure 34: Transmission Pipeline Age Relative to Peer
Figure 35: Map of Transmission System
Figure 36: Age Distribution of City Gates
Figure 37: Spend per City Gate
Figure 38: Remote-Control Valves as at October 2018
Figure 39: Current RCV Installation Rate
Figure 40: Contrast of Potential Risk Model Upgrades
Figure 41: Transmission Capital Investment Plan
Figure 42: Distribution Main by Materials and Installation Date
Figure 43: Map of vintage Distribution materials
Figure 44: Remediation Plan for Cast Iron Compared to Industry
Figure 45: Remediation Plan for Bare Steel Compared to Industry
Figure 46: New Remediation Plan for Vintage Materials
Figure 47: Map of Copper and Bare Steel Services
Figure 48: Previous Remediation Plan for Copper Services Compared to the Industry
Figure 49: New Remediation Plan for Copper Services
Figure 50: EIRP Workforce Balance
Figure 51: EIRP Workforce Hours by Program
Figure 52: Distribution Main Risk per Grid
Figure 53: Distribution of Regulator Stations
Figure 54: Distribution of Regulator Stands
Figure 55 Below Grade Leak Classification (Distribution)
Figure 56: Distribution Capital Investment Plan
Figure 57: GSMS Implementation Timeline
Figure 58: LAUF Tracking Calculations
MICHIGAN PUBLIC SERVICE COMMISSION Consumers Energy Company
Case No.: U-20650 Exhibit No.: A-36 (CCD-1)
Page: 6 of 112 Witness: CCDegenfelder
Date: December 2019
4th Quarter 2020 - 2030
Natural Gas Delivery Plan
Page 7 of 112
Figure 59: Transmission LAUF 2015 – 2019
Figure 60: Distribution LAUF 2014 – 2018
Figure 61: System LAUF 2014 – 2019
Figure 62: Illustrative View of a Grid-based Model
Figure 63: Maintenance Practices Pyramid
Figure 64: Digital (IT) Capital Investment Plan
Figure 65: Digital (IT) Actual / Projected O&M vs. 5-Year Average
Figure 66: 2018 – 2030 Capital Plan
Figure 67: 2020 – 2030 O&M Plan
Figure 68: Average Residential Customer Bill History and Forecast
MICHIGAN PUBLIC SERVICE COMMISSION Consumers Energy Company
Case No.: U-20650 Exhibit No.: A-36 (CCD-1)
Page: 7 of 112 Witness: CCDegenfelder
Date: December 2019
4th Quarter 2020 - 2030
Natural Gas Delivery Plan
Page 8 of 112
List of Tables Table 1: Asset Focus and Strategic Changes in Plan
Table 2: Storage Field Types, Names, and Working Gas Volumes
Table 3: Overview of Three Types of Compressor Stations
Table 4: Summary of Compressor Units
Table 5: Miles Remediated Under EIRP
Table 6: Sources to Planning Enablers
Table 7: Leak classification at Consumers Energy
Table 8: Above Grade Leak Classification (Distribution)
MICHIGAN PUBLIC SERVICE COMMISSION Consumers Energy Company
Case No.: U-20650 Exhibit No.: A-36 (CCD-1)
Page: 8 of 112 Witness: CCDegenfelder
Date: December 2019
4th Quarter 2020 - 2030
Natural Gas Delivery Plan
Page 9 of 112
Acronyms
AGA – American Gas Association
AMI – Advanced Metering Infrastructure
AMR – Automated Meter Reading
API – American Petroleum Institute
ARMA – Association of Records Managers and Administrators
Bcf – Billion Cubic Feet
BYOD – Bring Your Own Device
C&I – Commercial & Industrial
CAGR – Compounded Annual Growth Rate
CARE Program - Consumers Affordable Resource for Energy
CM – Current Month
DGR – Daily Gas Report
DIMP – Distribution Integrity Management Program
DR – Demand Response
EIRP – Enhanced Infrastructure Replacement Program
ETR – Estimated Time to Restoration
FT – Firm Transport
GCC – Gas Customer Choice
GCR – Gas Cost Recovery
GIS – Geospatial Information System
GSMS – Gas Safety Management System
GTIE – Gas Technical Information Excellence
HCA – High Consequence Area
HP – High Pressure
hp – Horsepower
HVAC – Heating, Ventilation, Air Conditioning
IAAS – Infrastructure as a Service
LAUF – Lost And Unaccounted For (gas)
LDCs – Local Distribution Companies
LFERW – Low Frequency Electric Resistance Welded
MCA – Moderate Consequence Area
MICHIGAN PUBLIC SERVICE COMMISSION Consumers Energy Company
Case No.: U-20650 Exhibit No.: A-36 (CCD-1)
Page: 9 of 112 Witness: CCDegenfelder
Date: December 2019
4th Quarter 2020 - 2030
Natural Gas Delivery Plan
Page 10 of 112
MMbtu – Million British Thermal Units
MMCFD – Million Cubic Feet per Day
MP – Medium Pressure
MPSC – Michigan Public Service Commission
NACE – National Association of Corrosion Engineers
NERC – North American Electric Reliability Corporation
O&M – Operations and Maintenance
PAAS – Platform as a Service
PHMSA – Pipeline and Hazardous Materials Safety Administration
PIPES – Pipeline Integrity Protection, Enforcement, Safety Act
PM – Prior Month
PPA – Prior Period Adjustment
psi – Pounds Per Square Inch
psig – Pounds Per Square Inch Gauge
psia - Pounds Per Square Inch Absolute
RCV – Remote-Control Valve
RORs – Random Outage Rates
RNG – Renewable Natural Gas
RTU – Remote Terminal Units
SaaS – Software as a Service
SEA – Statewide Energy Assessment
SCADA – Supervisory Control and Data Acquisition
SCC – Stress Corrosion Cracking
SOX – Sarbanes Oxley Act
SP – Standard Pressure
SQCDM – Safety, Quality, Cost, Delivery, Morale
TCF – Trillion Cubic Feet
TED-I – Transmission Enhancements For Deliverability & Integrity
TOD – Transmission Operated By Distribution
TP – Transmission Pressure
USM – Ultrasonic meters
VSR – Vintage Service Replacement
WC – Inches of Water Column
MICHIGAN PUBLIC SERVICE COMMISSION Consumers Energy Company
Case No.: U-20650 Exhibit No.: A-36 (CCD-1)
Page: 10 of 112 Witness: CCDegenfelder
Date: December 2019
4th Quarter 2020 - 2030
Natural Gas Delivery Plan
Page 11 of 112
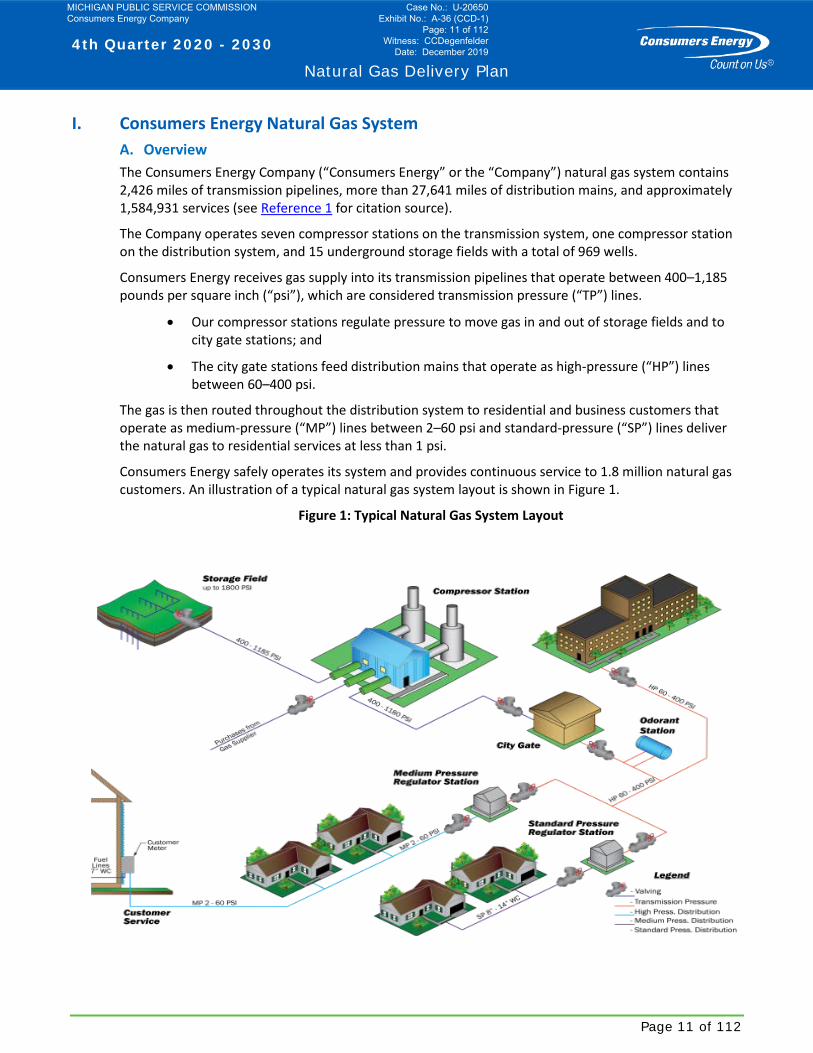
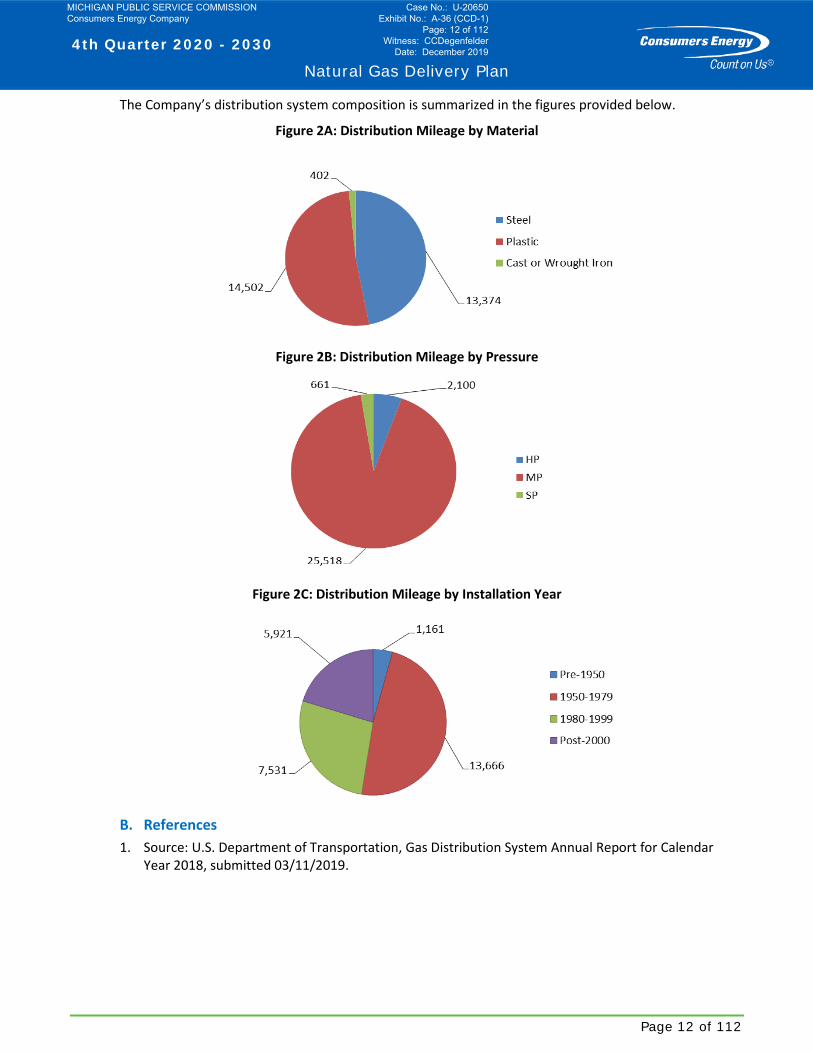
I. Consumers Energy Natural Gas System A. Overview The Consumers Energy Company (“Consumers Energy” or the “Company”) natural gas system contains 2,426 miles of transmission pipelines, more than 27,641 miles of distribution mains, and approximately 1,584,931 services (see Reference 1 for citation source).
The Company operates seven compressor stations on the transmission system, one compressor station on the distribution system, and 15 underground storage fields with a total of 969 wells.
Consumers Energy receives gas supply into its transmission pipelines that operate between 400–1,185 pounds per square inch (“psi”), which are considered transmission pressure (“TP”) lines.
• Our compressor stations regulate pressure to move gas in and out of storage fields and to city gate stations; and
• The city gate stations feed distribution mains that operate as high-pressure (“HP”) lines between 60–400 psi.
The gas is then routed throughout the distribution system to residential and business customers that operate as medium-pressure (“MP”) lines between 2–60 psi and standard-pressure (“SP”) lines deliver the natural gas to residential services at less than 1 psi.
Consumers Energy safely operates its system and provides continuous service to 1.8 million natural gas customers. An illustration of a typical natural gas system layout is shown in Figure 1.
Figure 1: Typical Natural Gas System Layout
MICHIGAN PUBLIC SERVICE COMMISSION Consumers Energy Company
Case No.: U-20650 Exhibit No.: A-36 (CCD-1)
Page: 11 of 112 Witness: CCDegenfelder
Date: December 2019
4th Quarter 2020 - 2030
Natural Gas Delivery Plan
Page 12 of 112
The Company’s distribution system composition is summarized in the figures provided below.
Figure 2A: Distribution Mileage by Material
Figure 2B: Distribution Mileage by Pressure
Figure 2C: Distribution Mileage by Installation Year
B. References 1. Source: U.S. Department of Transportation, Gas Distribution System Annual Report for Calendar
Year 2018, submitted 03/11/2019.
MICHIGAN PUBLIC SERVICE COMMISSION Consumers Energy Company
Case No.: U-20650 Exhibit No.: A-36 (CCD-1)
Page: 12 of 112 Witness: CCDegenfelder
Date: December 2019
4th Quarter 2020 - 2030
Natural Gas Delivery Plan
Page 13 of 112
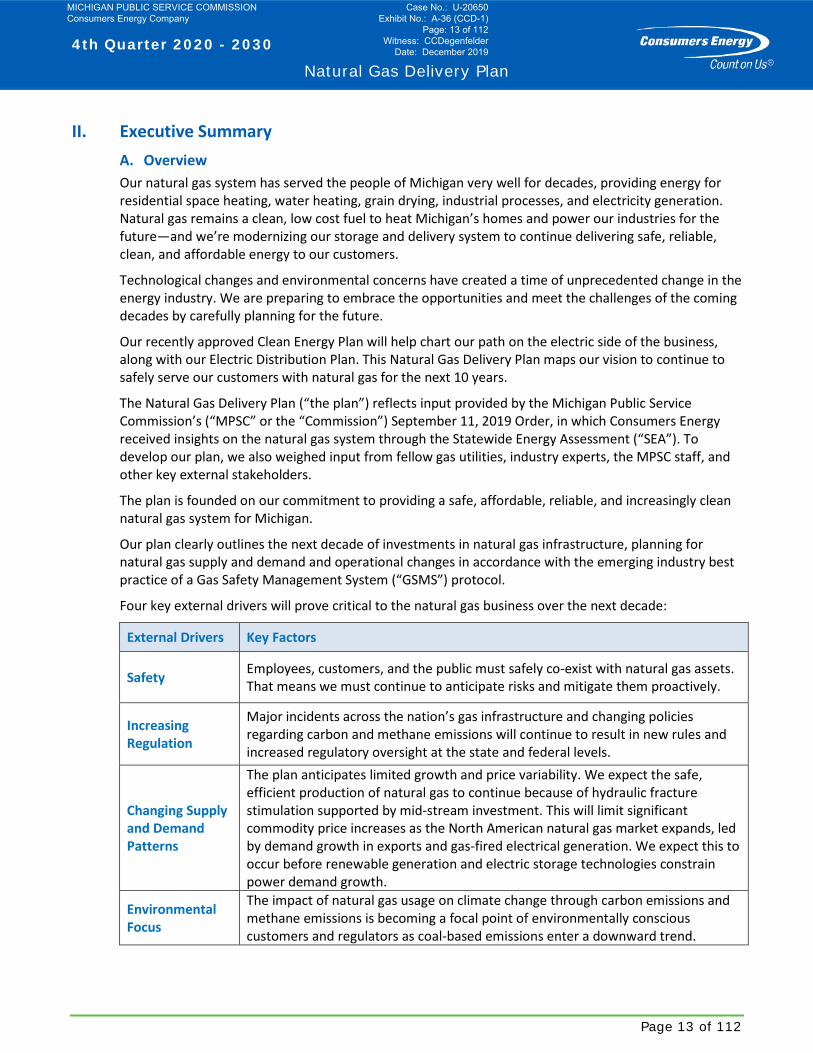
II. Executive Summary A. Overview Our natural gas system has served the people of Michigan very well for decades, providing energy for residential space heating, water heating, grain drying, industrial processes, and electricity generation. Natural gas remains a clean, low cost fuel to heat Michigan’s homes and power our industries for the future—and we’re modernizing our storage and delivery system to continue delivering safe, reliable, clean, and affordable energy to our customers.
Technological changes and environmental concerns have created a time of unprecedented change in the energy industry. We are preparing to embrace the opportunities and meet the challenges of the coming decades by carefully planning for the future.
Our recently approved Clean Energy Plan will help chart our path on the electric side of the business, along with our Electric Distribution Plan. This Natural Gas Delivery Plan maps our vision to continue to safely serve our customers with natural gas for the next 10 years.
The Natural Gas Delivery Plan (“the plan”) reflects input provided by the Michigan Public Service Commission’s (“MPSC” or the “Commission”) September 11, 2019 Order, in which Consumers Energy received insights on the natural gas system through the Statewide Energy Assessment (“SEA”). To develop our plan, we also weighed input from fellow gas utilities, industry experts, the MPSC staff, and other key external stakeholders.
The plan is founded on our commitment to providing a safe, affordable, reliable, and increasingly clean natural gas system for Michigan.
Our plan clearly outlines the next decade of investments in natural gas infrastructure, planning for natural gas supply and demand and operational changes in accordance with the emerging industry best practice of a Gas Safety Management System (“GSMS”) protocol.
Four key external drivers will prove critical to the natural gas business over the next decade:
External Drivers Key Factors
Safety Employees, customers, and the public must safely co-exist with natural gas assets. That means we must continue to anticipate risks and mitigate them proactively.
Increasing Regulation
Major incidents across the nation’s gas infrastructure and changing policies regarding carbon and methane emissions will continue to result in new rules and increased regulatory oversight at the state and federal levels.
Changing Supply and Demand Patterns
The plan anticipates limited growth and price variability. We expect the safe, efficient production of natural gas to continue because of hydraulic fracture stimulation supported by mid-stream investment. This will limit significant commodity price increases as the North American natural gas market expands, led by demand growth in exports and gas-fired electrical generation. We expect this to occur before renewable generation and electric storage technologies constrain power demand growth.
Environmental Focus
The impact of natural gas usage on climate change through carbon emissions and methane emissions is becoming a focal point of environmentally conscious customers and regulators as coal-based emissions enter a downward trend.
MICHIGAN PUBLIC SERVICE COMMISSION Consumers Energy Company
Case No.: U-20650 Exhibit No.: A-36 (CCD-1)
Page: 13 of 112 Witness: CCDegenfelder
Date: December 2019
4th Quarter 2020 - 2030
Natural Gas Delivery Plan
Page 14 of 112
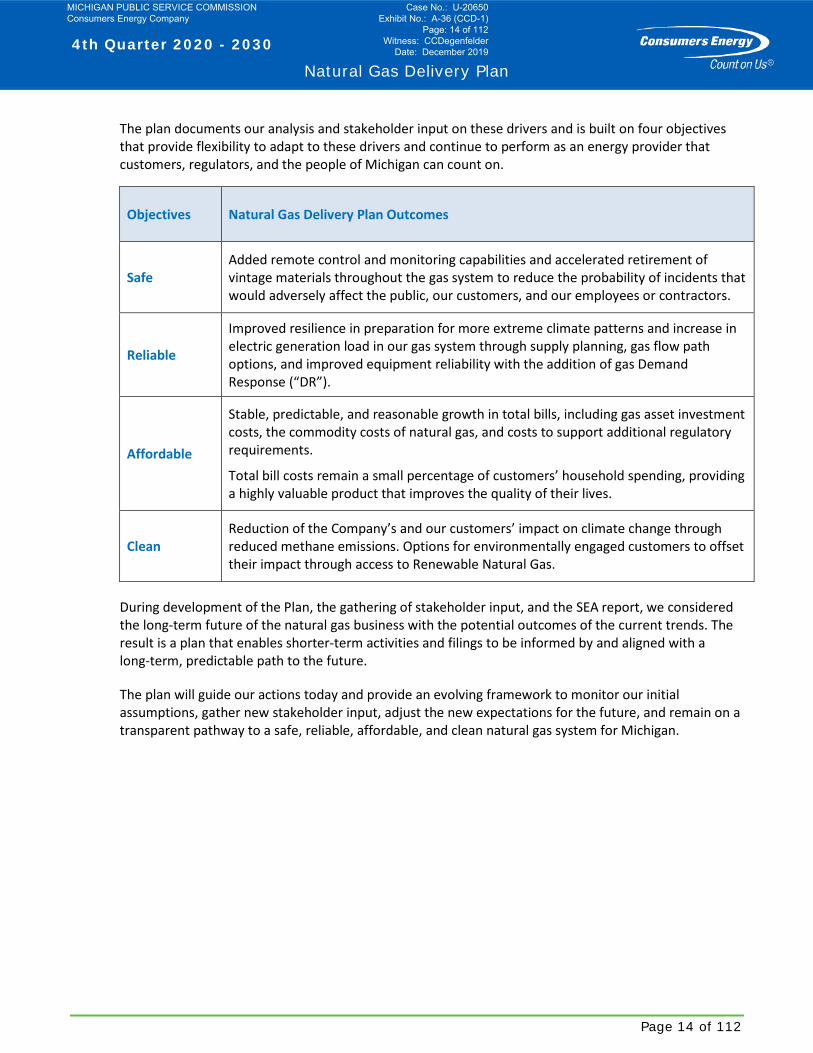
The plan documents our analysis and stakeholder input on these drivers and is built on four objectives that provide flexibility to adapt to these drivers and continue to perform as an energy provider that customers, regulators, and the people of Michigan can count on.
Objectives Natural Gas Delivery Plan Outcomes
Safe Added remote control and monitoring capabilities and accelerated retirement of vintage materials throughout the gas system to reduce the probability of incidents that would adversely affect the public, our customers, and our employees or contractors.
Reliable
Improved resilience in preparation for more extreme climate patterns and increase in electric generation load in our gas system through supply planning, gas flow path options, and improved equipment reliability with the addition of gas Demand Response (“DR”).
Affordable
Stable, predictable, and reasonable growth in total bills, including gas asset investment costs, the commodity costs of natural gas, and costs to support additional regulatory requirements.
Total bill costs remain a small percentage of customers’ household spending, providing a highly valuable product that improves the quality of their lives.
Clean Reduction of the Company’s and our customers’ impact on climate change through reduced methane emissions. Options for environmentally engaged customers to offset their impact through access to Renewable Natural Gas.
During development of the Plan, the gathering of stakeholder input, and the SEA report, we considered the long-term future of the natural gas business with the potential outcomes of the current trends. The result is a plan that enables shorter-term activities and filings to be informed by and aligned with a long-term, predictable path to the future.
The plan will guide our actions today and provide an evolving framework to monitor our initial assumptions, gather new stakeholder input, adjust the new expectations for the future, and remain on a transparent pathway to a safe, reliable, affordable, and clean natural gas system for Michigan.
MICHIGAN PUBLIC SERVICE COMMISSION Consumers Energy Company
Case No.: U-20650 Exhibit No.: A-36 (CCD-1)
Page: 14 of 112 Witness: CCDegenfelder
Date: December 2019

4th Quarter 2020 - 2030
Natural Gas Delivery Plan
Page 15 of 112
B. Supply
1. Pipeline
Consumers Energy’s system accesses seven interstate pipelines and a major intrastate pipeline. This interconnectivity provides diverse access to supply from Appalachia, the Rockies, Canada, the Gulf Coast, and Mid-Continent production basins.
Pipeline deliveries must conform to the fixed pipeline scheduling procedures and are not instantaneous, barring expensive tariff options mimicking the on-demand availability of owned storage assets. Pipeline supply encompasses both supply purchased directly at our system interconnects, i.e., city gate supply, and gas purchased at receipt points upstream of our system. Firm Transport (“FT”) contracts reserving capacity on a pipeline can be both short- or long-term agreements representing an incremental fixed cost to the user and are used to access specific sources of natural gas supply, including third-party storage; and
Interstate pipeline supply into Consumers Energy’s system generally ranges from 600 million cubic feet per day (“MMCFD”) to 1,400 MMCFD. Overall, pipeline supply is required to fill storage in the summer while meeting customer demand. A mix of pipeline supply and storage withdrawal will continue to be used during the winter season.
2. Storage
The gas storage system today includes 15 storage fields made up of 969 wells, totaling more than 149 billion cubic feet (“Bcf”) of gas storage capacity.
Storage assets continue playing an important role in customer affordability. The stored gas is within the state, readily available, and provides price stability in times of high demand. On average, storage has supplied approximately 50% of customer gas deliveries during winter (November through March) and can be available up to approximately 80% on peak days if needed.
In developing the plan, an analysis was completed for the storage assets to compare the role each storage field plays in our annual operating plan.
• The plan calls for continuing a 10-year execution of well inspection, well maintenance, and new well drilling in our priority storage fields;
• This work will increase efficiency and resiliency while lowering risk and cost; and
• Fields with high-cost, high-risk, and low deliverability will be targeted for retirement and decommissioning.
MICHIGAN PUBLIC SERVICE COMMISSION Consumers Energy Company
Case No.: U-20650 Exhibit No.: A-36 (CCD-1)
Page: 15 of 112 Witness: CCDegenfelder
Date: December 2019
4th Quarter 2020 - 2030
Natural Gas Delivery Plan
Page 16 of 112
C. Compression
Our fleet of compression assets are grouped into eight stations: five storage—with two of those stations also acting as transmission stations—two strictly transmission and one distribution compressor station.
• In aggregate, these stations contain 49 compressor units capable of producing more than 163,000 horsepower (“hp”); and
• Gas compression equipment is used to inject and withdraw gas through storage fields, maintain transmission pressures from interstate pipelines, and to boost transmission and distribution gas pressures seasonally.
Over the last decade, we have made significant progress in transforming our compression fleet from 1950s technology to modern, efficient, and clean running equipment. In recent history, some of our older compression fleet has not been reliable and starting up the newly installed equipment has required rapid learning for us and our equipment suppliers. Therefore, we are planning to do the following:
• Improve reliability and resiliency of our compression fleet is a key priority in the plan;
• Adopt and implement a digitized data collection and maintenance work management;
• Implement lessons learned from the 2019 Ray Compressor Station (“Ray”) fire incident; and
• Retire old engines that are no longer cost beneficial to operate and maintain.
In addition, the plan will address single failure points in our compression fleet where a station compression event could isolate a storage or transmission supply resource from the system.
D. Transmission
Gas transmission pipelines are the “expressways” of the gas system, transmitting large quantities of gas at high pressures in large diameter pipes ranging from 12 inches to 36 inches.
Consumers Energy operates approximately 1,600 miles of major gas transmission pipelines in its integrated system today.
• Our goal is to meet the needs of Michigan and have a top quartile transmission system in terms of age, materials, and technology. The plan details compliance with Pipeline & Hazardous Materials Safety Administration (“PHMSA”) requirements for inspection and increased inspections based on the age of our current transmission system and mitigating risk; and
• The plan continues investment in upgrading and replacing Michigan’s major pipelines and modernizing the system with remote-control valves (“RCVs”) to quickly isolate the system when system integrity is compromised.
MICHIGAN PUBLIC SERVICE COMMISSION Consumers Energy Company
Case No.: U-20650 Exhibit No.: A-36 (CCD-1)
Page: 16 of 112 Witness: CCDegenfelder
Date: December 2019
4th Quarter 2020 - 2030
Natural Gas Delivery Plan
Page 17 of 112
E. Distribution
Our distribution system moves gas from city gates through pressure regulation stations into neighborhood and commercial and industrial districts to customer homes and businesses. Gas enters the distribution system at 60–400 psi and residential meter service pressures are less than 1 psi.
The distribution system includes our oldest facilities and is situated closest to customers. Therefore, reducing risk in this area is a critical focus.
• We have 27,700 miles of distribution pipeline and 1.6 million services;
• The highest-risk assets in this system are the oldest materials and gas leaks from corrosion of these older vintage materials—including cast iron, bare steel, and copper, which were installed from the 1940s through the 1970s—are the primary risk drivers; and
• While leaks in this area are at a lower pressure, they are also located in areas of higher population.
In 2012, we launched the Enhanced Infrastructure Replacement Program (“EIRP”), targeting replacement of vintage materials such as cast iron, copper, wrought iron, and unprotected steel over multiple decades.
In 2017, we added the Vintage Service Replacement (“VSR”) Program to eliminate identified materials on services on a programmatic basis.
• There remains 2,400 miles of vintage main, and approximately 152,000 vintage services;
• Benchmarking during the development of the plan indicates that to make our portion of Michigan’s gas distribution system top quartile in the country, we must accelerate completion of the project to 2030; and
• This acceleration will provide Michigan with the opportunities for job growth throughout our service territory.
F. Operational Capabilities
As we move forward with the Plan, the Company will need essential operational capabilities in the areas of people, process and technology for each of the asset areas to ensure we achieve the strategic 10-year goals and outcomes.
• People
From a people perspective, we are focused on how we can safely deliver for our customers by ensuring we have the right people, with the right skills, at the right place and time; and
To make sure we meet these commitments, we’re placing a strong focus on creating the right employee experience to ensure we attract and retain the most qualified and talented candidates, and providing the essential training needed for our workforce.
MICHIGAN PUBLIC SERVICE COMMISSION Consumers Energy Company
Case No.: U-20650 Exhibit No.: A-36 (CCD-1)
Page: 17 of 112 Witness: CCDegenfelder
Date: December 2019

4th Quarter 2020 - 2030
Natural Gas Delivery Plan
Page 18 of 112
• Process
To ensure we continue to best position ourselves for the future unknowns, we will also assess our operating model (e.g., governance, roles, responsibilities, structure, ways of working) and will adjust as required. The following are some examples of our future process improvements:
o We will continue to ensure risk prioritization drives our work management processes as we transition our current relative (i.e., indexed) risk models to a complete probabilistic system risk model over time; and
o We are also in the process of implementing the recommended practice (“RP”) American Petroleum Institute (“API”) 1173, pipeline safety management system, an industry leading practice that Consumers Energy is calling its Gas Safety management System, as discussed in Section IX – Gas Safety Enhancements, in order to be more holistic and cover the entire gas system. GSMS will keep key performance indicators visible to leadership and will increase focus on processes, procedures, and outcomes like leading companies in other industries that have implemented ISO 9000 to ensure transparency, proper communication, and timely decision-making at every level of the organization.
• Technology
Digital is a modern approach to investing in technology for customer value.
It is about connecting people, “smart” things, and data to create better products, services, and ways of working. This plan shows the need to invest in technology for our natural gas system.
Digital capabilities are essential to:
o Achieving the outcomes of optimizing our compression and storage assets;
o Modernizing the distribution and transmission system;
o Incorporating predictive and condition-based maintenance;
o Transforming work management; and
o Ensuring physical and cybersecurity of our assets.
Overall, these operational capabilities will enhance our workforce resources, processes, and technologies to successfully execute the plan. In addition, they will allow us to routinely assess the gas system and update the integrated Plan on an annual basis and/or as-needed.
MICHIGAN PUBLIC SERVICE COMMISSION Consumers Energy Company
Case No.: U-20650 Exhibit No.: A-36 (CCD-1)
Page: 18 of 112 Witness: CCDegenfelder
Date: December 2019

4th Quarter 2020 - 2030
Natural Gas Delivery Plan
Page 19 of 112
III. Consumers Energy Natural Gas Delivery Plan A. Vision Statement Provide a safe, reliable, affordable, and clean gas supply to customers.
B. Objectives Our Plan has four objectives to guide future investment decisions across the full system of storage, compression, transmission, and distribution. We plan to use these objectives to help prioritize investment decisions based on factors such as risk, cost, and various impacts on the customer to ensure successful outcomes for the Plan.
The Plan’s four objectives are: • Safe: Zero incidents. The safety of our employees, customers, and system is our top priority; • Reliable: The reliability and resiliency of our system is essential to operating as a trusted energy
partner for Michigan; • Affordable: Competitive, predictable prices. To have a safe and reliable system, investments
must be made. Therefore, we must balance system needs and the timing of investments with the ability to maintain affordability on the customer bill; and
• Clean: Decrease our environmental footprint. Investing in a safe, reliable, and affordable system will help us better track our system emissions and provide a clean gas system for the future.
C. Objectives and Goals We used modeling results and input from industry experts and other external gas utilities to identify goals for each objective:
1. Safe
Safety remains our top priority. That means:
• Continuously reducing system risk;
• Focusing on process safety; and
• Modernizing our system by remediating our distribution and transmission assets and replacing higher-risk vintage distribution mains and services.
There is also an emphasis on implementing best practices in GSMS (RP 1173) and records management.
We’ll continue to use operational metrics to measure factors spanning the safety of our personnel, assets, processes, and physical and cybersecurity.
We are accelerating remediation of high-risk materials in service, while moving to system-wide risk management to reduce overall system risk and better quantify the necessary spending priorities.
MICHIGAN PUBLIC SERVICE COMMISSION Consumers Energy Company
Case No.: U-20650 Exhibit No.: A-36 (CCD-1)
Page: 19 of 112 Witness: CCDegenfelder
Date: December 2019
4th Quarter 2020 - 2030
Natural Gas Delivery Plan
Page 20 of 112
2. Reliable
We are continuing to create a reliable system through dependable assets, measured through metrics such as system optimization and gas flow path resiliency to avoid unplanned outages. We also must ensure there is a resilient storage and market supply plan for peak demand days, and utilize the lessons learned from the Ray incident, and proactively balance peak demand with the implementation of gas DR. We’ll measure system optimization through storage and compression utilization rates.
Considering the Ray incident, the SEA, and the need to ensure supply resiliency and system optimization, our efforts will be to assess available interstate supply, optimize storage, and improve our compression fleet reliability.
We define resiliency as the ability of our gas system to quickly adapt to unforeseen disruptions while maintaining operations that provide for safe and continuous customer service.
3. Affordable
There is a continued and consistent focus on delivering affordable gas to our customers with competitive, predictable prices. We will continue to analyze average customer bills (total cost and cost per Mcf) to consider all costs to the customer.
Offering gas DR choices to customers will create the additional benefit of ensuring affordable supply to residential customers during peak times.
We will also continue our commitment to low-income customers through our Consumers Affordable Resource for Energy (“CARE”) Program, support energy efficiency programs at 1% or more of sales and measure customer satisfaction.
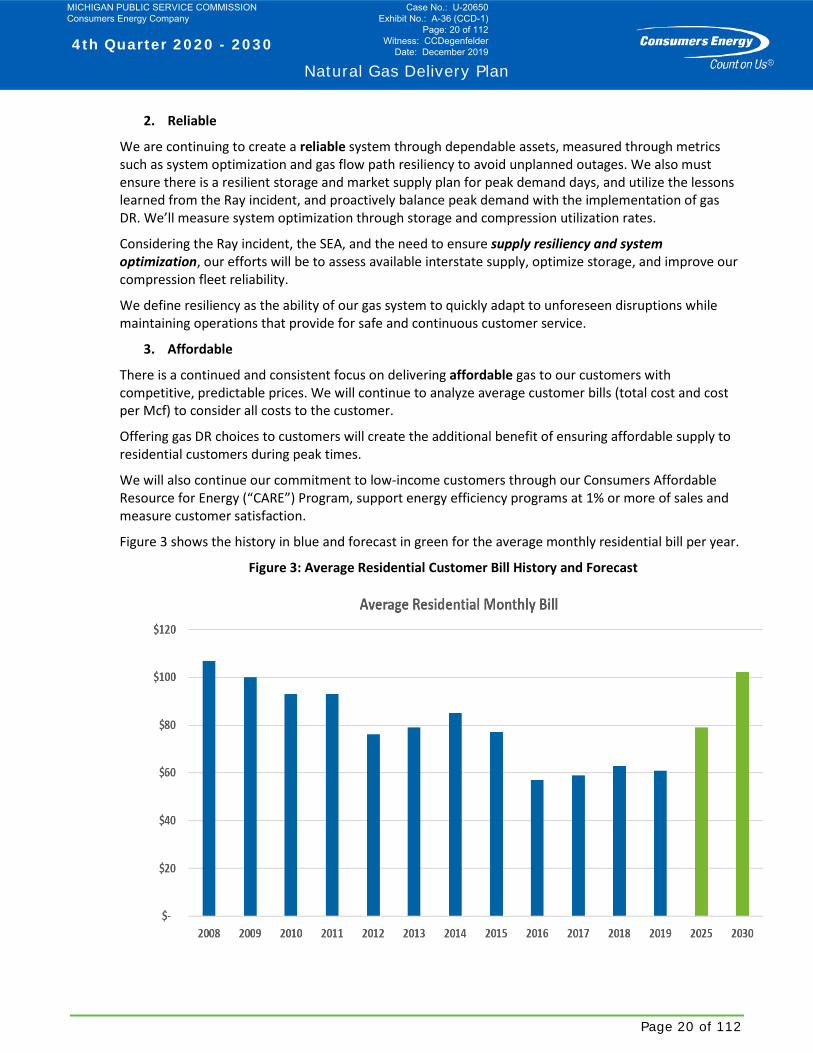
Figure 3 shows the history in blue and forecast in green for the average monthly residential bill per year.
Figure 3: Average Residential Customer Bill History and Forecast
MICHIGAN PUBLIC SERVICE COMMISSION Consumers Energy Company
Case No.: U-20650 Exhibit No.: A-36 (CCD-1)
Page: 20 of 112 Witness: CCDegenfelder
Date: December 2019
4th Quarter 2020 - 2030
Natural Gas Delivery Plan
Page 21 of 112
As you can see in Figure 3, the average monthly bill has decreased significantly at over 5% per year over the last decade due to gas commodity costs decreasing and even with our capital investment spending increasing approximately 15% per year at that same time.
However, as seen with the last gas rate case order (Case No. U-20322) issued on September 26, 2019, the customer bills will need to start increasing again to ensure the necessary investments are completed for a safe, reliable, and clean gas system.
This bill growth rate will be an approximate compounded annual growth rate of approximately 4-5% each year through 2025 and 5-6% each year from 2026 through 2030.
However, even if the average bill increases to historical values, as also shown in Figure 3, the impact as a percentage of customers’ overall household spending is forecasted to be lower in 2030 than it was in 2008.
We’re accelerating investments today to reduce volatility in customer bill growth while commodity costs are lower. We’re also introducing natural gas DR choices to reduce potential gas demand and mitigate the need for further investments to meet an infrequent peak demand and/or system resilience event.
We’ll continue to measure customer satisfaction and ensure the predictability of our capital work spend plan to help reduce the volatility of customers’ bills.
4. Clean
Consumers Energy loves Michigan and is committed to protecting the planet.
That’s why we’re fundamentally transforming the way we operate to fight climate change and create a clean energy future for generations to come. Our Clean Energy Plan will eliminate coal as a fuel source for electricity, boost renewable energy, and reduce carbon emissions by 90% by 2040.
Now, we’re voluntarily implementing changes to our natural gas business that will minimize our environmental footprint by significantly reducing methane emissions.
The primary 10-year outcome for “clean” is to achieve net zero methane emissions for our natural gas delivery system by the end of 2030.
We’ve already reduced methane emissions in the gas system by about 10% over the past decade. This Plan outlines the path to further emissions reductions by:
• Accelerating the replacement of aging pipe; • Rehabilitating or retiring outdated infrastructure; and • Embracing new technologies and operational practices to keep gas flowing more safely and
efficiently than ever.
We expect these measures—detailed in the following pages—to reduce our emissions by about 80%.
As an example of these reductions, for the year 2021, we are expecting the following methane reductions per program:
• EIRP Program (i.e. vintage distribution main pipe) will reduce methane emissions approximately 195-225 metric tons;
• VSR Program (i.e. vintage services replacements) will reduce methane emissions approximately 55-65 metric tons;
MICHIGAN PUBLIC SERVICE COMMISSION Consumers Energy Company
Case No.: U-20650 Exhibit No.: A-36 (CCD-1)
Page: 21 of 112 Witness: CCDegenfelder
Date: December 2019

4th Quarter 2020 - 2030
Natural Gas Delivery Plan
Page 22 of 112
• Damage Prevention Program will reduce methane emissions approximately 23-27 metric tons; and
• Storage Rehabilitation (Well P&A) Program will reduce methane emissions approximately 1.5-3 metric tons.
Unfortunately, emitting some level of methane is unavoidable with a sprawling storage and delivery system that stretches thousands of miles and includes about 1.5 million service connections. We plan to close that gap by including renewable natural gas (“RNG”), which has a negative methane footprint, in our supply portfolio.
Together, these two actions will help us reach net zero methane emissions for our natural gas delivery system. Along the way, we’ll continue to explore and evaluate new strategies, technologies, and possibilities.
By achieving net zero methane emissions for our natural gas system, we’ll reduce our methane emissions by more than 10,000 metric tons—that’s the equivalent of removing about 55,000 vehicles from the road for a year or preserving more than 300,000 acres of forest.
Reducing methane, a greenhouse gas that’s 25 times more potent than carbon dioxide, aligns with our Clean Energy Plan as a key priority to combat climate change. We are committed to caring for people, protecting the planet, and empowering Michigan’s prosperity.
The following graph in Figure 4 shows our net-zero and methane emissions goal.
Figure 4: Net-Zero and Methane (CH4) Emissions Goal
MICHIGAN PUBLIC SERVICE COMMISSION Consumers Energy Company
Case No.: U-20650 Exhibit No.: A-36 (CCD-1)
Page: 22 of 112 Witness: CCDegenfelder
Date: December 2019
4th Quarter 2020 - 2030
Natural Gas Delivery Plan
Page 23 of 112
D. Alignment with Headline Metrics, Objectives, and 10-Year Outcomes For each objective shown above, headline metrics and a set of 10-year outcomes with 2030 performance targets were developed by analyzing our historical performance and future needs of the system while benchmarking other similar peer utilities as shown in this plan.
Overall, we are investing in the gas system because it is necessary per regulatory requirements and it is best for Michigan—and we plan to make this improvement while keeping bill increases affordable and predictable for customers.
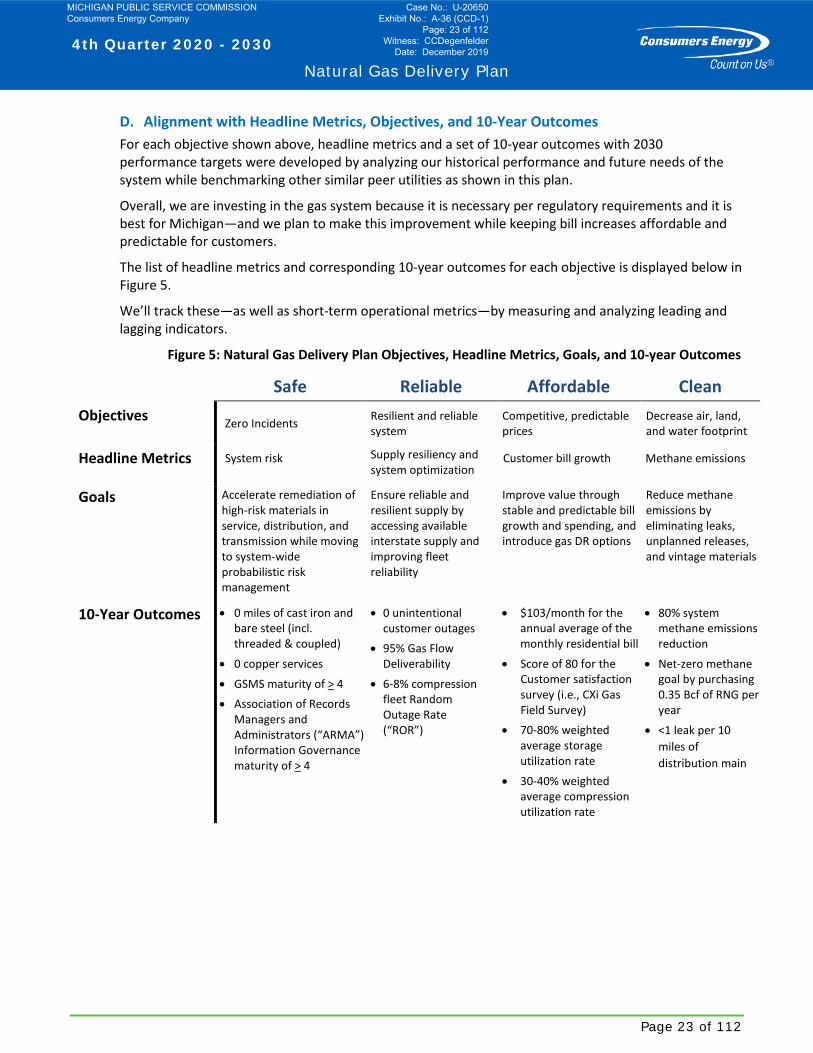
The list of headline metrics and corresponding 10-year outcomes for each objective is displayed below in Figure 5.
We’ll track these—as well as short-term operational metrics—by measuring and analyzing leading and lagging indicators.
Figure 5: Natural Gas Delivery Plan Objectives, Headline Metrics, Goals, and 10-year Outcomes
Safe Reliable Affordable Clean Objectives Zero Incidents Resilient and reliable
system Competitive, predictable prices
Decrease air, land, and water footprint
Headline Metrics System risk Supply resiliency and system optimization
Customer bill growth Methane emissions
Goals Accelerate remediation of high-risk materials in service, distribution, and transmission while moving to system-wide probabilistic risk management
Ensure reliable and resilient supply by accessing available interstate supply and improving fleet reliability
Improve value through stable and predictable bill growth and spending, and introduce gas DR options
Reduce methane emissions by eliminating leaks, unplanned releases, and vintage materials
10-Year Outcomes • 0 miles of cast iron and bare steel (incl. threaded & coupled)
• 0 copper services
• GSMS maturity of > 4
• Association of Records Managers and Administrators (“ARMA”) Information Governance maturity of > 4
• 0 unintentional customer outages
• 95% Gas Flow Deliverability
• 6-8% compression fleet Random Outage Rate (“ROR”)
• $103/month for the annual average of the monthly residential bill
• Score of 80 for the Customer satisfaction survey (i.e., CXi Gas Field Survey)
• 70-80% weighted average storage utilization rate
• 30-40% weighted average compression utilization rate
• 80% system methane emissions reduction
• Net-zero methane goal by purchasing 0.35 Bcf of RNG per year
• <1 leak per 10 miles of distribution main
MICHIGAN PUBLIC SERVICE COMMISSION Consumers Energy Company
Case No.: U-20650 Exhibit No.: A-36 (CCD-1)
Page: 23 of 112 Witness: CCDegenfelder
Date: December 2019

4th Quarter 2020 - 2030
Natural Gas Delivery Plan
Page 24 of 112
E. “Future Back” Scenario Modeling
We worked with industry experts from October 2018 to March 2019, to support us in the creation of a holistic, long-term plan for the natural gas system. During that time, we talked with many other gas utilities to identify how to conduct a holistic review of our gas system by assessing internal risk models and system data to determine the optimal system configuration to meet the Company’s objectives of safe, reliable, affordable, and clean.
This external consultant helped us consider various internal and external factors and industry trends. We then assessed several possible system configurations and potential future external scenarios based on the changing nature of our business, the industry, and the gas commodity environment. We intended to determine the boundaries of possible system configurations under various peak day, monthly, and seasonal scenarios through 2030.
As part of the process, we reviewed historical data from all asset areas, system demand forecasts, and total system pipeline supplies.
We then inserted the data in various modeling tools to generate the future operational feasibility, financial implications, and other factors that could exist based on changing inputs. This approach is outlined below in Figure 6.
Figure 6: Approach to “Future Back” Scenario Modeling
MICHIGAN PUBLIC SERVICE COMMISSION Consumers Energy Company
Case No.: U-20650 Exhibit No.: A-36 (CCD-1)
Page: 24 of 112 Witness: CCDegenfelder
Date: December 2019
4th Quarter 2020 - 2030
Natural Gas Delivery Plan
Page 25 of 112
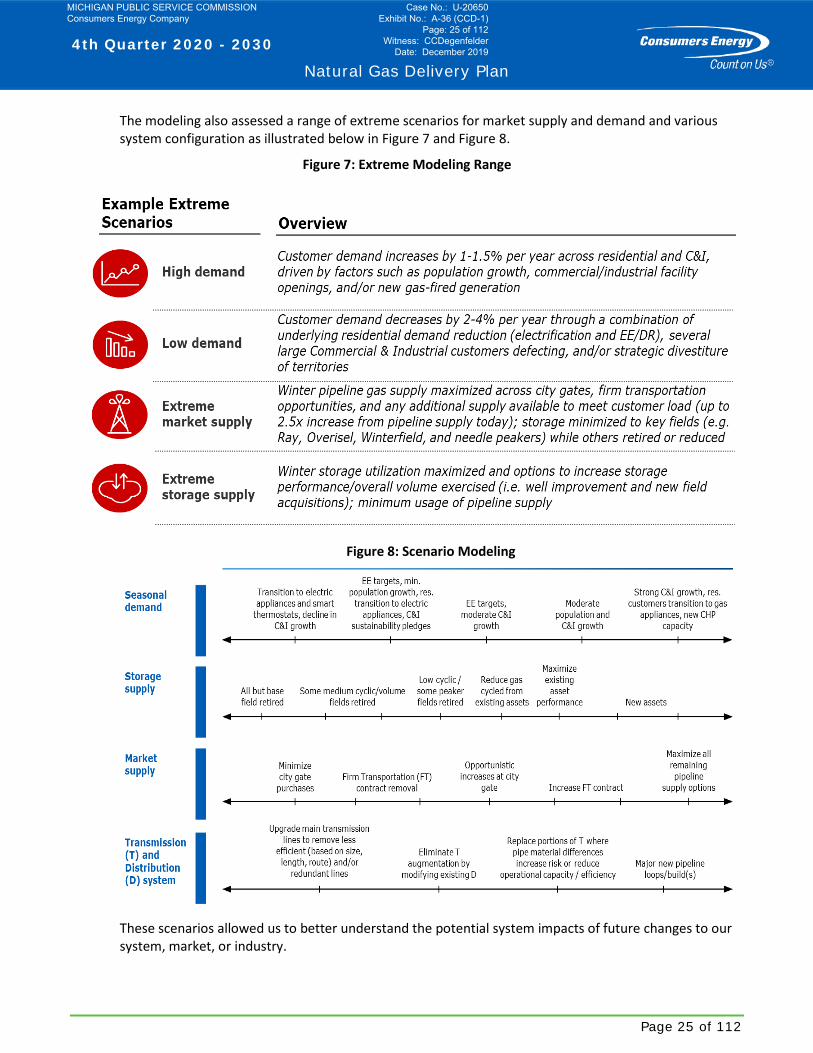
The modeling also assessed a range of extreme scenarios for market supply and demand and various system configuration as illustrated below in Figure 7 and Figure 8.
Figure 7: Extreme Modeling Range
Figure 8: Scenario Modeling
These scenarios allowed us to better understand the potential system impacts of future changes to our system, market, or industry.
MICHIGAN PUBLIC SERVICE COMMISSION Consumers Energy Company
Case No.: U-20650 Exhibit No.: A-36 (CCD-1)
Page: 25 of 112 Witness: CCDegenfelder
Date: December 2019
4th Quarter 2020 - 2030
Natural Gas Delivery Plan
Page 26 of 112
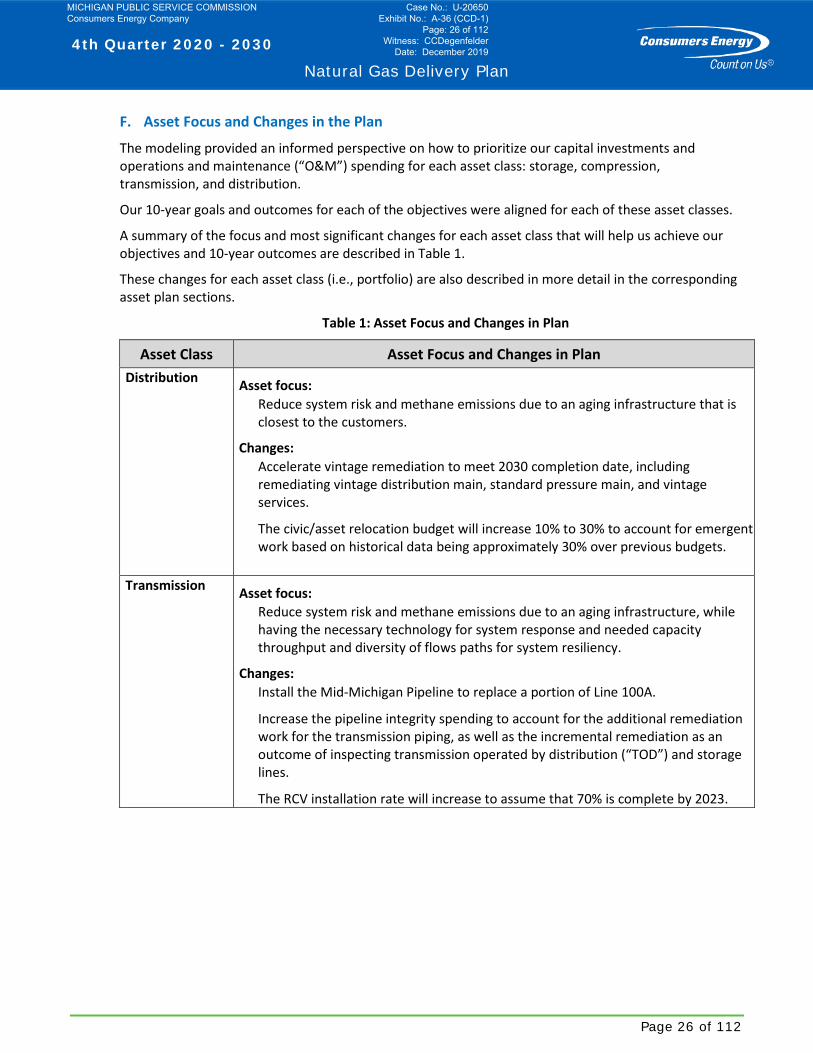
F. Asset Focus and Changes in the Plan
The modeling provided an informed perspective on how to prioritize our capital investments and operations and maintenance (“O&M”) spending for each asset class: storage, compression, transmission, and distribution.
Our 10-year goals and outcomes for each of the objectives were aligned for each of these asset classes.
A summary of the focus and most significant changes for each asset class that will help us achieve our objectives and 10-year outcomes are described in Table 1.
These changes for each asset class (i.e., portfolio) are also described in more detail in the corresponding asset plan sections.
Table 1: Asset Focus and Changes in Plan
Asset Class Asset Focus and Changes in Plan Distribution Asset focus:
Reduce system risk and methane emissions due to an aging infrastructure that is closest to the customers.
Changes: Accelerate vintage remediation to meet 2030 completion date, including
remediating vintage distribution main, standard pressure main, and vintage services.
The civic/asset relocation budget will increase 10% to 30% to account for emergent work based on historical data being approximately 30% over previous budgets.
Transmission Asset focus: Reduce system risk and methane emissions due to an aging infrastructure, while
having the necessary technology for system response and needed capacity throughput and diversity of flows paths for system resiliency.
Changes: Install the Mid-Michigan Pipeline to replace a portion of Line 100A.
Increase the pipeline integrity spending to account for the additional remediation work for the transmission piping, as well as the incremental remediation as an outcome of inspecting transmission operated by distribution (“TOD”) and storage lines.
The RCV installation rate will increase to assume that 70% is complete by 2023.
MICHIGAN PUBLIC SERVICE COMMISSION Consumers Energy Company
Case No.: U-20650 Exhibit No.: A-36 (CCD-1)
Page: 26 of 112 Witness: CCDegenfelder
Date: December 2019
4th Quarter 2020 - 2030
Natural Gas Delivery Plan
Page 27 of 112
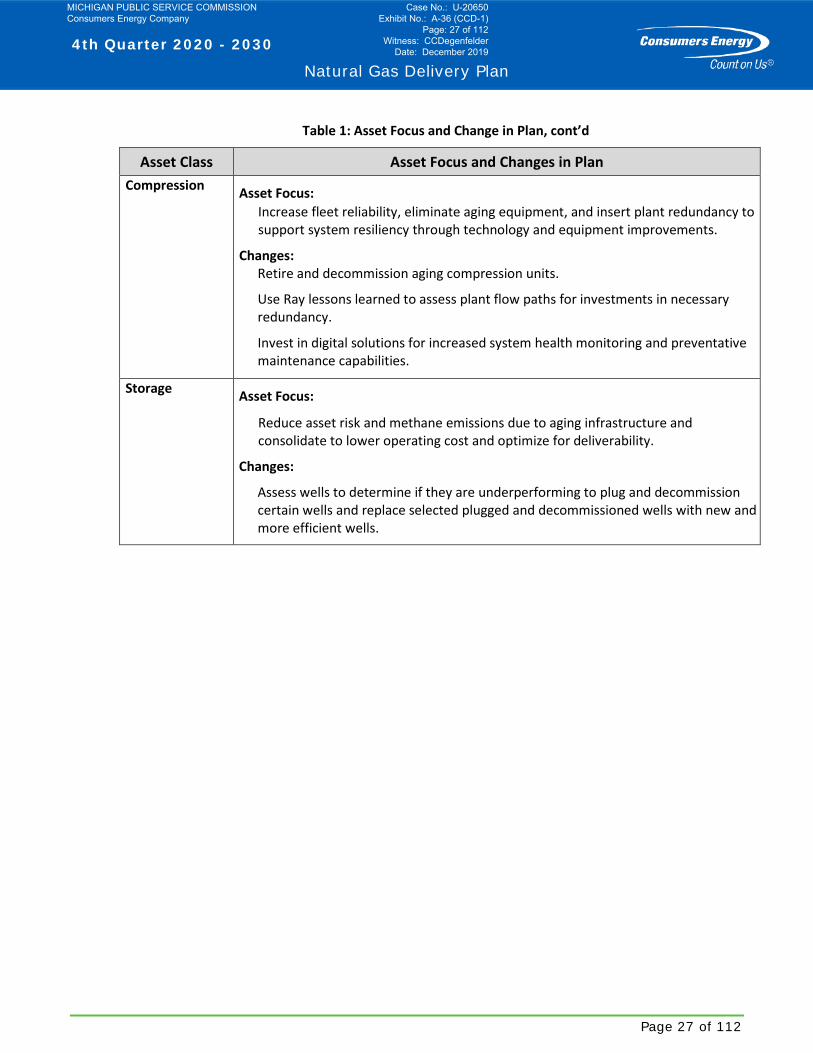
Table 1: Asset Focus and Change in Plan, cont’d
Asset Class Asset Focus and Changes in Plan Compression Asset Focus:
Increase fleet reliability, eliminate aging equipment, and insert plant redundancy to support system resiliency through technology and equipment improvements.
Changes: Retire and decommission aging compression units.
Use Ray lessons learned to assess plant flow paths for investments in necessary redundancy.
Invest in digital solutions for increased system health monitoring and preventative maintenance capabilities.
Storage Asset Focus:
Reduce asset risk and methane emissions due to aging infrastructure and consolidate to lower operating cost and optimize for deliverability.
Changes:
Assess wells to determine if they are underperforming to plug and decommission certain wells and replace selected plugged and decommissioned wells with new and more efficient wells.
MICHIGAN PUBLIC SERVICE COMMISSION Consumers Energy Company
Case No.: U-20650 Exhibit No.: A-36 (CCD-1)
Page: 27 of 112 Witness: CCDegenfelder
Date: December 2019
4th Quarter 2020 - 2030
Natural Gas Delivery Plan
Page 28 of 112
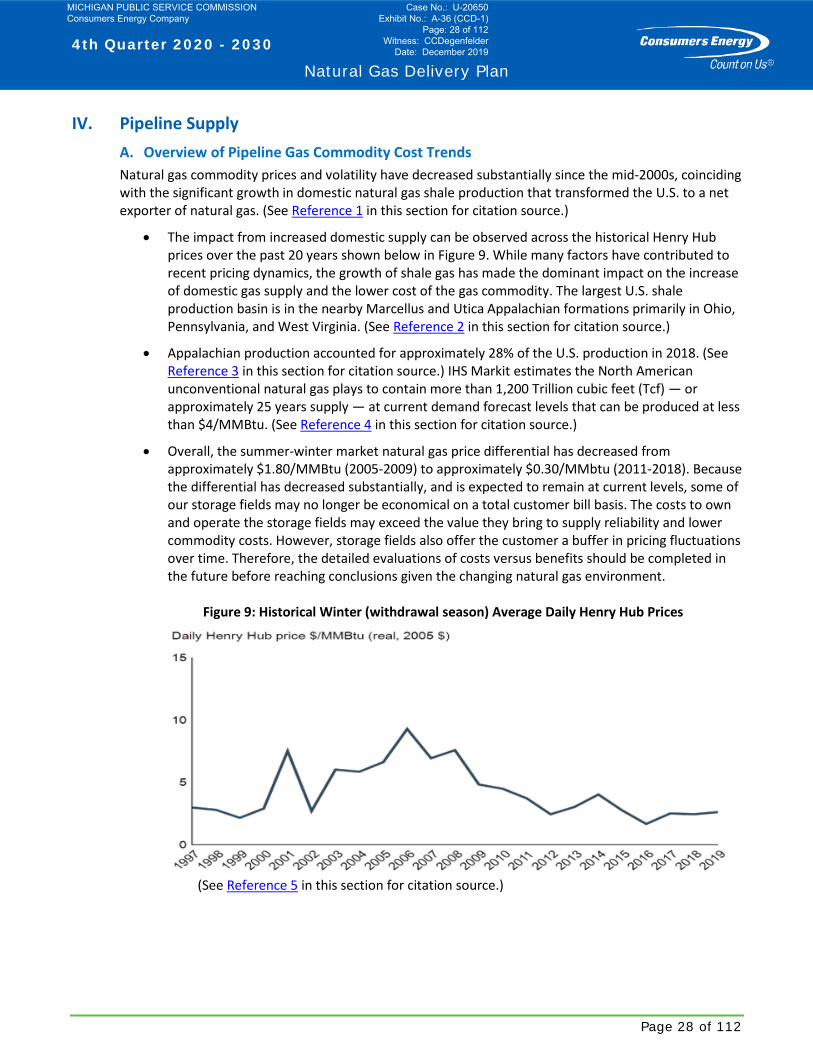
IV. Pipeline Supply A. Overview of Pipeline Gas Commodity Cost Trends Natural gas commodity prices and volatility have decreased substantially since the mid-2000s, coinciding with the significant growth in domestic natural gas shale production that transformed the U.S. to a net exporter of natural gas. (See Reference 1 in this section for citation source.)
• The impact from increased domestic supply can be observed across the historical Henry Hub prices over the past 20 years shown below in Figure 9. While many factors have contributed to recent pricing dynamics, the growth of shale gas has made the dominant impact on the increase of domestic gas supply and the lower cost of the gas commodity. The largest U.S. shale production basin is in the nearby Marcellus and Utica Appalachian formations primarily in Ohio, Pennsylvania, and West Virginia. (See Reference 2 in this section for citation source.)
• Appalachian production accounted for approximately 28% of the U.S. production in 2018. (See Reference 3 in this section for citation source.) IHS Markit estimates the North American unconventional natural gas plays to contain more than 1,200 Trillion cubic feet (Tcf) — or approximately 25 years supply — at current demand forecast levels that can be produced at less than $4/MMBtu. (See Reference 4 in this section for citation source.)
• Overall, the summer-winter market natural gas price differential has decreased from approximately $1.80/MMBtu (2005-2009) to approximately $0.30/MMbtu (2011-2018). Because the differential has decreased substantially, and is expected to remain at current levels, some of our storage fields may no longer be economical on a total customer bill basis. The costs to own and operate the storage fields may exceed the value they bring to supply reliability and lower commodity costs. However, storage fields also offer the customer a buffer in pricing fluctuations over time. Therefore, the detailed evaluations of costs versus benefits should be completed in the future before reaching conclusions given the changing natural gas environment.
Figure 9: Historical Winter (withdrawal season) Average Daily Henry Hub Prices1
(See Reference 5 in this section for citation source.)
MICHIGAN PUBLIC SERVICE COMMISSION Consumers Energy Company
Case No.: U-20650 Exhibit No.: A-36 (CCD-1)
Page: 28 of 112 Witness: CCDegenfelder
Date: December 2019

4th Quarter 2020 - 2030
Natural Gas Delivery Plan
Page 29 of 112
B. Implications for Our System and Pipeline Supply vs. Total Customer Cost Trade-Off
To ensure customer affordability, we will continue to evaluate both pipeline gas commodity (i.e., Gas Cost Recovery (“GCR”) and investment costs when considering the total delivered price of gas that the customer pays. This aligns with our goal of affordability.
• Considering the historically low gas commodity pricing, we plan to invest in the necessary asset areas to have the least impact on the overall customer bill. Consumers Energy had the lowest average GCR factor, i.e., the portion of the bill recovering commodity costs, of any regulated Michigan utility in 2018; and
• Figure 10 shows our current GCR price when compared to other Local Distribution Companies through 2019. We are still the lowest-cost GCR provider in Michigan.
Figure 10: Monthly GCR Billing Factor Price for Consumers Energy and Others
(See Reference 6 in this section for citation source.)
As part of the plan, total bill considerations will provide the optimal trade-offs between commodity and investment related alternatives to maintain affordability for our customers. Considering total customer bills will provide more levers to accomplish the affordability objective while commodity prices are low.
MICHIGAN PUBLIC SERVICE COMMISSION Consumers Energy Company
Case No.: U-20650 Exhibit No.: A-36 (CCD-1)
Page: 29 of 112 Witness: CCDegenfelder
Date: December 2019
4th Quarter 2020 - 2030
Natural Gas Delivery Plan
Page 30 of 112
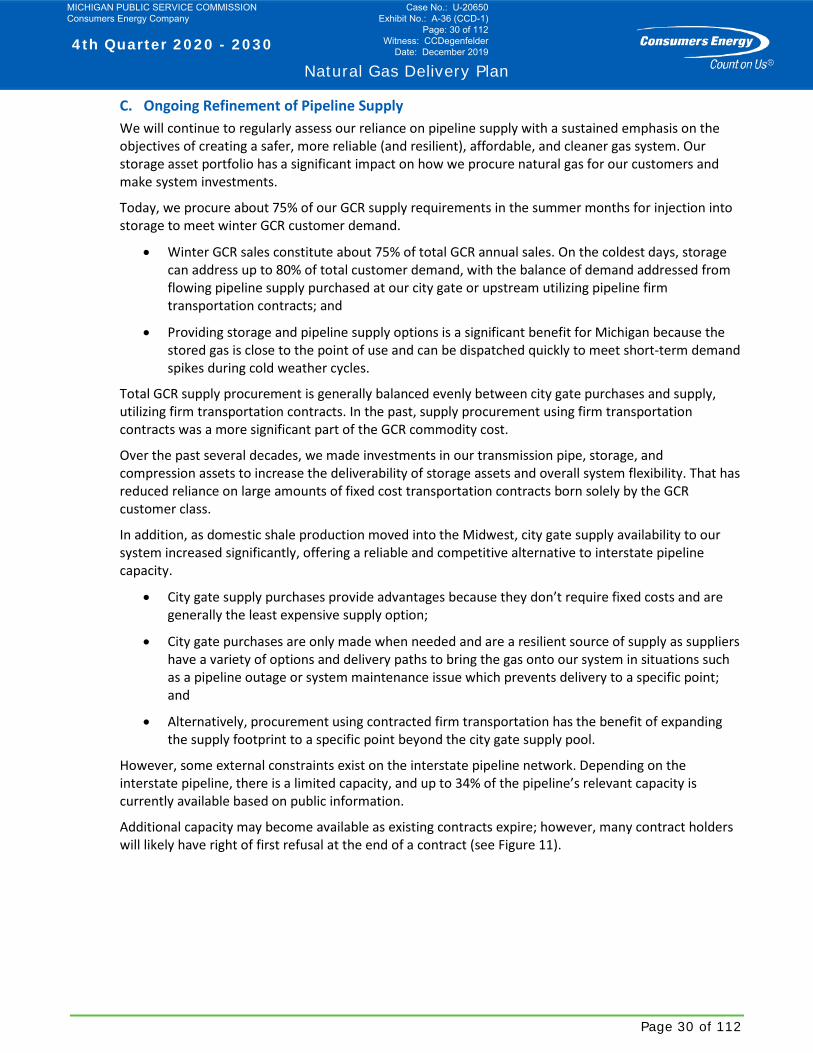
C. Ongoing Refinement of Pipeline Supply We will continue to regularly assess our reliance on pipeline supply with a sustained emphasis on the objectives of creating a safer, more reliable (and resilient), affordable, and cleaner gas system. Our storage asset portfolio has a significant impact on how we procure natural gas for our customers and make system investments.
Today, we procure about 75% of our GCR supply requirements in the summer months for injection into storage to meet winter GCR customer demand.
• Winter GCR sales constitute about 75% of total GCR annual sales. On the coldest days, storage can address up to 80% of total customer demand, with the balance of demand addressed from flowing pipeline supply purchased at our city gate or upstream utilizing pipeline firm transportation contracts; and
• Providing storage and pipeline supply options is a significant benefit for Michigan because the stored gas is close to the point of use and can be dispatched quickly to meet short-term demand spikes during cold weather cycles.
Total GCR supply procurement is generally balanced evenly between city gate purchases and supply, utilizing firm transportation contracts. In the past, supply procurement using firm transportation contracts was a more significant part of the GCR commodity cost.
Over the past several decades, we made investments in our transmission pipe, storage, and compression assets to increase the deliverability of storage assets and overall system flexibility. That has reduced reliance on large amounts of fixed cost transportation contracts born solely by the GCR customer class.
In addition, as domestic shale production moved into the Midwest, city gate supply availability to our system increased significantly, offering a reliable and competitive alternative to interstate pipeline capacity.
• City gate supply purchases provide advantages because they don’t require fixed costs and are generally the least expensive supply option;
• City gate purchases are only made when needed and are a resilient source of supply as suppliers have a variety of options and delivery paths to bring the gas onto our system in situations such as a pipeline outage or system maintenance issue which prevents delivery to a specific point; and
• Alternatively, procurement using contracted firm transportation has the benefit of expanding the supply footprint to a specific point beyond the city gate supply pool.
However, some external constraints exist on the interstate pipeline network. Depending on the interstate pipeline, there is a limited capacity, and up to 34% of the pipeline’s relevant capacity is currently available based on public information.
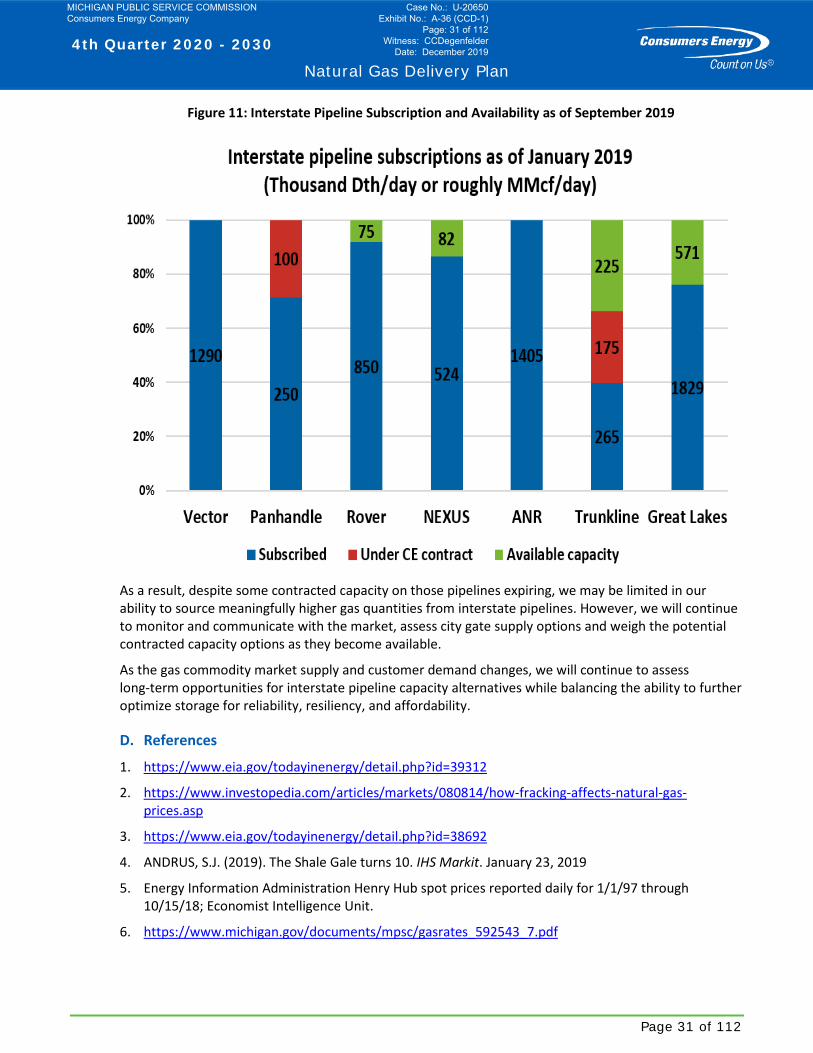
Additional capacity may become available as existing contracts expire; however, many contract holders will likely have right of first refusal at the end of a contract (see Figure 11).
MICHIGAN PUBLIC SERVICE COMMISSION Consumers Energy Company
Case No.: U-20650 Exhibit No.: A-36 (CCD-1)
Page: 30 of 112 Witness: CCDegenfelder
Date: December 2019
4th Quarter 2020 - 2030
Natural Gas Delivery Plan
Page 31 of 112
Figure 11: Interstate Pipeline Subscription and Availability as of September 2019
As a result, despite some contracted capacity on those pipelines expiring, we may be limited in our ability to source meaningfully higher gas quantities from interstate pipelines. However, we will continue to monitor and communicate with the market, assess city gate supply options and weigh the potential contracted capacity options as they become available.
As the gas commodity market supply and customer demand changes, we will continue to assess long-term opportunities for interstate pipeline capacity alternatives while balancing the ability to further optimize storage for reliability, resiliency, and affordability.
D. References
1. https://www.eia.gov/todayinenergy/detail.php?id=39312
2. https://www.investopedia.com/articles/markets/080814/how-fracking-affects-natural-gas-prices.asp
3. https://www.eia.gov/todayinenergy/detail.php?id=38692
4. ANDRUS, S.J. (2019). The Shale Gale turns 10. IHS Markit. January 23, 2019
5. Energy Information Administration Henry Hub spot prices reported daily for 1/1/97 through 10/15/18; Economist Intelligence Unit.
6. https://www.michigan.gov/documents/mpsc/gasrates_592543_7.pdf
MICHIGAN PUBLIC SERVICE COMMISSION Consumers Energy Company
Case No.: U-20650 Exhibit No.: A-36 (CCD-1)
Page: 31 of 112 Witness: CCDegenfelder
Date: December 2019
4th Quarter 2020 - 2030
Natural Gas Delivery Plan
Page 32 of 112
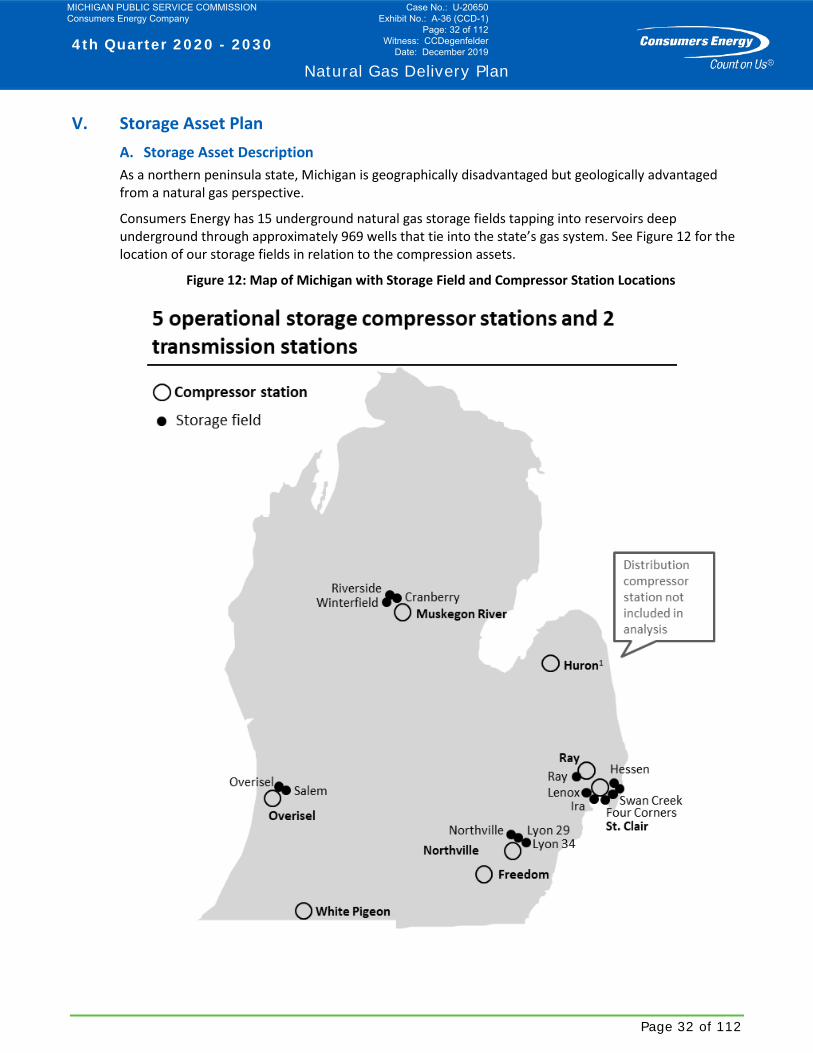
V. Storage Asset Plan A. Storage Asset Description As a northern peninsula state, Michigan is geographically disadvantaged but geologically advantaged from a natural gas perspective.
Consumers Energy has 15 underground natural gas storage fields tapping into reservoirs deep underground through approximately 969 wells that tie into the state’s gas system. See Figure 12 for the location of our storage fields in relation to the compression assets.
Figure 12: Map of Michigan with Storage Field and Compressor Station Locations
MICHIGAN PUBLIC SERVICE COMMISSION Consumers Energy Company
Case No.: U-20650 Exhibit No.: A-36 (CCD-1)
Page: 32 of 112 Witness: CCDegenfelder
Date: December 2019
4th Quarter 2020 - 2030
Natural Gas Delivery Plan
Page 33 of 112
Originally, these storage fields were oil and gas production wells repurposed to inject and withdraw natural gas to meet Michigan’s winter energy needs. This storage capacity created customer value by enabling us to purchase gas at lower prices in the summer.
The growth of hydraulic fracture gas production has mitigated this seasonal variation as noted in the Pipeline Supply, section IV.
However, the storage fleet continues to play an important role during extreme weather such as polar vortex situations by providing quick access to high volumes of gas that are geographically close to Michigan’s demand centers.
Michigan’s winter demand peaks due to residential heating. Also, in contrast to electricity where energy moves instantaneously, natural gas moves at a slower speed (approximately 10 mph or less).
• Geographical proximity of gas storage to customer load provides Michigan with a systemic advantage during the extremely cold winters in our region. With the growth of gas-fired generation to offset the retirements of coal-fired generation—and the maturation of renewable energy generation—maintaining a safe and reliable storage asset portfolio could also be important to Michigan’s electric reliability;
• All our gas storage fields are accessed through vertical or horizontal wells. These fields balance flowing interstate supply and customer demand each day and provide quicker access to large quantities of natural gas than incremental pipeline supply purchases;
• These storage fields provide approximately 149 Bcf of cyclic design capacity, about 116 Bcf of which was used during 2018; and
• In addition to the natural gas cycled annually for customer use, a base level remains in place to ensure the field is adequately pressurized. We use nearby gas compressor stations to inject and withdraw gas to leverage the storage fields.
B. Storage Asset Management Our owned and operated storage fields are segmented into baseload, intermediate, and peaking fields to serve different needs depending on monthly and seasonal demand, as well as peak day deliverability requirements.
Storage fields in our system are used in three ways:
• Along with pipeline supply, baseload storage fields run daily during the winter to meet a foundation level of demand;
• Intermediate storage fields run during longer periods of higher demand; and
• Peaker (and needle peaker) storage fields run during the extreme hours and days when demand changes quickly—typically in the early morning when customers start their day and their gas appliances.
MICHIGAN PUBLIC SERVICE COMMISSION Consumers Energy Company
Case No.: U-20650 Exhibit No.: A-36 (CCD-1)
Page: 33 of 112 Witness: CCDegenfelder
Date: December 2019
4th Quarter 2020 - 2030
Natural Gas Delivery Plan
Page 34 of 112
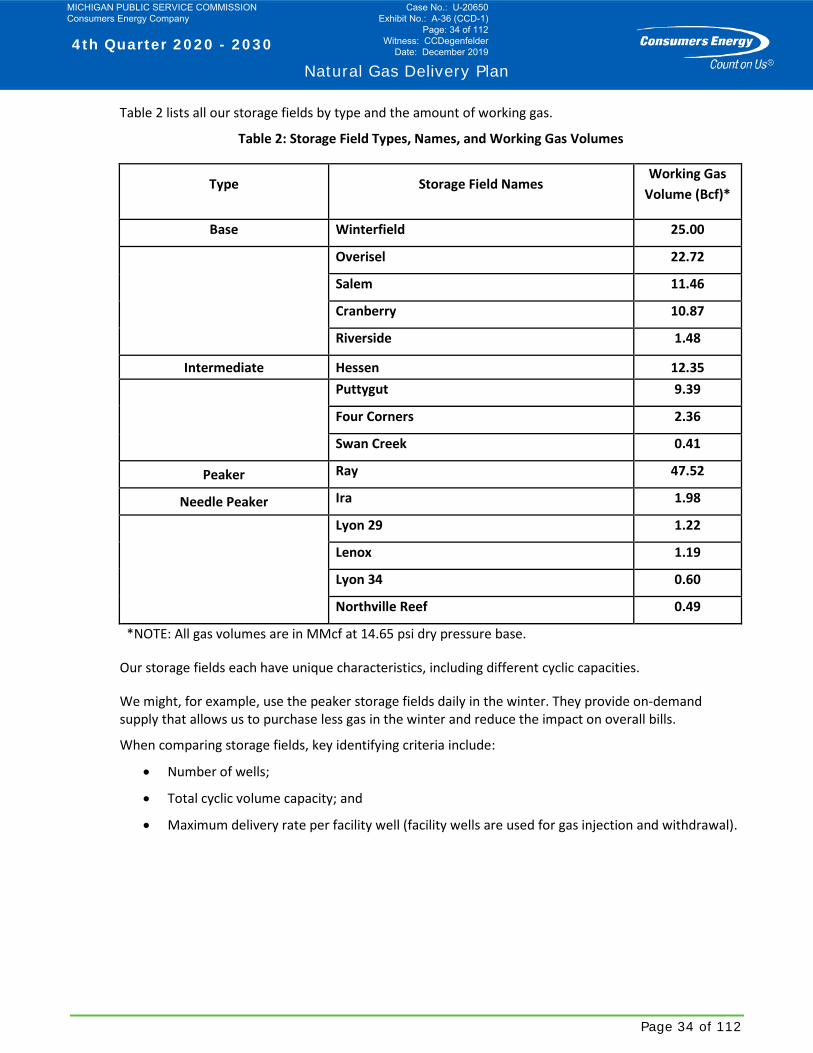
Table 2 lists all our storage fields by type and the amount of working gas.
Table 2: Storage Field Types, Names, and Working Gas Volumes
Type Storage Field Names Working Gas
Volume (Bcf)*
Base Winterfield 25.00
Overisel 22.72
Salem 11.46
Cranberry 10.87
Riverside 1.48
Intermediate Hessen 12.35
Puttygut 9.39
Four Corners 2.36
Swan Creek 0.41
Peaker Ray 47.52
Needle Peaker Ira 1.98
Lyon 29 1.22
Lenox 1.19
Lyon 34 0.60
Northville Reef 0.49
*NOTE: All gas volumes are in MMcf at 14.65 psi dry pressure base.
Our storage fields each have unique characteristics, including different cyclic capacities.
We might, for example, use the peaker storage fields daily in the winter. They provide on-demand supply that allows us to purchase less gas in the winter and reduce the impact on overall bills.
When comparing storage fields, key identifying criteria include:
• Number of wells;
• Total cyclic volume capacity; and
• Maximum delivery rate per facility well (facility wells are used for gas injection and withdrawal).
MICHIGAN PUBLIC SERVICE COMMISSION Consumers Energy Company
Case No.: U-20650 Exhibit No.: A-36 (CCD-1)
Page: 34 of 112 Witness: CCDegenfelder
Date: December 2019
4th Quarter 2020 - 2030
Natural Gas Delivery Plan
Page 35 of 112
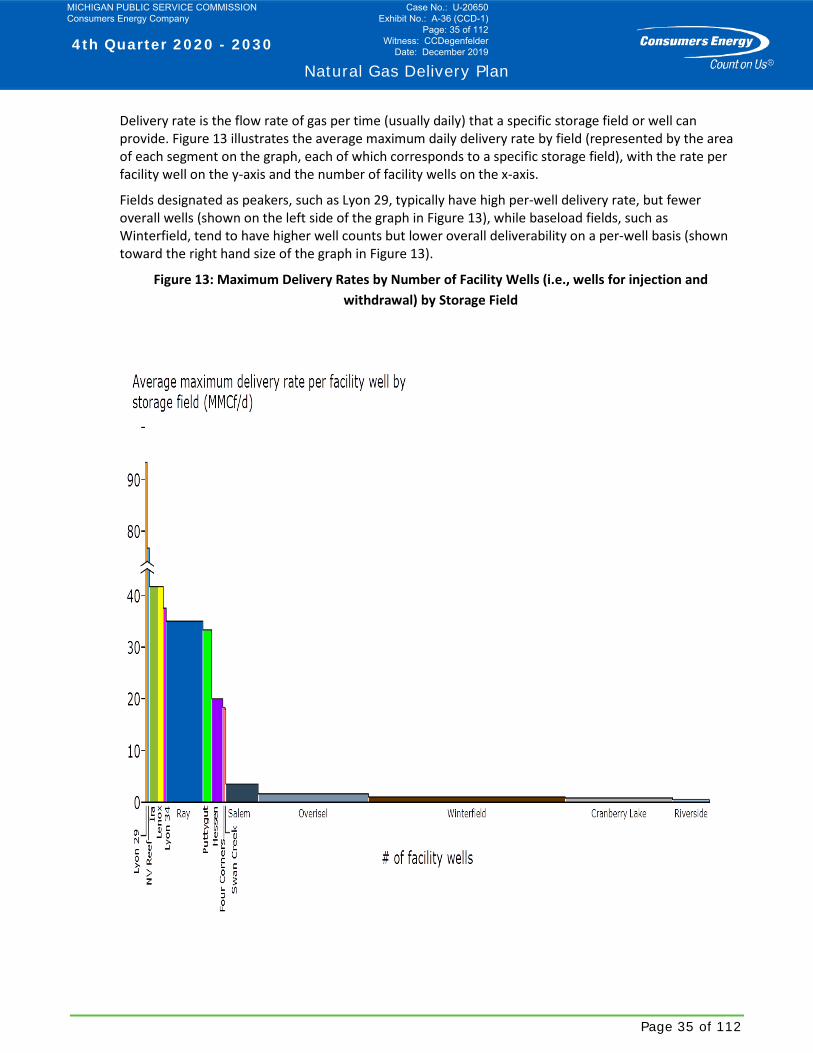
Delivery rate is the flow rate of gas per time (usually daily) that a specific storage field or well can provide. Figure 13 illustrates the average maximum daily delivery rate by field (represented by the area of each segment on the graph, each of which corresponds to a specific storage field), with the rate per facility well on the y-axis and the number of facility wells on the x-axis.
Fields designated as peakers, such as Lyon 29, typically have high per-well delivery rate, but fewer overall wells (shown on the left side of the graph in Figure 13), while baseload fields, such as Winterfield, tend to have higher well counts but lower overall deliverability on a per-well basis (shown toward the right hand size of the graph in Figure 13).
Figure 13: Maximum Delivery Rates by Number of Facility Wells (i.e., wells for injection and withdrawal) by Storage Field
MICHIGAN PUBLIC SERVICE COMMISSION Consumers Energy Company
Case No.: U-20650 Exhibit No.: A-36 (CCD-1)
Page: 35 of 112 Witness: CCDegenfelder
Date: December 2019
4th Quarter 2020 - 2030
Natural Gas Delivery Plan
Page 36 of 112
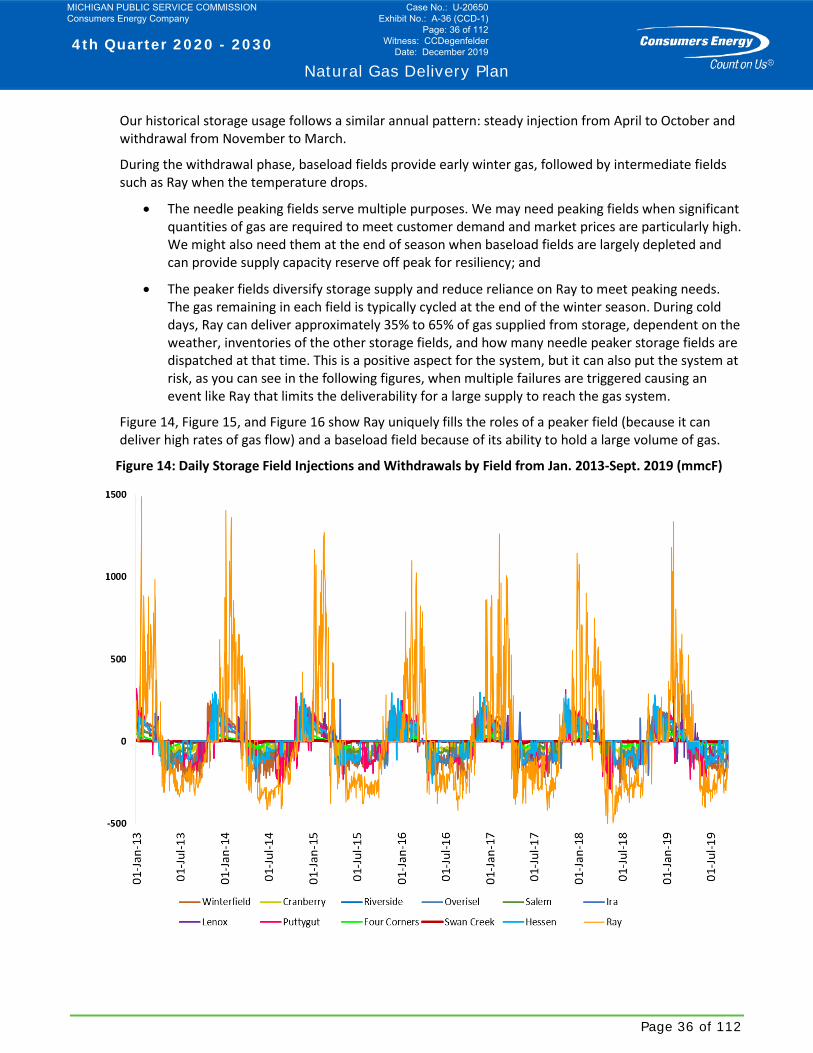
Our historical storage usage follows a similar annual pattern: steady injection from April to October and withdrawal from November to March.
During the withdrawal phase, baseload fields provide early winter gas, followed by intermediate fields such as Ray when the temperature drops.
• The needle peaking fields serve multiple purposes. We may need peaking fields when significant quantities of gas are required to meet customer demand and market prices are particularly high. We might also need them at the end of season when baseload fields are largely depleted and can provide supply capacity reserve off peak for resiliency; and
• The peaker fields diversify storage supply and reduce reliance on Ray to meet peaking needs. The gas remaining in each field is typically cycled at the end of the winter season. During cold days, Ray can deliver approximately 35% to 65% of gas supplied from storage, dependent on the weather, inventories of the other storage fields, and how many needle peaker storage fields are dispatched at that time. This is a positive aspect for the system, but it can also put the system at risk, as you can see in the following figures, when multiple failures are triggered causing an event like Ray that limits the deliverability for a large supply to reach the gas system.
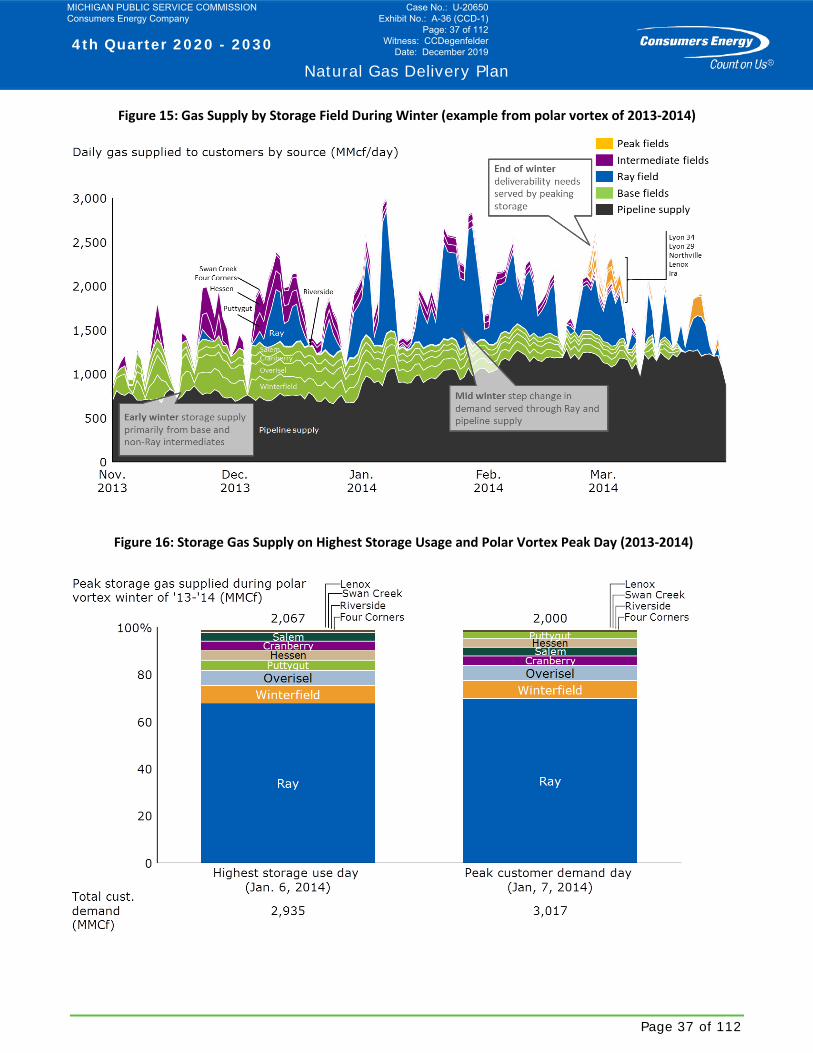
Figure 14, Figure 15, and Figure 16 show Ray uniquely fills the roles of a peaker field (because it can deliver high rates of gas flow) and a baseload field because of its ability to hold a large volume of gas.
Figure 14: Daily Storage Field Injections and Withdrawals by Field from Jan. 2013-Sept. 2019 (mmcF)
MICHIGAN PUBLIC SERVICE COMMISSION Consumers Energy Company
Case No.: U-20650 Exhibit No.: A-36 (CCD-1)
Page: 36 of 112 Witness: CCDegenfelder
Date: December 2019
4th Quarter 2020 - 2030
Natural Gas Delivery Plan
Page 37 of 112
Figure 15: Gas Supply by Storage Field During Winter (example from polar vortex of 2013-2014)
Figure 16: Storage Gas Supply on Highest Storage Usage and Polar Vortex Peak Day (2013-2014)
MICHIGAN PUBLIC SERVICE COMMISSION Consumers Energy Company
Case No.: U-20650 Exhibit No.: A-36 (CCD-1)
Page: 37 of 112 Witness: CCDegenfelder
Date: December 2019

4th Quarter 2020 - 2030
Natural Gas Delivery Plan
Page 38 of 112
C. Storage Well Integrity Program
The key risk in storage field operations is degradation of the well equipment, allowing gas stored in the reservoir below to escape and leak into the surrounding area.
A highly publicized incident occurred in Aliso Canyon, California. As a result, PHMSA adopted the API recommended practice 1171 to established code requirements for storage operators.
Storage asset maintenance involves inspections (i.e., “logging”), repair, rehabilitation and plugging, and decommissioning for wells that provide little or no value to the customer. In addition, new wells with horizontal drilling technology can be added to the system to enhance access to the storage field to replace decommissioned wells.
1. Well Inspections We inspect or log, wells to determine their current state and to assess risk. We have reviewed the requirement outlined in 49 CFR 192.12, and the applicable API RP 1171. These procedures govern: operations, maintenance, integrity demonstration and verification, monitoring, threat and hazard identification, assessment, remediation, site security, emergency response and preparedness, and recordkeeping requirements developed by January 18, 2018, for all existing underground natural gas storage facilities.
• Integrity assessments of underground storage wells began in 2017 to support the anticipated 10-year compliance timeframe for completing all risk management activities, as required in the API RP 1171.
• Based on these new requirements, all wells will have three current logs at the completion of our 10-year remediation program. Figure 17 below outlines the portfolio of wells based on current or outdated/missing log information, highlighting the importance of well inspections going forward.
Figure 17: Breakdown of Storage Wells by Logging History (current vs. outdated or missing)
MICHIGAN PUBLIC SERVICE COMMISSION Consumers Energy Company
Case No.: U-20650 Exhibit No.: A-36 (CCD-1)
Page: 38 of 112 Witness: CCDegenfelder
Date: December 2019

4th Quarter 2020 - 2030
Natural Gas Delivery Plan
Page 39 of 112
2. Well Rehabilitation
We started the 10-year Well Rehabilitation Program in 2017 following a PHMSA interim final rule to address underground storage safety issues.
This program involves remediating wells across our storage portfolio to return them to ‘like-new’ condition and then to comply with a 10-year inspection cycle.
• Primary benefits of the well rehabilitation include safer and more efficient long-term storage operation by reducing risks stemming from factors such as corrosion and gas migration, leaks, and well integrity issues; and
• Rehabilitation also improves well deliverability.
3. New Well Drilling
The purpose of the program is to identify the best locations to drill new wells for our storage assets.
Important considerations include: the sequencing of well logging, remediation, new drilling, and plugging to ensure continued deliverability.
• We plan to take a holistic system view that these activities follow a logical sequence. For example, new well drilling should precede capping and decommissioning, to ensure short-term flow is not compromised.
Options to accelerate drilling should be considered when possible to ensure remediation, new well drilling, and plugging follows an optimal schedule.
• Another benefit of drilling new wells includes centralizing multiple wells to one location. This reduces road maintenance and could reduce, overall storage pipeline lengths; and
• In addition, new wells allow for drilling to current standards and potentially allow for plugging of aging wells that may present higher risk.
4. Well Plugging
Well plugging is performed on certain wells to reduce risk without reducing reliability, deliverability, or cycle capacity.
• Plugging poor-performing, high-risk wells helps to reduce risk to our natural gas system;
• After a well is plugged, we can reduce our land footprint by restoring the area; and
• Plugging a well also reduces methane emissions because fewer wellheads and pipelines minimize the potential for emissions or gas leaks.
MICHIGAN PUBLIC SERVICE COMMISSION Consumers Energy Company
Case No.: U-20650 Exhibit No.: A-36 (CCD-1)
Page: 39 of 112 Witness: CCDegenfelder
Date: December 2019
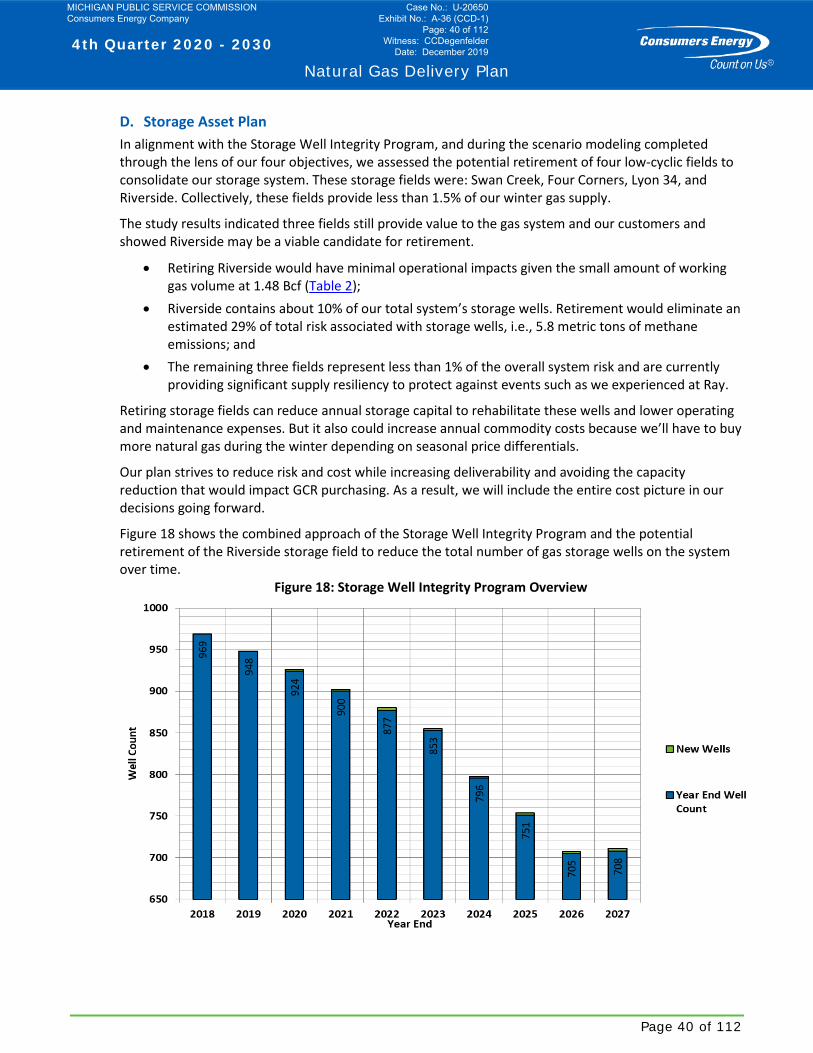
4th Quarter 2020 - 2030
Natural Gas Delivery Plan
Page 40 of 112
D. Storage Asset Plan In alignment with the Storage Well Integrity Program, and during the scenario modeling completed through the lens of our four objectives, we assessed the potential retirement of four low-cyclic fields to consolidate our storage system. These storage fields were: Swan Creek, Four Corners, Lyon 34, and Riverside. Collectively, these fields provide less than 1.5% of our winter gas supply.
The study results indicated three fields still provide value to the gas system and our customers and showed Riverside may be a viable candidate for retirement.
• Retiring Riverside would have minimal operational impacts given the small amount of working gas volume at 1.48 Bcf (Table 2);
• Riverside contains about 10% of our total system’s storage wells. Retirement would eliminate an estimated 29% of total risk associated with storage wells, i.e., 5.8 metric tons of methane emissions; and
• The remaining three fields represent less than 1% of the overall system risk and are currently providing significant supply resiliency to protect against events such as we experienced at Ray.
Retiring storage fields can reduce annual storage capital to rehabilitate these wells and lower operating and maintenance expenses. But it also could increase annual commodity costs because we’ll have to buy more natural gas during the winter depending on seasonal price differentials.
Our plan strives to reduce risk and cost while increasing deliverability and avoiding the capacity reduction that would impact GCR purchasing. As a result, we will include the entire cost picture in our decisions going forward.
Figure 18 shows the combined approach of the Storage Well Integrity Program and the potential retirement of the Riverside storage field to reduce the total number of gas storage wells on the system over time.
Figure 18: Storage Well Integrity Program Overview
MICHIGAN PUBLIC SERVICE COMMISSION Consumers Energy Company
Case No.: U-20650 Exhibit No.: A-36 (CCD-1)
Page: 40 of 112 Witness: CCDegenfelder
Date: December 2019
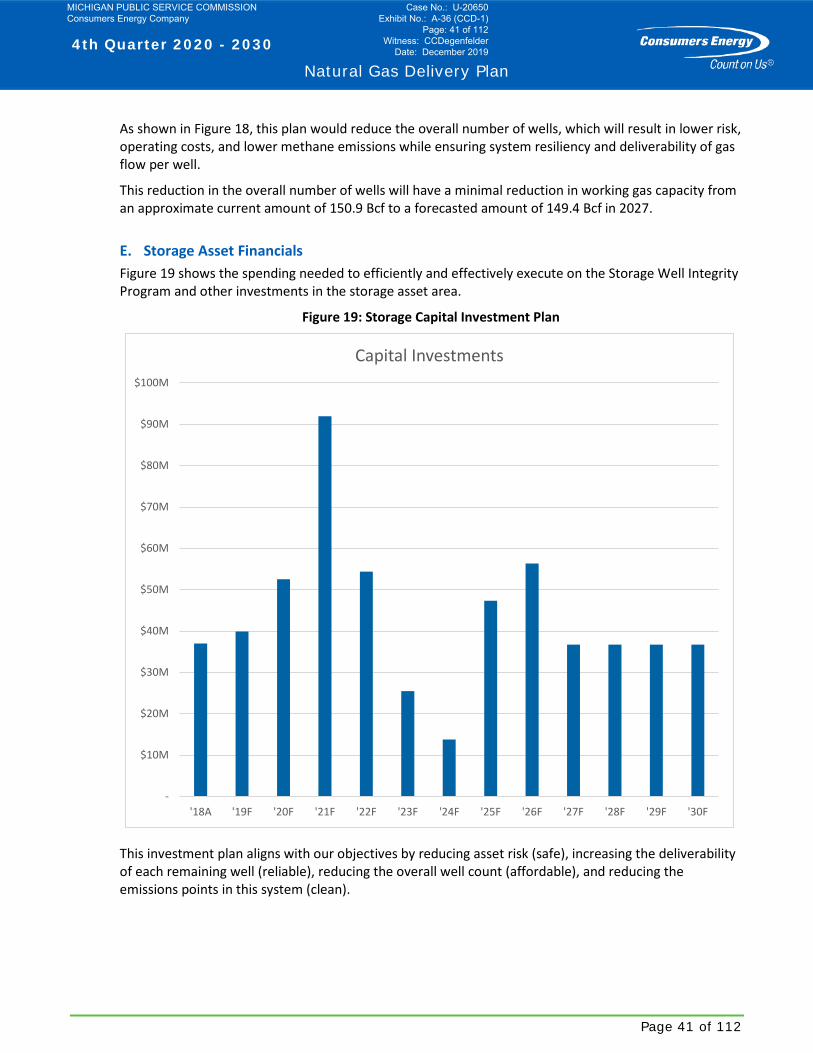
4th Quarter 2020 - 2030
Natural Gas Delivery Plan
Page 41 of 112
As shown in Figure 18, this plan would reduce the overall number of wells, which will result in lower risk, operating costs, and lower methane emissions while ensuring system resiliency and deliverability of gas flow per well.
This reduction in the overall number of wells will have a minimal reduction in working gas capacity from an approximate current amount of 150.9 Bcf to a forecasted amount of 149.4 Bcf in 2027.
E. Storage Asset Financials Figure 19 shows the spending needed to efficiently and effectively execute on the Storage Well Integrity Program and other investments in the storage asset area.
Figure 19: Storage Capital Investment Plan
This investment plan aligns with our objectives by reducing asset risk (safe), increasing the deliverability of each remaining well (reliable), reducing the overall well count (affordable), and reducing the emissions points in this system (clean).
-
$10M
$20M
$30M
$40M
$50M
$60M
$70M
$80M
$90M
$100M
'18A '19F '20F '21F '22F '23F '24F '25F '26F '27F '28F '29F '30F
Capital Investments
MICHIGAN PUBLIC SERVICE COMMISSION Consumers Energy Company
Case No.: U-20650 Exhibit No.: A-36 (CCD-1)
Page: 41 of 112 Witness: CCDegenfelder
Date: December 2019
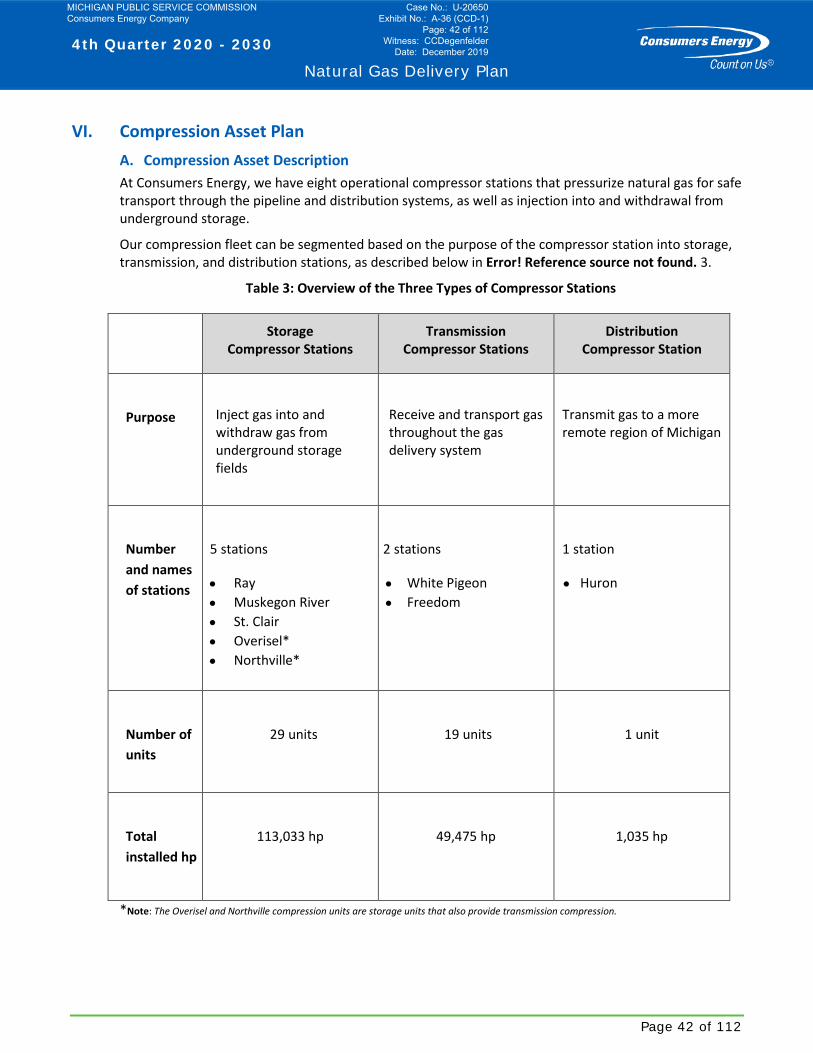
4th Quarter 2020 - 2030
Natural Gas Delivery Plan
Page 42 of 112
VI. Compression Asset Plan A. Compression Asset Description At Consumers Energy, we have eight operational compressor stations that pressurize natural gas for safe transport through the pipeline and distribution systems, as well as injection into and withdrawal from underground storage.
Our compression fleet can be segmented based on the purpose of the compressor station into storage, transmission, and distribution stations, as described below in Error! Reference source not found. 3.
Table 3: Overview of the Three Types of Compressor Stations
*Note: The Overisel and Northville compression units are storage units that also provide transmission compression.
Storage Compressor Stations
Transmission Compressor Stations
Distribution Compressor Station
Purpose
Inject gas into and withdraw gas from underground storage fields
Receive and transport gas throughout the gas delivery system
Transmit gas to a more remote region of Michigan
Number and names of stations
5 stations
• Ray • Muskegon River • St. Clair • Overisel* • Northville*
2 stations
• White Pigeon • Freedom
1 station
• Huron
Number of units
29 units
19 units
1 unit
Total installed hp
113,033 hp
49,475 hp
1,035 hp
MICHIGAN PUBLIC SERVICE COMMISSION Consumers Energy Company
Case No.: U-20650 Exhibit No.: A-36 (CCD-1)
Page: 42 of 112 Witness: CCDegenfelder
Date: December 2019
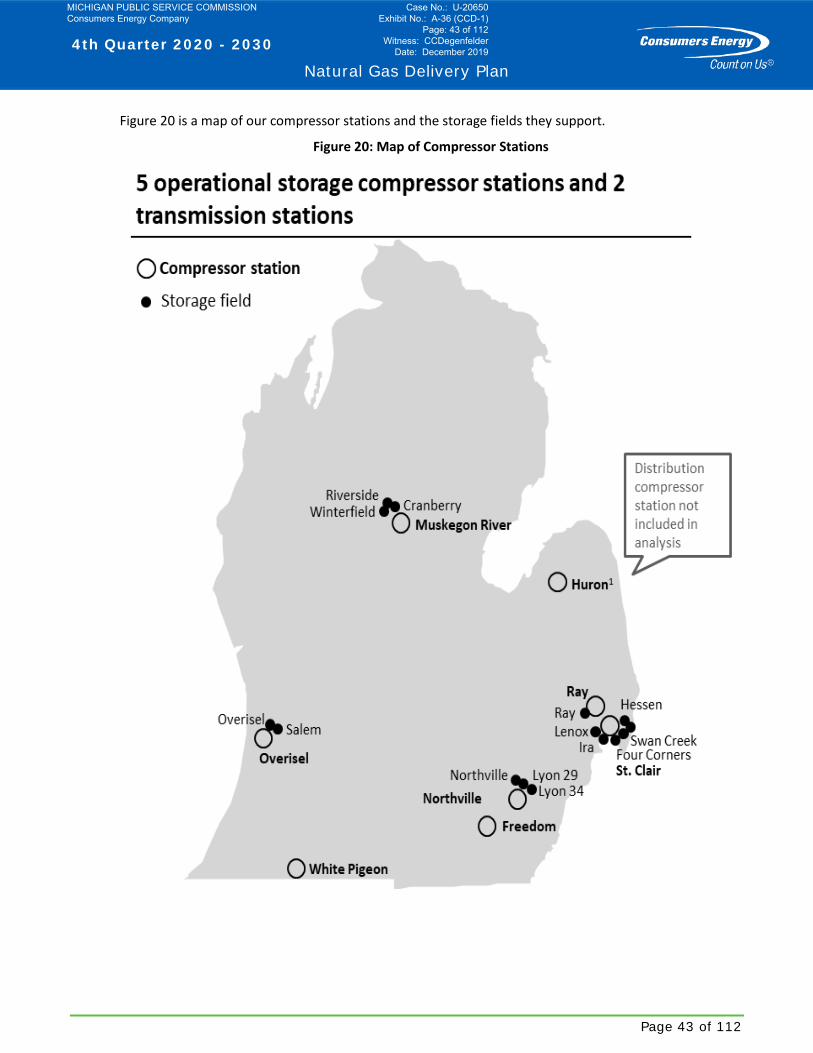
4th Quarter 2020 - 2030
Natural Gas Delivery Plan
Page 43 of 112
Figure 20 is a map of our compressor stations and the storage fields they support.
Figure 20: Map of Compressor Stations
MICHIGAN PUBLIC SERVICE COMMISSION Consumers Energy Company
Case No.: U-20650 Exhibit No.: A-36 (CCD-1)
Page: 43 of 112 Witness: CCDegenfelder
Date: December 2019
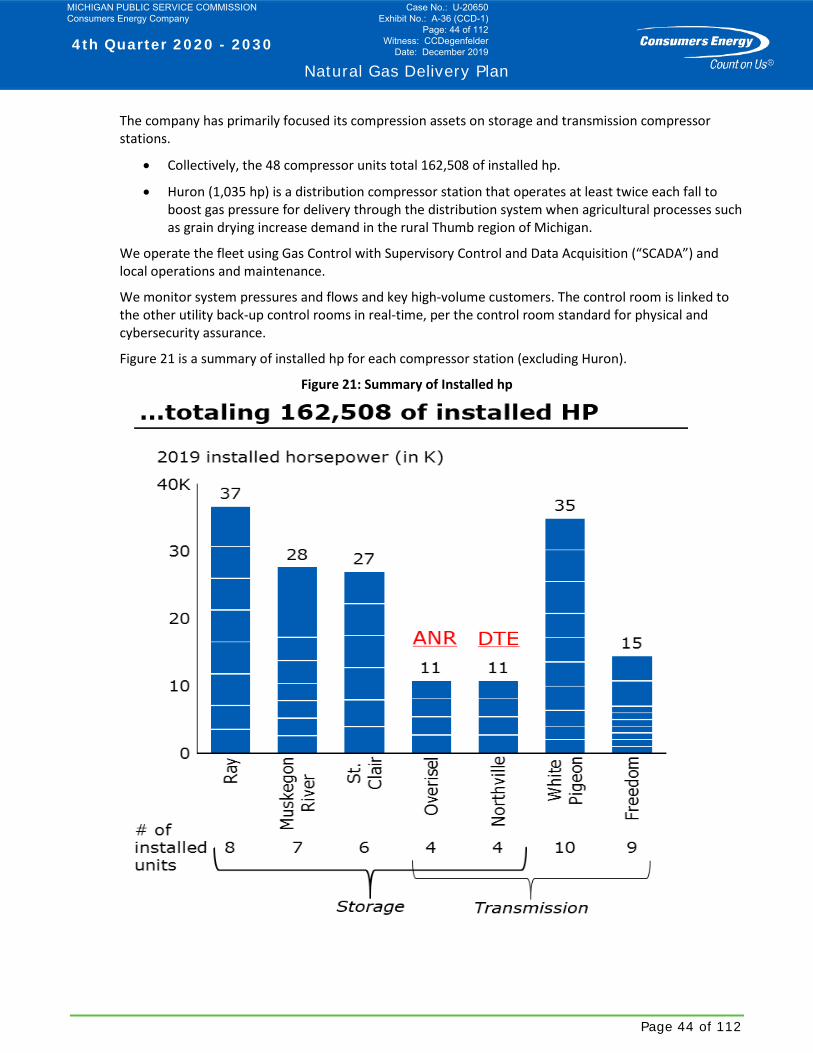
4th Quarter 2020 - 2030
Natural Gas Delivery Plan
Page 44 of 112
The company has primarily focused its compression assets on storage and transmission compressor stations.
• Collectively, the 48 compressor units total 162,508 of installed hp.
• Huron (1,035 hp) is a distribution compressor station that operates at least twice each fall to boost gas pressure for delivery through the distribution system when agricultural processes such as grain drying increase demand in the rural Thumb region of Michigan.
We operate the fleet using Gas Control with Supervisory Control and Data Acquisition (“SCADA”) and local operations and maintenance.
We monitor system pressures and flows and key high-volume customers. The control room is linked to the other utility back-up control rooms in real-time, per the control room standard for physical and cybersecurity assurance.
Figure 21 is a summary of installed hp for each compressor station (excluding Huron).
Figure 21: Summary of Installed hp
MICHIGAN PUBLIC SERVICE COMMISSION Consumers Energy Company
Case No.: U-20650 Exhibit No.: A-36 (CCD-1)
Page: 44 of 112 Witness: CCDegenfelder
Date: December 2019
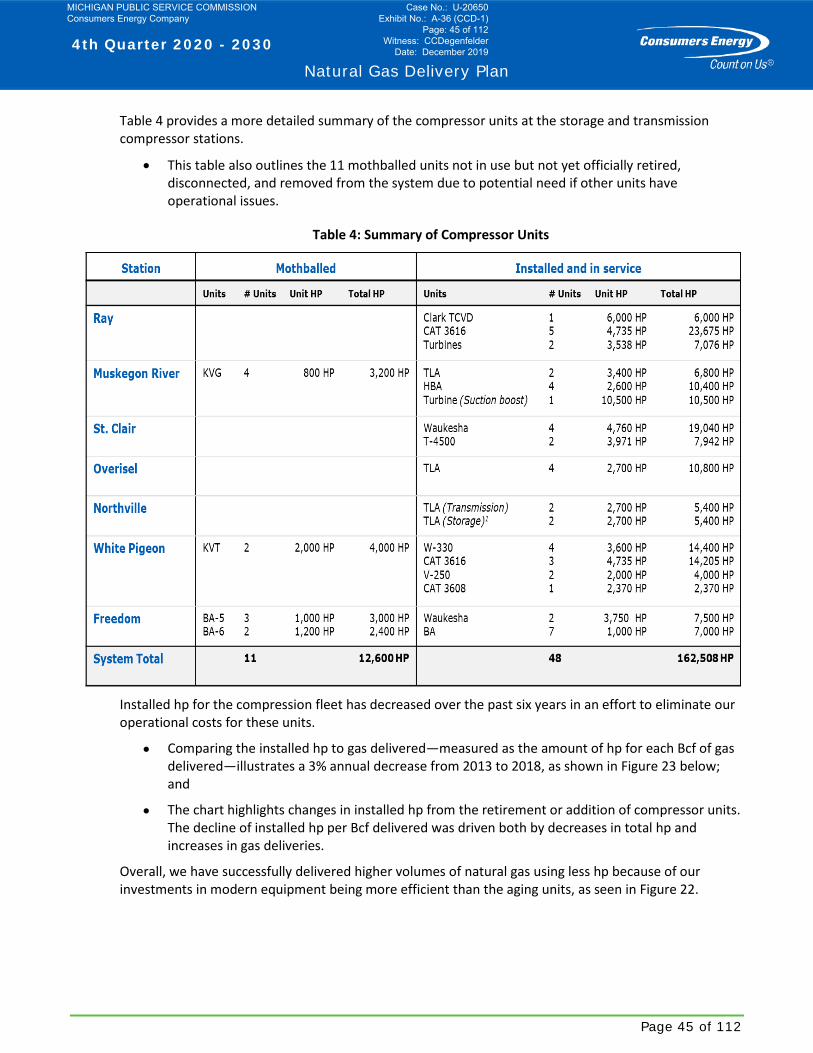
4th Quarter 2020 - 2030
Natural Gas Delivery Plan
Page 45 of 112
Table 4 provides a more detailed summary of the compressor units at the storage and transmission compressor stations.
• This table also outlines the 11 mothballed units not in use but not yet officially retired, disconnected, and removed from the system due to potential need if other units have operational issues.
Table 4: Summary of Compressor Units
Installed hp for the compression fleet has decreased over the past six years in an effort to eliminate our operational costs for these units.
• Comparing the installed hp to gas delivered—measured as the amount of hp for each Bcf of gas delivered—illustrates a 3% annual decrease from 2013 to 2018, as shown in Figure 23 below; and
• The chart highlights changes in installed hp from the retirement or addition of compressor units. The decline of installed hp per Bcf delivered was driven both by decreases in total hp and increases in gas deliveries.
Overall, we have successfully delivered higher volumes of natural gas using less hp because of our investments in modern equipment being more efficient than the aging units, as seen in Figure 22.
MICHIGAN PUBLIC SERVICE COMMISSION Consumers Energy Company
Case No.: U-20650 Exhibit No.: A-36 (CCD-1)
Page: 45 of 112 Witness: CCDegenfelder
Date: December 2019

4th Quarter 2020 - 2030
Natural Gas Delivery Plan
Page 46 of 112
Figure 22: Installed hp per Bcf of Gas Delivered
B. Compression Asset Management
Our 2018 system weighted average compression utilization of 21% is below industry average of about 50%. The utilization rate is a simple calculation using the amount of time that a compression unit is available to operate rather than the time the unit was designed to operate, which would be a more meaningful measure of the assets utilization in the future and will likely result in this current utilization metric changing over time to better communicate the status and forecast the necessary outcomes.
Overall, we don’t anticipate our compression assets having a utilization rate as high as the industry average due to the uniqueness of the Company’s natural gas system. The Company’s compression assets are used more to serve the seasonal needs of the Company’s storage assets, both for injection and withdrawal. Another consideration, given the locational supply flexibility offered by the Company’s natural gas system, is that interstate pipeline supply focused compression may fall below industry average utilization depending on market pricing conditions.
However, we do believe that an increase from our current 21% is possible, and can be achieved, through our work to improve the reliability of our compression stations and allowing the retirement of some
MICHIGAN PUBLIC SERVICE COMMISSION Consumers Energy Company
Case No.: U-20650 Exhibit No.: A-36 (CCD-1)
Page: 46 of 112 Witness: CCDegenfelder
Date: December 2019
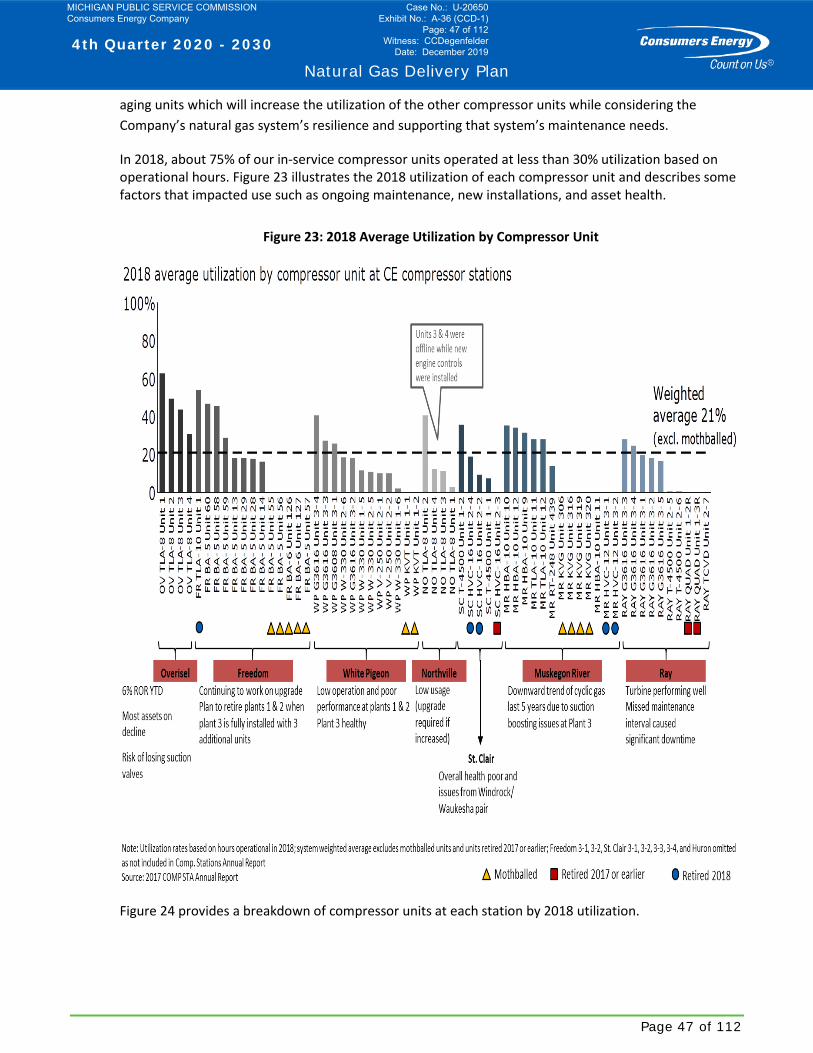
4th Quarter 2020 - 2030
Natural Gas Delivery Plan
Page 47 of 112
aging units which will increase the utilization of the other compressor units while considering the Company’s natural gas system’s resilience and supporting that system’s maintenance needs.
In 2018, about 75% of our in-service compressor units operated at less than 30% utilization based on operational hours. Figure 23 illustrates the 2018 utilization of each compressor unit and describes some factors that impacted use such as ongoing maintenance, new installations, and asset health.
Figure 23: 2018 Average Utilization by Compressor Unit
Figure 24 provides a breakdown of compressor units at each station by 2018 utilization.
MICHIGAN PUBLIC SERVICE COMMISSION Consumers Energy Company
Case No.: U-20650 Exhibit No.: A-36 (CCD-1)
Page: 47 of 112 Witness: CCDegenfelder
Date: December 2019
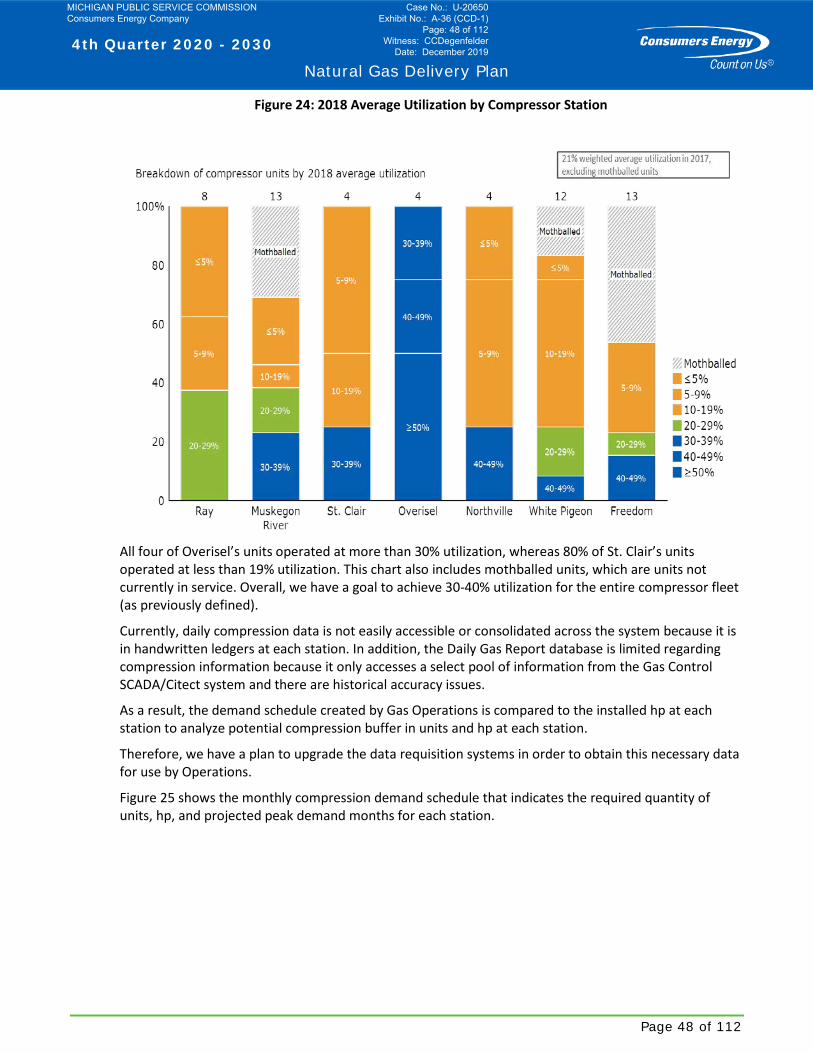
4th Quarter 2020 - 2030
Natural Gas Delivery Plan
Page 48 of 112
Figure 24: 2018 Average Utilization by Compressor Station
All four of Overisel’s units operated at more than 30% utilization, whereas 80% of St. Clair’s units operated at less than 19% utilization. This chart also includes mothballed units, which are units not currently in service. Overall, we have a goal to achieve 30-40% utilization for the entire compressor fleet (as previously defined).
Currently, daily compression data is not easily accessible or consolidated across the system because it is in handwritten ledgers at each station. In addition, the Daily Gas Report database is limited regarding compression information because it only accesses a select pool of information from the Gas Control SCADA/Citect system and there are historical accuracy issues.
As a result, the demand schedule created by Gas Operations is compared to the installed hp at each station to analyze potential compression buffer in units and hp at each station.
Therefore, we have a plan to upgrade the data requisition systems in order to obtain this necessary data for use by Operations.
Figure 25 shows the monthly compression demand schedule that indicates the required quantity of units, hp, and projected peak demand months for each station.
MICHIGAN PUBLIC SERVICE COMMISSION Consumers Energy Company
Case No.: U-20650 Exhibit No.: A-36 (CCD-1)
Page: 48 of 112 Witness: CCDegenfelder
Date: December 2019
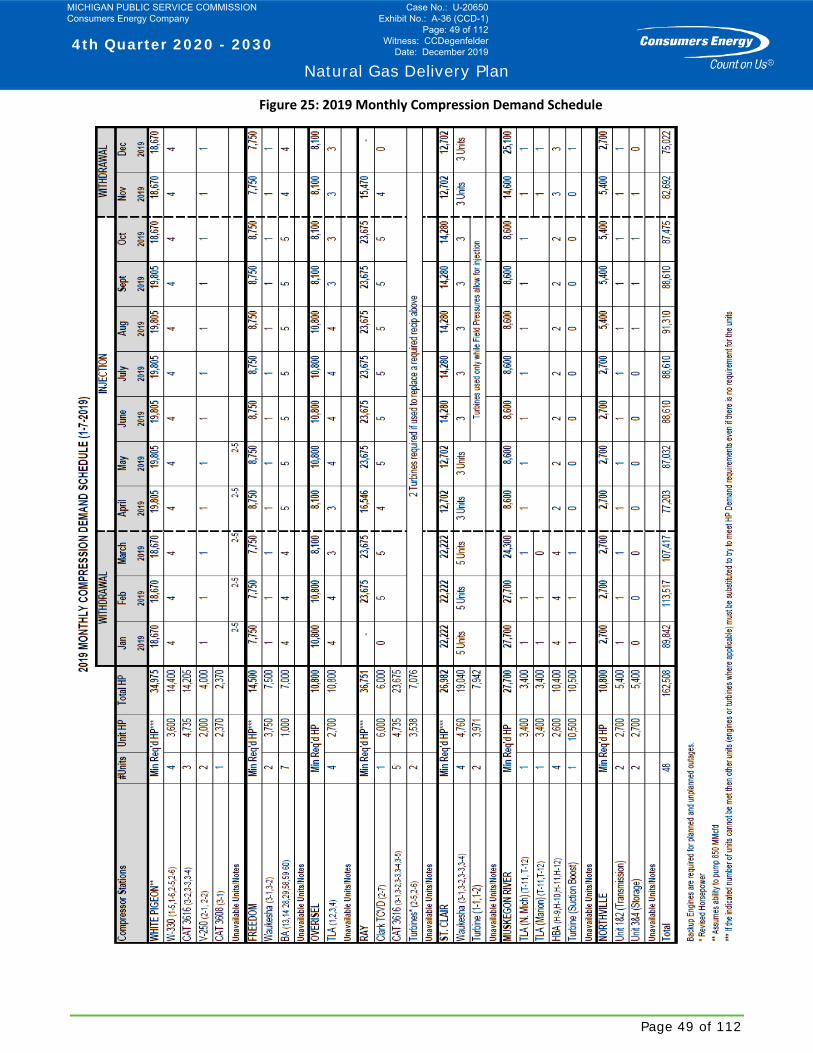
4th Quarter 2020 - 2030
Natural Gas Delivery Plan
Page 49 of 112
Figure 25: 2019 Monthly Compression Demand Schedule
MICHIGAN PUBLIC SERVICE COMMISSION Consumers Energy Company
Case No.: U-20650 Exhibit No.: A-36 (CCD-1)
Page: 49 of 112 Witness: CCDegenfelder
Date: December 2019
4th Quarter 2020 - 2030
Natural Gas Delivery Plan
Page 50 of 112
Figure 26 indicates how many units are required monthly from each ‘grouping’ of units designed to operate in the same conditions (i.e., suction and discharge pressures).
The compressor station hp probability distributions used to create the demand schedule were developed using the convolution mathematical method.
The probability distribution curves reflect the level of confidence that the compression equipment will meet the performance criteria. The hp probability requirements were initially set at 95% to include a 5% risk tolerance. Specific probability requirements at each station were then adjusted based on:
• Function of individual engines by station and the potential consequence of not meeting the hp requirement;
• Risk and magnitude of consequence of potential demand curtailments; and
• Specific probability requirements of engine units at Muskegon River.
The demand schedule highlights the variation in monthly peak demands for storage and transmission compressor stations. In general, storage compressor stations tend to have greater variability in hp requirements month-to-month as they are used to meet summer injection and winter withdrawal needs.
The lower hp utilization at St. Clair and Ray reflects the winter peaking services those facilities provide.
• High utilization of most of the hp typically occurs when those facilities are peaking to support late season high demand winter days, primarily in February and March, when other fields are nearing depletion; and
• Late season high demand days are not frequent, and thus the utilization is low comparatively. That hp is necessary for supply reliability in meeting design winter conditions. It offsets the need to procure large quantities of more expensive pipeline transportation and supply during the winter.
Growing peak day demands, including those that may be associated with gas fired generation are expected to primarily be met with our peaking storage at Northville, St. Clair, and Ray, given their high deliverability characteristics.
• To manage our reliance on Ray, and to support the system resilience, hp is needed to refill Northville and St. Clair after a peak demand period in the winter to facilitate more frequent cycling of the needle peakers; and
• The lower utilization at White Pigeon reflects market conditions and locational pricing that is currently more favorable for supply to be received through Freedom.
Swings in utilization at the transmission facilities will vary with market conditions and planned and unplanned upstream facility outages. Maintaining access to supply and flexibility for changes in the location in supply helps keep consumer market prices lower.
MICHIGAN PUBLIC SERVICE COMMISSION Consumers Energy Company
Case No.: U-20650 Exhibit No.: A-36 (CCD-1)
Page: 50 of 112 Witness: CCDegenfelder
Date: December 2019
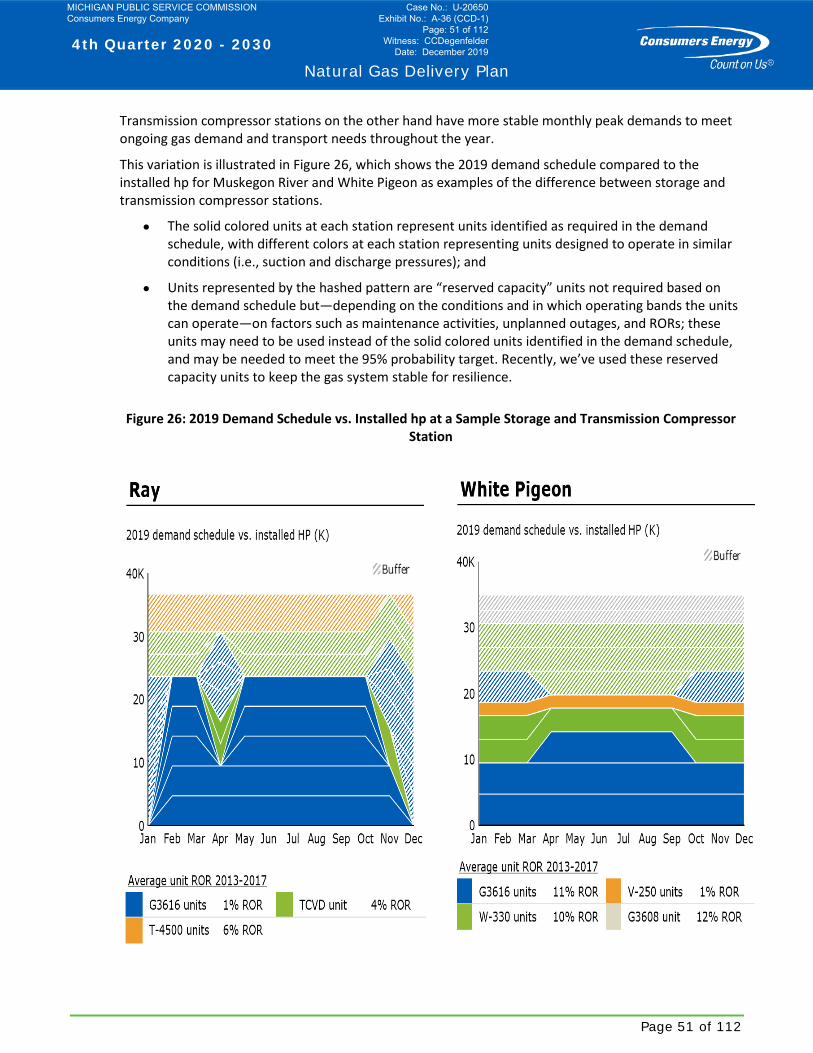
4th Quarter 2020 - 2030
Natural Gas Delivery Plan
Page 51 of 112
Transmission compressor stations on the other hand have more stable monthly peak demands to meet ongoing gas demand and transport needs throughout the year.
This variation is illustrated in Figure 26, which shows the 2019 demand schedule compared to the installed hp for Muskegon River and White Pigeon as examples of the difference between storage and transmission compressor stations.
• The solid colored units at each station represent units identified as required in the demand schedule, with different colors at each station representing units designed to operate in similar conditions (i.e., suction and discharge pressures); and
• Units represented by the hashed pattern are “reserved capacity” units not required based on the demand schedule but—depending on the conditions and in which operating bands the units can operate—on factors such as maintenance activities, unplanned outages, and RORs; these units may need to be used instead of the solid colored units identified in the demand schedule, and may be needed to meet the 95% probability target. Recently, we’ve used these reserved capacity units to keep the gas system stable for resilience.
Figure 26: 2019 Demand Schedule vs. Installed hp at a Sample Storage and Transmission Compressor Station
MICHIGAN PUBLIC SERVICE COMMISSION Consumers Energy Company
Case No.: U-20650 Exhibit No.: A-36 (CCD-1)
Page: 51 of 112 Witness: CCDegenfelder
Date: December 2019
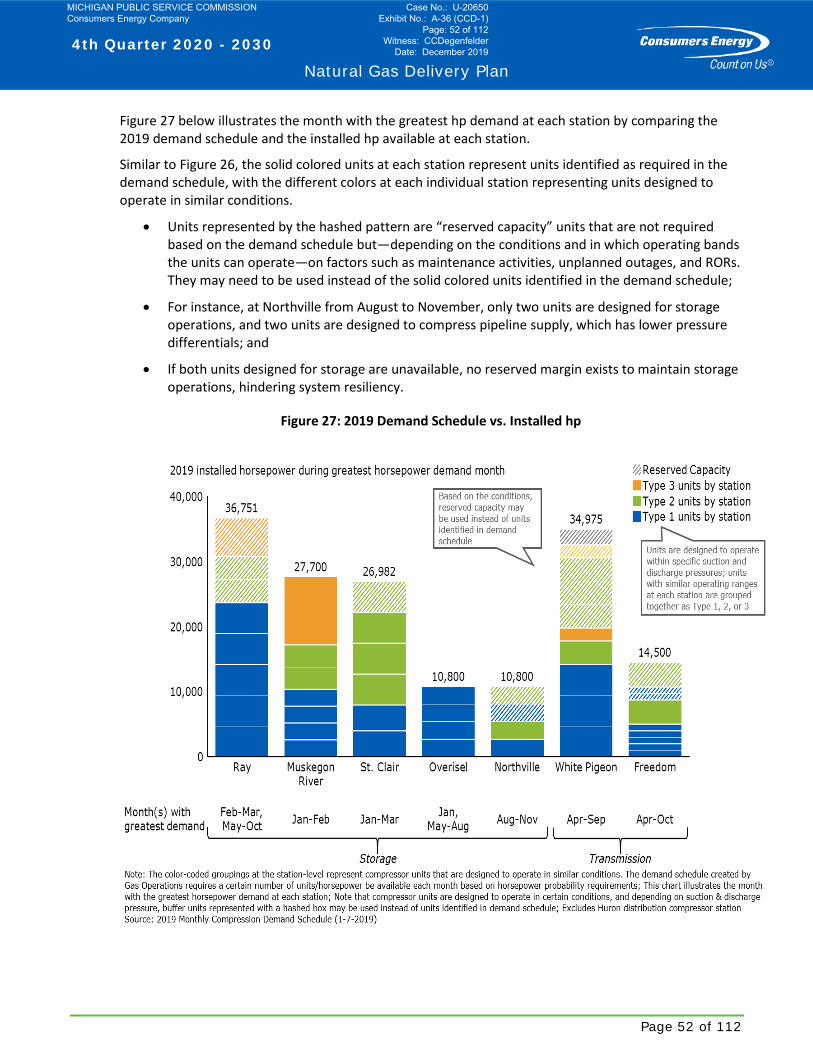
4th Quarter 2020 - 2030
Natural Gas Delivery Plan
Page 52 of 112
Figure 27 below illustrates the month with the greatest hp demand at each station by comparing the 2019 demand schedule and the installed hp available at each station.
Similar to Figure 26, the solid colored units at each station represent units identified as required in the demand schedule, with the different colors at each individual station representing units designed to operate in similar conditions.
• Units represented by the hashed pattern are “reserved capacity” units that are not required based on the demand schedule but—depending on the conditions and in which operating bands the units can operate—on factors such as maintenance activities, unplanned outages, and RORs. They may need to be used instead of the solid colored units identified in the demand schedule;
• For instance, at Northville from August to November, only two units are designed for storage operations, and two units are designed to compress pipeline supply, which has lower pressure differentials; and
• If both units designed for storage are unavailable, no reserved margin exists to maintain storage operations, hindering system resiliency.
Figure 27: 2019 Demand Schedule vs. Installed hp
MICHIGAN PUBLIC SERVICE COMMISSION Consumers Energy Company
Case No.: U-20650 Exhibit No.: A-36 (CCD-1)
Page: 52 of 112 Witness: CCDegenfelder
Date: December 2019
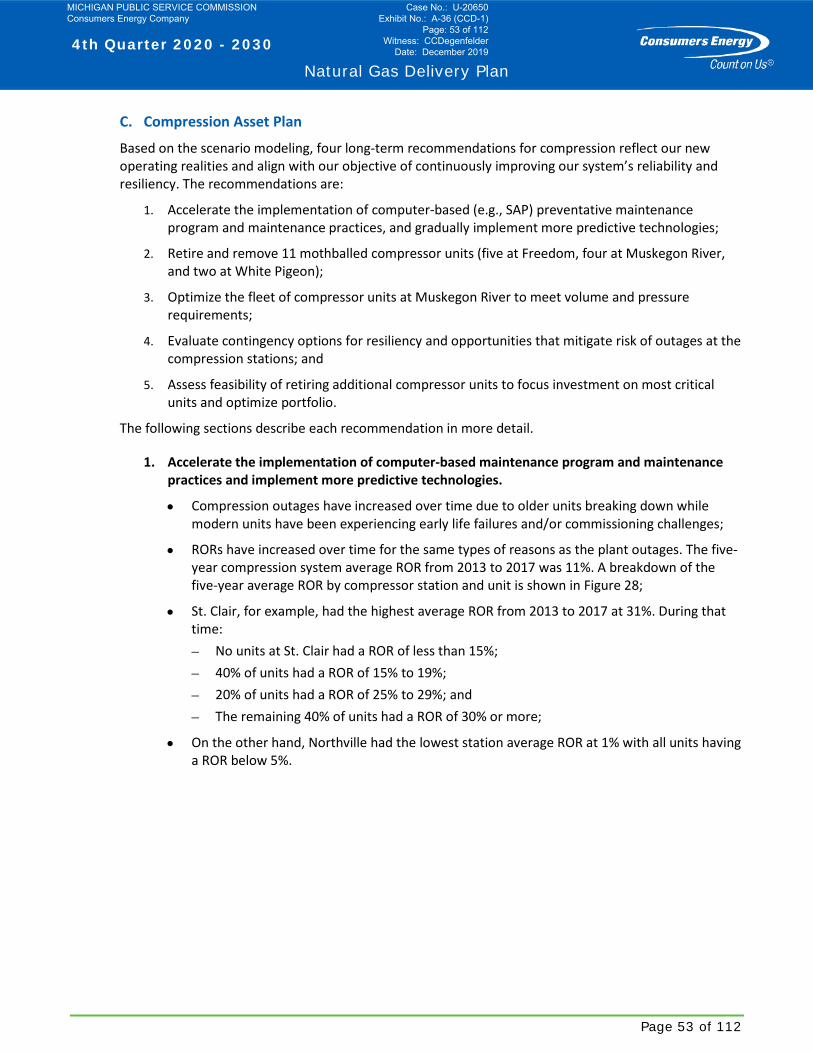
4th Quarter 2020 - 2030
Natural Gas Delivery Plan
Page 53 of 112
C. Compression Asset Plan
Based on the scenario modeling, four long-term recommendations for compression reflect our new operating realities and align with our objective of continuously improving our system’s reliability and resiliency. The recommendations are:
1. Accelerate the implementation of computer-based (e.g., SAP) preventative maintenance program and maintenance practices, and gradually implement more predictive technologies;
2. Retire and remove 11 mothballed compressor units (five at Freedom, four at Muskegon River, and two at White Pigeon);
3. Optimize the fleet of compressor units at Muskegon River to meet volume and pressure requirements;
4. Evaluate contingency options for resiliency and opportunities that mitigate risk of outages at the compression stations; and
5. Assess feasibility of retiring additional compressor units to focus investment on most critical units and optimize portfolio.
The following sections describe each recommendation in more detail.
1. Accelerate the implementation of computer-based maintenance program and maintenance practices and implement more predictive technologies.
• Compression outages have increased over time due to older units breaking down while modern units have been experiencing early life failures and/or commissioning challenges;
• RORs have increased over time for the same types of reasons as the plant outages. The five-year compression system average ROR from 2013 to 2017 was 11%. A breakdown of the five-year average ROR by compressor station and unit is shown in Figure 28;
• St. Clair, for example, had the highest average ROR from 2013 to 2017 at 31%. During that time: − No units at St. Clair had a ROR of less than 15%; − 40% of units had a ROR of 15% to 19%; − 20% of units had a ROR of 25% to 29%; and − The remaining 40% of units had a ROR of 30% or more;
• On the other hand, Northville had the lowest station average ROR at 1% with all units having a ROR below 5%.
MICHIGAN PUBLIC SERVICE COMMISSION Consumers Energy Company
Case No.: U-20650 Exhibit No.: A-36 (CCD-1)
Page: 53 of 112 Witness: CCDegenfelder
Date: December 2019
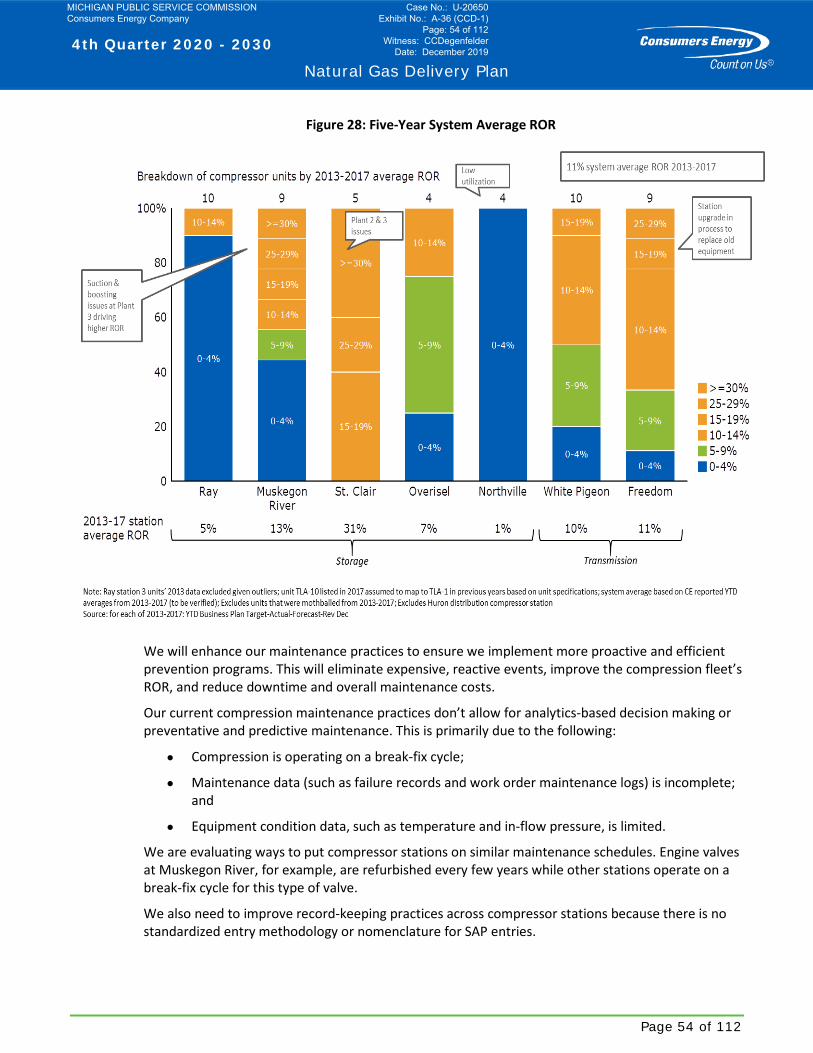
4th Quarter 2020 - 2030
Natural Gas Delivery Plan
Page 54 of 112
Figure 28: Five-Year System Average ROR
We will enhance our maintenance practices to ensure we implement more proactive and efficient prevention programs. This will eliminate expensive, reactive events, improve the compression fleet’s ROR, and reduce downtime and overall maintenance costs.
Our current compression maintenance practices don’t allow for analytics-based decision making or preventative and predictive maintenance. This is primarily due to the following:
• Compression is operating on a break-fix cycle;
• Maintenance data (such as failure records and work order maintenance logs) is incomplete; and
• Equipment condition data, such as temperature and in-flow pressure, is limited.
We are evaluating ways to put compressor stations on similar maintenance schedules. Engine valves at Muskegon River, for example, are refurbished every few years while other stations operate on a break-fix cycle for this type of valve.
We also need to improve record-keeping practices across compressor stations because there is no standardized entry methodology or nomenclature for SAP entries.
MICHIGAN PUBLIC SERVICE COMMISSION Consumers Energy Company
Case No.: U-20650 Exhibit No.: A-36 (CCD-1)
Page: 54 of 112 Witness: CCDegenfelder
Date: December 2019
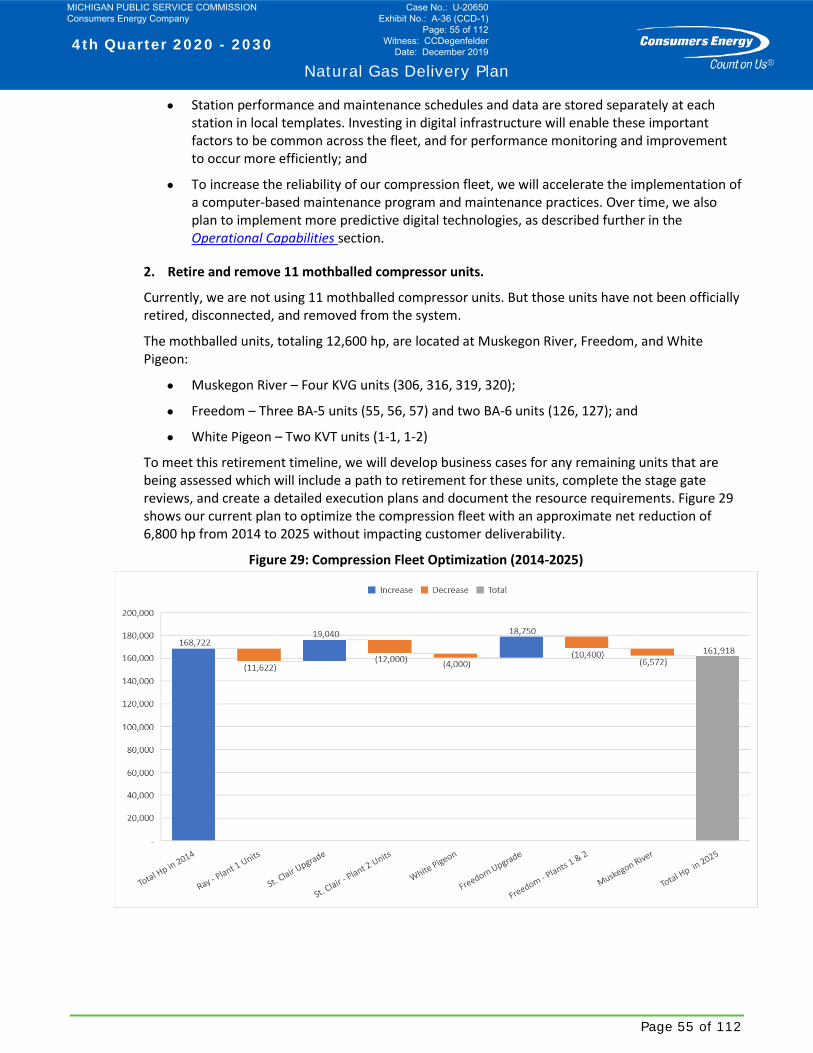
4th Quarter 2020 - 2030
Natural Gas Delivery Plan
Page 55 of 112
• Station performance and maintenance schedules and data are stored separately at each station in local templates. Investing in digital infrastructure will enable these important factors to be common across the fleet, and for performance monitoring and improvement to occur more efficiently; and
• To increase the reliability of our compression fleet, we will accelerate the implementation of a computer-based maintenance program and maintenance practices. Over time, we also plan to implement more predictive digital technologies, as described further in the Operational Capabilities section.
2. Retire and remove 11 mothballed compressor units.
Currently, we are not using 11 mothballed compressor units. But those units have not been officially retired, disconnected, and removed from the system.
The mothballed units, totaling 12,600 hp, are located at Muskegon River, Freedom, and White Pigeon:
• Muskegon River – Four KVG units (306, 316, 319, 320);
• Freedom – Three BA-5 units (55, 56, 57) and two BA-6 units (126, 127); and
• White Pigeon – Two KVT units (1-1, 1-2)
To meet this retirement timeline, we will develop business cases for any remaining units that are being assessed which will include a path to retirement for these units, complete the stage gate reviews, and create a detailed execution plans and document the resource requirements. Figure 29 shows our current plan to optimize the compression fleet with an approximate net reduction of 6,800 hp from 2014 to 2025 without impacting customer deliverability.
Figure 29: Compression Fleet Optimization (2014-2025)
MICHIGAN PUBLIC SERVICE COMMISSION Consumers Energy Company
Case No.: U-20650 Exhibit No.: A-36 (CCD-1)
Page: 55 of 112 Witness: CCDegenfelder
Date: December 2019
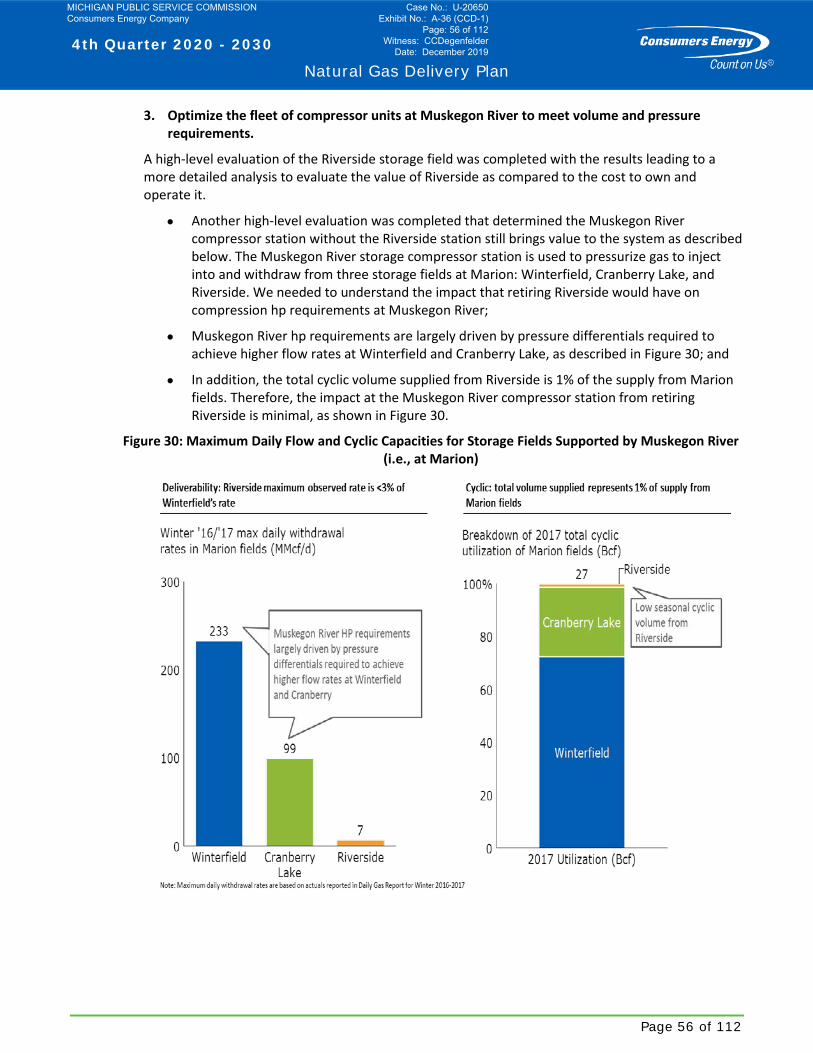
4th Quarter 2020 - 2030
Natural Gas Delivery Plan
Page 56 of 112
3. Optimize the fleet of compressor units at Muskegon River to meet volume and pressure requirements.
A high-level evaluation of the Riverside storage field was completed with the results leading to a more detailed analysis to evaluate the value of Riverside as compared to the cost to own and operate it.
• Another high-level evaluation was completed that determined the Muskegon River compressor station without the Riverside station still brings value to the system as described below. The Muskegon River storage compressor station is used to pressurize gas to inject into and withdraw from three storage fields at Marion: Winterfield, Cranberry Lake, and Riverside. We needed to understand the impact that retiring Riverside would have on compression hp requirements at Muskegon River;
• Muskegon River hp requirements are largely driven by pressure differentials required to achieve higher flow rates at Winterfield and Cranberry Lake, as described in Figure 30; and
• In addition, the total cyclic volume supplied from Riverside is 1% of the supply from Marion fields. Therefore, the impact at the Muskegon River compressor station from retiring Riverside is minimal, as shown in Figure 30.
Figure 30: Maximum Daily Flow and Cyclic Capacities for Storage Fields Supported by Muskegon River (i.e., at Marion)
MICHIGAN PUBLIC SERVICE COMMISSION Consumers Energy Company
Case No.: U-20650 Exhibit No.: A-36 (CCD-1)
Page: 56 of 112 Witness: CCDegenfelder
Date: December 2019
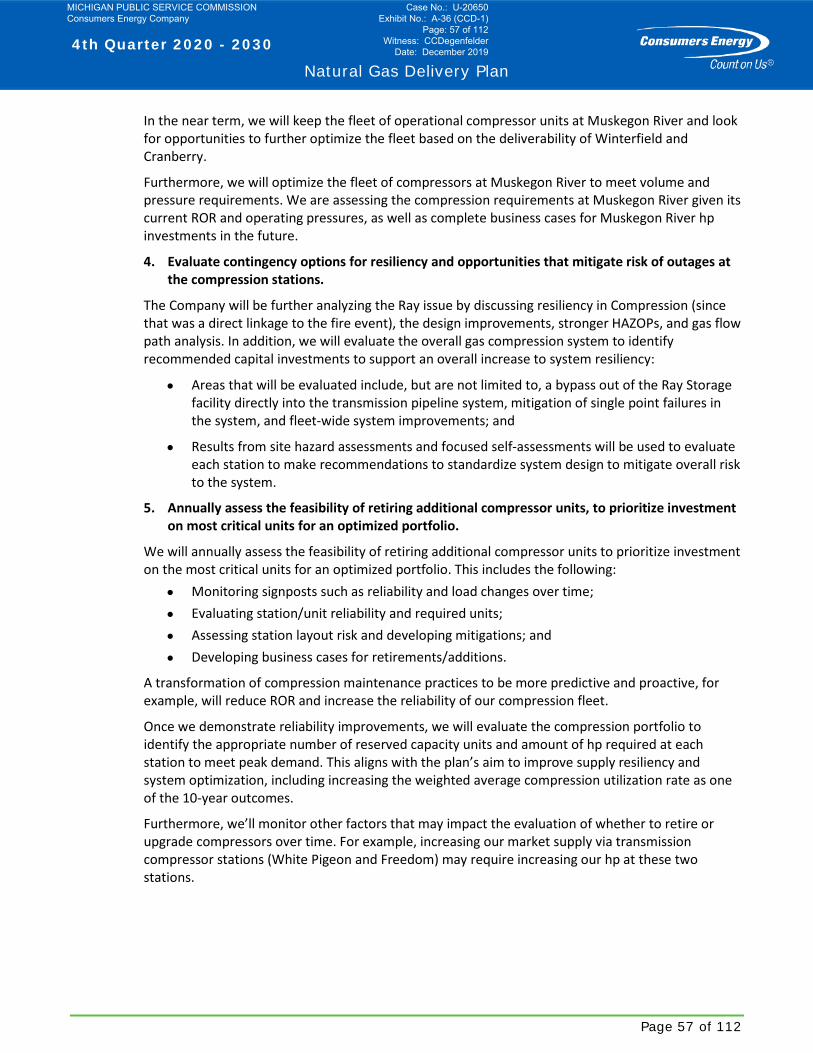
4th Quarter 2020 - 2030
Natural Gas Delivery Plan
Page 57 of 112
In the near term, we will keep the fleet of operational compressor units at Muskegon River and look for opportunities to further optimize the fleet based on the deliverability of Winterfield and Cranberry.
Furthermore, we will optimize the fleet of compressors at Muskegon River to meet volume and pressure requirements. We are assessing the compression requirements at Muskegon River given its current ROR and operating pressures, as well as complete business cases for Muskegon River hp investments in the future.
4. Evaluate contingency options for resiliency and opportunities that mitigate risk of outages at the compression stations.
The Company will be further analyzing the Ray issue by discussing resiliency in Compression (since that was a direct linkage to the fire event), the design improvements, stronger HAZOPs, and gas flow path analysis. In addition, we will evaluate the overall gas compression system to identify recommended capital investments to support an overall increase to system resiliency:
• Areas that will be evaluated include, but are not limited to, a bypass out of the Ray Storage facility directly into the transmission pipeline system, mitigation of single point failures in the system, and fleet-wide system improvements; and
• Results from site hazard assessments and focused self-assessments will be used to evaluate each station to make recommendations to standardize system design to mitigate overall risk to the system.
5. Annually assess the feasibility of retiring additional compressor units, to prioritize investment on most critical units for an optimized portfolio.
We will annually assess the feasibility of retiring additional compressor units to prioritize investment on the most critical units for an optimized portfolio. This includes the following:
• Monitoring signposts such as reliability and load changes over time; • Evaluating station/unit reliability and required units; • Assessing station layout risk and developing mitigations; and • Developing business cases for retirements/additions.
A transformation of compression maintenance practices to be more predictive and proactive, for example, will reduce ROR and increase the reliability of our compression fleet.
Once we demonstrate reliability improvements, we will evaluate the compression portfolio to identify the appropriate number of reserved capacity units and amount of hp required at each station to meet peak demand. This aligns with the plan’s aim to improve supply resiliency and system optimization, including increasing the weighted average compression utilization rate as one of the 10-year outcomes.
Furthermore, we’ll monitor other factors that may impact the evaluation of whether to retire or upgrade compressors over time. For example, increasing our market supply via transmission compressor stations (White Pigeon and Freedom) may require increasing our hp at these two stations.
MICHIGAN PUBLIC SERVICE COMMISSION Consumers Energy Company
Case No.: U-20650 Exhibit No.: A-36 (CCD-1)
Page: 57 of 112 Witness: CCDegenfelder
Date: December 2019
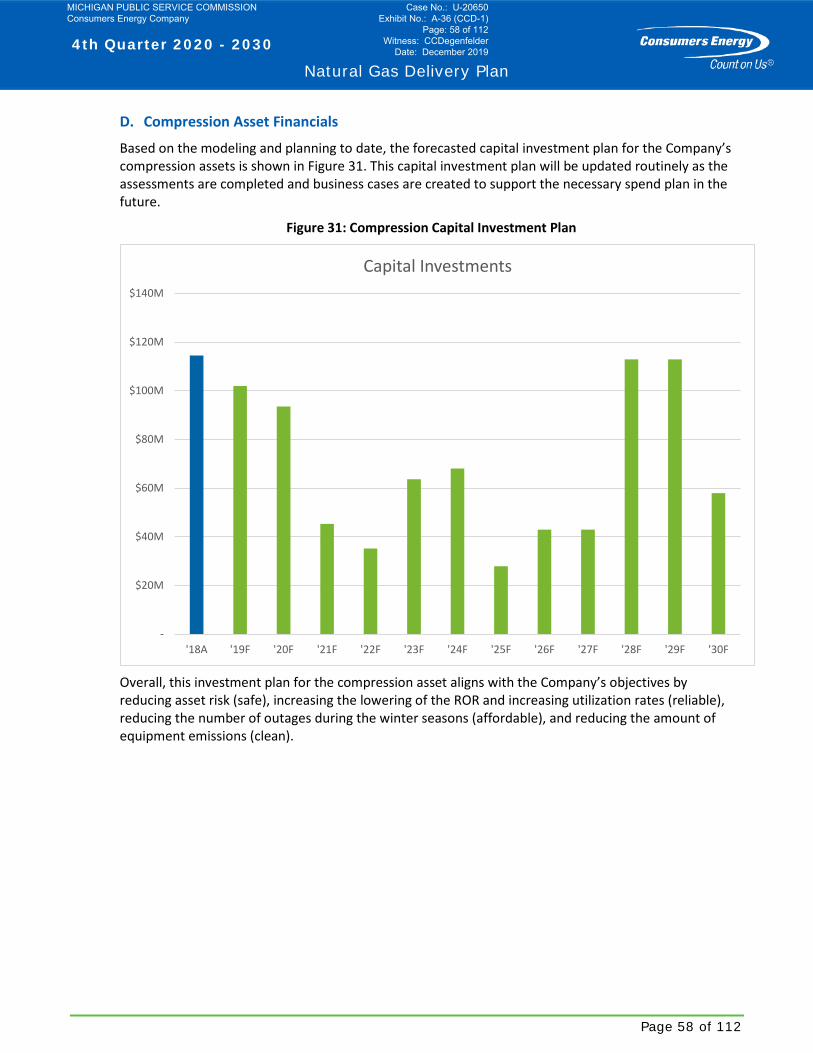
4th Quarter 2020 - 2030
Natural Gas Delivery Plan
Page 58 of 112
D. Compression Asset Financials
Based on the modeling and planning to date, the forecasted capital investment plan for the Company’s compression assets is shown in Figure 31. This capital investment plan will be updated routinely as the assessments are completed and business cases are created to support the necessary spend plan in the future.
Figure 31: Compression Capital Investment Plan
Overall, this investment plan for the compression asset aligns with the Company’s objectives by reducing asset risk (safe), increasing the lowering of the ROR and increasing utilization rates (reliable), reducing the number of outages during the winter seasons (affordable), and reducing the amount of equipment emissions (clean).
-
$20M
$40M
$60M
$80M
$100M
$120M
$140M
'18A '19F '20F '21F '22F '23F '24F '25F '26F '27F '28F '29F '30F
Capital Investments
MICHIGAN PUBLIC SERVICE COMMISSION Consumers Energy Company
Case No.: U-20650 Exhibit No.: A-36 (CCD-1)
Page: 58 of 112 Witness: CCDegenfelder
Date: December 2019
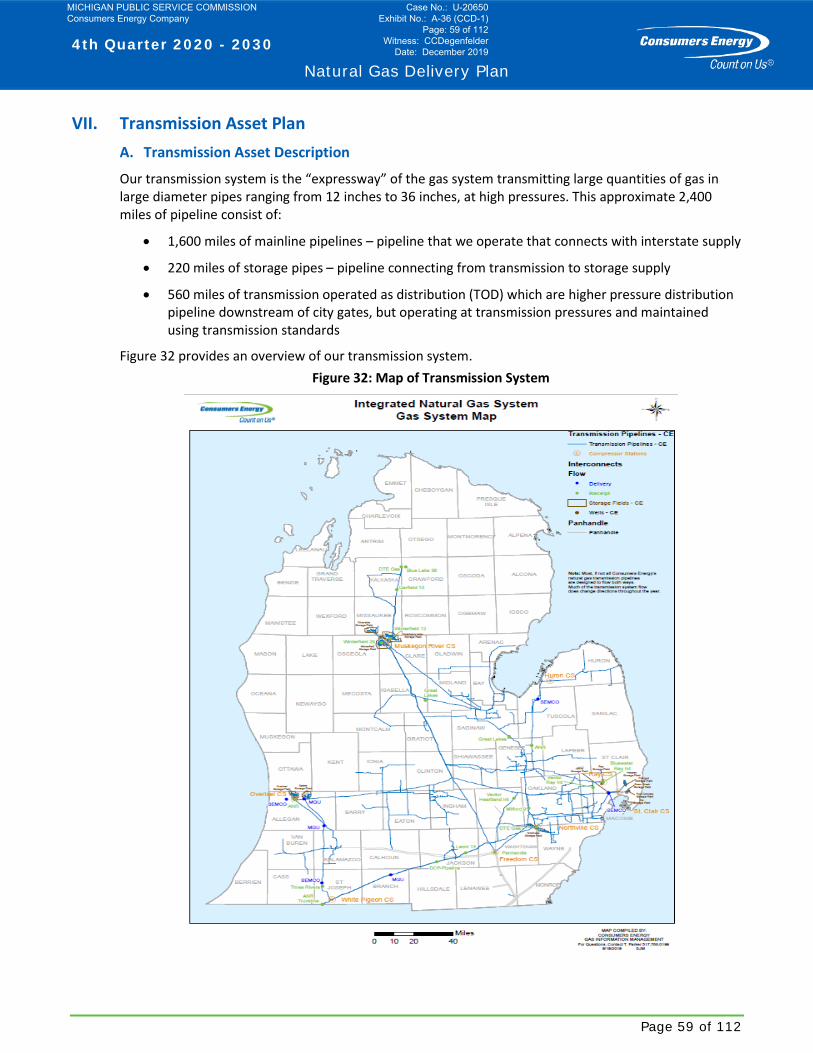
4th Quarter 2020 - 2030
Natural Gas Delivery Plan
Page 59 of 112
VII. Transmission Asset Plan A. Transmission Asset Description
Our transmission system is the “expressway” of the gas system transmitting large quantities of gas in large diameter pipes ranging from 12 inches to 36 inches, at high pressures. This approximate 2,400 miles of pipeline consist of:
• 1,600 miles of mainline pipelines – pipeline that we operate that connects with interstate supply
• 220 miles of storage pipes – pipeline connecting from transmission to storage supply
• 560 miles of transmission operated as distribution (TOD) which are higher pressure distribution pipeline downstream of city gates, but operating at transmission pressures and maintained using transmission standards
Figure 32 provides an overview of our transmission system. Figure 32: Map of Transmission System
MICHIGAN PUBLIC SERVICE COMMISSION Consumers Energy Company
Case No.: U-20650 Exhibit No.: A-36 (CCD-1)
Page: 59 of 112 Witness: CCDegenfelder
Date: December 2019
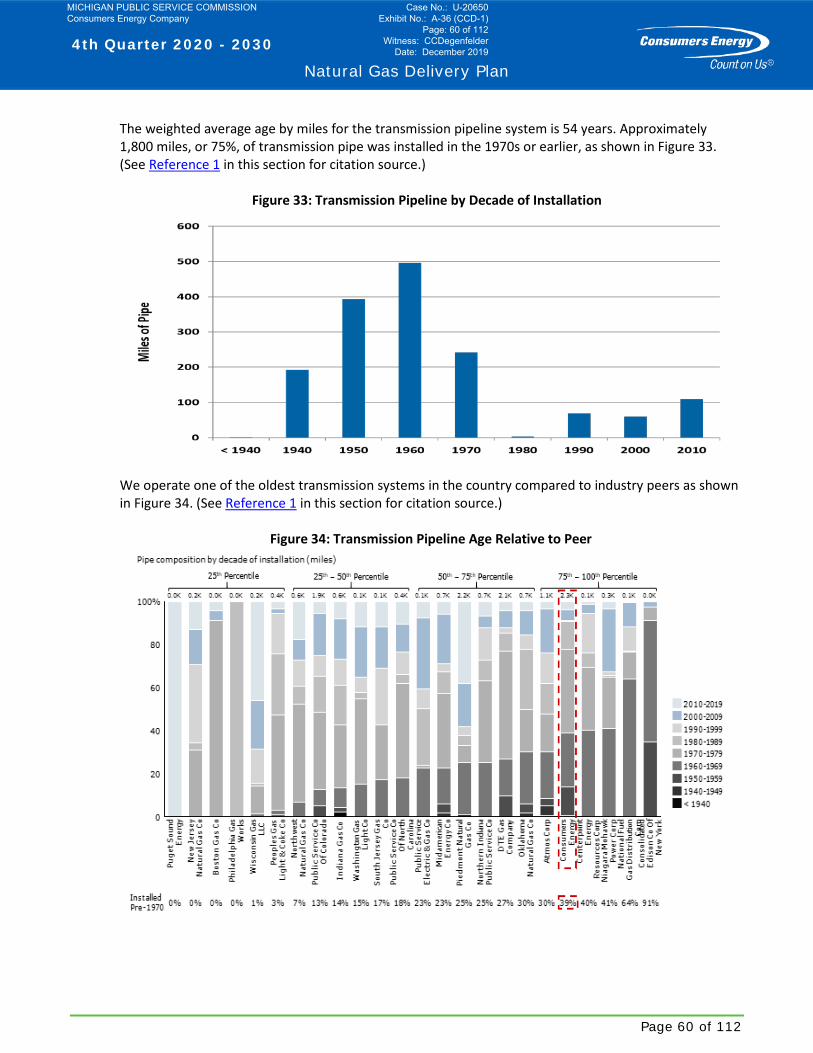
4th Quarter 2020 - 2030
Natural Gas Delivery Plan
Page 60 of 112
The weighted average age by miles for the transmission pipeline system is 54 years. Approximately 1,800 miles, or 75%, of transmission pipe was installed in the 1970s or earlier, as shown in Figure 33. (See Reference 1 in this section for citation source.)
Figure 33: Transmission Pipeline by Decade of Installation 2
We operate one of the oldest transmission systems in the country compared to industry peers as shown in Figure 34. (See Reference 1 in this section for citation source.)
Figure 34: Transmission Pipeline Age Relative to Peer
MICHIGAN PUBLIC SERVICE COMMISSION Consumers Energy Company
Case No.: U-20650 Exhibit No.: A-36 (CCD-1)
Page: 60 of 112 Witness: CCDegenfelder
Date: December 2019
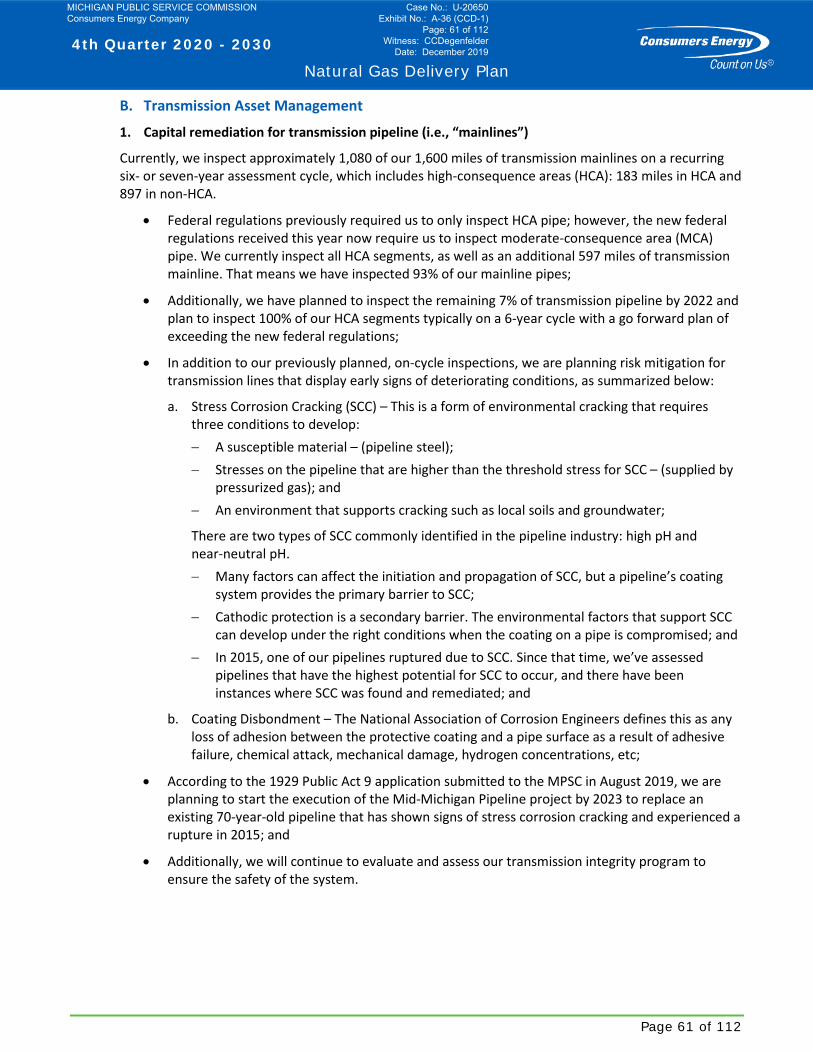
4th Quarter 2020 - 2030
Natural Gas Delivery Plan
Page 61 of 112
B. Transmission Asset Management
1. Capital remediation for transmission pipeline (i.e., “mainlines”)
Currently, we inspect approximately 1,080 of our 1,600 miles of transmission mainlines on a recurring six- or seven-year assessment cycle, which includes high-consequence areas (HCA): 183 miles in HCA and 897 in non-HCA.
• Federal regulations previously required us to only inspect HCA pipe; however, the new federal regulations received this year now require us to inspect moderate-consequence area (MCA) pipe. We currently inspect all HCA segments, as well as an additional 597 miles of transmission mainline. That means we have inspected 93% of our mainline pipes;
• Additionally, we have planned to inspect the remaining 7% of transmission pipeline by 2022 and plan to inspect 100% of our HCA segments typically on a 6-year cycle with a go forward plan of exceeding the new federal regulations;
• In addition to our previously planned, on-cycle inspections, we are planning risk mitigation for transmission lines that display early signs of deteriorating conditions, as summarized below:
a. Stress Corrosion Cracking (SCC) – This is a form of environmental cracking that requires three conditions to develop: − A susceptible material – (pipeline steel); − Stresses on the pipeline that are higher than the threshold stress for SCC – (supplied by
pressurized gas); and − An environment that supports cracking such as local soils and groundwater;
There are two types of SCC commonly identified in the pipeline industry: high pH and near-neutral pH. − Many factors can affect the initiation and propagation of SCC, but a pipeline’s coating
system provides the primary barrier to SCC; − Cathodic protection is a secondary barrier. The environmental factors that support SCC
can develop under the right conditions when the coating on a pipe is compromised; and − In 2015, one of our pipelines ruptured due to SCC. Since that time, we’ve assessed
pipelines that have the highest potential for SCC to occur, and there have been instances where SCC was found and remediated; and
b. Coating Disbondment – The National Association of Corrosion Engineers defines this as any loss of adhesion between the protective coating and a pipe surface as a result of adhesive failure, chemical attack, mechanical damage, hydrogen concentrations, etc;
• According to the 1929 Public Act 9 application submitted to the MPSC in August 2019, we are planning to start the execution of the Mid-Michigan Pipeline project by 2023 to replace an existing 70-year-old pipeline that has shown signs of stress corrosion cracking and experienced a rupture in 2015; and
• Additionally, we will continue to evaluate and assess our transmission integrity program to ensure the safety of the system.
MICHIGAN PUBLIC SERVICE COMMISSION Consumers Energy Company
Case No.: U-20650 Exhibit No.: A-36 (CCD-1)
Page: 61 of 112 Witness: CCDegenfelder
Date: December 2019
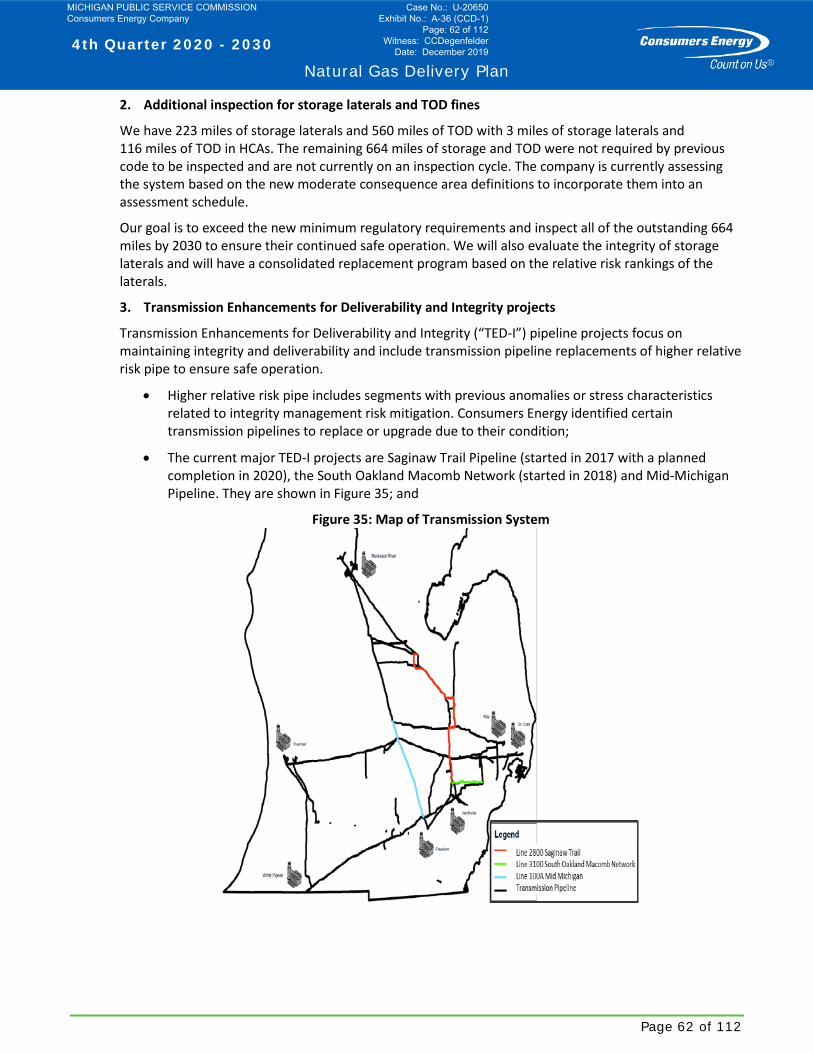
4th Quarter 2020 - 2030
Natural Gas Delivery Plan
Page 62 of 112
2. Additional inspection for storage laterals and TOD fines
We have 223 miles of storage laterals and 560 miles of TOD with 3 miles of storage laterals and 116 miles of TOD in HCAs. The remaining 664 miles of storage and TOD were not required by previous code to be inspected and are not currently on an inspection cycle. The company is currently assessing the system based on the new moderate consequence area definitions to incorporate them into an assessment schedule.
Our goal is to exceed the new minimum regulatory requirements and inspect all of the outstanding 664 miles by 2030 to ensure their continued safe operation. We will also evaluate the integrity of storage laterals and will have a consolidated replacement program based on the relative risk rankings of the laterals.
3. Transmission Enhancements for Deliverability and Integrity projects
Transmission Enhancements for Deliverability and Integrity (“TED-I”) pipeline projects focus on maintaining integrity and deliverability and include transmission pipeline replacements of higher relative risk pipe to ensure safe operation.
• Higher relative risk pipe includes segments with previous anomalies or stress characteristics related to integrity management risk mitigation. Consumers Energy identified certain transmission pipelines to replace or upgrade due to their condition;
• The current major TED-I projects are Saginaw Trail Pipeline (started in 2017 with a planned completion in 2020), the South Oakland Macomb Network (started in 2018) and Mid-Michigan Pipeline. They are shown in Figure 35; and
Figure 35: Map of Transmission System
MICHIGAN PUBLIC SERVICE COMMISSION Consumers Energy Company
Case No.: U-20650 Exhibit No.: A-36 (CCD-1)
Page: 62 of 112 Witness: CCDegenfelder
Date: December 2019

4th Quarter 2020 - 2030
Natural Gas Delivery Plan
Page 63 of 112
• In addition, the area southeast of Kalamazoo is currently being evaluated as this continues to be a supply bottleneck and a growing area for gas load. The 12” Line 1300 is the limiting factor in restricting capacity. In order to continue to enable growth, augmentation of the system may be necessary. Alternative studies are being conducted with both the transmission system and the distribution system to determine need and feasibility within the next five years.
Capacity requirements are factored into line replacements to ensure customer deliverability. • TED-I pipeline projects improve customer reliability and advance public safety by replacing or
retiring higher relative risk pipe segments and, in some cases, increasing capacity; and • Additionally, the replaced pipelines also have enhanced pipeline pressure control and isolation
capabilities. The TED-I plan will be continually evaluated based on integrity assessment results, analysis, construction efficiencies, and system modeling.
4. City gates
Consumers Energy operates 105 city gates, where pressure is regulated, and the natural gas is odorized for safe delivery to homes and businesses. Over-pressure protection and SCADA monitoring equipment are located at city gates.
City gate facilities and the equipment located within them have a reasonable life span of about 50 years. Almost half of our city gates were originally built in the 1960s, as shown in Figure 36. (See Reference 2 in this section for citation source.) However, age alone is not the primary factor for rebuilding a city gate. A modern facility has SCADA monitoring, adequate filtration and up-to-date measurement, and over-pressure protection equipment.
Our goal is to modernize 90% of our city gates within this 10-year plan. Then, we plan to rebuild our city gates on a cycle that will ensure the entire fleet is rebuilt within 50 years, or as required for safety and high-performance demand.
Figure 36: Age Distribution of City Gates
MICHIGAN PUBLIC SERVICE COMMISSION Consumers Energy Company
Case No.: U-20650 Exhibit No.: A-36 (CCD-1)
Page: 63 of 112 Witness: CCDegenfelder
Date: December 2019
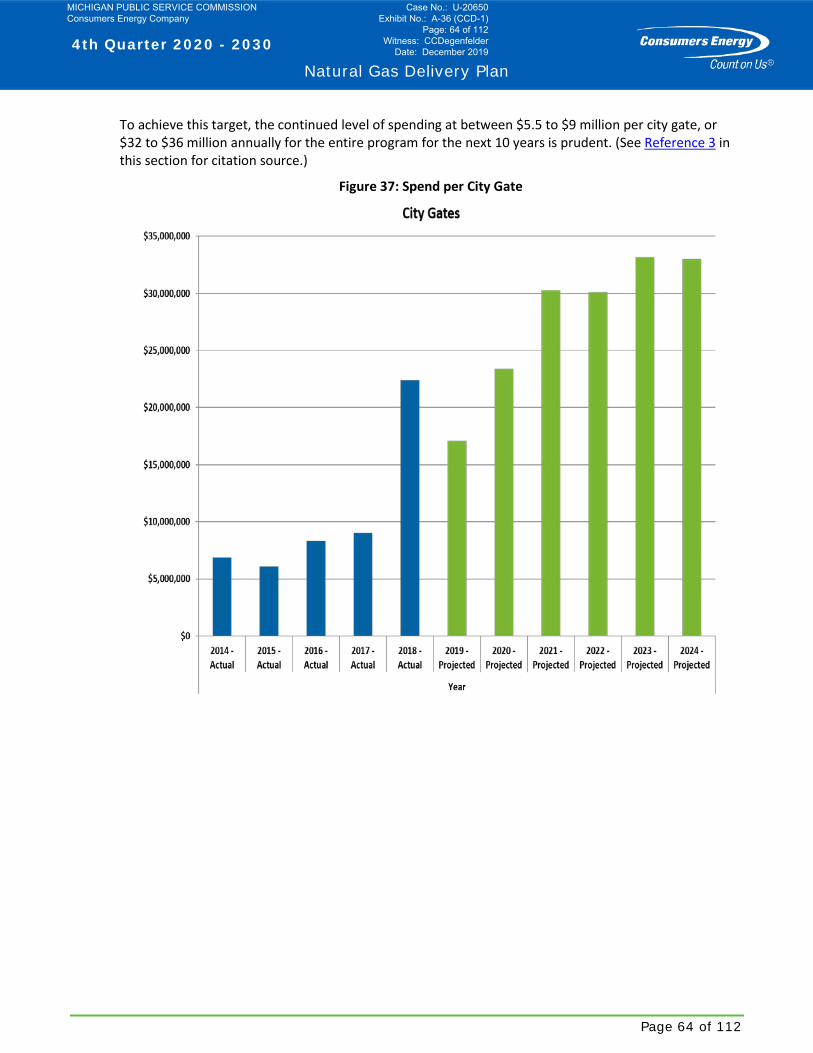
4th Quarter 2020 - 2030
Natural Gas Delivery Plan
Page 64 of 112
To achieve this target, the continued level of spending at between $5.5 to $9 million per city gate, or $32 to $36 million annually for the entire program for the next 10 years is prudent. (See Reference 3 in this section for citation source.)
Figure 37: Spend per City Gate
MICHIGAN PUBLIC SERVICE COMMISSION Consumers Energy Company
Case No.: U-20650 Exhibit No.: A-36 (CCD-1)
Page: 64 of 112 Witness: CCDegenfelder
Date: December 2019

4th Quarter 2020 - 2030
Natural Gas Delivery Plan
Page 65 of 112
5. RCVs
In the event of damage to a transmission line or a rupture event, the ability to remotely and quickly stop the flow of gas is essential, and RVCs are the standard for achieving this across the system. RCVs can toggle the system instantly and can quickly eliminate the flow of gas if necessary due to an emergency or abnormal operating condition. These RCV’s also allow for manual operations if a condition calls for an operator to override the RCV. In 2017, we installed our first set of RCVs in HCAs and at flexible points in our system, as mapped in Figure 38. (See Reference 4 in this section for citation source.)
Figure 38: RCVs as of October 2018
To leverage RCVs as a means of increasing the safety of the transmission system, we are planning to accelerate our installation rate towards a goal of 70% by 2023, as shown in Figure 39. (See Reference 5 in this section for citation source.)
Currently, we have 436 valves in our transmission system, requiring approximately 305 RCVs to reach our 70% goal. This increased installation rate will require an acceleration of spending by approximately $5 million in incremental capital per year.
MICHIGAN PUBLIC SERVICE COMMISSION Consumers Energy Company
Case No.: U-20650 Exhibit No.: A-36 (CCD-1)
Page: 65 of 112 Witness: CCDegenfelder
Date: December 2019
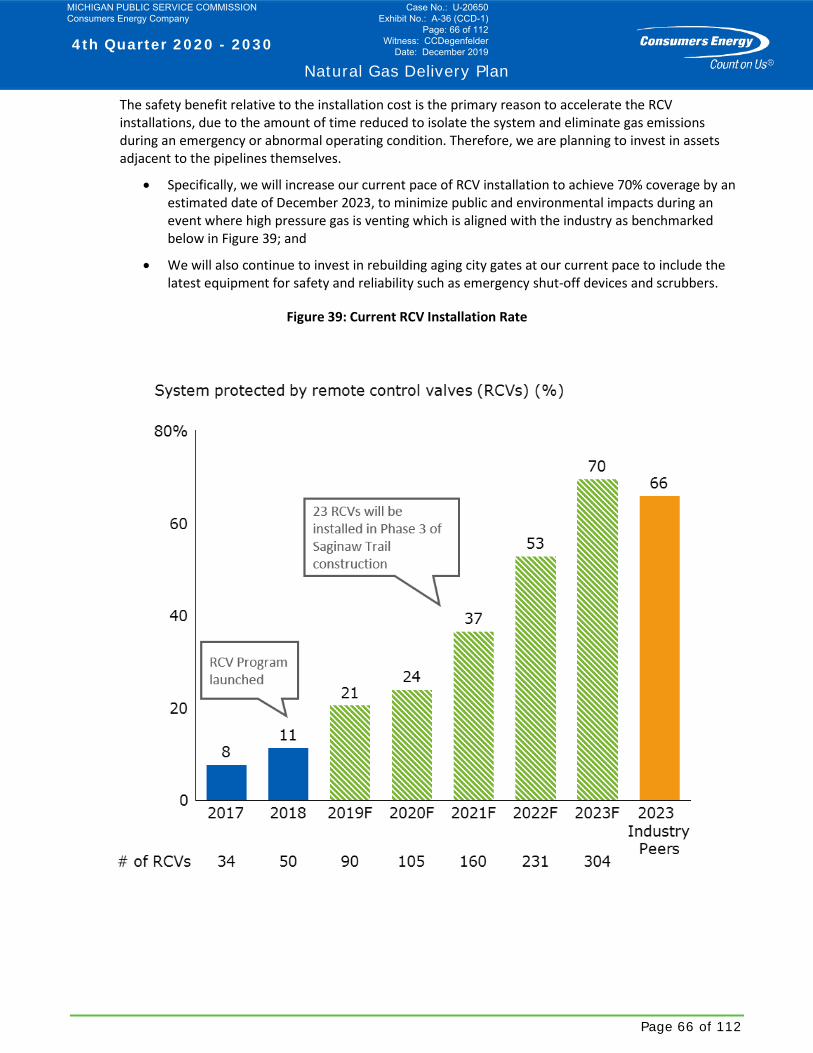
4th Quarter 2020 - 2030
Natural Gas Delivery Plan
Page 66 of 112
The safety benefit relative to the installation cost is the primary reason to accelerate the RCV installations, due to the amount of time reduced to isolate the system and eliminate gas emissions during an emergency or abnormal operating condition. Therefore, we are planning to invest in assets adjacent to the pipelines themselves.
• Specifically, we will increase our current pace of RCV installation to achieve 70% coverage by an estimated date of December 2023, to minimize public and environmental impacts during an event where high pressure gas is venting which is aligned with the industry as benchmarked below in Figure 39; and
• We will also continue to invest in rebuilding aging city gates at our current pace to include the latest equipment for safety and reliability such as emergency shut-off devices and scrubbers.
Figure 39: Current RCV Installation Rate
MICHIGAN PUBLIC SERVICE COMMISSION Consumers Energy Company
Case No.: U-20650 Exhibit No.: A-36 (CCD-1)
Page: 66 of 112 Witness: CCDegenfelder
Date: December 2019
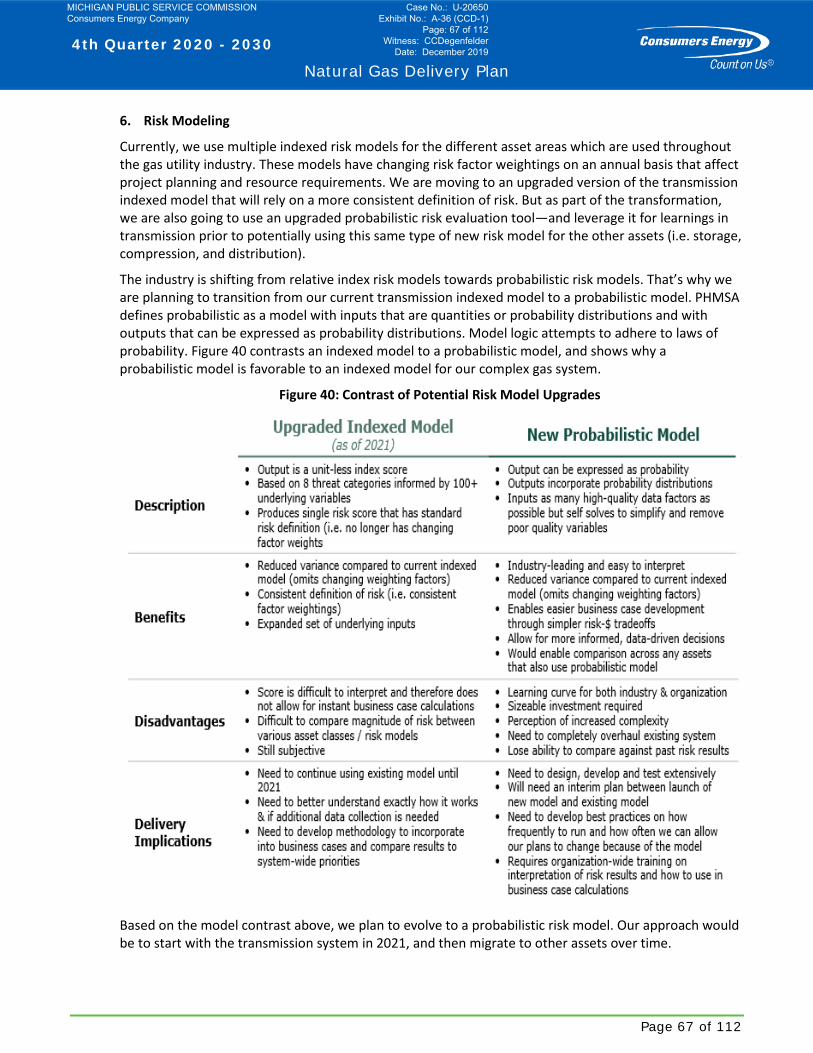
4th Quarter 2020 - 2030
Natural Gas Delivery Plan
Page 67 of 112
6. Risk Modeling
Currently, we use multiple indexed risk models for the different asset areas which are used throughout the gas utility industry. These models have changing risk factor weightings on an annual basis that affect project planning and resource requirements. We are moving to an upgraded version of the transmission indexed model that will rely on a more consistent definition of risk. But as part of the transformation, we are also going to use an upgraded probabilistic risk evaluation tool—and leverage it for learnings in transmission prior to potentially using this same type of new risk model for the other assets (i.e. storage, compression, and distribution).
The industry is shifting from relative index risk models towards probabilistic risk models. That’s why we are planning to transition from our current transmission indexed model to a probabilistic model. PHMSA defines probabilistic as a model with inputs that are quantities or probability distributions and with outputs that can be expressed as probability distributions. Model logic attempts to adhere to laws of probability. Figure 40 contrasts an indexed model to a probabilistic model, and shows why a probabilistic model is favorable to an indexed model for our complex gas system.
Figure 40: Contrast of Potential Risk Model Upgrades
Based on the model contrast above, we plan to evolve to a probabilistic risk model. Our approach would be to start with the transmission system in 2021, and then migrate to other assets over time.
MICHIGAN PUBLIC SERVICE COMMISSION Consumers Energy Company
Case No.: U-20650 Exhibit No.: A-36 (CCD-1)
Page: 67 of 112 Witness: CCDegenfelder
Date: December 2019
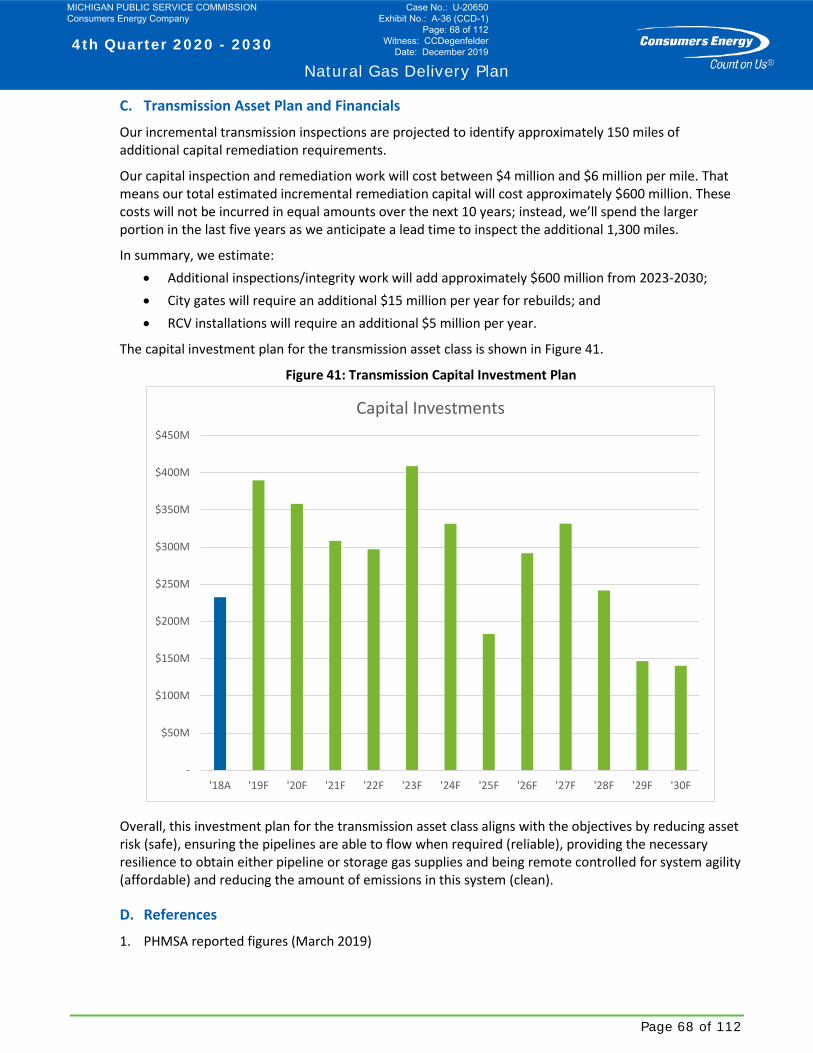
4th Quarter 2020 - 2030
Natural Gas Delivery Plan
Page 68 of 112
C. Transmission Asset Plan and Financials
Our incremental transmission inspections are projected to identify approximately 150 miles of additional capital remediation requirements.
Our capital inspection and remediation work will cost between $4 million and $6 million per mile. That means our total estimated incremental remediation capital will cost approximately $600 million. These costs will not be incurred in equal amounts over the next 10 years; instead, we’ll spend the larger portion in the last five years as we anticipate a lead time to inspect the additional 1,300 miles.
In summary, we estimate: • Additional inspections/integrity work will add approximately $600 million from 2023-2030; • City gates will require an additional $15 million per year for rebuilds; and • RCV installations will require an additional $5 million per year.
The capital investment plan for the transmission asset class is shown in Figure 41.
Figure 41: Transmission Capital Investment Plan
Overall, this investment plan for the transmission asset class aligns with the objectives by reducing asset risk (safe), ensuring the pipelines are able to flow when required (reliable), providing the necessary resilience to obtain either pipeline or storage gas supplies and being remote controlled for system agility (affordable) and reducing the amount of emissions in this system (clean).
D. References
1. PHMSA reported figures (March 2019)
-
$50M
$100M
$150M
$200M
$250M
$300M
$350M
$400M
$450M
'18A '19F '20F '21F '22F '23F '24F '25F '26F '27F '28F '29F '30F
Capital Investments
MICHIGAN PUBLIC SERVICE COMMISSION Consumers Energy Company
Case No.: U-20650 Exhibit No.: A-36 (CCD-1)
Page: 68 of 112 Witness: CCDegenfelder
Date: December 2019

4th Quarter 2020 - 2030
Natural Gas Delivery Plan
Page 69 of 112
2. Geographic Information System (“GIS”) database 3. Capital Budget O&M (January 2019), Capital Budget Engineering (January 2019) 4. GIS Database visualized through Tableau 5. RCV Priority by HCA; RCV Scheduled Forecasts
MICHIGAN PUBLIC SERVICE COMMISSION Consumers Energy Company
Case No.: U-20650 Exhibit No.: A-36 (CCD-1)
Page: 69 of 112 Witness: CCDegenfelder
Date: December 2019
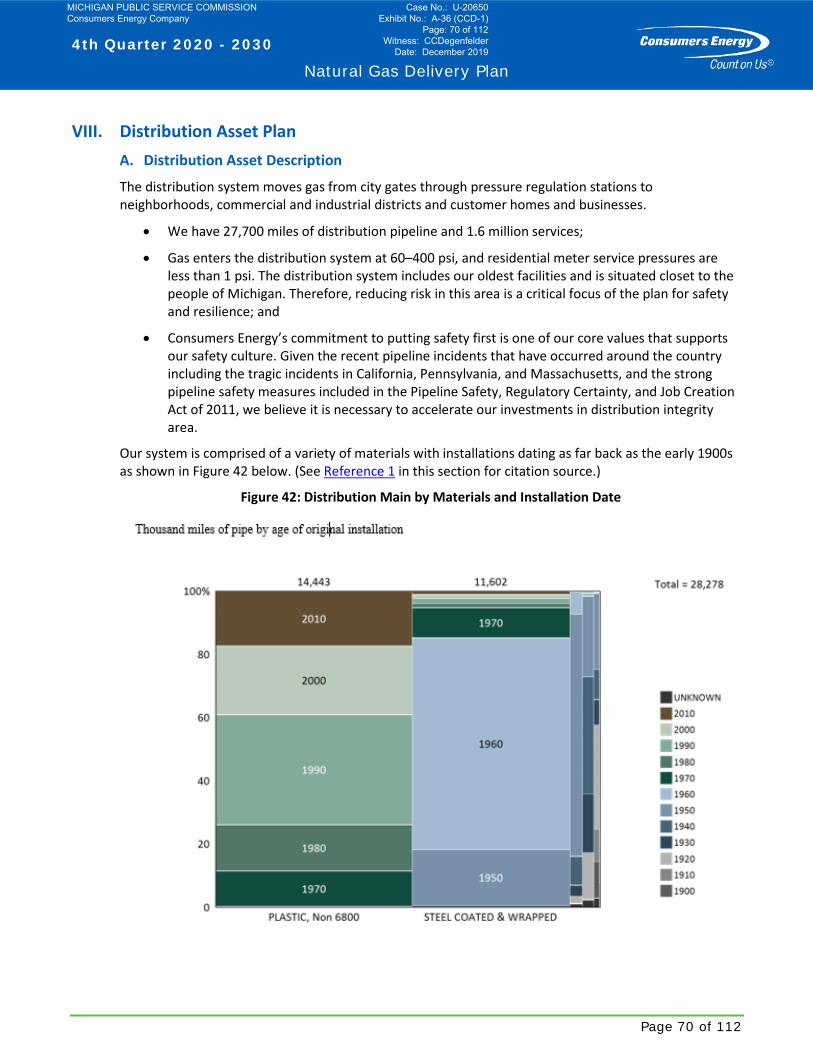
4th Quarter 2020 - 2030
Natural Gas Delivery Plan
Page 70 of 112
VIII. Distribution Asset Plan A. Distribution Asset Description
The distribution system moves gas from city gates through pressure regulation stations to neighborhoods, commercial and industrial districts and customer homes and businesses.
• We have 27,700 miles of distribution pipeline and 1.6 million services;
• Gas enters the distribution system at 60–400 psi, and residential meter service pressures are less than 1 psi. The distribution system includes our oldest facilities and is situated closet to the people of Michigan. Therefore, reducing risk in this area is a critical focus of the plan for safety and resilience; and
• Consumers Energy’s commitment to putting safety first is one of our core values that supports our safety culture. Given the recent pipeline incidents that have occurred around the country including the tragic incidents in California, Pennsylvania, and Massachusetts, and the strong pipeline safety measures included in the Pipeline Safety, Regulatory Certainty, and Job Creation Act of 2011, we believe it is necessary to accelerate our investments in distribution integrity area.
Our system is comprised of a variety of materials with installations dating as far back as the early 1900s as shown in Figure 42 below. (See Reference 1 in this section for citation source.)
Figure 42: Distribution Main by Materials and Installation Date
MICHIGAN PUBLIC SERVICE COMMISSION Consumers Energy Company
Case No.: U-20650 Exhibit No.: A-36 (CCD-1)
Page: 70 of 112 Witness: CCDegenfelder
Date: December 2019

4th Quarter 2020 - 2030
Natural Gas Delivery Plan
Page 71 of 112
Cast and wrought iron pipelines are among the oldest in our distribution system. Many of these pipelines were installed over 100 years ago and still deliver natural gas to our customers today. The age of the pipelines makes them susceptible to corrosion and cracking due to the degradation of the iron alloys (i.e. pipes rust and get brittle with age) and pipe joint design.
Bare steel, also called uncoated, pipelines are considered higher risk due to corrosion and cracking caused by age and lack of protective coating. External corrosion occurs on metal pipe due to soil and moisture conditions. Bare steel pipe is in direct contact with these corrosive conditions.
Fluctuations of temperatures during the seasons, as everyone experiences in Michigan, create additional risks. Once the ground freezes at low temperatures, pipelines are susceptible to frost heave causing new cracks to form and existing cracks to expand. Natural gas vapors are lighter than air and will generally rise and dissipate quickly. These vapors will move through the soil finding the path of least resistance. Frozen ground acts as a vertical barrier causing gas to gather and pushing it horizontally until it finds an opening (porous/cracked foundations, water/sewer lines) often leading into a building.
The above factors have greatly increased the risk involved with continued use of vintage materials. Our distribution mains are about 52% plastic, 45% protected steel, and 3% vintage materials such as cast iron, wrought iron and bare steel.
PHMSA classifies the highest risk vintage materials, in order of risk, as:
• Cast iron (385 miles in our system);
• Bare steel (847 miles in our system); and
• Threaded & coupled steel (936 miles in our system).
And as more infrequent materials:
• Wrought iron (17 miles in our system).
These at-risk materials total 2,184 miles of main or approximately 8% of all distribution main miles. Not replacing older infrastructure could have catastrophic results as seen in Allentown, PA (1990) and in northeastern Massachusetts (2018). The PHMSA Pipeline Incident data for Michigan Gas Distribution reports a rising trend in the 5-year average incident count for the distribution system.
Figure 43, on the following page, is a map of these at-risk vintage materials for our system. (See Reference 2 in this section for citation source.)
MICHIGAN PUBLIC SERVICE COMMISSION Consumers Energy Company
Case No.: U-20650 Exhibit No.: A-36 (CCD-1)
Page: 71 of 112 Witness: CCDegenfelder
Date: December 2019

4th Quarter 2020 - 2030
Natural Gas Delivery Plan
Page 72 of 112
Figure 43: Map of Vintage Distribution Materials
Another distribution integrity risk is pipes operating at standard (utilization) low pressure. Gas needs to reach each customer with enough flow rate and pressure to fuel equipment and appliances while staying below the maximum operating pressure for each segment within the system.
The standard pressure system operates at 7”WC (about a ¼ psig) and does not require a pressure regulator for each customer’s service. The challenges of operating a standard pressure system are the dynamic flow and pressure changes due to varying customer demand. This system struggles to operate at higher pressures on extreme cold weather days, customer demand changes, etc. – and require accurate and timely pressure control to meet deliverability requirements. If the pressure is not maintained and drops below 7”WC then customers may experience heating and other appliance problems due to the low gas pressure.
In January 2018, in Rhode Island, it was reported that thousands of Newport residents went several days without natural gas. Rhode Island PUC blamed the outage on low pipeline pressure due to weather driven high gas demand and malfunctioning equipment. Other factors that can contribute to low gas pressure are:
• Standard-pressure portions of the system, largely vintage material, are susceptible to fluid infiltration from the ground. This fluid can travel through the system, including to customers’ meters; and
• In freezing temperatures, this fluid may seal the orifices of the meter and/or regulator and interrupt gas flow. This poses a risk to customers during the heating season. Furthermore,
MICHIGAN PUBLIC SERVICE COMMISSION Consumers Energy Company
Case No.: U-20650 Exhibit No.: A-36 (CCD-1)
Page: 72 of 112 Witness: CCDegenfelder
Date: December 2019
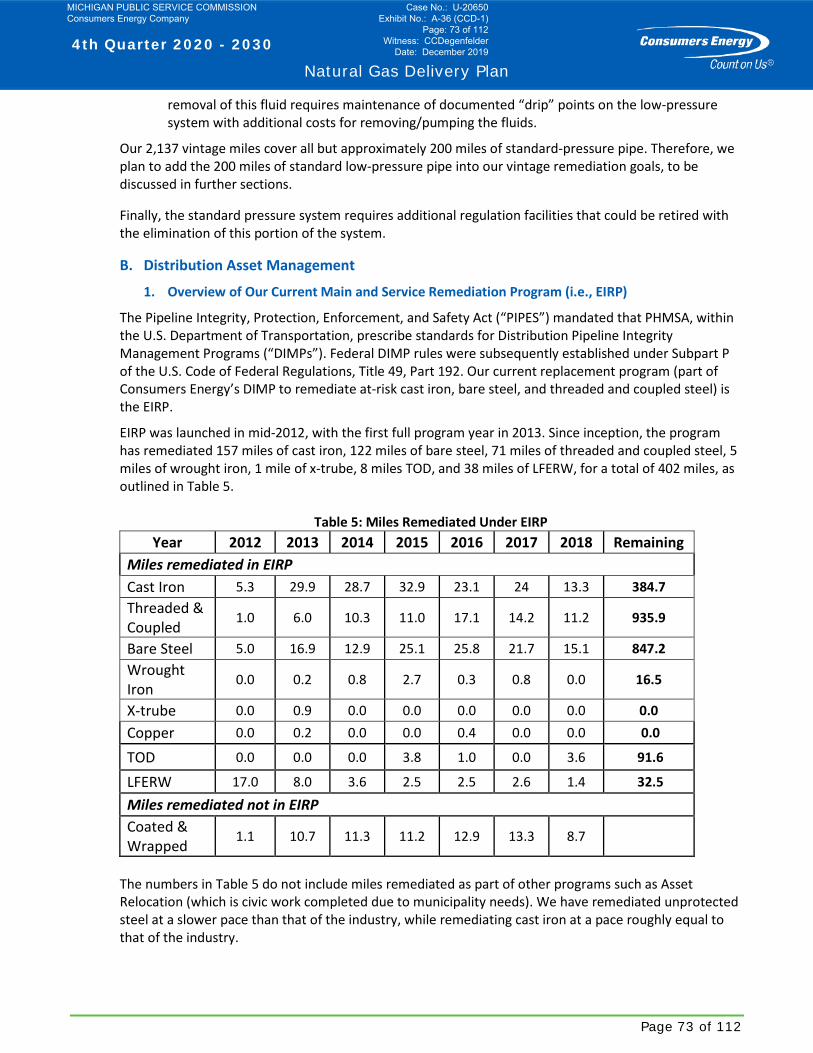
4th Quarter 2020 - 2030
Natural Gas Delivery Plan
Page 73 of 112
removal of this fluid requires maintenance of documented “drip” points on the low-pressure system with additional costs for removing/pumping the fluids.
Our 2,137 vintage miles cover all but approximately 200 miles of standard-pressure pipe. Therefore, we plan to add the 200 miles of standard low-pressure pipe into our vintage remediation goals, to be discussed in further sections.
Finally, the standard pressure system requires additional regulation facilities that could be retired with the elimination of this portion of the system.
B. Distribution Asset Management
1. Overview of Our Current Main and Service Remediation Program (i.e., EIRP)
The Pipeline Integrity, Protection, Enforcement, and Safety Act (“PIPES”) mandated that PHMSA, within the U.S. Department of Transportation, prescribe standards for Distribution Pipeline Integrity Management Programs (“DIMPs”). Federal DIMP rules were subsequently established under Subpart P of the U.S. Code of Federal Regulations, Title 49, Part 192. Our current replacement program (part of Consumers Energy’s DIMP to remediate at-risk cast iron, bare steel, and threaded and coupled steel) is the EIRP.
EIRP was launched in mid-2012, with the first full program year in 2013. Since inception, the program has remediated 157 miles of cast iron, 122 miles of bare steel, 71 miles of threaded and coupled steel, 5 miles of wrought iron, 1 mile of x-trube, 8 miles TOD, and 38 miles of LFERW, for a total of 402 miles, as outlined in Table 5.
Table 5: Miles Remediated Under EIRP Year 2012 2013 2014 2015 2016 2017 2018 Remaining
Miles remediated in EIRP Cast Iron 5.3 29.9 28.7 32.9 23.1 24 13.3 384.7 Threaded & Coupled
1.0 6.0 10.3 11.0 17.1 14.2 11.2 935.9
Bare Steel 5.0 16.9 12.9 25.1 25.8 21.7 15.1 847.2 Wrought Iron
0.0 0.2 0.8 2.7 0.3 0.8 0.0 16.5
X-trube 0.0 0.9 0.0 0.0 0.0 0.0 0.0 0.0 Copper 0.0 0.2 0.0 0.0 0.4 0.0 0.0 0.0
TOD 0.0 0.0 0.0 3.8 1.0 0.0 3.6 91.6
LFERW 17.0 8.0 3.6 2.5 2.5 2.6 1.4 32.5
Miles remediated not in EIRP Coated & Wrapped
1.1 10.7 11.3 11.2 12.9 13.3 8.7
The numbers in Table 5 do not include miles remediated as part of other programs such as Asset Relocation (which is civic work completed due to municipality needs). We have remediated unprotected steel at a slower pace than that of the industry, while remediating cast iron at a pace roughly equal to that of the industry.
MICHIGAN PUBLIC SERVICE COMMISSION Consumers Energy Company
Case No.: U-20650 Exhibit No.: A-36 (CCD-1)
Page: 73 of 112 Witness: CCDegenfelder
Date: December 2019
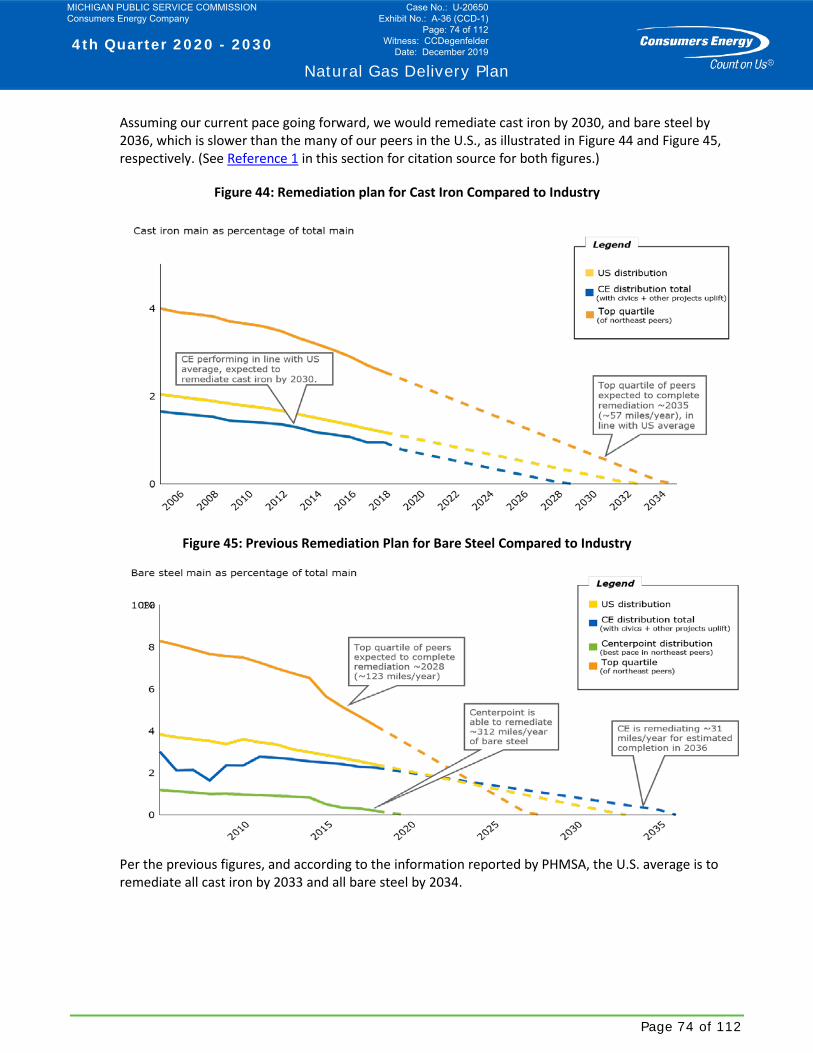
4th Quarter 2020 - 2030
Natural Gas Delivery Plan
Page 74 of 112
Assuming our current pace going forward, we would remediate cast iron by 2030, and bare steel by 2036, which is slower than the many of our peers in the U.S., as illustrated in Figure 44 and Figure 45, respectively. (See Reference 1 in this section for citation source for both figures.)
Figure 44: Remediation plan for Cast Iron Compared to Industry
Figure 45: Previous Remediation Plan for Bare Steel Compared to Industry
Per the previous figures, and according to the information reported by PHMSA, the U.S. average is to remediate all cast iron by 2033 and all bare steel by 2034.
MICHIGAN PUBLIC SERVICE COMMISSION Consumers Energy Company
Case No.: U-20650 Exhibit No.: A-36 (CCD-1)
Page: 74 of 112 Witness: CCDegenfelder
Date: December 2019

4th Quarter 2020 - 2030
Natural Gas Delivery Plan
Page 75 of 112
As part of our plan, we have identified the need to accelerate remediation of vintage main materials. Figure 46 illustrates the new plan that would maximize future installed miles in 2023 with a leveled pace 2024 for completion by 2030 based on a grid approach.
Figure 46: New Remediation plan for Vintage Materials
2. Overview of Distribution Services and Vintage Service Replacement Program
The Consumers Energy distribution system includes approximately 1.6 million service lines that connect the distribution main to homes and businesses.
• Service lines can contain at-risk materials. The system contains approximately 135,000 copper services, or 8.5% of all services; and
• In a much smaller quantity, the system also contains 10,761 bare steel services. Given that bare steel main is considered high-risk, we consider bare steel services as a high-risk vintage material, as well.
Current vintage services are dispersed evenly across the system, as mapped in Figure 47. (See Reference 2 in this section for the citation source.)
MICHIGAN PUBLIC SERVICE COMMISSION Consumers Energy Company
Case No.: U-20650 Exhibit No.: A-36 (CCD-1)
Page: 75 of 112 Witness: CCDegenfelder
Date: December 2019
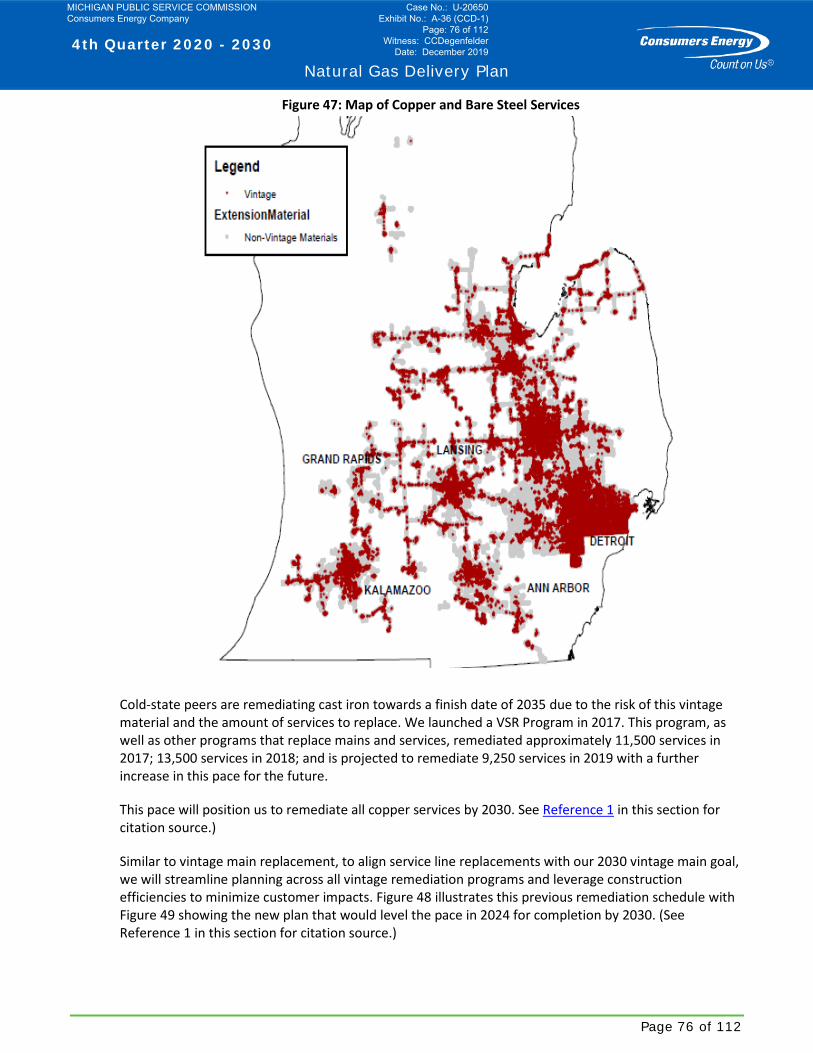
4th Quarter 2020 - 2030
Natural Gas Delivery Plan
Page 76 of 112
Figure 47: Map of Copper and Bare Steel Services
Cold-state peers are remediating cast iron towards a finish date of 2035 due to the risk of this vintage material and the amount of services to replace. We launched a VSR Program in 2017. This program, as well as other programs that replace mains and services, remediated approximately 11,500 services in 2017; 13,500 services in 2018; and is projected to remediate 9,250 services in 2019 with a further increase in this pace for the future.
This pace will position us to remediate all copper services by 2030. See Reference 1 in this section for citation source.)
Similar to vintage main replacement, to align service line replacements with our 2030 vintage main goal, we will streamline planning across all vintage remediation programs and leverage construction efficiencies to minimize customer impacts. Figure 48 illustrates this previous remediation schedule with Figure 49 showing the new plan that would level the pace in 2024 for completion by 2030. (See Reference 1 in this section for citation source.)
MICHIGAN PUBLIC SERVICE COMMISSION Consumers Energy Company
Case No.: U-20650 Exhibit No.: A-36 (CCD-1)
Page: 76 of 112 Witness: CCDegenfelder
Date: December 2019

4th Quarter 2020 - 2030
Natural Gas Delivery Plan
Page 77 of 112
Figure 48: Previous Remediation Plan for Copper Services compared to the Industry
Figure 49: New Remediation Plan for Vintage Services
MICHIGAN PUBLIC SERVICE COMMISSION Consumers Energy Company
Case No.: U-20650 Exhibit No.: A-36 (CCD-1)
Page: 77 of 112 Witness: CCDegenfelder
Date: December 2019

4th Quarter 2020 - 2030
Natural Gas Delivery Plan
Page 78 of 112
3. Acceleration of vintage material remediation
To reduce risk and reduce our methane emissions, we plan to accelerate the remediation of all vintage materials.
• A target of 2030 would position us to remove risk from our assets and help ensure the safety of our customers and the public; and
• Remediating vintage materials also drastically reduces methane emissions. Methane studies estimate that cast iron pipes leak almost 23 times more methane than plastic pipes, while unprotected steel leaks almost 10 times more.
4. Additional benefits to customers
• Less disruption to customer property from reduced project mobilization and demobilization to the same or nearby locations;
• Improved local coordination with municipalities to better align the timing of our planned project work with public works projects;
• Improved customer safety and reliability by more rapidly eliminating the higher-risk vintage main pipe and services from our system;
• Improved system efficiency due to higher operating pressure and reduction of standard pressure on our system;
• Lower gas losses and reduced emissions into atmosphere;
• Reduced O&M costs; and
• Reduced risk of long-term cost inflation, by completing the program work in a shorter time.
5. Acceleration approach
Our 2030 goals for vintage material replacement will require an approximate annual total installation of 267 miles of main and 11,750 services as previously shown.
These accelerated targets imply an annual increase of 200% in miles and 20% in services compared to our current remediation pace, which will reduce the overall schedule by 6 years and reduce the overall program costs by over 13%.
To achieve this, we will continue to deploy better work management processes and hire additional gas utility workers and contractors throughout the state of Michigan to execute this work. The current annual cost of the EIRP program is approximately $87 million per year with $100 million in 2020, representing a potential required increase of approximately 110%. In addition to operational improvements and increasing scope, we will require an increase in capital of approximately $200 million per year by 2024.
Our largest operational driver to accelerating the work is the labor workforce requirements necessary during execution.
MICHIGAN PUBLIC SERVICE COMMISSION Consumers Energy Company
Case No.: U-20650 Exhibit No.: A-36 (CCD-1)
Page: 78 of 112 Witness: CCDegenfelder
Date: December 2019
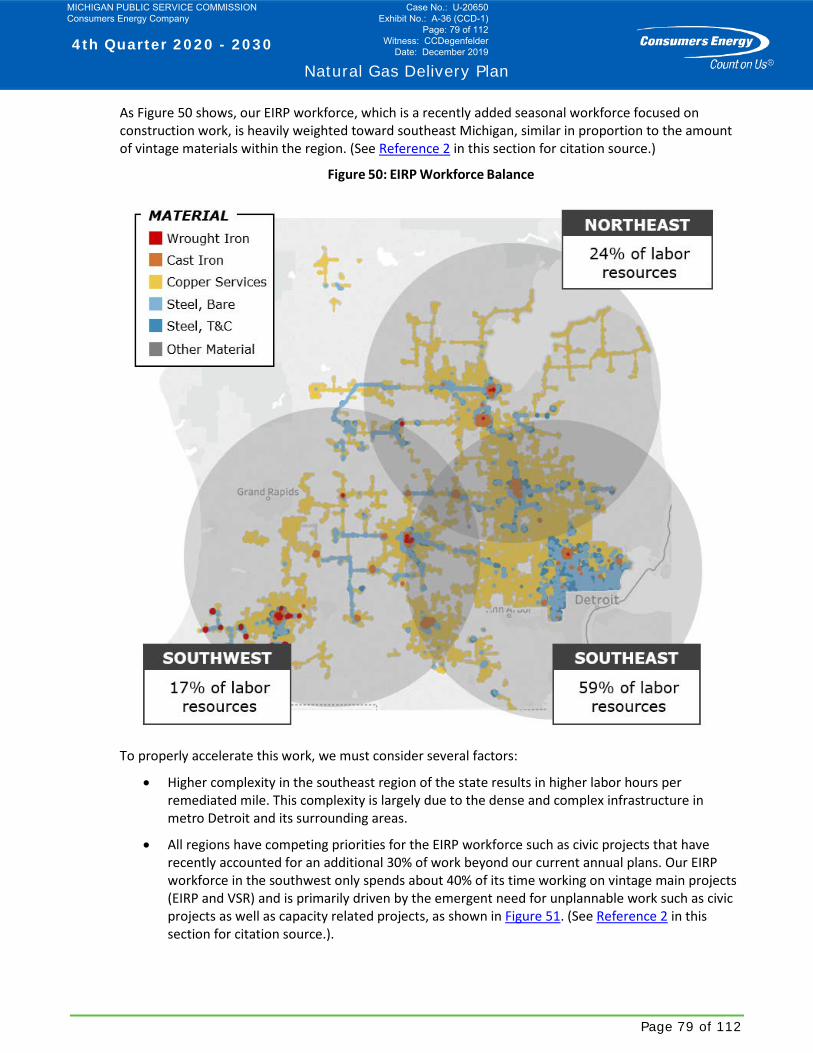
4th Quarter 2020 - 2030
Natural Gas Delivery Plan
Page 79 of 112
As Figure 50 shows, our EIRP workforce, which is a recently added seasonal workforce focused on construction work, is heavily weighted toward southeast Michigan, similar in proportion to the amount of vintage materials within the region. (See Reference 2 in this section for citation source.)
Figure 50: EIRP Workforce Balance
To properly accelerate this work, we must consider several factors:
• Higher complexity in the southeast region of the state results in higher labor hours per remediated mile. This complexity is largely due to the dense and complex infrastructure in metro Detroit and its surrounding areas.
• All regions have competing priorities for the EIRP workforce such as civic projects that have recently accounted for an additional 30% of work beyond our current annual plans. Our EIRP workforce in the southwest only spends about 40% of its time working on vintage main projects (EIRP and VSR) and is primarily driven by the emergent need for unplannable work such as civic projects as well as capacity related projects, as shown in Figure 51. (See Reference 2 in this section for citation source.).
MICHIGAN PUBLIC SERVICE COMMISSION Consumers Energy Company
Case No.: U-20650 Exhibit No.: A-36 (CCD-1)
Page: 79 of 112 Witness: CCDegenfelder
Date: December 2019
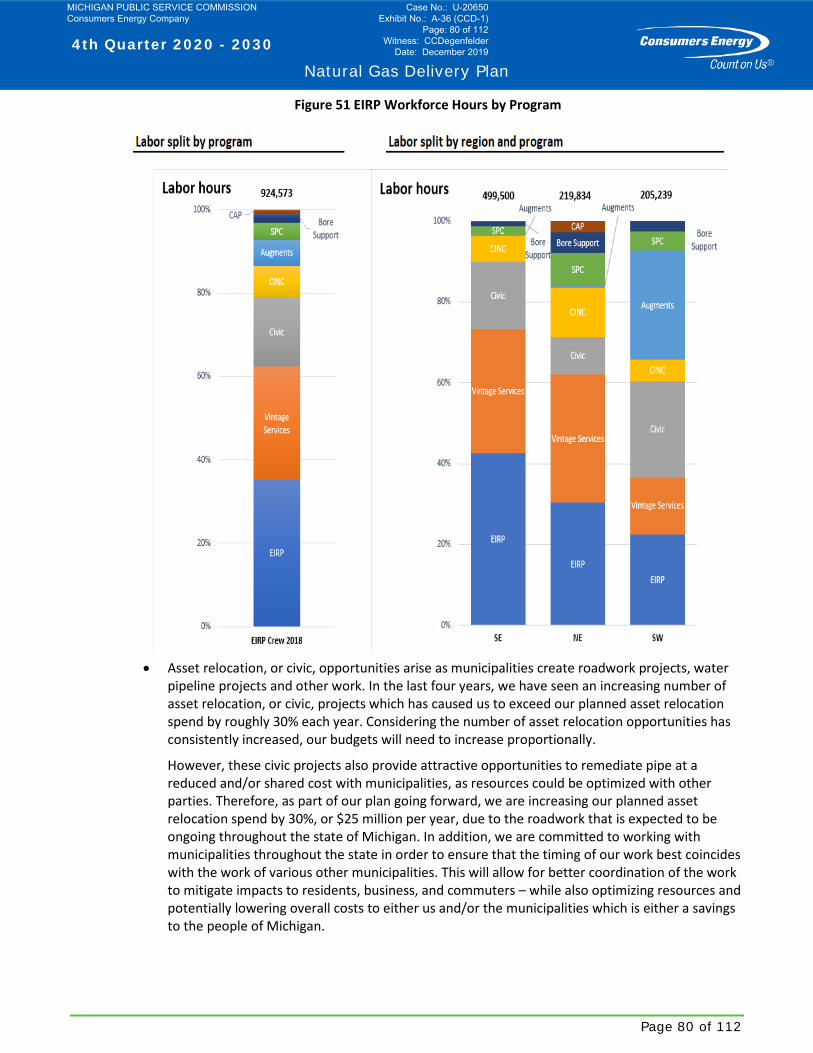
4th Quarter 2020 - 2030
Natural Gas Delivery Plan
Page 80 of 112
Figure 51 EIRP Workforce Hours by Program
• Asset relocation, or civic, opportunities arise as municipalities create roadwork projects, water
pipeline projects and other work. In the last four years, we have seen an increasing number of asset relocation, or civic, projects which has caused us to exceed our planned asset relocation spend by roughly 30% each year. Considering the number of asset relocation opportunities has consistently increased, our budgets will need to increase proportionally.
However, these civic projects also provide attractive opportunities to remediate pipe at a reduced and/or shared cost with municipalities, as resources could be optimized with other parties. Therefore, as part of our plan going forward, we are increasing our planned asset relocation spend by 30%, or $25 million per year, due to the roadwork that is expected to be ongoing throughout the state of Michigan. In addition, we are committed to working with municipalities throughout the state in order to ensure that the timing of our work best coincides with the work of various other municipalities. This will allow for better coordination of the work to mitigate impacts to residents, business, and commuters – while also optimizing resources and potentially lowering overall costs to either us and/or the municipalities which is either a savings to the people of Michigan.
MICHIGAN PUBLIC SERVICE COMMISSION Consumers Energy Company
Case No.: U-20650 Exhibit No.: A-36 (CCD-1)
Page: 80 of 112 Witness: CCDegenfelder
Date: December 2019

4th Quarter 2020 - 2030
Natural Gas Delivery Plan
Page 81 of 112
• Between 30 and 60 EIRP projects are executed each year. In 2018, the smallest project remediated 0.1 miles while the largest project remediated 5.38 miles. More than doubling our vintage remediation will require either increasing the number of projects or increasing the miles within each project. While both options have been considered, for our organization it is more beneficial to create projects with larger scope rather than increase the number of projects.
Therefore, considering all these factors, we are looking at a holistic view of all distribution work and have created a new grid approach by increasing the geographical area of a project which allows for improved economies of scale, reduced complexity of management/permitting and streamlined planning (discussed further in the Operational Capabilities, Section XII.B). This new approach will allow us to complete more work in a quicker timeframe and lower the cost per unit from our current numbers today. This accelerated approach will require annual investment increases of over 200% by 2024. In addition, from a resource standpoint, we are planning for additional skilled workers and contractors to support this new plan and remediate all vintage materials (mains and services) by 2030.
We recognize this is a challenge, and Table 6 shows some of the major components to enable this acceleration to be successful.
Table 6: Sources to Planning Enablers
Component Potential Sources of Acceleration and Cost Reduction
Outside Services • Assess vendor approach • Review of HVAC approval process • Assess Aggregate & Traffic Control services
Labor • Assess work approach of current workforce • Assess trained workforce levels and push restoration work down
from current lowest level
Direct Assessments • Assess equipment time/ rental approach • Assess direct assessment costs to projects • Improve digital tools to enable efficiencies
Total
• Optimization/six-sigma/CE-Way trainings for field leaders and more lower management levels
• Reduce damages / incentivize crews to reduce frequency of damages
In addition to these enablers to support the acceleration and potential cost reductions, this grid approach considers the mains and services in an area averaging 6 square miles prioritizing the grids by using on the current risk model, and replaces all the vintage materials at one time, instead of removing mains in a segment approach with services being replaced at a different time. Figure 52 shows an example of this grid approach using the risk model as the means of prioritizing the work with the high-risk segments in red and the lighter the blue color means the lower the risk for any given pipe segment.
MICHIGAN PUBLIC SERVICE COMMISSION Consumers Energy Company
Case No.: U-20650 Exhibit No.: A-36 (CCD-1)
Page: 81 of 112 Witness: CCDegenfelder
Date: December 2019
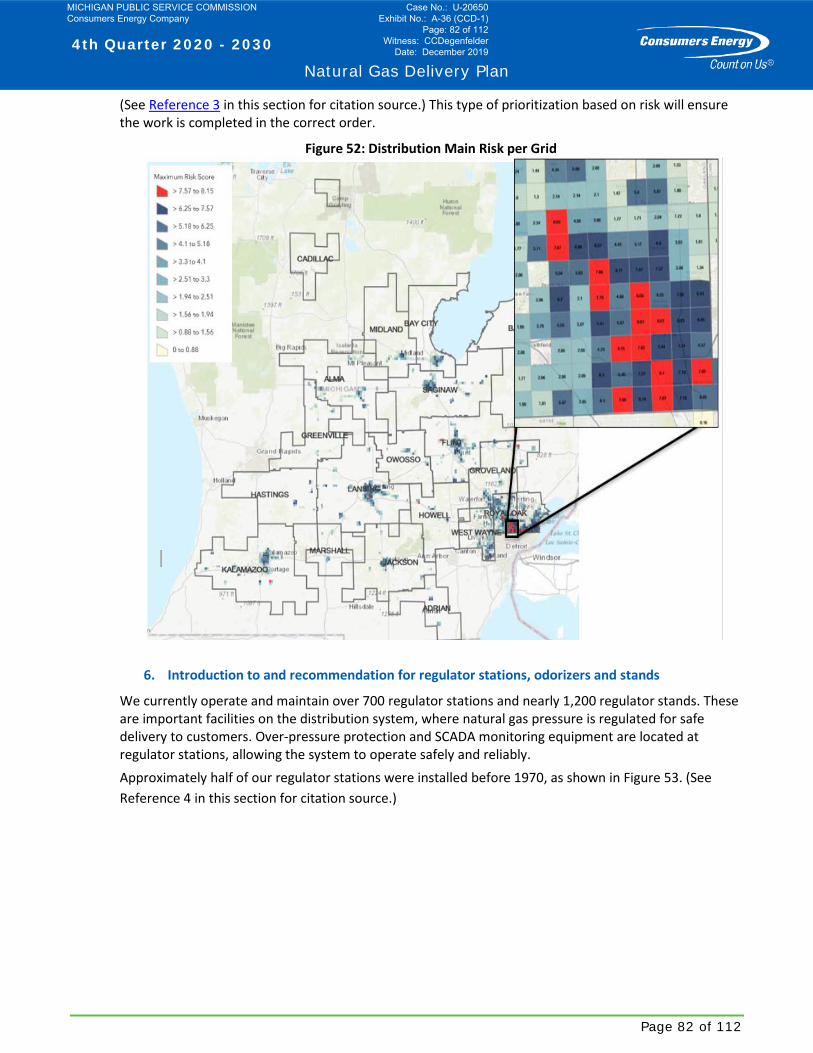
4th Quarter 2020 - 2030
Natural Gas Delivery Plan
Page 82 of 112
(See Reference 3 in this section for citation source.) This type of prioritization based on risk will ensure the work is completed in the correct order.
Figure 52: Distribution Main Risk per Grid
6. Introduction to and recommendation for regulator stations, odorizers and stands
We currently operate and maintain over 700 regulator stations and nearly 1,200 regulator stands. These are important facilities on the distribution system, where natural gas pressure is regulated for safe delivery to customers. Over-pressure protection and SCADA monitoring equipment are located at regulator stations, allowing the system to operate safely and reliably. Approximately half of our regulator stations were installed before 1970, as shown in Figure 53. (See Reference 4 in this section for citation source.)
MICHIGAN PUBLIC SERVICE COMMISSION Consumers Energy Company
Case No.: U-20650 Exhibit No.: A-36 (CCD-1)
Page: 82 of 112 Witness: CCDegenfelder
Date: December 2019
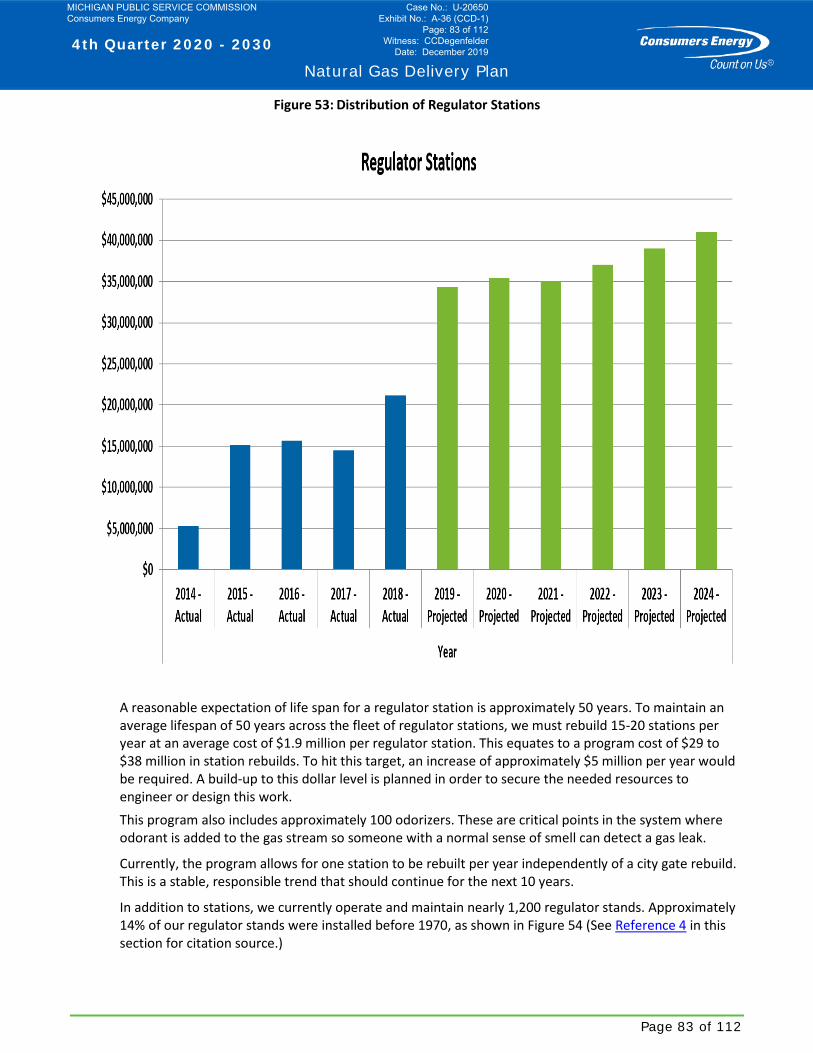
4th Quarter 2020 - 2030
Natural Gas Delivery Plan
Page 83 of 112
Figure 53: Distribution of Regulator Stations
A reasonable expectation of life span for a regulator station is approximately 50 years. To maintain an average lifespan of 50 years across the fleet of regulator stations, we must rebuild 15-20 stations per year at an average cost of $1.9 million per regulator station. This equates to a program cost of $29 to $38 million in station rebuilds. To hit this target, an increase of approximately $5 million per year would be required. A build-up to this dollar level is planned in order to secure the needed resources to engineer or design this work. This program also includes approximately 100 odorizers. These are critical points in the system where odorant is added to the gas stream so someone with a normal sense of smell can detect a gas leak.
Currently, the program allows for one station to be rebuilt per year independently of a city gate rebuild. This is a stable, responsible trend that should continue for the next 10 years.
In addition to stations, we currently operate and maintain nearly 1,200 regulator stands. Approximately 14% of our regulator stands were installed before 1970, as shown in Figure 54 (See Reference 4 in this section for citation source.)
MICHIGAN PUBLIC SERVICE COMMISSION Consumers Energy Company
Case No.: U-20650 Exhibit No.: A-36 (CCD-1)
Page: 83 of 112 Witness: CCDegenfelder
Date: December 2019
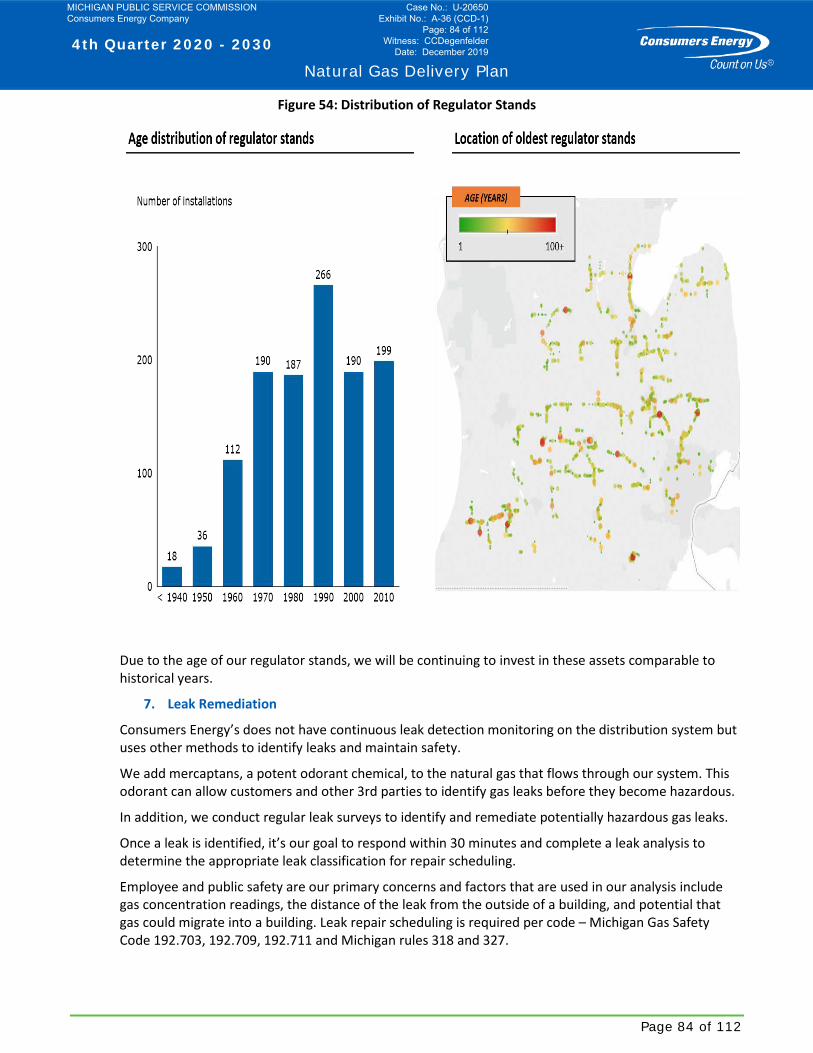
4th Quarter 2020 - 2030
Natural Gas Delivery Plan
Page 84 of 112
Figure 54: Distribution of Regulator Stands
Due to the age of our regulator stands, we will be continuing to invest in these assets comparable to historical years.
7. Leak Remediation
Consumers Energy’s does not have continuous leak detection monitoring on the distribution system but uses other methods to identify leaks and maintain safety.
We add mercaptans, a potent odorant chemical, to the natural gas that flows through our system. This odorant can allow customers and other 3rd parties to identify gas leaks before they become hazardous.
In addition, we conduct regular leak surveys to identify and remediate potentially hazardous gas leaks.
Once a leak is identified, it’s our goal to respond within 30 minutes and complete a leak analysis to determine the appropriate leak classification for repair scheduling.
Employee and public safety are our primary concerns and factors that are used in our analysis include gas concentration readings, the distance of the leak from the outside of a building, and potential that gas could migrate into a building. Leak repair scheduling is required per code – Michigan Gas Safety Code 192.703, 192.709, 192.711 and Michigan rules 318 and 327.
MICHIGAN PUBLIC SERVICE COMMISSION Consumers Energy Company
Case No.: U-20650 Exhibit No.: A-36 (CCD-1)
Page: 84 of 112 Witness: CCDegenfelder
Date: December 2019
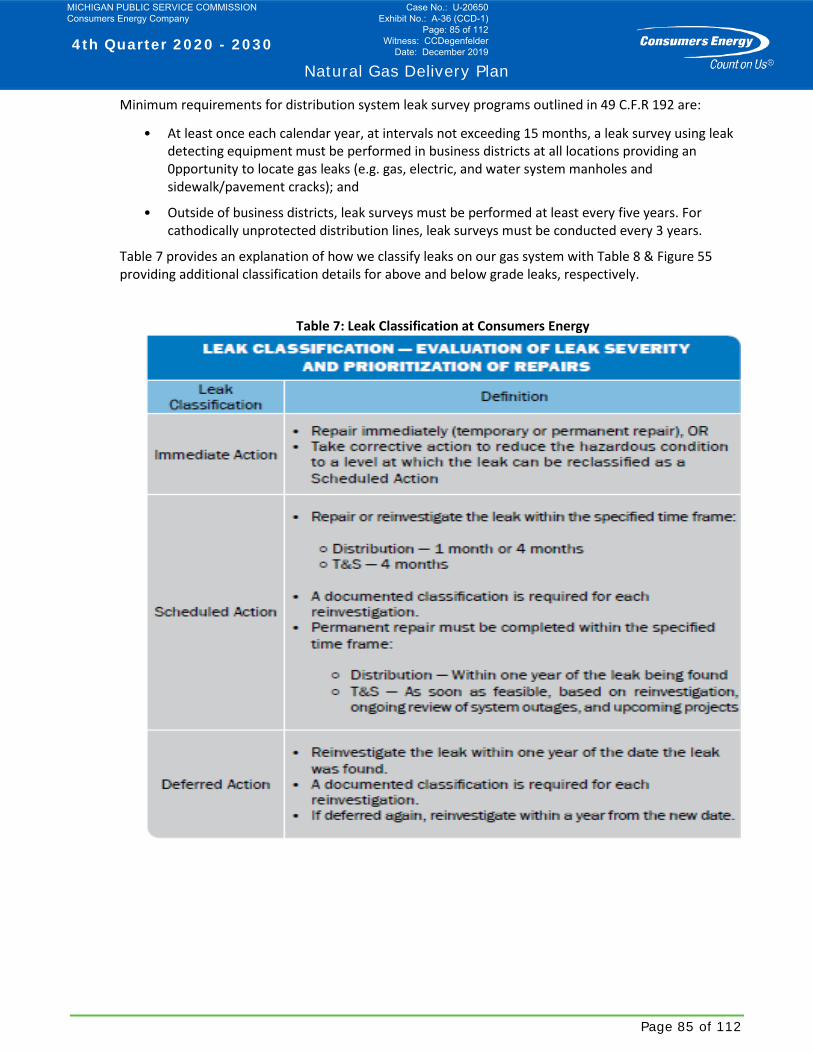
4th Quarter 2020 - 2030
Natural Gas Delivery Plan
Page 85 of 112
Minimum requirements for distribution system leak survey programs outlined in 49 C.F.R 192 are:
• At least once each calendar year, at intervals not exceeding 15 months, a leak survey using leak detecting equipment must be performed in business districts at all locations providing an 0pportunity to locate gas leaks (e.g. gas, electric, and water system manholes and sidewalk/pavement cracks); and
• Outside of business districts, leak surveys must be performed at least every five years. For cathodically unprotected distribution lines, leak surveys must be conducted every 3 years.
Table 7 provides an explanation of how we classify leaks on our gas system with Table 8 & Figure 55 providing additional classification details for above and below grade leaks, respectively.
Table 7: Leak Classification at Consumers Energy
MICHIGAN PUBLIC SERVICE COMMISSION Consumers Energy Company
Case No.: U-20650 Exhibit No.: A-36 (CCD-1)
Page: 85 of 112 Witness: CCDegenfelder
Date: December 2019
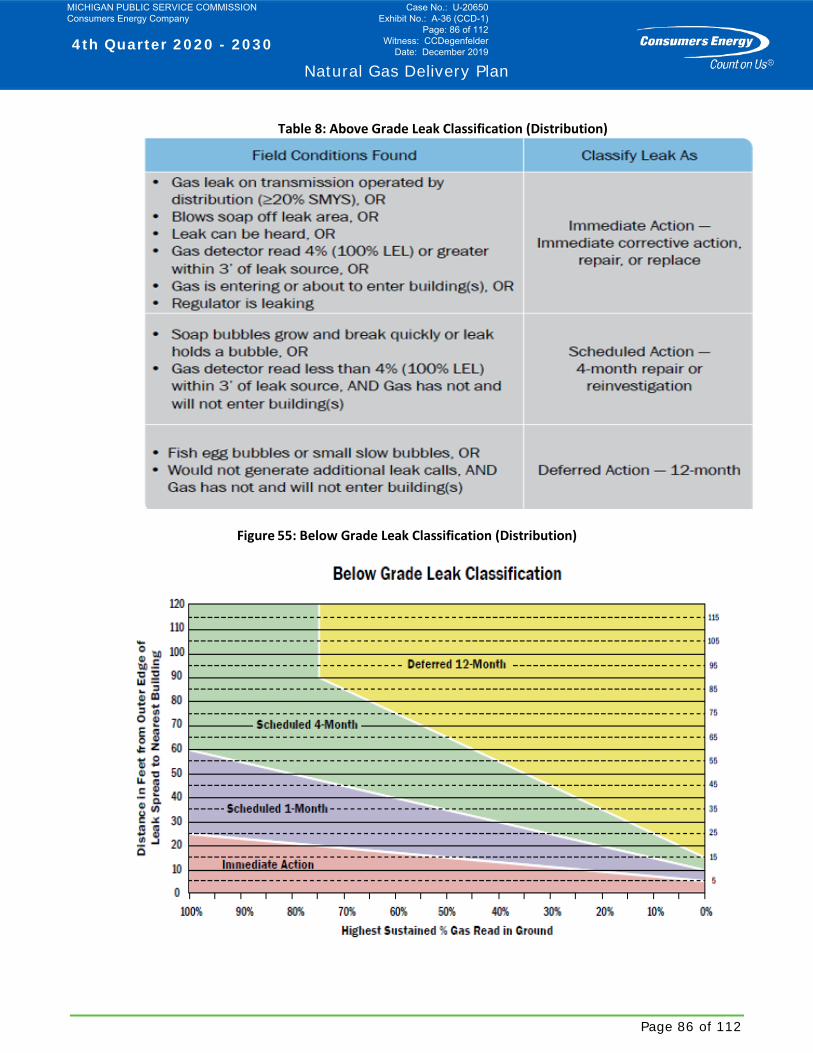
4th Quarter 2020 - 2030
Natural Gas Delivery Plan
Page 86 of 112
Table 8: Above Grade Leak Classification (Distribution)
Figure 55: Below Grade Leak Classification (Distribution)
MICHIGAN PUBLIC SERVICE COMMISSION Consumers Energy Company
Case No.: U-20650 Exhibit No.: A-36 (CCD-1)
Page: 86 of 112 Witness: CCDegenfelder
Date: December 2019
4th Quarter 2020 - 2030
Natural Gas Delivery Plan
Page 87 of 112
In mid-2018, our distribution system had roughly 12,000 active leaks. To reduce the active leaks, we focused on remediating above-grade service leaks.
• Within one month, our crews were able to fix roughly 4,000 above-grade rural service leaks; and
• While above-grade leaks are commonly the easiest to remediate, the effort helped us estimate the resources required and costs of remediating all remaining active leaks.
With roughly 3,500 below-grade leaks and 4,200 above-grade leaks remaining, as shown in Figure 56, we estimate an additional capital requirement of approximately $10 million. (See Reference 5 in this section for citation source.)
However, based on 2019 data, we have seen approximately 14,100 total active leaks (3,200 below-grade and 10,900 above-grade), which is an additional 7,000 leaks from 2018. This data further shows the need to accelerate the vintage material remediation in order to continuously reduce our leak backlog over time.
C. Distribution Asset Financials
Our largest capital increase is due to the acceleration of vintage material remediation. We believe we can lower our remediation costs through economies of scale and work management improvements, and therefore we expect our total main and services remediation to cost approximately $3 billion.
While this total cost is not far from our current expected EIRP and VSR cost, it would require a much faster capital outlay. With a 10-year target instead of our 16- to 26-year pace, this would represent about $300 million in capital per year.
Due to the process changes and labor required, we anticipate a ramp-up period of approximately three years, with our first full $300 million per year in 2023.
The capital investment plan for the entire distribution asset class is shown in Figure 56.
MICHIGAN PUBLIC SERVICE COMMISSION Consumers Energy Company
Case No.: U-20650 Exhibit No.: A-36 (CCD-1)
Page: 87 of 112 Witness: CCDegenfelder
Date: December 2019
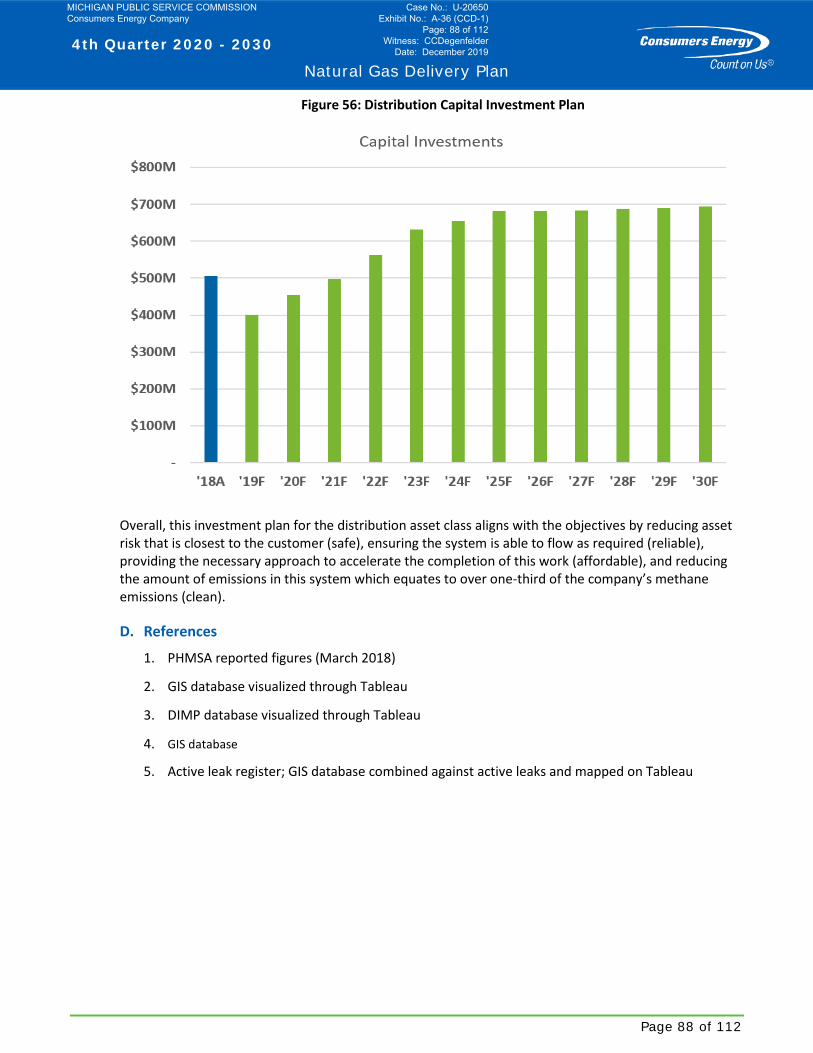
4th Quarter 2020 - 2030
Natural Gas Delivery Plan
Page 88 of 112
Figure 56: Distribution Capital Investment Plan
Overall, this investment plan for the distribution asset class aligns with the objectives by reducing asset risk that is closest to the customer (safe), ensuring the system is able to flow as required (reliable), providing the necessary approach to accelerate the completion of this work (affordable), and reducing the amount of emissions in this system which equates to over one-third of the company’s methane emissions (clean).
D. References
1. PHMSA reported figures (March 2018)
2. GIS database visualized through Tableau
3. DIMP database visualized through Tableau
4. GIS database
5. Active leak register; GIS database combined against active leaks and mapped on Tableau
MICHIGAN PUBLIC SERVICE COMMISSION Consumers Energy Company
Case No.: U-20650 Exhibit No.: A-36 (CCD-1)
Page: 88 of 112 Witness: CCDegenfelder
Date: December 2019
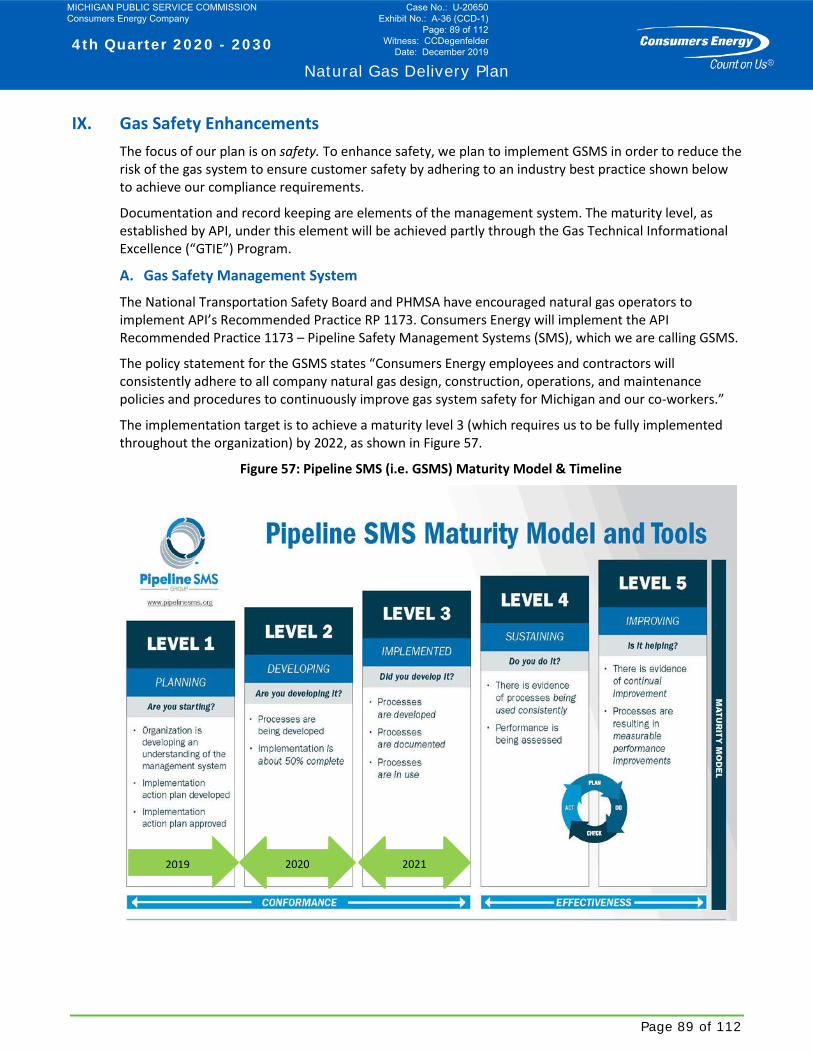
4th Quarter 2020 - 2030
Natural Gas Delivery Plan
Page 89 of 112
IX. Gas Safety Enhancements The focus of our plan is on safety. To enhance safety, we plan to implement GSMS in order to reduce the risk of the gas system to ensure customer safety by adhering to an industry best practice shown below to achieve our compliance requirements.
Documentation and record keeping are elements of the management system. The maturity level, as established by API, under this element will be achieved partly through the Gas Technical Informational Excellence (“GTIE”) Program.
A. Gas Safety Management System
The National Transportation Safety Board and PHMSA have encouraged natural gas operators to implement API’s Recommended Practice RP 1173. Consumers Energy will implement the API Recommended Practice 1173 – Pipeline Safety Management Systems (SMS), which we are calling GSMS.
The policy statement for the GSMS states “Consumers Energy employees and contractors will consistently adhere to all company natural gas design, construction, operations, and maintenance policies and procedures to continuously improve gas system safety for Michigan and our co-workers.”
The implementation target is to achieve a maturity level 3 (which requires us to be fully implemented throughout the organization) by 2022, as shown in Figure 57.
Figure 57: Pipeline SMS (i.e. GSMS) Maturity Model & Timeline
2019 2020 2021
MICHIGAN PUBLIC SERVICE COMMISSION Consumers Energy Company
Case No.: U-20650 Exhibit No.: A-36 (CCD-1)
Page: 89 of 112 Witness: CCDegenfelder
Date: December 2019
4th Quarter 2020 - 2030
Natural Gas Delivery Plan
Page 90 of 112
API RP 1173 includes 10 essential elements. To better suit the operational and management structure of the Company, we subdivided the essential elements of stakeholder engagement, risk management and operational controls.
An additional element—Prioritization, Resources and Unit Costs—is included in the GSMS.
1. Leadership & Management Commitment
2. Stakeholder Engagement
a. Customer Complaints
b. Customer Deliverability
3. Risk Management
a. Asset Risk Management
b. Gas Regulatory Compliance Risk
c. Gas Cybersecurity Risk
4. Operational Controls
a. Operational & Maintenance Controls
b. Design Controls & Management of Change
5. Incident Investigation, Evaluation & Lessons Learned
6. Safety Assurance (internal and external audits, corrective action program)
7. Management Review & Continuous Improvement
8. Emergency Preparedness & Response
9. Competence, Awareness & Training
10. Documentation & Record Keeping
11. Prioritization, Resources and Unit Costs
The implementation committee is comprised of representation from various internal organizations affected by the GSMS. Members of the implementation team are referred to as element owners.
The responsibility of an element owner is to bring visibility to gaps identified in their area and lead the gap closure efforts with the support of other personnel (employee and contractor) resources.
MICHIGAN PUBLIC SERVICE COMMISSION Consumers Energy Company
Case No.: U-20650 Exhibit No.: A-36 (CCD-1)
Page: 90 of 112 Witness: CCDegenfelder
Date: December 2019
4th Quarter 2020 - 2030
Natural Gas Delivery Plan
Page 91 of 112
B. Gas Technical Information Excellence
Accurate records are critical to success for a gas system operator.
The mission statement for the GTIE program is to “ensure our gas technical records and information are accurate, complete and accessible, making our employees more efficient while increasing confidence in public safety.”
The implementation target is a score of 4.2 on the ARMA Information Governance Maturity Model by 2022.
The GTIE Program is aligned with Consumers Energy’s Corporate Information Governance organization in the adoption and deployment of the ARMA Generally Accepted Record Keeping Principles, defining how to govern gas technical records and information.
The ARMA is a recognized industry body for records management best practices. The GTIE Program will provide:
1. Process and procedure improvements around the creation, organization, retention, and destruction of gas-specific records and information;
2. Support the implementation of technical tools that enable the maintenance and use of our gas technical records throughout their lifecycle (creation, capture, storage, access, retention, and disposition); and
3. Execute training and communications to build a culture of effective records and information management.
The GTIE Program will develop and implement strategies, standards and requirements designed to promote consistent activities across the entire gas organization, resulting in accurate, complete and accessible technical records.
Effective records management saves money and reduces risk for the gas organization by increasing accuracy, accessibility, and resource efficiency; and, by improving public, employee, and environmental safety.
In May 2018, the GTIE Program implemented our technology platform using an Engineering Content Management system for project engineering technical records.
• Critical records and information will be migrated using a phased multi-year approach across all of gas engineering; and
• The technology will provide the basis for improvements in the access, integrity, protection, and preservation of records and information.
MICHIGAN PUBLIC SERVICE COMMISSION Consumers Energy Company
Case No.: U-20650 Exhibit No.: A-36 (CCD-1)
Page: 91 of 112 Witness: CCDegenfelder
Date: December 2019
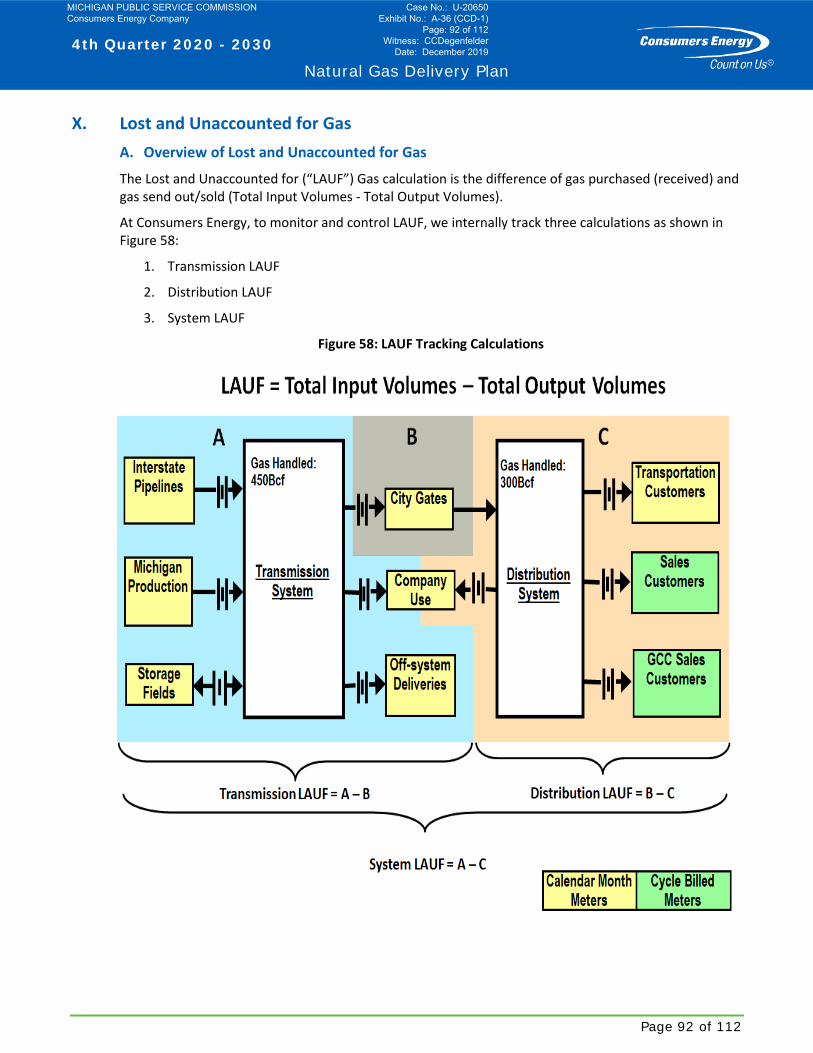
4th Quarter 2020 - 2030
Natural Gas Delivery Plan
Page 92 of 112
X. Lost and Unaccounted for Gas A. Overview of Lost and Unaccounted for Gas
The Lost and Unaccounted for (“LAUF”) Gas calculation is the difference of gas purchased (received) and gas send out/sold (Total Input Volumes - Total Output Volumes).
At Consumers Energy, to monitor and control LAUF, we internally track three calculations as shown in Figure 58:
1. Transmission LAUF
2. Distribution LAUF
3. System LAUF
Figure 58: LAUF Tracking Calculations
MICHIGAN PUBLIC SERVICE COMMISSION Consumers Energy Company
Case No.: U-20650 Exhibit No.: A-36 (CCD-1)
Page: 92 of 112 Witness: CCDegenfelder
Date: December 2019

4th Quarter 2020 - 2030
Natural Gas Delivery Plan
Page 93 of 112
1. Transmission LAUF
The Transmission LAUF is calculated using measured volumes of gas entering the transmission system from storage field withdrawals, Michigan production wells and interstate pipelines—then subtracting the deliveries from the transmission system to storage field injections, city gates, third parties and company use.
The measured volume of gas within the transmission system is calculated using American Gas Association (“AGA”) algorithms programmed into the remote terminal units (“RTU”) that are part of the SCADA system.
• These algorithms can precisely take into account a variety of factors impacting gas measurement including: temperature, pressure and gas quality to calculate corrected gas volumes as shown in Figure 59.
Figure 59: Transmission LAUF 2015 - 2019
MICHIGAN PUBLIC SERVICE COMMISSION Consumers Energy Company
Case No.: U-20650 Exhibit No.: A-36 (CCD-1)
Page: 93 of 112 Witness: CCDegenfelder
Date: December 2019
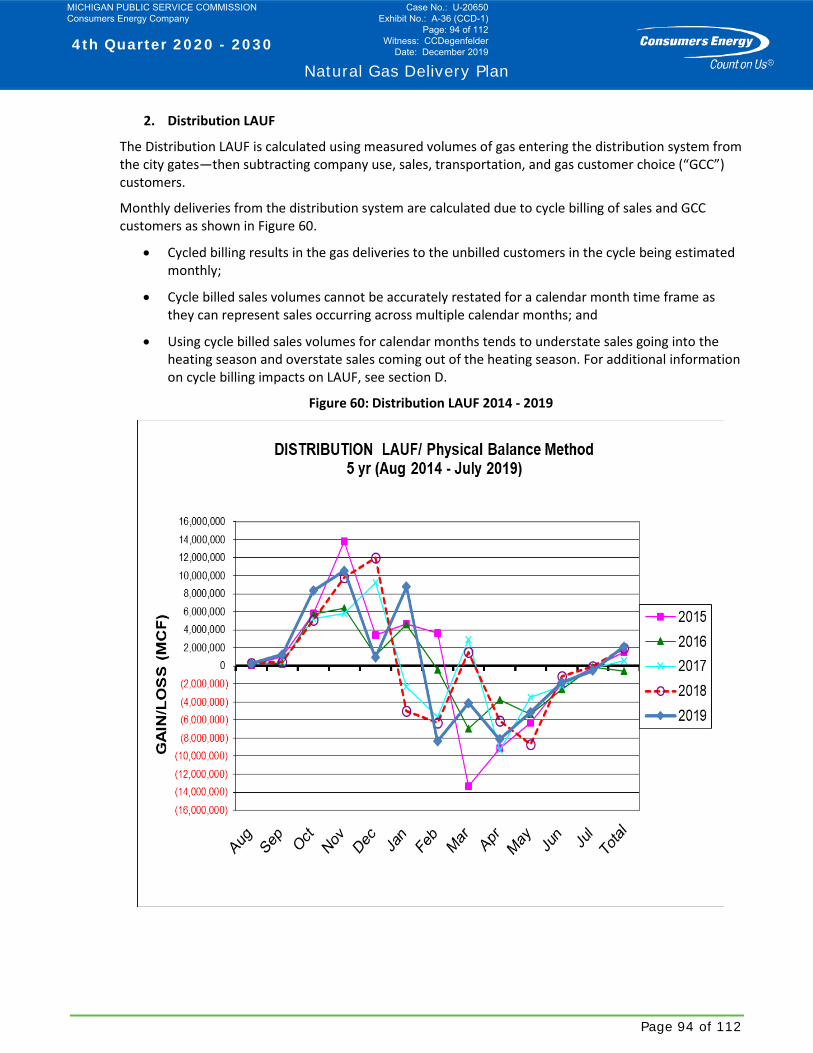
4th Quarter 2020 - 2030
Natural Gas Delivery Plan
Page 94 of 112
2. Distribution LAUF
The Distribution LAUF is calculated using measured volumes of gas entering the distribution system from the city gates—then subtracting company use, sales, transportation, and gas customer choice (“GCC”) customers.
Monthly deliveries from the distribution system are calculated due to cycle billing of sales and GCC customers as shown in Figure 60.
• Cycled billing results in the gas deliveries to the unbilled customers in the cycle being estimated monthly;
• Cycle billed sales volumes cannot be accurately restated for a calendar month time frame as they can represent sales occurring across multiple calendar months; and
• Using cycle billed sales volumes for calendar months tends to understate sales going into the heating season and overstate sales coming out of the heating season. For additional information on cycle billing impacts on LAUF, see section D.
Figure 60: Distribution LAUF 2014 - 2019
MICHIGAN PUBLIC SERVICE COMMISSION Consumers Energy Company
Case No.: U-20650 Exhibit No.: A-36 (CCD-1)
Page: 94 of 112 Witness: CCDegenfelder
Date: December 2019
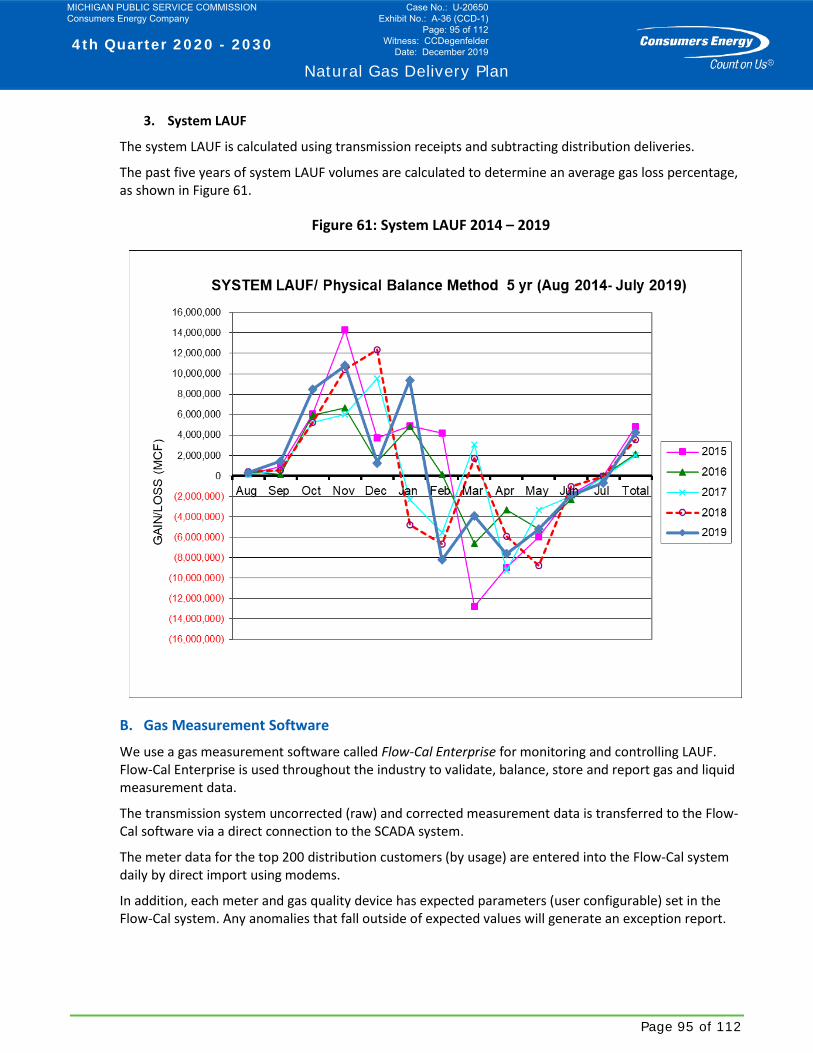
4th Quarter 2020 - 2030
Natural Gas Delivery Plan
Page 95 of 112
3. System LAUF
The system LAUF is calculated using transmission receipts and subtracting distribution deliveries.
The past five years of system LAUF volumes are calculated to determine an average gas loss percentage, as shown in Figure 61.
Figure 61: System LAUF 2014 – 2019
B. Gas Measurement Software
We use a gas measurement software called Flow-Cal Enterprise for monitoring and controlling LAUF. Flow-Cal Enterprise is used throughout the industry to validate, balance, store and report gas and liquid measurement data.
The transmission system uncorrected (raw) and corrected measurement data is transferred to the Flow-Cal software via a direct connection to the SCADA system.
The meter data for the top 200 distribution customers (by usage) are entered into the Flow-Cal system daily by direct import using modems.
In addition, each meter and gas quality device has expected parameters (user configurable) set in the Flow-Cal system. Any anomalies that fall outside of expected values will generate an exception report.
MICHIGAN PUBLIC SERVICE COMMISSION Consumers Energy Company
Case No.: U-20650 Exhibit No.: A-36 (CCD-1)
Page: 95 of 112 Witness: CCDegenfelder
Date: December 2019
4th Quarter 2020 - 2030
Natural Gas Delivery Plan
Page 96 of 112
The following are the benefits from the Flow-Cal Measurement software:
• Measurement data validation: Provides automated review of individual meters and allows for creation of validation set points for meter variables;
• System balancing: System balancing on volume and energy;
• Segments and balancing zone: Data can be used to further segment creating subsystems which can be balanced;
• Auto estimation: Automatically recognizes data is missing and calculates estimated data based on user defined algorithms;
• Auditing: Automatically compares check and audit meter data against custody transfer meter;
• Gas quality data validation: Meters assigned to a GQ Source have volume and energy recalculated using the updated gas quality data;
• Accountability: System uses industry calculation standards of AGA and API audit trail standards. Flow-Cal has been deemed SOX compliant by third party auditors; and
• Monthly close function: Subsequent changes to meter records requires a prior period adjustment that is automatically preserved in the audit trail and file history.
C. Factors Contributing to Gas Loss
There are many factors that can contribute to LAUF. The most common factors are related to measurement uncertainty, theft, and leaks, including:
1. Compressibility Factor;
• Natural gas is a compressible fluid. Therefore, the calculation of the compressibility factor is critical for accurate gas measurement; and
• The compressibility factor is calculated using pressure, temperature, and gas composition.
2. Meter Condition;
• Poor maintenance and/or inspections;
• Incorrect size or condition of orifice plates;
• Straightening vanes/Flow profilers altered or removed;
• Dirty meter tubes, plugged gauge lines; and
• Shortened meter runs.
3. Incorrectly calibrated meters and/or transmitters;
4. Incorrect metering and/or chromatograph data entered in RTUs;
5. Lost data from RTU to Gas Control (i.e. communication errors between systems);
6. Pulsations/Variations in gas flow;
7. Incomplete reporting of lost gas (i.e. blowdowns, 3rd party damage); and
8. Stolen Gas.
MICHIGAN PUBLIC SERVICE COMMISSION Consumers Energy Company
Case No.: U-20650 Exhibit No.: A-36 (CCD-1)
Page: 96 of 112 Witness: CCDegenfelder
Date: December 2019

4th Quarter 2020 - 2030
Natural Gas Delivery Plan
Page 97 of 112
D. Cycle (Portion) Billing Impacts on Distribution and System LAUF
Cycle (also called portion) billing is a practice of invoicing a proportionate fraction of customers on each working day of a month. Consumers Energy uses 21 portions (01 – 21) to bill customers.
Cycle billing is the period of time from the end of one billing statement to the start of the next and spans across months. For example, a cycle could be November 19th to December 18th, totaling 30 days of usage, but these 30 days are split across the 2 months. It is not the same as calendar month billing, which starts on the first day of the month and ends on the last day of the month.
• Due to the cycle billing practice, we do not receive a month start and month end meter read for each customer, therefore we are unable to determine measured gas volumes delivered from the Distribution system for a calendar month period.
Consumers Energy estimates the monthly delivered gas volumes using a process that estimates the unbilled cycles to calculate calendar sales each month.
• The actual amount billed each month (CM = current month) is subtracted from the net send out to arrive at the net unbilled for the month; and
• The CM Unbilled is the result of subtracting the PM Unbilled (PM = prior month) from the current month Net Unbilled.
This has the effect of progressively accumulating unbilled from month-to-month when net line losses (unbilled) are greater than estimated.
• Net Unbilled = Net send out – CM Billed (GCC & GCR);
• CM Unbilled = Net Unbilled - PM Unbilled; and
• Calendar Sales = CM Billed + CM Unbilled.
Since each cycle starts/ends on a different working day each month, each cycle has a different percentage of actual and estimated reads.
• The Net Unbilled calculation can represent up to 60% of the estimated Distribution send out each month.
Referencing the Distribution and System LAUF graphs in Figure 60, Figure 61, and Figure 62, the Monthly Unbilled estimate tends to understate sales going into the heating season and overstate sales coming out of the heating season.
This is why we show high LAUF monthly losses during the colder months and high LAUF gains in the warmer months. As usage drops, the Net Unbilled calculation is smaller and customer billing catches up.
E. Outline for LAUF Monitoring and Control Improvements
1. Smart Energy and Gas Automated Meter Reading
With the completion of the Smart Energy (“AMI”) and Gas Automated Meter Reading (“AMR”) projects, we will be able to incorporate the use of monthly reads for the calculation of delivered gas to sales customers reducing the unbilled cycle estimate explained in Section D.
MICHIGAN PUBLIC SERVICE COMMISSION Consumers Energy Company
Case No.: U-20650 Exhibit No.: A-36 (CCD-1)
Page: 97 of 112 Witness: CCDegenfelder
Date: December 2019

4th Quarter 2020 - 2030
Natural Gas Delivery Plan
Page 98 of 112
In addition, we will be able to incorporate actual monthly deliveries from the Distribution system into the Flow-Cal software to support system physical balance calculations and system segmentation in the future. Adding this data to the Flow-Cal system will provide more accurate monitoring and control of Distribution LAUF.
2. Gas Quality and Measurement Improvement Projects
• Installation of gas quality equipment:
− Installing gas quality equipment such as chromatographs, filter separators, slug catchers, hydro carbon dew points and water and hydrogen sulfide analyzers to verify gas received from suppliers or withdrawn from storage facility meets the requirements of pipeline quality gas in accordance with regulatory requirements;
− This will allow the Company to enhance gas quality, reduce measurement uncertainty, reduce internal pipeline corrosion and support system integrity efforts; and
− We plan to install twenty Gas chromatographs and other component analyzer systems across state.
• Measurement improvement projects:
− Install check meters at major interchanges: Check meters are used to validate delivery volumes from interstate suppliers. By ensuring the accuracy of volume received onto our transmission system, we can compare one or more meters to third party-reported meters, or one meter to another meter at any station to identify problems with measurement. We plan to install check meters at interstate supplier sites above 2 Bcf flow per year;
− Orifice meter replacement: We have a long-term program to replace 50- to 65-year-old orifice meters to reduce O&M cost and improve measurement accuracy using highly accurate ultrasonic meters (“USM”) over the next 15 years. Benefits of this program include: enhancing measurement accuracy, reducing measurement uncertainty and enhancing safety by eliminating operational/mechanical failures associated with orifice meters; and
− Single path ultrasonic meters for residential customers: The industry has used multi-path USM technology for decades on the transmission system for many applications including custody transfer. In 2019, multiple gas meter manufacturers introduced a single path USM for use on residential customers. These new meters offer improved measurement accuracy as well as safety features such as pressure monitoring and remote shut-off capabilities. USM meters have many advantages over the conventional diaphragm meters used today such as a wider turn-down ratio allowing the meter to measure a wider range of flow and create relatively little pressure drop. They have no moving parts and require very little maintenance. The long-term plan for implementing this technology needs to be aligned with Smart Energy/Gas AMR technology to maximize the benefits of higher accuracy, remote shut-off capabilities and automated meter reading.
3. Increase utilization of Flow-Cal Enterprise Gas Automation Software
• Gas system segmentation within the Flow-Cal system: Installation of boundary meters to enable system segmentation and tracking of LAUF by zones (segments). Further refinement into zones results in improved LAUF tracking and issue identification.
MICHIGAN PUBLIC SERVICE COMMISSION Consumers Energy Company
Case No.: U-20650 Exhibit No.: A-36 (CCD-1)
Page: 98 of 112 Witness: CCDegenfelder
Date: December 2019
4th Quarter 2020 - 2030
Natural Gas Delivery Plan
Page 99 of 112
XI. Gas Demand Response As requested in the Statewide Energy Assessment, we are initiating gas DR pilots that will incentivize residential and commercial and industrial (“C&I”) customers to reduce their gas consumption during times of peak system demand or abnormal system conditions. We are proposing that the pilots would run during the winter of 2020/2021.
• The pilots will add a voluntary tool that can be called upon to balance our available system capacity and customer load requirements—ultimately minimizing system constraints and downstream customer impacts in support of providing system resilience; and
• The purpose of the pilots is to:
− Assess the opportunity to potentially avoid or defer capital infrastructure costs; and
− Evaluate customers’ receptiveness to the offering.
The pilots will be implemented through a contract-based rate for C&I customers and a ‘Bring Your Own Device’ smart thermostat approach for residential customers — both modeled after electric DR programs currently offered to customers and described below.
• The Residential pilot will be a Bring Your Own Device (“BYOD”) Smart Thermostat program. The Company is proposing that the pilot would run during the winter of 2020/2021 and would initially target 3,000 customers who have a gas furnace and a Wi-Fi enabled smart thermostat. The program would use a cloud-based software deployed through the customer’s Wi-Fi thermostat to reduce the heating load during demand response events. The projected cost of developing and implementing this pilot is $3.0 million in O&M; and
• The C&I pilots will incentivize customers to provide net reductions of natural gas during pilot events. Two programs will be developed, one for large C&I customers and a second for small to medium C&I customers.
− For the large customer C&I program, each customer would contract for a specified load (MCf) reduction during events for the program year of December 1 through February 28. The customer contract would set forth the program parameters, including the program period, timing and frequency of events, minimum advanced notification time, primary contacts to receive event notifications, how performance will be calculated, rules regarding non-performance, and the compensation the customer will receive for the reduction provided; and
− For the small to medium pilot program, the Company will offer a BYOD C&I gas DR pilot similar to the residential BYOD pilot described above. Customers will have their usage adjusted through control of their compatible Wi-Fi enabled thermostat. The Company will be targeting up to 450 business customers to participate in this pilot. The projected cost of developing and implementing both components of the C&I Gas DR pilot is $1.0 million in O&M.
The goal of the pilots is to achieve demand savings of 0.012-0.050 therms per residential customer enrolled, and to determine the potential total reduction in daily gas consumption, which could support the resilience of the gas system in the future by lowering peak demands at critical times of the year.
MICHIGAN PUBLIC SERVICE COMMISSION Consumers Energy Company
Case No.: U-20650 Exhibit No.: A-36 (CCD-1)
Page: 99 of 112 Witness: CCDegenfelder
Date: December 2019
4th Quarter 2020 - 2030
Natural Gas Delivery Plan
Page 100 of 112
XII. Operational Capabilities As we move forward with the Natural Gas Delivery Plan, there will be intentional actions by Consumers Energy in the areas of people, process and technology for each of the asset areas to successfully achieve the 10-year objectives, goals and outcomes.
A. People – Talent and Workforce Approach
From a people perspective, we are focused on how we can safely deliver for our customers by ensuring we have the right people, with the right skills, at the right place and time.
• To make sure we meet these commitments, we’re placing a strong focus on creating the right employee experience to ensure we attract and retain the most qualified candidates;
• In addition, we will develop a full-scale Gas City Training Village that will allow us to train our employees through real-time situations and continue our relentless focus on making safety our top priority. We will need enhanced and evolving cybersecurity skills to protect our assets as technology becomes more integrated with our assets. As customer expectations shift to on-demand expert advisement and more personalized experience, we will need a workforce skilled in leveraging the power of data to meet customer needs;
− A variety of new skills will be needed to deliver on our business plans over the next 10 years. This framework will provide a means to build these skillsets at scale, including developing current employees and adding new employees with different talents; and
− The knowledge, skills, and abilities of our employees are key determinants in the quality and timeliness of service that customers receive. Our ability to deliver what customers expect— such as reliable and safe energy delivery, on-time completion of service orders, energy savings, accurate billing and easy-to-navigate website and mobile applications—depends upon having the right talent in the right job at the right time;
• This framework will facilitate the matching of employees, capabilities and qualifications to the requirements of the business to minimize the risk and costs of employee turnover. We’ve also developed a competitive Michigan workforce of more than 600 employees that constructs infrastructure projects; and
• We are providing jobs for veterans through outreach efforts, for a diverse and inclusive workforce of choice.
Overall, we are confident we will have the talented workforce necessary to execute successfully on this plan.
MICHIGAN PUBLIC SERVICE COMMISSION Consumers Energy Company
Case No.: U-20650 Exhibit No.: A-36 (CCD-1)
Page: 100 of 112 Witness: CCDegenfelder
Date: December 2019
4th Quarter 2020 - 2030
Natural Gas Delivery Plan
Page 101 of 112
B. Process – Operational Excellence
1. The CE Way
In 2016, we began our CE Way journey to provide the best value for our customers through a culture of continuous improvement.
While still early in our journey, we created a large footprint across the organization by exposing employees’ company-wide to the CE Way, and building a strong desire to improve Safety, Quality, Cost, Delivery, and Morale.
• In 2017, we launched the 4 Basic Plays (Visual Management, Operating Reviews, Problem Solving, and Standard Work) as a prioritized approach for leaders to begin implementing the CE Way. Since that time, we have added Waste Elimination to our Basic Play toolkit;
• Through these basics, we’ve established a strong capability that will deliver value to our customers and allow us to sustain breakthrough performance. Consumers Energy’s purpose of “CMS Energy: World Class Performance Delivering Hometown Service” means ensuring we deliver safely, reliably, affordably, and with the highest quality; and
• With this plan at the forefront, and guided by the CE Way, we are committed to achieving operational excellence.
Operational excellence at Consumers Energy means using the CE Way to achieve a state of performance that enables us to deliver on our purpose. Through the application of the Basic Plays, our Company is transforming how we operate to improve performance, the customer experience, and identify opportunities to increase efficiencies in our business.
Examples of performance improvements can be seen across the company as a result of our lean journey. The CE Way Basic Plays are dependent upon one another, and are implemented together to achieve maximum effectiveness in delivering for our customers.
2. Work management
As part of the overall operational excellence process, work management is a key to the successful execution of this plan. Part of transforming our workforce is within the distribution remediation that will include changing to a zone-based model.
As stated in the Distribution Asset Plan section, our remediation projects can range in size, from several hundred feet to a few miles.
Many utilities use a grid-based model to complete projects one at a time, grouping areas of distribution mains and services together based on collective risk as shown below in Figure 62.
MICHIGAN PUBLIC SERVICE COMMISSION Consumers Energy Company
Case No.: U-20650 Exhibit No.: A-36 (CCD-1)
Page: 101 of 112 Witness: CCDegenfelder
Date: December 2019
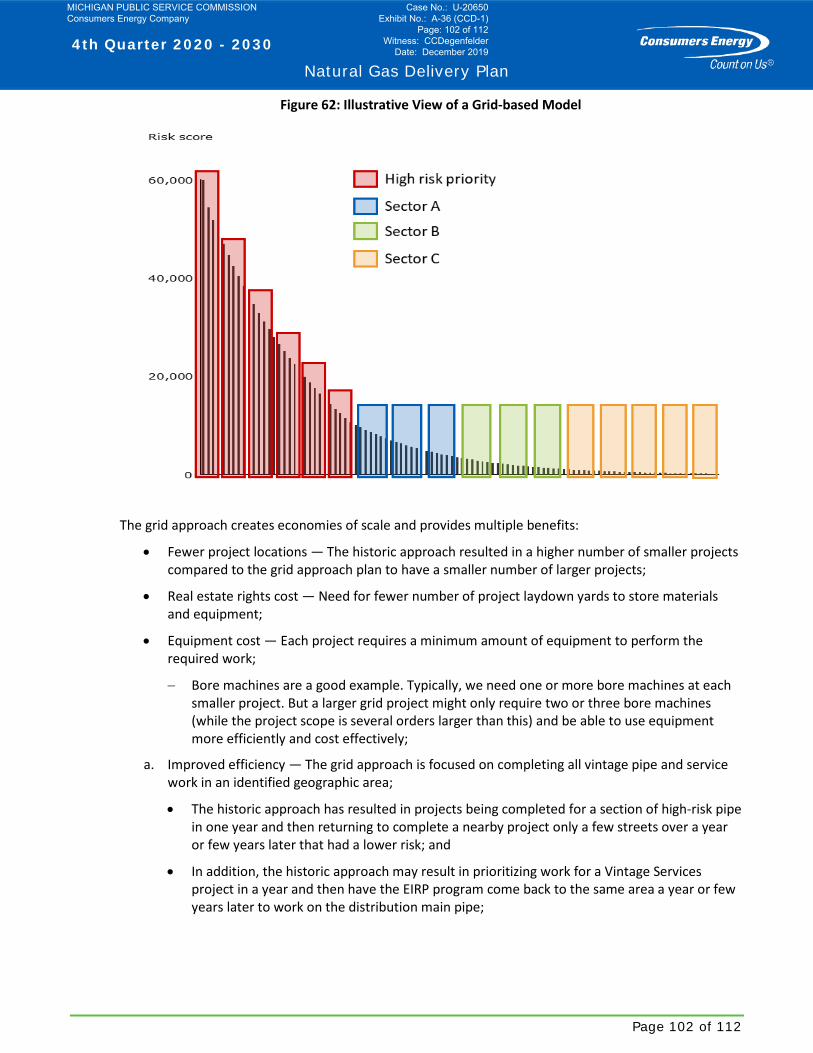
4th Quarter 2020 - 2030
Natural Gas Delivery Plan
Page 102 of 112
Figure 62: Illustrative View of a Grid-based Model
The grid approach creates economies of scale and provides multiple benefits:
• Fewer project locations — The historic approach resulted in a higher number of smaller projects compared to the grid approach plan to have a smaller number of larger projects;
• Real estate rights cost — Need for fewer number of project laydown yards to store materials and equipment;
• Equipment cost — Each project requires a minimum amount of equipment to perform the required work;
− Bore machines are a good example. Typically, we need one or more bore machines at each smaller project. But a larger grid project might only require two or three bore machines (while the project scope is several orders larger than this) and be able to use equipment more efficiently and cost effectively;
a. Improved efficiency — The grid approach is focused on completing all vintage pipe and service work in an identified geographic area;
• The historic approach has resulted in projects being completed for a section of high-risk pipe in one year and then returning to complete a nearby project only a few streets over a year or few years later that had a lower risk; and
• In addition, the historic approach may result in prioritizing work for a Vintage Services project in a year and then have the EIRP program come back to the same area a year or few years later to work on the distribution main pipe;
MICHIGAN PUBLIC SERVICE COMMISSION Consumers Energy Company
Case No.: U-20650 Exhibit No.: A-36 (CCD-1)
Page: 102 of 112 Witness: CCDegenfelder
Date: December 2019

4th Quarter 2020 - 2030
Natural Gas Delivery Plan
Page 103 of 112
b. Increased productivity — The grid approach will reduce the amount of project mobilization and demobilization travel time and cost each year, allowing construction crews to use that time for productive project work; and
c. Improved coordination with local communities — Longer-term planning and communication on fewer and larger projects will improve coordination of local public works projects and plans. This allows us to explore cost savings opportunities with local municipal partners.
C. Technology – Digital Approach
Digital capabilities are essential to optimizing our compression and storage assets, modernizing the distribution and transmission systems, incorporating predictive and condition-based maintenance, transforming work management and ensuring physical and cybersecurity of our assets.
• Digital is about connecting people, technology, and data to improve products and services for our customers and our co-workers.
Our pragmatic digital approach is evolving to support:
• Faster delivery with new practices such as adopting agile frameworks;
• ‘Democratization’ of digital skills and expectations;
• A move to cloud solutions where and when appropriate;
• Data as an asset and deployment of larger-scale analytics;
• Deployment of a consistent asset management system/framework;
• Deployment of integrated control systems for system automation; and
• Continuous operational improvements through automation.
The Plan includes digital investments in: asset management, work management, system automation, control, security and privacy, and advanced analytics:
1. Asset management investments include the ability to store, manage and track our gas assets in a consistent manner to ensure visibility, transparency as part of asset life cycle management and predictive maintenance practices (see advanced analytics below);
• Projects include the implementation of the new Utility Pipeline Data Model in our gas GIS and migration of our service records into GIS;
• In addition, we are evaluating Cavity Ring-Down Spectroscopy (i.e., Picarro) that could help us better prioritize and plan for this accelerated pace of vintage material remediation along with implementing using risk-based leak surveys;
• In conjunction with risk modeling and prioritization for pipeline and service replacement, utilization of advanced technology like Picarro is being considered as a potential replacement for conventional leak survey. This will be achieved in a systematic manner with a multi-month trial and validation phase, with consideration of the volume of leaks expected in comparison to conventional methods and the subsequent remediations. This trial phase will require the need to purchase two units in 2020;
MICHIGAN PUBLIC SERVICE COMMISSION Consumers Energy Company
Case No.: U-20650 Exhibit No.: A-36 (CCD-1)
Page: 103 of 112 Witness: CCDegenfelder
Date: December 2019
4th Quarter 2020 - 2030
Natural Gas Delivery Plan
Page 104 of 112
• Data is the foundation for predictive maintenance. We will require live digitized records and performance of all assets to enable predictive calculations and a potential future state of machine learning;
• This means we must digitize our current maintenance records into a centralized database;
• Digitally logging these maintenance activities is key to uncovering correlations between asset health and driving factors; and
• We need additional information systems such as updated SCADA and PI Historian systems to obtain critical information necessary to improve in this area;
2. Work management investments include the ability to accurately capture and manage work in a systematic, consistent manner for all work types and crews with integrated forecasting, scheduling and dispatching;
• Implementation of a fleet telematics application would enable and enhance the visibility of crew and work location, creating opportunities to improve crew and work dispatching; and
• Digital projects will enhance work and resource planning, skills and qualifications management and technology support for the EIRP workforce;
3. System automation, control, security and privacy investments include the implementation of an updated gas SCADA system integrated with GIS for gas system visibility and transparency and deployment of RCVs integrated with the gas SCADA system;
• Capabilities would eventually include the ability to control and perform remote shut-off to preserve safety and reliability of the gas system; and
• Additional investments would include securing city gates with card access (transition from a lock-and-key system) to centralize access control and enhance security. The system is capable of both single factor (card only) and two-factor (card and code). Currently we deploy two-factor in only our most sensitive physical areas, generally NERC/CIP medium assets. Two-factor will be something we evaluate for gas facilities over time and as security and regulatory requirements mature. Card access management is a single, centralized system and process for the company. All employees receive basic access to major buildings with specialized access granted through a workflow approval process. Access is monitored through our 24x7 Security Command Center. Processes are in place to deactivate badges immediately upon notification of separation from the company and automatically when not used for specific periods of time;
These projects advance the goals of security, reliability and a more compliant gas system; and
4. Advanced analytics investments include data collection, standardization and analytical model frameworks to implement probabilistic risk models for transmission and distribution;
• We plan to apply advanced statistical and predictive modeling tools and techniques for deriving insights from gas system data. Such projects will enable customer-level load profiling and predictive models with propensity ranking for future gas demand response programs;
• Integrating operational gas system data to a consolidated data repository will strengthen operational reporting and analytical capabilities. For example, pipeline commodity modeling efforts revealed we need to also invest in a repeatable capability for rapid system
MICHIGAN PUBLIC SERVICE COMMISSION Consumers Energy Company
Case No.: U-20650 Exhibit No.: A-36 (CCD-1)
Page: 104 of 112 Witness: CCDegenfelder
Date: December 2019
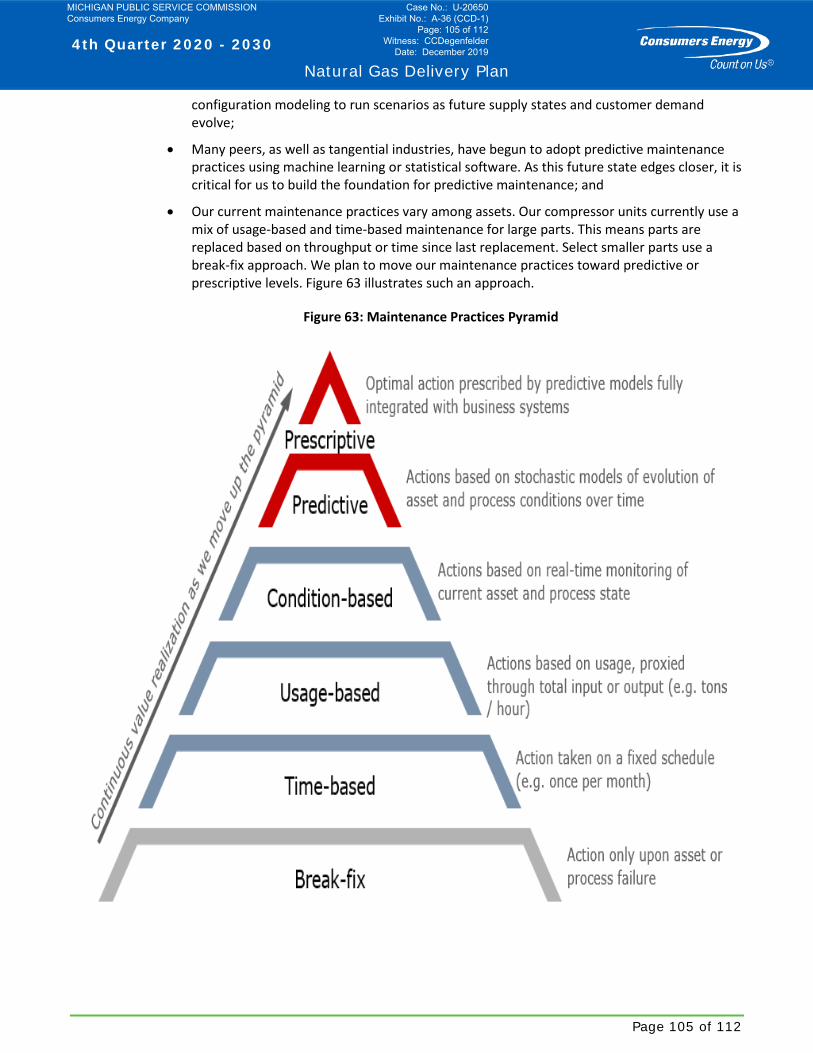
4th Quarter 2020 - 2030
Natural Gas Delivery Plan
Page 105 of 112
configuration modeling to run scenarios as future supply states and customer demand evolve;
• Many peers, as well as tangential industries, have begun to adopt predictive maintenance practices using machine learning or statistical software. As this future state edges closer, it is critical for us to build the foundation for predictive maintenance; and
• Our current maintenance practices vary among assets. Our compressor units currently use a mix of usage-based and time-based maintenance for large parts. This means parts are replaced based on throughput or time since last replacement. Select smaller parts use a break-fix approach. We plan to move our maintenance practices toward predictive or prescriptive levels. Figure 63 illustrates such an approach.
Figure 63: Maintenance Practices Pyramid
MICHIGAN PUBLIC SERVICE COMMISSION Consumers Energy Company
Case No.: U-20650 Exhibit No.: A-36 (CCD-1)
Page: 105 of 112 Witness: CCDegenfelder
Date: December 2019

4th Quarter 2020 - 2030
Natural Gas Delivery Plan
Page 106 of 112
Supporting gas digital investments are foundational investments intended to create the technology platforms, tools, processes and frameworks that enable business outcomes through project delivery.
The investments are organized by capabilities as follows:
• Data and analytics — Accurately manage and collect data, integrate it seamlessly across systems and applications and create insights to inform and enable business outcomes and decisions;
• Data management and governance — Manage data as an asset through data life cycle process (create, update, and delete) for master data management;
• Data integration (Application Programming Interface Fabric) — Integrate data across platforms, systems and applications with a reusable framework to avoid costly point-to-point integrations;
• Cloud platform enablement and operationalizing artificial intelligence and machine learning at-scale — Integrate data, run advanced analytics at-scale using leading machine learning and artificial intelligence frameworks. Manage scalable technical infrastructure remotely over the internet to flex capacity with our needs and demands.
We have already been using cloud solutions by adopting Software as a Service (SaaS) and Platform as a Service (PaaS) offerings. ServiceNow, Office 365, SAP SuccessFactors, CA Clarity and Enviance are examples of SaaS solutions we have implemented. Azure DevOps is an example of a PaaS solution used by developers to manage their software development lifecycle. Infrastructure as a Service (IaaS) is another cloud offering that we have begun to try, along with machine learning, to train an analytics model that will help improve ETR (Estimated Time of Restoration). These are the types of cloud capabilities that will enable future advanced gas analytics;
• Work automation with artificial intelligence - Automate routine, repetitive tasks through software to improve efficiency and productivity;
• Electronic content management — Manage enterprise content/data consistently to enable digital document management for retention, compliance and privacy; and
• Network communications and security and privacy — Manage data, voice and multimedia communications through a reliable and redundant network infrastructure with robust frameworks to protect physical and cybersecurity assets.
Equally important as new digital investments in technology as an integral element of the Plan, is the ability to properly maintain technology assets after implementation.
Prudent technology asset management and replacement programs, system monitoring, timely upgrades and continuous system patching to mitigate cyberthreats are necessary expenditures to sustain business operations and provide the experiences our customers expect.
Figure 64 shows forecasted capital investments for this digital implementation into our gas system and will support many gas projects and programs.
MICHIGAN PUBLIC SERVICE COMMISSION Consumers Energy Company
Case No.: U-20650 Exhibit No.: A-36 (CCD-1)
Page: 106 of 112 Witness: CCDegenfelder
Date: December 2019
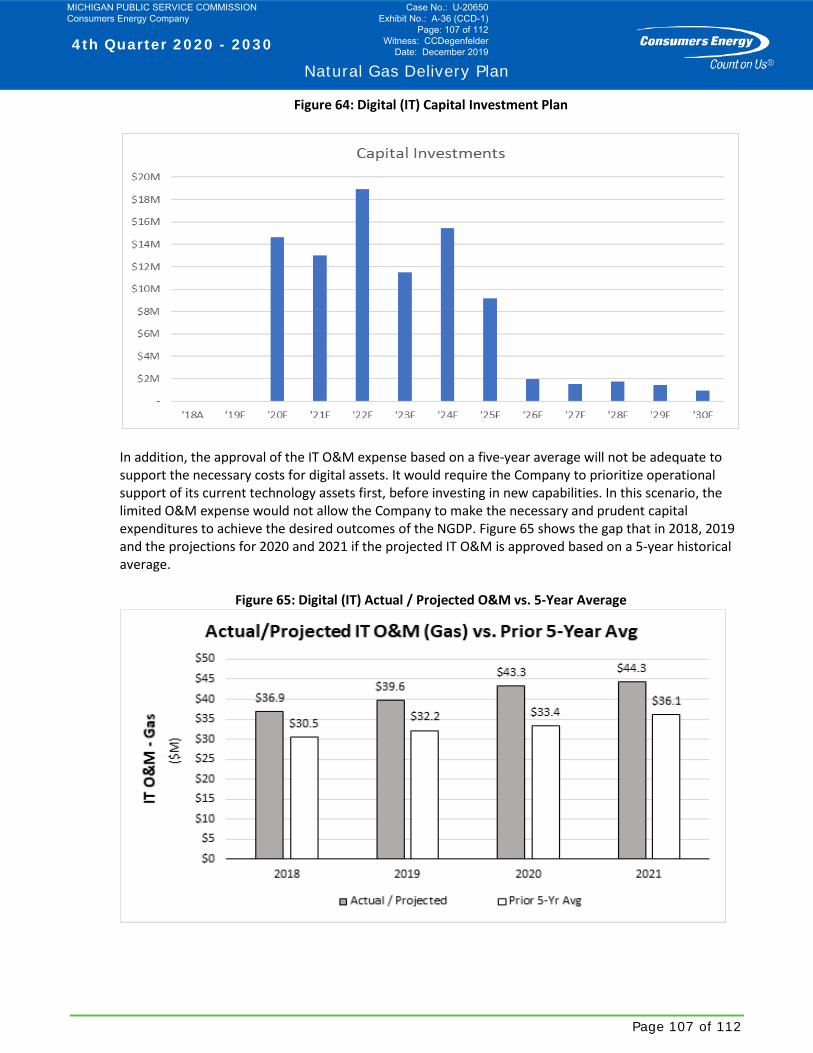
4th Quarter 2020 - 2030
Natural Gas Delivery Plan
Page 107 of 112
Figure 64: Digital (IT) Capital Investment Plan
In addition, the approval of the IT O&M expense based on a five-year average will not be adequate to support the necessary costs for digital assets. It would require the Company to prioritize operational support of its current technology assets first, before investing in new capabilities. In this scenario, the limited O&M expense would not allow the Company to make the necessary and prudent capital expenditures to achieve the desired outcomes of the NGDP. Figure 65 shows the gap that in 2018, 2019 and the projections for 2020 and 2021 if the projected IT O&M is approved based on a 5-year historical average.
Figure 65: Digital (IT) Actual / Projected O&M vs. 5-Year Average
MICHIGAN PUBLIC SERVICE COMMISSION Consumers Energy Company
Case No.: U-20650 Exhibit No.: A-36 (CCD-1)
Page: 107 of 112 Witness: CCDegenfelder
Date: December 2019

4th Quarter 2020 - 2030
Natural Gas Delivery Plan
Page 108 of 112
XIV. Financial Summary A. Benefits of the Integrated System Plan
One of the most significant benefits of the integrated system plan is that we will plan and allocate capital using a holistic view of the entire gas system to prioritize projects between asset classes and aim to better analyze and communicate the trade-offs between the system’s many potential needs and projects.
We will allocate capital based on the most pressing needs of the system and in accordance with our objectives, enabling us to achieve our 10-year outcomes.
We’ll use the four objectives of the Plan (safe, reliable, affordable, and clean) to guide and prioritize future investment decisions.
B. Financial profile
The integrated system plan bases funding decisions about capital projects to fund and the timing on entire system need.
By planning over a 10-year period, we can predictably plan and communicate our investment spend in various portfolios over a longer time, while providing the agility necessary to modify our plans in the future based on potential internal and external changes over time.
Overall, the total future capital spend will be approximately $10.9 billion from 2021 to 2030, at a consistent annual spend of around $1 billion per year enabling more predictability in the budget planning process, as seen in Figure 66.
This level of capital investment is consistent with recent past years. This capital forecast will help us achieve the safe, reliable, and clean objectives by enabling more predictable customer bills while striving for competitive pricing with low gas commodity projections to support the affordability objective.
MICHIGAN PUBLIC SERVICE COMMISSION Consumers Energy Company
Case No.: U-20650 Exhibit No.: A-36 (CCD-1)
Page: 108 of 112 Witness: CCDegenfelder
Date: December 2019
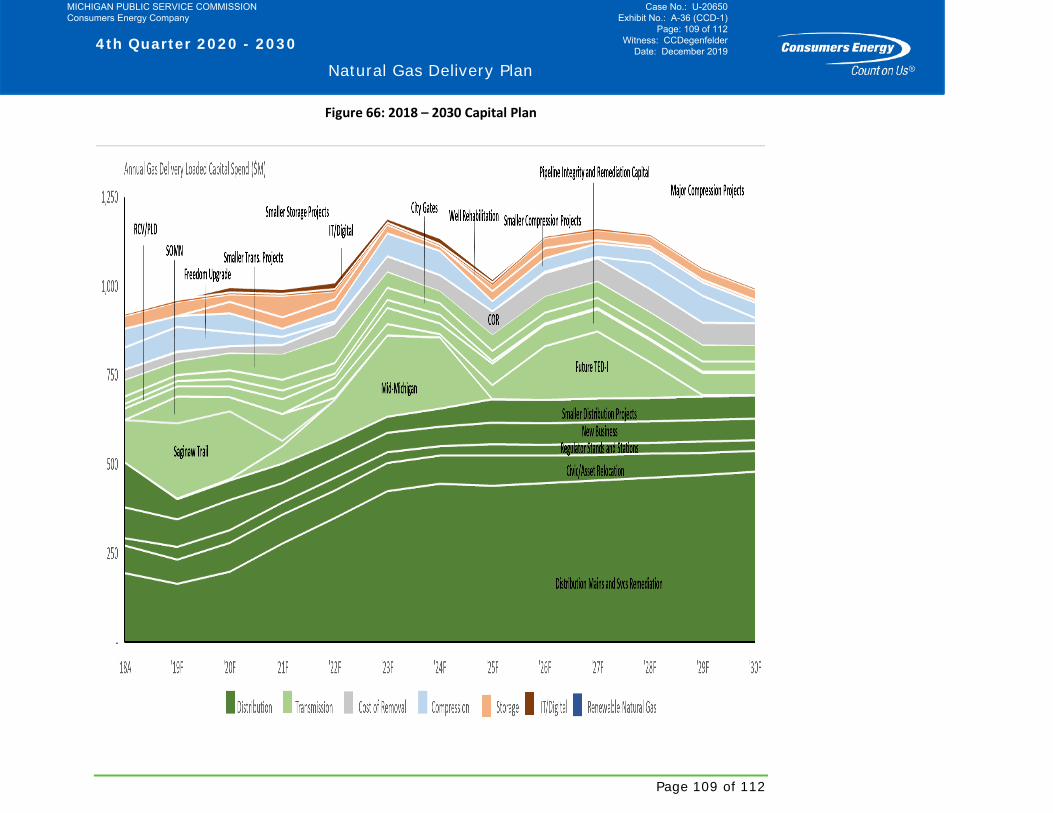
4th Quarter 2020 - 2030
Natural Gas Delivery Plan
Page 109 of 112
Figure 66: 2018 – 2030 Capital Plan
MICHIGAN PUBLIC SERVICE COMMISSION Consumers Energy Company
Case No.: U-20650 Exhibit No.: A-36 (CCD-1)
Page: 109 of 112 Witness: CCDegenfelder
Date: December 2019
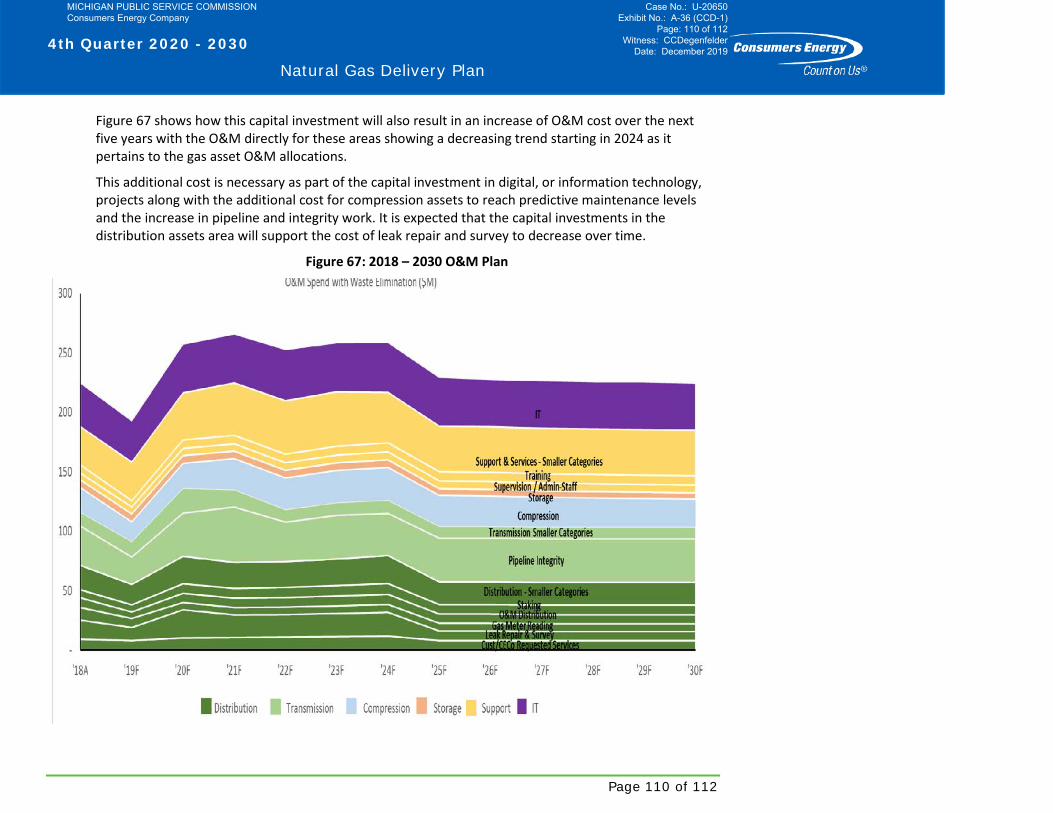
4th Quarter 2020 - 2030
Natural Gas Delivery Plan
Page 110 of 112
Figure 67 shows how this capital investment will also result in an increase of O&M cost over the next five years with the O&M directly for these areas showing a decreasing trend starting in 2024 as it pertains to the gas asset O&M allocations.
This additional cost is necessary as part of the capital investment in digital, or information technology, projects along with the additional cost for compression assets to reach predictive maintenance levels and the increase in pipeline and integrity work. It is expected that the capital investments in the distribution assets area will support the cost of leak repair and survey to decrease over time.
Figure 67: 2018 – 2030 O&M Plan
MICHIGAN PUBLIC SERVICE COMMISSION Consumers Energy Company
Case No.: U-20650 Exhibit No.: A-36 (CCD-1)
Page: 110 of 112 Witness: CCDegenfelder
Date: December 2019
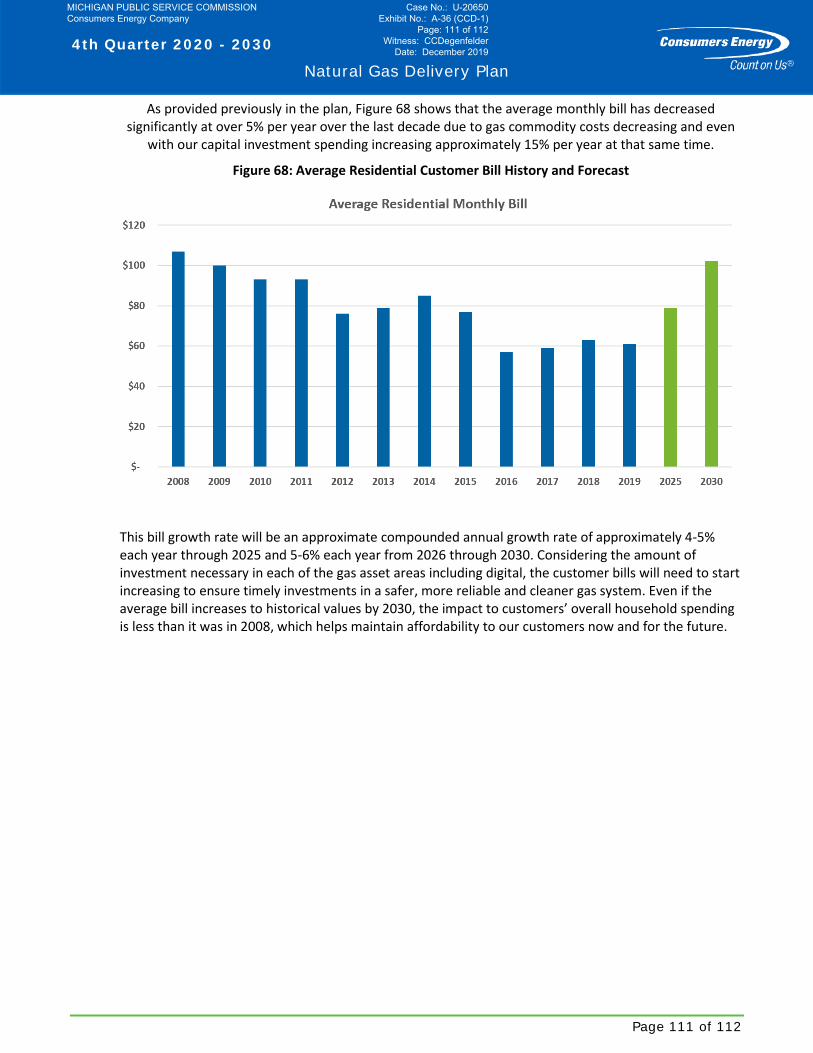
4th Quarter 2020 - 2030
Natural Gas Delivery Plan
Page 111 of 112
As provided previously in the plan, Figure 68 shows that the average monthly bill has decreased significantly at over 5% per year over the last decade due to gas commodity costs decreasing and even
with our capital investment spending increasing approximately 15% per year at that same time.
Figure 68: Average Residential Customer Bill History and Forecast
This bill growth rate will be an approximate compounded annual growth rate of approximately 4-5% each year through 2025 and 5-6% each year from 2026 through 2030. Considering the amount of investment necessary in each of the gas asset areas including digital, the customer bills will need to start increasing to ensure timely investments in a safer, more reliable and cleaner gas system. Even if the average bill increases to historical values by 2030, the impact to customers’ overall household spending is less than it was in 2008, which helps maintain affordability to our customers now and for the future.
MICHIGAN PUBLIC SERVICE COMMISSION Consumers Energy Company
Case No.: U-20650 Exhibit No.: A-36 (CCD-1)
Page: 111 of 112 Witness: CCDegenfelder
Date: December 2019
4th Quarter 2020 - 2030
Natural Gas Delivery Plan
Page 112 of 112
XV. Closing Consumers Energy has developed this 10-year plan for the gas delivery system to ensure Michigan has a safe, reliable, affordable and clean natural gas supply.
The Natural Gas Delivery Plan enables stakeholders to have confidence in our commitments to:
• Enhance safety by prioritizing and lowering system risk throughout the gas delivery system;
• Deliver reliable supply to our customers with prudent contingency planning;
• Provide affordability to our customers through stable, competitive and predictable bill growth and spending on efficient assets; and
• Create a cleaner gas delivery system that reduces our methane emissions.
The plan reflects thorough analysis of our system, the natural gas commodity market, trends and practices across the industry, and regulatory and customer trends.
We intend to periodically review the validity of the inputs and assumptions that led to the creation of the plan, update as appropriate and continue to share our vision with stakeholders across Michigan.
MICHIGAN PUBLIC SERVICE COMMISSION Consumers Energy Company
Case No.: U-20650 Exhibit No.: A-36 (CCD-1)
Page: 112 of 112 Witness: CCDegenfelder
Date: December 2019