Embed Size (px)
Citation preview
8/6/2019 Natural Gas _ India _2010(1)
http://slidepdf.com/reader/full/natural-gas-india-20101 1/65
Study on Common Pool Price Mechanism forNatural Gas in the country
P repared for:
GAIL (I NDIA) LIM ITED
P repared by:
MERCADOS ENERGY MARKETS INDIA PRIVATE
LIMITED
DATE: 28 January 2010
CLIENT CODE: GAIL200901
8/6/2019 Natural Gas _ India _2010(1)
http://slidepdf.com/reader/full/natural-gas-india-20101 2/65
STUDY ON COMMON POOL PRICE MECHANISM FORNATURA L GAS IN THE COUNTRY
TABLE OF CONTENTS
I OBJECTI VE OF TH E STUDY ............................................................................... I -6
II BROAD APPROACH AND METHODOLOGY ...................................................... II-8
II I IN TRODUCTI ON TO THE IN DIA N NATU RAL GAS M ARK ET ........................... II I-9
1. DEVELOPMENT OF THE NATURAL GAS MARKETS IN INDIA ........................................ III-9
2. PRODUCTION AND SUPPLY OF NATURAL GAS ...................................................... III-9
3. SECTOR WISE NATURAL GAS DEMAND ............................................................ III-10
4. NATURAL GAS BALANCE – NEXT FIVE YEARS ..................................................... III-11
5. PIPELINE INFRASTRUCTURE ....................................................................... III-12
I V CURR ENT NA TUR AL GAS P RI CIN G MECHA NI SM ......................................... I V-14
1. APM GAS PRICING .................................................................................. IV-14
2. PRICING OF GAS UNDER PRE -NELP PRODUCTION SHARING CONTRACTS ....................... IV-14
3. PRICING OF GAS WITH REFERENCE TO NELP PROVISION S ....................................... IV-15
4. IMPORTED GAS (LNG) PRICING ................................................................... IV-15
V NEED FOR PRICE POOLING .......................................................................... V-17
VI I NTR ODUCTI ON TO P OOL P RI CE M ECHAN I SMS ......................................... VI -19
1. DEFINING THE TYPES OF COMMODITY POOLS ..................................................... VI-19
2. DETAILED DESCRIPTION OF THE OPTION CONSIDERED FOR COMMODITY PRICE POOLING ... VI-20
2 . 1 . C OST B ASED G ENERAL POOL . . . . . . . .. . . . . . . . . .. . . . . . . . .. . . . . . . . .. . . . . . . . .. . . . . . . . . .. . . . VI -2 0
2 . 2 . C OST B ASED S ECTORAL POOL . . . . . . . .. . . . . . . . .. . . . . . . . .. . . . . . . . .. . . . . . . . . .. . . . . . . . .. . . VI -2 7
2 . 3 . B I D B ASED POOL . . . . . . . . . .. . . . . . . . .. . . . . . . . .. . . . . . . . .. . . . . . . . .. . . . . . . . . .. . . . . . . . .. . . . . . . . VI -3 1
2 . 4 . C OMPARI SON OF THE PREFERRED POOLI NG OPTI ONS . . . . . . . . . .. . . . . . . .. . . . . . . . . . VI -3 2
2 . 5 . K EY I SSUE - S HOULD M ERCHANT POWER BE EXCLUDED FROM THE POOL ? .. . . VI -3 3
2 . 6 . S ETTI NG UP OF POOL - K EY ELEMENTS . . . . . . . . .. . . . . . . . . .. . . . . . . .. . . . . . . . . .. . . . . . . . .. VI -3 5
2 . 7 . P OOL OPERATI ON MECHANI SM . . . . . . . .. . . . . . . . . .. . . . . . . . .. . . . . . . . .. . . . . . . . .. . . . . . . . .. . VI -3 6
2 . 8 . I NSTI TUTI ONAL MECHANI SM . . . . . . . . .. . . . . . . . .. . . . . . . . .. . . . . . . . .. . . . . . . . . .. . . . . . . . .. . . VI -3 7
VI I I NTER NA TI ONA L GAS M AR KETS: PR I CIN G SYSTEM S .............................. VI I -38
1. INTRODUCTION : OIL INDEXATION VERSUS HUB PRICING ...................................... VII-38
2. NORTH AMERICA ................................................................................... VII-40
2 . 1 . B RI EF DESCRI PTI ON OF THE N ORTH AMERI CAN GAS MARKET . . . .. . . .. . . .. . . . VI I -4 0
2 . 2 . T HE LI BERALI ZATI ON PROCESS . . . . . . . . .. . . . . . . . .. . . . . . . . . .. . . . . . . . .. . . . . . . . .. . . . . . . . VI I -4 0
2 . 3 . T HE C URRENT PRI CIN G SYSTEM . . . . . . . . .. . . . . . . . . .. . . . . . . . .. . . . . . . . .. . . . . . . . .. . . . . . . VI I -4 1
2 . 4 . T HE OPERATI ON OF THE SYSTEM . . . . . . . .. . . . . . . . .. . . . . . . . . .. . . . . . . . .. . . . . . . . .. . . . . . . VI I -4 2
2 . 5 . C URRENT PRICE RELATI ONSHI PS . . . . . . . . .. . . . . . . . .. . . . . . . . . .. . . . . . . . .. . . . . . . . .. . . . . VI I -4 2
2 . 6 . U SEFUL I NSI GHTS FOR I NDI A ’ S GAS MARKET . . . . . . . .. . . . . . . . . .. . . . . . . . .. . . . . . . . . VI I -4 2
3. THE UNITED KINGDOM ............................................................................ VII-43
8/6/2019 Natural Gas _ India _2010(1)
http://slidepdf.com/reader/full/natural-gas-india-20101 3/65
GAIL (India) Limited STRICTLY CONFIDENTIAL
Study on common pool price mechanism for natural gas in the country I-2
3 . 1 . B RI EF DESCRI PTI ON OF THE UK GAS MARKET . . . . . . . . . .. . . . . . . . . .. . . . . . . . .. . . . . . . VI I -4 3
3 . 2 . T HE LI BERALI SATI ON PROCESS . . . . . . . . .. . . . . . . . . .. . . . . . . . .. . . . . . . . .. . . . . . . . .. . . . . . . VI I -4 3
3 . 3 . T HE CURRENT PRI CI NG SYSTEM . . . . . . . . .. . . . . . . . . .. . . . . . . . .. . . . . . . . .. . . . . . . . .. . . . . . . VI I -4 4
3 . 4 . T HE OPERATI ON OF THE SYSTEM : THE W HOLESALE MARKETS BROUGHT TOGETHER V I I - 4 5
3 . 5 . U SEFUL I NSI GHTS FOR I NDI A ’ S GAS SECTOR . . . . . . . . .. . . . . . . . . .. . . . . . . . .. . . . . . . . . VI I -4 5
4. CONTINENTAL EUROPE ............................................................................ VII-46
4 . 1 . B RI EF DESCRI PTI ON OF THE EUROPEAN CONTI NENTAL GAS MARKETS . . .. . . V I I - 4 6
4 . 2 . T HE LI BERALI ZATI ON PROCESS : 1 9 9 8 – 2 0 0 9 . . . . . . .. . . .. . . .. . . .. . . .. . . .. . . .. . VI I -4 7
4 . 3 . T HE CURRENT PRI CI NG SYSTEM . . . . . . . . .. . . . . . . . . .. . . . . . . . .. . . . . . . . .. . . . . . . . .. . . . . . . VI I -4 9
4 . 4 . C URRENT PRICE RELATI ONSHI PS : HYBRID MARKETS . . . . . . . . .. . . . . . . . . .. . . . . . . . VI I -5 2
4 . 5 . T WO TYPI CAL CONTI NENTAL EUROPEAN MARKETS : I TALY AND FRANCE . .. . V I I - 5 3
4 . 6 . U SEFUL I NSI GHTS FOR I NDI A ’ S GAS SECTOR . . . . . . . . .. . . . . . . . . .. . . . . . . . .. . . . . . . . . VI I -5 5
VIII POOLING OF TRANSPORTATION TARIFFS ............................................ VI I I -57
I X R ECOM MEN DA TI ON S ................................................................................. I X-5 9
AN NEXURE - GAS BASED P OW ER PLA NT S ...................................................... I X-61
AN NEXURE - FER TI LI ZER P LA NT S .................................................................. I X-64
8/6/2019 Natural Gas _ India _2010(1)
http://slidepdf.com/reader/full/natural-gas-india-20101 4/65
GAIL (India) Limited STRICTLY CONFIDENTIAL
Study on common pool price mechanism for natural gas in the country I-3
ABBREVIATIONS
APM Administered Price Mechanism
CERC Central Electricity Regula tory Commission
CGD City Gas Distribution
CNG Compressed Natural Gas
DC Designated Consumers
LNG Liquefied Natural Gas
MMSCMD Million Metric Standard Cubic Meter per Day
TCM Trillion cubic meters
MMBTU Million Metric British Thermal Units
MMTPA Million metric tons per annum
MoPNG Ministry of Petroleum and Natural Gas
MSCM Thousan d standard cubic meter
PMT Panna Mukta Tapti
PNGRB Petroleum and Natural Gas Regulatory Board
Px Pow er Exchange
R-LNG Regasifie d Liquefied Natural Gas
RTC Round the clock
UI Unscheduled Interchange
OTC Over the counter
OCM On the commodity market
PSC Prod uction Sharing Contracts
TSO Transmissio n system operator
8/6/2019 Natural Gas _ India _2010(1)
http://slidepdf.com/reader/full/natural-gas-india-20101 5/65
GAIL (India) Limited STRICTLY CONFIDENTIAL
Study on common pool price mechanism for natural gas in the country I-4
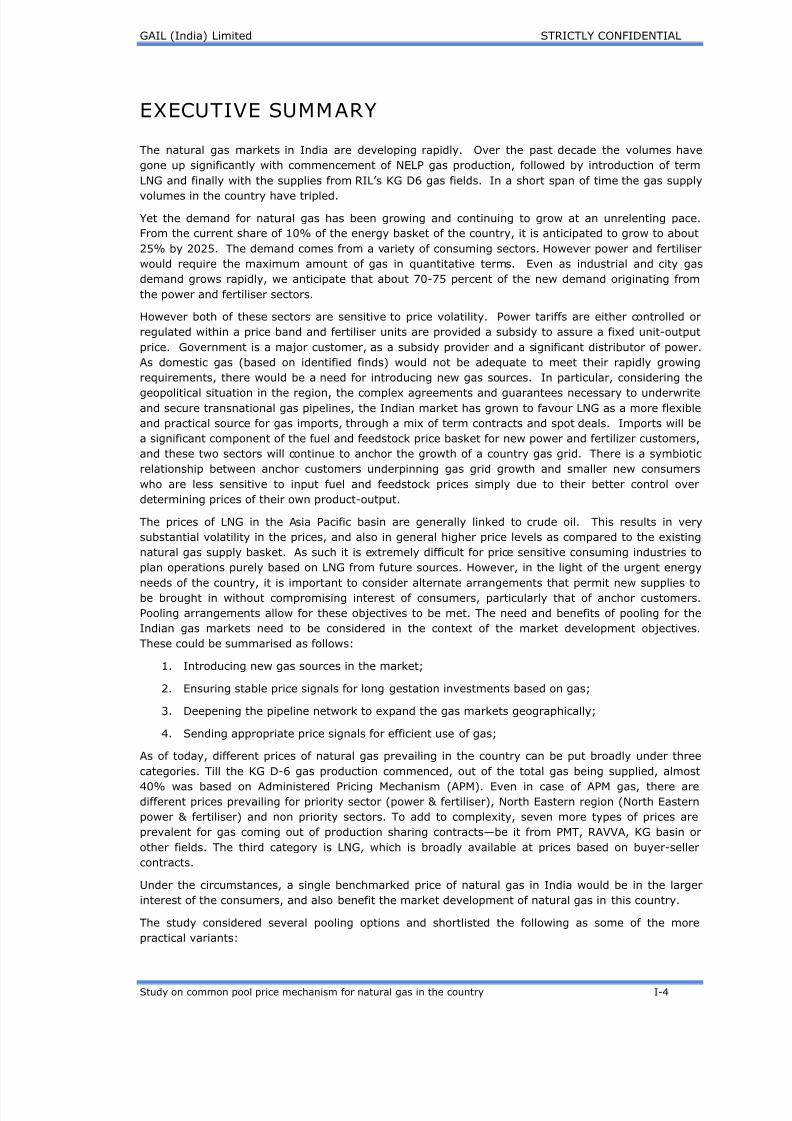
EXECUTIVE SUMM ARY
The natural gas markets in India are developing rapidly. Over the past decade the volumes havegone up significantly with commencement of NELP gas production, followed by introduction of termLNG and finally with the supplies from RIL’s KG D6 gas fields. In a short span of time the gas supply
volumes in the country have tripled.Yet the demand for natural gas has been growing and continuing to grow at an unrelenting pace.From the current share of 10% of the energy basket of the country, it is anticipated to grow to about25% by 2025. The demand comes from a variety of consuming sectors. However power and fertiliserwould require the maximum amount of gas in quantitative terms. Even as industrial and city gasdemand grows rapidly, we anticipate that about 70-75 percent of the new demand originating fromthe power and fertiliser sectors.
However both of these sectors are sensitive to price volatility. Power tariffs are either controlled orregulated within a price band and fertiliser units are provided a subsidy to assure a fixed unit-outputprice. Government is a major customer, as a subsidy provider and a significant distributor of power.As domestic gas (based on identified finds) would not be adequate to meet their rapidly growingrequirements, there would be a need for introducing new gas sources. In particular, considering the
geopolitical situation in the region, the complex agreements and guarantees necessary to underwriteand secure transnational gas pipelines, the Indian market has grown to favour LNG as a more flexibleand practical source for gas imports, through a mix of term contracts and spot deals. Imports will bea significant component of the fuel and feedstock price basket for new power and fertilizer customers,and these two sectors will continue to anchor the growth of a country gas grid. There is a symbioticrelationship between anchor customers underpinning gas grid growth and smaller new consumerswho are less sensitive to input fuel and feedstock prices simply due to their better control overdetermining prices of their own product-output.
The prices of LNG in the Asia Pacific basin are generally linked to crude oil. This results in verysubstantial volatility in the prices, and also in general higher price levels as compared to the existingnatural gas supply basket. As such it is extremely difficult for price sensitive consuming industries toplan operations purely based on LNG from future sources. However, in the light of the urgent energyneeds of the country, it is important to consider alternate arrangements that permit new supplies tobe brought in without compromising interest of consumers, particularly that of anchor customers.Pooling arrangements allow for these objectives to be met. The need and benefits of pooling for theIndian gas markets need to be considered in the context of the market development objectives.These could be summarised as follows:
1. Introducing new gas sources in the market;
2. Ensuring stable price signals for long gestation investments based on gas;
3. Deepening the pipeline network to expand the gas markets geographically;
4. Sending appropriate price signals for efficient use of gas;
As of today, different prices of natural gas prevailing in the country can be put broadly under threecategories. Till the KG D-6 gas production commenced, out of the total gas being supplied, almost
40% was based on Administered Pricing Mechanism (APM). Even in case of APM gas, there aredifferent prices prevailing for priority sector (power & fertiliser), North Eastern region (North Easternpower & fertiliser) and non priority sectors. To add to complexity, seven more types of prices areprevalent for gas coming out of production sharing contracts—be it from PMT, RAVVA, KG basin orother fields. The third category is LNG, which is broadly available at prices based on buyer-sellercontracts.
Under the circumstances, a single benchmarked price of natural gas in India would be in the largerinterest of the consumers, and also benefit the market development of natural gas in this country.
The study considered several pooling options and shortlisted the following as some of the morepractical variants:
8/6/2019 Natural Gas _ India _2010(1)
http://slidepdf.com/reader/full/natural-gas-india-20101 6/65
GAIL (India) Limited STRICTLY CONFIDENTIAL
Study on common pool price mechanism for natural gas in the country I-5
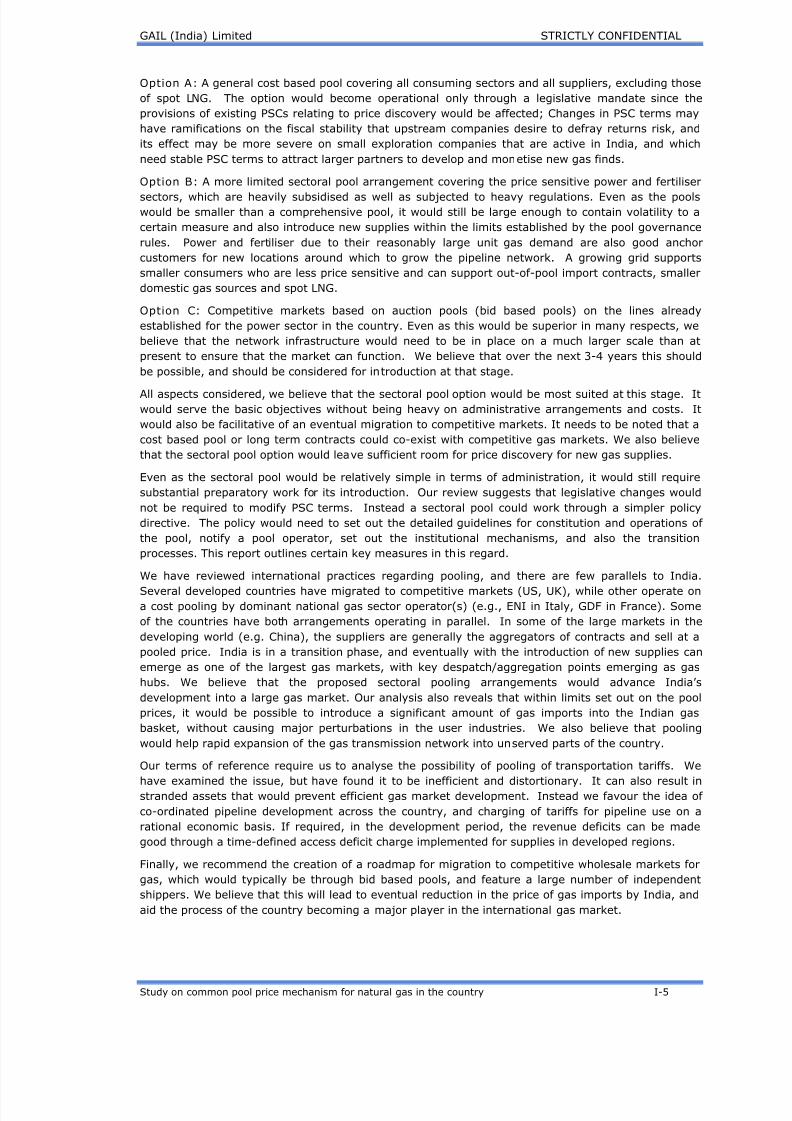
Option A : A general cost based pool covering all consuming sectors and all suppliers, excluding thoseof spot LNG. The option would become operational only through a legislative mandate since theprovisions of existing PSCs relating to price discovery would be affected; Changes in PSC terms mayhave ramifications on the fiscal stability that upstream companies desire to defray returns risk, andits effect may be more severe on small exploration companies that are active in India, and whichneed stable PSC terms to attract larger partners to develop and monetise new gas finds.
Option B : A more limited sectoral pool arrangement covering the price sensitive power and fertiliser
sectors, which are heavily subsidised as well as subjected to heavy regulations. Even as the poolswould be smaller than a comprehensive pool, it would still be large enough to contain volatility to acertain measure and also introduce new supplies within the limits established by the pool governancerules. Power and fertiliser due to their reasonably large unit gas demand are also good anchorcustomers for new locations around which to grow the pipeline network. A growing grid supportssmaller consumers who are less price sensitive and can support out-of-pool import contracts, smallerdomestic gas sources and spot LNG.
Option C : Competitive markets based on auction pools (bid based pools) on the lines alreadyestablished for the power sector in the country. Even as this would be superior in many respects, webelieve that the network infrastructure would need to be in place on a much larger scale than atpresent to ensure that the market can function. We believe that over the next 3-4 years this shouldbe possible, and should be considered for introduction at that stage.
All aspects considered, we believe that the sectoral pool option would be most suited at this stage. Itwould serve the basic objectives without being heavy on administrative arrangements and costs. Itwould also be facilitative of an eventual migration to competitive markets. It needs to be noted that acost based pool or long term contracts could co-exist with competitive gas markets. We also believethat the sectoral pool option would leave sufficient room for price discovery for new gas supplies.
Even as the sectoral pool would be relatively simple in terms of administration, it would still requiresubstantial preparatory work for its introduction. Our review suggests that legislative changes wouldnot be required to modify PSC terms. Instead a sectoral pool could work through a simpler policydirective. The policy would need to set out the detailed guidelines for constitution and operations of the pool, notify a pool operator, set out the institutional mechanisms, and also the transitionprocesses. This report outlines certain key measures in this regard.
We have reviewed international practices regarding pooling, and there are few parallels to India.
Several developed countries have migrated to competitive markets (US, UK), while other operate ona cost pooling by dominant national gas sector operator(s) (e.g., ENI in Italy, GDF in France). Someof the countries have both arrangements operating in parallel. In some of the large markets in thedeveloping world (e.g. China), the suppliers are generally the aggregators of contracts and sell at apooled price. India is in a transition phase, and eventually with the introduction of new supplies canemerge as one of the largest gas markets, with key despatch/aggregation points emerging as gashubs. We believe that the proposed sectoral pooling arrangements would advance India’sdevelopment into a large gas market. Our analysis also reveals that within limits set out on the poolprices, it would be possible to introduce a significant amount of gas imports into the Indian gasbasket, without causing major perturbations in the user industries. We also believe that poolingwould help rapid expansion of the gas transmission network into unserved parts of the country.
Our terms of reference require us to analyse the possibility of pooling of transportation tariffs. We
have examined the issue, but have found it to be inefficient and distortionary. It can also result instranded assets that would prevent efficient gas market development. Instead we favour the idea of co-ordinated pipeline development across the country, and charging of tariffs for pipeline use on arational economic basis. If required, in the development period, the revenue deficits can be madegood through a time-defined access deficit charge implemented for supplies in developed regions.
Finally, we recommend the creation of a roadmap for migration to competitive wholesale markets forgas, which would typically be through bid based pools, and feature a large number of independentshippers. We believe that this will lead to eventual reduction in the price of gas imports by India, andaid the process of the country becoming a major player in the international gas market.
8/6/2019 Natural Gas _ India _2010(1)
http://slidepdf.com/reader/full/natural-gas-india-20101 7/65
GAIL (India) Limited STRICTLY CONFIDENTIAL
Study on common pool price mechanism for natural gas in the country I-6
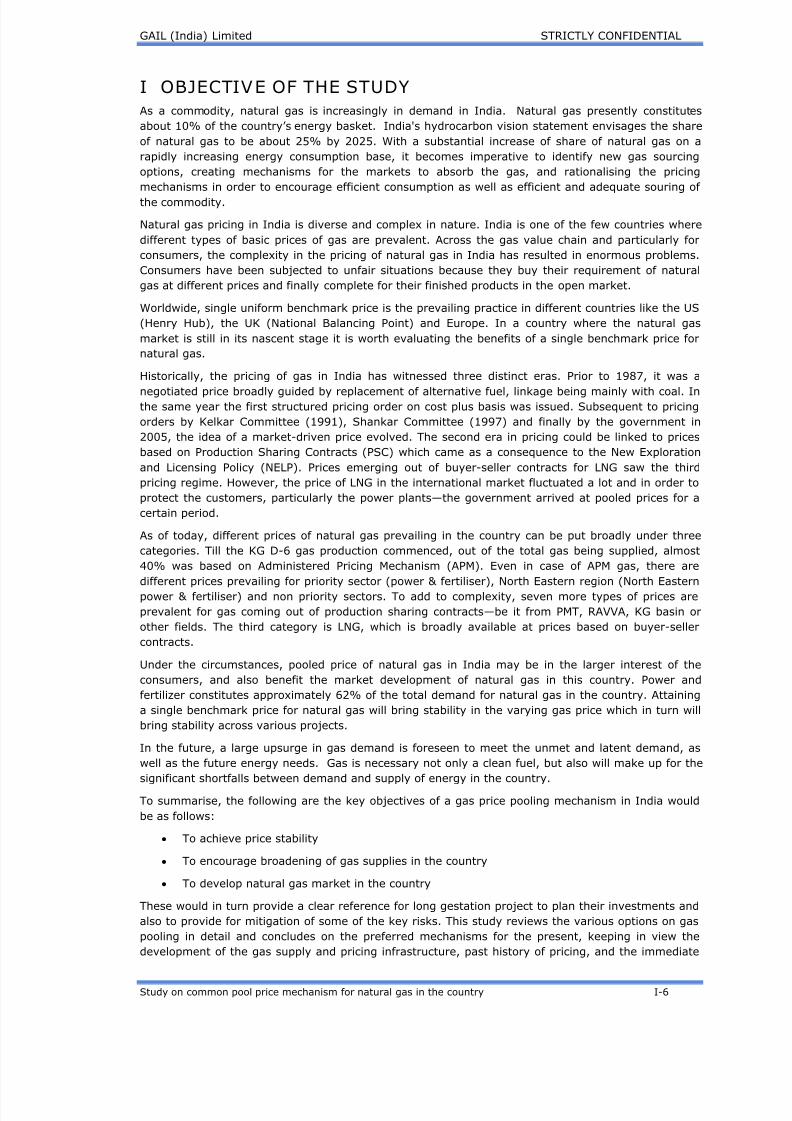
I OBJECTIV E OF THE STUDYAs a commodity, natural gas is increasingly in demand in India. Natural gas presently constitutesabout 10% of the country’s energy basket. India's hydrocarbon vision statement envisages the shareof natural gas to be about 25% by 2025. With a substantial increase of share of natural gas on arapidly increasing energy consumption base, it becomes imperative to identify new gas sourcingoptions, creating mechanisms for the markets to absorb the gas, and rationalising the pricingmechanisms in order to encourage efficient consumption as well as efficient and adequate souring of the commodity.
Natural gas pricing in India is diverse and complex in nature. India is one of the few countries wheredifferent types of basic prices of gas are prevalent. Across the gas value chain and particularly forconsumers, the complexity in the pricing of natural gas in India has resulted in enormous problems.Consumers have been subjected to unfair situations because they buy their requirement of naturalgas at different prices and finally complete for their finished products in the open market.
Worldwide, single uniform benchmark price is the prevailing practice in different countries like the US(Henry Hub), the UK (National Balancing Point) and Europe. In a country where the natural gasmarket is still in its nascent stage it is worth evaluating the benefits of a single benchmark price fornatural gas.
Historically, the pricing of gas in India has witnessed three distinct eras. Prior to 1987, it was a
negotiated price broadly guided by replacement of alternative fuel, linkage being mainly with coal. Inthe same year the first structured pricing order on cost plus basis was issued. Subsequent to pricingorders by Kelkar Committee (1991), Shankar Committee (1997) and finally by the government in2005, the idea of a market-driven price evolved. The second era in pricing could be linked to pricesbased on Production Sharing Contracts (PSC) which came as a consequence to the New Explorationand Licensing Policy (NELP). Prices emerging out of buyer-seller contracts for LNG saw the thirdpricing regime. However, the price of LNG in the international market fluctuated a lot and in order toprotect the customers, particularly the power plants—the government arrived at pooled prices for acertain period.
As of today, different prices of natural gas prevailing in the country can be put broadly under threecategories. Till the KG D-6 gas production commenced, out of the total gas being supplied, almost40% was based on Administered Pricing Mechanism (APM). Even in case of APM gas, there aredifferent prices prevailing for priority sector (power & fertiliser), North Eastern region (North Easternpower & fertiliser) and non priority sectors. To add to complexity, seven more types of prices areprevalent for gas coming out of production sharing contracts—be it from PMT, RAVVA, KG basin orother fields. The third category is LNG, which is broadly available at prices based on buyer-sellercontracts.
Under the circumstances, pooled price of natural gas in India may be in the larger interest of theconsumers, and also benefit the market development of natural gas in this country. Power andfertilizer constitutes approximately 62% of the total demand for natural gas in the country. Attaininga single benchmark price for natural gas will bring stability in the varying gas price which in turn willbring stability across various projects.
In the future, a large upsurge in gas demand is foreseen to meet the unmet and latent demand, aswell as the future energy needs. Gas is necessary not only a clean fuel, but also will make up for thesignificant shortfalls between demand and supply of energy in the country.
To summarise, the following are the key objectives of a gas price pooling mechanism in India wouldbe as follows:
• To achieve price stability
• To encourage broadening of gas supplies in the country
• To develop natural gas market in the country
These would in turn provide a clear reference for long gestation project to plan their investments andalso to provide for mitigation of some of the key risks. This study reviews the various options on gaspooling in detail and concludes on the preferred mechanisms for the present, keeping in view thedevelopment of the gas supply and pricing infrastructure, past history of pricing, and the immediate
8/6/2019 Natural Gas _ India _2010(1)
http://slidepdf.com/reader/full/natural-gas-india-20101 8/65
GAIL (India) Limited STRICTLY CONFIDENTIAL
Study on common pool price mechanism for natural gas in the country I-7
policy priorities. The report also identifies the roadmap for future development of competitive gasmarkets in the country.
The report is organised as follows:
• Chapter II identifies the approach and methodology
• Chapter III discusses in detail the characteristics of the natural gas market in India
• Chapter IV discusses the current gas pricing methodologies
• Chapter V elaborates on the need for pooling
• Chapter VI identifies the pooling mechanisms studied as part of the study
• Chapter VII discusses international gas pricing systems based on select regions and countriesreviewed
• Chapter VIII deliberates on the transportation tariff pooling issues
The report concludes with the Consultant’s recommendations in Chapter IX.

8/6/2019 Natural Gas _ India _2010(1)
http://slidepdf.com/reader/full/natural-gas-india-20101 9/65
GAIL (India) Limited STRICTLY CONFIDENTIAL
Study on common pool price mechanism for natural gas in the country II-8
II BROAD APP ROACH AND METHODOLOGYThe following figures highlights the broad approach and methodology adopted for the conducting thestudy.
Demand supply analysisCurrent pricingmechanismsIdentify issuesOverview of poolingmechanisms
Stage 1
Study internationalexperienceConsult key policy makersDetermine keyconsiderations for pooling
Stage 2
Determine variousalternativesValidation of alternatives
Stage 3
Finalize mechanism andimplementationmethodology
Stage 4
Stable gas priceWider suppliesDevelopedinfrastructure
The activities conducted in each stage are described below:
Stage 1: In stage 1, the demand supply gas balance for the future years was identified. The futuredemand in case of power was identified based on the Government of India plans and also the latent
demand that may arise due to shortage of coal. The current pricing system for natural gas and issuestherein were also identified.
Stage 2: The second stage involved the study of the practices adopted in various countries/continentslike USA, UK, Italy, Continental Europe etc. This stage also involved discussion with the key policymakers and determining the key considerations for pooling.
Stage 3: This stage involved determining various alternatives and thereafter validation andapplicability of these alternatives.
Stage 4: In stage 4, the most tenable mechanism has been identified and the implementationmethodology was assessed. Extensive consultation was undertaken with MoPNG and GAIL officials todetermine the most practical mechanisms, as well as future pooling and market frameworks.
The outcome of the study based on the methodology outlined above is reflected in the
recommendations provided in this report.
8/6/2019 Natural Gas _ India _2010(1)
http://slidepdf.com/reader/full/natural-gas-india-20101 10/65
GAIL (India) Limited STRICTLY CONFIDENTIAL
Study on common pool price mechanism for natural gas in the country III-9
II I INTRODUCTION TO THE INDI AN NATURAL GASMARKET
1. DEVELOPMENT OF THE NA TURAL GAS MARKETS IN IN DIA
India is the world’s seventh largest energy producer, accounting for 2.49% of the world’s total annualenergy production. It is the fifth largest energy consumer, accounting for about 3.45% of total energyconsumption in 2004, which has been increasing by an average of 4.8% percent a year since 1990.The share of commercial energy in total primary energy consumption increased from 59.7% in 1980-81 to 79.3% in 2008-09.
India’s GDP has grown at more than 8-8.5% during the last few years, and is expected to grow atleast at 6.5-7% in the coming few years. The growth has taken place despite the huge deficit inenergy infrastructure and infrastructure. Even today, half of the country’s population does not haveaccess to electricity or any other form of commercial energy, and still use non-commercial fuels suchas firewood, crop residues end during cakes as a primary source of energy for cooking in over two-thirds of households. The future growth of the country would demand a move to large scalecommercial energy forms. In particular, natural gas as a clean energy source holds the highestpromise for the country.
World’s resources of natural gas, although finite, are enormous. Estimates of its size continue to growas a result of innovations in exploration and extraction techniques. Natural gas resources are widelyand plentifully distributed around the globe. It is estimated that a significant amount of natural gasremains to be discovered. Natural gas has emerged as the most preferred fuel due to its inherentenvironmentally benign nature, greater efficiency and cost effectiveness.
The demand of natural gas has sharply increased in the last two decades at the global level. In Indianatural gas was first discovered off the west coast in 1970s, and today, it constitutes 10% of India’stotal energy consumption. Over the last decade it has gained importance as a source of energy andits share is slated to increase to about 25% of the total energy basket by 2025-2030.
2. PRODUCTION AND SUPP LY OF NA TURAL GAS
Production of natural gas, which was almost negligible at the time of independence, is at present atthe level of around 132.83 million standard cubic meters per day (MMSCMD). The main producers of natural gas are Oil & Natural Gas Corporation Ltd. (ONGC), Oil India Limited (OIL), JVs of Tapti,Panna-Mukta and Ravva and Reliance Industries Limited (RIL) which has discovered gas in theKrishna Godavari basin at its KG D6 block in the east cost of Andhra Pradesh.
Out of the total domestic production of 132.83 MMSCMD of gas about 43% is produced by RelianceIndustries Ltd. (as of December 2009) and approximately 57% of the gas is produced by others.Table 3.1 provides the details of the production of natural gas in 2009-10 by Government & Privatesector.
Apart from the KG D6 gas, the onshore fields in states of Assam, Andhra Pradesh and Gujarat are
other major producers of gas. Smaller quantities of gas are also produced in states of Tripura, TamilNadu and Rajasthan. OIL is operating in states of Assam and Rajasthan, whereas ONGC is operatingin the Western offshore fields along with other states. Gas produced by ONGC and a part of the gasproduced by the JV consortiums is marketed by GAIL (India) Ltd. . Gas produced by OIL is marketedby OIL itself except in Rajasthan where GAIL is authorized to market its gas. Gas produced by CairnEnergy from Lakshmi fields in Gujarat and Gujarat State Petroleum Corporation Ltd. (GSPCL) fromHazira fields is being sold directly by them at market determined prices.
8/6/2019 Natural Gas _ India _2010(1)
http://slidepdf.com/reader/full/natural-gas-india-20101 11/65
8/6/2019 Natural Gas _ India _2010(1)
http://slidepdf.com/reader/full/natural-gas-india-20101 12/65
GAIL (India) Limited STRICTLY CONFIDENTIAL
Study on common pool price mechanism for natural gas in the country III-11
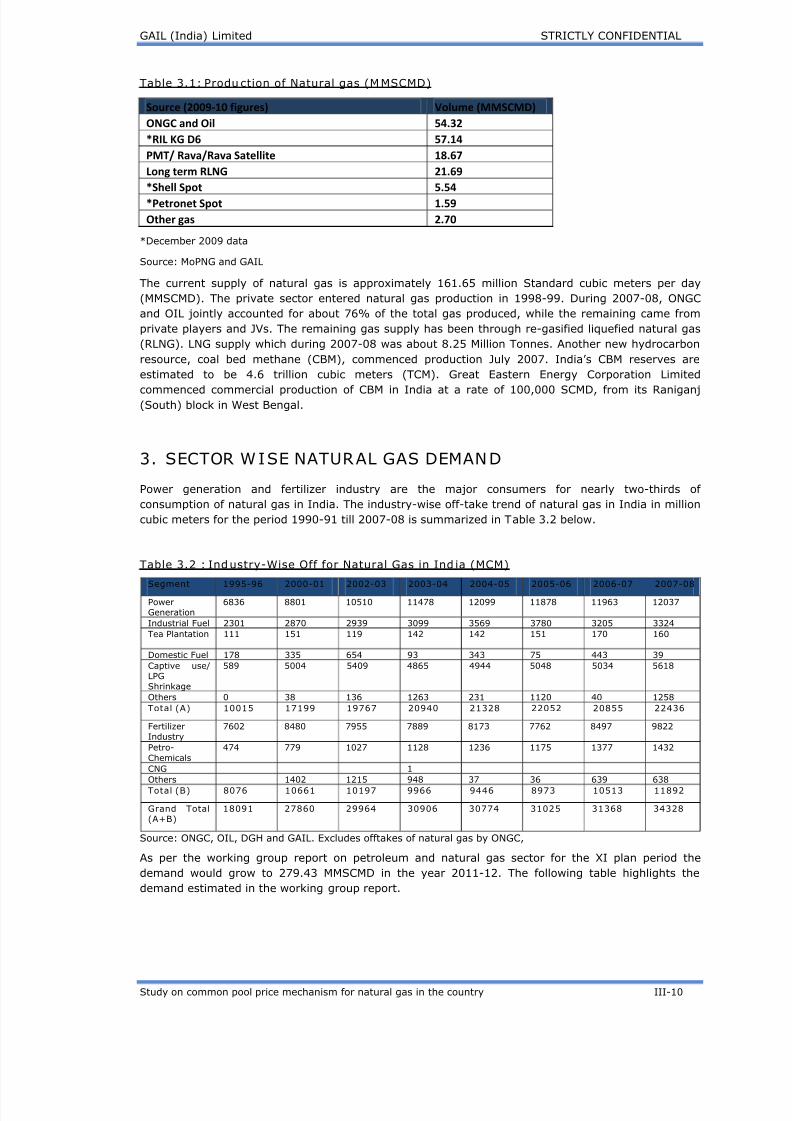
Table 3.3 : Segment w ise demand fo r natural gas (M MSCMD)
2007-08 2008-09 2009-10 2010-11 2011-12
Power 79.70 91.20 102.70 114.20 126.57
Fertilizer 41.02 42.89 55.90 76.26 76.26
City Gas 12.08 12.93 13.83 14.80 15.83
Industrial 15.00 16.05 17.17 18.38 19.66
Petchem ‐
Refinery 25.37 27.15 29.05 31.08 33.25
Sponge Iron 6.00 6.42 6.87 7.35 7.86
Total 179.17 196.64 225.52 262.07 279.43
Source: Working group report on petroleum and natural gas sector for the 11th plan period
4. NATUR AL GAS BALAN CE – NEXT FIVE YEAR S
A detailed analysis based on the current and upcoming power plants and fertilizer plants has beendone to estimate the demand for natural gas in the country. Power and fertilizer sector willcontinue to be the main segments consuming natural gas in coming years. The power and fertilizersector together will consume around 76-80% of the total natural gas consumed in the country.There will be huge demand for natural gas on account of shortage in coal supplies.
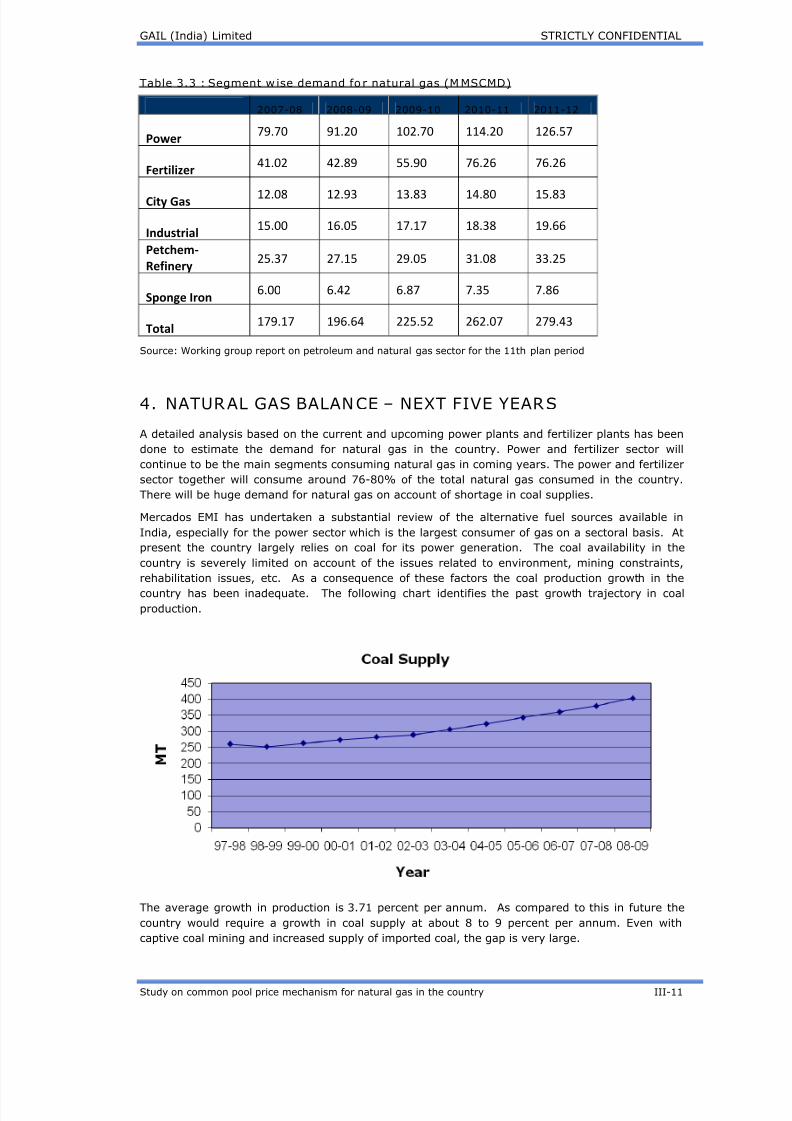
Mercados EMI has undertaken a substantial review of the alternative fuel sources available inIndia, especially for the power sector which is the largest consumer of gas on a sectoral basis. Atpresent the country largely relies on coal for its power generation. The coal availability in thecountry is severely limited on account of the issues related to environment, mining constraints,rehabilitation issues, etc. As a consequence of these factors the coal production growth in thecountry has been inadequate. The following chart identifies the past growth trajectory in coalproduction.
The average growth in production is 3.71 percent per annum. As compared to this in future thecountry would require a growth in coal supply at about 8 to 9 percent per annum. Even withcaptive coal mining and increased supply of imported coal, the gap is very large.
8/6/2019 Natural Gas _ India _2010(1)
http://slidepdf.com/reader/full/natural-gas-india-20101 13/65
GAIL (India) Limited STRICTLY CONFIDENTIAL
Study on common pool price mechanism for natural gas in the country III-12
Natural gas provides a plausible alternative to coal. Gas as a clean and flexible fuel is much indemand. It is understood that in the XIIth Plan period the country is likely to aim for gas basedcapacity addition of 5000 MW per annum. This would correspondingly require an additional 100MMSCMD of supply by the end of the XIIth Plan period.
Demand is also anticipated to grow substantially for fertiliser, industry and for city gas, all of which prefer gas over the existing options on account of environmental and economic factors.
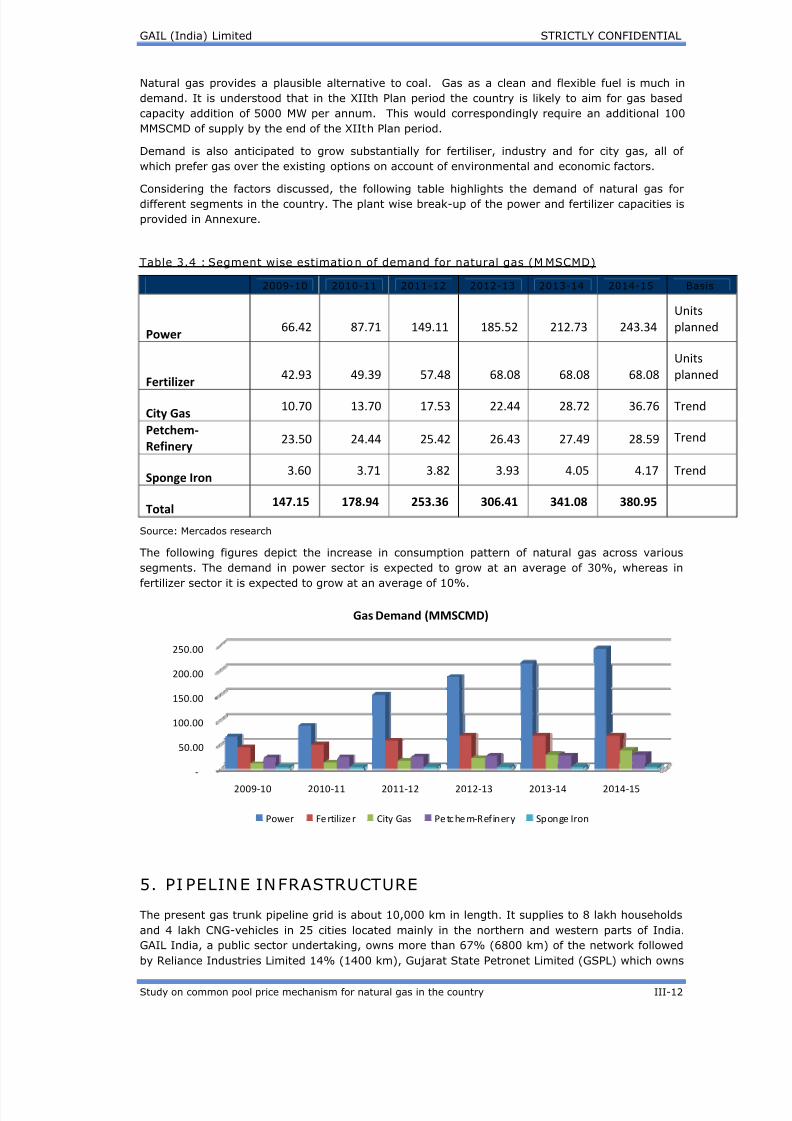
Considering the factors discussed, the following table highlights the demand of natural gas fordifferent segments in the country. The plant wise break-up of the power and fertilizer capacities isprovided in Annexure.
Table 3.4 : Segment wise estimatio n of demand for natural gas (M MSCMD)
2009-10 2010-11 2011-12 2012-13 2013-14 2014-15 Basis
Power 66.42 87.71 149.11 185.52 212.73 243.34
Units
planned
Fertilizer 42.93 49.39 57.48 68.08 68.08 68.08
Units
planned
City Gas 10.70 13.70 17.53 22.44 28.72 36.76 Trend
Petchem ‐
Refinery 23.50 24.44 25.42 26.43 27.49 28.59 Trend
Sponge Iron 3.60 3.71 3.82 3.93 4.05 4.17 Trend
Total
147.15 178.94 253.36 306.41 341.08 380.95
Source: Mercados research
The following figures depict the increase in consumption pattern of natural gas across varioussegments. The demand in power sector is expected to grow at an average of 30%, whereas infertilizer sector it is expected to grow at an average of 10%.
‐
50.00
100.00
150.00
200.00
250.00
2009 ‐ 10 2010 ‐ 11 2011 ‐ 12 2012 ‐ 13 2013 ‐ 14 2014 ‐ 15
Gas Demand (MMSCMD)
Power Fe rtilize r City Gas Pe tc he m ‐ Refinery Sponge Iron
5. PI PELIN E IN FRASTRUCTURE
The present gas trunk pipeline grid is about 10,000 km in length. It supplies to 8 lakh householdsand 4 lakh CNG-vehicles in 25 cities located mainly in the northern and western parts of India.GAIL India, a public sector undertaking, owns more than 67% (6800 km) of the network followedby Reliance Industries Limited 14% (1400 km), Gujarat State Petronet Limited (GSPL) which owns
8/6/2019 Natural Gas _ India _2010(1)
http://slidepdf.com/reader/full/natural-gas-india-20101 14/65
GAIL (India) Limited STRICTLY CONFIDENTIAL
Study on common pool price mechanism for natural gas in the country III-13
1152 km i.e. 11% of the network. The rest is owned by Assam Gas Company, OIL and GujaratGas.
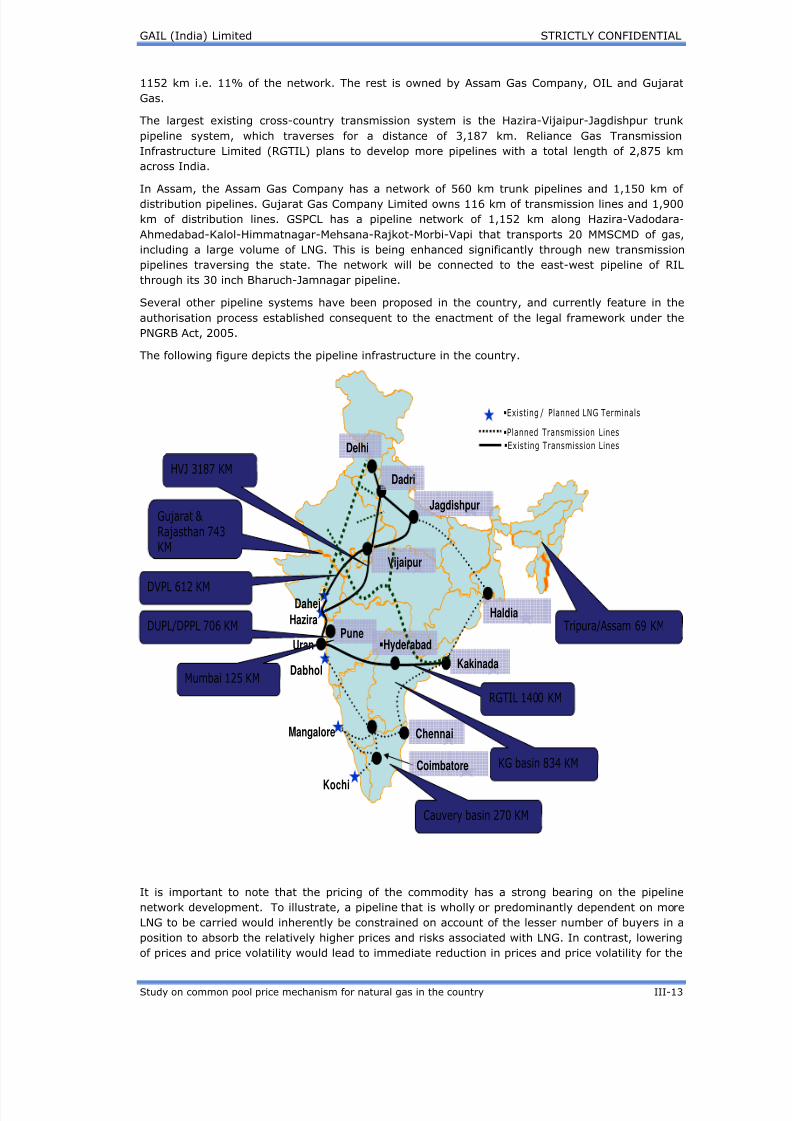
The largest existing cross-country transmission system is the Hazira-Vijaipur-Jagdishpur trunkpipeline system, which traverses for a distance of 3,187 km. Reliance Gas TransmissionInfrastructure Limited (RGTIL) plans to develop more pipelines with a total length of 2,875 kmacross India.
In Assam, the Assam Gas Company has a network of 560 km trunk pipelines and 1,150 km of distribution pipelines. Gujarat Gas Company Limited owns 116 km of transmission lines and 1,900km of distribution lines. GSPCL has a pipeline network of 1,152 km along Hazira-Vadodara-Ahmedabad-Kalol-Himmatnagar-Mehsana-Rajkot-Morbi-Vapi that transports 20 MMSCMD of gas,including a large volume of LNG. This is being enhanced significantly through new transmissionpipelines traversing the state. The network will be connected to the east-west pipeline of RILthrough its 30 inch Bharuch-Jamnagar pipeline.
Several other pipeline systems have been proposed in the country, and currently feature in theauthorisation process established consequent to the enactment of the legal framework under thePNGRB Act, 2005.
The following figure depicts the pipeline infrastructure in the country.
DahejHazira
Mangalore
Delhi
Dabhol
Kochi
Uran
Dadri
Jagdishpur
Haldia
Vijaipur
Kakinada
Chennai
Coimbatore
PuneHyderabad
Existing / Planned LNG Terminals
Existing Transmission LinesPlanned Transmission Lines
RGTIL 1400 KM
KG basin 834 KM
Cauvery basin 270 KM
Tripura/Assam 69 KM
Gujarat & Rajasthan 743KM
Mumbai 125 KM
DUPL/DPPL 706 KM
DVPL 612 KM
HVJ 3187 KM
It is important to note that the pricing of the commodity has a strong bearing on the pipelinenetwork development. To illustrate, a pipeline that is wholly or predominantly dependent on moreLNG to be carried would inherently be constrained on account of the lesser number of buyers in aposition to absorb the relatively higher prices and risks associated with LNG. In contrast, loweringof prices and price volatility would lead to immediate reduction in prices and price volatility for the
8/6/2019 Natural Gas _ India _2010(1)
http://slidepdf.com/reader/full/natural-gas-india-20101 15/65
GAIL (India) Limited STRICTLY CONFIDENTIAL
Study on common pool price mechanism for natural gas in the country IV-14
end use consumers, would encourage consumption along the pipeline system, thus aiding itsexpansion.
IV CURRENT NATURAL GAS PRI CIN G MECHANI SMThe natural gas pricing scenario in India is complex and heterogeneous in nature. There are widevarieties of gas price in the country.
At present, there are broadly two pricing regimes for gas in the country - gas priced under APMand non-APM or free market gas. The price of APM gas is set by the Government. As regards non-APM/free market gas, this could also be broadly divided into two categories, namely, domesticallyproduced gas from JV fields and imported LNG. The pricing of JV gas is governed in terms of thePSC provisions. It is expected that substantial gas production would commence from the gas fieldsawarded by the Government under the New Exploration Licensing Policy (NELP). As regards LNG,while the price of LNG imported under term contracts is governed by the SPA between the LNGseller and the buyer, the spot cargoes are purchased on mutually agreeable commercial terms.
1. APM GAS PRICING
APM gas refers to gas produced by entities awarded gas fields prior to the PSC regime. The pricesof gas from these fields are administered by GoI. The Government raised the consumer price be
revised from Rs.2,800/MSCM to Rs.3,200/MSCM with effective from July 1 st 2005 for the followingcategories of consumers. It was also decided that all the APM gas will be supplied to only thesecategories.
• Power sector consumers
• Fertilizers sector consumers
• Consumers covered under court orders
• Consumers having allocations of less than 0.05 MMSCMD
This increase was on an ad hoc basis and it was decided that the Tariff Commission would examinethe issue of producer price of natural gas. The Tariff Commission (TC) has since submitted itsreport and has recommended Producer price of Rs.3710/MSCM and Rs.4150/MSCM for ONGC andOIL respectively. TC has also recommended that the consumer price should be somewhat higherthan the producer price, considering the substantial difference between the recommendedproducer price and the price of market gas/alternative fuels.
GoI also decided that the price of gas supplied to small consumers and transport sector (CNG)would be increased over the next 3 to 5 years to the level of the market price. With effect fromMay 6 th 2005, the APM gas price to small consumers and CNG sector has been increased by 20%,to bring it to Rs.3840 / MSCM.
The price of natural gas for customers in the North-East has been kept at 60% of the price in therest of the country. Accordingly, the price for power and fertilizers sector in the North-East isRs.1920/MSCM and that for court-mandated and small scale consumers in the region isRs.2304/MSCM.
2. PRICING OF GAS UNDER PRE-NELP PRODUCTIONSHARI NG CONTRACTS
Production Sharing Contracts (PSCs) were executed by GOI with Ravva consortium and PMTconsortium on October 28, 1994 and December 12, 1994 respectively. The price of natural gas isdetermined by the provisions of PSC signed by the consortium with GOI. Around 17.3 MMSCMD, 1MMSCMD and 0.9 MMSCMD are supplied from PMT fields, Ravva fields and Ravva Satellite fieldsrespectively under the pre-NELP PSCs. Out of this, GAIL supplies 5 MMSCMD from PMT fields andthe production (1 MMSCMD) from Ravva fields at APM rate to APM consumers; the differencebetween PSC price and APM price is being made up through the gas pool account mechanism.
8/6/2019 Natural Gas _ India _2010(1)
http://slidepdf.com/reader/full/natural-gas-india-20101 16/65
GAIL (India) Limited STRICTLY CONFIDENTIAL
Study on common pool price mechanism for natural gas in the country IV-15
3. PRI CING OF GAS WI TH REFERENCE TO NELP P ROVISIONS
As regards the gas from NELP fields, the Government constituted an Empowered Group of Ministers to consider inter alia issues relating to pricing of natural gas, produced under the NELPregime. It has been decided therein that the provisions of the NELP PSC should be honoured. Thefollowing price basis/formula for the purpose of valuation of natural gas has been approved by theGovernment in case of KG-D6 Block of RIL/Niko.
Selling price (in US $/MMBTU) = 2.5 + (CP-25)0.15 (in US$/MMBTU), where CP=crude price inUS$/barrel, with cap of CP=US $60/barrel.
The price basis/formula comes to US$4.2/MMBTU for crude price greater or equal to US$60/barrel.
It was decided that price discovery process on arm's length basis will be adopted in the futureNELP contracts, only after the approval of the price basis/formula by the Government. It was alsodecided that the price discovered through this process would be uniformly applicable to all thesectors.
4. IM PORTED GAS (LNG) P RICING
A contract was signed with RasGas, Qatar for supply of 5 MMTPA LNG (equivalent to about 18MMSCMD) by Petronet LNG Limited (PLL) and supplies commenced from April 2004. This quantityhas subsequently increased to 7.5 MMTPA wef. January 2010. The price for LNG has been linked toJCC crude oil under an agreed formula. However, the FOB price for the period up to December2008 has been agreed at a constant price of $2.53/MMBTU. This price translates to RLNG price of $3.63/MMBTU ex-Dahej terminal. The price would vary on monthly basis from January 2009.
Further, in July 2007, PLL has signed another contract with RasGas, Qatar for supply of 1.25MMTPA LNG from July 2007 to September 2009 to meet the requirement of Ratnagiri PowerProject in Maharashtra.
In order to make the price of spot RLNG affordable, EGoM has decided in the meeting held onJanuary 11 th 2007 for pooling of prices of spot cargoes with LNG being imported on term contract
basis. This Ministry accordingly issued orders on March 6th
2007 in compliance with the decision of EGoM. In addition to the above term contracts, LNG is also being sourced from spot market by PLLand Hazira LNG Pvt. Ltd. During 2007-08, an average quantity of about 5.7 mmscmd was broughtinto the country as spot cargoes.
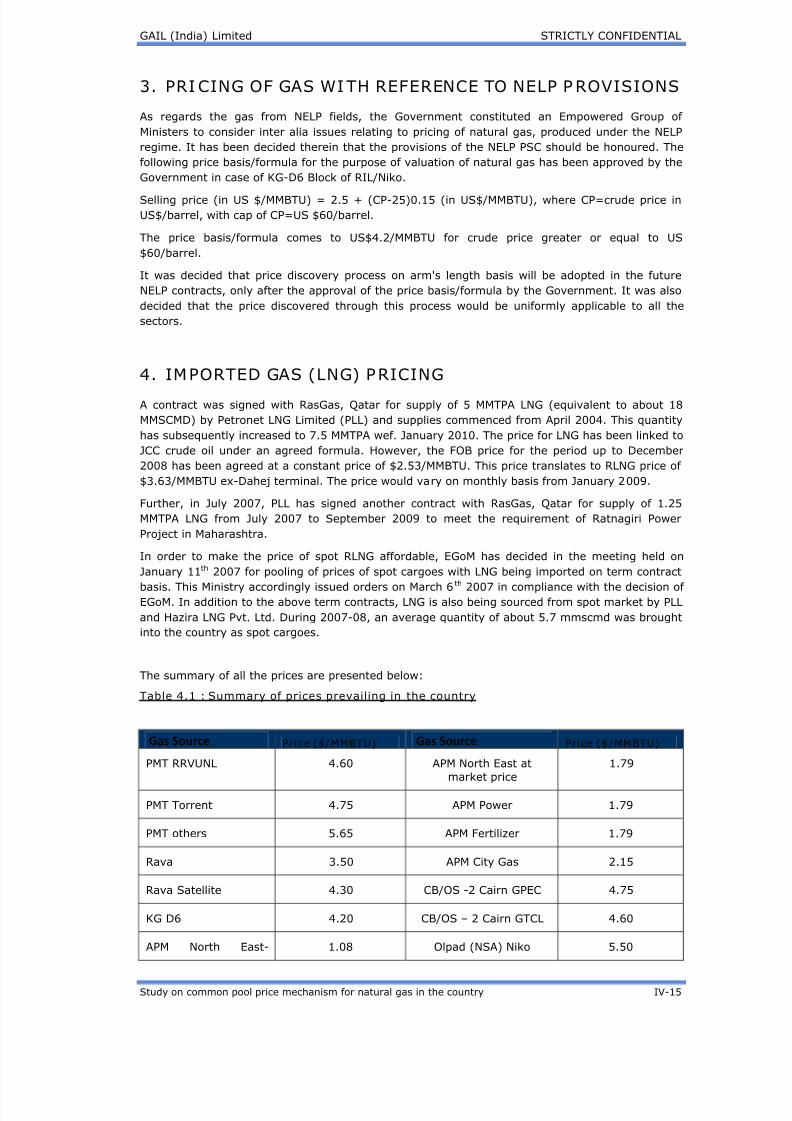
The summary of all the prices are presented below:
Table 4.1 : Summary of prices prevailing in the country
Gas Source Price ($/MMBTU) Gas Source Price ($/MMBTU)
PMT RRVUNL 4.60 APM North East atmarket price
1.79
PMT Torrent 4.75 APM Power 1.79
PMT others 5.65 APM Fertilizer 1.79
Rava 3.50 APM City Gas 2.15
Rava Satellite 4.30 CB/OS -2 Cairn GPEC 4.75
KG D6 4.20 CB/OS – 2 Cairn GTCL 4.60
APM North East- 1.08 Olpad (NSA) Niko 5.50
8/6/2019 Natural Gas _ India _2010(1)
http://slidepdf.com/reader/full/natural-gas-india-20101 17/65
GAIL (India) Limited STRICTLY CONFIDENTIAL
Study on common pool price mechanism for natural gas in the country IV-16
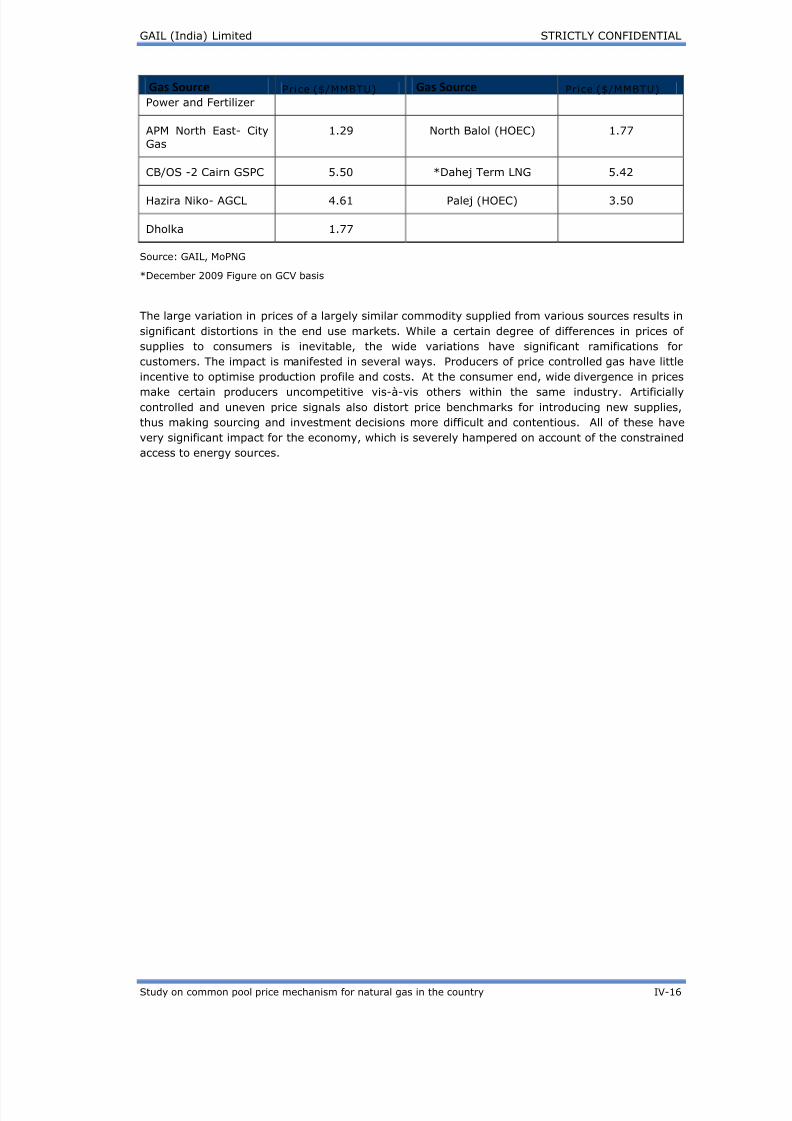
Gas Source Price ($/MMBTU) Gas Source Price ($/MMBTU)Power and Fertilizer
APM North East- CityGas
1.29 North Balol (HOEC) 1.77
CB/OS -2 Cairn GSPC 5.50 *Dahej Term LNG 5.42
Hazira Niko- AGCL 4.61 Palej (HOEC) 3.50
Dholka 1.77
Source: GAIL, MoPNG
*December 2009 Figure on GCV basis
The large variation in prices of a largely similar commodity supplied from various sources results insignificant distortions in the end use markets. While a certain degree of differences in prices of supplies to consumers is inevitable, the wide variations have significant ramifications forcustomers. The impact is manifested in several ways. Producers of price controlled gas have littleincentive to optimise production profile and costs. At the consumer end, wide divergence in prices
make certain producers uncompetitive vis-à-vis others within the same industry. Artificiallycontrolled and uneven price signals also distort price benchmarks for introducing new supplies,thus making sourcing and investment decisions more difficult and contentious. All of these havevery significant impact for the economy, which is severely hampered on account of the constrainedaccess to energy sources.
8/6/2019 Natural Gas _ India _2010(1)
http://slidepdf.com/reader/full/natural-gas-india-20101 18/65
GAIL (India) Limited STRICTLY CONFIDENTIAL
Study on common pool price mechanism for natural gas in the country V-17
V NEED FOR PR ICE POOLI NGThe Indian gas market needs to match customer expectations, gas infrastructure expansion withproviding flexibility for new and marginal suppliers to enter the market. Price pooling is amechanism where the potential for balancing the customer and developer expectation with that of suppliers.
The need and benefits of pooling for the Indian gas markets need to be considered in the contextof the market development objectives. These could be summarised as follows:
1. Introducing new gas sources in the market;
2. Ensuring stable price signals for long gestation investments based on gas;
3. Deepening the pipeline network to expand the gas markets geographically;
4. Sending appropriate price signals for efficient use of gas;
The Indian gas markets are relatively small as compared to the size of the economy, but areexpanding rapidly. However, as commented earlier, the expansion has not kept pace with thedemand. Domestic gas finds, while substantial, are inadequate to meet the burgeoning demandfor gas. In particular, the demand from bulk consuming sectors like power and fertiliser is
growing at a rapid pace. At the other end, the demand from city gas is also expected to increaserapidly in the coming years. As a result of this expansion of demand, the country is lookingseriously at LNG as a potential source of supply expansion.
LNG, as an internationally traded commodity presents two challenges. Firstly, the price of LNG isgenerally linked to the price of crude oil, especially for long term supplies. The resultant prices of RLNG are typically significantly higher than the prices of domestic gas, including from the NELPfields. Secondly, the prices of such supplies being linked to crude are inherently volatile. Thecombination of relatively high prices and high volatility make it difficult for user industries likepower and fertiliser to plan investments based on LNG.
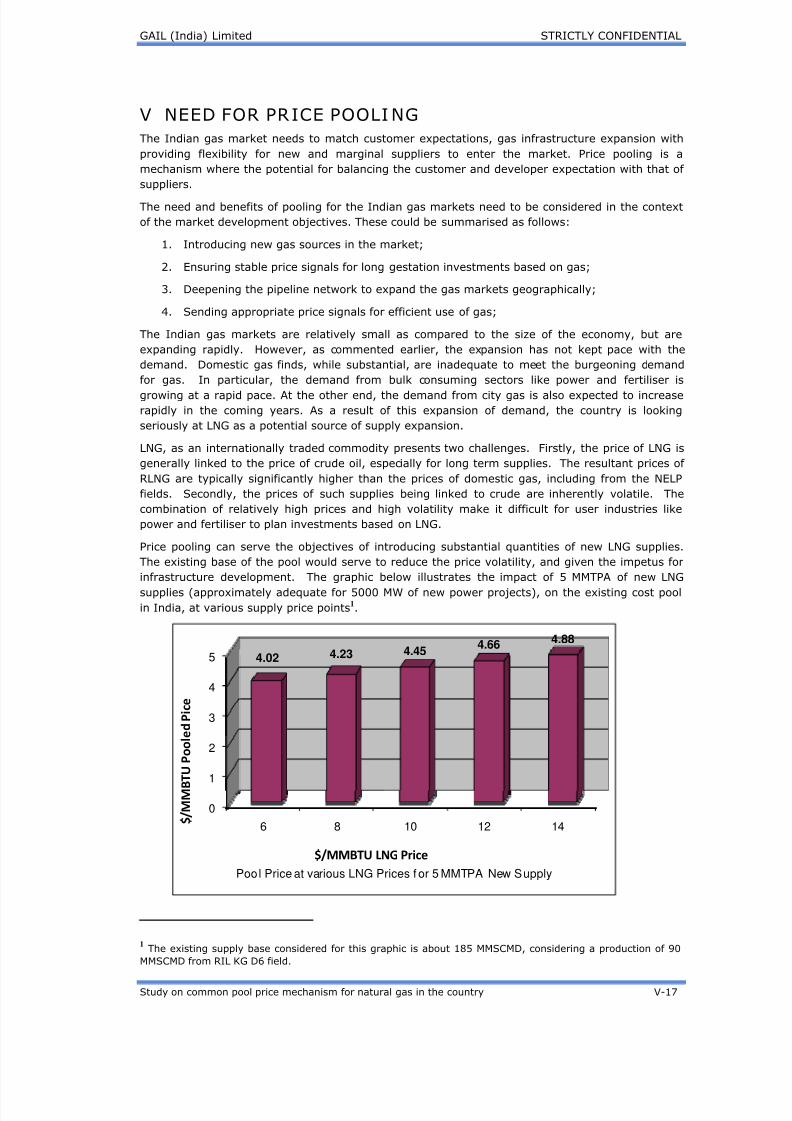
Price pooling can serve the objectives of introducing substantial quantities of new LNG supplies.The existing base of the pool would serve to reduce the price volatility, and given the impetus forinfrastructure development. The graphic below illustrates the impact of 5 MMTPA of new LNGsupplies (approximately adequate for 5000 MW of new power projects), on the existing cost poolin India, at various supply price points 1 .
0
1
2
3
4
5
6 8 10 12 14
4.02 4.23 4.45 4.66 4.88
Pool Price at various LNG Prices f or 5 MMTPA New Supply
$/MMBTU LNG Price
$ / M M B T U P o o
l e d P i c e
1The existing supply base considered for this graphic is about 185 MMSCMD, considering a production of 90
MMSCMD from RIL KG D6 field.
8/6/2019 Natural Gas _ India _2010(1)
http://slidepdf.com/reader/full/natural-gas-india-20101 19/65
GAIL (India) Limited STRICTLY CONFIDENTIAL
Study on common pool price mechanism for natural gas in the country V-18
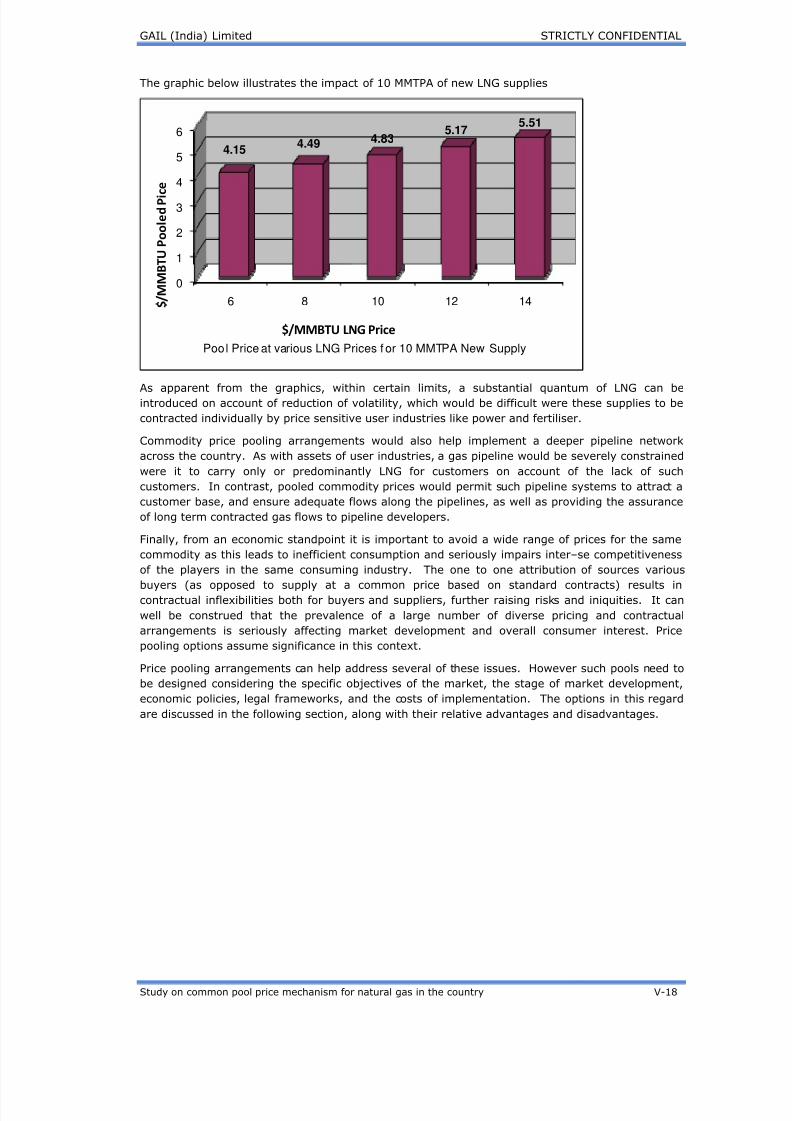
The graphic below illustrates the impact of 10 MMTPA of new LNG supplies
0
1
2
3
4
5
6
6 8 10 12 14
4.15 4.49 4.835.17
5.51
Pool Price at various LNG Prices f or 10 MMTPA New Supply
$/MMBTU LNG Price
$ / M M B T U P o o
l e d P i c e
As apparent from the graphics, within certain limits, a substantial quantum of LNG can beintroduced on account of reduction of volatility, which would be difficult were these supplies to becontracted individually by price sensitive user industries like power and fertiliser.
Commodity price pooling arrangements would also help implement a deeper pipeline networkacross the country. As with assets of user industries, a gas pipeline would be severely constrainedwere it to carry only or predominantly LNG for customers on account of the lack of suchcustomers. In contrast, pooled commodity prices would permit such pipeline systems to attract acustomer base, and ensure adequate flows along the pipelines, as well as providing the assuranceof long term contracted gas flows to pipeline developers.
Finally, from an economic standpoint it is important to avoid a wide range of prices for the samecommodity as this leads to inefficient consumption and seriously impairs inter–se competitivenessof the players in the same consuming industry. The one to one attribution of sources various
buyers (as opposed to supply at a common price based on standard contracts) results incontractual inflexibilities both for buyers and suppliers, further raising risks and iniquities. It canwell be construed that the prevalence of a large number of diverse pricing and contractualarrangements is seriously affecting market development and overall consumer interest. Pricepooling options assume significance in this context.
Price pooling arrangements can help address several of these issues. However such pools need tobe designed considering the specific objectives of the market, the stage of market development,economic policies, legal frameworks, and the costs of implementation. The options in this regardare discussed in the following section, along with their relative advantages and disadvantages.
8/6/2019 Natural Gas _ India _2010(1)
http://slidepdf.com/reader/full/natural-gas-india-20101 20/65
GAIL (India) Limited STRICTLY CONFIDENTIAL
Study on common pool price mechanism for natural gas in the country VI-19
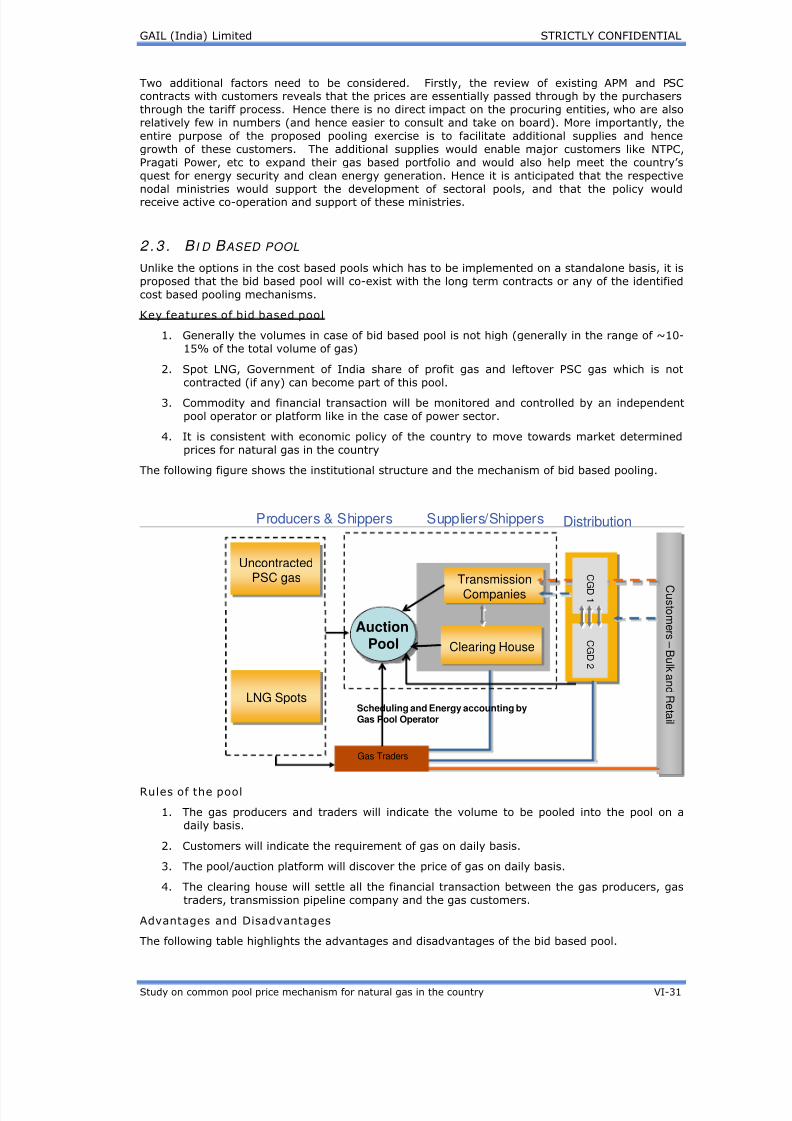
VI INTRODUCTION TO POOL PRICE MECHANI SMSThis section of the report discusses the various options that can be considered for pooling of gas.A pool is an arrangement where outputs from different sources are pooled together scheduledaccording to increased costs, the technical and contractual characteristics and dispatchedaccording to defined set rules of distribution. Price pooling mechanisms take into account eitherthe costs of the various sources of gas and arrive at a weighted average pool price, or such pricesbased on demand and supply, typically through bid processes.
1. DEFININ G THE TYP ES OF COMMODITY POOLS
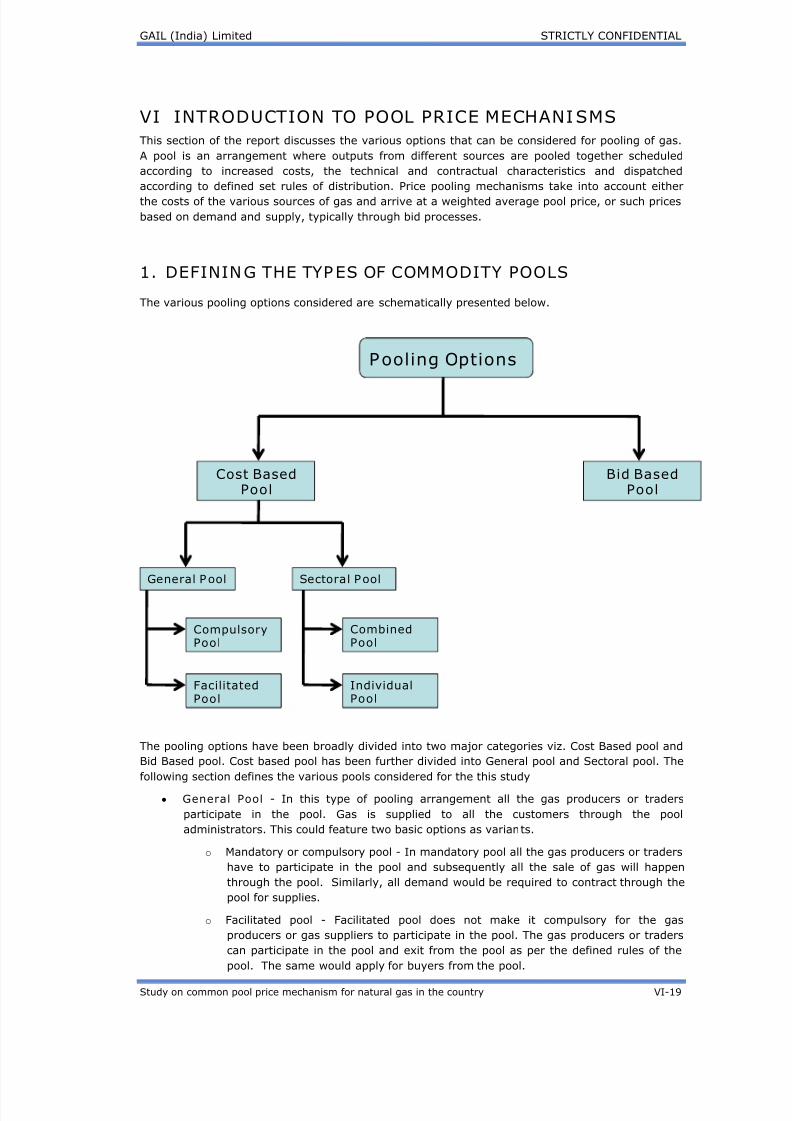
The various pooling options considered are schematically presented below.
P ooling Options
Bid BasedPool
Cost BasedPool
General P ool Sectoral P ool
CompulsoryPool
FacilitatedPool
CombinedPool
IndividualPool
The pooling options have been broadly divided into two major categories viz. Cost Based pool andBid Based pool. Cost based pool has been further divided into General pool and Sectoral pool. Thefollowing section defines the various pools considered for the this study
• General Pool - In this type of pooling arrangement all the gas producers or tradersparticipate in the pool. Gas is supplied to all the customers through the pooladministrators. This could feature two basic options as variants.
o Mandatory or compulsory pool - In mandatory pool all the gas producers or tradershave to participate in the pool and subsequently all the sale of gas will happenthrough the pool. Similarly, all demand would be required to contract through thepool for supplies.
o Facilitated pool - Facilitated pool does not make it compulsory for the gasproducers or gas suppliers to participate in the pool. The gas producers or traderscan participate in the pool and exit from the pool as per the defined rules of thepool. The same would apply for buyers from the pool.
8/6/2019 Natural Gas _ India _2010(1)
http://slidepdf.com/reader/full/natural-gas-india-20101 21/65
GAIL (India) Limited STRICTLY CONFIDENTIAL
Study on common pool price mechanism for natural gas in the country VI-20
• Sectoral Pool - Sectoral pool is specifically for pre-identified sectors. As regards thisstudy, this has been considered for Power and Fertilizer segments, although variants couldextend to other sectors as well. Two basic forms of sectoral pools have been considered.
o Combined pool - In combined pooling arrangement there is a single pool for Powerand Fertilizer. The gas at pooled price is supplied to customers from both thesectors through an identified mechanism.
o Individual pool - In this type of pooling arrangement there will two different poolsfor Power and Fertilizer separately. The pool operator may or may not be same.The gas at pooled price is supplied to the respective customers through onidentified mechanism. The pooled price may or may not be same for both thepools.
The above options have been discussed in the subsequent sections. It needs to be noted that in alloptions presented herein, the existing cost structures of the gas supply from producers (orimporters) remain unchanged, and the revenues to be generated would correspond to these costs,plus the transportation costs, taxes and duties as at present. Hence there is no impact onsubsidies as a whole, although the cost of gas to individual consumer costs would be rationalisedas a result of the pooling arrangements. In subsequent years, with expansion of supplies in thepool, this would be altered based on the cost and quantum of additional gas supplies. Hence,irrespective of the option selected, specific pool rules would need to be agreed on the cost and
quantity limits and implemented by the pool operator accordingly.
2. DETAILED DESCRIPTION OF THE OPTION CONSIDEREDFOR COMMODITY P RICE POOLING
2 . 1 . C OS T B ASED G ENERAL POOL The following four options have been identified in cost based general pools.
• Option 1: Comprehensive compulsory - It would be mandatory for all the gas suppliers andgas traders to take part in this pool.
• Option 2: Comprehensive compulsory without spot RLNG - It would mandatory for all thegas suppliers to take part in this pooling arrangement, except for the spot LNGtransactions, which would be kept out of the ambit of the pooling arrangements.
• Option 3: Facilitated pool without private spot and PSC gas - A voluntary arrangement withall the PSU gas producers, PSU spot LNG traders and long term LNG producers bringingtheir gas into the pool.
• Option 4: Voluntary pool without private spot - It is a voluntary pool opens for all the gasproducers and gas traders except the private LNG players.
Option 1: Comprehen sive compulsory cost based po ol
As mentioned above, this is a cost based pool with all the gas producers and traders becoming a
part of the pool. APM gas, Gas from NELP blocks, Long term LNG and Spot LNG will become part of this pool.
Rules of the pool
1. It would be compulsory for all the gas producers and traders to become a part of this pool.
2. The pool operator will forecast the pool demand and will be responsible for the demandsupply balance of natural gas in the pool.
3. The pool operator (or its nominees) would be counter party to all the gas purchased in thepool from the Spot LNG market.
4. Pool operator will allocate the gas based on the individual demand from the gascustomers.
8/6/2019 Natural Gas _ India _2010(1)
http://slidepdf.com/reader/full/natural-gas-india-20101 22/65
GAIL (India) Limited STRICTLY CONFIDENTIAL
Study on common pool price mechanism for natural gas in the country VI-21
5. This will be a tenured mechanism with the sunset clause identified ab-initio to facilitate thetransition to a developed Natural Gas market.
Gas Source
Based on the existing identified sources, the table below provides the details of the gas fromvarious sources that will be a part of this pool
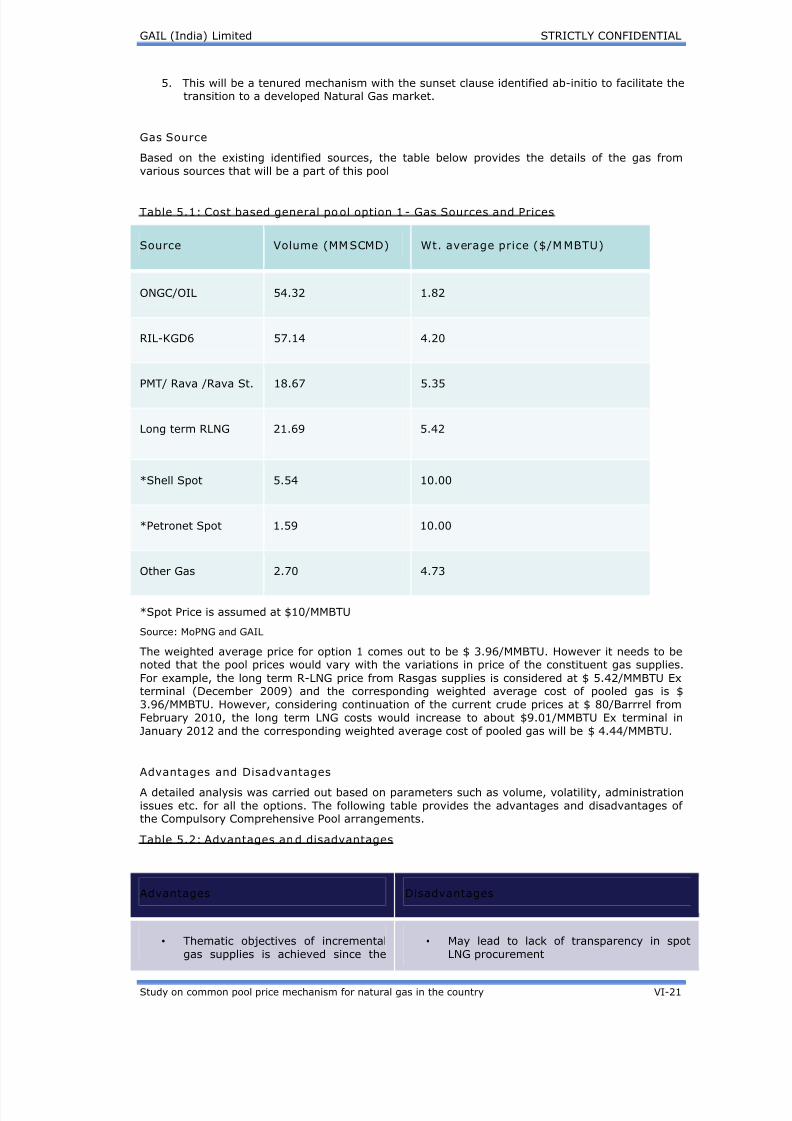
Table 5.1: Cost based general po ol option 1 - Gas Sources and Prices
Source Volume (MM SCMD) Wt. average price ($/M MBTU)
ONGC/OIL 54.32 1.82
RIL-KGD6 57.14 4.20
PMT/ Rava /Rava St. 18.67 5.35
Long term RLNG 21.69 5.42
*Shell Spot 5.54 10.00
*Petronet Spot 1.59 10.00
Other Gas 2.70 4.73
*Spot Price is assumed at $10/MMBTU
Source: MoPNG and GAIL
The weighted average price for option 1 comes out to be $ 3.96/MMBTU. However it needs to benoted that the pool prices would vary with the variations in price of the constituent gas supplies.For example, the long term R-LNG price from Rasgas supplies is considered at $ 5.42/MMBTU Exterminal (December 2009) and the corresponding weighted average cost of pooled gas is $3.96/MMBTU. However, considering continuation of the current crude prices at $ 80/Barrrel fromFebruary 2010, the long term LNG costs would increase to about $9.01/MMBTU Ex terminal inJanuary 2012 and the corresponding weighted average cost of pooled gas will be $ 4.44/MMBTU.
Advantages and Disadvantages
A detailed analysis was carried out based on parameters such as volume, volatility, administrationissues etc. for all the options. The following table provides the advantages and disadvantages of the Compulsory Comprehensive Pool arrangements.
Table 5.2: Advantages an d disadvantages
Advantages Disadvantages
• Thematic objectives of incrementalgas supplies is achieved since the
• May lead to lack of transparency in spotLNG procurement
8/6/2019 Natural Gas _ India _2010(1)
http://slidepdf.com/reader/full/natural-gas-india-20101 23/65
GAIL (India) Limited STRICTLY CONFIDENTIAL
Study on common pool price mechanism for natural gas in the country VI-22
Advantages Disadvantages
arrangements can potentiallyintroduce new supplies
• Large volumes dampen the effect of high Spot LNG prices. However if allspot is included then there could besignificant volatility
• Pool administration and implementationexpensive and contentious
• Increased LNG supplies in thecountry
• Negative signaling impact for future as pricediscovery of PSC gas is not possible
• Legal issues- Will be prone to disputes. Alsoruns counter to PSC provisions
• Runs counter to the direction of economicpolicies of the country
• Allocation will be an issue in event of shortages- Gas Utilization Policy (GUP) tobe detailed out
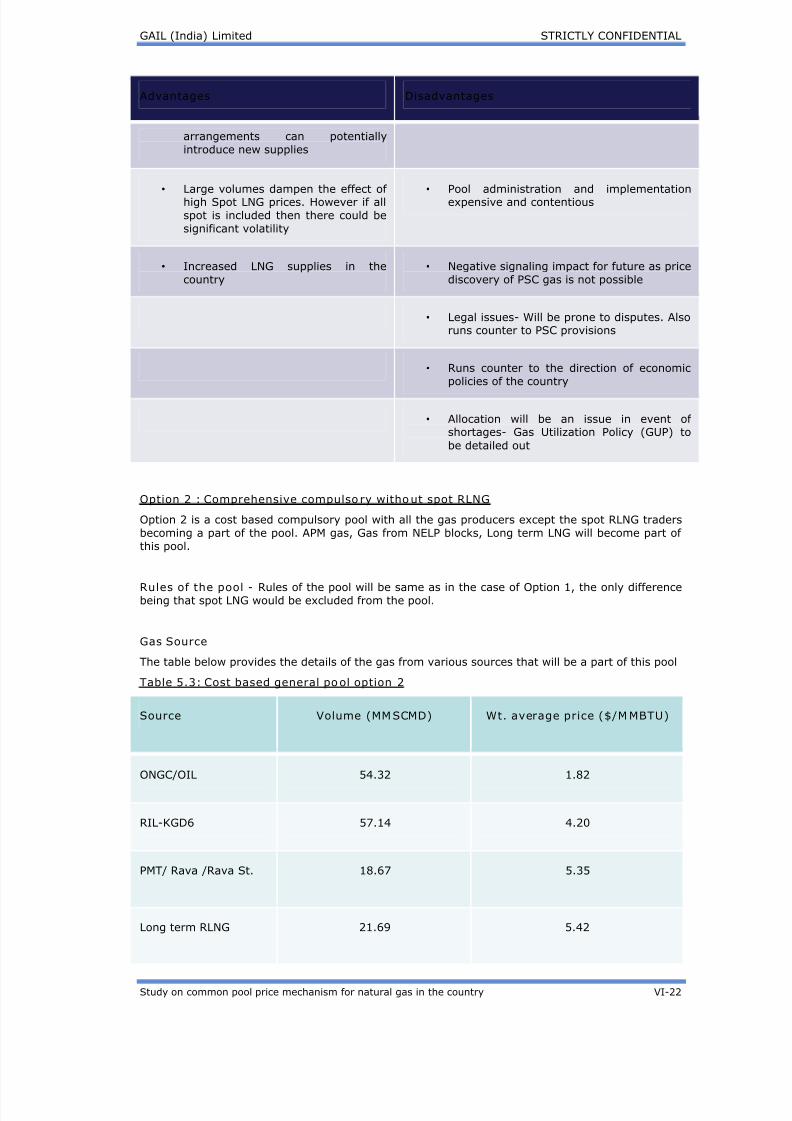
Option 2 : Comprehensive compulso ry witho ut spot RLNG
Option 2 is a cost based compulsory pool with all the gas producers except the spot RLNG tradersbecoming a part of the pool. APM gas, Gas from NELP blocks, Long term LNG will become part of this pool.
Rules of the pool - Rules of the pool will be same as in the case of Option 1, the only differencebeing that spot LNG would be excluded from the pool.
Gas Source
The table below provides the details of the gas from various sources that will be a part of this pool
Table 5.3: Cost based general po ol option 2
Source Volume (MM SCMD) Wt. average price ($/M MBTU)
ONGC/OIL 54.32 1.82
RIL-KGD6 57.14 4.20
PMT/ Rava /Rava St. 18.67 5.35
Long term RLNG 21.69 5.42

8/6/2019 Natural Gas _ India _2010(1)
http://slidepdf.com/reader/full/natural-gas-india-20101 24/65
GAIL (India) Limited STRICTLY CONFIDENTIAL
Study on common pool price mechanism for natural gas in the country VI-23
Other Gas 2.70 4.73
Source: MoPNG and GAIL
The weighted average price for option 2 comes out to be $3.68/MMBTU
Advantages and Disadvantages
The following table provides the advantages and disadvantages of option 2.
Table 5.4: Advantages an d disadvantages
Advantages Disadvantages
• Lower volatility as compared tothe Compulsory Comprehensive
arrangements (Option 1)
• Militates against the objective of highervolumes of gas being sources through spots
• No pool administration issuesrelating to spot purchase of LNG
• Negative signaling impact for future as pricediscovery of PSC gas is not possible
• Legal issues- Runs counter to PSC provisionsof market discovery of prices
• Runs counter to the direction of economicpolicies of the country
• Allocation will be an issue in event of shortages- Gas Utilization Policy (GUP) to bedetailed out through rules
Option 3: Facilitated w ithout private spot RLNG and P SC gas
Option 3 is a cost based facilitated pool with all the PSU gas producers having an option to be apart of the pool. There is no compulsion for the gas producers to become a part of his pool. Thegas producers can join and exit the pool as per predefined rules.
Rules of the pool
1. All the entities holding the customers will identify the demand and give it to the
pool operator.2. Pool operator will allocate the gas based on identified rules (Gas Utilization
Policy).
3. Priority will be given to the power and fertilizer customers.
4. This will be a tenured mechanism with the sunset clause identified at the beginningto facilitate the transition to a developed Natural Gas market.
Gas Source
The table below provides the details of the gas from various sources that could be a part of thispool.
8/6/2019 Natural Gas _ India _2010(1)
http://slidepdf.com/reader/full/natural-gas-india-20101 25/65
GAIL (India) Limited STRICTLY CONFIDENTIAL
Study on common pool price mechanism for natural gas in the country VI-24
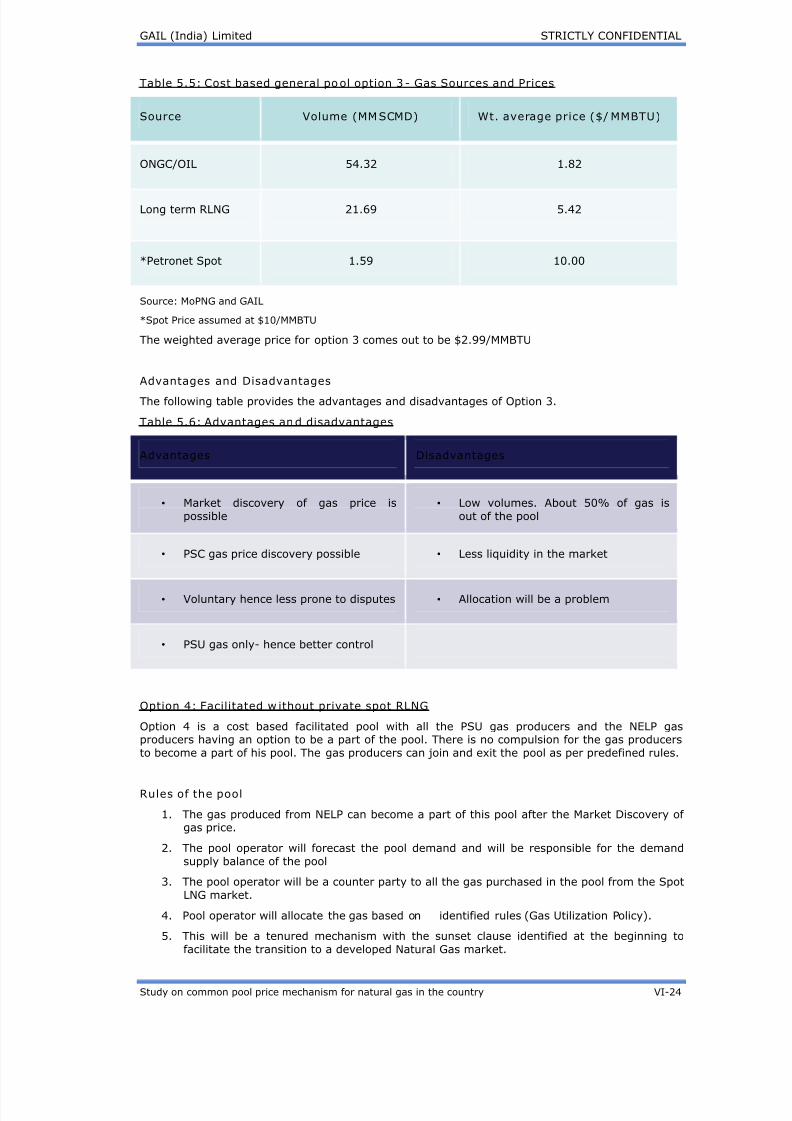
Table 5.5: Cost based general po ol option 3 - Gas Sources and Prices
Source Volume (MM SCMD) Wt. average price ($/ MMBTU)
ONGC/OIL 54.32 1.82
Long term RLNG 21.69 5.42
*Petronet Spot 1.59 10.00
Source: MoPNG and GAIL
*Spot Price assumed at $10/MMBTU
The weighted average price for option 3 comes out to be $2.99/MMBTU
Advantages and Disadvantages
The following table provides the advantages and disadvantages of Option 3.
Table 5.6: Advantages an d disadvantages
Advantages Disadvantages
• Market discovery of gas price ispossible
• Low volumes. About 50% of gas isout of the pool
• PSC gas price discovery possible • Less liquidity in the market
• Voluntary hence less prone to disputes • Allocation will be a problem
• PSU gas only- hence better control
Option 4: Facilitated w ithout private spot RLNG
Option 4 is a cost based facilitated pool with all the PSU gas producers and the NELP gasproducers having an option to be a part of the pool. There is no compulsion for the gas producersto become a part of his pool. The gas producers can join and exit the pool as per predefined rules.
Rules of the pool
1. The gas produced from NELP can become a part of this pool after the Market Discovery of gas price.
2. The pool operator will forecast the pool demand and will be responsible for the demandsupply balance of the pool
3. The pool operator will be a counter party to all the gas purchased in the pool from the SpotLNG market.
4. Pool operator will allocate the gas based on identified rules (Gas Utilization Policy).
5. This will be a tenured mechanism with the sunset clause identified at the beginning tofacilitate the transition to a developed Natural Gas market.
8/6/2019 Natural Gas _ India _2010(1)
http://slidepdf.com/reader/full/natural-gas-india-20101 26/65
GAIL (India) Limited STRICTLY CONFIDENTIAL
Study on common pool price mechanism for natural gas in the country VI-25
Gas Source
The table below provides the details of the gas from various sources that could be a part of thispool
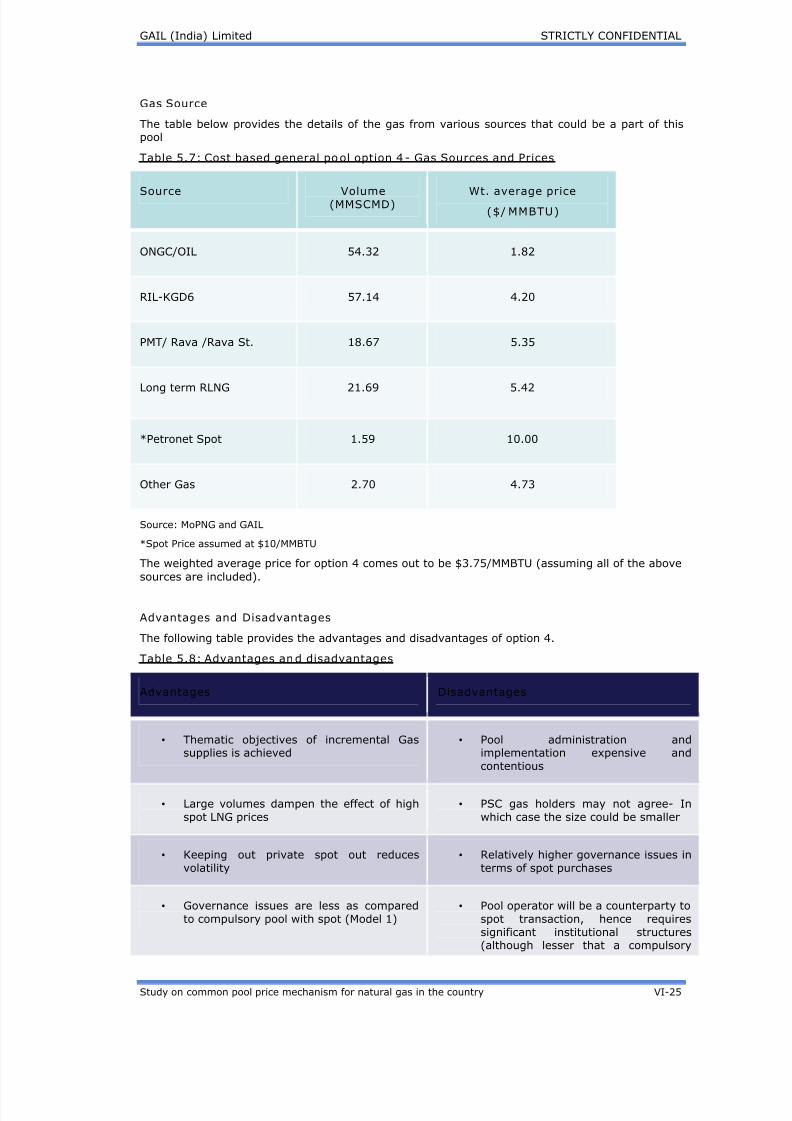
Table 5.7: Cost based general po ol option 4 - Gas Sources and Prices
Source Volume(MMSCMD) Wt. average price ($ / MMBTU)
ONGC/OIL 54.32 1.82
RIL-KGD6 57.14 4.20
PMT/ Rava /Rava St. 18.67 5.35
Long term RLNG 21.69 5.42
*Petronet Spot 1.59 10.00
Other Gas 2.70 4.73
Source: MoPNG and GAIL
*Spot Price assumed at $10/MMBTU
The weighted average price for option 4 comes out to be $3.75/MMBTU (assuming all of the abovesources are included).
Advantages and Disadvantages
The following table provides the advantages and disadvantages of option 4.
Table 5.8: Advantages an d disadvantages
Advantages Disadvantages
• Thematic objectives of incremental Gassupplies is achieved
• Pool administration andimplementation expensive andcontentious
• Large volumes dampen the effect of highspot LNG prices
• PSC gas holders may not agree- Inwhich case the size could be smaller
• Keeping out private spot out reducesvolatility
• Relatively higher governance issues interms of spot purchases
• Governance issues are less as comparedto compulsory pool with spot (Model 1)
• Pool operator will be a counterparty tospot transaction, hence requiressignificant institutional structures(although lesser that a compulsory
8/6/2019 Natural Gas _ India _2010(1)
http://slidepdf.com/reader/full/natural-gas-india-20101 27/65
GAIL (India) Limited STRICTLY CONFIDENTIAL
Study on common pool price mechanism for natural gas in the country VI-26
Advantages Disadvantages
pool)
• Price discovery for PSC gas is possible • Government may appoint a pooloperator among the PSU companies
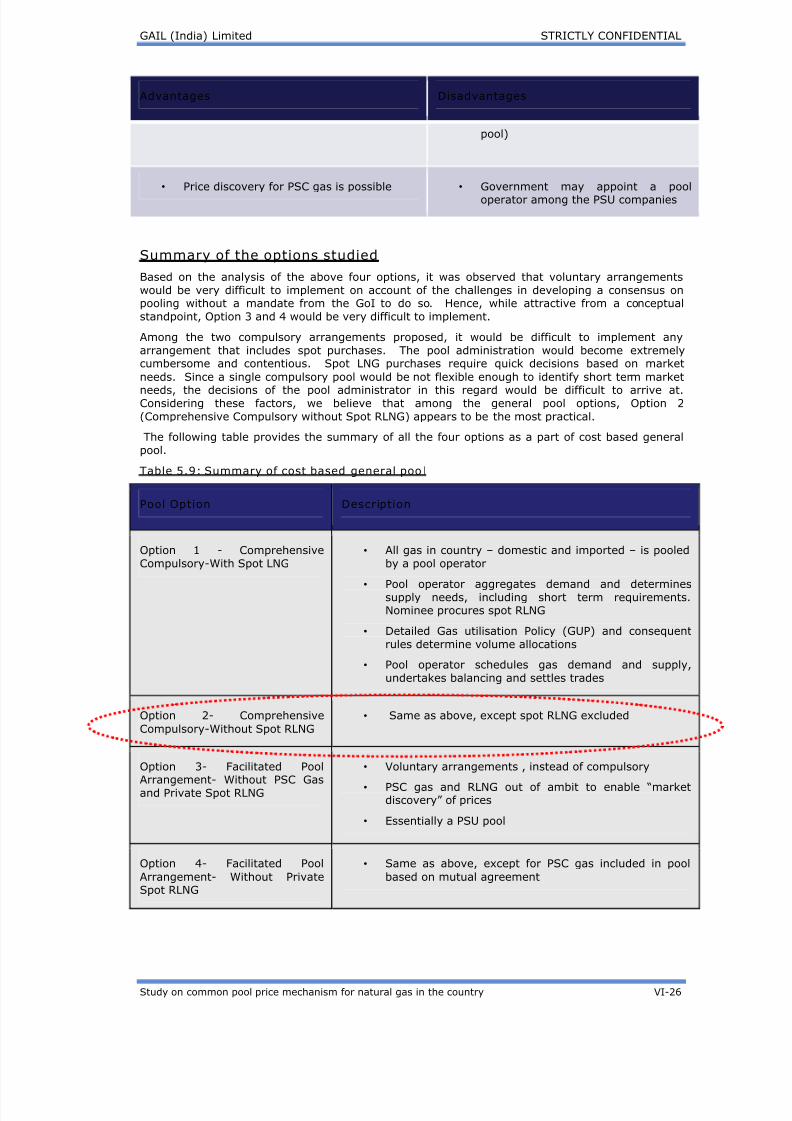
Summary of the options studiedBased on the analysis of the above four options, it was observed that voluntary arrangementswould be very difficult to implement on account of the challenges in developing a consensus onpooling without a mandate from the GoI to do so. Hence, while attractive from a conceptualstandpoint, Option 3 and 4 would be very difficult to implement.
Among the two compulsory arrangements proposed, it would be difficult to implement anyarrangement that includes spot purchases. The pool administration would become extremelycumbersome and contentious. Spot LNG purchases require quick decisions based on marketneeds. Since a single compulsory pool would be not flexible enough to identify short term market
needs, the decisions of the pool administrator in this regard would be difficult to arrive at.Considering these factors, we believe that among the general pool options, Option 2(Comprehensive Compulsory without Spot RLNG) appears to be the most practical.
The following table provides the summary of all the four options as a part of cost based generalpool.
Table 5.9: Summary of cost based general poo l
Pool Option Description
Option 1 - ComprehensiveCompulsory-With Spot LNG
• All gas in country – domestic and imported – is pooledby a pool operator
• Pool operator aggregates demand and determinessupply needs, including short term requirements.Nominee procures spot RLNG
• Detailed Gas utilisation Policy (GUP) and consequentrules determine volume allocations
• Pool operator schedules gas demand and supply,undertakes balancing and settles trades
Option 2- ComprehensiveCompulsory-Without Spot RLNG
• Same as above, except spot RLNG excluded
Option 3- Facilitated PoolArrangement- Without PSC Gasand Private Spot RLNG
• Voluntary arrangements , instead of compulsory
• PSC gas and RLNG out of ambit to enable “marketdiscovery” of prices
• Essentially a PSU pool
Option 4- Facilitated PoolArrangement- Without PrivateSpot RLNG
• Same as above, except for PSC gas included in poolbased on mutual agreement
8/6/2019 Natural Gas _ India _2010(1)
http://slidepdf.com/reader/full/natural-gas-india-20101 28/65
GAIL (India) Limited STRICTLY CONFIDENTIAL
Study on common pool price mechanism for natural gas in the country VI-27
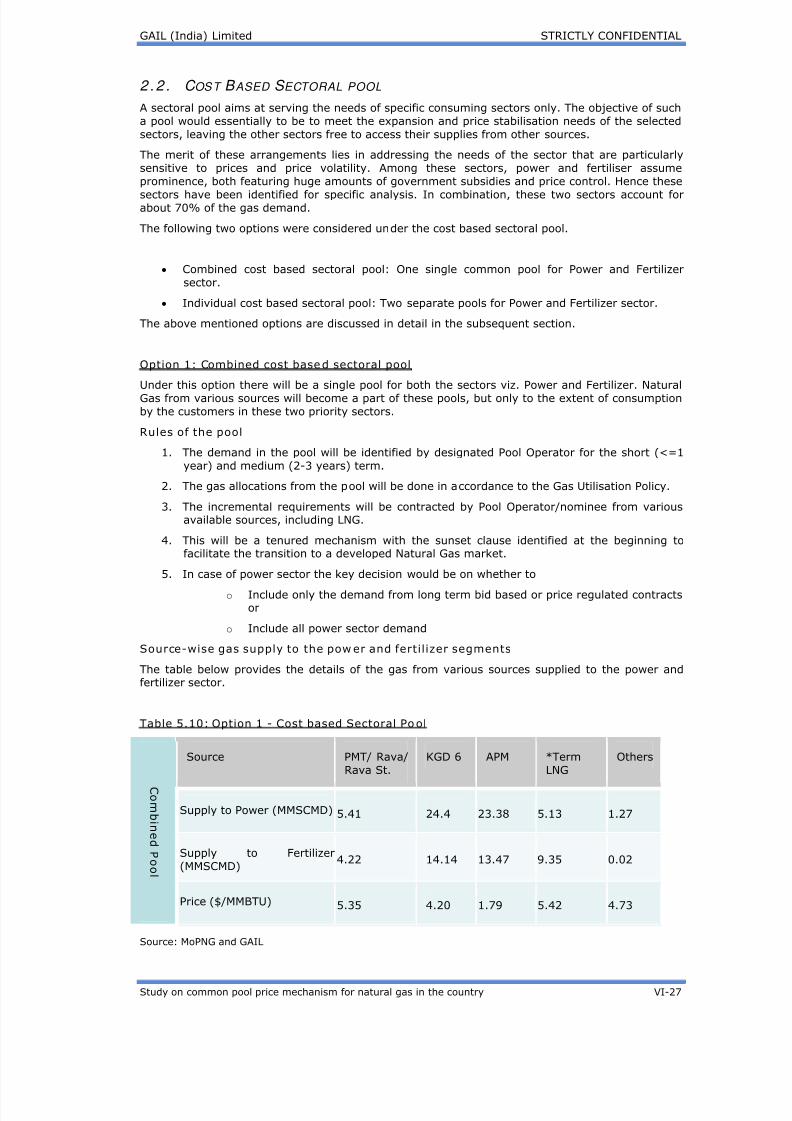
2 . 2 . C OS T B ASED S ECTORAL POOL A sectoral pool aims at serving the needs of specific consuming sectors only. The objective of sucha pool would essentially to be to meet the expansion and price stabilisation needs of the selectedsectors, leaving the other sectors free to access their supplies from other sources.
The merit of these arrangements lies in addressing the needs of the sector that are particularlysensitive to prices and price volatility. Among these sectors, power and fertiliser assumeprominence, both featuring huge amounts of government subsidies and price control. Hence these
sectors have been identified for specific analysis. In combination, these two sectors account forabout 70% of the gas demand.
The following two options were considered under the cost based sectoral pool.
• Combined cost based sectoral pool: One single common pool for Power and Fertilizersector.
• Individual cost based sectoral pool: Two separate pools for Power and Fertilizer sector.
The above mentioned options are discussed in detail in the subsequent section.
Option 1: Combined cost base d sectoral pool
Under this option there will be a single pool for both the sectors viz. Power and Fertilizer. NaturalGas from various sources will become a part of these pools, but only to the extent of consumptionby the customers in these two priority sectors.
Rules of the pool
1. The demand in the pool will be identified by designated Pool Operator for the short (<=1year) and medium (2-3 years) term.
2. The gas allocations from the pool will be done in accordance to the Gas Utilisation Policy.
3. The incremental requirements will be contracted by Pool Operator/nominee from variousavailable sources, including LNG.
4. This will be a tenured mechanism with the sunset clause identified at the beginning tofacilitate the transition to a developed Natural Gas market.
5. In case of power sector the key decision would be on whether to
o Include only the demand from long term bid based or price regulated contractsor
o Include all power sector demand
Source-wise gas supply to the pow er and fertilizer segments
The table below provides the details of the gas from various sources supplied to the power andfertilizer sector.
Table 5.10: Option 1 - Cost based Sectoral Po ol
C om
b i n
e d P
o ol
Source PMT/ Rava/Rava St.
KGD 6 APM *TermLNG
Others
Supply to Power (MMSCMD) 5.41 24.4 23.38 5.13 1.27
Supply to Fertilizer(MMSCMD) 4.22 14.14 13.47 9.35 0.02
Price ($/MMBTU) 5.35 4.20 1.79 5.42 4.73
Source: MoPNG and GAIL

8/6/2019 Natural Gas _ India _2010(1)
http://slidepdf.com/reader/full/natural-gas-india-20101 29/65
GAIL (India) Limited STRICTLY CONFIDENTIAL
Study on common pool price mechanism for natural gas in the country VI-28
The weighted average price for combined sectoral pool, considering the current supplies comes outto be $3.61/MMBTU
Advantages and Disadvantages
A detailed analysis was carried out on parameters such as volume, volatility, gas supply,administration issues etc. for all the options. The following table provides the advantages anddisadvantages of option 1.
Table 5.11: Advantages an d disadvantages
Advantages Disadvantages
Moderate volatility Allocation will be an issue in event of shortages.Allocation based on identified rules
Desired effect of pooling can be achievedas pooled price gas will be supplied to thekey segments which requires gas pricestability
Power and fertilizer sectors would have separategrowth trajectories. A common pool may result
in one category of consumers subsidizing theother
Price discovery of gas is possible howevermechanism for price discovery of gas out of power and fertilizer sector will have to beidentified
Policy directive adequate forimplementation
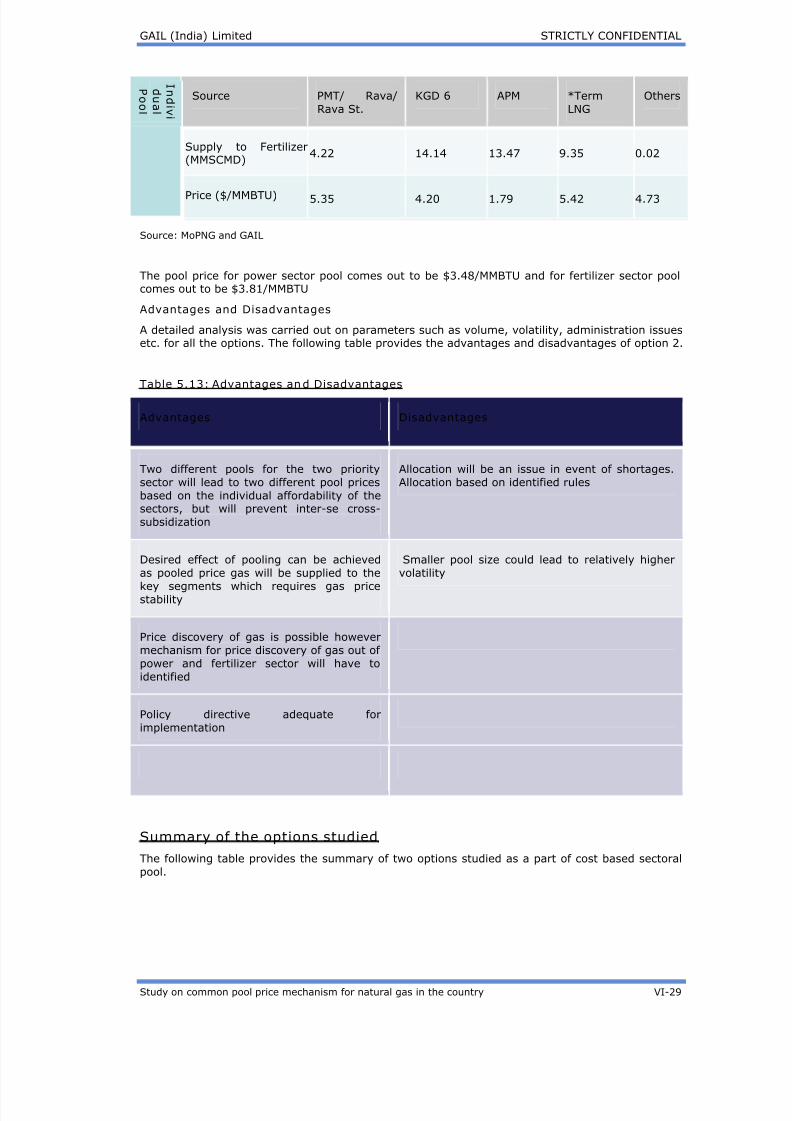
Option 2: In dividual cost based sectoral poolThere will be two separate pools for Power and Fertilizer. Natural Gas from various sources willbecome a part of these pools, but only to the extent of consumption by the customers in these twopriority sectors respectively.
Rules of the pool
1. Rules will be similar to option 1 except that there will be two independent pooloperators which will administer the respective pools
Source-wise gas supply to the pow er and fertilizer segments
The table below provides the details of the gas from various sources supplied to the power andfertilizer sector.
Table 5.12: Cost based sectoral pool o ption 2-
I n d i vi d
u al P
o ol
Source PMT/ Rava/Rava St.
KGD 6 APM *TermLNG
Others
Supply to Power(MMSCMD) 5.41 24.4 23.38 5.13 1.27
Price ($/MMBTU) 5.35 4.20 1.79 5.42 4.73
Source PMT/ Rava/Rava St.
KGD 6 APM *TermLNG
Others
8/6/2019 Natural Gas _ India _2010(1)
http://slidepdf.com/reader/full/natural-gas-india-20101 30/65
GAIL (India) Limited STRICTLY CONFIDENTIAL
Study on common pool price mechanism for natural gas in the country VI-29
I n d i vi
d u al
P o ol
Source PMT/ Rava/Rava St.
KGD 6 APM *TermLNG
Others
Supply to Fertilizer(MMSCMD) 4.22 14.14 13.47 9.35 0.02
Price ($/MMBTU) 5.35 4.20 1.79 5.42 4.73
Source: MoPNG and GAIL
The pool price for power sector pool comes out to be $3.48/MMBTU and for fertilizer sector poolcomes out to be $3.81/MMBTU
Advantages and Disadvantages
A detailed analysis was carried out on parameters such as volume, volatility, administration issuesetc. for all the options. The following table provides the advantages and disadvantages of option 2.
Table 5.13: Advantages an d Disadvantages
Advantages Disadvantages
Two different pools for the two prioritysector will lead to two different pool pricesbased on the individual affordability of thesectors, but will prevent inter-se cross-subsidization
Allocation will be an issue in event of shortages.Allocation based on identified rules
Desired effect of pooling can be achievedas pooled price gas will be supplied to the
key segments which requires gas pricestability
Smaller pool size could lead to relatively highervolatility
Price discovery of gas is possible howevermechanism for price discovery of gas out of power and fertilizer sector will have toidentified
Policy directive adequate forimplementation
Summary of the options studiedThe following table provides the summary of two options studied as a part of cost based sectoralpool.
8/6/2019 Natural Gas _ India _2010(1)
http://slidepdf.com/reader/full/natural-gas-india-20101 31/65
GAIL (India) Limited STRICTLY CONFIDENTIAL
Study on common pool price mechanism for natural gas in the country VI-30
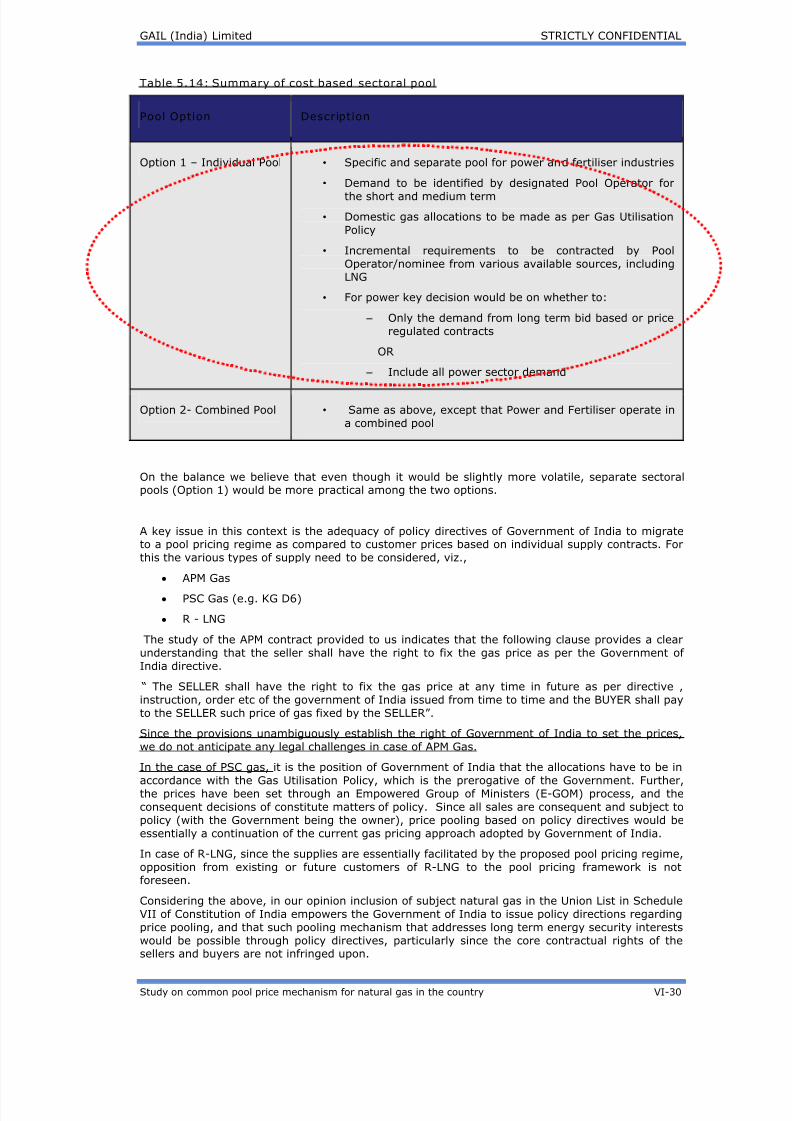
Table 5.14: Summary of cost based sectoral pool
Pool Option Description
Option 1 – Individual Pool • Specific and separate pool for power and fertiliser industries
• Demand to be identified by designated Pool Operator for
the short and medium term• Domestic gas allocations to be made as per Gas Utilisation
Policy
• Incremental requirements to be contracted by PoolOperator/nominee from various available sources, includingLNG
• For power key decision would be on whether to:
– Only the demand from long term bid based or priceregulated contracts
OR
– Include all power sector demand
Option 2- Combined Pool • Same as above, except that Power and Fertiliser operate ina combined pool
On the balance we believe that even though it would be slightly more volatile, separate sectoralpools (Option 1) would be more practical among the two options.
A key issue in this context is the adequacy of policy directives of Government of India to migrateto a pool pricing regime as compared to customer prices based on individual supply contracts. Forthis the various types of supply need to be considered, viz.,
• APM Gas
• PSC Gas (e.g. KG D6)
• R - LNG
The study of the APM contract provided to us indicates that the following clause provides a clearunderstanding that the seller shall have the right to fix the gas price as per the Government of India directive.
“ The SELLER shall have the right to fix the gas price at any time in future as per directive ,instruction, order etc of the government of India issued from time to time and the BUYER shall payto the SELLER such price of gas fixed by the SELLER”.
Since the provisions unambiguously establish the right of Government of India to set the prices,we do not anticipate any legal challenges in case of APM Gas.
In the case of PSC gas, it is the position of Government of India that the allocations have to be in
accordance with the Gas Utilisation Policy, which is the prerogative of the Government. Further,the prices have been set through an Empowered Group of Ministers (E-GOM) process, and theconsequent decisions of constitute matters of policy. Since all sales are consequent and subject topolicy (with the Government being the owner), price pooling based on policy directives would beessentially a continuation of the current gas pricing approach adopted by Government of India.
In case of R-LNG, since the supplies are essentially facilitated by the proposed pool pricing regime,opposition from existing or future customers of R-LNG to the pool pricing framework is notforeseen.
Considering the above, in our opinion inclusion of subject natural gas in the Union List in ScheduleVII of Constitution of India empowers the Government of India to issue policy directions regardingprice pooling, and that such pooling mechanism that addresses long term energy security interestswould be possible through policy directives, particularly since the core contractual rights of thesellers and buyers are not infringed upon.
8/6/2019 Natural Gas _ India _2010(1)
http://slidepdf.com/reader/full/natural-gas-india-20101 32/65
GAIL (India) Limited STRICTLY CONFIDENTIAL
Study on common pool price mechanism for natural gas in the country VI-31
Two additional factors need to be considered. Firstly, the review of existing APM and PSCcontracts with customers reveals that the prices are essentially passed through by the purchasersthrough the tariff process. Hence there is no direct impact on the procuring entities, who are alsorelatively few in numbers (and hence easier to consult and take on board). More importantly, theentire purpose of the proposed pooling exercise is to facilitate additional supplies and hencegrowth of these customers. The additional supplies would enable major customers like NTPC,Pragati Power, etc to expand their gas based portfolio and would also help meet the country’squest for energy security and clean energy generation. Hence it is anticipated that the respectivenodal ministries would support the development of sectoral pools, and that the policy wouldreceive active co-operation and support of these ministries.
2 . 3 . B I D B ASED POOL Unlike the options in the cost based pools which has to be implemented on a standalone basis, it isproposed that the bid based pool will co-exist with the long term contracts or any of the identifiedcost based pooling mechanisms.
Key features of bid based pool
1. Generally the volumes in case of bid based pool is not high (generally in the range of ~10-15% of the total volume of gas)
2. Spot LNG, Government of India share of profit gas and leftover PSC gas which is notcontracted (if any) can become part of this pool.
3. Commodity and financial transaction will be monitored and controlled by an independentpool operator or platform like in the case of power sector.
4. It is consistent with economic policy of the country to move towards market determinedprices for natural gas in the country
The following figure shows the institutional structure and the mechanism of bid based pooling.
TransmissionCompanies C u
s t om
er s –B
ul k
an
d R
e t ai l
Clearing House
C GD 1
C GD 2
Producers & Shippers Suppliers/Shippers Distribution
Scheduling and Energy accounting byGas Pool Operator
AuctionPool
Gas Traders
UncontractedPSC gas
LNG Spots
Rules of the pool
1. The gas producers and traders will indicate the volume to be pooled into the pool on adaily basis.
2. Customers will indicate the requirement of gas on daily basis.
3. The pool/auction platform will discover the price of gas on daily basis.
4. The clearing house will settle all the financial transaction between the gas producers, gastraders, transmission pipeline company and the gas customers.
Advantages and Disadvantages
The following table highlights the advantages and disadvantages of the bid based pool.
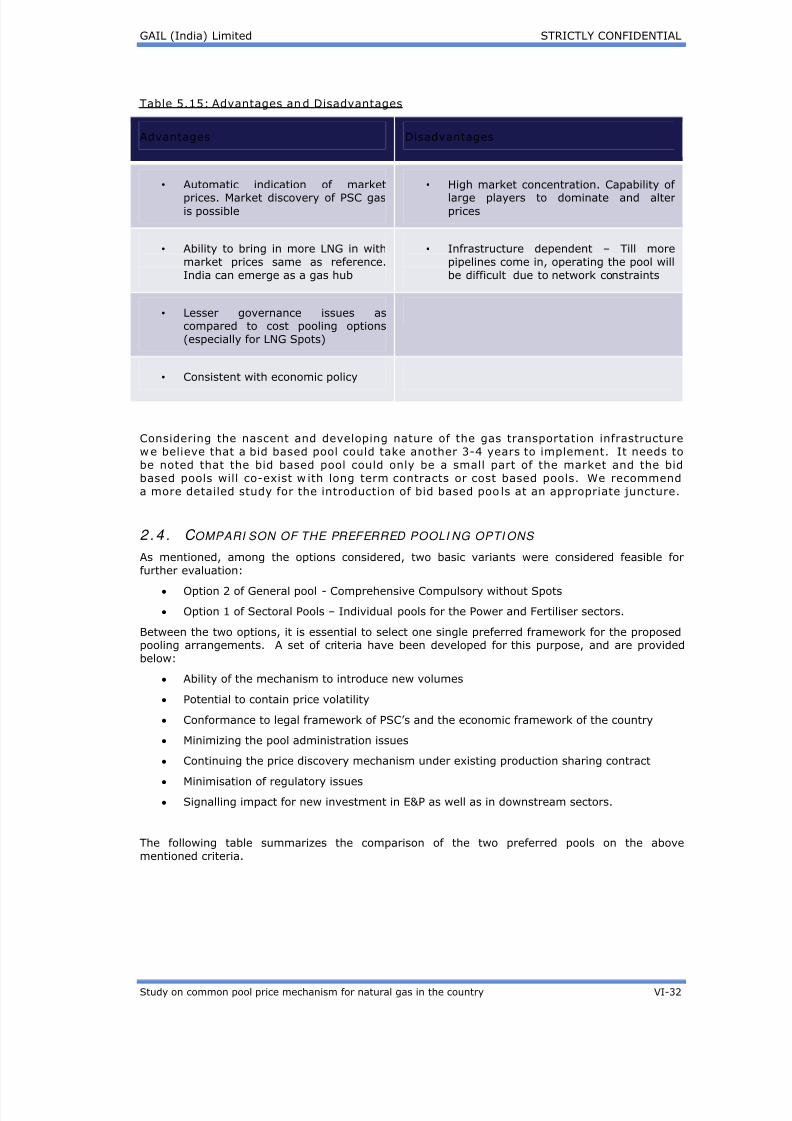
8/6/2019 Natural Gas _ India _2010(1)
http://slidepdf.com/reader/full/natural-gas-india-20101 33/65
GAIL (India) Limited STRICTLY CONFIDENTIAL
Study on common pool price mechanism for natural gas in the country VI-32
Table 5.15: Advantages an d Disadvantages
Advantages Disadvantages
• Automatic indication of marketprices. Market discovery of PSC gasis possible
• High market concentration. Capability of large players to dominate and alterprices
• Ability to bring in more LNG in withmarket prices same as reference.India can emerge as a gas hub
• Infrastructure dependent – Till morepipelines come in, operating the pool willbe difficult due to network constraints
• Lesser governance issues ascompared to cost pooling options(especially for LNG Spots)
• Consistent with economic policy
Considering the nascent and developing nature of the gas transportation infrastructurew e believe that a bid based pool could take another 3-4 years to implement. It needs tobe noted that the bid based pool could only be a small part of the market and the bidbased pools will co-exist w ith long term contracts or cost based pools. We recommenda more detailed study for the introduction of bid based poo ls at an appropriate juncture.
2 . 4 . C OMPARI SON OF THE PREFERRED POOLI NG OPTI ONS As mentioned, among the options considered, two basic variants were considered feasible forfurther evaluation:
• Option 2 of General pool - Comprehensive Compulsory without Spots• Option 1 of Sectoral Pools – Individual pools for the Power and Fertiliser sectors.
Between the two options, it is essential to select one single preferred framework for the proposedpooling arrangements. A set of criteria have been developed for this purpose, and are providedbelow:
• Ability of the mechanism to introduce new volumes
• Potential to contain price volatility
• Conformance to legal framework of PSC’s and the economic framework of the country
• Minimizing the pool administration issues
• Continuing the price discovery mechanism under existing production sharing contract
•
Minimisation of regulatory issues• Signalling impact for new investment in E&P as well as in downstream sectors.
The following table summarizes the comparison of the two preferred pools on the abovementioned criteria.
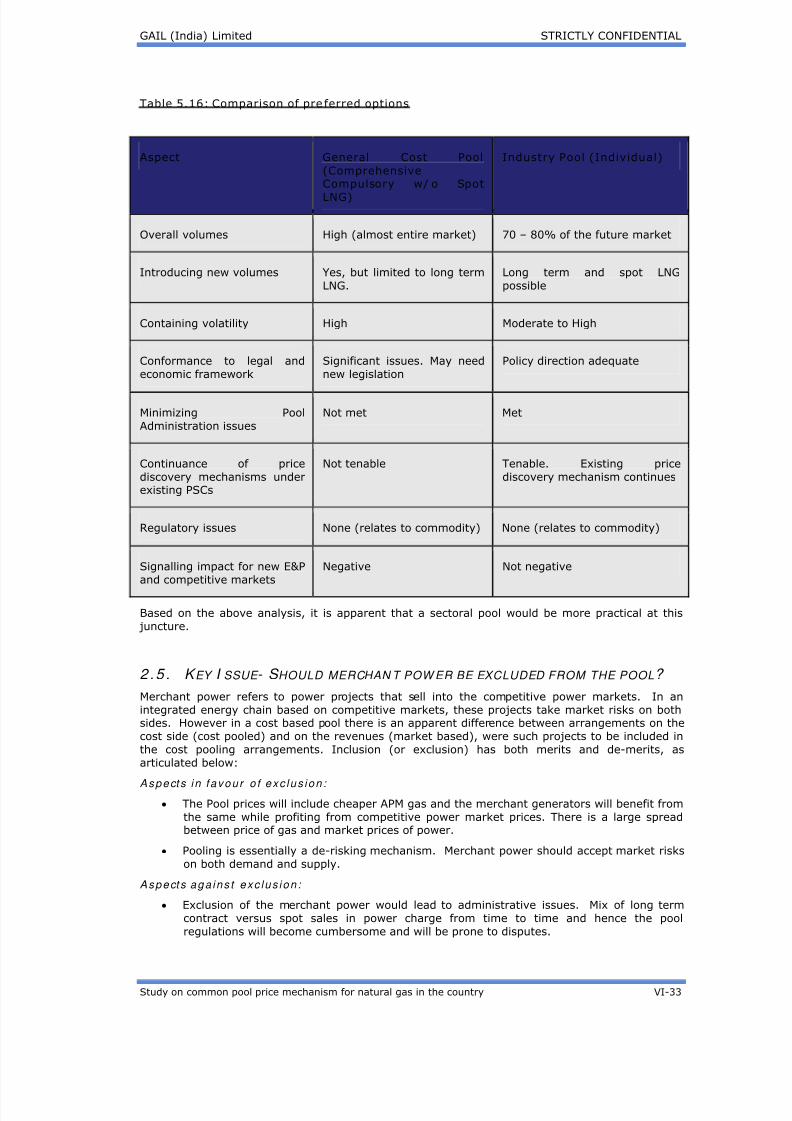
8/6/2019 Natural Gas _ India _2010(1)
http://slidepdf.com/reader/full/natural-gas-india-20101 34/65
GAIL (India) Limited STRICTLY CONFIDENTIAL
Study on common pool price mechanism for natural gas in the country VI-33
Table 5.16: Comparison of pre ferred options
Aspect General Cost Pool(ComprehensiveCompulsory w/ o Spot
LNG)
Industry Pool (Individual)
Overall volumes High (almost entire market) 70 – 80% of the future market
Introducing new volumes Yes, but limited to long termLNG.
Long term and spot LNGpossible
Containing volatility High Moderate to High
Conformance to legal andeconomic framework
Significant issues. May neednew legislation
Policy direction adequate
Minimizing PoolAdministration issues
Not met Met
Continuance of pricediscovery mechanisms underexisting PSCs
Not tenable Tenable. Existing pricediscovery mechanism continues
Regulatory issues None (relates to commodity) None (relates to commodity)
Signalling impact for new E&Pand competitive markets
Negative Not negative
Based on the above analysis, it is apparent that a sectoral pool would be more practical at this juncture.
2 . 5 . K EY I SSUE - S HOULD MERCHAN T POW ER BE EXCLUDED FROM THE POOL ? Merchant power refers to power projects that sell into the competitive power markets. In anintegrated energy chain based on competitive markets, these projects take market risks on bothsides. However in a cost based pool there is an apparent difference between arrangements on thecost side (cost pooled) and on the revenues (market based), were such projects to be included inthe cost pooling arrangements. Inclusion (or exclusion) has both merits and de-merits, asarticulated below:
A s p e ct s i n f a v o u r o f e x c l u s i o n : • The Pool prices will include cheaper APM gas and the merchant generators will benefit from
the same while profiting from competitive power market prices. There is a large spreadbetween price of gas and market prices of power.
• Pooling is essentially a de-risking mechanism. Merchant power should accept market riskson both demand and supply.
A s p e ct s a g a i n s t e x c l u s i o n :
• Exclusion of the merchant power would lead to administrative issues. Mix of long termcontract versus spot sales in power charge from time to time and hence the poolregulations will become cumbersome and will be prone to disputes.
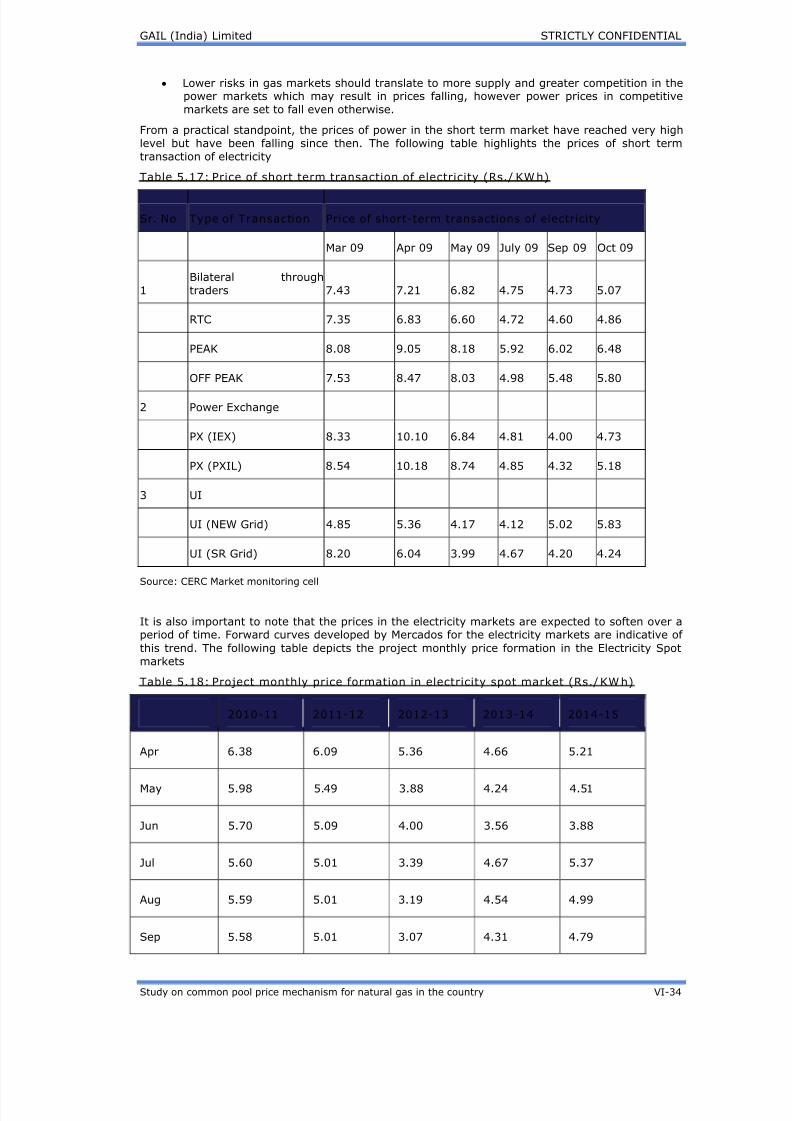
8/6/2019 Natural Gas _ India _2010(1)
http://slidepdf.com/reader/full/natural-gas-india-20101 35/65
GAIL (India) Limited STRICTLY CONFIDENTIAL
Study on common pool price mechanism for natural gas in the country VI-34
• Lower risks in gas markets should translate to more supply and greater competition in thepower markets which may result in prices falling, however power prices in competitivemarkets are set to fall even otherwise.
From a practical standpoint, the prices of power in the short term market have reached very highlevel but have been falling since then. The following table highlights the prices of short termtransaction of electricity
Table 5.17: Price of short term transaction of electricity (Rs./ KW h)
Sr. No Type of Transaction Price of short-term transactions of electricity
Mar 09 Apr 09 May 09 July 09 Sep 09 Oct 09
1Bilateral throughtraders 7.43 7.21 6.82 4.75 4.73 5.07
RTC 7.35 6.83 6.60 4.72 4.60 4.86
PEAK 8.08 9.05 8.18 5.92 6.02 6.48
OFF PEAK 7.53 8.47 8.03 4.98 5.48 5.80
2 Power Exchange
PX (IEX) 8.33 10.10 6.84 4.81 4.00 4.73
PX (PXIL) 8.54 10.18 8.74 4.85 4.32 5.18
3 UI
UI (NEW Grid) 4.85 5.36 4.17 4.12 5.02 5.83
UI (SR Grid) 8.20 6.04 3.99 4.67 4.20 4.24
Source: CERC Market monitoring cell
It is also important to note that the prices in the electricity markets are expected to soften over aperiod of time. Forward curves developed by Mercados for the electricity markets are indicative of this trend. The following table depicts the project monthly price formation in the Electricity Spotmarkets
Table 5.18: Project monthly price formation in electricity spot market (Rs./ KW h)
2010-11 2011-12 2012-13 2013-14 2014-15
Apr 6.38 6.09 5.36 4.66 5.21
May 5.98 5.49 3.88 4.24 4.51
Jun 5.70 5.09 4.00 3.56 3.88
Jul 5.60 5.01 3.39 4.67 5.37
Aug 5.59 5.01 3.19 4.54 4.99
Sep 5.58 5.01 3.07 4.31 4.79
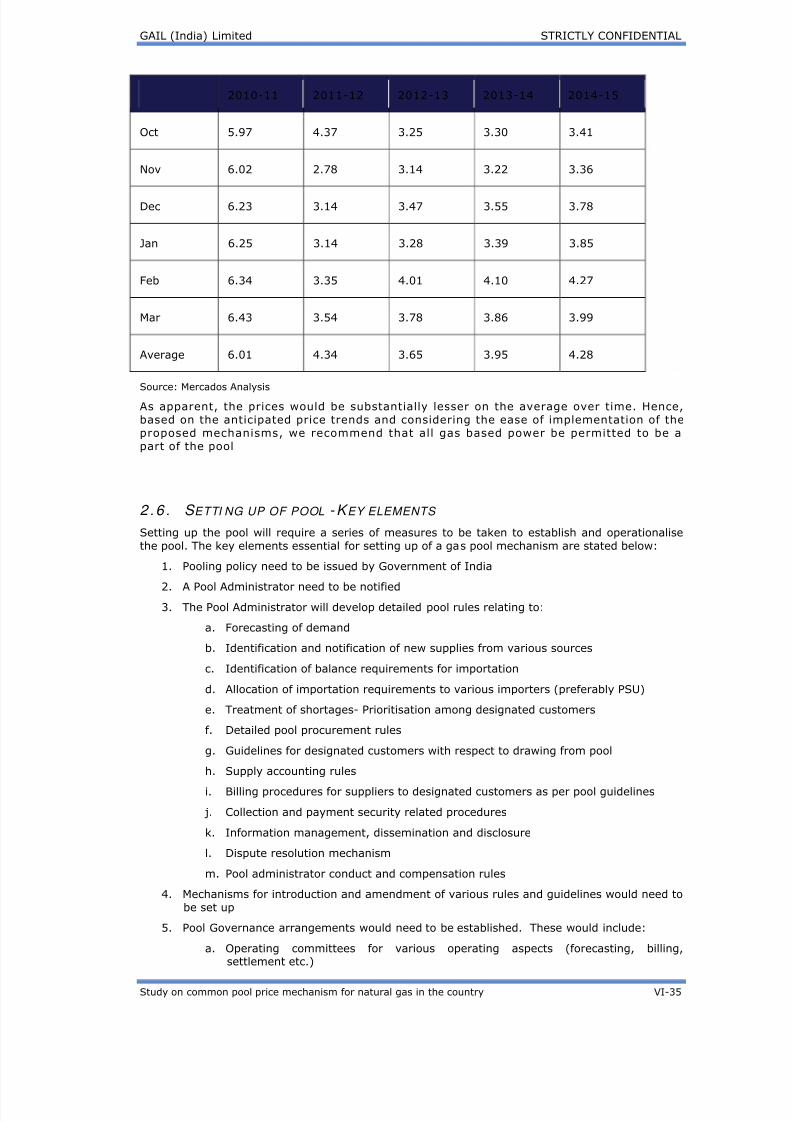
8/6/2019 Natural Gas _ India _2010(1)
http://slidepdf.com/reader/full/natural-gas-india-20101 36/65
GAIL (India) Limited STRICTLY CONFIDENTIAL
Study on common pool price mechanism for natural gas in the country VI-35
2010-11 2011-12 2012-13 2013-14 2014-15
Oct 5.97 4.37 3.25 3.30 3.41
Nov 6.02 2.78 3.14 3.22 3.36
Dec 6.23 3.14 3.47 3.55 3.78
Jan 6.25 3.14 3.28 3.39 3.85
Feb 6.34 3.35 4.01 4.10 4.27
Mar 6.43 3.54 3.78 3.86 3.99
Average 6.01 4.34 3.65 3.95 4.28
Source: Mercados Analysis
As apparent, the prices would be substantially lesser on the average over time. Hence,based on the anticipated price trends and considering the ease of implementation of theproposed mechanisms, we recommend that all gas based power be permitted to be apart of the pool
2 . 6 . S ETTI NG UP OF POOL - K EY ELEMENTS Setting up the pool will require a series of measures to be taken to establish and operationalisethe pool. The key elements essential for setting up of a gas pool mechanism are stated below:
1. Pooling policy need to be issued by Government of India
2. A Pool Administrator need to be notified3. The Pool Administrator will develop detailed pool rules relating to:
a. Forecasting of demand
b. Identification and notification of new supplies from various sources
c. Identification of balance requirements for importation
d. Allocation of importation requirements to various importers (preferably PSU)
e. Treatment of shortages- Prioritisation among designated customers
f. Detailed pool procurement rules
g. Guidelines for designated customers with respect to drawing from pool
h. Supply accounting rules
i. Billing procedures for suppliers to designated customers as per pool guidelines
j. Collection and payment security related procedures
k. Information management, dissemination and disclosure
l. Dispute resolution mechanism
m. Pool administrator conduct and compensation rules
4. Mechanisms for introduction and amendment of various rules and guidelines would need tobe set up
5. Pool Governance arrangements would need to be established. These would include:
a. Operating committees for various operating aspects (forecasting, billing,settlement etc.)
8/6/2019 Natural Gas _ India _2010(1)
http://slidepdf.com/reader/full/natural-gas-india-20101 37/65
GAIL (India) Limited STRICTLY CONFIDENTIAL
Study on common pool price mechanism for natural gas in the country VI-36
b. Operations review committee (periodic review of efficacy of arrangement andrules. Recommendations on changes);
c. Audit committees
6. Amendments or modifications to existing contracts novated to the pool would need to bemade.
a. Notification of DCs and modification of the contracts
b. Modification of supply contracts to the extent required by the poolingarrangements
c. Modification to transportation contracts
7. Review arrangements after a defined time period would need to be set out.
An important aspect to consider is the taxation regime for gas. At present there are a wide rangeof taxation regimes that apply to gas from various sources, both at origin and at point of sale.Pooling of prices would result in the costs of feed gas varying from the sale price under the supplycontract. While in case of PMT gas supplied under the APM mechanism a similar situation has beenaddressed (through the Gas Pool Account), and the same can be done for the sectoral pool, wewould recommend a relook at the taxation regime and suggest simplification of the same. Inparticular since it is the stated objective of Government of India to reach gas out as a clean sourceof energy across the country, according gas the status of Declared Goods would merit
consideration.
2 . 7 . P OOL OPERATI ON MECHANI SM The day to day operations of the pool will need to be based on detailed procedures. The PoolOperator would be central to the proposed arrangements and would play a major role in finalizingthe terms and conditions for new gas entering the pool, as well as the management of the entirepool operations. The overall scheme proposed for this are indicated below:
1. Pool operator will forecast Short Term (Up to 1 year) and Medium Term Demand (3-4years) every month for Designated Consumers.
2. The demand will be confirmed by the Designated Consumers.
3. The pool operator will decide on the probable mix between domestic gas (based on
availability), Term LNG and Spots.4. The pool operator will allocate the demand to empanelled/identified suppliers (sellers,
shippers and importers) as per agreed allocation mechanisms.
5. The gas suppliers will contract at appropriate time with the Designated Consumers in linewith the pool rules and allocations. The Pool operator will be informed about the contractsconcluded and the agreements would be lodged with the Pool Operator.
6. The pool operator will conduct periodic review for various kinds of procurement to modifyprocurement schedules.
7. Metering will be done at the various supply and off-take points by the gas transportersbased on identified contractual volumes (for the Designated Consumers) and actual.
8. The metered data will be submitted to the pool operator.
9. The pool operator will thereafter prepare the pool accounts, computing the average poolprices and quantities for the month.
10. The sellers will issue bills to the Designated Customers at the pool prices for the quantitiessupplied.
11. Buyers will be required to pay into a designated Clearing House set up for the pool at thepool prices, which shall include the following
a. Pooled Commodity Prices
b. Marketing margins of sellers
c. Pool administration charges
12. The Clearing House will collect the amounts and thereafter distribute it to the variousentities as per agreed commodity costs and marketing margins
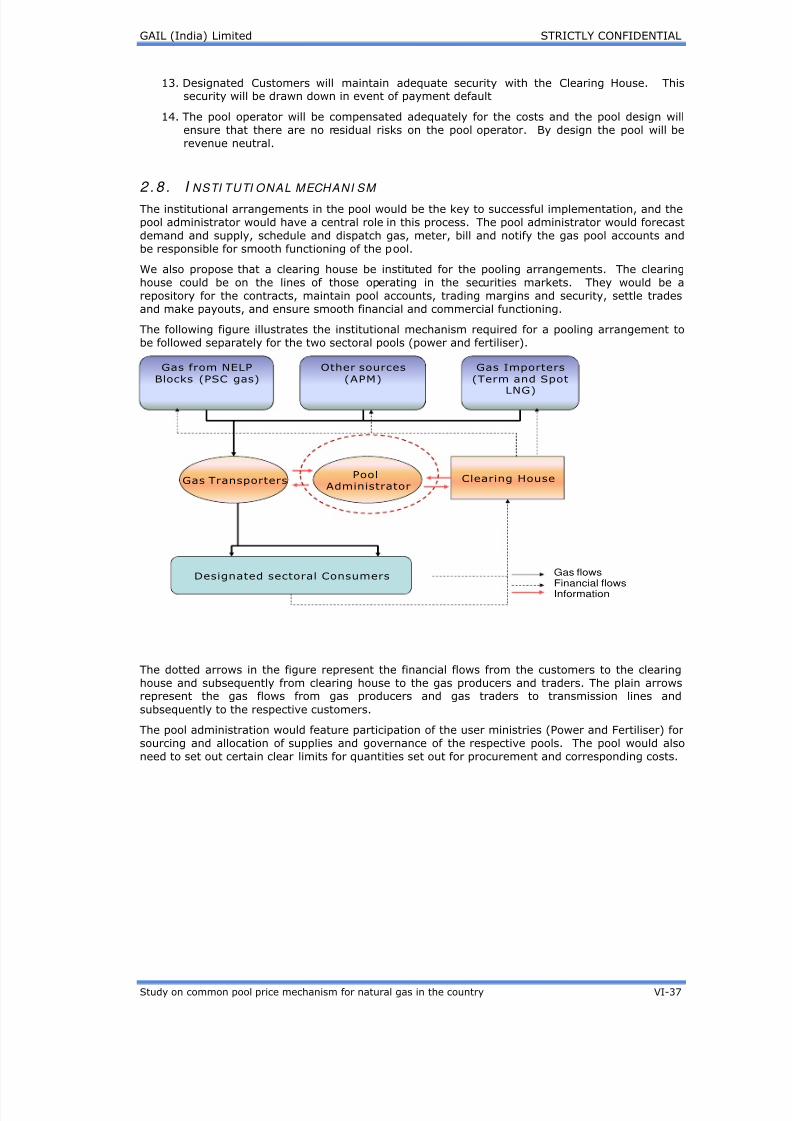
8/6/2019 Natural Gas _ India _2010(1)
http://slidepdf.com/reader/full/natural-gas-india-20101 38/65
GAIL (India) Limited STRICTLY CONFIDENTIAL
Study on common pool price mechanism for natural gas in the country VI-37
13. Designated Customers will maintain adequate security with the Clearing House. Thissecurity will be drawn down in event of payment default
14. The pool operator will be compensated adequately for the costs and the pool design willensure that there are no residual risks on the pool operator. By design the pool will berevenue neutral.
2 . 8 . I NSTI TUTI ONAL MECHANI SM The institutional arrangements in the pool would be the key to successful implementation, and thepool administrator would have a central role in this process. The pool administrator would forecastdemand and supply, schedule and dispatch gas, meter, bill and notify the gas pool accounts andbe responsible for smooth functioning of the pool.
We also propose that a clearing house be instituted for the pooling arrangements. The clearinghouse could be on the lines of those operating in the securities markets. They would be arepository for the contracts, maintain pool accounts, trading margins and security, settle tradesand make payouts, and ensure smooth financial and commercial functioning.
The following figure illustrates the institutional mechanism required for a pooling arrangement tobe followed separately for the two sectoral pools (power and fertiliser).
Gas Transporters PoolAdministrator
Clearing House
Gas from NELPBlocks (PSC gas)
Other sources(APM)
Gas Importers(Term and Spot
LNG)
Designated sectoral Consumers Gas flowsFinancial flowsInformation
The dotted arrows in the figure represent the financial flows from the customers to the clearinghouse and subsequently from clearing house to the gas producers and traders. The plain arrowsrepresent the gas flows from gas producers and gas traders to transmission lines andsubsequently to the respective customers.
The pool administration would feature participation of the user ministries (Power and Fertiliser) forsourcing and allocation of supplies and governance of the respective pools. The pool would alsoneed to set out certain clear limits for quantities set out for procurement and corresponding costs.
8/6/2019 Natural Gas _ India _2010(1)
http://slidepdf.com/reader/full/natural-gas-india-20101 39/65
8/6/2019 Natural Gas _ India _2010(1)
http://slidepdf.com/reader/full/natural-gas-india-20101 40/65
GAIL (India) Limited STRICTLY CONFIDENTIAL
Study on common pool price mechanism for natural gas in the country VII-39
Hub
“Notional Hub”
Gas is Exchange in a zone, a part of a gas network (e.g. national or regional gas
network
• Eligible gas for trading = Entry paid gas = gas that entered the zone
• Physical players: gas is imported/exported/sold to end consumers (which are
within the zone) to/from this zone by physical players
• Pure traders: pure traders never import/export gas to/from the zone.
Typically, the Hub operator does not actively put the parties into contact. Usually, trades areconcluded bilaterally between parties (Over-the-Counter). Such deals can be carried outdirectly between the parties, involved, but many deals are put together by brokers.Traditional voice brokers work over the phone, but many brokerages now run computertrading platforms that display prices over the internet.
In some case, screen trading is also offered on the Hub; in this case, the hub is called GasExchange. Parties put anonymous bid/offer on a screen and the transaction are
automatically concluded through the screen, the Hub Operator of being the “central counterparty”; this allows full anonymity.
Key features of a gas trading hub
A successful gas trading hub has two basic characteristics: first and foremost it must bepossible to easily move gas into and out of the market, whether the market is defined as asingle point or as a whole area (virtual hub); second, there must be a use for the gas, eitherthrough the existence of a significant customer base, or through the demand from othermarkets that can be reached from the traded hub.
An important requisite for a trading hub is the ability for market players to manage volumerisk (swings in consumer or export demand, compared to production or import supply) at acompetitive cost. For a gas marketer, volume risk can be mitigated either by the use of storage or by having a customer base of a size and mix that matches the supplycharacteristics; similarly, a gas consumer will manage his volume risk by purchasingflexibility services from his supplier, or by having access to storage himself. Most hubs inNorth America also have access to significant quantities of storage.
Another major element of trading hubs is the legal and financial framework of themarketplace. For existing markets a number of master trading agreements have developed,most noticeably the EFET (European Federation of Energy Traders) contract for physical gastrading, and various annexes to the ISDA (International Swaps and Derivatives Association)contract. These frameworks contain the basic legal text for most standard provisions,serving as a foundation on which contracts are negotiated.
We can thus summarise the minimum requirements for a successful new trading market as:
• Access to gas sources, and to customer base• Possibility of managing volume risk for all market participants at a competitive cost• Low barriers to entry for new players, known contractual setup and possible clearing
services, with low transaction costs• Managing price risk, through the market (existence of a forward/futures market)• Fairness and transparency, leading to confidence and liquidity.
8/6/2019 Natural Gas _ India _2010(1)
http://slidepdf.com/reader/full/natural-gas-india-20101 41/65
GAIL (India) Limited STRICTLY CONFIDENTIAL
Study on common pool price mechanism for natural gas in the country VII-40
In contrast to the situation in North America and the UK, gas markets in the rest of the EuropeanUnion (excluding the Netherlands), and in Japan and Korea have developed based on importedgas. These markets have been shaped by the wish of exporting countries to maximise the rentfrom gas exports as a compensation for the depletion of their finite resources. The EU depends for50% of its consumption on three large gas-exporting countries: Algeria, Norway and Russia.
The structure and concentration of gas supply to Continental Europe and to Japan and Korea, andtheir dependence on imports, makes these cases very different from North America and the UK. Inturn, this suggests that differences in market structure are not only a question of sector reform.
In China, like other energy prices, natural gas prices have been under government control. Topromote the use of natural gas use, the government has maintained a “cost-plus” based priceregime, keeping the prices at a relatively cheap level compared to international markets. This gaswas to a large extent possible due to China’s self-sufficiency in natural gas. However, given theprojected significant increase in LNG imports (which started in 2006), the price regime is nowbeing challenged.
2. NORTH AMERI CA
The North American (USA and Canada) natural gas transmission system is sufficientlyinterconnected that it operates virtually as a single system.
Liberalisation in the North American gas market started in 1979. A highly competitive market hasevolved along the whole value chain.
The US liberalisation, coming at a time of sharply rising energy prices as a result of the first oilshock, created an extended period of surplus in the US – the ‘gas bubble’, which lasted until themid 1990s. Continued growth in US demand beyond that point was increasingly supported byimports from Canada.
The North American market system features open trading in gas as a commodity and in pipelinecapacity to move the gas to market. The centrepiece of the pricing system is Henry Hub, a pipeline
junction in South Louisiana. This is the basis both of spot market trading and in futures trading onthe New York Mercantile Exchange (NYMEX). The trade press reports on prices at other hubs andtheir differences from Henry Hub are referred to as ‘basis differentials’.
2 . 1 . B RI EF DESCRI PTI ON OF THE N ORTH AMERI CAN GAS MARKET The North American market consumes annually 770 bcm compared to 540 bcm per year in IEAEurope. As a whole, North America is almost self-sufficient, but there is considerable tradebetween its component parts – overall, the US imports around 14% of total consumption fromCanada.
The pipeline infrastructure linking Canada and the US operates virtually as an interconnectedsystem. The interstate pipeline system in the US consists of about 340,000 kilometres of pipeline.The Canadian system operates 80,000 kilometres. These systems connect the major gas-producing basins with the principal US and Canadian market centres.
The natural gas industry in the US is made up almost entirely of private-sector companies. Thetransmission and distribution of gas have traditionally been treated as natural monopolies and areprovided by utility companies operating under various state and Federal regulatory jurisdictions.Production, except for a unique twenty-four year period from 1954 to 1978, has always beentreated as a competitive industry and has not been subject to utility rate regulation.
2 . 2 . T HE LI BERALI ZATI ON PROCESS Before the market was opened to competition, the gas delivery chain had a linear structure whichwas not dissimilar to the one which has evolved in Europe. E&P companies produced gas, sold it tointer-state pipeline companies, who in turn delivered it to the city gate and sold it to the LocalDistribution Company (LDC), who then sold it to the end-user.
There have been five major policy turning points in Federal regulation of natural gas in the UnitedStates. Two of these were initiated by Congress, one by a Supreme Court interpretation of anearlier law, and two by major policy initiatives undertaken by FERC. They were:
• The Natural Gas Act of 1938• The Supreme Court Phillips Decision – 1954• The Natural Gas Policy Act of 1978 (NGPA)
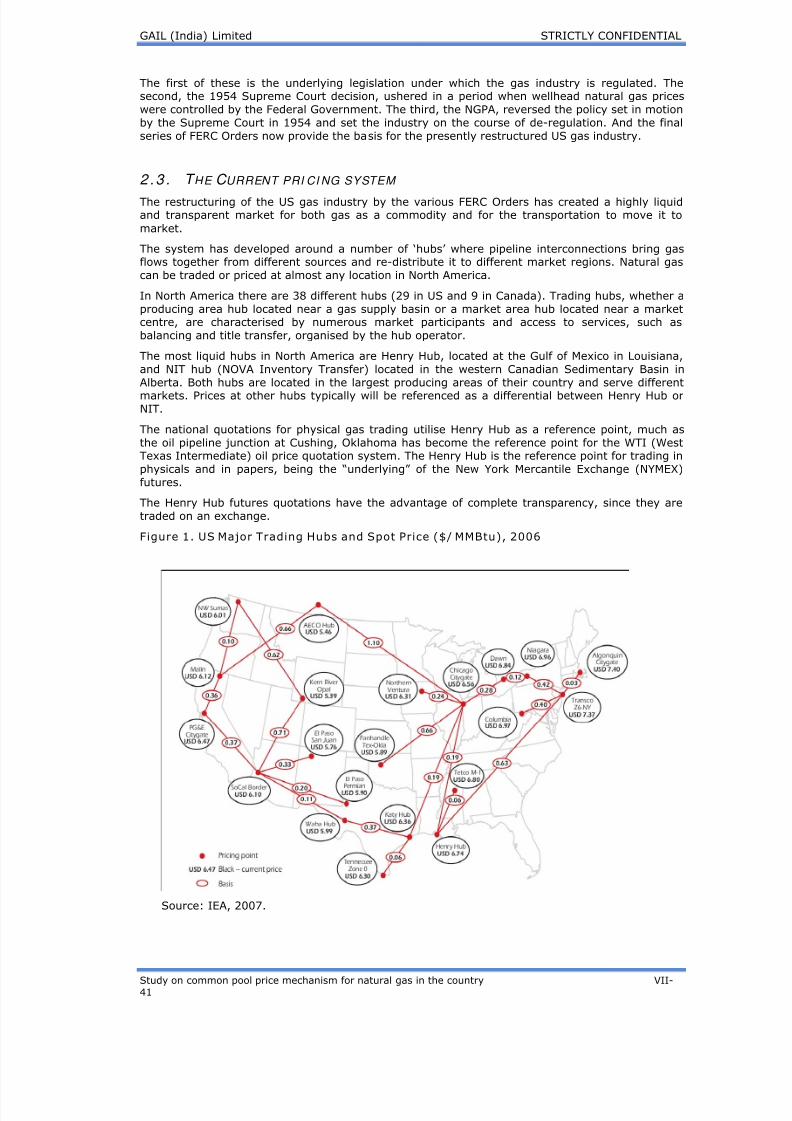
8/6/2019 Natural Gas _ India _2010(1)
http://slidepdf.com/reader/full/natural-gas-india-20101 42/65
GAIL (India) Limited STRICTLY CONFIDENTIAL
Study on common pool price mechanism for natural gas in the country VII-41
The first of these is the underlying legislation under which the gas industry is regulated. Thesecond, the 1954 Supreme Court decision, ushered in a period when wellhead natural gas priceswere controlled by the Federal Government. The third, the NGPA, reversed the policy set in motionby the Supreme Court in 1954 and set the industry on the course of de-regulation. And the finalseries of FERC Orders now provide the basis for the presently restructured US gas industry.
2 . 3 . T HE C URRENT PRI CI NG SYSTEM The restructuring of the US gas industry by the various FERC Orders has created a highly liquidand transparent market for both gas as a commodity and for the transportation to move it tomarket.
The system has developed around a number of ‘hubs’ where pipeline interconnections bring gasflows together from different sources and re-distribute it to different market regions. Natural gascan be traded or priced at almost any location in North America.
In North America there are 38 different hubs (29 in US and 9 in Canada). Trading hubs, whether aproducing area hub located near a gas supply basin or a market area hub located near a marketcentre, are characterised by numerous market participants and access to services, such asbalancing and title transfer, organised by the hub operator.
The most liquid hubs in North America are Henry Hub, located at the Gulf of Mexico in Louisiana,and NIT hub (NOVA Inventory Transfer) located in the western Canadian Sedimentary Basin inAlberta. Both hubs are located in the largest producing areas of their country and serve differentmarkets. Prices at other hubs typically will be referenced as a differential between Henry Hub orNIT.
The national quotations for physical gas trading utilise Henry Hub as a reference point, much asthe oil pipeline junction at Cushing, Oklahoma has become the reference point for the WTI (WestTexas Intermediate) oil price quotation system. The Henry Hub is the reference point for trading inphysicals and in papers, being the “underlying” of the New York Mercantile Exchange (NYMEX)futures.
The Henry Hub futures quotations have the advantage of complete transparency, since they aretraded on an exchange.
Figure 1. US Major Trading Hubs and Spot Price ($/ MMBtu), 2006
Source: IEA, 2007.
8/6/2019 Natural Gas _ India _2010(1)
http://slidepdf.com/reader/full/natural-gas-india-20101 43/65
GAIL (India) Limited STRICTLY CONFIDENTIAL
Study on common pool price mechanism for natural gas in the country VII-42
2 . 4 . T HE OPERATI ON OF THE SYSTEM In the North American market, both the commodity and transportation capacity are freely traded.Shippers will typically line up capacity for the next transportation month. This makes for a veryshort-term – and frequently volatile – market.
When investment in new capacity is required, project sponsors will usually hold an ‘open season’ for potential shippers who are prepared to assume the obligation to cover ‘demand charges’ thatare needed to recover the fixed charges on the investment. Thus the debt service on the
investment is protected, not in the form of a take-or-pay contract for combined transportation andcommodity, but in the form of a ‘ship-or-pay’ obligation.
2 . 5 . C URRENT PRI CE RELATI ONSHI PS As already mentioned, spot natural gas prices and individual month futures prices can be quitevolatile and are affected by seasonality, but participants in the market make use of derivatives tomanage price risk. The New York Mercantile Exchange (NYMEX) offers futures contracts for aseventy-two month period into the future, but the liquidity of the contract deteriorates rapidly forlonger-term contract settlement dates
Market basis differentials relate the price at other hubs to the price at Henry Hub. Figure 1compares the basis differentials for several market hubs – New York, Chicago and the Californiaborder. As is apparent, there is comparatively little variation between the Chicago price and HenryHub, suggesting a limited price driving force to attract Gulf Coast supply to the upper Midwest.
2 . 6 . U SEFUL I NSI GHTS FOR I NDI A ’ S GAS MARKET
Box - North American hubs: Henry Hub and NIT
The most liquid hubs in North America are Henry Hub, located at the Gulf of Mexico inLouisiana, and NIT hub (NOVA Inventory Transfer – NIT is often also referred to as Albertahub or AECO hub) located in the western Canadian Sedimentary Basin in Alberta. Both hubsare located in the largest producing areas of their country and serve different markets.Prices at other hubs typically will be referenced as a differential between Henry Hub or NIT.From Henry Hub, most gas flows to eastern markets and gas from NIT is either used inwestern Canada or exported to the US. The following elements have made these hubs asuccess:
• Connected to many large pipelines serving different markets (Henry Hub: 14 and NIThub: 6)
• Large volume of gas flows (Gulf of Mexico: 20% of US production, western CanadianSedimentary Basin: 80% of Canadian production). Henry Hub is also connected to thecountry's largest grouping of LNG regasification terminals
• Connected to high deliverability storage facilities• Prices and other relevant information available. Delivery point of exchanges (Henry Hub:
Nymex, NIT: NGX)• Many different types of buyers and sellers• Large daily volume of transactions
I - Co n c l u s i o n s a n d U s ef u l i n s i g h t s f o r I n d i a ’s g a s s ec t o r .
The restructuring of the US gas industry by the various FERC Orders has created a highlyliquid and transparent market for both gas as a commodity and for the transportation tomove it to market. Both the commodity and transportation capacity are freely traded. Thenational quotations for physical gas trading utilise Henry Hub as a reference point. Not onlyis Henry Hub the reference point for trading in physicals, but it has become the focus for theHenry Hub futures market trading on the New York Mercantile Exchange (NYMEX).
8/6/2019 Natural Gas _ India _2010(1)
http://slidepdf.com/reader/full/natural-gas-india-20101 44/65
GAIL (India) Limited STRICTLY CONFIDENTIAL
Study on common pool price mechanism for natural gas in the country VII-43
3. THE UNITED KIN GDOM
3 . 1 . B RI EF DESCRI PTI ON OF THE UK GAS MARKET
The UK now has one of the most price-competitive gas industries in the world. Its transition from agovernment gas monopoly in 1986 to the liquid and competitive market today is a product of fortunate conditions and major policy initiatives.
The fortunate conditions were: on the supply side - reliance on domestic gas with an emergingsurplus of low-cost gas from the Central North Sea that provided ample supply competition fromtraditional contracted supply, and, on the demand side – the need to expand the UK power sectorin an environmentally friendly way by using gas-fired power plants in a restructured electricitymarket.
3 . 2 . T HE LI BERALI SATI ON PROCESS
The key policy moves that led to the full liberalization of the UK gas market included:
• Privatising British Gas, the monopoly company• Creating a regulatory body, Ofgas (later Ofgem) to oversee competition• Restricting British Gas to 90% of the supply from new fields, thereby creating supplies for
competitive sellers• Requiring third-party access on the transition system to permit competitive suppliers to
gain access to customers• Requiring that British Gas free its customers of any obligation to purchase, thereby
creating new buyers for competitive producers. This move was accomplished in a series of steps.
The original British Gas has now devolved into three separate corporate activities:
BG – formerly the parent company, now a major international gas company that is especiallyactive in LNG; Centrica – the former marketing arm, now a successful independent gas marketer;TransCo – the former transmission company that manages the gas transportation operations and
has been acquired by the National Grid, the major UK electricity transmission system.These moves created substantial financial problems for Centrica, since it was still obligated ontake-or-pay contracts for volumes of gas for which it no longer had sufficient customers. Thesefinancial problems were resolved by negotiations with the producers. However, the larger part of supplies landed at the beach of the UK under long-term contracts, part of it self-contracting andmainly linked to the newly developed price on the UK National Balancing Point (virtual hub)
The construction of the Interconnector, a pipeline linking Bacton in the UK with Zeebrugge inBelgium, initially served as an instrument for exports of UK gas to the Continent, under long-termcontracts, although – compared to the prevailing model for gas imports to Continental Europe –the UK export contracts were for smaller volumes (each in the order of a few Bcm/year at most)and with a shorter term of 10-15 years. The Interconnector also created a basis for priceinteraction with the Continent by arbitrage, between a system characterised by short-term pricing
The physical spot market in North America is highly volatile, but participants in the marketmake use of derivatives to manage price risk.
The North American model, based on gas-to-gas competition and trading at hubs andbetween hubs, may serve as a useful reference for countries envisaging the introduction of an higher level of competition in their gas markets. Trading contracts and tradedinstruments evolved in the North America market, as well as a number of market-basedsolutions developed to address allocation and investment issues, deserve a careful study byenergy policy makers and regulators. However, the sharp contrast between the structuralconditions and the degree of development between the US and the Indian gas markets,make it hardly possible to borrow solutions and/or pricing mechanisms from the former forthe latter.
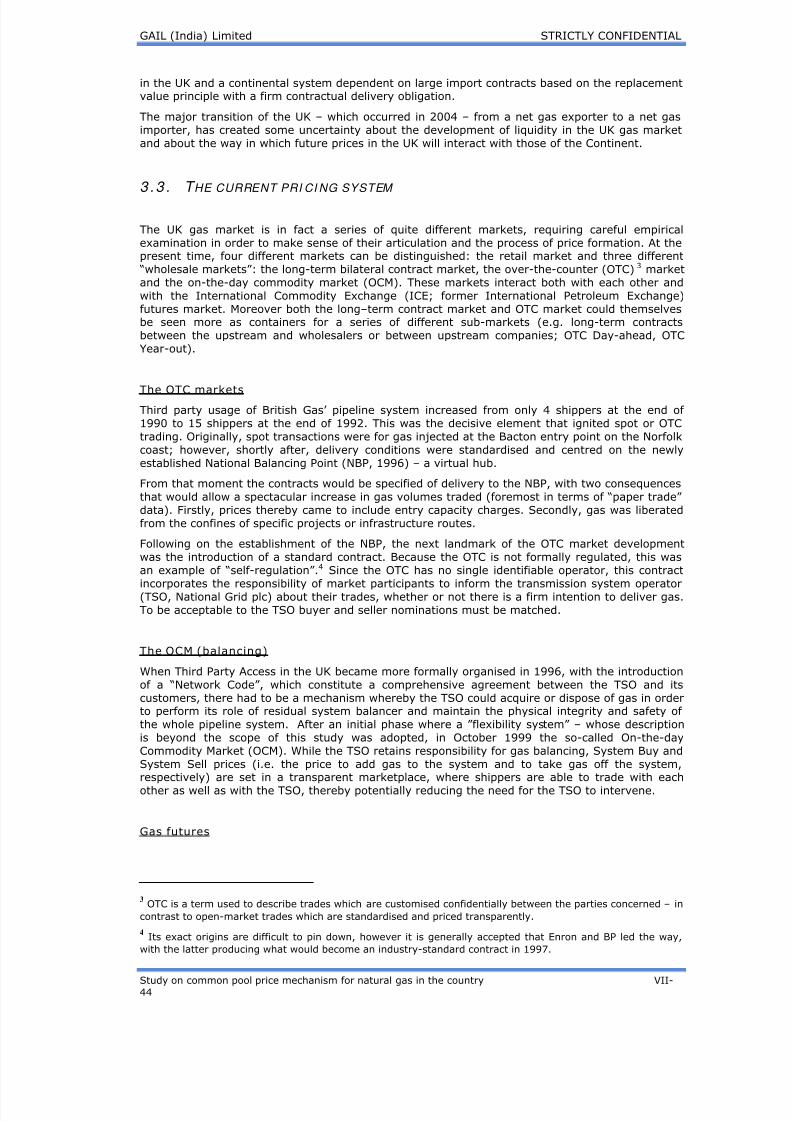
8/6/2019 Natural Gas _ India _2010(1)
http://slidepdf.com/reader/full/natural-gas-india-20101 45/65
GAIL (India) Limited STRICTLY CONFIDENTIAL
Study on common pool price mechanism for natural gas in the country VII-44
in the UK and a continental system dependent on large import contracts based on the replacementvalue principle with a firm contractual delivery obligation.
The major transition of the UK – which occurred in 2004 – from a net gas exporter to a net gasimporter, has created some uncertainty about the development of liquidity in the UK gas marketand about the way in which future prices in the UK will interact with those of the Continent.
3 . 3 . T HE CURRENT PRI CI NG SYSTEM
The UK gas market is in fact a series of quite different markets, requiring careful empiricalexamination in order to make sense of their articulation and the process of price formation. At thepresent time, four different markets can be distinguished: the retail market and three different
“wholesale markets”: the long-term bilateral contract market, the over-the-counter (OTC) 3 marketand the on-the-day commodity market (OCM). These markets interact both with each other andwith the International Commodity Exchange (ICE; former International Petroleum Exchange)futures market. Moreover both the long–term contract market and OTC market could themselvesbe seen more as containers for a series of different sub-markets (e.g. long-term contractsbetween the upstream and wholesalers or between upstream companies; OTC Day-ahead, OTCYear-out).
The OTC marketsThird party usage of British Gas’ pipeline system increased from only 4 shippers at the end of 1990 to 15 shippers at the end of 1992. This was the decisive element that ignited spot or OTCtrading. Originally, spot transactions were for gas injected at the Bacton entry point on the Norfolkcoast; however, shortly after, delivery conditions were standardised and centred on the newlyestablished National Balancing Point (NBP, 1996) – a virtual hub.
From that moment the contracts would be specified of delivery to the NBP, with two consequencesthat would allow a spectacular increase in gas volumes traded (foremost in terms of “paper trade” data). Firstly, prices thereby came to include entry capacity charges. Secondly, gas was liberatedfrom the confines of specific projects or infrastructure routes.
Following on the establishment of the NBP, the next landmark of the OTC market developmentwas the introduction of a standard contract. Because the OTC is not formally regulated, this wasan example of “self-regulation”. 4 Since the OTC has no single identifiable operator, this contract
incorporates the responsibility of market participants to inform the transmission system operator(TSO, National Grid plc) about their trades, whether or not there is a firm intention to deliver gas.To be acceptable to the TSO buyer and seller nominations must be matched.
The OCM (balancing)
When Third Party Access in the UK became more formally organised in 1996, with the introductionof a “Network Code”, which constitute a comprehensive agreement between the TSO and itscustomers, there had to be a mechanism whereby the TSO could acquire or dispose of gas in orderto perform its role of residual system balancer and maintain the physical integrity and safety of the whole pipeline system. After an initial phase where a ”flexibility system” – whose descriptionis beyond the scope of this study was adopted, in October 1999 the so-called On-the-dayCommodity Market (OCM). While the TSO retains responsibility for gas balancing, System Buy andSystem Sell prices (i.e. the price to add gas to the system and to take gas off the system,respectively) are set in a transparent marketplace, where shippers are able to trade with eachother as well as with the TSO, thereby potentially reducing the need for the TSO to intervene.
Gas futures
3OTC is a term used to describe trades which are customised confidentially between the parties concerned – in
contrast to open-market trades which are standardised and priced transparently.4
Its exact origins are difficult to pin down, however it is generally accepted that Enron and BP led the way,with the latter producing what would become an industry-standard contract in 1997.
8/6/2019 Natural Gas _ India _2010(1)
http://slidepdf.com/reader/full/natural-gas-india-20101 46/65
GAIL (India) Limited STRICTLY CONFIDENTIAL
Study on common pool price mechanism for natural gas in the country VII-45
A market in natural gas futures was established by the UK’s International Commodity Exchange(former IPE) in 1997. The market operator is the ICE but the London Clearing House (LCH) acts ascounterparty for all trades, thereby guaranteeing the financial performance of every contract up toclosure or delivery. Five standard gas futures contracts are traded: Season (6 consecutive monthsin summer and winter), Quarter, Month, Balance of month (the number of days remaining in thecurrent month), and Day.
End-user market
The description of the UK’s marketplaces is worthy to mention the retail market, which occupiesthe endpoint in the gas chain and does not present peculiar features with respect to traditional gasretail market, except for relatively high degrees of competition and switching.
3 . 4 . T HE OPERATI ON OF THE SYSTEM : THE WHOLESALE MARKETS BROUGHT TOGETHER
The Figure 2 provides a representation of how the sizes of the NBP/OTC, OCM. ICE and beachcontract markets look in relation to each other, and how the scale of paper trades looks in relationto physical trades. Particularly, deliveries to NBP are now greater than those represented by beachcontracts and NBP trades for physical deliveries are less than 10% of the total trades (reflectingthe “churn ratio”). ICE trades only cover about half throughput, while OCM balancing trades aredwarfed by “within-day” trading on the OTC. Centrica is responsible for nearly a quarter of throughput.
Figure 2. UK Market Structure (volum es data 2006)
3 . 5 . U SEFUL I NSI GHTS FOR I NDI A ’ S GAS SECTOR
I I – Co n c l u s i o n s a n d U s e f u l i n s i g h t s f o r I n d i a ’s g a s s e ct o r .
The UK negotiated the transition from government monopoly control of its gas industry to aliquid commodity market. The UK spot gas market is now one of the most liquid markets inthe world and is the most liquid in Europe, with roughly 70 active players. However, pricesstill largely follow the trend of competing fuels (clearing price coal / heavy fuel oil in
IPE Futures
578 TWh
Total NBP
Trades
6.248 TWhWithin-Day
Trades
651 TWhPhysical
591 TWh
Total throughput:1.060 TWh
(Centrica 257 TWh)
OCM
104 TWh
Customers
BEACH
CONTRACTS
468 TWh
8/6/2019 Natural Gas _ India _2010(1)
http://slidepdf.com/reader/full/natural-gas-india-20101 47/65
GAIL (India) Limited STRICTLY CONFIDENTIAL
Study on common pool price mechanism for natural gas in the country VII-46
4. CONTIN ENTAL EUROPE
The development of the gas industry in Continental West Europe has been characterised byimports from super-giant fields, starting with the development of the Groningen field.
In order to maximise the rent income from the Groningen field for the Dutch state, the Dutchgovernment, together with Exxon and Shell, developed the concept of replacement, or marketvalue pricing (which was also applied domestically), and the concept of long-term contracts with aminimum pay based on a netback / replacement value pricing, with regular review possibilities toadjust pricing to the originally sought balance.
The concept of long-term contracts aimed at maximising the rent income of the exporting state,while keeping the gas marketable, or in other words the seller (the exporting country) was takingrisks and chances of price development via the replacement value pricing concept, while the buyerwas taking the obligation to market a defined volume via the minimum take-or-pay obligationagainst earning a satisfactory margin.
The Dutch export contracts served as a point of reference for most gas export contracts toContinental Europe which followed over the next four decades.
Changes in market conditions were reflected in the new contracts concluded and by regular pricereviews for existing contracts. Adaptations to changed circumstances happened by modifying theoriginal (very large) long-term contracts by changing the price formula to reflect the developmentin the competitive situation of gas, mainly by increasing the share of gas oil, but also by includingelements to reflect the changed role of gas in power generation and later the role of gas-to-gascompetition. As a result the currently applied price formulas for imported gas follow similar
patterns, as was shown by the report of the Energy Sector Inquiry by the European Commission’sDG COMP, published in January 2007.
While EU gas market reforms changed the regulatory framework since the end of the 1990s, long-term import contracts persisted as the dominant import arrangement, now complemented bysome imports, on a short-term basis from the UK and by some spot LNG mainly to Belgium.Except for the adaptation of the pricing formula to new competitive situations, new import projectskept with the principles of long-term contracts, with some modifications as to the size of volumes,term and more flexibility regarding the delivery point.
4 . 1 . B RI EF DESCRI PTI ON OF THE EUROPEAN CONTI NENTAL GAS MARKETS Natural gas consumption in EU member states was around 445 mtoe in 2008 and is expected toincrease to about 625 mtoe in 2030, which is an increase of 43%. The share of natural gas in the
European primary energy demand will rise from 23,9% in 2005 to 29.9% in 2030 (18% in 1990).At 60% of the total demand increase, most of the growth will come from power generation.
In the residential and commercial sector, gas consumption has steadily increased in line with theexpansion of the infrastructure and the associated rise in the number of gas users. Over the last15 years, gas consumption has seen a 2.8% growth p.a. to 175 mtoe. Gas currently holds amarket share of approx. 35 %, which makes it the market leader in this sector.
Gas currently accounts for 33 % of industrial final energy consumption (excluding industrial powerstations) and is thus a major source of energy in this market, too.
The development of the modern natural gas industry in the Western parts of Europe started withthe discovery of the Groningen field in 1959. Further drilling proved it to be a super-giant field. Itwas clear that its gas could not solely be consumed in the Netherlands, but that, in order tovalorise the gas reserves of the field, part of its production had to be exported. Groningen gas was
summer and gas oil / liquids in winter) and after the surplus gas supply disappears pricesrise substantially.
As in the case of the North American market, the complexities of the UK’s wholesale marketdo not seem to provide pricing mechanisms that can be feasibly transposed to the Indiangas market.
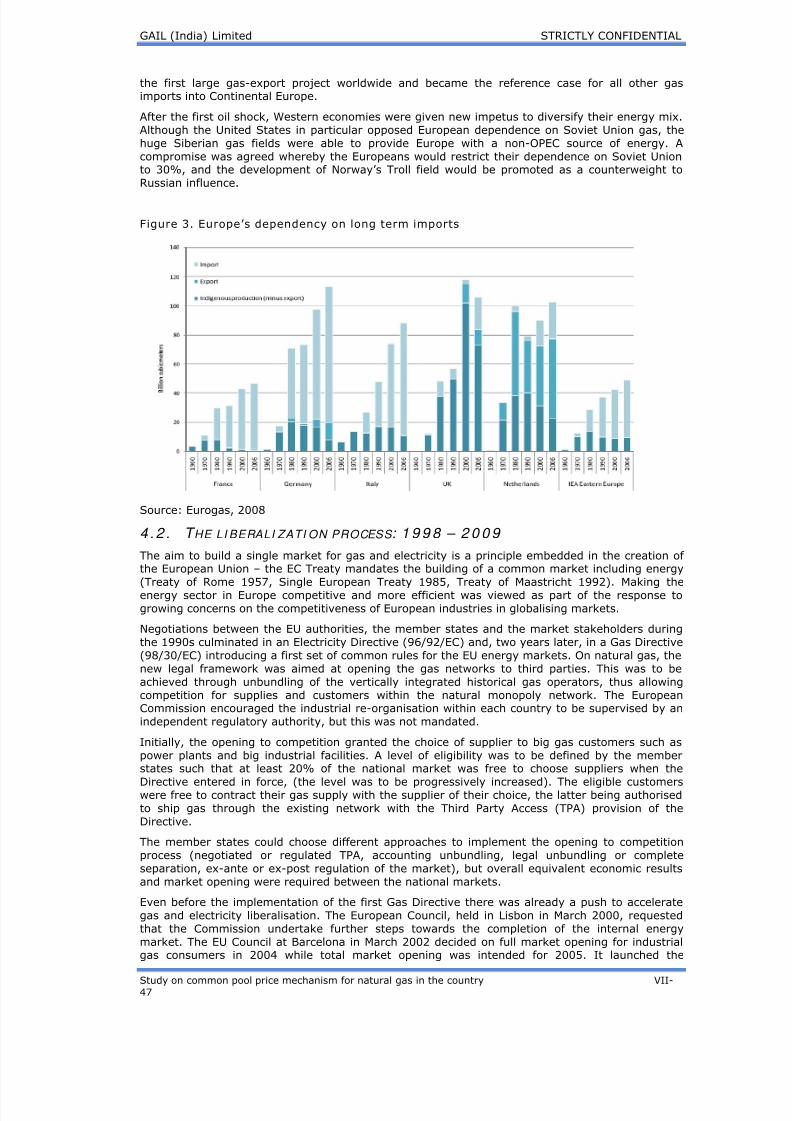
8/6/2019 Natural Gas _ India _2010(1)
http://slidepdf.com/reader/full/natural-gas-india-20101 48/65

8/6/2019 Natural Gas _ India _2010(1)
http://slidepdf.com/reader/full/natural-gas-india-20101 49/65
GAIL (India) Limited STRICTLY CONFIDENTIAL
Study on common pool price mechanism for natural gas in the country VII-48
preparation of a new legislation to implement these decisions. A year later, the second GasDirective was adopted (2003/55/EC). Concomitant to a second Electricity Directive (2003/54/EC),the new EU gas law mandated regulated TPA as the basic rule (for all existing infrastructure) aswell as moving the level of unbundling of TSOs to the level of legal separation (e.g. regulatedactivities under the responsibility of separate entities). The role of independent regulators was alsoreinforced.
The 6th benchmarking report was issued in January 2007 and provided a general overview of thefuture energy policy of the EU. It envisaged a “third package” of legislative proposals for the
European gas and electricity markets. The rationale of this third package is the integration of theenergy and the environment objectives of the EU through the use of market based environmentaland other measures.
The EU Commission proposed ambitious and far-ranging measures such as complete de-integration of the gas operators through ownership unbundling and further institutions to back-upthe creation of an integrated EU gas market (European regulatory agency).
Third Energy Package .
On April 22, 2009, the “Third Energy Package”, consisting of 2 Directives and 3 Regulations onelectricity and gas, has received final approval (2nd reading) from the European Parliament,according to the compromise agreed with the Council Presidency. The package was approved bythe European Council in June 2009.
The revised package details rules for unbundling and the responsibilities of the new EuropeanAgency for the Cooperation of Energy Regulators (ACER) and the new European Network forTransmission System Operators (ENTSO) for both gas and power. The shape of the Europeanenergy industry in the coming years will be heavily influenced by the interaction of these newbodies with national regulators and the European Commission.
• Unbundling: the package leaves three unbundling options on the table, with member states ableto choose their preferred form of separation of transmission and supply: ownership unbundling,independent system operator (ISO), and ITO—for both gas and power. According to the lTOmodel, the “third way”, generation/supply companies may still own and control transmissionoperators, although separate companies under common ownership must be set up to hold andoperate the assets.
• ACER: the package creates a new Europe-wide coordinating and advisory body made up of national regulators with powers over cross-border transmission
• ENTSO: the new Europe-wide group of transmission operators for gas and power will haveresponsibility for developing and implementing network codes for cross-border transmission withina framework set down by the Commission and ACER.
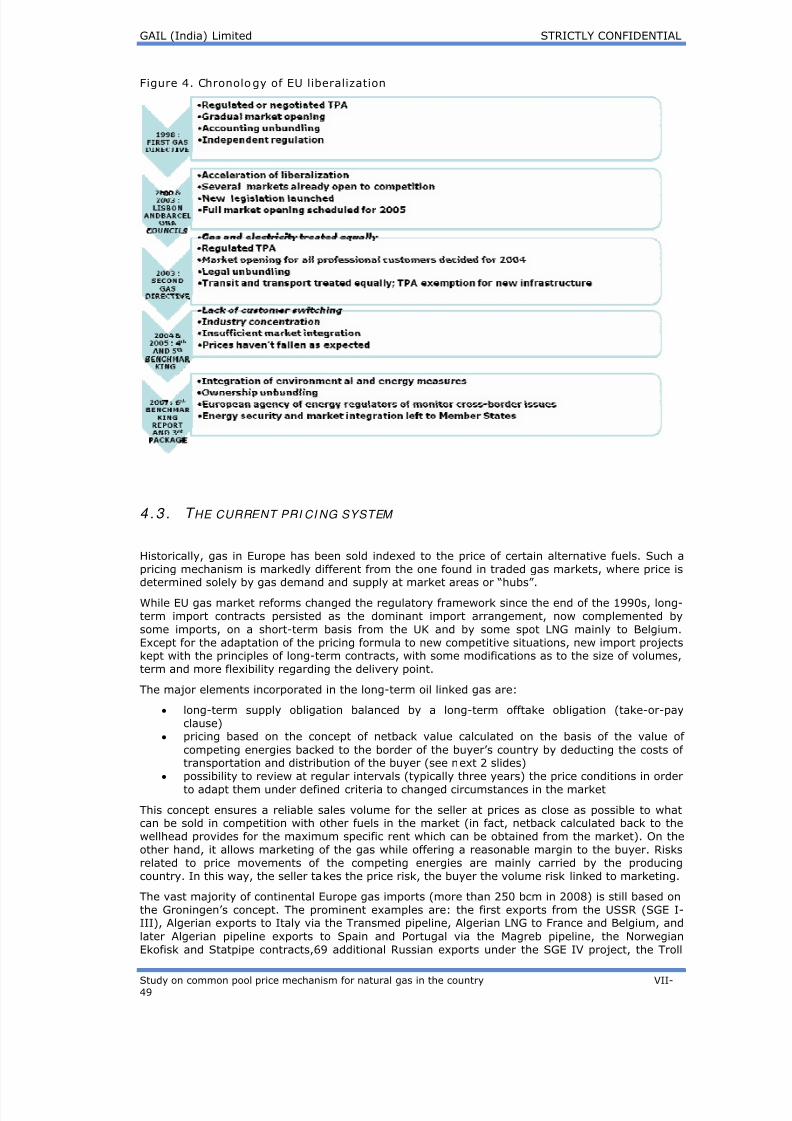
8/6/2019 Natural Gas _ India _2010(1)
http://slidepdf.com/reader/full/natural-gas-india-20101 50/65
GAIL (India) Limited STRICTLY CONFIDENTIAL
Study on common pool price mechanism for natural gas in the country VII-49
Figure 4. Chronolo gy of EU liberalization
4 . 3 . T HE CURRENT PRI CI NG SYSTEM
Historically, gas in Europe has been sold indexed to the price of certain alternative fuels. Such apricing mechanism is markedly different from the one found in traded gas markets, where price isdetermined solely by gas demand and supply at market areas or “hubs”.
While EU gas market reforms changed the regulatory framework since the end of the 1990s, long-term import contracts persisted as the dominant import arrangement, now complemented bysome imports, on a short-term basis from the UK and by some spot LNG mainly to Belgium.Except for the adaptation of the pricing formula to new competitive situations, new import projectskept with the principles of long-term contracts, with some modifications as to the size of volumes,term and more flexibility regarding the delivery point.
The major elements incorporated in the long-term oil linked gas are:
• long-term supply obligation balanced by a long-term offtake obligation (take-or-payclause)
• pricing based on the concept of netback value calculated on the basis of the value of competing energies backed to the border of the buyer’s country by deducting the costs of transportation and distribution of the buyer (see next 2 slides)
• possibility to review at regular intervals (typically three years) the price conditions in orderto adapt them under defined criteria to changed circumstances in the market
This concept ensures a reliable sales volume for the seller at prices as close as possible to whatcan be sold in competition with other fuels in the market (in fact, netback calculated back to thewellhead provides for the maximum specific rent which can be obtained from the market). On theother hand, it allows marketing of the gas while offering a reasonable margin to the buyer. Risksrelated to price movements of the competing energies are mainly carried by the producingcountry. In this way, the seller takes the price risk, the buyer the volume risk linked to marketing.
The vast majority of continental Europe gas imports (more than 250 bcm in 2008) is still based onthe Groningen’s concept. The prominent examples are: the first exports from the USSR (SGE I-III), Algerian exports to Italy via the Transmed pipeline, Algerian LNG to France and Belgium, andlater Algerian pipeline exports to Spain and Portugal via the Magreb pipeline, the NorwegianEkofisk and Statpipe contracts,69 additional Russian exports under the SGE IV project, the Troll
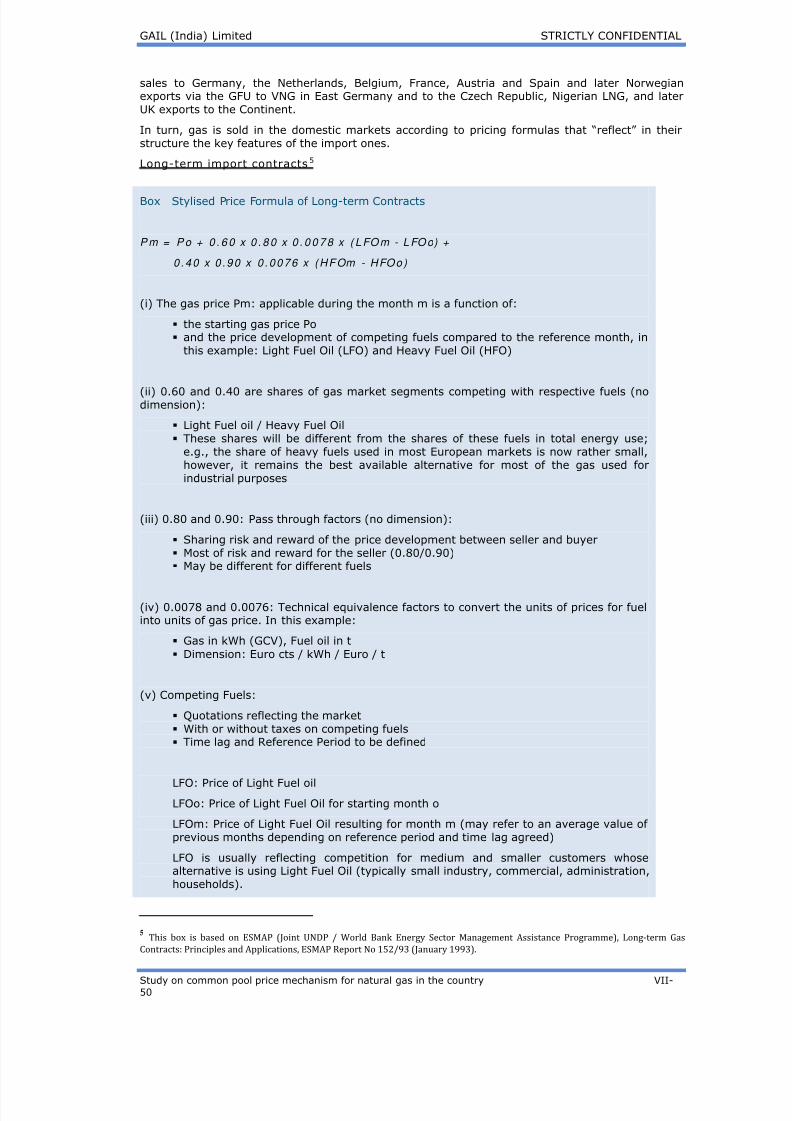
8/6/2019 Natural Gas _ India _2010(1)
http://slidepdf.com/reader/full/natural-gas-india-20101 51/65
GAIL (India) Limited STRICTLY CONFIDENTIAL
Study on common pool price mechanism for natural gas in the country VII-50
sales to Germany, the Netherlands, Belgium, France, Austria and Spain and later Norwegianexports via the GFU to VNG in East Germany and to the Czech Republic, Nigerian LNG, and laterUK exports to the Continent.
In turn, gas is sold in the domestic markets according to pricing formulas that “reflect” in theirstructure the key features of the import ones.
Long-term import contracts 5
5 This box is based on ESMAP (Joint UNDP / World Bank Energy Sector Management Assistance Programme), Long‐term Gas
Contracts: Principles and Applications, ESMAP Report No 152/93 (January 1993).
Box Stylised Price Formula of Long-term Contracts
P m = P o + 0 . 6 0 x 0 . 8 0 x 0 . 0 0 7 8 x ( L FO m - L FO o) +
0 . 4 0 x 0 . 9 0 x 0 . 0 0 7 6 x ( H F Om - H FO o )
(i) The gas price Pm: applicable during the month m is a function of:
the starting gas price Po and the price development of competing fuels compared to the reference month, in
this example: Light Fuel Oil (LFO) and Heavy Fuel Oil (HFO)
(ii) 0.60 and 0.40 are shares of gas market segments competing with respective fuels (nodimension):
Light Fuel oil / Heavy Fuel Oil These shares will be different from the shares of these fuels in total energy use;
e.g., the share of heavy fuels used in most European markets is now rather small,however, it remains the best available alternative for most of the gas used forindustrial purposes
(iii) 0.80 and 0.90: Pass through factors (no dimension):
Sharing risk and reward of the price development between seller and buyer Most of risk and reward for the seller (0.80/0.90) May be different for different fuels
(iv) 0.0078 and 0.0076: Technical equivalence factors to convert the units of prices for fuelinto units of gas price. In this example:
Gas in kWh (GCV), Fuel oil in t Dimension: Euro cts / kWh / Euro / t
(v) Competing Fuels:
Quotations reflecting the market With or without taxes on competing fuels Time lag and Reference Period to be defined
LFO: Price of Light Fuel oilLFOo: Price of Light Fuel Oil for starting month o
LFOm: Price of Light Fuel Oil resulting for month m (may refer to an average value of previous months depending on reference period and time lag agreed)
LFO is usually reflecting competition for medium and smaller customers whosealternative is using Light Fuel Oil (typically small industry, commercial, administration,households).
8/6/2019 Natural Gas _ India _2010(1)
http://slidepdf.com/reader/full/natural-gas-india-20101 52/65
GAIL (India) Limited STRICTLY CONFIDENTIAL
Study on common pool price mechanism for natural gas in the country VII-51
It has to be noticed that the concept of replacement value, combined for export contracts with theconcept of a netback price, results in different netback values at the exporting country’s border fordifferent customers. In addition, different transportation costs to different customers imply
different netback values earned by the exporter at its border, even if the replacement value at theborder of the customers would be the same.
A special king of “pooling price mechanism”
Historically, key features of long-term import contracts (e.g. basket indexation, elasticity toenergy price changes) have been largely “mirrored” in the domestic wholesale and retail supplycontracts. This means that the (dominant) national suppliers, while defining the overall structureof their selling portfolio, have usually designed a range of selling price formulas that, on average,reproduce the indexation and the cost level of their buying portfolio. In this way a number of keyresults are achieved, in particular: 1) the national supplier hedges its overall portfolio (i.e. its pricerisk exposure is largely reduced; 2) this sort of pooling price mechanism allows to have a gas pricesubstantially uniform, by consumer category, across the country (i.e. not directly linked to the costof any specific long-term supply contract of the supplier or its direct production).
After the liberalisation, the new entrants have largely adopted this conventional rule, often takingas a reference the price formulas of the incumbent and offering discounts on them.
The logic of this pricing system is illustrated by Figure 5.
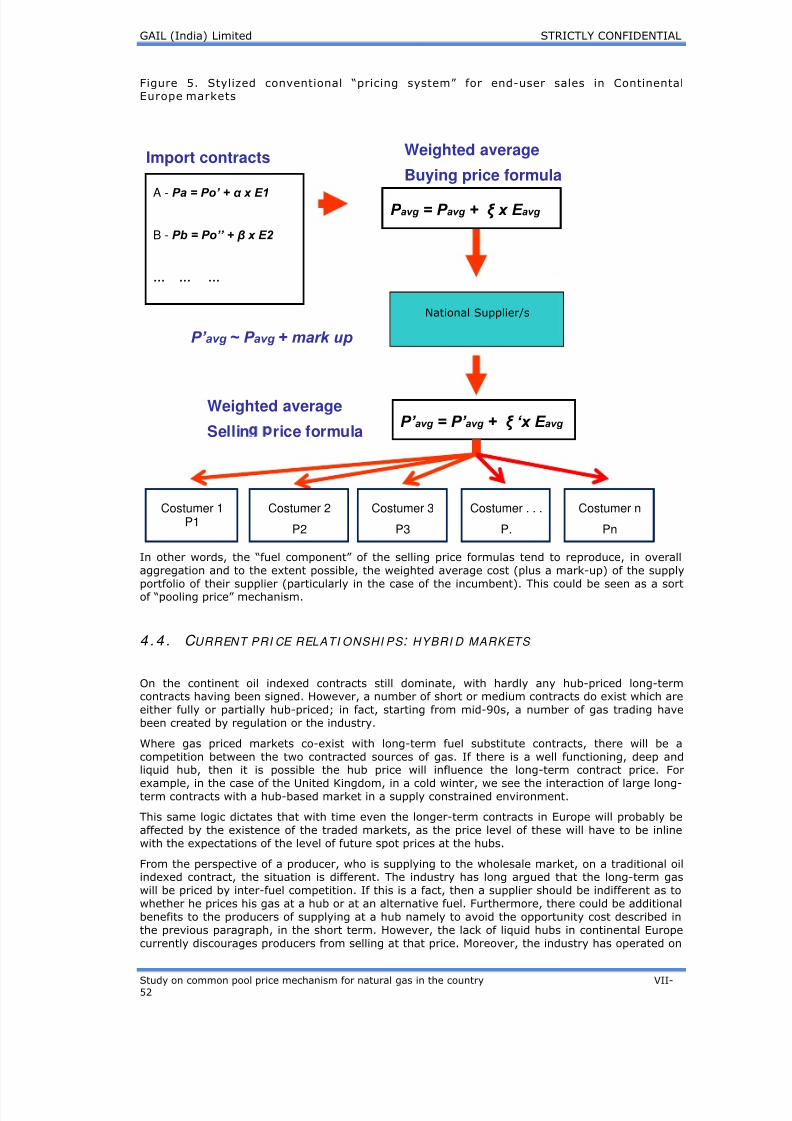
8/6/2019 Natural Gas _ India _2010(1)
http://slidepdf.com/reader/full/natural-gas-india-20101 53/65
GAIL (India) Limited STRICTLY CONFIDENTIAL
Study on common pool price mechanism for natural gas in the country VII-52
Figure 5. Stylized conventional “pricing system” for end-user sales in ContinentalEurope markets
In other words, the “fuel component” of the selling price formulas tend to reproduce, in overallaggregation and to the extent possible, the weighted average cost (plus a mark-up) of the supply
portfolio of their supplier (particularly in the case of the incumbent). This could be seen as a sortof “pooling price” mechanism.
4 . 4 . C URRENT PRI CE RELATI ONSHI PS : HYBRI D MARKETS
On the continent oil indexed contracts still dominate, with hardly any hub-priced long-termcontracts having been signed. However, a number of short or medium contracts do exist which areeither fully or partially hub-priced; in fact, starting from mid-90s, a number of gas trading havebeen created by regulation or the industry.
Where gas priced markets co-exist with long-term fuel substitute contracts, there will be acompetition between the two contracted sources of gas. If there is a well functioning, deep andliquid hub, then it is possible the hub price will influence the long-term contract price. For
example, in the case of the United Kingdom, in a cold winter, we see the interaction of large long-term contracts with a hub-based market in a supply constrained environment.
This same logic dictates that with time even the longer-term contracts in Europe will probably beaffected by the existence of the traded markets, as the price level of these will have to be inlinewith the expectations of the level of future spot prices at the hubs.
From the perspective of a producer, who is supplying to the wholesale market, on a traditional oilindexed contract, the situation is different. The industry has long argued that the long-term gaswill be priced by inter-fuel competition. If this is a fact, then a supplier should be indifferent as towhether he prices his gas at a hub or at an alternative fuel. Furthermore, there could be additionalbenefits to the producers of supplying at a hub namely to avoid the opportunity cost described inthe previous paragraph, in the short term. However, the lack of liquid hubs in continental Europecurrently discourages producers from selling at that price. Moreover, the industry has operated on
Import contracts
A - Pa = Po’ + α x E1
B - Pb = Po’’ + β x E2
… … …
Weighted average
Buying price formula
P’ avg = P’ avg + ξ ‘x E avg Weighted average
Sellin rice formula
P’ avg ~ P avg + mark up
Costumer 2
P2
Costumer 3
P3
Costumer . . .
P.
Costumer n
Pn
Costumer 1P1
P avg = P avg + ξ x E avg
National Supplier/s
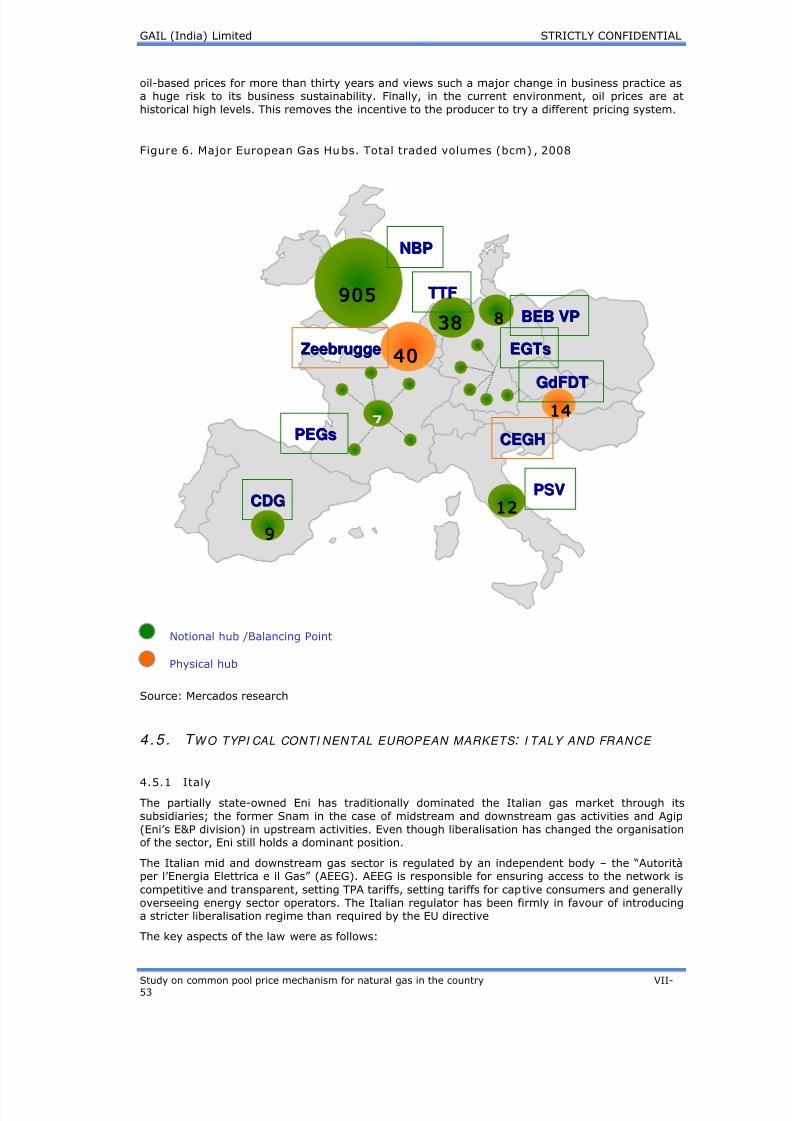
8/6/2019 Natural Gas _ India _2010(1)
http://slidepdf.com/reader/full/natural-gas-india-20101 54/65
GAIL (India) Limited STRICTLY CONFIDENTIAL
Study on common pool price mechanism for natural gas in the country VII-53
oil-based prices for more than thirty years and views such a major change in business practice asa huge risk to its business sustainability. Finally, in the current environment, oil prices are athistorical high levels. This removes the incentive to the producer to try a different pricing system.
Figure 6. Major European Gas Hu bs. Total traded volumes (bcm) , 2008
Source: Mercados research
4 . 5 . T W O TYPI CAL CONTI NENTAL EUROPEAN MARKETS : I TALY AND FRANCE
4.5.1 ItalyThe partially state-owned Eni has traditionally dominated the Italian gas market through itssubsidiaries; the former Snam in the case of midstream and downstream gas activities and Agip(Eni’s E&P division) in upstream activities. Even though liberalisation has changed the organisationof the sector, Eni still holds a dominant position.
The Italian mid and downstream gas sector is regulated by an independent body – the “Autoritàper l’Energia Elettrica e il Gas” (AEEG). AEEG is responsible for ensuring access to the network iscompetitive and transparent, setting TPA tariffs, setting tariffs for captive consumers and generallyoverseeing energy sector operators. The Italian regulator has been firmly in favour of introducinga stricter liberalisation regime than required by the EU directive
The key aspects of the law were as follows:
99 00 55 33 88
11 44
44 00
11 22
88
NNBB PP
ZZee ee bb rruu gg gg ee
CCDDGG
BB EEBB VVPP
EE GGTTss
CC EEGGHH
PP SS VV
99
TTTTFF
PP EEGG ss
GG dd FFDDTT
Physical hub
Notional hub /Balancing Point
8/6/2019 Natural Gas _ India _2010(1)
http://slidepdf.com/reader/full/natural-gas-india-20101 55/65
GAIL (India) Limited STRICTLY CONFIDENTIAL
Study on common pool price mechanism for natural gas in the country VII-54
• Regulated TPA system for both pipelines and storage;• Transportation and storage activities were unbundled into separate companies by January 2002;• Since January 2003, all consumers have been free to choose supplier;• A limit has been placed on the volume of gas any one company may produce and import: 61% in2009;
• A ceiling of 40% of total sales to final consumers has also been introduced for sales of any onecompany.
The spot market trade at the balancing point ‘Punto di Scambio Virtuale’ (PSV) is growing inimportance, having been introduced in October 2003 to facilitate short term deals betweenshippers. In 2008 volumes traded at the PSV accounted for about 28% of the total. Most deals onthe PSV are of a back-to-back nature, with very little players trading for speculative purposes.Parties transact to adjust their respective positions. Most new entrants, including foreign players,trade on the PSV or use it as a convenient point to transact one-year contracts as opposed to spotvolume. There is still no spot price transparency at the PSV as transactions are not priced and areall bilateral. Currently, the only wholesale gas price transparency in Italy is in the shape of the Enigas release auction.
4.5.1.a Italy’s curren t pricing system
Till July 2007 AEEG was responsible for establishing (maximum) gas prices for residential andcommercial customers and also supervises negotiated prices for other consumers. Since thenAEEG only set a “reference price”, which the retail supplier must include within the prices/pricingformulas they offer to the clients.
For industrial customers, the price is usually based on a volume charge and maximum demandcharge and depends on the customer indicating to the supplier the maximum daily volume andalso the total expected volume for the year:
• the volume charge is indexed to gas-oil, crude oil and heavy fuel-oil prices (mirroring thetype of indexation and elasticity to energy price changes which is incorporated in the long-term import contracts). There are various volume discounts that can be applied to thispart of the price;
• the demand element of the tariff also has a base charge that is indexed. The indexation isannual and is based on the movement in wages and in PPI.
4.5.2 France
The gas industry in France is dominated by Gaz de France (GdF), which directly or indirectlyoperates at all market levels – imports/wholesale, transmission and distribution, and supply. Forthe bulk of its supplies, the French gas market relies on long-term contracts between incumbentsuppliers (predominantly GdF and Total, who account for 95% of imports) and national companiesfrom producing countries. The share of alternative suppliers (such as Tegaz and local distributors)in imports is on the rise, while there are also 12 foreign companies operating in the wholesalemarket. There are two TSOs in France, one of which is owned by GdF and operates around 88%
of the French transmission network, while the other is owned by Total and operates 12% of thenetwork. At the distribution/supply level, there are 22 DSOs, with GdF again dominating this partof the market (96%). There are also 11 suppliers currently active in the retail market, which areindependent of network companies.
The deregulation of the French gas market took place in several stages:
• From August 2000, all sites with an annual gas consumption over 237 GWh and allelectricity generators or simultaneous electricity and heat generators whatever theirannual consumption level became eligible
• From August 2003, all sites with an annual gas consumption over 83 GWh became eligible• From July 2004, all companies and local government agencies became eligible• From July 2007, all customers became eligible, including residential customers.
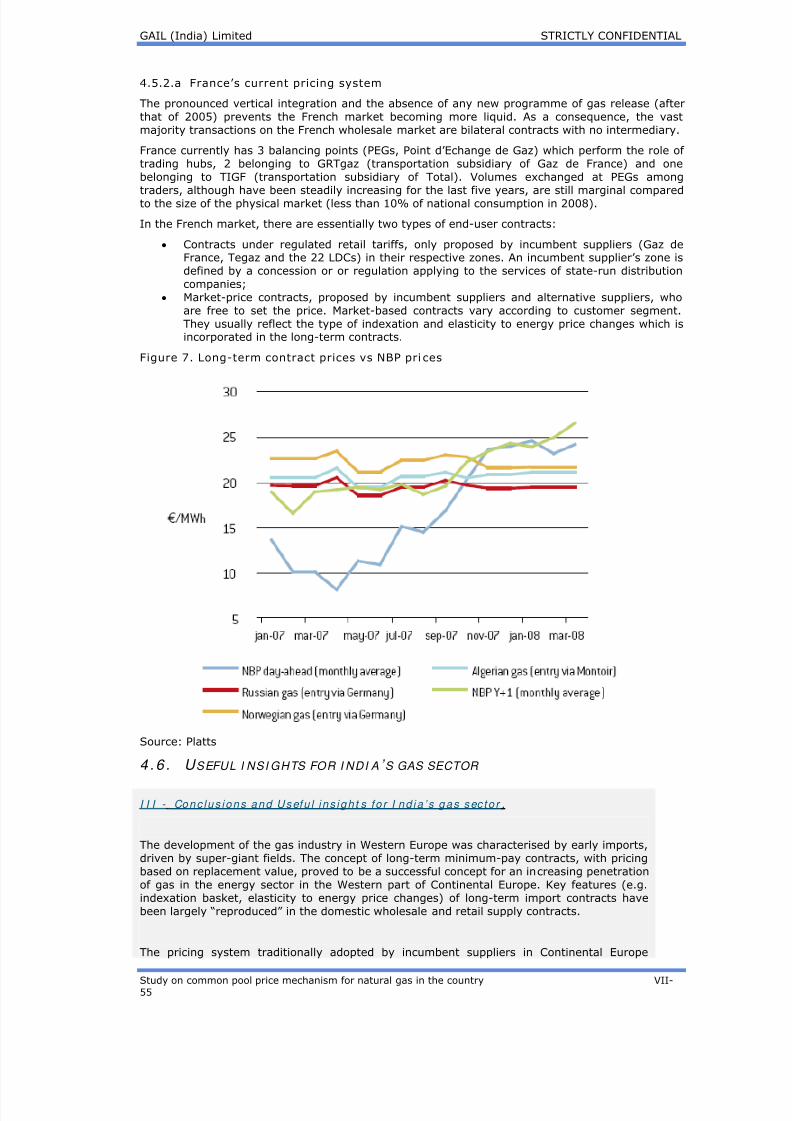
8/6/2019 Natural Gas _ India _2010(1)
http://slidepdf.com/reader/full/natural-gas-india-20101 56/65
GAIL (India) Limited STRICTLY CONFIDENTIAL
Study on common pool price mechanism for natural gas in the country VII-55
4.5.2.a France’s current pricing system
The pronounced vertical integration and the absence of any new programme of gas release (afterthat of 2005) prevents the French market becoming more liquid. As a consequence, the vastmajority transactions on the French wholesale market are bilateral contracts with no intermediary.
France currently has 3 balancing points (PEGs, Point d’Echange de Gaz) which perform the role of trading hubs, 2 belonging to GRTgaz (transportation subsidiary of Gaz de France) and onebelonging to TIGF (transportation subsidiary of Total). Volumes exchanged at PEGs amongtraders, although have been steadily increasing for the last five years, are still marginal comparedto the size of the physical market (less than 10% of national consumption in 2008).
In the French market, there are essentially two types of end-user contracts:
• Contracts under regulated retail tariffs, only proposed by incumbent suppliers (Gaz deFrance, Tegaz and the 22 LDCs) in their respective zones. An incumbent supplier’s zone isdefined by a concession or or regulation applying to the services of state-run distributioncompanies;
• Market-price contracts, proposed by incumbent suppliers and alternative suppliers, whoare free to set the price. Market-based contracts vary according to customer segment.They usually reflect the type of indexation and elasticity to energy price changes which isincorporated in the long-term contracts.
Figure 7. Long-term contract prices vs NBP pri ces
Source: Platts
4 . 6 . U SEFUL I NSI GHTS FOR I NDI A ’ S GAS SECTOR
I I I - Co n c l u s i o n s a n d U s ef u l i n s i g h t s f o r I n d i a ’s g a s s ec t o r .
The development of the gas industry in Western Europe was characterised by early imports,driven by super-giant fields. The concept of long-term minimum-pay contracts, with pricingbased on replacement value, proved to be a successful concept for an increasing penetrationof gas in the energy sector in the Western part of Continental Europe. Key features (e.g.indexation basket, elasticity to energy price changes) of long-term import contracts havebeen largely “reproduced” in the domestic wholesale and retail supply contracts.
The pricing system traditionally adopted by incumbent suppliers in Continental Europe
8/6/2019 Natural Gas _ India _2010(1)
http://slidepdf.com/reader/full/natural-gas-india-20101 57/65
GAIL (India) Limited STRICTLY CONFIDENTIAL
Study on common pool price mechanism for natural gas in the country VII-56
markets (described in section 4.3), mutatis mutandi , is surely of interest for India’sintention of establishing a “pooling price mechanisms” for its LNG imports.
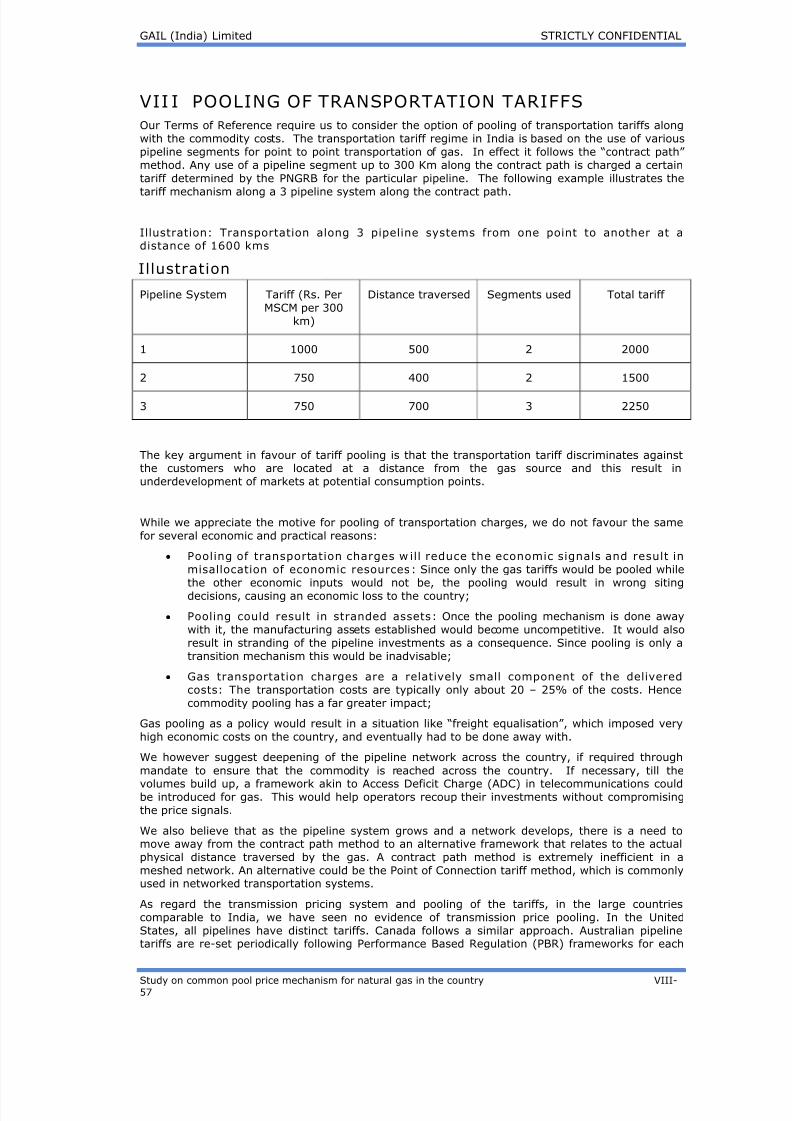
8/6/2019 Natural Gas _ India _2010(1)
http://slidepdf.com/reader/full/natural-gas-india-20101 58/65
GAIL (India) Limited STRICTLY CONFIDENTIAL
Study on common pool price mechanism for natural gas in the country VIII-57
VII I POOLING OF TRANSPORTATION TARIFFSOur Terms of Reference require us to consider the option of pooling of transportation tariffs alongwith the commodity costs. The transportation tariff regime in India is based on the use of variouspipeline segments for point to point transportation of gas. In effect it follows the “contract path” method. Any use of a pipeline segment up to 300 Km along the contract path is charged a certaintariff determined by the PNGRB for the particular pipeline. The following example illustrates the
tariff mechanism along a 3 pipeline system along the contract path.
Illustration: Transportation along 3 pipeline systems from one point to another at adistance of 1600 kms
Pipeline System Tariff (Rs. PerMSCM per 300
km)
Distance traversed Segments used Total tariff
1 1000 500 2 2000
2 750 400 2 1500
3 750 700 3 2250
The key argument in favour of tariff pooling is that the transportation tariff discriminates againstthe customers who are located at a distance from the gas source and this result inunderdevelopment of markets at potential consumption points.
While we appreciate the motive for pooling of transportation charges, we do not favour the samefor several economic and practical reasons:
• Pooling of transportation charges w ill reduce the economic signals and result inmisallocation of economic resources : Since only the gas tariffs would be pooled whilethe other economic inputs would not be, the pooling would result in wrong sitingdecisions, causing an economic loss to the country;
• Pooling could result in stranded assets : Once the pooling mechanism is done awaywith it, the manufacturing assets established would become uncompetitive. It would alsoresult in stranding of the pipeline investments as a consequence. Since pooling is only atransition mechanism this would be inadvisable;
• Gas transportation charges are a relatively small component of the deliveredcosts: The transportation costs are typically only about 20 – 25% of the costs. Hencecommodity pooling has a far greater impact;
Gas pooling as a policy would result in a situation like “freight equalisation”, which imposed veryhigh economic costs on the country, and eventually had to be done away with.
We however suggest deepening of the pipeline network across the country, if required throughmandate to ensure that the commodity is reached across the country. If necessary, till the
volumes build up, a framework akin to Access Deficit Charge (ADC) in telecommunications couldbe introduced for gas. This would help operators recoup their investments without compromisingthe price signals.
We also believe that as the pipeline system grows and a network develops, there is a need tomove away from the contract path method to an alternative framework that relates to the actualphysical distance traversed by the gas. A contract path method is extremely inefficient in ameshed network. An alternative could be the Point of Connection tariff method, which is commonlyused in networked transportation systems.
As regard the transmission pricing system and pooling of the tariffs, in the large countriescomparable to India, we have seen no evidence of transmission price pooling. In the UnitedStates, all pipelines have distinct tariffs. Canada follows a similar approach. Australian pipelinetariffs are re-set periodically following Performance Based Regulation (PBR) frameworks for each
Illustration
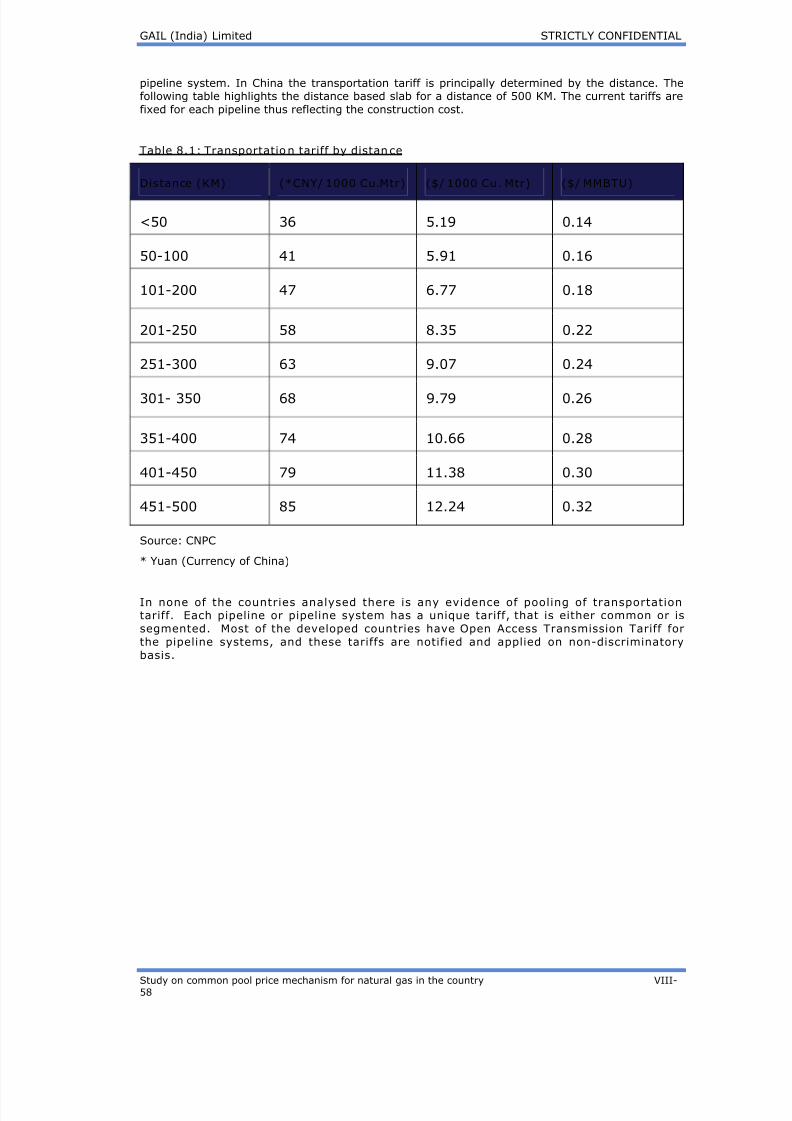
8/6/2019 Natural Gas _ India _2010(1)
http://slidepdf.com/reader/full/natural-gas-india-20101 59/65
GAIL (India) Limited STRICTLY CONFIDENTIAL
Study on common pool price mechanism for natural gas in the country VIII-58
pipeline system. In China the transportation tariff is principally determined by the distance. Thefollowing table highlights the distance based slab for a distance of 500 KM. The current tariffs arefixed for each pipeline thus reflecting the construction cost.
Table 8.1: Transportatio n tariff by distan ce
Distance (KM) (*CNY/ 1000 Cu.Mtr) ($/ 1000 Cu. Mtr) ($/ MMBTU)
<50 36 5.19 0.14
50-100 41 5.91 0.16
101-200 47 6.77 0.18
201-250 58 8.35 0.22
251-300 63 9.07 0.24
301- 350 68 9.79 0.26
351-400 74 10.66 0.28
401-450 79 11.38 0.30
451-500 85 12.24 0.32
Source: CNPC
* Yuan (Currency of China)
In none of the countries analysed there is any evidence of pooling of transportationtariff. Each pipeline or pipeline system has a unique tariff, that is either common or issegmented. Most of the developed countries have Open Access Transmission Tariff forthe pipeline systems, and these tariffs are notified and applied on non-discriminatorybasis.
8/6/2019 Natural Gas _ India _2010(1)
http://slidepdf.com/reader/full/natural-gas-india-20101 60/65
GAIL (India) Limited STRICTLY CONFIDENTIAL
Study on common pool price mechanism for natural gas in the country IX-59
IX RECOMMENDATIONSIt is important to note Indian gas market needs a rational gas pricing mechanism to encourageefficient consumption and development of natural gas infrastructure, while preserving theincentives to gas suppliers. Gas price pooling (either based on cost pooling or bid based pooling) isdesirable for all the sectors consuming gas in order to bring in price stability at the individual
consumer level. However, the analysis conducted in the section V of the report illustrate thatPower and Fertilizer being the most vulnerable sectors, it is imperative for the Power and Fertilizersectors to have a stable (within a range) gas price. Accordingly the following are recommended:
1. Price pools should be formed for power and fertiliser customers. We recommend separatepools for the two sectors to avoid cross subsidies between the customer groups andadministration issues that a combined pool would present;
2. The pools should be notified consequent to a policy issued by the GoI. The notificationshould spell out the guidelines for pool operation in sufficient detail, and should alsoprovide for tenure for the pool. The pool can be disbanded or extended upon a specificreview on completion of the term. Considering the market realities we recommend a 4-5year term for the pool;
3. The policy should notify a pool operator. We believe that GAIL as an existing operator of the pipeline system (and also with prior experience of pooling of RLNG) would be wellplaced to operate the pool. However the pool operation would have to be done on anarms length basis with suitable functional separation within the organisation. The design of the pool should be undertaken on the basis of minimisation of structures, costs andcomplexities;
4. A detailed set of pool rules should be drawn up and such rules should be notified by theGoI after due consultation. The limits of operations of the pool should be clearly set out,including the range of acceptable pool prices and corresponding quantities to beintroduced. Detailed operating codes would also need to be drawn up;
5. All existing contracts for the sectors identified for pooling should be modified or novated tothe pool as per the pool rules. This would require the pool operator to develop standardcontracts;
6. The pool should feature the necessary institutional structures and governancearrangements discussed earlier in this report. A separate analysis of these arrangementsis suggested consequent to acceptance of the recommendations of this report;
As mentioned, the pools are recommended for the power and fertiliser industries only. This leavesadequate room for an alternate market to develop for other industries and even for customers of the power and fertiliser sector (particularly the former), who may not wish to be a part of the pool.This would facilitate price discovery for new gas supplies, and the pooling arrangements would notbe a limiting factor for development of the industry beyond the limits that the pool can servewithin its rules. This would also provide comfort to new gas suppliers who wish to supply to suchindustries.
It is important to note that the benefits of cost pooling are not necessarily restricted to the powerand fertiliser sectors only. However the benefits of central pooling in the other sectors on the linesproposed is more complex on account of the large number of consumers with small volumes, sincethis would militate against the objective of keeping the pool administration set up and costs to aminimum. For the other sectors such as sponge iron, petrochemicals, CGD and other smallcustomers pooling can be done at the gas supplier’s level. In the present scenario the gasconsumers source gas from various sources and pool it at the individual company level. Ouranalysis shows that in the international markets such as Italy and France where mostly the supplyis based on contracts the gas supply company pools the gas from various sources and supplies itto the customers at a common price to all the end consumers. As we have mentioned in thereport, we do not recommend pooling of transportation costs since this distorts the basic economicprice signals derived from the location of the customer vis a vis the resource. However we dorecommend the development of a robust gas transportation system across the country based on apolicy or legislative mandate. In the initial years when the utilisation is low on such pipelines, thepolicy framework should place limits on the pipeline charges. Deficits if any can be made goodthrough mechanisms like Access Deficit Charges (ADC) as prevalent in the telecommunicationssector.
Finally we recommend the creation of a roadmap for migration to competitive wholesale marketsfor gas, which would typically be through bid based pools, and feature a large number of
8/6/2019 Natural Gas _ India _2010(1)
http://slidepdf.com/reader/full/natural-gas-india-20101 61/65
GAIL (India) Limited STRICTLY CONFIDENTIAL
Study on common pool price mechanism for natural gas in the country IX-60
independent shippers. It is important to note that such mechanisms could coexist with cost basedpools and also long term contracts for gas supply. This would result in the emergence of a vibrantgas market that could attract new gas suppliers willing to supply for various contract tenures, andwould provide a strong signal for emergence of gas trading hubs at key despatch/aggregationpoints in the country.
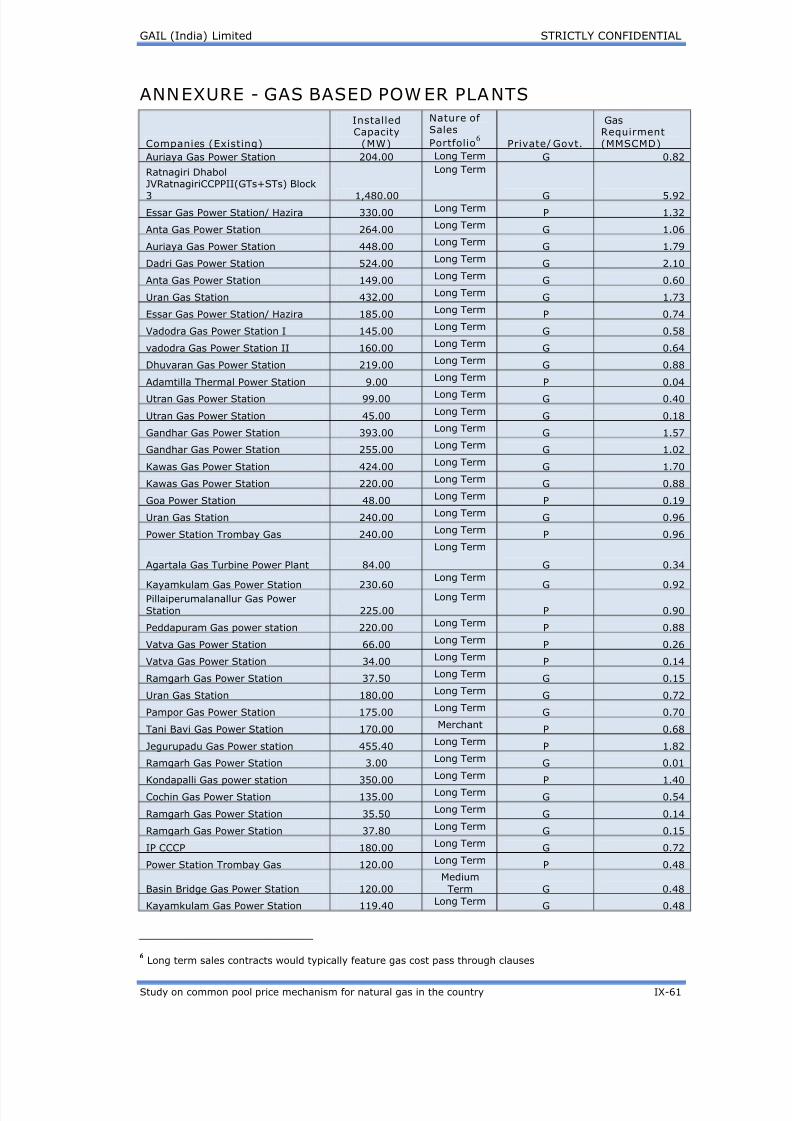
8/6/2019 Natural Gas _ India _2010(1)
http://slidepdf.com/reader/full/natural-gas-india-20101 62/65
GAIL (India) Limited STRICTLY CONFIDENTIAL
Study on common pool price mechanism for natural gas in the country IX-61
ANN EXURE - GAS BASED POW ER PLA NTS
Companies (Existing)
InstalledCapacity
(MW)
Nature of SalesPortfolio
6 Private/ Govt.
GasRequirment(MMSCMD)
Auriaya Gas Power Station 204.00 Long Term G 0.82Ratnagiri DhabolJVRatnagiriCCPPII(GTs+STs) Block
3 1,480.00
Long Term
G 5.92Essar Gas Power Station/ Hazira 330.00 Long Term P 1.32
Anta Gas Power Station 264.00 Long Term G 1.06
Auriaya Gas Power Station 448.00 Long Term G 1.79
Dadri Gas Power Station 524.00 Long Term G 2.10
Anta Gas Power Station 149.00 Long Term G 0.60
Uran Gas Station 432.00 Long Term G 1.73
Essar Gas Power Station/ Hazira 185.00 Long Term P 0.74
Vadodra Gas Power Station I 145.00 Long Term G 0.58
vadodra Gas Power Station II 160.00 Long Term G 0.64
Dhuvaran Gas Power Station 219.00 Long Term G 0.88
Adamtilla Thermal Power Station 9.00 Long Term P 0.04
Utran Gas Power Station 99.00 Long Term G 0.40
Utran Gas Power Station 45.00 Long Term G 0.18
Gandhar Gas Power Station 393.00 Long Term G 1.57
Gandhar Gas Power Station 255.00 Long Term G 1.02
Kawas Gas Power Station 424.00 Long Term G 1.70
Kawas Gas Power Station 220.00 Long Term G 0.88
Goa Power Station 48.00 Long Term P 0.19
Uran Gas Station 240.00 Long Term G 0.96
Power Station Trombay Gas 240.00 Long Term P 0.96
Agartala Gas Turbine Power Plant 84.00
Long Term
G 0.34
Kayamkulam Gas Power Station 230.60
Long Term
G 0.92Pillaiperumalanallur Gas PowerStation 225.00
Long TermP 0.90
Peddapuram Gas power station 220.00 Long Term P 0.88
Vatva Gas Power Station 66.00 Long Term P 0.26
Vatva Gas Power Station 34.00 Long Term P 0.14
Ramgarh Gas Power Station 37.50 Long Term G 0.15
Uran Gas Station 180.00 Long Term G 0.72
Pampor Gas Power Station 175.00 Long Term G 0.70
Tani Bavi Gas Power Station 170.00 Merchant P 0.68
Jegurupadu Gas Power station 455.40 Long Term P 1.82
Ramgarh Gas Power Station 3.00 Long Term G 0.01
Kondapalli Gas power station 350.00 Long Term P 1.40
Cochin Gas Power Station 135.00 Long Term G 0.54
Ramgarh Gas Power Station 35.50 Long Term G 0.14
Ramgarh Gas Power Station 37.80 Long Term G 0.15
IP CCCP 180.00 Long Term G 0.72
Power Station Trombay Gas 120.00 Long Term P 0.48
Basin Bridge Gas Power Station 120.00Medium
Term G 0.48
Kayamkulam Gas Power Station 119.40 Long Term G 0.48
6Long term sales contracts would typically feature gas cost pass through clauses
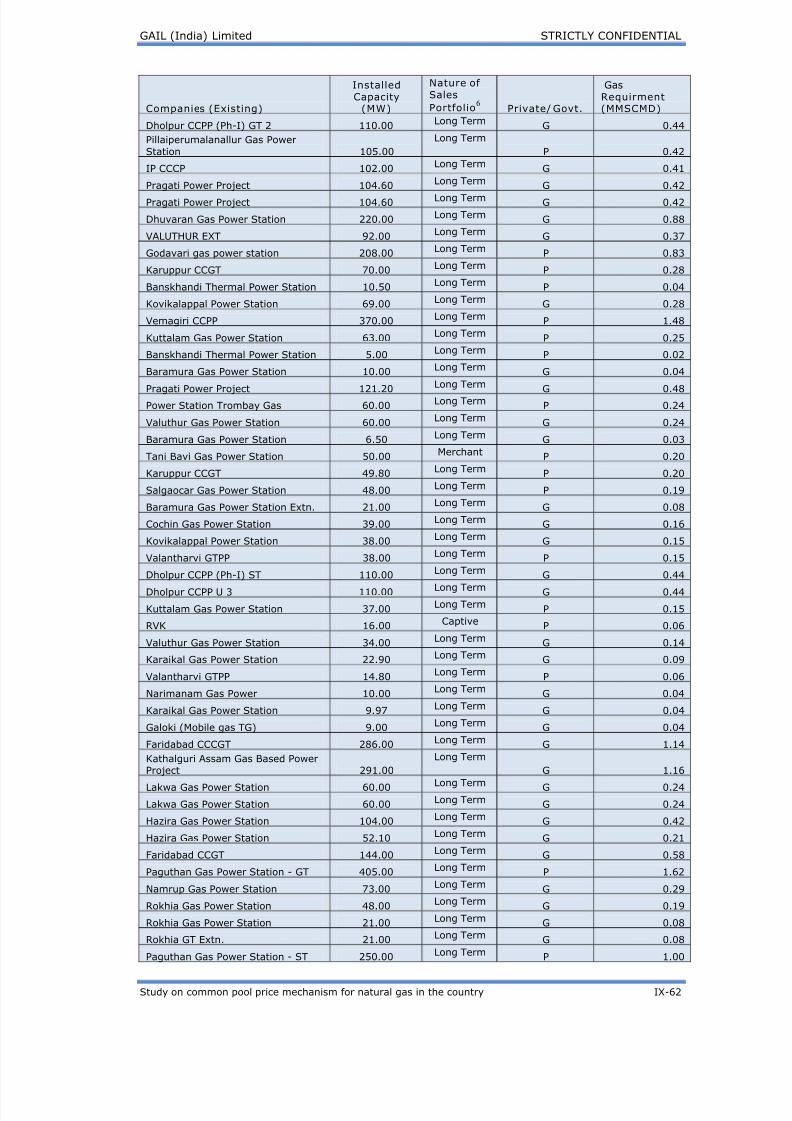
8/6/2019 Natural Gas _ India _2010(1)
http://slidepdf.com/reader/full/natural-gas-india-20101 63/65
GAIL (India) Limited STRICTLY CONFIDENTIAL
Study on common pool price mechanism for natural gas in the country IX-62
Companies (Existing)
InstalledCapacity
(MW)
Nature of SalesPortfolio
6 Private/ Govt.
GasRequirment(MMSCMD)
Dholpur CCPP (Ph-I) GT 2 110.00 Long Term G 0.44Pillaiperumalanallur Gas PowerStation 105.00
Long TermP 0.42
IP CCCP 102.00 Long Term G 0.41
Pragati Power Project 104.60 Long Term G 0.42
Pragati Power Project 104.60 Long Term G 0.42
Dhuvaran Gas Power Station 220.00 Long Term G 0.88
VALUTHUR EXT 92.00 Long Term G 0.37
Godavari gas power station 208.00 Long Term P 0.83
Karuppur CCGT 70.00 Long Term P 0.28
Banskhandi Thermal Power Station 10.50 Long Term P 0.04
Kovikalappal Power Station 69.00 Long Term G 0.28
Vemagiri CCPP 370.00 Long Term P 1.48
Kuttalam Gas Power Station 63.00 Long Term P 0.25
Banskhandi Thermal Power Station 5.00 Long Term P 0.02
Baramura Gas Power Station 10.00 Long Term G 0.04
Pragati Power Project 121.20Long Term
G 0.48Power Station Trombay Gas 60.00 Long Term P 0.24
Valuthur Gas Power Station 60.00 Long Term G 0.24
Baramura Gas Power Station 6.50 Long Term G 0.03
Tani Bavi Gas Power Station 50.00 Merchant P 0.20
Karuppur CCGT 49.80 Long Term P 0.20
Salgaocar Gas Power Station 48.00 Long Term P 0.19
Baramura Gas Power Station Extn. 21.00 Long Term G 0.08
Cochin Gas Power Station 39.00 Long Term G 0.16
Kovikalappal Power Station 38.00 Long Term G 0.15
Valantharvi GTPP 38.00 Long Term P 0.15
Dholpur CCPP (Ph-I) ST 110.00 Long Term G 0.44
Dholpur CCPP U 3 110.00 Long Term G 0.44Kuttalam Gas Power Station 37.00 Long Term P 0.15
RVK 16.00 Captive P 0.06
Valuthur Gas Power Station 34.00 Long Term G 0.14
Karaikal Gas Power Station 22.90 Long Term G 0.09
Valantharvi GTPP 14.80 Long Term P 0.06
Narimanam Gas Power 10.00 Long Term G 0.04
Karaikal Gas Power Station 9.97 Long Term G 0.04
Galoki (Mobile gas TG) 9.00 Long Term G 0.04
Faridabad CCCGT 286.00 Long Term G 1.14Kathalguri Assam Gas Based PowerProject 291.00
Long TermG 1.16
Lakwa Gas Power Station 60.00 Long Term G 0.24Lakwa Gas Power Station 60.00 Long Term G 0.24
Hazira Gas Power Station 104.00 Long Term G 0.42
Hazira Gas Power Station 52.10 Long Term G 0.21
Faridabad CCGT 144.00 Long Term G 0.58
Paguthan Gas Power Station - GT 405.00 Long Term P 1.62
Namrup Gas Power Station 73.00 Long Term G 0.29
Rokhia Gas Power Station 48.00 Long Term G 0.19
Rokhia Gas Power Station 21.00 Long Term G 0.08
Rokhia GT Extn. 21.00 Long Term G 0.08
Paguthan Gas Power Station - ST 250.00 Long Term P 1.00
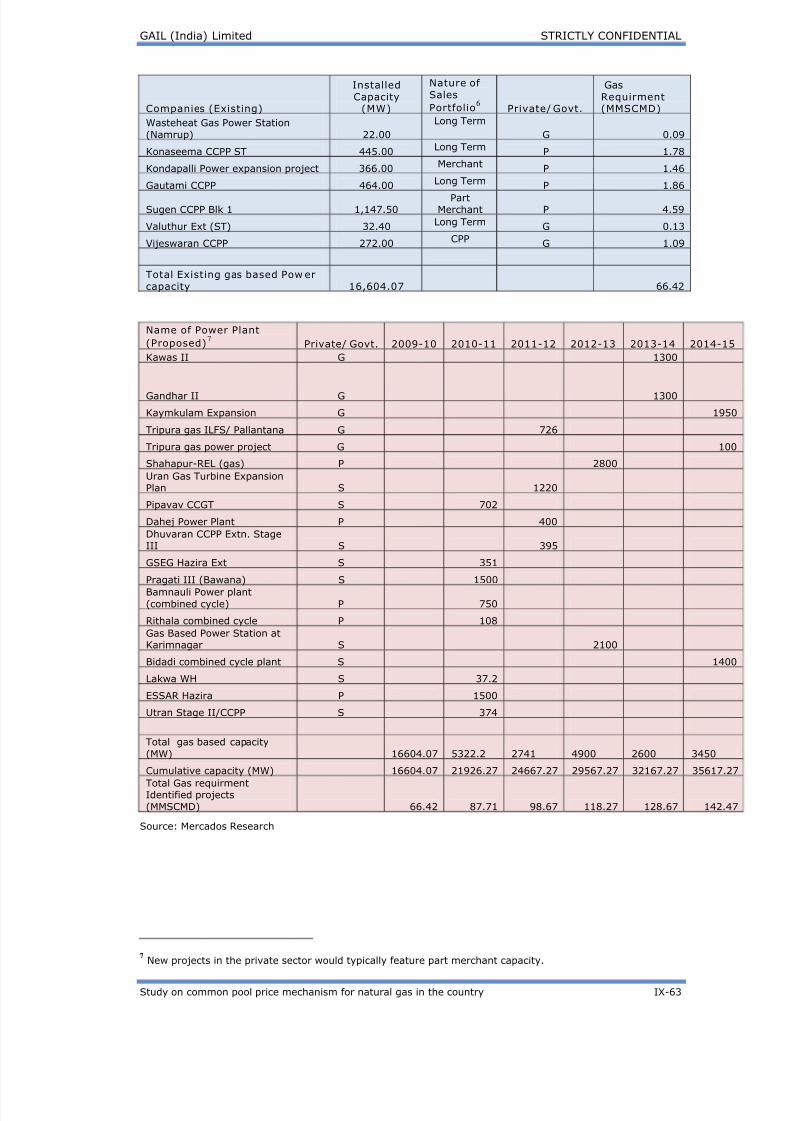
8/6/2019 Natural Gas _ India _2010(1)
http://slidepdf.com/reader/full/natural-gas-india-20101 64/65
GAIL (India) Limited STRICTLY CONFIDENTIAL
Study on common pool price mechanism for natural gas in the country IX-63
Companies (Existing)
InstalledCapacity
(MW)
Nature of SalesPortfolio
6 Private/ Govt.
GasRequirment(MMSCMD)
Wasteheat Gas Power Station(Namrup) 22.00
Long TermG 0.09
Konaseema CCPP ST 445.00 Long Term P 1.78
Kondapalli Power expansion project 366.00 Merchant P 1.46
Gautami CCPP 464.00 Long Term P 1.86
Sugen CCPP Blk 1 1,147.50Part
Merchant P 4.59
Valuthur Ext (ST) 32.40 Long Term G 0.13
Vijeswaran CCPP 272.00 CPP G 1.09
Total Existing gas based Pow ercapacity 16,604.07 66.42
Name of Power Plant(Proposed)
7 Private/ Govt. 2009-10 2010-11 2011-12 2012-13 2013-14 2014-15
Kawas II G 1300
Gandhar II G 1300Kaymkulam Expansion G 1950
Tripura gas ILFS/ Pallantana G 726
Tripura gas power project G 100
Shahapur-REL (gas) P 2800Uran Gas Turbine ExpansionPlan S 1220
Pipavav CCGT S 702
Dahej Power Plant P 400Dhuvaran CCPP Extn. StageIII S 395
GSEG Hazira Ext S 351
Pragati III (Bawana) S 1500Bamnauli Power plant(combined cycle) P 750
Rithala combined cycle P 108Gas Based Power Station atKarimnagar S 2100
Bidadi combined cycle plant S 1400
Lakwa WH S 37.2
ESSAR Hazira P 1500
Utran Stage II/CCPP S 374
Total gas based capacity(MW) 16604.07 5322.2 2741 4900 2600 3450
Cumulative capacity (MW) 16604.07 21926.27 24667.27 29567.27 32167.27 35617.27
Total Gas requirmentIdentified projects(MMSCMD) 66.42 87.71 98.67 118.27 128.67 142.47
Source: Mercados Research
7New projects in the private sector would typically feature part merchant capacity.
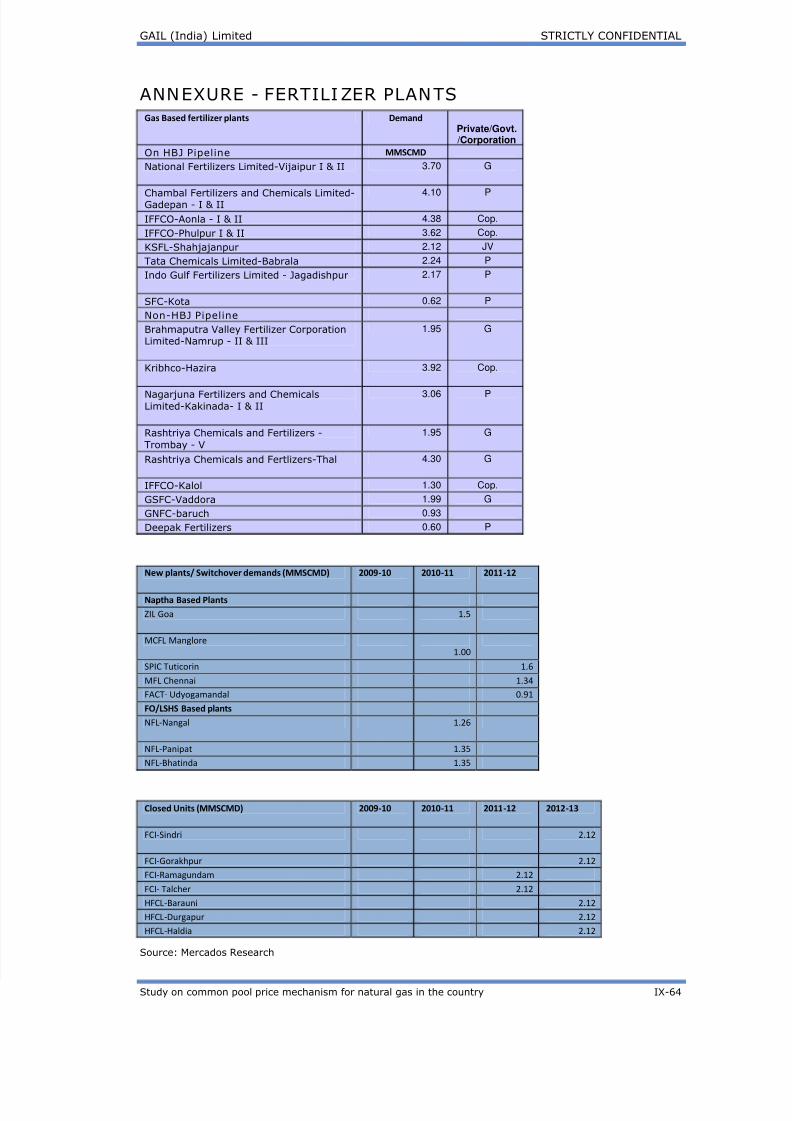
8/6/2019 Natural Gas _ India _2010(1)
http://slidepdf.com/reader/full/natural-gas-india-20101 65/65
GAIL (India) Limited STRICTLY CONFIDENTIAL
ANN EXURE - FERTILI ZER PLAN TS Gas Based fertilizer plants Demand
Private/Govt./Corporation
On HBJ Pipeline MMSCMD National Fertilizers Limited-Vijaipur I & II 3.70 G
Chambal Fertilizers and Chemicals Limited-Gadepan - I & II 4.10 P
IFFCO-Aonla - I & II 4.38 Cop.IFFCO-Phulpur I & II 3.62 Cop.KSFL-Shahjajanpur 2.12 JVTata Chemicals Limited-Babrala 2.24 PIndo Gulf Fertilizers Limited - Jagadishpur 2.17 P
SFC-Kota 0.62 PNon-HBJ PipelineBrahmaputra Valley Fertilizer CorporationLimited-Namrup - II & III
1.95 G
Kribhco-Hazira 3.92 Cop.
Nagarjuna Fertilizers and ChemicalsLimited-Kakinada- I & II
3.06 P
Rashtriya Chemicals and Fertilizers -Trombay - V
1.95 G
Rashtriya Chemicals and Fertlizers-Thal 4.30 G
IFFCO-Kalol 1.30 Cop.GSFC-Vaddora 1.99 GGNFC-baruch 0.93Deepak Fertilizers 0.60 P
New plants/ Switchover demands (MMSCMD) 2009 ‐ 10 2010 ‐ 11 2011 ‐ 12
Naptha Based Plants
ZIL Goa 1.5
MCFL Manglore
1.00
SPIC Tuticorin 1.6
MFL Chennai 1.34
FACT‐ Udyogamandal 0.91
FO/LSHS Based plants
NFL‐ Nangal 1.26
NFL‐ Panipat 1.35
NFL‐ Bhatinda 1.35
Closed Units (MMSCMD) 2009 ‐ 10 2010 ‐ 11 2011 ‐ 12 2012 ‐ 13