Embed Size (px)
Citation preview
General rights Copyright and moral rights for the publications made accessible in the public portal are retained by the authors and/or other copyright owners and it is a condition of accessing publications that users recognise and abide by the legal requirements associated with these rights.
Users may download and print one copy of any publication from the public portal for the purpose of private study or research.
You may not further distribute the material or use it for any profit-making activity or commercial gain
You may freely distribute the URL identifying the publication in the public portal If you believe that this document breaches copyright please contact us providing details, and we will remove access to the work immediately and investigate your claim.
Downloaded from orbit.dtu.dk on: Oct 31, 2021
Natural genetic variation impacts expression levels of coding, non-coding, andantisense transcripts in fission yeast.
Clément-Ziza, Mathieu; Marsellach, Francesc X.; Codlin, Sandra; Papadakis, Manos A.; Reinhardt,Susanne; Rodríguez-López, María; Martin, Stuart; Marguerat, Samuel; Schmidt, Alexander; Lee, EunhyeTotal number of authors:13
Published in:Molecular Systems Biology
Link to article, DOI:10.15252/msb.20145123
Publication date:2014
Document VersionPublisher's PDF, also known as Version of record
Link back to DTU Orbit
Citation (APA):Clément-Ziza, M., Marsellach, F. X., Codlin, S., Papadakis, M. A., Reinhardt, S., Rodríguez-López, M., Martin,S., Marguerat, S., Schmidt, A., Lee, E., Workman, C., Bähler, J., & Beyer, A. (2014). Natural genetic variationimpacts expression levels of coding, non-coding, and antisense transcripts in fission yeast. Molecular SystemsBiology, 10(764). https://doi.org/10.15252/msb.20145123
Article
Natural genetic variation impacts expression levelsof coding, non-coding, and antisense transcripts infission yeastMathieu Clément-Ziza1,2,‡, Francesc X Marsellach3,‡, Sandra Codlin3,‡, Manos A Papadakis4, Susanne
Reinhardt1, María Rodríguez-López3, Stuart Martin3, Samuel Marguerat3,†, Alexander Schmidt5,
Eunhye Lee3, Christopher T Workman4, Jürg Bähler3,* & Andreas Beyer1,2,**
Abstract
Our current understanding of how natural genetic variation affectsgene expression beyond well-annotated coding genes is stilllimited. The use of deep sequencing technologies for the study ofexpression quantitative trait loci (eQTLs) has the potential to closethis gap. Here, we generated the first recombinant strain libraryfor fission yeast and conducted an RNA-seq-based QTL study of thecoding, non-coding, and antisense transcriptomes. We show thatthe frequency of distal effects (trans-eQTLs) greatly exceeds thenumber of local effects (cis-eQTLs) and that non-coding RNAs areas likely to be affected by eQTLs as protein-coding RNAs. We iden-tified a genetic variation of swc5 that modifies the levels of 871RNAs, with effects on both sense and antisense transcription, andshow that this effect most likely goes through a compromiseddeposition of the histone variant H2A.Z. The strains, methods, anddatasets generated here provide a rich resource for future studies.
Keywords antisense transcription; histone variant; non-coding RNA; QTL;
Schizosaccharomyces pombe
Subject Categories Chromatin, Epigenetics, Genomics & Functional
Genomics; Transcription
DOI 10.15252/msb.20145123 | Received 14 January 2014 | Revised 27 October
2014 | Accepted 3 November 2014
Mol Syst Biol. (2014) 10: 764
Introduction
Variation in gene expression, which in turn is often caused by
natural genetic variation, is a major factor causing intra-species
phenotypic differences. Hence, investigating the influence of genetic
variation on gene expression has been the focus of intense research.
The identification of expression quantitative trait loci (eQTLs), that
is, genomic regions that are linked with the expression of a specific
transcript, has primarily been conducted using DNA microarrays
(Jansen & Nap, 2001; Brem et al, 2002).
The advent of next-generation sequencing technologies is drasti-
cally changing the way we study the relationship between genotype
and gene expression. High-throughput sequencing of cDNA (RNA-
seq) has great potential to provide qualitatively new insights beyond
mere mRNA quantification (Wang et al, 2009). RNA-seq is indepen-
dent of gene annotation and provides information on all types of
transcripts (including coding, non-coding, and antisense) and on the
corresponding genotypes. However, many of these aspects have only
been partially exploited. Previous RNA-seq-based eQTL studies have
focused on measuring ‘new’ traits, giving rise to splicing QTLs
(Lalonde et al, 2011; Battle et al, 2013), isoform-specific QTLs
(Montgomery et al, 2010), and allele-specific eQTLs (Montgomery
et al, 2010, 2011; Pickrell et al, 2010; Sun, 2012; Battle et al, 2013).
Most of these studies have been limited to the detection of local
eQTLs, so-called cis-eQTLs (Montgomery et al, 2010, 2011; Pickrell
et al, 2010; Lalonde et al, 2011; Majewski & Pastinen, 2011), or have
identified only a relatively small proportion of distant eQTLs (trans-
eQTLs, Battle et al, 2013). Cis-eQTLs are located at or close to the
genes whose expression they directly affect, while trans-eQTLs are
remote from the genes whose expression they affect. It has been
suggested that the vast majority of eQTLs act in trans (Brem et al,
2002; Yvert et al, 2003; Rockman & Kruglyak, 2006; Ackermann
et al, 2013). Hence, to fully understand phenotypic variation, it will
be necessary to design RNA-seq-based eQTL studies with the ability
to detect all trans-eQTLs. Further, although the sequence variation
1 Biotechnology Centre, Technische Universität Dresden, Dresden, Germany2 Cologne Cluster of Excellence in Cellular Stress Responses in Aging-associated Diseases (CECAD), University of Cologne, Cologne, Germany3 Department of Genetics, Evolution & Environment and UCL Genetics Institute, University College London, London, UK4 Center for Biological Sequence Analysis, Department of Systems Biology, Technical University of Denmark, Lyngby, Denmark5 Biozentrum, University of Basel, Basel, Switzerland
*Corresponding author. Tel: +44 203 108 1602; E-mail: [email protected]**Corresponding author. Tel: +49 221 478 84 429; E-mail: [email protected]‡These authors contributed equally to this work†Present address: MRC Clinical Sciences Centre, Imperial College London, London, UK
ª 2014 The Authors. Published under the terms of the CC BY 4.0 license Molecular Systems Biology 10: 764 | 2014 1
Published online: November 28, 2014
information contained in the RNA-seq data has been exploited for
SNP detection (e.g. Piskol et al, 2013; Quinn et al, 2013), it has not
been used in the framework of eQTL mapping, possibly due to the
complexity of the studied organisms (Montgomery et al, 2010, 2011;
Pickrell et al, 2010; Keane et al, 2011).
Here, we have conducted an expression QTL study characterized
by a design enabling a high statistical power for association detec-
tion and by a broad investigation of pervasive expression beyond
well-annotated coding genes (i.e. non-coding and antisense tran-
scripts). The high statistical power contributed to the improved
discovery of trans-eQTLs (thereby enabling the reliable detection of
more than 2,000 trans-eQTLs), suggesting that previous studies may
have been overestimating the fraction of cis-eQTLs. First, we gener-
ated a recombinant strain library for fission yeast (Schizosacchar-
omyces pombe) suitable for powerful QTL studies, which was
subsequently subjected to high-resolution measurements of growth
kinetics and strand-specific RNA-seq. Whereas microarray probes
rely on a fixed ‘reference genome’, RNA-seq allows for the individu-
alized quantification of transcripts taking genomic variation into
account. We show that our approach, which explicitly includes indi-
vidual genomes, reduces the potential for false-positive eQTLs.
Further, because RNA-seq measures the actual transcript sequences
of a given strain, it can also be used for genotyping the strain
library. We developed a computational framework for the robust
genotyping of recombinant strains using RNA-seq data, which elimi-
nates the need for separate genotyping experiments. Finally, RNA-
seq makes no assumptions about the structure of genomic features.
In the context of QTL studies, it can thus be used to identify genetic
variants affecting non-annotated features. Here, we present a strik-
ing example of a variation affecting antisense transcription of
hundreds of S. pombe genes detected in this study.
Results
Generation of a recombinant Schizosaccharomyces pombestrain library
To generate the first fission yeast strain library suitable for QTL
studies, we selected an independent isolate that is not derived from
Leupold’s widely used 968 h90 strain (968; standard laboratory
strain, Leupold, 1950). In order to enable the detection of associa-
tion at a high statistical power, we selected closely related parental
strains to reduce the genetic complexity of the library (Brown et al,
2011). Reproductive barriers have been reported between S. pombe
wild isolates (Kondrat’eva & Naumov, 2001), which could lead to
low recombination and biased segregation of polymorphic markers
(Chambers et al, 1996). To avoid such problems, we characterized
the mating and segregation of polymorphic markers among fission
yeast wild isolates (D. Jeffares et al, in preparation) available in
strain collections (Brown et al, 2011). Based on these analyses, we
chose Y0036 (isolated in South Africa) as a suitable mating partner
for the 968 strain to produce a QTL library. Crosses between the
Y0036 and 968 strains showed 55% spore survival by tetrad analy-
sis. Moreover, microsatellite markers (Patch & Aves, 2007) were
polymorphic between these two strains, and Affymetrix-based geno-
typing showed no segregation biases, with the exception of a low
recombination rate on a large region of Chromosome I. This result
was later confirmed with the RNA-seq genotyping of the QTL library
(see below).
The strain library was constructed with a customized protocol to
ensure that matings occurred exclusively between the Y0036 and
968 strains, but not within parental strains (Materials and Methods).
This approach also showed that increasing the number of crosses,
that is, generating F2 segregants, significantly helped to improve the
resolution of the QTL library (F2 segregants contained more recom-
binations than in F1 segregants, P = 0.0111, one-sided Wilcoxon’s
rank-sum test), as previously shown (Parts et al, 2011; Liti & Louis,
2012). In total, we generated 44 recombinant segregant strains from
the cross between Y0036 and 968 (Supplementary Table S1). Note
that fission yeast strains normally grow as haploid cells, and all our
segregants were haploid.
Phenotyping of strain library by high-resolution growthmeasurements and RNA-seq
We analyzed the growth of the recombinant strains in liquid media
in standard conditions using the BioLector instrument (Kensy et al,
2009). This approach allowed us to acquire real-time cellular growth
kinetics and high-resolution growth curves, which in turn facilitated
the resolution of individual growth variables with high precision for
the parental and all segregant strains of the library (Supplementary
Fig S1A, Supplementary Dataset S1). We extracted from these data a
number of growth parameters, including the lag phase (response
time), the maximum specific growth rate (lmax, slope in exponential
phase of growth converted into population doubling time), the
growth efficiency (gain in biomass provided by nutrients in
medium), and the area under the growth curve (Supplementary Fig
S1B–D, Supplementary Dataset S2). All growth traits showed vari-
ability within the library. Interestingly, the growth efficiency and
maximum specific growth rate were higher in the parental strains
than in 96.6 and 94.1% of the segregants, respectively (Supplemen-
tary Fig S2). This apparent outbreed depression suggests an adap-
tive evolution of the parental strains during their lineage that
resulted in epistatic interactions between different loci (Edmands,
1999; Gimond et al, 2013).
We also determined the viability in stationary phase of the
parental and segregant strains after 36 h of growth in liquid medium.
A large fraction of the segregants (~46%) showed a high average
population viability corresponding to 76–100% (Supplementary
Fig S3, Supplementary Dataset S3). The viabilities of the parental
strains were very different from each other: 38.0 and 87.6% for
Y0036 and 968, respectively.
The library was also subjected to a molecular characterization of
genotypes and expression phenotypes via transcriptome sequencing
at high depth (50 base long strand-specific RNA-seq, average RNA-
seq statistics: Table 1, detailed: Supplementary Table S2). We could
reliably measure: (i) the expression of 6,464 previously identified
transcripts (5,036 protein-coding and 1,428 non-coding transcripts,
Supplementary Dataset S4, Supplementary Table S2), and (ii) the
antisense expression at the loci of 4,133 coding genes (Supplementary
Dataset S5, Supplementary Table S2) in 65 samples (including
biological replicates) derived from 46 distinct strains (Supplemen-
tary Table S2). The average Pearson’s product-moment correlation
coefficient (Pearson’s r) between the biological replicates was
r = 0.97 (Supplementary Fig S4).
Molecular Systems Biology 10: 764 | 2014 ª 2014 The Authors
Molecular Systems Biology Genetic variation impacting antisense transcription Mathieu Clément-Ziza et al
2
Published online: November 28, 2014
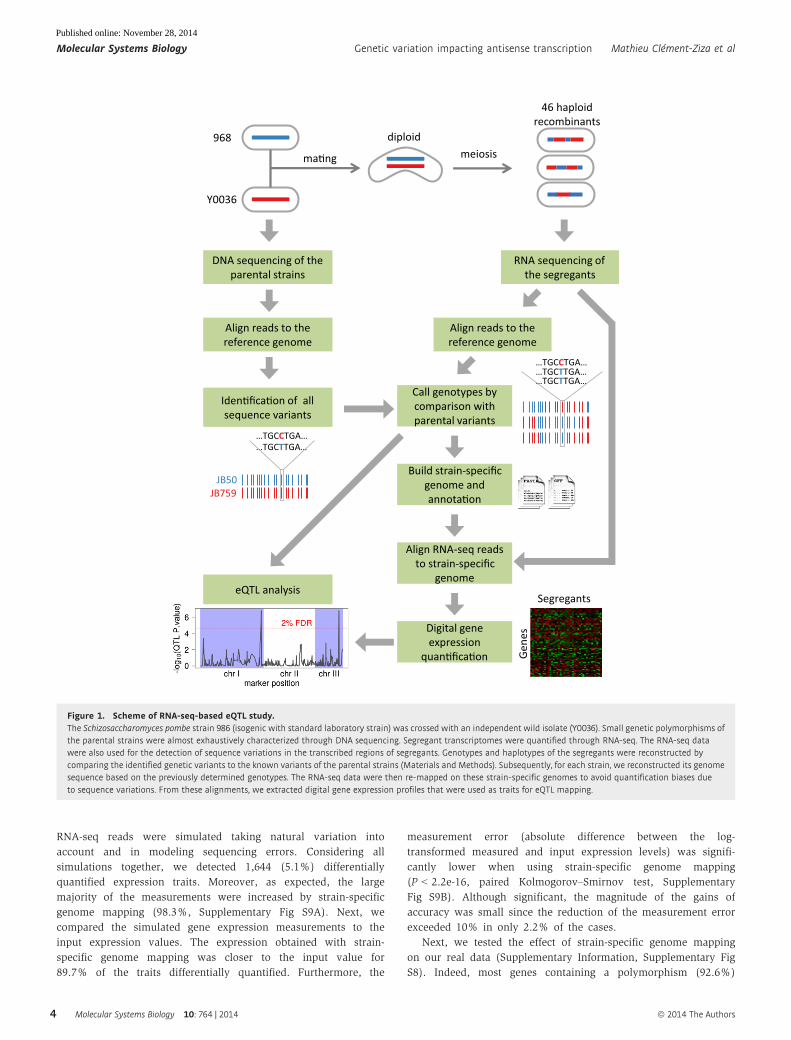
Genotyping of the strain library by RNA-seq
eQTL studies require both the genotypes and the expression profiles
of each individual of the studied population. We developed a
strategy enabling the genotyping of a recombinant strain library
through RNA-seq (Fig 1). Thus, separate genotyping experiments of
the segregant strains were not needed.
First, the genomes of the parental strains were sequenced at great
depth (273× and 244× for 968 and Y0036, respectively), allowing us
to detect potentially all genomic variants (Supplementary Fig S5).
We identified 4,570 high-confidence genomic polymorphisms
between the two parental strains. These genetic variants included
3,865 single-nucleotide polymorphisms (SNPs) and 705 small inser-
tions and deletions (indels) (Supplementary Dataset S6), represent-
ing a minimum genomic divergence of 0.05% between the two
parental strains. This degree of divergence is comparable to the
average divergence between two humans (~0.1%; Jorde & Wooding,
2004), but it is less than the divergence typically observed between
progenitors of model recombinant inbred populations; for instance,
the widely used S. cerevisiae RMxBY strains are ten times more
divergent (Brem et al, 2002; Bloom et al, 2013).
Subsequently, we used the RNA-seq data of the segregants to
detect genomic variations and thus determine their haplotype, at
4,481 polymorphic sites, with 89 sites being excluded from this
analysis (Fig 2, Supplementary Dataset S7, Materials and Methods).
On average, about half of the sites (47.7%) could be directly geno-
typed with high certainty, which was sufficient to identify haplotype
blocks and therefore infer genotypes at the remaining sites. Ambigu-
ous sites (e.g. between two haplotype blocks) were not called. Over-
all, 97.3% of the polymorphic sites could be genotyped (Materials
and Methods). From this genotype data, we inferred 765 recombina-
tion breakpoints (Supplementary Fig S6, Supplementary Dataset
S8), that is, on average 17.4 recombination sites per segregant. A set
of 708 genetic makers was then assembled (Materials and Methods,
Supplementary Dataset S9) to perform the subsequent QTL analy-
ses, with an average interval between markers of 17.8 kb.
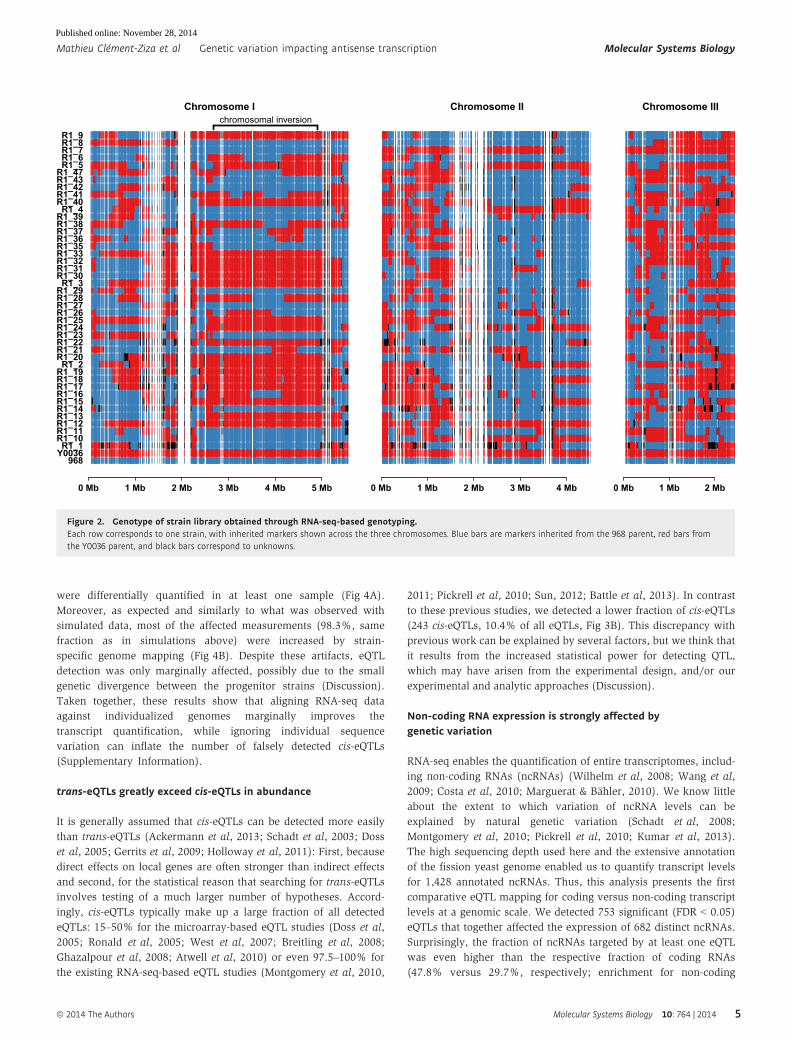
We noticed that a large part of Chromosome I exhibited a reduced
recombination frequency (Fig 2, Supplementary Fig S6). This region
corresponds to a 2.23 Mbp pericentric inversion shared by a minority of
S. pombe isolates (Brown et al, 2011), including the 968 strain, but not
the other parental strain (Y0036). This inversion on Chromosome I
lowered the frequencies of crossovers, which resulted in a reduced
genetic resolution in this region (distances between informative genetic
markers in this region were on average three times larger, Supplemen-
tary Information, Supplementary Figs S6 and S7).
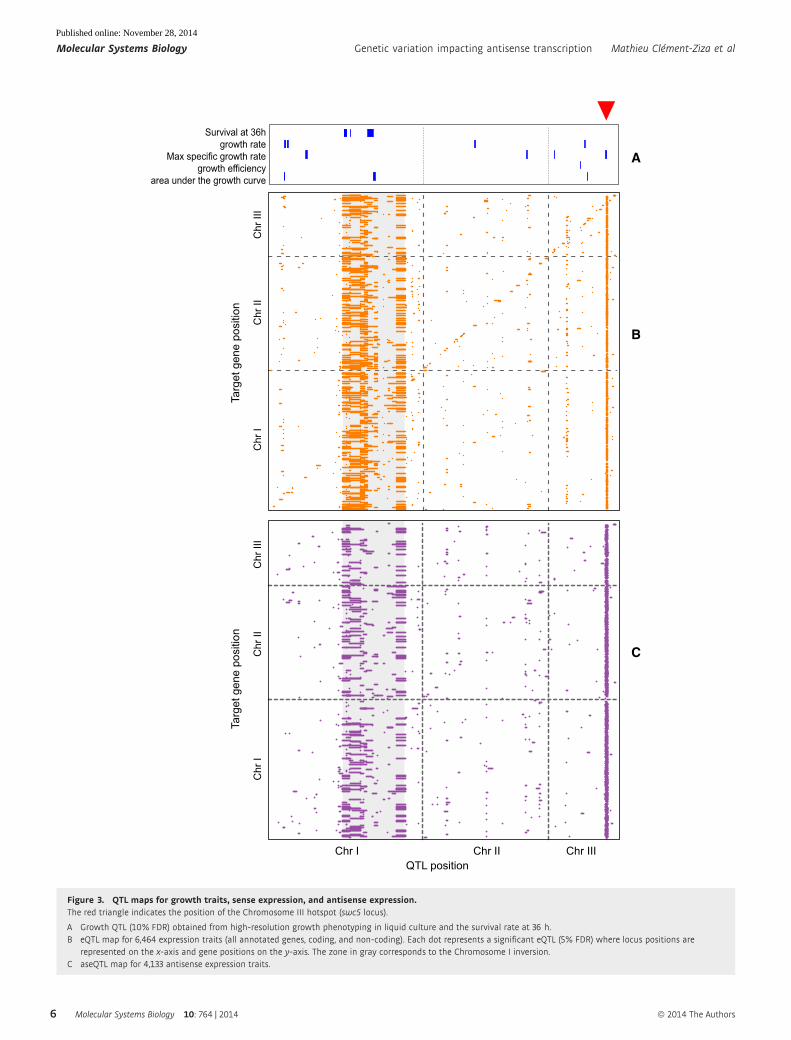
QTL detection
Next, we used the RNA-seq data from the 65 samples (derived from
44 distinct recombinant strains and the two parental strains,
Supplementary Table S2) to determine the expression levels of
6,464 coding and non-coding transcripts (Supplementary Dataset S4).
QTL mapping was done using a method that we previously devel-
oped (Michaelson et al, 2010). Because we noticed the presence of
population structure in the cross, the QTL mapping method was
improved to also account for population structure and missing geno-
type data (Materials and Methods). At an empirical false discovery
rate (FDR) of 5%, we detected 2,346 eQTLs that were linked to
2,179 transcripts, 682 of which were non-coding (Fig 3B, Supple-
mentary Datasets S10 and S11). Almost half of these eQTLs (1,040;
44%) had a FDR of < 1%, which underlines the high statistical
power of this study. We mapped the variation of antisense expres-
sion levels of 4,133 coding genes (Supplementary Dataset S5) to
genetic variation, resulting in an ‘antisense eQTL’ (aseQTL) study.
At 5% FDR, we detected 2,066 aseQTLs affecting 1,911 antisense
expression traits (Fig 3C, Supplementary Datasets S12 and S13).
QTLs were also found for all the growth traits measured (at a FDR
of 10%, Fig 3A, Supplementary Dataset S14).
Accounting for individual genomes improvestranscript quantification
In microarray-based expression studies, sequence variation in probe
regions can affect the hybridization efficiency. Because this leads to an
allele-specific signal bias, sequence variation can inflate the number of
false cis-eQTL calls (Alberts et al, 2007; Benovoy et al, 2008; Verdugo
et al, 2010). Notably, RNA-seq studies are neither immune to such arti-
facts (Degner et al, 2009) as transcript quantification usually involves
the mapping of sequence reads to a reference genome. Reads from indi-
viduals carrying the allele from the reference genome are more likely to
be mapped than reads from individuals carrying a polymorphic allele,
because alignment algorithms treat sequence differences as mismatches.
Such bias may lower the expression estimates of polymorphic alleles,
which would bias eQTL calls in a similar way as in microarray studies.
The effects of this potential artifact in whole-genome RNA-seq-based
eQTL mapping have not been investigated to our knowledge, presum-
ably because previous studies have used human samples where single-
base genotype information is often not available (Montgomery et al,
2010, 2011; Pickrell et al, 2010; Lalonde et al, 2011; Majewski &
Pastinen, 2011). However, such biases have already been noticed in the
framework of allele-specific expression in heterozygous diploid individ-
uals (Degner et al, 2009; Turro et al, 2011; Reddy et al, 2012; Satya
et al, 2012; Franzen et al, 2013; Pandey et al, 2013; Stevenson et al,
2013). As a solution to this problem, it has been proposed to mask or
exclude all or part of the polymorphic positions in the reference genome
prior to read-mapping (Degner et al, 2009; Stevenson et al, 2013), or to
use multi-mapping strategies (Turro et al, 2011; Satya et al, 2012).
In this study, haplotype information is available at single-base
resolution from the DNA sequencing of the parental strains. Thus,
we used our data to investigate potential biases caused by intragenic
polymorphisms by comparing the gene expression quantification
obtained from alignments to strain-specific genomes versus
the reference genome (Supplementary Information, Supplementary
Fig S8).
In order to initially explore the potential benefits of strain-
specific genome mapping, we simulated the sequencing of the
transcriptome of the two parental strains and of three segregants
and compared the accuracy of the expression quantification
obtained using strain-specific versus reference genome mapping.
Table 1. RNA-seq average statistics.
Average number of reads 22,372,046
Average mapping efficiency 45%
Average effective depth 37.5×
For detail see Supplementary Table S2.
ª 2014 The Authors Molecular Systems Biology 10: 764 | 2014
Mathieu Clément-Ziza et al Genetic variation impacting antisense transcription Molecular Systems Biology
3
Published online: November 28, 2014
RNA-seq reads were simulated taking natural variation into
account and in modeling sequencing errors. Considering all
simulations together, we detected 1,644 (5.1%) differentially
quantified expression traits. Moreover, as expected, the large
majority of the measurements were increased by strain-specific
genome mapping (98.3%, Supplementary Fig S9A). Next, we
compared the simulated gene expression measurements to the
input expression values. The expression obtained with strain-
specific genome mapping was closer to the input value for
89.7% of the traits differentially quantified. Furthermore, the
measurement error (absolute difference between the log-
transformed measured and input expression levels) was signifi-
cantly lower when using strain-specific genome mapping
(P < 2.2e-16, paired Kolmogorov–Smirnov test, Supplementary
Fig S9B). Although significant, the magnitude of the gains of
accuracy was small since the reduction of the measurement error
exceeded 10% in only 2.2% of the cases.
Next, we tested the effect of strain-specific genome mapping
on our real data (Supplementary Information, Supplementary Fig
S8). Indeed, most genes containing a polymorphism (92.6%)
968
Y0036
diploidmeiosis
46 haploid recombinants
DNA sequencing of the parental strains
RNA sequencing of the segregants
Align reads to the reference genome
Align reads to the reference genome
Iden�fica�on of all sequence variants
Call genotypes by comparison with parental variants
…TGCCTGA……TGCTTGA……TGCTTGA…
Build strain-specific genome and annota�on
Align RNA-seq reads to strain-specific
genome
Digital gene expression
quan�fica�on
…TGCTTGA……TGCCTGA…
JB50JB759
Gene
s
Segregants
ma�ng
eQTL analysis
Figure 1. Scheme of RNA-seq-based eQTL study.The Schizosaccharomyces pombe strain 986 (isogenic with standard laboratory strain) was crossed with an independent wild isolate (Y0036). Small genetic polymorphisms ofthe parental strains were almost exhaustively characterized through DNA sequencing. Segregant transcriptomes were quantified through RNA-seq. The RNA-seq datawere also used for the detection of sequence variations in the transcribed regions of segregants. Genotypes and haplotypes of the segregants were reconstructed bycomparing the identified genetic variants to the known variants of the parental strains (Materials and Methods). Subsequently, for each strain, we reconstructed its genomesequence based on the previously determined genotypes. The RNA-seq data were then re-mapped on these strain-specific genomes to avoid quantification biases dueto sequence variations. From these alignments, we extracted digital gene expression profiles that were used as traits for eQTL mapping.
Molecular Systems Biology 10: 764 | 2014 ª 2014 The Authors
Molecular Systems Biology Genetic variation impacting antisense transcription Mathieu Clément-Ziza et al
4
Published online: November 28, 2014
were differentially quantified in at least one sample (Fig 4A).
Moreover, as expected and similarly to what was observed with
simulated data, most of the affected measurements (98.3%, same
fraction as in simulations above) were increased by strain-
specific genome mapping (Fig 4B). Despite these artifacts, eQTL
detection was only marginally affected, possibly due to the small
genetic divergence between the progenitor strains (Discussion).
Taken together, these results show that aligning RNA-seq data
against individualized genomes marginally improves the
transcript quantification, while ignoring individual sequence
variation can inflate the number of falsely detected cis-eQTLs
(Supplementary Information).
trans-eQTLs greatly exceed cis-eQTLs in abundance
It is generally assumed that cis-eQTLs can be detected more easily
than trans-eQTLs (Ackermann et al, 2013; Schadt et al, 2003; Doss
et al, 2005; Gerrits et al, 2009; Holloway et al, 2011): First, because
direct effects on local genes are often stronger than indirect effects
and second, for the statistical reason that searching for trans-eQTLs
involves testing of a much larger number of hypotheses. Accord-
ingly, cis-eQTLs typically make up a large fraction of all detected
eQTLs: 15–50% for the microarray-based eQTL studies (Doss et al,
2005; Ronald et al, 2005; West et al, 2007; Breitling et al, 2008;
Ghazalpour et al, 2008; Atwell et al, 2010) or even 97.5–100% for
the existing RNA-seq-based eQTL studies (Montgomery et al, 2010,
2011; Pickrell et al, 2010; Sun, 2012; Battle et al, 2013). In contrast
to these previous studies, we detected a lower fraction of cis-eQTLs
(243 cis-eQTLs, 10.4% of all eQTLs, Fig 3B). This discrepancy with
previous work can be explained by several factors, but we think that
it results from the increased statistical power for detecting QTL,
which may have arisen from the experimental design, and/or our
experimental and analytic approaches (Discussion).
Non-coding RNA expression is strongly affected bygenetic variation
RNA-seq enables the quantification of entire transcriptomes, includ-
ing non-coding RNAs (ncRNAs) (Wilhelm et al, 2008; Wang et al,
2009; Costa et al, 2010; Marguerat & Bahler, 2010). We know little
about the extent to which variation of ncRNA levels can be
explained by natural genetic variation (Schadt et al, 2008;
Montgomery et al, 2010; Pickrell et al, 2010; Kumar et al, 2013).
The high sequencing depth used here and the extensive annotation
of the fission yeast genome enabled us to quantify transcript levels
for 1,428 annotated ncRNAs. Thus, this analysis presents the first
comparative eQTL mapping for coding versus non-coding transcript
levels at a genomic scale. We detected 753 significant (FDR < 0.05)
eQTLs that together affected the expression of 682 distinct ncRNAs.
Surprisingly, the fraction of ncRNAs targeted by at least one eQTL
was even higher than the respective fraction of coding RNAs
(47.8% versus 29.7%, respectively; enrichment for non-coding
0 Mb 1 Mb 2 Mb 3 Mb 4 Mb 5 Mb
968Y0036R1_1
R1_10R1_11R1_12R1_13R1_14R1_15R1_16R1_17R1_18R1_19
R1_2R1_20R1_21R1_22R1_23R1_24R1_25R1_26R1_27R1_28R1_29
R1_3R1_30R1_31R1_32R1_33R1_35R1_36R1_37R1_38R1_39
R1_4R1_40R1_41R1_42R1_43R1_47
R1_5R1_6R1_7R1_8R1_9
chromosomal inversionChromosome I
0 Mb 1 Mb 2 Mb 3 Mb 4 Mb
Chromosome II
0 Mb 1 Mb 2 Mb
Chromosome III
Figure 2. Genotype of strain library obtained through RNA-seq-based genotyping.Each row corresponds to one strain, with inherited markers shown across the three chromosomes. Blue bars are markers inherited from the 968 parent, red bars fromthe Y0036 parent, and black bars correspond to unknowns.
ª 2014 The Authors Molecular Systems Biology 10: 764 | 2014
Mathieu Clément-Ziza et al Genetic variation impacting antisense transcription Molecular Systems Biology
5
Published online: November 28, 2014
Survival at 36hgrowth rate
Max specific growth rategrowth efficiency
area under the growth curve
A
B
C
Targ
et g
ene
posi
tion
Targ
et g
ene
posi
tion
QTL position
Chr
IC
hr II
Chr
III
Chr I Chr II Chr III
Chr
IC
hr II
Chr
III
Figure 3. QTL maps for growth traits, sense expression, and antisense expression.The red triangle indicates the position of the Chromosome III hotspot (swc5 locus).
A Growth QTL (10% FDR) obtained from high-resolution growth phenotyping in liquid culture and the survival rate at 36 h.B eQTL map for 6,464 expression traits (all annotated genes, coding, and non-coding). Each dot represents a significant eQTL (5% FDR) where locus positions are
represented on the x-axis and gene positions on the y-axis. The zone in gray corresponds to the Chromosome I inversion.C aseQTL map for 4,133 antisense expression traits.
Molecular Systems Biology 10: 764 | 2014 ª 2014 The Authors
Molecular Systems Biology Genetic variation impacting antisense transcription Mathieu Clément-Ziza et al
6
Published online: November 28, 2014
genes among eQTL targets P < 2.2e-16, one-sided Fisher’s exact
test). To rule out that only a small number of loci affecting many
ncRNAs are responsible for this trend, we re-computed these frac-
tions after excluding all eQTL hotspots (see below) and the Chromo-
some I inversion. The trend remained the same, although the
difference was not statistically significant anymore (7.2% versus
6.3%, respectively, P = 0.14, one-sided Fisher’s exact test). Finally,
we noticed that the ncRNAs were significantly more often affected
by cis-eQTLs than coding RNAs (3.2 and 5.7% cis-eQTL for coding
and non-coding RNAs, respectively, P = 2.54e-05, one-sided Fisher’s
exact test). Altogether, these findings indicate that the expression of
non-coding RNAs is at least as much affected by genetic variation as
the expression of protein-coding RNAs.
To further investigate the importance of non-coding RNAs as
effectors of eQTLs, we predicted the most likely causal gene for each
eQTL (Supplementary Dataset S11). We noticed that ncRNAs were
enriched among the genes predicted as being most likely causal
(31.2% of the predicted causal genes were ncRNAs, whereas 21.7%
of all genes at eQTL are ncRNA; P < 10�15, Fisher’s exact test). This
result suggests that non-coding RNAs substantially contribute as
effectors of the genetic variation of gene expression. Note that we
identified 12 trans-linkages that involved eQTL containing either no
genes or only non-coding genes. Those cases (Supplementary Data-
set S15) constitute a set of eQTL where the causal gene is most
likely non-coding.
eQTL and aseQTL hotspots
Loci affecting gene expression in eQTL studies are non-randomly
distributed in the genome: A few ‘hotspot’ loci can regulate the
expression of numerous genes (Brem et al, 2002; Ghazalpour et al,
2008; Atwell et al, 2010). We identified 8 genomic regions signifi-
cantly enriched for eQTLs (Fig 3B, Supplementary Fig S10A, Supple-
mentary Table S3). These hotspots were robust with respect to
different strategies for normalization of the expression measurements
and different FDR cutoffs, suggesting that they do not represent
statistical artifacts (Supplementary Fig S10B; Wang et al, 2007;
Williams, 2006). Moreover, the method that we used to assess the
significance of QTL follows a previously suggested principle for
preventing the detection of spurious QTL hotspots (Breitling et al,
2008). Four hotspots were located in the region of the Chromosome I
inversion, and eQTLs in this region together targeted 44% of all
transcripts affected by any eQTL (950 out of 2,179). Thus, this large
inversion has a strong influence on the expression of many genes
(Supplementary Information, Supplementary Fig S10A). Four out
of eight eQTL hotspots were also aseQTL hotspots (Supplementary
Fig S10A, Supplementary Table S3). Further, the eQTL hotspots 1,
2, 4, and 8 were also QTL for several growth traits (Fig 3). This
result further suggests that the eQTL mapping and hotspot
detection results are not statistical artifacts, since the growth traits
represent independently measured phenotypes.
Functional enrichment analysis revealed hotspot-specific func-
tions enriched among the target genes (Supplementary Tables S3
and S4). Targets of hotspot 1 were enriched for ribosome biogenesis
(Supplementary Table S3). The same hotspot also affected a growth
trait (growth rate). Ribosome biogenesis has been shown to play an
important role in growth via the Tor pathway (Schmelzle & Hall,
2000; Mayer & Grummt, 2006). Hotspot 2, linked to genes enriched
for stress response (Supplementary Table S3), is also linked to
survival in stationary phase. The importance of molecular stress
response for aging and survival is well established in diverse
species, including fission yeast (Sohal & Weindruch, 1996; Zuin
et al, 2010). Taken together, these results highlight the utility of this
fission yeast library for studying the relationships between molecu-
lar and macroscopic traits.
A frameshift in swc5 causes major eQTL hotspot
Whereas several hypotheses could explain the strong impact of the
inversion on Chromosome I on gene expression (Supplementary
0 5 10 15 20 25
−1
0
1
average quantification
log2
(SSG
RG
)
0.16 %
90.85 %
8.99 %genes containingpolymorphisms
137
1705
51
genes differentiallyquantified
A B
Figure 4. Accounting for individual genomes affects expression quantification.
A Venn diagram showing the overlap between genes with at least one polymorphism and genes differentially quantified in at least one sample when mapping againstthe strain-specific genome (SSG) as compared to mapping against the reference genome (RG).
B Comparison of expression quantification measurements obtained by the SSG and RG mapping strategies. Green (red): measurements quantified higher (lower) usingSSG versus RG. Color intensities reflect the density of points. The vertical line denotes the median gene expression.
ª 2014 The Authors Molecular Systems Biology 10: 764 | 2014
Mathieu Clément-Ziza et al Genetic variation impacting antisense transcription Molecular Systems Biology
7
Published online: November 28, 2014
Information), the cause of a second major hotspot on
Chromosome III was not immediately apparent. This other eQTL
hotspot (hotspot 8), influenced the expression of 871 genes
(Supplementary Fig S10A, Supplementary Table S3). This hotspot
was also the strongest aseQTL hotspot. It was linked to 1,384
antisense traits, that is, it is affecting antisense transcription even
more than sense transcription. To our knowledge, hotspot 8
shows more widespread gene expression effects than any other
hotspot reported so far (note that the effect of the Chromosome I
inversion is spread over several loci). It has been discussed that
eQTL hotspots, especially the strongest ones, can constitute arti-
facts (Williams, 2006; Wang et al, 2007; Breitling et al, 2008).
Here, two lines of evidence suggest that hotspot 8 represents a
true biological event: (i) This hotspot was also linked to cellular
growth, that is, an independent and distinct trait (Fig 3); and (ii)
it was robust to the application of different normalization strate-
gies (Supplementary Fig S10B), which is notable as insufficient
correction for confounding factors is believed to be a major
source of false eQTL hotspots (Williams, 2006; Michaelson et al,
2010).
Because of its extraordinary strength, we wanted to unravel the
molecular cause of hotspot 8. In previous eQTLs studies, the
genetic variations explaining eQTL hotspots were often deletions
of entire genes or mutations in the coding sequence of genes
resulting in de facto knockouts (Brem & Kruglyak, 2005; Keurentjes
et al, 2007; Breitling et al, 2008; Foss et al, 2011). Therefore, we
focused our attention on non-silent polymorphisms within the
hotspot region (Supplementary Fig S11). Six protein-coding genes
in this region were affected, five of them through amino acid
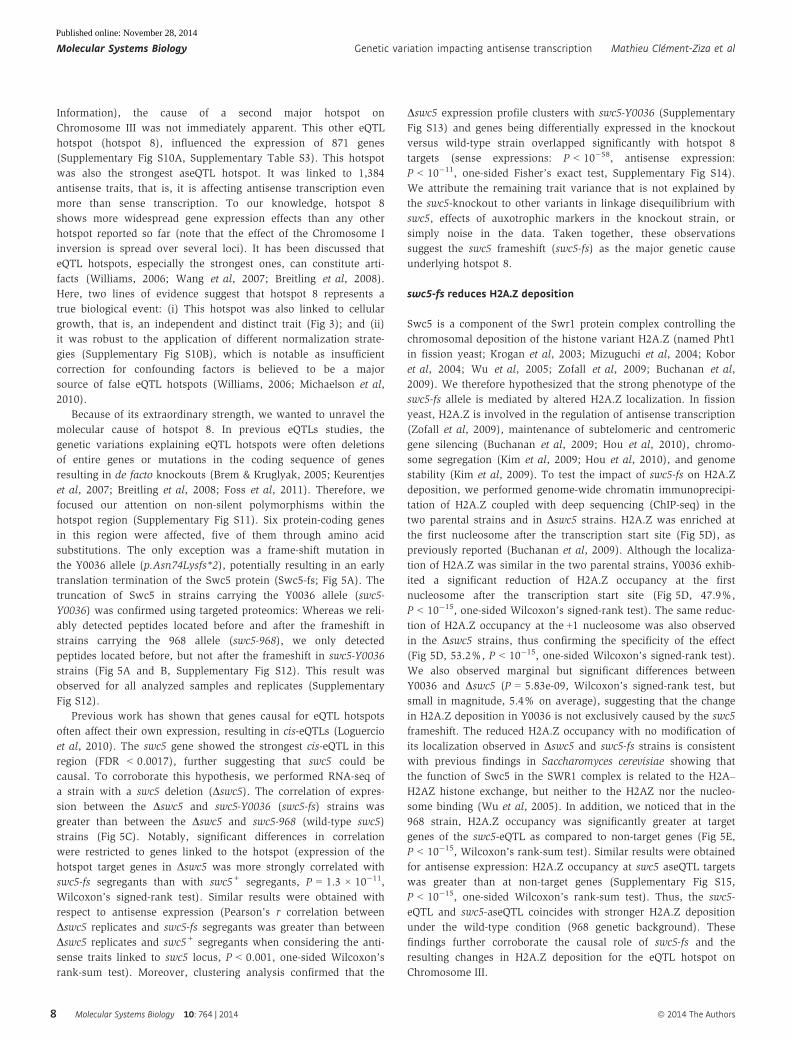
substitutions. The only exception was a frame-shift mutation in
the Y0036 allele (p.Asn74Lysfs*2), potentially resulting in an early
translation termination of the Swc5 protein (Swc5-fs; Fig 5A). The
truncation of Swc5 in strains carrying the Y0036 allele (swc5-
Y0036) was confirmed using targeted proteomics: Whereas we reli-
ably detected peptides located before and after the frameshift in
strains carrying the 968 allele (swc5-968), we only detected
peptides located before, but not after the frameshift in swc5-Y0036
strains (Fig 5A and B, Supplementary Fig S12). This result was
observed for all analyzed samples and replicates (Supplementary
Fig S12).
Previous work has shown that genes causal for eQTL hotspots
often affect their own expression, resulting in cis-eQTLs (Loguercio
et al, 2010). The swc5 gene showed the strongest cis-eQTL in this
region (FDR < 0.0017), further suggesting that swc5 could be
causal. To corroborate this hypothesis, we performed RNA-seq of
a strain with a swc5 deletion (Dswc5). The correlation of expres-
sion between the Dswc5 and swc5-Y0036 (swc5-fs) strains was
greater than between the Dswc5 and swc5-968 (wild-type swc5)
strains (Fig 5C). Notably, significant differences in correlation
were restricted to genes linked to the hotspot (expression of the
hotspot target genes in Dswc5 was more strongly correlated with
swc5-fs segregants than with swc5+ segregants, P = 1.3 × 10�11,
Wilcoxon’s signed-rank test). Similar results were obtained with
respect to antisense expression (Pearson’s r correlation between
Dswc5 replicates and swc5-fs segregants was greater than between
Dswc5 replicates and swc5+ segregants when considering the anti-
sense traits linked to swc5 locus, P < 0.001, one-sided Wilcoxon’s
rank-sum test). Moreover, clustering analysis confirmed that the
Dswc5 expression profile clusters with swc5-Y0036 (Supplementary
Fig S13) and genes being differentially expressed in the knockout
versus wild-type strain overlapped significantly with hotspot 8
targets (sense expressions: P < 10�58, antisense expression:
P < 10�11, one-sided Fisher’s exact test, Supplementary Fig S14).
We attribute the remaining trait variance that is not explained by
the swc5-knockout to other variants in linkage disequilibrium with
swc5, effects of auxotrophic markers in the knockout strain, or
simply noise in the data. Taken together, these observations
suggest the swc5 frameshift (swc5-fs) as the major genetic cause
underlying hotspot 8.
swc5-fs reduces H2A.Z deposition
Swc5 is a component of the Swr1 protein complex controlling the
chromosomal deposition of the histone variant H2A.Z (named Pht1
in fission yeast; Krogan et al, 2003; Mizuguchi et al, 2004; Kobor
et al, 2004; Wu et al, 2005; Zofall et al, 2009; Buchanan et al,
2009). We therefore hypothesized that the strong phenotype of the
swc5-fs allele is mediated by altered H2A.Z localization. In fission
yeast, H2A.Z is involved in the regulation of antisense transcription
(Zofall et al, 2009), maintenance of subtelomeric and centromeric
gene silencing (Buchanan et al, 2009; Hou et al, 2010), chromo-
some segregation (Kim et al, 2009; Hou et al, 2010), and genome
stability (Kim et al, 2009). To test the impact of swc5-fs on H2A.Z
deposition, we performed genome-wide chromatin immunoprecipi-
tation of H2A.Z coupled with deep sequencing (ChIP-seq) in the
two parental strains and in Dswc5 strains. H2A.Z was enriched at
the first nucleosome after the transcription start site (Fig 5D), as
previously reported (Buchanan et al, 2009). Although the localiza-
tion of H2A.Z was similar in the two parental strains, Y0036 exhib-
ited a significant reduction of H2A.Z occupancy at the first
nucleosome after the transcription start site (Fig 5D, 47.9%,
P < 10�15, one-sided Wilcoxon’s signed-rank test). The same reduc-
tion of H2A.Z occupancy at the +1 nucleosome was also observed
in the Dswc5 strains, thus confirming the specificity of the effect
(Fig 5D, 53.2%, P < 10�15, one-sided Wilcoxon’s signed-rank test).
We also observed marginal but significant differences between
Y0036 and Dswc5 (P = 5.83e-09, Wilcoxon’s signed-rank test, but
small in magnitude, 5.4% on average), suggesting that the change
in H2A.Z deposition in Y0036 is not exclusively caused by the swc5
frameshift. The reduced H2A.Z occupancy with no modification of
its localization observed in Dswc5 and swc5-fs strains is consistent
with previous findings in Saccharomyces cerevisiae showing that
the function of Swc5 in the SWR1 complex is related to the H2A–
H2AZ histone exchange, but neither to the H2AZ nor the nucleo-
some binding (Wu et al, 2005). In addition, we noticed that in the
968 strain, H2A.Z occupancy was significantly greater at target
genes of the swc5-eQTL as compared to non-target genes (Fig 5E,
P < 10�15, Wilcoxon’s rank-sum test). Similar results were obtained
for antisense expression: H2A.Z occupancy at swc5 aseQTL targets
was greater than at non-target genes (Supplementary Fig S15,
P < 10�15, one-sided Wilcoxon’s rank-sum test). Thus, the swc5-
eQTL and swc5-aseQTL coincides with stronger H2A.Z deposition
under the wild-type condition (968 genetic background). These
findings further corroborate the causal role of swc5-fs and the
resulting changes in H2A.Z deposition for the eQTL hotspot on
Chromosome III.
Molecular Systems Biology 10: 764 | 2014 ª 2014 The Authors
Molecular Systems Biology Genetic variation impacting antisense transcription Mathieu Clément-Ziza et al
8
Published online: November 28, 2014
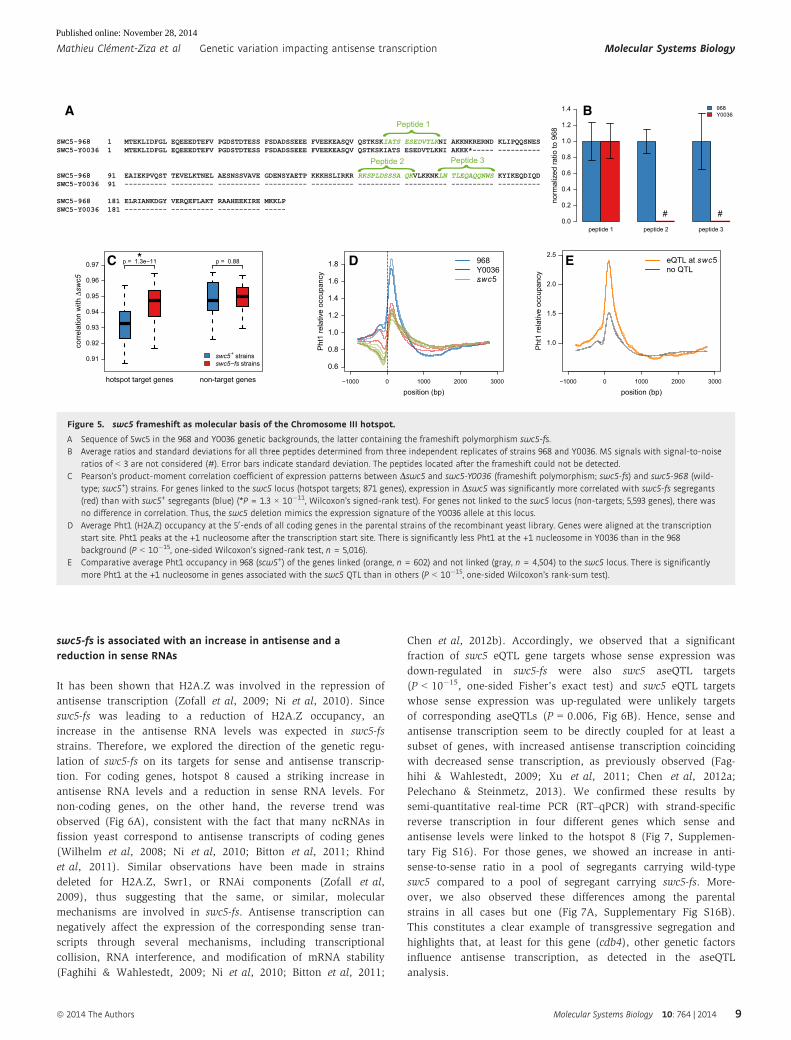
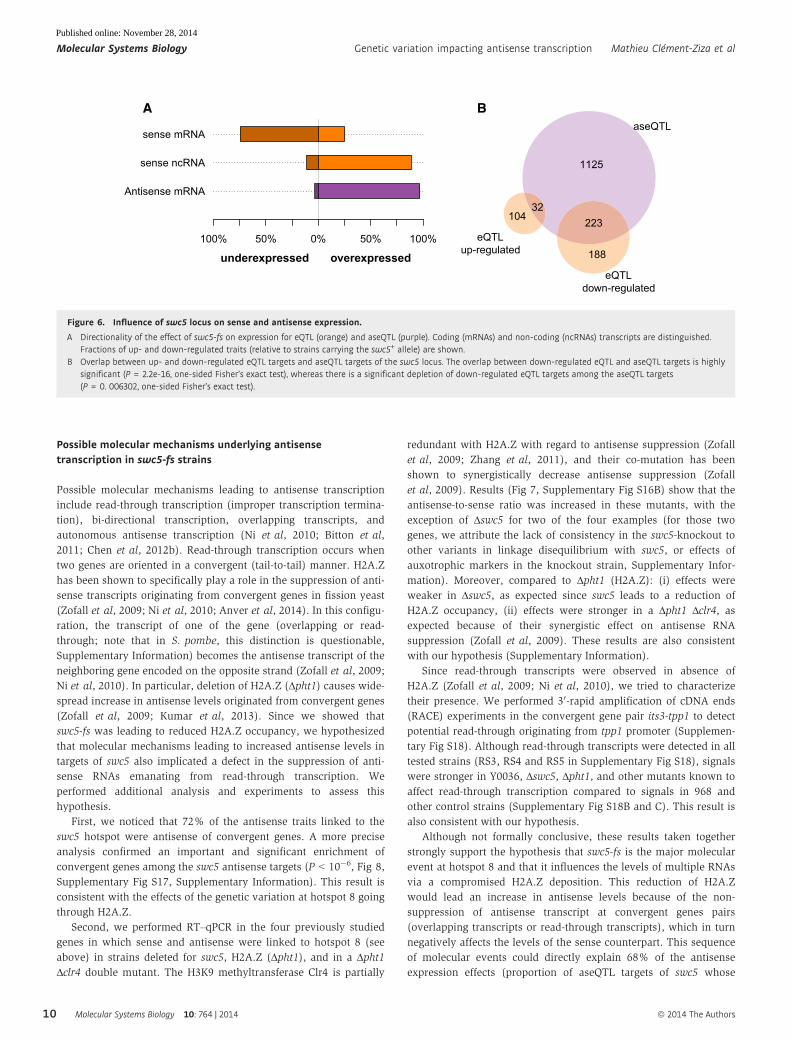
swc5-fs is associated with an increase in antisense and areduction in sense RNAs
It has been shown that H2A.Z was involved in the repression of
antisense transcription (Zofall et al, 2009; Ni et al, 2010). Since
swc5-fs was leading to a reduction of H2A.Z occupancy, an
increase in the antisense RNA levels was expected in swc5-fs
strains. Therefore, we explored the direction of the genetic regu-
lation of swc5-fs on its targets for sense and antisense transcrip-
tion. For coding genes, hotspot 8 caused a striking increase in
antisense RNA levels and a reduction in sense RNA levels. For
non-coding genes, on the other hand, the reverse trend was
observed (Fig 6A), consistent with the fact that many ncRNAs in
fission yeast correspond to antisense transcripts of coding genes
(Wilhelm et al, 2008; Ni et al, 2010; Bitton et al, 2011; Rhind
et al, 2011). Similar observations have been made in strains
deleted for H2A.Z, Swr1, or RNAi components (Zofall et al,
2009), thus suggesting that the same, or similar, molecular
mechanisms are involved in swc5-fs. Antisense transcription can
negatively affect the expression of the corresponding sense tran-
scripts through several mechanisms, including transcriptional
collision, RNA interference, and modification of mRNA stability
(Faghihi & Wahlestedt, 2009; Ni et al, 2010; Bitton et al, 2011;
Chen et al, 2012b). Accordingly, we observed that a significant
fraction of swc5 eQTL gene targets whose sense expression was
down-regulated in swc5-fs were also swc5 aseQTL targets
(P < 10�15, one-sided Fisher’s exact test) and swc5 eQTL targets
whose sense expression was up-regulated were unlikely targets
of corresponding aseQTLs (P = 0.006, Fig 6B). Hence, sense and
antisense transcription seem to be directly coupled for at least a
subset of genes, with increased antisense transcription coinciding
with decreased sense transcription, as previously observed (Fag-
hihi & Wahlestedt, 2009; Xu et al, 2011; Chen et al, 2012a;
Pelechano & Steinmetz, 2013). We confirmed these results by
semi-quantitative real-time PCR (RT–qPCR) with strand-specific
reverse transcription in four different genes which sense and
antisense levels were linked to the hotspot 8 (Fig 7, Supplemen-
tary Fig S16). For those genes, we showed an increase in anti-
sense-to-sense ratio in a pool of segregants carrying wild-type
swc5 compared to a pool of segregant carrying swc5-fs. More-
over, we also observed these differences among the parental
strains in all cases but one (Fig 7A, Supplementary Fig S16B).
This constitutes a clear example of transgressive segregation and
highlights that, at least for this gene (cdb4), other genetic factors
influence antisense transcription, as detected in the aseQTL
analysis.
SWC5-968 1 MTEKLIDFGL EQEEEDTEFV PGDSTDTESS FSDADSSEEE FVEEKEASQV QSTKSKIATS ESEDVTLKNI AKKNKRERND KLIPQQSNESSWC5-Y0036 1 MTEKLIDFGL EQEEEDTEFV PGDSTDTESS FSDADSSEEE FVEEKEASQV QSTKSKIATS ESEDVTLKNI AKKK*----- ----------
SWC5-968 91 EAIEKPVQST TEVELKTNEL AESNSSVAVE GDENSYAETP KKKHSLIRKR RKSPLDSSSA QKVLKKNKLN TLEQAQQNWS KYIKEQDIQDSWC5-Y0036 91 ---------- ---------- ---------- ---------- ---------- ---------- ---------- ---------- ----------
SWC5-968 181 ELRIANKDGY VERQEFLAKT RAAHEEKIRE MKKLPSWC5-Y0036 181 ---------- ---------- ---------- -----
{ Peptide 1{ Peptide 2
{ Peptide 3
0.6
0.8
1.0
1.2
1.4
1.6
1.8
position (bp)
Pht
1 re
lativ
e oc
cupa
ncy
−1000 0 1000 2000 3000
968Y0036..swc5
peptide 1 peptide 2 peptide 3
norm
aliz
ed ra
tio to
968
0.0
0.2
0.4
0.6
0.8
1.0
1.2
1.4
# #
968Y0036A B
C D E
0.91
0.92
0.93
0.94
0.95
0.96
0.97
corr
elat
ion
with
Δswc5
hotspot target genes non-target genes
*p = 1.3e−11 p = 0.88
swc5+ strainsswc5−fs strains
1.0
1.5
2.0
2.5
position (bp)
Pht
1 re
lativ
e oc
cupa
ncy
eQTL at swc5no QTL
−1000 0 1000 2000 3000
Figure 5. swc5 frameshift as molecular basis of the Chromosome III hotspot.
A Sequence of Swc5 in the 968 and Y0036 genetic backgrounds, the latter containing the frameshift polymorphism swc5-fs.B Average ratios and standard deviations for all three peptides determined from three independent replicates of strains 968 and Y0036. MS signals with signal-to-noise
ratios of < 3 are not considered (#). Error bars indicate standard deviation. The peptides located after the frameshift could not be detected.C Pearson’s product-moment correlation coefficient of expression patterns between Dswc5 and swc5-Y0036 (frameshift polymorphism; swc5-fs) and swc5-968 (wild-
type; swc5+) strains. For genes linked to the swc5 locus (hotspot targets; 871 genes), expression in Dswc5 was significantly more correlated with swc5-fs segregants(red) than with swc5+ segregants (blue) (*P = 1.3 × 10�11, Wilcoxon’s signed-rank test). For genes not linked to the swc5 locus (non-targets; 5,593 genes), there wasno difference in correlation. Thus, the swc5 deletion mimics the expression signature of the Y0036 allele at this locus.
D Average Pht1 (H2A.Z) occupancy at the 50-ends of all coding genes in the parental strains of the recombinant yeast library. Genes were aligned at the transcriptionstart site. Pht1 peaks at the +1 nucleosome after the transcription start site. There is significantly less Pht1 at the +1 nucleosome in Y0036 than in the 968background (P < 10�15, one-sided Wilcoxon’s signed-rank test, n = 5,016).
E Comparative average Pht1 occupancy in 968 (scw5+) of the genes linked (orange, n = 602) and not linked (gray, n = 4,504) to the swc5 locus. There is significantlymore Pht1 at the +1 nucleosome in genes associated with the swc5 QTL than in others (P < 10�15, one-sided Wilcoxon’s rank-sum test).
ª 2014 The Authors Molecular Systems Biology 10: 764 | 2014
Mathieu Clément-Ziza et al Genetic variation impacting antisense transcription Molecular Systems Biology
9
Published online: November 28, 2014
Possible molecular mechanisms underlying antisensetranscription in swc5-fs strains
Possible molecular mechanisms leading to antisense transcription
include read-through transcription (improper transcription termina-
tion), bi-directional transcription, overlapping transcripts, and
autonomous antisense transcription (Ni et al, 2010; Bitton et al,
2011; Chen et al, 2012b). Read-through transcription occurs when
two genes are oriented in a convergent (tail-to-tail) manner. H2A.Z
has been shown to specifically play a role in the suppression of anti-
sense transcripts originating from convergent genes in fission yeast
(Zofall et al, 2009; Ni et al, 2010; Anver et al, 2014). In this configu-
ration, the transcript of one of the gene (overlapping or read-
through; note that in S. pombe, this distinction is questionable,
Supplementary Information) becomes the antisense transcript of the
neighboring gene encoded on the opposite strand (Zofall et al, 2009;
Ni et al, 2010). In particular, deletion of H2A.Z (Δpht1) causes wide-
spread increase in antisense levels originated from convergent genes
(Zofall et al, 2009; Kumar et al, 2013). Since we showed that
swc5-fs was leading to reduced H2A.Z occupancy, we hypothesized
that molecular mechanisms leading to increased antisense levels in
targets of swc5 also implicated a defect in the suppression of anti-
sense RNAs emanating from read-through transcription. We
performed additional analysis and experiments to assess this
hypothesis.
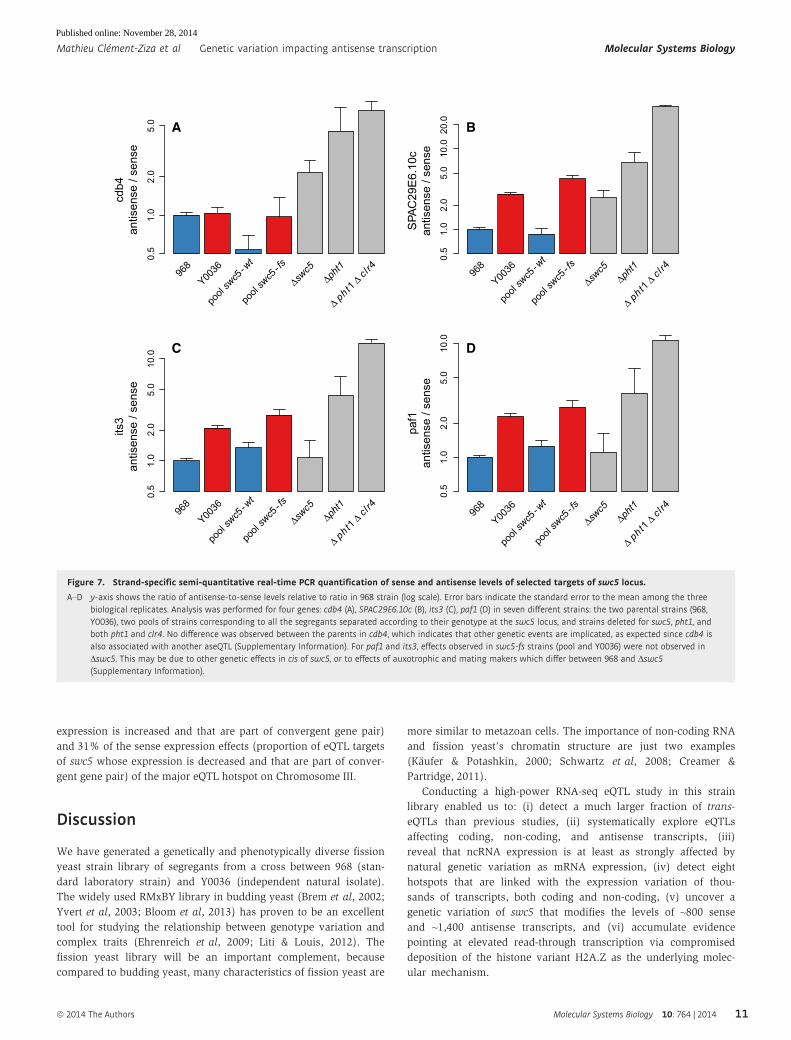
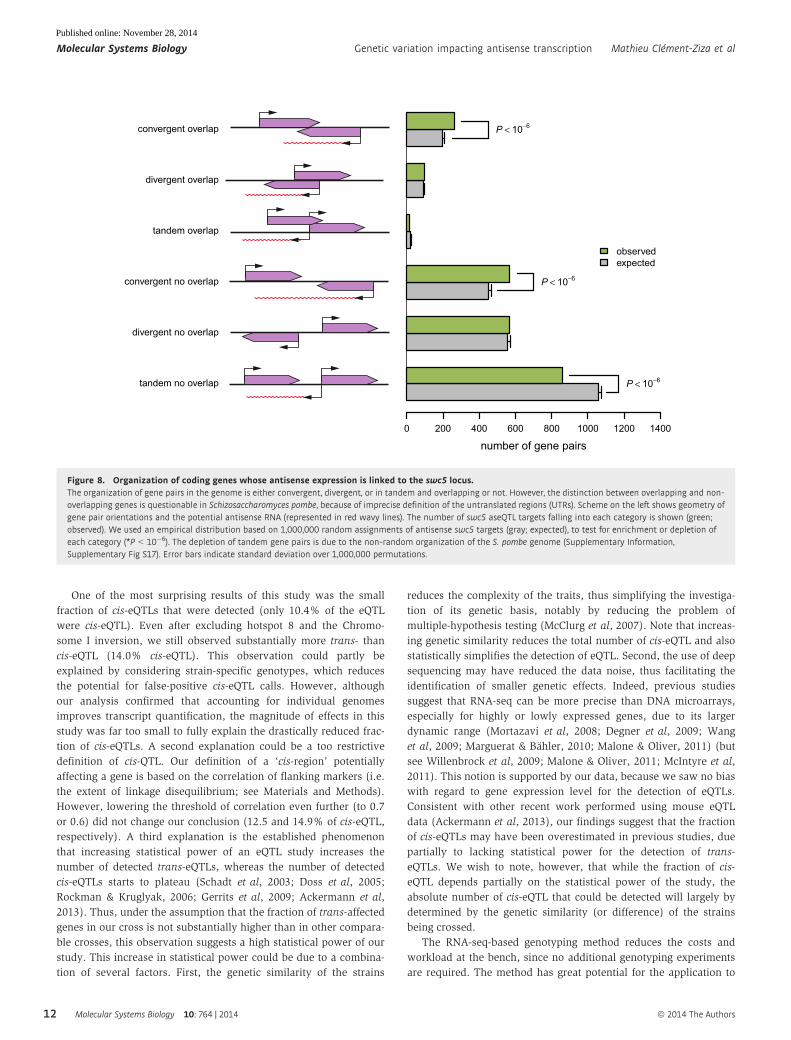
First, we noticed that 72% of the antisense traits linked to the
swc5 hotspot were antisense of convergent genes. A more precise
analysis confirmed an important and significant enrichment of
convergent genes among the swc5 antisense targets (P < 10�6, Fig 8,
Supplementary Fig S17, Supplementary Information). This result is
consistent with the effects of the genetic variation at hotspot 8 going
through H2A.Z.
Second, we performed RT–qPCR in the four previously studied
genes in which sense and antisense were linked to hotspot 8 (see
above) in strains deleted for swc5, H2A.Z (Δpht1), and in a Δpht1Δclr4 double mutant. The H3K9 methyltransferase Clr4 is partially
redundant with H2A.Z with regard to antisense suppression (Zofall
et al, 2009; Zhang et al, 2011), and their co-mutation has been
shown to synergistically decrease antisense suppression (Zofall
et al, 2009). Results (Fig 7, Supplementary Fig S16B) show that the
antisense-to-sense ratio was increased in these mutants, with the
exception of Δswc5 for two of the four examples (for those two
genes, we attribute the lack of consistency in the swc5-knockout to
other variants in linkage disequilibrium with swc5, or effects of
auxotrophic markers in the knockout strain, Supplementary Infor-
mation). Moreover, compared to Δpht1 (H2A.Z): (i) effects were
weaker in Δswc5, as expected since swc5 leads to a reduction of
H2A.Z occupancy, (ii) effects were stronger in a Δpht1 Δclr4, as
expected because of their synergistic effect on antisense RNA
suppression (Zofall et al, 2009). These results are also consistent
with our hypothesis (Supplementary Information).
Since read-through transcripts were observed in absence of
H2A.Z (Zofall et al, 2009; Ni et al, 2010), we tried to characterize
their presence. We performed 30-rapid amplification of cDNA ends
(RACE) experiments in the convergent gene pair its3-tpp1 to detect
potential read-through originating from tpp1 promoter (Supplemen-
tary Fig S18). Although read-through transcripts were detected in all
tested strains (RS3, RS4 and RS5 in Supplementary Fig S18), signals
were stronger in Y0036, Δswc5, Δpht1, and other mutants known to
affect read-through transcription compared to signals in 968 and
other control strains (Supplementary Fig S18B and C). This result is
also consistent with our hypothesis.
Although not formally conclusive, these results taken together
strongly support the hypothesis that swc5-fs is the major molecular
event at hotspot 8 and that it influences the levels of multiple RNAs
via a compromised H2A.Z deposition. This reduction of H2A.Z
would lead an increase in antisense levels because of the non-
suppression of antisense transcript at convergent genes pairs
(overlapping transcripts or read-through transcripts), which in turn
negatively affects the levels of the sense counterpart. This sequence
of molecular events could directly explain 68% of the antisense
expression effects (proportion of aseQTL targets of swc5 whose
A B
Antisense mRNA
sense ncRNA
sense mRNA
100% 50% 0% 50% 100%
underexpressed overexpressed
223
188
10432
1125
aseQTL
eQTLup-regulated
eQTLdown-regulated
Figure 6. Influence of swc5 locus on sense and antisense expression.
A Directionality of the effect of swc5-fs on expression for eQTL (orange) and aseQTL (purple). Coding (mRNAs) and non-coding (ncRNAs) transcripts are distinguished.Fractions of up- and down-regulated traits (relative to strains carrying the swc5+ allele) are shown.
B Overlap between up- and down-regulated eQTL targets and aseQTL targets of the swc5 locus. The overlap between down-regulated eQTL and aseQTL targets is highlysignificant (P = 2.2e-16, one-sided Fisher’s exact test), whereas there is a significant depletion of down-regulated eQTL targets among the aseQTL targets(P = 0. 006302, one-sided Fisher’s exact test).
Molecular Systems Biology 10: 764 | 2014 ª 2014 The Authors
Molecular Systems Biology Genetic variation impacting antisense transcription Mathieu Clément-Ziza et al
10
Published online: November 28, 2014
expression is increased and that are part of convergent gene pair)
and 31% of the sense expression effects (proportion of eQTL targets
of swc5 whose expression is decreased and that are part of conver-
gent gene pair) of the major eQTL hotspot on Chromosome III.
Discussion
We have generated a genetically and phenotypically diverse fission
yeast strain library of segregants from a cross between 968 (stan-
dard laboratory strain) and Y0036 (independent natural isolate).
The widely used RMxBY library in budding yeast (Brem et al, 2002;
Yvert et al, 2003; Bloom et al, 2013) has proven to be an excellent
tool for studying the relationship between genotype variation and
complex traits (Ehrenreich et al, 2009; Liti & Louis, 2012). The
fission yeast library will be an important complement, because
compared to budding yeast, many characteristics of fission yeast are
more similar to metazoan cells. The importance of non-coding RNA
and fission yeast’s chromatin structure are just two examples
(Kaufer & Potashkin, 2000; Schwartz et al, 2008; Creamer &
Partridge, 2011).
Conducting a high-power RNA-seq eQTL study in this strain
library enabled us to: (i) detect a much larger fraction of trans-
eQTLs than previous studies, (ii) systematically explore eQTLs
affecting coding, non-coding, and antisense transcripts, (iii)
reveal that ncRNA expression is at least as strongly affected by
natural genetic variation as mRNA expression, (iv) detect eight
hotspots that are linked with the expression variation of thou-
sands of transcripts, both coding and non-coding, (v) uncover a
genetic variation of swc5 that modifies the levels of ~800 sense
and ~1,400 antisense transcripts, and (vi) accumulate evidence
pointing at elevated read-through transcription via compromised
deposition of the histone variant H2A.Z as the underlying molec-
ular mechanism.
0.5
1.0
2.0
5.0
cdb4
antis
ense
/ se
nse
968
Y0036
Δswc5
Δpht1
Δ pht
1 Δ cl r4
0.5
1.0
2.0
5.0
10.0
20.0
SPA
C29
E6.
10c
antis
ense
/ se
nse
968
Y0036
pool swc5
- wt
pool swc5
- wt
pool swc5
- fs
pool swc5
- fs
pool swc5
- wt
pool swc5
- fs
pool swc5
- wt
pool swc5
- fs
Δswc5
Δpht1
Δ pht
1 Δ cl r4
0.5
1.0
2.0
5.0
10.0
its3
antis
ense
/ se
nse
968
Y0036
Δswc5
Δpht1
Δ pht
1 Δ cl r4
0.5
1.0
2.0
5.0
10.0
paf1
antis
ense
/ se
nse
968
Y0036
Δswc5
Δpht1
Δ pht
1 Δ cl r4
A B
C D
Figure 7. Strand-specific semi-quantitative real-time PCR quantification of sense and antisense levels of selected targets of swc5 locus.
A–D y-axis shows the ratio of antisense-to-sense levels relative to ratio in 968 strain (log scale). Error bars indicate the standard error to the mean among the threebiological replicates. Analysis was performed for four genes: cdb4 (A), SPAC29E6.10c (B), its3 (C), paf1 (D) in seven different strains: the two parental strains (968,Y0036), two pools of strains corresponding to all the segregants separated according to their genotype at the swc5 locus, and strains deleted for swc5, pht1, andboth pht1 and clr4. No difference was observed between the parents in cdb4, which indicates that other genetic events are implicated, as expected since cdb4 isalso associated with another aseQTL (Supplementary Information). For paf1 and its3, effects observed in swc5-fs strains (pool and Y0036) were not observed inΔswc5. This may be due to other genetic effects in cis of swc5, or to effects of auxotrophic and mating makers which differ between 968 and Δswc5(Supplementary Information).
ª 2014 The Authors Molecular Systems Biology 10: 764 | 2014
Mathieu Clément-Ziza et al Genetic variation impacting antisense transcription Molecular Systems Biology
11
Published online: November 28, 2014
One of the most surprising results of this study was the small
fraction of cis-eQTLs that were detected (only 10.4% of the eQTL
were cis-eQTL). Even after excluding hotspot 8 and the Chromo-
some I inversion, we still observed substantially more trans- than
cis-eQTL (14.0% cis-eQTL). This observation could partly be
explained by considering strain-specific genotypes, which reduces
the potential for false-positive cis-eQTL calls. However, although
our analysis confirmed that accounting for individual genomes
improves transcript quantification, the magnitude of effects in this
study was far too small to fully explain the drastically reduced frac-
tion of cis-eQTLs. A second explanation could be a too restrictive
definition of cis-QTL. Our definition of a ‘cis-region’ potentially
affecting a gene is based on the correlation of flanking markers (i.e.
the extent of linkage disequilibrium; see Materials and Methods).
However, lowering the threshold of correlation even further (to 0.7
or 0.6) did not change our conclusion (12.5 and 14.9% of cis-eQTL,
respectively). A third explanation is the established phenomenon
that increasing statistical power of an eQTL study increases the
number of detected trans-eQTLs, whereas the number of detected
cis-eQTLs starts to plateau (Schadt et al, 2003; Doss et al, 2005;
Rockman & Kruglyak, 2006; Gerrits et al, 2009; Ackermann et al,
2013). Thus, under the assumption that the fraction of trans-affected
genes in our cross is not substantially higher than in other compara-
ble crosses, this observation suggests a high statistical power of our
study. This increase in statistical power could be due to a combina-
tion of several factors. First, the genetic similarity of the strains
reduces the complexity of the traits, thus simplifying the investiga-
tion of its genetic basis, notably by reducing the problem of
multiple-hypothesis testing (McClurg et al, 2007). Note that increas-
ing genetic similarity reduces the total number of cis-eQTL and also
statistically simplifies the detection of eQTL. Second, the use of deep
sequencing may have reduced the data noise, thus facilitating the
identification of smaller genetic effects. Indeed, previous studies
suggest that RNA-seq can be more precise than DNA microarrays,
especially for highly or lowly expressed genes, due to its larger
dynamic range (Mortazavi et al, 2008; Degner et al, 2009; Wang
et al, 2009; Marguerat & Bahler, 2010; Malone & Oliver, 2011) (but
see Willenbrock et al, 2009; Malone & Oliver, 2011; McIntyre et al,
2011). This notion is supported by our data, because we saw no bias
with regard to gene expression level for the detection of eQTLs.
Consistent with other recent work performed using mouse eQTL
data (Ackermann et al, 2013), our findings suggest that the fraction
of cis-eQTLs may have been overestimated in previous studies, due
partially to lacking statistical power for the detection of trans-
eQTLs. We wish to note, however, that while the fraction of cis-
eQTL depends partially on the statistical power of the study, the
absolute number of cis-eQTL that could be detected will largely by
determined by the genetic similarity (or difference) of the strains
being crossed.
The RNA-seq-based genotyping method reduces the costs and
workload at the bench, since no additional genotyping experiments
are required. The method has great potential for the application to
tandem no overlap
divergent no overlap
convergent no overlap
tandem overlap
divergent overlap
convergent overlap
observedexpected
number of gene pairs0 200 400 600 800 1000 1200 1400
P < 10−6
P < 10−6
P < 10−6
Figure 8. Organization of coding genes whose antisense expression is linked to the swc5 locus.The organization of gene pairs in the genome is either convergent, divergent, or in tandem and overlapping or not. However, the distinction between overlapping and non-overlapping genes is questionable in Schizosaccharomyces pombe, because of imprecise definition of the untranslated regions (UTRs). Scheme on the left shows geometry ofgene pair orientations and the potential antisense RNA (represented in red wavy lines). The number of swc5 aseQTL targets falling into each category is shown (green;observed). We used an empirical distribution based on 1,000,000 random assignments of antisense swc5 targets (gray; expected), to test for enrichment or depletion ofeach category (*P < 10�6). The depletion of tandem gene pairs is due to the non-random organization of the S. pombe genome (Supplementary Information,Supplementary Fig S17). Error bars indicate standard deviation over 1,000,000 permutations.
Molecular Systems Biology 10: 764 | 2014 ª 2014 The Authors
Molecular Systems Biology Genetic variation impacting antisense transcription Mathieu Clément-Ziza et al
12
Published online: November 28, 2014
other recombinant strains, where parental strains have been fully
sequenced (Keane et al, 2011). This approach requires relatively
deep sequencing to be efficient, but its accuracy is robust against
changing the sequencing depth (Supplementary Fig S19, Supple-
mentary Information). The sensitivity of RNA-seq-based genotyping
was higher than most other strategies used for genotyping recombi-
nant populations (Supplementary Information).
Natural genetic variation is known to bias expression quantifica-
tion based on both microarrays and RNA-seq, with known impacts
on eQTL studies (Alberts et al, 2005, 2007; Degner et al, 2009;
Verdugo et al, 2010). The fact that RNA-seq also indirectly
sequences the actual genome of an individual enabled us to pursue a
two-step strategy, where we first used the RNA-seq data for deter-
mining an individual’s genotype to subsequently map against this
individualized genome to quantify expression. Previous studies have
used similar strategies for other applications requiring sensitive tran-
script quantification (Degner et al, 2009; Turro et al, 2011; Reddy
et al, 2012; Satya et al, 2012; Franzen et al, 2013; Pandey et al,
2013; Stevenson et al, 2013), and here, we evaluated the relevance
of this phenomenon for eQTL mapping. Our analysis, using real and
simulated data, revealed significant improvements of small magni-
tude when accounting for the strain-specific genome, with, however,
minimal impact on eQTL mapping results. These differences are
likely to become more prominent in RNA-seq studies involving
genetically more diverse individuals such as human populations and
especially cancer genomics (Supplementary Fig S8D and E). We
therefore also advocate the development of read-mappers that
incorporate sequence variations into their model, which would
solve the issue of our strategy with respect to homologous regions
(Supplementary Information; Degner et al, 2009; Wu & Nacu, 2010;
Reddy et al, 2012).
Another important advantage of RNA-seq is its ability to quantify
all transcribed products, without relying on previously determined
annotation (Wilhelm et al, 2008; Wang et al, 2009; Costa et al,
2010; Marguerat & Bahler, 2010). In the context of this study, we
could show that ncRNA levels are even more affected by eQTLs than
mRNA levels. Previous eQTL work only considered the cis regula-
tion of a subset of the large intergenic ncRNAs (Kumar et al, 2013).
Here, RNAs were enriched for polyadenylated species, which make
up the great majority of ncRNAs in fission yeast (Marguerat et al,
2012). By using protocols especially developed for the purification
of ncRNAs, one might detect even more ncRNA-eQTLs.
It has been shown that erroneous antisense expression quantifi-
cation could arise from reverse transcription leading to positive
correlation between sense and antisense levels (Perocchi et al,
2007). Our results show not such correlation. In the contrary, we
observe an anticorrelation between the expression level of sense
transcripts and the expression levels of their antisense counterparts
(q = �0.34, Spearman’s rank correlation coefficient, Supplementary
Fig S20), as one could expect considering the repressive cis effect of
antisense transcripts (Pelechano et al, 2013).
The use of strand-specific RNA-seq provided remarkable and
unforeseen advantages for analyzing the swc5 locus. Without any
additional experiments, we could investigate antisense transcription
and conduct an ‘aseQTL study’. Importantly, even though the
majority of aseQTLs were associated with the swc5 locus, many
additional aseQTL regions could be detected. Future research may
address the role and mechanisms of those loci.
Our results showed that swc5-fs reduced the replacement of
histone H2A by the H2A.Z variant at the 50 end of coding genes. In
budding yeast, Swc5 is implicated in the transfer of H2A.Z, but not
in the binding of H2A.Z to the nucleosome (Wu et al, 2005). Our
H2A.Z ChIP-seq results suggest a similar role in fission yeast: The
positioning of H2A.Z was unchanged in swc5-fs strains, but the
occupancy, that is, the efficiency of the deposition, was reduced
(Fig 5D). In accordance with previous studies of the function of
H2A.Z (Zofall et al, 2009; Ni et al, 2010; Zhang et al, 2011), our
data hint that the reduced H2A.Z occupancy at the 50 end of coding
genes increased antisense transcription either through read-through
transcription or through overlapping convergent gene pairs. H2A.Z
is known to cooperate with RNAi and heterochromatin factors
to suppress antisense read-through, presumably via exosome-
dependent degradation (Zofall et al, 2009; Ni et al, 2010) (schema-
tized in Supplementary Fig S21). The anticorrelation between sense
and antisense transcription that we observed is in agreement with
the hypothesis that sense and antisense transcription establish a
negative feedback cycle (reviewed in Pelechano & Steinmetz, 2013).
However, the effect sizes that we observed differed between sense
and antisense transcription: While swc5-fs caused a dramatic
increase in antisense expression, the associated reduction in sense
expression was weaker. Indeed, linkages between sense traits and
the swc5 locus were only found for ~19% of the swc5 aseQTL
targets, showing that there is no simple and general antagonistic
relationship between sense and antisense expression (Xu et al,
2011; Chen et al, 2012a).
According to our high-density growth data, the swc5-fs allele
substantially compromised cellular fitness, resulting in less effi-
cient growth. It is likely that this growth defect indirectly altered
the expression of some genes that were not directly affected by the
H2A.Z deposition phenotype. We found 153 coding genes linked to
swc5 that were up-regulated in swc5-fs strains and thus likely not
affected by antisense transcription. The directionality of these link-
ages suggests that they were indirectly affected by swc5-fs; indeed,
there was a depletion of swc5 aseQTLs among those genes
(Fig 6B). Accordingly, these genes were also highly enriched for
genes involved in stress response (Supplementary Table S5),
which is typically regulated as a function of growth (Lopez-Maury
et al, 2008).
In addition to the library of segregants, the datasets generated in
this project provide a rich resource for future studies. Many aspects
of the data have not been analyzed so far, such as the impact of
sequence variation on alternative transcription start or polyadenyla-
tion sites, or exon usage. As opposed to budding yeast, a substantial
number of fission yeast genes are spliced. The depth and precision
of this data makes it an excellent resource for addressing these
questions.
Materials and Methods
QTL strain library construction
To cross different strains and select for segregants derived from
a mating between the two parental strains, we introduced domi-
nant markers at the ade6 locus in Chromosome III. We deleted
differentially the ade6 locus in the two parental strains by inserting
ª 2014 The Authors Molecular Systems Biology 10: 764 | 2014
Mathieu Clément-Ziza et al Genetic variation impacting antisense transcription Molecular Systems Biology
13
Published online: November 28, 2014
nourseothricin (NAT) or hygromycin B resistance markers at this
locus (Gregan et al, 2006). Subsequently, we plated the mating
mixture onto double selection plates that contained both NAT
and hygromycin B. This strategy allowed us to select for diploid
hybrids that arose from a cross between the two parental
strains. F1 haploid recombinants were obtained straight from the
selected diploid hybrids by tetrad analysis. F2 haploid recombi-
nants were obtained by performing tetrad analysis of F2 diploid
hybrids obtained from a mass mating among F1 haploid segre-
gants. Double selection of dominant markers was performed to
select F2 diploid hybrids, thus avoiding the high proportion of
identical sibling matings observed in a mass mating involving an
h90 homothallic strain.
High-throughput profiling of cellular growth
The growth of the parental and segregant strains was profiled in
normal conditions using the BioLector micro-fermentation system
(mp2p-labs GmbH, Baesweller, Germany). Based on the light scat-
tering (LS) technology, the BioLector system records biomass values
at 620 nm (Kensy et al, 2009). Cells of each strain were grown for
36 h in pre-cultures, which were prepared in 10-ml falcon tubes
containing YES broth (Formedium, PCM0305). The pre-cultures
were used to inoculate microtiter plates with 48 ‘flower’-shaped
wells (m2p-labs GmbH, MTP-48-B) filled with YES broth. Compared
to round or square wells, ‘flower’-shaped wells provide improved
mixing and oxygen transfer within the culture (Funke et al, 2009).
The cell density in each well of the plate was adjusted to an optical
density (OD595) of 0.2, with the final culture volume being 1.5 ml.
Gas-permeable adhesive seals (Thermo Fisher Scientific, AB-0718
and m2p-labs GmbH, F-R48M-25) were used to cover the wells of
the plate. Duplicate cultures were prepared for each strain tested.
Micro-fermentations were performed with the following settings:
Temperature was set at 32°C, humidity at 99%, shaking at
1,000 rpm, and LS measurements were retrieved every 3 min. A
linear regression approach between the LS and OD595 data measured
in the beginning and at the end of each experiment was applied to
convert the LS data of a BioLector experiment to OD595 values. The
raw growth data are provided in Supplementary Dataset S1.
Estimation of growth parameters
The collected BioLector data constituted a useful resource for the
detailed phenotypic characterization of the recombinant library in
normal growth conditions. Diverse growth parameters were
extracted from the highly resolved growth curves. Firstly, we calcu-
lated the growth efficiency of the segregants, which defined by the
gain of biomass given the substrate provided in the medium. The
efficiency of growth was simply the change in optical density
(OD595) value of the culture from the time of inoculation to the end
of the experiment (i.e. stationary phase) (Supplementary Fig S1B).
Secondly, the area under each growth curve, which is another indi-
cator of the growth capacity of a given strain, was calculated after
subtraction of a baseline (Supplementary Fig S1C). Moreover, calcu-
lation of the maximum slope of the log-transformed OD-
calibrated values within the exponential phase provided an estimation
of the maximum specific growth rate (lmax). The lmax of a culture
was also estimated from the log-scale OD-calibrated values via the
first derivatives of a smoothing spline fit. Furthermore, we calcu-
lated the lag time (lagT), which corresponds to the time at which
the tangent to the maximal growth rate intersects the time axis
(Supplementary Fig S1D). Finally, we estimated the doubling (or
generation) time of a culture (Td), which provides a direct link
between growth and cell cycle and is inversely proportional to the
growth rate (Td = ln(2)/lmax). Growths parameters are provided in
Supplementary Dataset S2.
Cell survival at the stationary phase of growth
Aliquots of biomass samples collected from stationary phase
cultures were diluted to ~106 cells, and a 1/10 aliquot was stained
with 0.05 g/l propidium iodide (Sigma, P4170). Stained cells were
incubated for 5 min at room temperature and analyzed for cell
survival using a Cell Lab Quanta SC MPL flow cytometer (Beckman
Coulter, Fullerton, CA). The jumper was set to ‘small’, and the cell
survival protocol of the Cell Lab Quanta SC software was applied
with the following gain and voltage settings: EV = 4.80, SS = 5.00,
FL1 = 4.22, and FL2 = 4.13. Flow cytometry data were analyzed
using the FlowJo v.7.1 (Tree Star, Inc.) software package. Survival
data are provided in Supplementary Dataset S3.
Parental strain genome sequencing
DNA was extracted with Qiagen genomic DNA kits. Paired-end Illu-
mina libraries were constructed according to the manufacturer’s
instructions, with 300 to 400 nt fragmented DNA. Sequences were
produced using a Illumina Genome Analyzer II, to at least 240×
coverage. Sequence data are archived in the European Nucleotide
Archive (http://www.ebi.ac.uk/ena/) under the accession numbers
ERX007392 and ERX007395 for the strains 968 and Y0036,
respectively.
RNA-seq library preparation and sequencing
Strand-specific RNA-seq libraries were created for SOLiD sequencing
from poly(dT)-enriched RNA using the SOLiDTM Total RNA-Seq kit
(Applied Biosystems, LifeTechnologies). Briefly, 50-ml cultures
grown at 32°C were harvested at 0.4–0.5 OD595 by filtration and
snap-frozen in liquid N2. Total RNA was isolated by hot phenol
extraction (Lyne et al, 2003), and RNA quality was assessed on a
Bioanalyzer instrument (Agilent). For poly(dT)-enrichment, three
rounds of poly(dT) Sera-Mag magnetic bead purifications were
carried out using 50 lg of total RNA starting material and verified
on a Bioanalyzer. 500 ng poly(A)-enriched RNA was then frag-
mented to an average size of ~200 nt. SOLiD adaptors were hybrid-
ized and ligated, RT–PCR performed, and the cDNA purified by size
selection on 6% TBE-urea gels. The 30 barcodes (1–48) were incor-
porated at the library amplification step using 16 PCR cycles and
purified using SPRI-beads (Agencourt, Beckman Coulter). Library
size distributions and concentrations were determined on a Bioana-
lyzer, and samples were pooled and put through emulsion PCR
steps. RNA-seq libraries were sequenced on an ABI SOLiD V4.0
System (50 bases long reads; Applied Biosystems, LifeTechnolo-
gies).
The RNA-seq data are available at ArrayExpress (http://www.
ebi.ac.uk/ arrayexpress/, identifier E-MTAB-2640).
Molecular Systems Biology 10: 764 | 2014 ª 2014 The Authors
Molecular Systems Biology Genetic variation impacting antisense transcription Mathieu Clément-Ziza et al
14
Published online: November 28, 2014
ChIP-seq library preparation and sequencing
To investigate H2A.Z (Pht1) occupancy in 968 compared with
Y0036 cells, endogenous pht1 was c-terminally tagged in 968
and Y0036 strains with 13c-myc:kanMX6 (Bahler et al, 1998).
We named the resulting strains JB1221 and JB1220 (968-pht1-
13c-myc and Y0036-pht1-13c-myc, respectively) and verified the
successful tagging by Western analysis, Supplementary Fig
S22A). The swc5D-pht1-13c-myc-tagged strain was created by
crossing JB1221 with a prototroph swc5D strain. We used the
h+ swc5D strain from the S. pombe Bioneer deletion library
(Kim et al, 2010), crossed out all the auxotrophic markers asso-
ciated with that background using the h� 972 wild-type strain,
and then crossed the prototroph swc5D with the previously
generated 968-13c-myc strain. Two swc5D-pht1-13c-myc-tagged
clones were verified by PCR and Western analysis (Supplemen-
tary Fig S22B and C), named JB1448 and JB1449, and used for
further analysis.
Western verification of C-terminal 13cmyc-tagged pht1 strains
(Supplementary Fig S22A) was performed using the Novex NuPAGE
system (LifeTechnologies). Cell lysates, 15 lg, were separated on 4–
12% Bis–Tris Gel, transferred to nitrocellulose membrane, and incu-
bated with anti-c-myc antibody (Ab32, Abcam).
To verify swc5-knockout, checking primers were used in colony
PCR (Supplementary Fig S22C). For swc5Δ 50, junction checking
primers CPN1 (within KanMX) 5-CGTCTGTGAGGGGAGCGTTT-3
and Cp5 5-TAACAAATCCCCCACAAGTCTTATT-3 (upstream of
swc5 gene) were used. For 30, junction checking primers CPC1
5-TGATTTTGATGACGAGCGTAAT-3 (within KanMX) and Cp3
5-ACAACAAGCATTGCAACATCACAAT-3 (downstream of swc5
gene) were used.
ChIP-seq libraries were created for Illumina MiSeq sequencing
from Chromatin immunoprecipitations (ChIPs) using antibodies
specific for either c-myc or histone H3 (ab32 and ab1791, respec-
tively; Abcam) in biological triplicates. Briefly, 500-ml cultures
grown at 32°C were formaldehyde-fixed for 30 min, harvested by
centrifugation, and snap-frozen. Chromatin extract (CE) was
prepared with a Fastprep machine (MP Biomedicals) at 6 × 20 s,
5.5 m/s using an equal volume of 0.5 ml acid-washed glass beads
(BioSpec products) to break cells. Lysates were sonicated using a
Bioruptor (Diagenode) at 6 × 50, 30 s on, 30 s off, in ice-cold condi-
tions, to create CE with an average DNA size of approximately
200 bp. Immunoprecipitations (ChIPs) were set up using 5 mg CE
on Dynabeads Protein A with appropriate antibody (Invitrogen, Life-
Technologies). Input (CE) and ChIPs were de-crosslinked overnight,
treated with DNase-free RNase (Roche) and proteinase K (Invitro-
gen, LifeTechnologies), and the DNA-purified using PureLink PCR
micro kits (Invitrogen, LifeTechnologies).
Triplicate ChIP-seq libraries from the immunoprecipitated
samples and corresponding input material were prepared using the
NEBNext ChIP-Seq Library Prep Master Mix set for Illumina (New
England Biolabs) combined with Illumina Barcodes 1–12. Briefly,
and according to manufacturer’s instructions, DNA was end-
repaired, end adaptors ligated, and the libraries amplified with 15
PCR cycles in the presence of Illumina barcodes. Libraries were
purified using SPRI-beads (Agencourt, Beckman Coulter), and
library size distributions and concentrations were determined by
Bioanalyzer (Supplementary Fig S22D) and Qubit (Invitrogen,
LifeTechnologies). Pooled ChIP-seq libraries were loaded at
10 pmol onto a MiSeq instrument using reagent kit v2, 50–55
cycles (Illumina). The ChIP-seq data are available at ArrayExpress
(http://www.ebi.ac.uk/arrayexpress/; identifier E-MTAB-2650). qPCRs
were performed in triplicate, as a QC to verify enrichment in ChIP
samples over input material. Briefly, four regions over the
S. pombe adh1 locus, including the transcription start site, were
examined using the fast SYBR Green Master Mix system (Applied
Biosystems). Relative quantities were derived from Ct values
obtained from the SDS software (Applied Biosystems) using 10-fold
serial dilutions of input material as standards. Once enrichment
was verified, ChIP-seq libraries were constructed. Supplementary
Fig S22E shows qPCR data over the transcription start site of
adh1.
Strand-specific RT–qPCR
Design
RT–qPCRs were performed for four pairs of genes arranged conver-
gently. The gene pairs were cdb4 (SPAC23H4.09)/thi4 (SPA
C23H4.10c); SPAC29E6.10c/SPAC29E6.09; its3 (SPAC19G12.14)/
tpp1 (SPAC19G12.15c); and paf1 (SPAC664.03)/rps1602 (SPAC6
64.04c); the first indicated gene of each pair was the swc5 target
gene. For each pair of convergent genes, two different reverse-tran-
scription (RT) reactions (plus two control reactions) and four qPCRs
were performed (the procedure was repeated in triplicate). The
cDNAs of all the sense transcripts were generated in one of the RT
reaction, while the antisense cDNAs were generated in a second
reaction (Supplementary Fig S16A).
RNA extraction
Total RNA was isolated by hot phenol extraction (Lyne et al,
2003). The residual DNA was digested with Qiagen’s DNase via
in column digestion using Qiagen’s RNAeasy mini kit protocol.
RNA quality was assessed on a Bioanalyzer instrument from
Agilent. All RNAs used in this assay had a RIN (RNA Integrity
Number) above 9.
RT reaction
cDNA was generated using primer-specific RT reactions
(2 pmols per primer) according to Superscript III manual, and 3 lgof total RNA was retro-transcribed using Superscript (R) III Reverse
Transcriptase (Life Technologies). To reduce the synthesis of
primer-independent cDNA, which has been shown to account to up
to 57% of the RT products in loci that express both sense and anti-
sense transcripts (Haddad et al, 2007; Perocchi et al, 2007; Feng
et al, 2012), the temperature of the RT reaction was set at 55°C
(relatively high temperature) and actinomycin D was added to the
reactions after the denaturating step at 70°C at a concentration of
6 lg/ml (Perocchi et al, 2007). For each RNA, 4 sets of RTs were
carried out:
1 Sense RT.
2 Antisense RT.
3 Self-priming RT in which no primers were added to assess for
the primer-independent cDNA synthesis.
4 DNase control RT in which no enzyme was added, to estimate
the remaining DNA after DNase treatment.
The list of RT primers is provided in Supplementary Table S6.
ª 2014 The Authors Molecular Systems Biology 10: 764 | 2014
Mathieu Clément-Ziza et al Genetic variation impacting antisense transcription Molecular Systems Biology
15
Published online: November 28, 2014
Semi-quantitative PCR
The expression of the transcripts analyzed was performed using the
fast SYBR Green Master Mix system (Applied Biosystem). Ct values
were obtained from the SDS software (Applied Biosystem). The list
of qPCR primers is provided in Supplementary Table S6. Raw qPCR
data are provided in Supplementary Dataset S16.
Analysis
All qPCRs were performed relative to the expression of the house-
keeping gene cdc2. Because we were assessing expression differ-
ences induced by genetic variations that had widespread effects on
transcription levels, we could not assume that the level of house-
keeping genes (like cdc2) were stable between the strains. There-
fore, we restricted our analysis to the comparison of ratios (like
antisense-to-sense ratios), because this quantity was independent of
potential variations in reference gene levels. Indeed, in semi-
quantitative qPCR, the expression levels are measured relatively to
a reference gene (here cdc2); for instance, the sense level of gene g
(senseg) is estimated via senseg/cdc2 and its antisense level (anti-
senseg) via antisenseeg/cdc2. Thus, their ratio is independent of cdc2
level:
antisenseg=cdc2
senseg=cdc2¼ antisenseg
senseg
30-rapid amplification of cDNA ends experiments
30-RACE experiments were done using SMARTer RACE kit (Clon-
tech) according to the manufacturer’s instructions.
Targeted proteomics analysis of swc5
Samples for protein analysis were harvested from the exact same
cultures as that for the RNA. Fifty milliliter of growing culture
(as described above) was pelleted at 4°C, washed once in
1× PBS, and snap-frozen in liquid N2. Cells were harvested by
centrifugation at 2,000 × g and resuspended in 100 ll of lysis
buffer (100 mM ammoniumbicarbonate, 8 M urea, 0.1% Rapi-
GestTM) and 100 ll of glass beads. The cells were lysed first by
vortexing for 3 × 1 min using a multivortexer followed by soni-
cation for 2 × 30 s. A small aliquot of the supernatant was taken
to determine the protein concentration using a BCA assay
(Thermo Fisher Scientific) and the protein concentration adjusted
to 5 mg/ml using additional lysis buffer. 100 lg total protein
was employed for targeted LC-MS analysis as recently specified
(Glatter et al, 2012). First, disulfide bonds were reduced with
5 mM TCEP for 30 min and alkylated with 10 mM iodoaceta-
mide at room temperature in the dark. Excess of iodoacetamide
was quenched with 12.5 mM N-acetyl-cysteine for 10 min at
37°C. Protein samples were diluted five times with 50 mM
NH4HCO3 to obtain a urea concentration of 1.6 M during digest.
2 lg of trypsin (Promega) was added to the protein sample (pro-
tein to trypsin ratio = 50:1), and digestion was carried out at
37°C overnight (about 18 h). Then, the samples were acidified
with 2 M HCl to a final concentration of 50 mM and incubated
for 15 min at 37°C, and the cleaved detergent was removed by
centrifugation at 10,000 × g for 5 min. Subsequently, a mixture
containing 1 pmol of heavy labeled reference peptides (Spike-
Tides_L, JPT Peptide Technologies), respectively, was spiked into
each sample and subsequently C18-purified using spin columns
(Harvard Apparatus) according to manufacturer’s instructions.
The corresponding Swc5 peptides were selected from two recent
large-scale proteomic studies of S. pombe (Marguerat et al, 2012;
Gunaratne et al, 2013). Data derived from a spectral library
generated based on data-dependent LC-MS/MS analysis of the
standard peptide mix were imported into Skyline version 1.4
(https://skyline.gs.washington.edu/labkey/wiki/home/software/Sky-
line/page.view?name=default) to define precursor charge states
and the most intense transitions. Up to 10 transitions per peptide
were traced on a LTQ Velos mass spectrometer connected to an
electrospray ion source (both Thermo Fisher Scientific). Peptide
separation was carried out using an easy nano-LC systems
(Thermo Fisher Scientific) equipped with a RP-HPLC column
(75 lm × 37 cm) packed in-house with C18 resin (ReproSil-Pur
C18–AQ, 3 lm resin; Dr. Maisch GmbH, Ammerbuch-Entringen,
Germany) using a linear gradient from 96% solvent A (0.15%
formic acid, 2% acetonitrile) and 4% solvent B (98% acetonitrile,
0.15% formic acid) to 35% solvent B over 90 min at a flow rate
of 0.2 ll/min. The data acquisition mode was set to obtain only
MS/MS scans in the linear ion trap of the defined precursor
masses. Maximal ion time was set to 50 ms, automatic gain
control target was set to 30,000 ions, and one microscan was
acquired per MS/MS scan. The MS data were imported into
Skyline that was used for further visualization, transition detec-
tion, and calculation of transition ratios. The generated transition
list used for the targeted analysis and the skyline results are
provided in the Supplementary Dataset S17.
DNA re-sequencing data processing
Paired-end reads were aligned against the S. pombe reference
genome using BWA (Li & Durbin, 2009) (maximum edit distance 4,
maximum gap expansion 15, seed length 32). We then applied
the GATK pipeline (v.1.0-6148) for quality score recalibration,
indel realignment, SNP, and small indel discovery and genotyp-
ing across the three parental samples simultaneously using
standard hard filtering parameters with a minimum variant score
of 50 (DePristo et al, 2011). Although the strains were haploid,
the GATK pipeline assumed diploidy for genotyping. We
therefore rejected polymorphisms that were genotyped as hetero-
zygous. We identified 4,570 polymorphisms (Supplementary
Dataset S6).
RNA-seq-based genotyping
Step 1: Identifying genomic variants in the segregants
For every sample, reads were mapped to the S. pombe reference
genome, in which the sequences of the spikes were added, using
Bowtie v.0.12.7 (Langmead et al, 2009) (using the following
command line options: -C –n 3 –e 100 –best). Read group
information was added, and sample-specific BAM files were sorted
using Picard utilities (http://picard.sourceforge.net/). We then used
the GATK pipeline (v.1.0-6148) to perform a local realignment of
reads around the indels that were previously identified in progenitor
strains. In the same step, data of samples derived from identical
Molecular Systems Biology 10: 764 | 2014 ª 2014 The Authors
Molecular Systems Biology Genetic variation impacting antisense transcription Mathieu Clément-Ziza et al
16
Published online: November 28, 2014
segregant strains were pooled together to obtain strain-specific BAM
files. Next, SNPs and indels were genotyped at the sites polymorphic
in the progenitors using GATK.
Step 2: Inferring genotype
For every polymorphic site between the progenitors, we
compared the polymorphisms in the segregant and the parental
strains to infer which allele was inherited. Ambiguous genotype
calls (heterozygous calls—we studied haploid individuals) and
calls where the GATK genotype score was below 20 were
considered as unknown. This threshold was determined empiri-
cally by analyzing the genotype calls made from RNA-seq data
of the parental strains—for which we knew the expected
genotype.
Step 3: Filtering for potential genotyping errors
Polymorphic sites that were not correctly called in the parental
strains and with a minor allele frequency below 10% were
discarded (89 polymorphisms). Another class of potentially errone-
ous genotype calls regards markers with genotype calls differing
from the two flanking markers (47 cases in the entire strain library).
Such patterns are likely to denote an erroneous genotype call when
the flanking markers are close (Supplementary Information). When
the distance between the flanking sites was smaller than 50 kilo
base pairs (kbp), those genotype calls were considered as erroneous
and corrected to match the segregation pattern of the flanking sites
(34 cases).
Step 4: Imputing missing genotypes
The genotype of less than half of the polymorphic sites could be
directly deduced from the RNA-seq data. Genotypes of the remain-
ing sites could not be determined because of the lack of read cover-
age resulting from low (or no) expression. However, the segregation
of a polymorphism is not an independent event since the meiotic
recombination generates relatively large haplotype blocks. This can
be taken into account to infer missing genotypes using the data of
genotyped flanking polymorphic sites. Therefore, when the informa-
tive flanking sites showed the same segregation patterns and when
they were < 50 kb away, the same genotype as the flanking one was
assigned to the missing value, thus assuming that no recombination
event took place (Supplementary Information). When the distance
was greater, or when the flanking polymorphic sites showed oppo-
site segregation patterns, the genotype was still considered as
unknown.
Step 5: Assembling a set of markers for linkage analyses
Genotypic markers that were not called in half of the segregants
after the imputation step were discarded (29 sites). Adjacent
markers with the same segregation pattern across all segregants
were collapsed into one unique marker, resulting in a set of 708
unique mapping genotypic markers (Supplementary Dataset S9).
Thus, each marker represents a genomic interval in which
all polymorphisms are in full linkage disequilibrium in the
cross.
If replicates RNA-seq data of the same strain led to comple-
tely different genotypes, thus indicating probable sample
inversions, the data of all replicates were removed from the
analysis.
Generation of strain-specific genome and annotation files
We used the genotype data to generate both strain-specific genome
sequences and strain-specific annotations starting from: (i) the refer-
ence genome (RG) sequence, (ii) the RG annotation files, and (iii)
the genomic variations information (VCF file) of the strain of inter-
est. Annotation files had to be generated to take insertions and dele-
tions into account. For this task, we developed a standalone Python
script called GenomeGenerator, which is freely available (www.
cellularnetworks.org).
RNA-seq simulation
To explore the potential advantage of the strain-specific RNA-seq
mapping, we simulated sets of 48 bp long RNA-seq reads for the
two parental strains (968 and Y0036) and three segregants (R1-10,
R1-13, and R1-22). First, we simulated the expression levels using
the average normalized expression values that we measured in the
real data for these samples (the same expression values were used
for all the simulations). To generate the number of RNA-seq reads
to simulate for each gene (NR), the normalized log expression
values (expression) were transformed to a natural scale and
multiplied by 10. This value was then ceiled (number of reads are
integer), and all values smaller than 1 were set to 1. This led to a
total of 77,110,382 reads by simulated samples.
NR ¼ 1 d10 � 2expressione� 1d10 � 2expressione otherwise
�
For each strain, we then generated a strain-specific transcriptome
(the sequence of the 6,464 coding and non-coding transcripts
considered in this study) that took polymorphisms into account and
added a poly-A tail of 48 bases for every transcript.
Before generating the RNA-seq reads, we built an error model to
simulate sequencing errors. It has been shown that sequencing
errors play an important role for the accuracy of RNA-seq-based
gene expression quantification when polymorphisms were consid-
ered (Degner et al, 2009). In order to quantify the sequencing error,
we used the RNA-seq results for strain 968 (laboratory strain
isogenic to the strain from which the S. pombe reference genome
was derived). We assumed that all mismatches between aligned
reads and the reference genome represent sequencing errors. There-
fore, for each read position, we evaluated the mismatch frequency
and used it as a sequencing error probability in the error model. We
then generated the RNA-seq reads by choosing randomly segments
of 48 bases from the transcript sequences and added mismatches
randomly following the previously generated error model. Note that
the coordinates of the RNA-seq reads were the same for all the simu-
lated strains in order to facilitate comparisons.
Gene expression quantification and normalization
To avoid biases due to sequence variations in gene expression quan-
tification, RNA-seq reads were mapped onto strain-specific genomes
(sequences of the spikes were also added to the genome sequence
file) using Bowtie v.0.12.7 (Langmead et al, 2009) with the follow-
ing command line options: (-C ––best -m 1). Gene expression
was evaluated by counting the number of reads mapped into each
ª 2014 The Authors Molecular Systems Biology 10: 764 | 2014
Mathieu Clément-Ziza et al Genetic variation impacting antisense transcription Molecular Systems Biology
17
Published online: November 28, 2014
annotated element (strand specifically). For coding genes, only the
coding sequences were considered to avoid the problem of variable
UTR length (Pelechano et al, 2013).
Read counts were filtered to remove genes, for which no read
was mapped in more than half of the samples. The remaining zero
read counts were replaced by 0.1 to avoid mathematical errors in
subsequent logarithmic transformation. Data were then sample-wise
scaled to the total number of mapped reads (spike excluded from
the counts).
ei scaled ¼ eiti� �t
where ei is the expression vector of the sample i, ti is the total
number of mapped reads, and �t is the average.
Finally, potential batch effects were removed by mean-centering
(also known as zero-mean, or one-way analysis of variance adjust-
ment (Luo et al, 2010)), and data were log2-transformed.
egnorn ¼ eg �egb1=�eg b1egb2=�eg b2
� � �egbn=�eg bn
0BB@
1CCA
where eg is the expression vector of the gene g over all samples
and egb1, the expression vector of the gene g over the samples of
the first batch. For the computation of the mean expression across
a batch (�eg bi ), the samples corresponding to the swc5 deletion
strain (Dswc5) were not taken into account because they were
likely to be different from the recombinant lines (different genetic
background). This did not alter the analyses that were carried out
with these particular samples since only correlations were studied.
Antisense expression quantification and normalization
Antisense expression data were quantified and normalized as the
sense expression data, but raw expression measurements were
obtained by counting the reads mapped on the opposite strand of
each annotated elements. Only the antisense expressions of coding
gene were considered in all subsequent analyses. Moreover, zero
values were not replaced by 0.1 but considered as missing values,
to account for the overall lower read coverage of antisense traits.
Differential gene expression analysis
Differential gene expression analysis has been carried out to
compare the expression of the 6,464 sense traits and of the 4,133
antisense traits in the swc5-deletion strain (measured in triplicate)
and the wild-type parental strain 968 (measured in seven repli-
cates). We used DeSeq2 to carry out this analysis. DeSeq models
read counts using negative binomial distributions and uses general-
ized linear models to test for differential expression.
eQTL, aseQTL, and growth QTL mapping
A previously developed QTL detection method based on Random
Forest (RF) (Michaelson et al, 2010) was adapted to handle missing
genotype values. The RF-based mapping uses genetic markers as
predictors. The original RF cannot handle missing values in the
predictor matrix. A naıve solution would be to define missing values
as a third category (i.e. possible ‘genotypes’ would be the two
parental alleles 968 and Y0036, and ‘missing’). However, we
observed that treating missing values like a genotype introduces a
bias in some special cases even though the total number of missing
values was very small. We thus developed a new strategy that only
uses real genotypes: In the case of missing values, one of the two
alleles (either 968 or Y0036) is randomly assigned to that locus. This
procedure is repeated 1,000 times, each time re-assigning a random
genotype, and subsequently, the resulting models (forests) are
combined. This strategy removed biases previously introduced by
missing values.
We further modified our Random Forest strategy to correct for
potential population sub-structure, by adopting previously proposed
concepts that essentially include population structure as a covariate
in the model (Patterson et al, 2006; Price et al, 2006, 2010; Novem-
bre & Stephens, 2008). First, we estimated the relatedness between
the strains (i.e. the kinship matrix) using the ‘emma’ package (Kang
et al, 2008). Subsequently, we selected those eigenvectors of the
kinship matrix corresponding to the top eighth eigenvalues as cova-
riates for the QTL mapping (additional predictors for growing the
Random Forests). These eight-first vectors explained more than
80% of the genotype variance.
For the eQTL and aseQTL mapping, forests of 16,000 trees
(100 forests of 160 trees) were grown using the R implementa-
tion of the Random Forest algorithm (randomForest package).
The strategies described above were used to handle missing
genotype values and model the population structure. The mtry
parameter, which defines the number of randomly preselected
predictors at each split, was left to default (one-third of the total
number of predictors). The QTL was then scored using the
predictor selection frequency as previously proposed (Michaelson
et al, 2010). To estimate the significance of the linkages, each
trait was permuted 1,000 times and random forests were grown
for each permutation. The correspondence between the covari-
ates (batches and population structure models) and the permu-
tated traits was maintained in order to properly estimate the
significance of the trait-marker linkages. Note that the same
permutation scheme was used for all traits in order to account
for inter-trait correlation. This permutation strategy has previ-
ously been proposed in order to avoid biases in the subsequent
detection of eQTL hotspots (Breitling et al, 2008). By pooling the
results of all the studied traits, we obtained null distributions of
the selection frequencies for each marker (predictor). These
distributions were used to generate empirical P-values for the
selection frequencies. We then reused the permutation results to
generate P-values for each randomized trait and thus obtained a
null distribution of P-values that was used to estimate false
discovery rates (FDR). For growth QTLs, forests of 50,000 trees
were grown (2,000 forest of 25 trees) and 10,000 permutations
were used to estimate the null distributions.
When consecutive markers were linked to the same trait, the
QTL was considered to span over the markers of interest. Further,
regions containing multiple markers linked to the same trait were
combined into a single locus if the linked markers were in high link-
age disequilibrium (LD) to each other (Pearson’s r > 0.8) and sepa-
rated by not more than 10 non-linked markers. All of those markers
Molecular Systems Biology 10: 764 | 2014 ª 2014 The Authors
Molecular Systems Biology Genetic variation impacting antisense transcription Mathieu Clément-Ziza et al
18
Published online: November 28, 2014
(including the intermediate non-linked markers) were combined
into one QTL (one region). If such markers were separated by more
than 10 non-linked markers (or resided on different chromosomes),
they were counted as a single linkage, because it is a priori
unknown, which of those regions contains a causal variant. We
refer to these sets of markers as ‘QTL groups’, because they do not
constitute a contiguous genomic region (i.e. not a single ‘locus’).
QTL genomic coordinates (Supplementary Datasets S11 and S13)
were reported as spanning in between the first non-linked polymor-
phisms. Linkages with last (or first) markers at the end (or begin-
ning) of a chromosome were considered as enclosing the entire
telomere.
eQTL hotspot detection
To formally identify eQTL hotspots in our dataset, the genome was
divided into 50-kb bins (250 bins, bins at the end of chromosomes
were bigger) and the number of eQTLs falling in each bin was
counted. Nineteen bins contained more eQTLs than expected
(P < 8e-4) if the eQTLs were randomly distributed across the
genome. The expected number of eQTLs per bin was computed
assuming a Poisson distribution (Brem et al, 2002). Consecutive
bins sharing the same targets were subsequently regrouped in 8
eQTL hotspots.
cis versus trans-QTL
eQTLs and aseQTLs were considered to act in cis when the marker
defining the QTL that was the most correlated with the markers
surrounding the target gene was correlated at more than 0.8 (Pear-
son’s r). The results that we obtained regarding the proportion of
cis-eQTLs were not importantly affected by lowering the threshold
(Discussion).
Identification of the strongest candidate regulator genes
eQTL loci usually span multiple genes. Identifying the causal
sequence variation or the causal gene responsible for a QTL has
proven to be difficult (Bing & Hoeschele, 2005; Kulp & Jagalur,
2006; Suthram et al, 2008; Verbeke et al, 2013). Several methods
take into account the correlation between the expression of the
target gene and the genes located at the eQTL (regulator genes) to
address this issue (Bing & Hoeschele, 2005; Kulp & Jagalur, 2006).
Here, we used a similar approach to identify potential likely regula-
tor gene for each eQTL target. For each trans-eQTL (or eQTL group),
we computed the squared Pearson’s r between the target gene and
all annotated genes located at the QTL. The candidate regulator
showing the maximal correlation was then considered as the poten-
tial regulator of the coding or non-coding target of interest. Note that
this method selects one candidate regulator for each gene–QTL link-
age. Therefore, if several genes are linked to the same QTL, this
method can identify several strongest regulator candidates in this
QTL, provided it contains several genes.
The prediction of the putative regulator at the hotspot (Supple-
mentary Table S3) was done based on a voting approach: For each
target of the hotspot, the strongest candidate regulator gene has
been determined. The most frequently selected candidate regulator
was considered the regulator of the hotspot.
Directionality of the effects
To determine the directionality of the regulation of a QTL on a trait,
we simply compared the average trait level in the strains carrying
the Y0036 allele at the locus of interest to the average level in the
strains carrying the 968 allele. The directionality was always
expressed relative to 968. Note that the directionality test implied
that a significant linkage had been previously found between the
locus and the trait; hence, the statistical significance had already
been tested.
Gene pair organization
Only the protein-coding genes were considered in this analysis,
because many ncRNAs correspond to antisense RNAs in S. pombe
(Wilhelm et al, 2008; Ni et al, 2010; Bitton et al, 2011; Xu et al,
2011). On each chromosome, genes were ordered according to geno-
mic position of the transcription start site position (or, when not
available, the start codon). All pairs of successive genes were then
classified into six categories by analyzing the orientation of the
genes (plus or minus strand) and whether they overlapped. Since
we evaluated the antisense transcription considering only the region
located on the opposite strand of the coding region (CDS), genes
were not considered as overlapping when only their UTRs over-
lapped.
The significance of the gene pair enrichment was empirically
determined: 1,384 antisense traits were linked to the swc5 locus;
we randomly picked the same number of traits and counted the
number of picked gene pairs falling in each category. By repeating
this operation 1,000,000 times, we obtained empirical null distribu-
tions of the number of gene pairs in each category. No empirical
value was above the observed number of overlapping and non-
overlapping convergent gene pairs, and no empirical value was
below the observed number of non-overlapping tandem gene
pairs.
ChIP-seq analysis
ChIP-seq reads were aligned onto the S. pombe reference genome
using Bowtie v.0.12.7 (Langmead et al, 2009) (using the following
command line options: -m 1 ––best). Pht1 peaks were called
using MACS2 v2.0.10.09132012 (Zhang et al, 2008), using input
DNA (specific for each replicate) as background control. The shift
size was fixed 73 in all samples; it corresponds to the average shift
size modeled by MACS2 for the studied samples.
Per base Pht1 occupancy relative to control was calculated using
the MACS2 ‘bdgcmp’ command using the ‘divide’ method (indepen-
dently for each replicate). The resulting bedgraph files were used to
map all coding genes onto a meta-gene. For each gene, the upstream
intergenic region and part of the coding region were analyzed within
a region ranging from �800 to+2800 bp from the transcription start
site with a resolution of 1 bp, similarly as described (Buchanan
et al, 2009).
GO enrichment
Gene Ontology (GO) enrichment analyses were performed using
topGO (‘weight’ algorithm, maximum node size 3, Fisher test),
ª 2014 The Authors Molecular Systems Biology 10: 764 | 2014
Mathieu Clément-Ziza et al Genetic variation impacting antisense transcription Molecular Systems Biology
19
Published online: November 28, 2014
which takes the topology of the ontology into account (Alexa et al,
2006).
Data Accessibility
Sequencing data of the parental strains are archived in the European
Nucleotide Archive (http://www.ebi.ac.uk/ena/) under the acces-
sion numbers ERX007392 and ERX007395 for the strains 968 and
Y0036, respectively.
All RNA-seq data generated in this study are available at Array-
Express (http://www.ebi.ac.uk/ arrayexpress/, identifier E-MTAB-
2640).
All ChIP-seq data generated in this study are available at ArrayEx-
press (http://www.ebi.ac.uk/arrayexpress, identifier E-MTAB-2650).
The standalone script that generates strain-specific genome
sequence and annotation (GenomeGenerator), is freely available at
http://www.cellularnetworks.org.
All the other raw data, processed data, and dataset results are
provided as Supplementary Datasets with this manuscript.
Supplementary information for this article is available online:
http://msb.embopress.org
AcknowledgementsWe deeply thank Ruedi Aebersold (ETH, Zurich, Switzerland) for his advice and
fruitful discussions all along this study. We thank the Liverpool Sequencing
Service (Pia Koldkjaer, John Kenny, Suzanne Kay, Richard Gregory, and
Christiane Hertz-Fowler at the Centre for Genomic Research, University of
Liverpool) for helpful discussions and assistance with the RNA-seq protocol,
libraries QC, pooling, and performing SOLiD sequencing runs. Parts of the
computations were performed on the cluster of the Center for Information
Services and High Performance Computing (ZIH) at TU Dresden. This study
was mainly supported in AB, CTW, and JB laboratories by PhenOxiGEn, an EU
FP7 research project. Research in the Bähler Lab was additionally funded by a
Wellcome Trust Senior Investigator grant.
Author contributionsFXM, SM, and JB designed the experiments. FXM generated the yeast library.
SC and SM generated the sequencing libraries. SC performed the ChIP-seq
analysis. MRL and FXM designed and performed the RT–qPCR experiments.
MAP and CTW designed, performed, and analyzed the growth experiments. AS
designed, carried out, and analyzed the proteomics experiments. MC-Z and AB
designed the analyses; MC-Z and SR carried out the analysis. The manuscript
was written by all authors. CTW, JB, and AB envisioned and supervised the
project.
Conflict of interestThe authors declare that they have no conflict of interest.
References
Ackermann M, Sikora-Wohlfeld W, Beyer A (2013) Impact of natural genetic
variation on gene expression dynamics. PLoS Genet 9: e1003514
Alberts R, Terpstra P, Bystrykh LV, de Haan G, Jansen RC (2005) A
statistical multiprobe model for analyzing cis and trans genes in
genetical genomics experiments with short-oligonucleotide arrays.
Genetics 171: 1437 – 1439
Alberts R, Terpstra P, Li Y, Breitling R, Nap J-P, Jansen RC (2007) Sequence
polymorphisms cause many false cis eQTLs. PLoS ONE 2: e622
Alexa A, Rahnenführer J, Lengauer T (2006) Improved scoring of functional
groups from gene expression data by decorrelating GO graph structure.
Bioinformatics 22: 1600 – 1607
Anver S, Roguev A, Zofall M, Krogan NJ, Grewal SIS, Harmer SL (2014) Yeast
X-chromosome-associated protein 5 (Xap5) functions with H2A.Z to
suppress aberrant transcripts. EMBO Rep 15: 894 – 902
Atwell S, Huang YS, Vilhjálmsson BJ, Willems G, Horton M, Li Y, Meng D, Platt
A, Tarone AM, Hu TT, Jiang R, Muliyati NW, Zhang X, Amer MA, Baxter I,
Brachi B, Chory J, Dean C, Debieu M, de Meaux J et al (2010)
Genome-wide association study of 107 phenotypes in Arabidopsis thaliana
inbred lines. Nature 465: 627 – 631
Bähler J, Wu JQ, Longtine MS, Shah NG, McKenzie A III, Steever AB, Wach A,
Philippsen P, Pringle JR (1998) Heterologous modules for efficient and
versatile PCR-based gene targeting in Schizosaccharomyces pombe. Yeast
14: 943 – 951
Battle A, Mostafavi S, Zhu X, Potash JB, Weissman MM, McCormick C,
Haudenschild CD, Beckman KB, Shi J, Mei R, Urban AE, Montgomery SB,
Levinson DF, Koller D (2013) Characterizing the genetic basis of
transcriptome diversity through RNA-sequencing of 922 individuals.
Genome Res 24: 14 – 24
Benovoy D, Kwan T, Majewski J (2008) Effect of polymorphisms within probe–
target sequences on olignonucleotide microarray experiments. Nucl Acids
Res 36: 4417 – 4423
Bing N, Hoeschele I (2005) Genetical genomics analysis of a yeast
segregant population for transcription network inference. Genetics 170:
533 – 542
Bitton DA, Grallert A, Scutt PJ, Yates T, Li Y, Bradford JR, Hey Y, Pepper SD,
Hagan IM, Miller CJ (2011) Programmed fluctuations in sense/antisense
transcript ratios drive sexual differentiation in S. pombe. Mol Syst Biol 7:
559
Bloom JS, Ehrenreich IM, Loo WT, Lite T-LV, Kruglyak L (2013) Finding the
sources of missing heritability in a yeast cross. Nature 494: 234 – 237
Breitling R, Li Y, Tesson BM, Fu J, Wu C, Wiltshire T, Gerrits A, Bystrykh LV, de
Haan G, Su AI, Jansen RC (2008) Genetical genomics: spotlight on QTL
hotspots. PLoS Genet 4: e1000232
Brem RB, Yvert G, Clinton R, Kruglyak L (2002) Genetic dissection of
transcriptional regulation in budding yeast. Science 296: 752 – 755
Brem RB, Kruglyak L (2005) The landscape of genetic complexity across
5,700 gene expression traits in yeast. Proc Natl Acad Sci USA 102:
1572 – 1577
Brown WRA, Liti G, Rosa C, James S, Roberts I, Robert V, Jolly N, Tang W,
Baumann P, Green C, Schlegel K, Young J, Hirchaud F, Leek S, Thomas G,
Blomberg A, Warringer J (2011) A geographically diverse collection of
Schizosaccharomyces pombe isolates shows limited phenotypic variation
but extensive karyotypic diversity. G3 (Bethesda) 1: 615 – 626
Buchanan L, Durand-Dubief M, Roguev A, Sakalar C, Wilhelm B, Strålfors A,
Shevchenko A, Aasland R, Shevchenko A, Ekwall K, Francis Stewart A
(2009) The Schizosaccharomyces pombe JmjC-protein, Msc1, prevents H2A.Z
localization in centromeric and subtelomeric chromatin domains. PLoS
Genet 5: e1000726
Chambers SR, Hunter N, Louis EJ, Borts RH (1996) The mismatch repair
system reduces meiotic homeologous recombination and stimulates
recombination-dependent chromosome loss. Mol Cell Biol 16: 6110 – 6120
Chen C, Wei R, Qiao R, Ren J, Yang H, Liu C, Huang L (2012a) A genome-wide
investigation of expression characteristics of natural antisense transcripts
in liver and muscle samples of pigs. PLoS ONE 7: e52433
Molecular Systems Biology 10: 764 | 2014 ª 2014 The Authors
Molecular Systems Biology Genetic variation impacting antisense transcription Mathieu Clément-Ziza et al
20
Published online: November 28, 2014
Chen H-M, Rosebrock AP, Khan SR, Futcher B, Leatherwood JK (2012b)
Repression of meiotic genes by antisense transcription and by Fkh2
transcription factor in Schizosaccharomyces pombe. PLoS ONE 7: e29917
Costa V, Angelini C, De Feis I, Ciccodicola A (2010) Uncovering the complexity
of transcriptomes with RNA-Seq. J Biomed Biotechnol 2010: 853916
Creamer KM, Partridge JF (2011) RITS-connecting transcription, RNA
interference, and heterochromatin assembly in fission yeast. Wiley
Interdiscip Rev RNA 2: 632 – 646
Degner JF, Marioni JC, Pai AA, Pickrell JK, Nkadori E, Gilad Y, Pritchard JK
(2009) Effect of read-mapping biases on detecting allele-specific
expression from RNA-sequencing data. Bioinformatics 25: 3207 – 3212
DePristo MA, Banks E, Poplin R, Garimella KV, Maguire JR, Hartl C, Philippakis
AA, del Angel G, Rivas MA, Hanna M, McKenna A, Fennell TJ, Kernytsky AM,
Sivachenko AY, Cibulskis K, Gabriel SB, Altshuler D, Daly MJ (2011) A
framework for variation discovery and genotyping using next-generation
DNA sequencing data. Nat Genet 43: 491 – 498
Doss S, Schadt EE, Drake TA, Lusis AJ (2005) Cis-acting expression quantitative
trait loci in mice. Genome Res 15: 681 – 691
Edmands S (1999) Heterosis and outbreeding depression in interpopulation
crosses spanning a wide range of divergence. Evolution 53: 1757 – 1768
Ehrenreich IM, Gerke JP, Kruglyak L (2009) Genetic dissection of complex
traits in yeast: insights from studies of gene expression and other
phenotypes in the BYxRM cross. Cold Spring Harb Symp Quant Biol 74:
145 – 153
Faghihi MA, Wahlestedt C (2009) Regulatory roles of natural antisense
transcripts. Nat Rev Mol Cell Biol 10: 637 – 643
Feng L, Lintula S, Ho TH, Anastasina M, Paju A, Haglund C, Stenman U-H,
Hotakainen K, Orpana A, Kainov D, Stenman J (2012) Technique for
strand-specific gene-expression analysis and monitoring of
primer-independent cDNA synthesis in reverse transcription. Biotechniques
52: 263 – 270
Foss EJ, Radulovic D, Shaffer SA, Goodlett DR, Kruglyak L, Bedalov A (2011)
Genetic variation shapes protein networks mainly through
non-transcriptional mechanisms. PLoS Biol 9: e1001144
Franzén O, Jerlström-Hultqvist J, Einarsson E, Ankarklev J, Ferella M,
Andersson B, Svärd SG (2013) Transcriptome profiling of giardia
intestinalis using strand-specific RNA-seq. PLoS Comput Biol 9: e1003000
Funke M, Diederichs S, Kensy F, Müller C, Büchs J (2009) The baffled microtiter
plate: increased oxygen transfer and improved online monitoring in small
scale fermentations. Biotechnol Bioeng 103: 1118 – 1128
Gerrits A, Li Y, Tesson BM, Bystrykh LV, Weersing E, Ausema A, Dontje B,
Wang X, Breitling R, Jansen RC, de Haan G (2009) Expression quantitative
trait loci are highly sensitive to cellular differentiation state. PLoS Genet 5:
e1000692
Ghazalpour A, Doss S, Kang H, Farber C, Wen P-Z, Brozell A, Castellanos R,
Eskin E, Smith DJ, Drake TA, Lusis AJ (2008) High-resolution mapping of
gene expression using association in an outbred mouse stock. PLoS Genet
4: e1000149
Gimond C, Jovelin R, Han S, Ferrari C, Cutter AD, Braendle C (2013)
Outbreeding depression with low genetic variation in selfing
Caenorhabditis nematodes. Evolution 67: 3087 – 3101
Glatter T, Ludwig C, Ahrné E, Aebersold R, Heck AJR, Schmidt A (2012)
Large-scale quantitative assessment of different in-solution protein
digestion protocols reveals superior cleavage efficiency of tandem Lys-C/
Trypsin proteolysis over trypsin digestion. J Proteome Res 11: 5145 – 5156
Gregan J, Rabitsch PK, Rumpf C, Novatchkova M, Schleiffer A, Nasmyth K
(2006) High-throughput knockout screen in fission yeast. Nat Protoc 1:
2457 – 2464
Gunaratne J, Schmidt A, Quandt A, Neo SP, Sarac OS, Gracia T, Loguercio S,
Ahrne E, Xia RLH, Tan KH, Lossner C, Bähler J, Beyer A, Blackstock W,
Aebersold R (2013) Extensive mass spectrometry-based analysis of the
fission yeast proteome. Mol Cell Proteomics 12: 1741 – 1751
Haddad F, Qin AX, Giger JM, Guo H, Baldwin KM (2007) Potential pitfalls in
the accuracy of analysis of natural sense-antisense RNA pairs by reverse
transcription-PCR. BMC Biotechnol 7: 21
Holloway B, Luck S, Beatty M, Rafalski J-A, Li B (2011) Genome-wide
expression quantitative trait loci (eQTL) analysis in maize. BMC Genom 12:
336
Hou H, Wang Y, Kallgren SP, Thompson J, Yates JR III, Jia S (2010) Histone
variant H2A.Z regulates centromere silencing and chromosome
segregation in fission yeast. J Biol Chem 285: 1909 – 1918
Jansen RC, Nap JP (2001) Genetical genomics: the added value from
segregation. Trends Genet 17: 388 – 391
Jorde LB, Wooding SP (2004) Genetic variation, classification and “race”. Nat
Genet 36: S28 – S33
Kang HM, Zaitlen NA, Wade CM, Kirby A, Heckerman D, Daly MJ, Eskin E
(2008) Efficient control of population structure in model organism
association mapping. Genetics 178: 1709 – 1723
Käufer NF, Potashkin J (2000) Analysis of the splicing machinery in fission
yeast: a comparison with budding yeast and mammals. Nucleic Acids Res
28: 3003 – 3010
Keane TM, Goodstadt L, Danecek P, White MA, Wong K, Yalcin B, Heger A,
Agam A, Slater G, Goodson M, Furlotte NA, Eskin E, Nellåker C, Whitley H,
Cleak J, Janowitz D, Hernandez-Pliego P, Edwards A, Belgard TG, Oliver PL
et al (2011) Mouse genomic variation and its effect on phenotypes and
gene regulation. Nature 477: 289 – 294
Kensy F, Zang E, Faulhammer C, Tan R-K, Büchs J (2009) Validation of a
high-throughput fermentation system based on online monitoring of
biomass and fluorescence in continuously shaken microtiter plates. Microb
Cell Fact 8: 31
Keurentjes JJB, Fu J, Terpstra IR, Garcia JM, van den Ackerveken G, Snoek
LB, Peeters AJM, Vreugdenhil D, Koornneef M, Jansen RC (2007)
Regulatory network construction in Arabidopsis by using genome-wide
gene expression quantitative trait loci. Proc Natl Acad Sci USA 104:
1708 – 1713
Kim H-S, Vanoosthuyse V, Fillingham J, Roguev A, Watt S, Kislinger T, Treyer
A, Carpenter LR, Bennett CS, Emili A, Greenblatt JF, Hardwick KG, Krogan
NJ, Bähler J, Keogh M-C (2009) An acetylated form of histone H2A.Z
regulates chromosome architecture in Schizosaccharomyces pombe. Nat
Struct Mol Biol 16: 1286 – 1293
Kim D-U, Hayles J, Kim D, Wood V, Park H-O, Won M, Yoo H-S, Duhig T, Nam
M, Palmer G, Han S, Jeffery L, Baek S-T, Lee H, Shim YS, Lee M, Kim L, Heo
K-S, Noh EJ, Lee A-R et al (2010) Analysis of a genome-wide set of gene
deletions in the fission yeast Schizosaccharomyces pombe. Nat Biotechnol
28: 617 – 623
Kobor MS, Venkatasubrahmanyam S, Meneghini MD, Gin JW, Jennings JL, Link
AJ, Madhani HD, Rine J (2004) A protein complex containing the conserved
Swi2/Snf2-related ATPase Swr1p deposits histone variant H2A.Z into
euchromatin. PLoS Biol 2: E131
Kondrat’eva VI, Naumov GI (2001) The phenomenon of spore killing in
Schizosaccharomyces pombe hybrids. Dokl Biol Sci 379: 385 – 388
Krogan NJ, Keogh M-C, Datta N, Sawa C, Ryan OW, Ding H, Haw RA,
Pootoolal J, Tong A, Canadien V, Richards DP, Wu X, Emili A, Hughes
TR, Buratowski S, Greenblatt JF (2003) A Snf2 family ATPase complex
required for recruitment of the histone H2A variant Htz1. Mol Cell 12:
1565 – 1576
ª 2014 The Authors Molecular Systems Biology 10: 764 | 2014
Mathieu Clément-Ziza et al Genetic variation impacting antisense transcription Molecular Systems Biology
21
Published online: November 28, 2014
Kulp DC, Jagalur M (2006) Causal inference of regulator-target pairs by gene
mapping of expression phenotypes. BMC Genom 7: 125
Kumar V, Westra H-J, Karjalainen J, Zhernakova DV, Esko T, Hrdlickova B,
Almeida R, Zhernakova A, Reinmaa E, Võsa U, Hofker MH, Fehrmann RSN,
Fu J, Withoff S, Metspalu A, Franke L, Wijmenga C (2013) Human
disease-associated genetic variation impacts large intergenic non-coding
RNA expression. PLoS Genet 9: e1003201
Lalonde E, Ha KCH, Wang Z, Bemmo A, Kleinman CL, Kwan T, Pastinen T,
Majewski J (2011) RNA sequencing reveals the role of splicing
polymorphisms in regulating human gene expression. Genome Res 21:
545 – 554
Langmead B, Trapnell C, Pop M, Salzberg SL (2009) Ultrafast and
memory-efficient alignment of short DNA sequences to the human
genome. Genome Biol 10: R25
Leupold U (1950) Die Vererbung Von Homothallie Und Heterothallie Bei
Schizosaccharomyces pombe. Cr Trav Lab Carlsberg Ser Physiol 24: 381 – 480
Li H, Durbin R (2009) Fast and accurate short read alignment with Burrows–
Wheeler transform. Bioinformatics 25: 1754 – 1760
Liti G, Louis EJ (2012) Advances in quantitative trait analysis in yeast. PLoS
Genet 8: e1002912
Loguercio S, Overall RW, Michaelson JJ, Wiltshire T, Pletcher MT, Miller BH,
Walker JR, Kempermann G, Su AI, Beyer A (2010) Integrative analysis of
low- and high-resolution eQTL. PLoS ONE 5: e13920
López-Maury L, Marguerat S, Bähler J (2008) Tuning gene expression to
changing environments: from rapid responses to evolutionary adaptation.
Nat Rev Genet 9: 583 – 593
Luo J, Schumacher M, Scherer A, Sanoudou D, Megherbi D, Davison T, Shi T,
Tong W, Shi L, Hong H, Zhao C, Elloumi F, Shi W, Thomas R, Lin S,
Tillinghast G, Liu G, Zhou Y, Herman D, Li Y et al (2010) A comparison of
batch effect removal methods for enhancement of prediction performance
using MAQC-II microarray gene expression data. Pharmacogenomics J 10:
278 – 291
Lyne R, Burns G, Mata J, Penkett CJ, Rustici G, Chen D, Langford C, Vetrie D,
Bähler J (2003) Whole-genome microarrays of fission yeast: characteristics,
accuracy, reproducibility, and processing of array data. BMC Genom 4: 27
Majewski J, Pastinen T (2011) The study of eQTL variations by RNA-seq: from
SNPs to phenotypes. Trends Genet 27: 72 – 79
Malone JH, Oliver B (2011) Microarrays, deep sequencing and the true
measure of the transcriptome. BMC Biol 9: 34
Marguerat S, Bähler J (2010) RNA-seq: from technology to biology. Cell Mol
Life Sci 67: 569 – 579
Marguerat S, Schmidt A, Codlin S, Chen W, Aebersold R, Bähler J (2012)
Quantitative analysis of fission yeast transcriptomes and proteomes in
proliferating and quiescent cells. Cell 151: 671 – 683
Mayer C, Grummt I (2006) Ribosome biogenesis and cell growth: mTOR
coordinates transcription by all three classes of nuclear RNA polymerases.
Oncogene 25: 6384 – 6391
McClurg P, Janes J, Wu C, Delano DL, Walker JR, Batalov S, Takahashi JS,
Shimomura K, Kohsaka A, Bass J, Wiltshire T, Su AI (2007) Genomewide
association analysis in diverse inbred mice: power and population
structure. Genetics 176: 675 – 683
McIntyre LM, Lopiano KK, Morse AM, Amin V, Oberg AL, Young LJ, Nuzhdin SV
(2011) RNA-seq: technical variability and sampling. BMC Genom 12: 293
Michaelson JJ, Alberts R, Schughart K, Beyer A (2010) Data-driven assessment
of eQTL mapping methods. BMC Genom 11: 502
Mizuguchi G, Shen X, Landry J, Wu W-H, Sen S, Wu C (2004) ATP-driven
exchange of histone H2AZ variant catalyzed by SWR1 chromatin
remodeling complex. Science 303: 343 – 348
Montgomery SB, Sammeth M, Gutierrez-Arcelus M, Lach RP, Ingle C, Nisbett
J, Guigo R, Dermitzakis ET (2010) Transcriptome genetics using second
generation sequencing in a Caucasian population. Nature 464: 773 – 777
Montgomery SB, Lappalainen T, Gutierrez-Arcelus M, Dermitzakis ET (2011)
Rare and common regulatory variation in population-scale sequenced
human genomes. PLoS Genet 7: e1002144
Mortazavi A, Williams BA, McCue K, Schaeffer L, Wold B (2008) Mapping and
quantifying mammalian transcriptomes by RNA-Seq. Nat Meth 5: 621 – 628
Ni T, Tu K, Wang Z, Song S, Wu H, Xie B, Scott KC, Grewal SI, Gao Y, Zhu J
(2010) The prevalence and regulation of antisense transcripts in
Schizosaccharomyces pombe. PLoS ONE 5: e15271
Novembre J, Stephens M (2008) Interpreting principal component analyses of
spatial population genetic variation. Nat Genet 40: 646 – 649
Pandey RV, Franssen SU, Futschik A, Schlötterer C (2013) Allelic imbalance
metre (Allim), a new tool for measuring allele-specific gene expression
with RNA-seq data. Mol Ecol Resour 13: 740 – 745
Parts L, Cubillos FA, Warringer J, Jain K, Salinas F, Bumpstead SJ, Molin M, Zia
A, Simpson JT, Quail MA, Moses A, Louis EJ, Durbin R, Liti G (2011)
Revealing the genetic structure of a trait by sequencing a population
under selection. Genome Res 21: 1131 – 1138
Patch A-M, Aves SJ (2007) Fingerprinting fission yeast: polymorphic markers
for molecular genetic analysis of Schizosaccharomyces pombe strains.
Microbiology 153: 887 – 897
Patterson N, Price AL, Reich D (2006) Population structure and eigenanalysis.
PLoS Genet 2: e190
Pelechano V, Steinmetz LM (2013) Gene regulation by antisense transcription.
Nat Rev Genet 14: 880 – 893
Pelechano V, Wei W, Steinmetz LM (2013) Extensive transcriptional
heterogeneity revealed by isoform profiling. Nature 497: 127 – 131
Perocchi F, Xu Z, Clauder-Münster S, Steinmetz LM (2007) Antisense artifacts
in transcriptome microarray experiments are resolved by actinomycin D.
Nucleic Acids Res 35: e128
Pickrell JK, Marioni JC, Pai AA, Degner JF, Engelhardt BE, Nkadori E, Veyrieras
J-B, Stephens M, Gilad Y, Pritchard JK (2010) Understanding mechanisms
underlying human gene expression variation with RNA sequencing. Nature
464: 768 – 772
Piskol R, Ramaswami G, Li JB (2013) Reliable identification of genomic
variants from RNA-Seq data. Am J Hum Genet 93: 641 – 651
Price AL, Patterson NJ, Plenge RM, Weinblatt ME, Shadick NA, Reich D (2006)
Principal components analysis corrects for stratification in genome-wide
association studies. Nat Genet 38: 904 – 909
Price AL, Zaitlen NA, Reich D, Patterson N (2010) New approaches to
population stratification in genome-wide association studies. Nat Rev
Genet 11: 459 – 463
Quinn EM, Cormican P, Kenny EM, Hill M, Anney R, Gill M, Corvin AP, Morris
DW (2013) Development of strategies for SNP detection in RNA-Seq data:
application to lymphoblastoid cell lines and evaluation using 1000
genomes data. PLoS ONE 8: e58815
Reddy TE, Gertz J, Pauli F, Kucera KS, Varley KE, Newberry KM, Marinov GK,
Mortazavi A, Williams BA, Song L, Crawford GE, Wold B, Willard HF, Myers
RM (2012) Effects of sequence variation on differential allelic transcription
factor occupancy and gene expression. Genome Res 22: 860 – 869
Rhind N, Chen Z, Yassour M, Thompson DA, Haas BJ, Habib N, Wapinski I, Roy S,
Lin MF, Heiman DI, Young SK, Furuya K, Guo Y, Pidoux A, Chen HM,
Robbertse B, Goldberg JM, Aoki K, Bayne EH, Berlin AM et al (2011)
Comparative functional genomics of the fission yeasts. Science 332: 930 – 936
Rockman MV, Kruglyak L (2006) Genetics of global gene expression. Nat Rev
Genet 7: 862 – 872
Molecular Systems Biology 10: 764 | 2014 ª 2014 The Authors
Molecular Systems Biology Genetic variation impacting antisense transcription Mathieu Clément-Ziza et al
22
Published online: November 28, 2014
Ronald J, Brem RB, Whittle J, Kruglyak L (2005) Local regulatory variation in
Saccharomyces cerevisiae. PLoS Genet 1: e25
Satya RV, Zavaljevski N, Reifman J (2012) A new strategy to reduce allelic
bias in RNA-Seq readmapping. Nucl Acids Res 40: e127
Schadt EE, Monks SA, Drake TA, Lusis AJ, Che N, Colinayo V, Ruff TG, Milligan
SB, Lamb JR, Cavet G, Linsley PS, Mao M, Stoughton RB, Friend SH (2003)
Genetics of gene expression surveyed in maize, mouse and man. Nature
422: 297 – 302
Schadt EE, Molony C, Chudin E, Hao K, Yang X, Lum PY, Kasarskis A, Zhang B,
Wang S, Suver C, Zhu J, Millstein J, Sieberts S, Lamb J, GuhaThakurta D, Derry
J, Storey JD, Avila-Campillo I, Kruger MJ, Johnson JM et al (2008) Mapping
the genetic architecture of gene expression in human liver. PLoS Biol 6: e107
Schmelzle T, Hall MN (2000) TOR, a central controller of cell growth. Cell 103:
253 – 262
Schwartz SH, Silva J, Burstein D, Pupko T, Eyras E, Ast G (2008) Large-scale
comparative analysis of splicing signals and their corresponding splicing
factors in eukaryotes. Genome Res 18: 88 – 103
Sohal RS, Weindruch R (1996) Oxidative stress, caloric restriction, and aging.
Science 273: 59 – 63
Stevenson KR, Coolon JD, Wittkopp PJ (2013) Sources of bias in measures of
allele-specific expression derived from RNA-seq data aligned to a single
reference genome. BMC Genom 14: 536
Sun W (2012) A statistical framework for eQTL mapping using RNA-seq data.
Biometrics 68: 1 – 11
Suthram S, Beyer A, Karp RM, Eldar Y, Ideker T (2008) eQED: an efficient
method for interpreting eQTL associations using protein networks. Mol
Syst Biol 4: 162
Turro E, Su S-Y, Gonçalves Â, Coin LJ, Richardson S, Lewin A (2011) Haplotype
and isoform specific expression estimation using multi-mapping RNA-seq
reads. Genome Biol 12: R13
Verbeke LPC, Cloots L, Demeester P, Fostier J, Marchal K (2013) EPSILON: an
eQTL prioritization framework using similarity measures derived from
local networks. Bioinformatics 29: 1308 – 1316
Verdugo RA, Farber CR, Warden CH, Medrano JF (2010) Serious limitations of
the QTL/Microarray approach for QTL gene discovery. BMC Biol 8: 96
Wang S, Zheng T, Wang Y (2007) Transcription activity hot spot, is it real or
an artifact? BMC Proc 1: S94
Wang Z, Gerstein M, Snyder M (2009) RNA-seq: a revolutionary tool for
transcriptomics. Nat Rev Genet 10: 57 – 63
West MAL, Kim K, Kliebenstein DJ, van Leeuwen H, Michelmore RW, Doerge
RW, St Clair DA (2007) Global eQTL mapping reveals the complex genetic
architecture of transcript-level variation in Arabidopsis. Genetics 175:
1441 – 1450
Wilhelm BT, Marguerat S, Watt S, Schubert F, Wood V, Goodhead I, Penkett CJ,
Rogers J, Bähler J (2008) Dynamic repertoire of a eukaryotic transcriptome
surveyed at single-nucleotide resolution. Nature 453: 1239 – 1243
Willenbrock H, Salomon J, Søkilde R, Barken KB, Hansen TN, Nielsen FC,
Møller S, Litman T (2009) Quantitative miRNA expression analysis:
comparing microarrays with next-generation sequencing. RNA 15:
2028 – 2034
Williams RW (2006) Expression genetics and the phenotype revolution.
Mamm Genome 17: 496 – 502
Wu W-H, Alami S, Luk E, Wu C-H, Sen S, Mizuguchi G, Wei D, Wu C
(2005) Swc2 is a widely conserved H2AZ-binding module essential for
ATP-dependent histone exchange. Nat Struct Mol Biol 12: 1064 – 1071
Wu TD, Nacu S (2010) Fast and SNP-tolerant detection of complex variants
and splicing in short reads. Bioinformatics 26: 873 – 881
Xu Z, Wei W, Gagneur J, Clauder-Münster S, Smolik M, Huber W, Steinmetz
LM (2011) Antisense expression increases gene expression variability and
locus interdependency. Mol Syst Biol 7: 468
Yvert G, Brem RB, Whittle J, Akey JM, Foss E, Smith EN, Mackelprang R,
Kruglyak L (2003) Trans-acting regulatory variation in Saccharomyces
cerevisiae and the role of transcription factors. Nat Genet 35: 57 – 64
Zhang Y, Liu T, Meyer CA, Eeckhoute J, Johnson DS, Bernstein BE, Nusbaum C,
Myers RM, Brown M, Li W, Liu XS (2008) Model-based analysis of
ChIP-Seq (MACS). Genome Biol 9: R137
Zhang K, Fischer T, Porter RL, Dhakshnamoorthy J, Zofall M, Zhou M,
Veenstra T, Grewal SIS (2011) Clr4/Suv39 and RNA quality control factors
cooperate to trigger RNAi and suppress antisense RNA. Science 331:
1624 – 1627
Zofall M, Fischer T, Zhang K, Zhou M, Cui B, Veenstra TD, Grewal SIS (2009)
Histone H2A.Z cooperates with RNAi and heterochromatin factors to
suppress antisense RNAs. Nature 461: 419 – 422
Zuin A, Castellano-Esteve D, Ayte J, Hidalgo E (2010) Living on the edge:
stress and activation of stress responses promote lifespan extension. Aging
2: 231 – 237
License: This is an open access article under the
terms of the Creative Commons Attribution 4.0
License, which permits use, distribution and reproduc-
tion in any medium, provided the original work is
properly cited.
23ª 2014 The Authors Molecular Systems Biology 10: 764 | 2014
Mathieu Clément-Ziza et al Genetic variation impacting antisense transcription Molecular Systems Biology
Published online: November 28, 2014

Published online: November 28, 2014


![Genetic Variation[1]](https://img.pdfslide.net/doc/110x75/577ce3381a28abf1038b98cf/genetic-variation1.jpg)