Embed Size (px)
Citation preview

Natural History of
SAN FRANCISCO BAY
Ariel Rubissow Okamoto Kathleen M. Wong
U N I V E R S I T Y O F C A L I F O R N I A P R E S S
Be r ke l ey L o s Ange l e s L ondon
Okamoto.indb 3 5/4/2011 2:40:07 PM

CONTENTS
Prologue xiAcknowledgments xiii
Taking the Plunge 1An Ever-Changing Environment 4Saving the Bay 6Inside and Out 8
Beneath the Surface: What Is an Estuar y? 13Geography and Geology 17Fresh and Salt Mix 21Rivers 23Creeks and Drainages 29Bays within the Bay 30Tides, Offshore Currents, and Upwelling 32Water Layers and Flows 35Wind, Waves, and Erosion 40Sediment 41Weather and Ocean Cycles 45Climate over Millennia 48Conclusion 50
V isible and Invisible Life: F ish, Birds, and Other Wildlife 53
Living Conditions 56Plants 67Bottom-dwellers 74Fish 78Mammals 92Birds 95Conclusion 103
Okamoto.indb 7 5/4/2011 2:40:15 PM

Histor y of Human Changes: 1800s–1960s 105Earliest Inhabitants 108Explorers, Missionaries, and Hunters 111The Allure of Gold 113Fighting Floods 117Reclaiming Swamps 118Farms and Towns Expand 120Fishing for a Living 122Culturing Oysters 127Fish and Wildlife Protection 128Industrialized Fishing 130Bay and Riverfront Enterprise 132Transportation Facilities 134Controlling Water Supply and Floods 138Growing through War 144Conclusion 147
The Environmental Backlash: 1960s–Present 149Stopping Fill 152Clean Water 157Preventing Spills and Runoff 162Emerging Contaminants 166Curing the Throwaway Habit 171Last of the Fishing 173Maintaining Ports and Shipping 177A Place for Wetlands and Wildlife 180Warring over Water 190Caring for Urban Creeks 197Preventing Invasions 199A Few Bad Actors 202Synergistic Problems 205Conclusion 207
Restoration Frontiers: The Watershed 209Historical Milestones 212Key Ingredients: A Riparian Recipe 214The Big River Projects 216The Delta and Shallows 218Water Rights for the Ecosystem 219Production or Conservation Hatcheries? 223Reviving Bay Creeks 225Bringing Back the Steelhead 230Conserving and Recycling Water 232Conclusion 235
Okamoto.indb 8 5/4/2011 2:40:16 PM
Restoration Frontiers: The Bay 237Historical Milestones 240Key Ingredients: A Wetland Recipe 246The Marin Shore 252North Bay Hayfields 256South Bay Salt Ponds Reborn 262Weeding by Satellite 268Underwater Restoration 274Central Bay Eelgrass Beds 276Oysters Back in the Bay? 279Building a Healthy Ethic 281Conclusion 284
Climate Change and the Bay’s Future 285Climate Change Basics 288The Bay’s Vulnerabilities 290Wetlands as Buffers 294Adaptation 296
Coda 299Glossary 303Historical Timeline 307References 313Learning More, Helping Out: A Few Places to Start 320Art Credits 323Index 325
Okamoto.indb 9 5/4/2011 2:40:16 PM

TA K I N G T H E P L U N G E 3
EMMA MACCHIARINI SWAM before she walked. On the morning of July 12, 1989, she got up early, dressed in a sparkly swimsuit with a pink bow, smeared herself with Vaseline, and stepped into the bay. Swimming from Fort Point under the southern tower of the Golden Gate Bridge to Lime Point on the opposite shore, she aimed to cross a coastal opening where currents surge with all the force of an entire ocean on one side and the state’s mightiest rivers on the other. She recalls thinking while in the water that they’d got the tides all wrong. The swim was much more work, and took much longer, than she’d imagined.
At one point during her swim, Emma feared she wasn’t going to make it. But she kept lifting her arms and kicking her feet in the freezing grey water, accompanied by her father swimming beside her and her mother paddling a boogie board. At another point, a container ship cut across her path, and the two bar pilots shadowing her in a Zodiac signaled wildly to both the towering vessel and the slip of a girl to watch out. Eventually she was able to see the beach ahead, but never seemed to get there. Then she remembers her father saying, “Stand up, Emma,” as she found her footing on the Marin County shore.
The headline in the San Francisco Chronicle the next day read: “Girl, 8, Conquers Gate.” The black-and-white photo hid the green algae on her face. Macchiarini was one of the youngest people ever to swim the mile-wide channel under the red bridge. She got fan mail, and television cover-age of her feat.
On that foggy day decades ago, Macchiarini swam across the deepest part of San Francisco Bay, where the bottom lies 330 feet below sea level.
Girl dives into the bay in the early 1900s. (Courtesy of The Dolphin Club, Shirley Coleman Collection)
Okamoto.indb 3 5/4/2011 2:40:24 PM

4 TA K I N G T H E P L U N G E
But most of the bay, which encompasses 470 square miles of open water between the narrows of the Golden Gate and the Carquinez Strait, is less than 12 feet deep. From one end to the other, the bay is about 42 miles in length and ranges from 5 to 13 miles in width. Before radar and sonar, ships regularly hit the fog-obscured rocks at its entrance. And gold- seekers abandoned so many vessels off the tiny town of San Francisco that new residents built right on top of them. These opportunists became the first in a long line of Bay fillers who saw more dollar signs along the water-front than up in the mother lode.
Today, 7 million people live on the shores and hills surrounding San Francisco Bay. Around this extraordinary natural harbor, they and their predecessors have built 46 cities, 6 ports, 4 airports, and 275 marinas, not to mention myriad industrial centers, oil refineries, and military bases. They have also set aside miles of bayshore for recreation and wildlife in the form of 135 parks, refuges, and reserves.
To locals, the bay is a breathing space, a blue prairie of water outside their windows and beside their communities. To tourists, it’s the water under the Golden Gate Bridge, the rippling backdrop to one of the engi-neering marvels of the West.
An Ever-Changing Environment
San Francisco Bay is an estuary where rivers draining 40 percent of Cali-fornia’s landscape meet and mix with the Pacific Ocean; where coastal and inland ecosystems overlap; where seabirds and songbirds ply the skies; where sharks swim with sardines; and where species both native and alien compete for space and food alongside some equally competitive primates.
Here at the edge of the North American continent, cool ocean water and air encounter their warmer inland counterparts, shaping an environ-ment in constant flux. One minute the sun may blaze down from above, whereas the next is wet with fog drip. Tides coming in may suddenly go out; wave trains may collide, encountering a shifting breeze or a change of current; and brown plumes of sediment-laden fresh water from the rivers upstream may dissolve into the bluer bay just west of the Carquinez Bridge or drive a muddy arrow through the Golden Gate and out to the Farallon Islands.
In this coastal zone, the continental and oceanic plates of the planet can shift against one another at any moment, sending a bridge or levee collapsing into the water. It can grow hot and dry enough for fire to con-sume most of Angel Island in one night, and cold enough for snow to stick on Mount Tamalpais. El Niño and La Niña rearrange the water layers
Okamoto.indb 4 5/4/2011 2:40:24 PM

B E N E AT H T H E S U R FA C E : W H AT I S A N E S T U A R Y ? 41
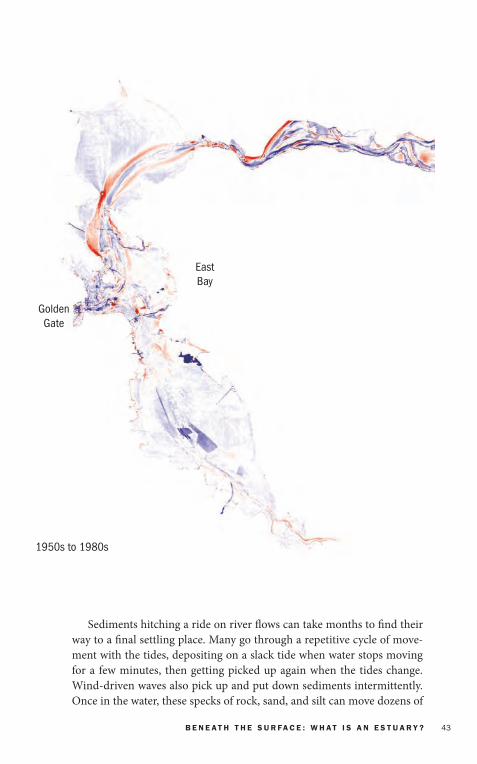
of local streams and tributaries beneath the surface of the bay. All of this changed after the California Gold Rush, whose miners washed away entire hillsides in search of the yellow ore. Bruce Jaffe’s research shows that sedi-ment pouring down from the gold mines over three decades (1856–1887) filled up the Petaluma River channel, more than doubled the acreage of surrounding mudflats, and smothered San Pablo Bay with 230 million cubic yards of soil from the Coast Ranges and Sierra uplands (see Figure 3).
The USGS’s Jaffe notes that all of this deposition on the floor of the bay 100 years ago stopped around 1950. Then erosion began. As farmers around the bay and river banks built dikes to drain land for agriculture and to control flooding, and others upstream diverted river flows for human uses, these waters were cut off from sediment supplies upstream and along shores. Ninety acres of San Pablo Bay mudflats—those flat buf-fer lands between bay and shore—disappeared every year between 1951 and 1983, says Jaffe.
Today’s bay shallows remain at the mercy of the wind. When it’s shal-low, it’s easier for the antics of the wind on the surface to roil the bottom. In shallow parts of the bay, winds create waves that loop water up, down, around, and back again—from surface to bay floor. And since these wind-waves reach all the way down to the bottom, they also pick up and move things on the bottom, like mud.
Sediment
For many people, brown water is a red flag. Water quality managers re-ceive frequent reports of brown water from concerned locals who assume it’s a sewage leak or pollutant spill. San Francisco Bay is certainly more brown and turbid (cloudy) than most estuaries. Even if the water is very brown, it’s generally not dirty or polluted, but filled with sediment. In-deed, whatever the color—brown, green, grey, blue—most hues come from suspended sediments and how they absorb and reflect light. Even a small amount of sediment can reflect a lot of light. On the muddiest days (usually in spring, when runoff volume is greatest), the amount of sedi-ment in the water is well below 1 percent. USGS scientist David Schoell-hamer, who has studied sediment transport in the bay, says if you flooded an island with 10 feet of chocolate-hued water from the bay and let it settle out, you’d wind up with less than a tenth of an inch of deposition on the bottom.
Sediment is an important part of the bay’s physical condition. The larg-est concentrations appear on the surface with freshwater runoff in spring and summer. By fall and winter, most of it has sunk down to the bottom or
Okamoto.indb 41 5/4/2011 2:43:23 PM

42 B E N E AT H T H E S U R FA C E : W H AT I S A N E S T U A R Y ?
No change1
105432
15
1
105432
15
Change (m)
Eros
ion
~
D
epos
ition
Shallower (deposition or �ll)
Deeper (erosion or removal)
1850s to 1890s
0 3 6 9 12 Kilometers
GoldenGate
EastBay
Figure 3. Changes in sediment deposition and erosion patterns in the bay between the 1850s and 1980s, largely as a result of hydraulic gold mining. (Bruce Jaffe)
settled out on a shoreline. “Rocks want to sink, because that’s what rocks do in water. They’re ‘negatively buoyant,’ ” says Schoellhamer. “If the rock had a life jacket on, it would be ‘positively buoyant.’ ” He goes on to explain how two primary forcing mechanisms keep the rocks up in the water col-umn instead of allowing them to sink down: tidal currents and wind-waves.
Okamoto.indb 42 5/4/2011 2:43:34 PM
B E N E AT H T H E S U R FA C E : W H AT I S A N E S T U A R Y ? 43
1950s to 1980s
GoldenGate
EastBay
Sediments hitching a ride on river flows can take months to find their way to a final settling place. Many go through a repetitive cycle of move-ment with the tides, depositing on a slack tide when water stops moving for a few minutes, then getting picked up again when the tides change. Wind-driven waves also pick up and put down sediments intermittently. Once in the water, these specks of rock, sand, and silt can move dozens of
Okamoto.indb 43 5/4/2011 2:43:44 PM

44 B E N E AT H T H E S U R FA C E : W H AT I S A N E S T U A R Y ?
times before settling out. Multiply that by the billions of specks suspended in the bay at any given moment and it’s clear just how solid the liquids are in this estuary.
“Typically in estuaries the finest material is up near the rivers,” explains Schoellhamer. “Things like the two-layer flows and the asymmetry of tides generally move the finer material preferentially toward the land, and the coarser material out toward the ocean. In this estuary, we have the large sandbars out on the continental shelf, and those may act as a source of sand moving into Central Bay. Also, near the mouth of the estuary at the Golden Gate, we have generally the biggest tides and biggest water veloc-ity, which again applies the most force, so the smaller rocks are not going to settle, as they are constantly picked up and moved somewhere else with every tide. Only the heavier stuff—the sand—can actually stay down there. That’s why it’s clearer down at the bottom of the Central Bay than in the shallower bays.”
Sediments are good for the bay in several ways. First, the bay’s natural turbidity protects it from the harmful algae blooms that plague other estu-aries. Not enough sunlight penetrates into the water to drive phytoplank-ton growth. Second, contaminants introduced into the water often attach themselves to sediments and settle out, thereby getting removed either temporarily or permanently from circulation. Third, the estuary’s wet-lands and beaches need a steady supply of sediments to sustain places for
Erosion of the San Pablo baylands shoreline. (Jude Stalker)
Okamoto.indb 44 5/4/2011 2:43:51 PM

B E N E AT H T H E S U R FA C E : W H AT I S A N E S T U A R Y ? 45
shoreline jaunts and barbecue spots, and for egrets, rails, and sandpipers probing the mud for goodies.
The bay may not be murky forever. Between 1957 and 2001, the amount of sediment coming down the Sacramento River decreased by 50 percent. But the supply will never dwindle away to nothing. Sediments will always be eroded off banks and shores by water and will move downstream.
Weather and Ocean Cycles
Climate often dictates the state of bay waters. It drives winds, currents, and waves, and it alters the temperature of air and water. Central California experiences a Mediterranean climate pattern with two distinct seasons: a warm, dry period from April to October, followed by a cool, rainy period from November to March. As the rainy season ends, snowmelt fortified by the season’s final storms swells the banks of streams and lowers the salinity of estuary waters. This runoff wanes with summer, reducing many creeks to a trickle.
Westerly winds that began in spring intensify in summer, forcing ocean waters shoreward. Near land, the rotation of the earth deflects currents to
MIGRATIONS: PARTICULATE TRAVELS FROM MOUNTAIN TO SEA
Imagine three rocks sitting on the sunny slope of a Sierra foothill in the 1850s: one a speck of quartz, one a particle of clay, and one a skipping stone–sized pebble. A miner aims a hose at the hill and blasts all three rocks off the slope and down into a sluice box, where they are all separated from their gold-bearing peers and dropped on the bank of a creek. The pebble is too large and heavy to move far, and it ends up stuck on the bank for centu-ries, until a major storm carries it down to a sandbar a few miles downriver, where it spends more centuries. The speck, however, soon gets carried away and joins the swell of spring rainwater rushing downstream. Being very small and fine, the speck moves as fast as the water, surfing the surface flows right through the bay and out the Golden Gate within a matter of days. The heavier clay particle, meanwhile, follows the speck but makes a few stops along the way downstream until it settles on a channel bank at the bottom of San Pablo Bay. Here it soon gets a lot of company, as a blanket of other particles of clay, mud, and silt slowly builds over it until it’s buried under six feet of other solids. Several decades later the clay particle might be scooped up and deposited on a dike by a dredger or scoured out by a 100-year flood, resuspended, and grabbed by a scientist in a bay-floor sample.
Okamoto.indb 45 5/4/2011 2:43:51 PM

62 F I S H , B I R D S , A N D O T H E R W I L D L I F E
tory of Human Changes”). Development reduced open waters by 50 per-cent and wetlands by 80 percent, and urbanized 50 percent of the sur-rounding uplands.
The Marine NurseryLike all good parents, aquatic organisms seek to give their young the most advantageous upbringing they can. The bay’s many amenities make it an appealing site for marine species to rear their young. Gentle waves, a con-sistent supply of food, turbid waters that offer cover from predators, and warmer waters than the open ocean make the bay a nurturing environ-ment for many kinds of helpless juveniles.
Some marine species, like herring, lay their eggs in the bay itself. But many others reproduce in the rich coastal waters just outside the Golden Gate. The majority breed in winter, when upwelling is at its weakest and less likely to carry young away from the shore. When spring arrives, up-welling produces plentiful food for their tiny offspring.
Species such as flatfish and Dungeness Crab travel into the bay during early life stages and remain to mature. Breeding out in the ocean, their parents strive to deposit eggs near enough to the coast for hatchlings to
Low-tide habitats at the Palo Alto baylands. (Jude Stalker)
Okamoto.indb 62 5/4/2011 2:44:23 PM

F I S H , B I R D S , A N D O T H E R W I L D L I F E 63
crawl, swim, or ride the flood tides, or bottom current, through the Golden Gate. If parental timing and placement is off, these youngsters end up in other near-shore areas up and down the coast. Those larvae and ju-veniles that do maneuver themselves into San Francisco Bay find a shel-tered, relatively warm, and food-filled place to grow up.
Entering the bay is one thing; managing to stay there is another. “There’s no species that comes into San Francisco Bay to reproduce, or that is resi-dent here, that hasn’t got some mechanism or strategy to keep their young here, some way of reducing their chances of being carried out the Golden Gate or up and down the coast by tides or currents,” says biologist Kathy Hieb of the California Department of Fish and Game. Hieb conducts a longstanding survey of bay life every month to monitor estuary health.
Some of these staying strategies include producing sticky eggs, build-ing nests, bearing live young in safe shallows, and timing reproduction to coincide with currents or tides headed in the right direction. Such strate-gies are one reason species that live in and around estuaries are so special. “They sense which way is upstream. There’s some gradient beyond just salinity, something in estuarine water like dissolved organics and plant materials, that they can detect using their olfactory senses,” Hieb says.
Fundamental FoodThe slate-grey waters of the bay can be considered a soup made up of nu-trients, sediment, and microscopic organisms called plankton. The calo-ries these minute creatures produce provide an essential foundation for all life in the bay and coastal ocean. Without plankton, the bay and ocean would offer little to eat.
A wide variety of bay creatures graze directly on plankton. These range from adult anchovies and herring to barnacles and larval fishes. Plank- ton not eaten while still alive sink to the bay floor and support filter-
Herring roe (eggs) on blades of eelgrass. Roe from San Francisco Bay are particularly prized by Japanese food buyers, who value their unusual golden hue.
Okamoto.indb 63 5/4/2011 2:44:30 PM

F I S H , B I R D S , A N D O T H E R W I L D L I F E 79
The bay fish with the most teeth and the fewest bones—with cartilage instead of a bony skeleton—are sharks. The presence of sharks in the bay at any given time is contingent on local water conditions. If the water gets too warm or fresh, sharks will depart for the ocean; if conditions remain cool, marine sharks will take up residence. Leopard Sharks and Bat Rays tolerate the lower-oxygen, warmer waters of the South Bay better than other marine species, and often hang out there. Sevengill, Leopard, and Dogfish Sharks all mate and birth their pups in estuary waters.
Though neither as big nor as glamorous as sharks or salmon, the most tenacious fish in the region may be the natives that live in bay creeks and small rivers. A surprising diversity of endemic freshwater fish survives in the streams that connect upland regions with the bay.
Pacific HerringPacific Herring (Clupea pallasii) have been known to enter the estuary by the millions. Imagine the main shipping channel between the Bay Bridge and the San Rafael Bridge as a 12-mile-long, 80-foot-thick river of silver. On a fish scanner, the biggest schools form what biologist Ken Oda dubs “giant sausage links” that stretch from one end of the bay to the other. Oda should know—he’s studied herring runs around the bay for 20 years at the California Department of Fish and Game. On the surface, however, the only hints of the herring’s arrival may be hovering gulls and bobbing sea lions, which come to gorge themselves on spawning fish.
Chinook Salmon found in Battle Creek. (California Department of Fish and Game)
Okamoto.indb 79 5/4/2011 2:45:24 PM

80 F I S H , B I R D S , A N D O T H E R W I L D L I F E
Pacific Herring collect in the bay starting in November and ending in March. The second and third waves of fish are typically the largest. After that, the Golden Gate becomes a revolving door as schools arrive, lay and fertilize their eggs, then return to the ocean. Herring may reprise this trip every year for their 11-year lifespan.
Herring will deposit their eggs on virtually any hard surface. In some months, San Francisco’s entire waterfront, from Marina Green to Hunter’s Point, may be covered with herring roe as ripe, full-bellied females unload a clutch of 4,000 to 134,000 eggs on any available rock, pier piling, sunken log, shipwreck, riprap block, and waterfront wall. Eelgrass blades and algae mats are also favored substrates. The fish have made a few modern adaptations too, spawning on the plastic mesh sacks used to package rice.
As female after female spawns on the same surfaces, some places ac-quire coatings of eggs up to nine layers deep. By late in the season, the pilings look like they’re wrapped in tan rubber bands, says Oda.
The spawning of Pacific Herring is one of the easier wildlife events to witness. Anyone out on a lighted dock or breakwater in the evening, espe-cially after a storm, might catch a swirl of activity in the waters below. “If you’re in the right place at the right time, you can actually see it happen-ing,” says Oda’s colleague Becky Ota, who managed the bay’s commercial herring fishery for the California Department of Fish and Game for 10 years. “You’d see fish madly swimming around the piling—females getting really close to those pilings with their vents and depositing those eggs, and males zipping around and releasing milt. One morning I was headed over the Golden Gate Bridge very early and I knew right away there was a spawning event going on because the water at Fort Baker was just white with milt.”
Once they’ve deposited their eggs, adult herring return almost imme-diately to the ocean. The egg masses left behind in the bay, meanwhile, at-tract gulls, Surf Scoters, and sturgeon. Within the 10 days or so it takes each batch of herring eggs to hatch, up to 95 percent are eaten. Eggs that aren’t fodder for animals higher up the food chain develop from larvae to
Pacific Herring. Locals have been catch-ing and eating Pacific Herring since the first humans settled around the bay. Na-tive Americans stretched their herring nets between two tule balsas, and weighted the edge with stone sinkers. According to UC Berkeley’s Kent Light-foot, they also collected herring thrown up on the beach by storms. (Ryan Bartling)
Okamoto.indb 80 5/4/2011 2:45:38 PM

F I S H , B I R D S , A N D O T H E R W I L D L I F E 81
swimming fish within three months. By fall, these herring have left the bay, not to return until they are mature and ready to spawn at two to three years old.
In recent decades, juvenile herring in San Francisco Bay have suffered from loss of food, predation, and changing conditions. State fish managers estimated that the spawning biomass for the 2009–2010 season was 38,409 tons—down from an historical average of more than 49,000 tons but up from the 2008–2009 low of 4,833 tons. Though herring support one of the bay’s handful of remaining commercial fisheries, the fishery’s future re-mains uncertain (see p. 173, “Last of the Fishing”).
Northern AnchovyThe Northern Anchovy (Engraulis mordax), the most abundant fish in the bay, is a small silver fish about the size of a french fry. As the foundation of a second commercial bay fishery, anchovies are used mostly as live bait for party boat fishing vessels and private anglers.
Northern Anchovies are easily distin-guished from other small silver fish by their severe overbite—a characteristic scientists call “stupid mouth.” (Aquarium of the Bay)
The life cycles of Northern Anchovy and herring are reversed. Whereas herring live offshore and come into the bay to spawn, most anchovies spawn offshore and move into the bay to grow up. Though this species can be found inside the bay for much of the year, their numbers peak from April to October. Scientists think that coastal upwelling and the subse-quent plankton blooms trigger their spring arrival, and cooling bay waters spur their fall departure. Northern Anchovy can live for up to four years.
Longfin SmeltAt first glance, the Longfin Smelt is just one more of the half-dozen small silver fish species found in the bay. But the Longfin Smelt (Spirinchus tha-leichthys) makes more complete use of the bay than any other small native fish. Its ability to tolerate a particularly wide range of salinities allows the Longfin Smelt to linger in the estuary’s changeable water conditions. Within a month of hatching, their tiny larvae (roughly 0.4 inches in size),
Okamoto.indb 81 5/4/2011 2:45:41 PM

H I S T O R Y O F H U M A N C H A N G E S 117
Fighting Floods
Though the mining debris worried the town and farm folk in the valley, the floods that seemed to arrive year after year worried them more. As they planted crops and trees with diligence, and laid out homes, schools, and city halls, floods kept soaking or sweeping away their investments. The Native Americans had told the region’s first visitors that the valley regularly filled with wall-to-wall water. As Kelley describes it: “During the annual winter cycle of torrential storms . . . or in the season of the spring snow melt . . . the Sacramento River and its tributaries rose like a vast tak-ing in of breath to flow out over their banks onto the wide Valley floor, there to produce terrifying floods. On that remarkably level expanse the spreading waters then stilled and ponded to form an immense, quiet in-land sea a hundred miles long, with its dense flocks of birds rising abruptly to wheel in the sky and its still masses of tule rushes stretching from the delta to the Sutter Buttes and beyond. Not until the late spring and sum-mer months would it drain away downstream.”
Historic floods on the Sacramento River outdid those of even the great Mississippi in magnitude. The Mississippi takes days to rise, gathering water slowly from a vast area encompassing half the continent. But snow-melt and storm water swell the Sacramento with great speed, coming from
Flooding on 4th Street, between L and M Streets, Sacramento, during 1862. (De-partment of Water Resources)
Okamoto.indb 117 5/4/2011 2:48:32 PM
118 H I S T O R Y O F H U M A N C H A N G E S
nearby mountain ranges and quickly overtopping riverbanks to spread across the Central Valley.
The settlers that came to the valley were full of the vim and vigor of conquering the West. Taming nature was just part of a day’s work, and the fertile river plains of the Central Valley were worth the risk. They didn’t really believe the size of the floods described by the Native Americans or in the speed with which such waters could arrive on their doorsteps. But flow gauges set up by the U.S. Geological Survey in the early 1900s con-firmed that the Sacramento River could rise from its normal flow of 5,000 cubic feet per second (cfs) to 600,000 cfs in less than a week—an amount that could never be contained within its natural banks.
On January 7, 1850, the small riverfront town of Sacramento experi-enced its first flood. The river rushed and swirled through the entire town, rising to the first floor of most houses and stores, and soaking others. The flood brought citizens together for a meeting, where they decided to build an earthen flood wall around the entire town. This first California levee would kick off decades of individual communities or property owners building small levees or dams willy-nilly, and of floods every few years that wiped out what crops, goods, and livestock the people had managed to amass.
Localism ruled, and the rights of individual property owners remained sacred. The response of most landowners threatened or engulfed by water was to redirect the water to a neighbor’s doorstep. If you built a levee on your side of the river, the owner on the opposite bank had to build a higher one. Accounts from the late 1800s describe midnight moments when masked men stole up on dams, disarmed guards, and dug trenches—breaking open the barrier so that the water might flood one part of the valley and spare another.
Reclaiming Swamps
Within the natural river system, the first lands to absorb winter floods from storms and snowmelt were the delta’s freshwater tule marshes. The state soon labeled these “overflowed” lands. Farther down in the bay wa-tershed, this designation encompassed shoreline mudflats and salt marshes. Early Californians viewed marshes as wasted land that could be put to better use once drained. They called this activity “reclamation.” Lit-tle did the empire builders know the critical function these marginal lands served in the estuarine ecosystem—and how much it would cost their de-scendants to restore them.
From the very beginning, those with an eye for the future began buy-
Okamoto.indb 118 5/4/2011 2:48:32 PM

166 T H E E N V I R O N M E N TA L B A C K L A S H
uted to the ecological catastrophe at Kesterson National Wildlife Refuge in 1983, where many ducks turned up dead or deformed by selenium poi-soning. Scientists warn that if the San Luis Drain—the channel that deliv-ered the contaminated agricultural drainage—is ever connected to the North Bay as originally planned, it will increase bay selenium concentra-tions to levels that endanger ducks, fish, and other species. Many environ-mental groups and agencies now say that retiring large tracts of land with problem soils is the only sustainable solution.
Down in the urban region around San Francisco Bay, cities and coun-ties are now pushing storm-water initiatives far beyond the public service messages and waste motor oil collection of a decade ago. At Brisbane City Hall, rainwater from the roof and parking lot that used to race into the bay now flows into a green depression—a “rain garden”—planted with sedges and rushes (see p. 197). In San Bruno, street runoff flows into a bulb-out planted with trees and native grasses. In Oakland, a bioswale treats pol-luted storm water that would ordinarily flow into Lake Merritt. Around the bay, municipalities are working on ways to slow, spread, and sink the storm water that used to speed into the bay. These “green infrastructure projects” mimic how a forested landscape would handle runoff. Regional regulators now require all new or redevelopment projects over 10,000 square feet to treat their storm-water runoff on-site.
Emerging Contaminants
In the twenty-first century, the brew of pollutants turning up in every-thing from tiny fish to human infants is a reminder that the battle to keep our bay and environment clean is far from over. Not only do some “legacy” pollutants never seem to go away—such as mercury from min-ing days, selenium from irrigated San Joaquin Valley soils, and PCBs from old dump sites—but moves to ban certain chemicals like flame re-tardants or pesticides simply lead to their replacement with something equally problematic for the environment. And industry isn’t solely to blame. Scientists have been disturbed to see personal care products, medicines, and birth control hormones turning up in organisms, water, and sediments. They think such contaminants may be the reason some fish and frogs have been found with indistinct genders and incomplete reproductive equipment.
“The real issue is the relative costs and benefits of all these chemicals we’re putting in our diapers, plastic bottles, make-up, deodorant, drugs, furniture, cars—all these different things we use to keep things from catch-ing fire, to make them smell nice, to stop them from getting moldy, or to
Okamoto.indb 166 5/4/2011 2:51:32 PM

T H E E N V I R O N M E N TA L B A C K L A S H 167
prevent pregnancy,” says scientist Ben Greenfield of the San Francisco Es-tuary Institute. “The bay, and every waterway in the world, is becoming this petri dish that all these things are leaching into at very low concentra-tions, and we’re starting to see some stresses on the fish and wildlife.”
Sadly, nature doesn’t always cooperate with humanity’s best intentions. The processes at work in such a large water system complicate cleanup. In the past, for example, rivers were constantly adding new layers of sedi-ment eroded from upstream to the bottom of the bay. As a result, a lot of contaminants—which naturally attach themselves to sediment particles—got buried and immobilized, or “sequestered,” semipermanently within bay mud. However, since dams have trapped the supply of sediments from upstream, the bay floor has started to erode. When long-buried contami-
0.03 0.04 0.05 0.06 0.07 0.08 0.09 0.1 0.11 0.12
Lower SouthBay
South Bay
Central Bay
San PabloBay Suisun Bay
Rivers
0 20 miles
Map 7. Distribution of total methyl mercury, the most bioavailable and toxic form of this heavy metal, in water in San Francisco Bay, measured in nanograms per liter (ng/L). Plots based on 75 data points collected from 2006 to 2008 as part of the Regional Monitoring Program conducted by the S.F. Estuary Institute. (S.F. Estuary Institute)
Okamoto.indb 167 5/4/2011 2:51:34 PM

168 T H E E N V I R O N M E N TA L B A C K L A S H
nants are exposed to water, or disturbed and mobilized, they can be quick to change chemical forms and enter the food chain.
“In our estuary we’re generating pollutants from a wide range of activi-ties, and each pollutant has different chemical characteristics, timescales of storage, and transformation processes,” says Jim Kuwabara, a U.S. Geo-logical Survey hydrologist. Kuwabara has the unflagging attention neces-sary to track the journey of a contaminant molecule from source to water to sediment to water, over and over again. “As good as treatment processes have become, it’s wise for the public to understand that because so much of the contamination is happening around an estuary, these contaminants will continue to mobilize, flux in and out of the water column, become biologically available, and transfer up the food web,” Kuwabara says.
While scientists uncover the behaviors of different contaminants, other
Percent of breeding population at risk
Avocet
Apparent risk
Stilt
Caspian Tern
Forster’s Tern
Low Moderate
High Extra High
0 20 40 60 80 100
Figure 10. Percent of breeding population of fish-eating birds at risk from methyl mercury. Recent U.S. Geological Survey research suggests that nearly 60 percent of the Forster’s Tern population breeding in San Francisco Bay are at high risk due to current methyl-mercury concentrations in their blood. Scientists think there may be particular risk to those species of birds that forage on invertebrates in pickle-weed marshes, such as stilts, or on small fish along the margins of the bay, such as terns. (Collin Eagles-Smith, S.F. Estuary Institute)
Okamoto.indb 168 5/4/2011 2:51:35 PM

T H E E N V I R O N M E N TA L B A C K L A S H 169
POISONS IN LOCAL PINNIPEDS
The Harbor Seal is an apex predator in the estuary. These 200-pound-plus pinni-peds fear only big sharks and dine on fish large and small during life spans of 30 years or more. But lately, the top tier of the food web has become a perilous place to be. Recent studies have shown that environmental pollutants called polybromi-nated diphenyl ethers, or PBDEs, have been accumulating at an alarming rate in local Harbor Seals.
PBDEs were first used intensively in the 1970s as flame retardants in uphol-stery foam, rigid plastics, textiles, and electronics. They also resist degradation and have been accumulating in the bay food web, so much so that the Bay Area ap-
20 40 60 80 100 120 140
Lower SouthBay
South Bay
Central Bay
San PabloBay Suisun Bay
Rivers
0 20 miles
Map 8. BDE47 in water (in picograms per liter, or parts per quadrillian) based on 203 data points measured between 2002 and 2008 by the Regional Monitoring Program. BDE47 is one of the most abundant PBDEs (ingredients in flame retar-dants) detected in the bay. (S.F. Estuary Institute)
Okamoto.indb 169 5/4/2011 2:51:37 PM
170 T H E E N V I R O N M E N TA L B A C K L A S H
concerned parties are ensuring that environmental protection laws are being implemented. Today, the bay and its watershed come largely under the purview of two regional water quality control boards. These boards, which answer to the state, issue and approve discharge permits as well as manage large-scale pollution control programs. In 1993, industry and dis-chargers joined with environmental interests and government to create a Regional Monitoring Program. The program conducts ongoing assess-ments of whether local and national water-quality objectives are being met for the bay. The San Francisco Estuary Institute runs this program, evalu-ating pollution in water and sediment at about 40 locations around the bay on an annual basis. Citizen groups such as BayKeeper, DeltaKeeper, and Communities for a Better Environment also keep a keen eye on pollutant issues. The state Coastal Commission conducts beach cleanups, and a number of Bay Area pollution-prevention groups collect used medica-tions, dental mercury, thermometers, and motor oil, as well as recycle paints, chemicals, and fluorescent lightbulbs (for more information, see p. 320, “Learning More, Helping Out”).
Looking back on his time as a regulator with the San Francisco Bay Regional Water Quality Control Board, former director Steve Ritchie says the bay is slowly and surely growing cleaner. “The first decades after the Clean Water Act were the era of command and control environmental protection, and we made great strides in cleaning up conventional pollu-tion. Next we started to deal with toxics, which had more diffuse sources than sewage, which made it tough to create useful water quality standards or discharge permits. Now we’re getting close to the end of what we can do with command and control, both in water quality and on the endangered species front, and more is being accomplished for the health of the estuary outside the regulatory arena than within.”
The region has long moved on from viewing bay waters as a dumping ground for all things unwanted and dangerous. More and more residents
pears to be a hotspot of PBDE contamination. Concentrations of this contaminant in bay fish are 10–100 times higher than found in Japan and Europe; likewise, lev-els in local bivalves are among the highest reported worldwide. A recent study found that PBDE concentrations in bay Harbor Seals have doubled every 1.8 years throughout the 1990s. The same study found elevated PBDE concentrations in the breast milk of Bay Area women.
In the laboratory, high doses of PBDEs cause reduced learning and memory capacities for young animals, disrupted endocrine functions, and decreased mus-cle control, and they led to abnormal responses to fearful situations. Though PBDEs were banned in 2003, new flame retardants designed to replace them may be equally troublesome.
Okamoto.indb 170 5/4/2011 2:51:37 PM

T H E E N V I R O N M E N TA L B A C K L A S H 171
are beginning to evaluate what they add to aquatic environments via toi-lets, sinks, gardens, garages, and flameproof furniture. Equally important to bay health are all of the products residents buy, the hours they drive, the lawns they fertilize, and the pests they exterminate. With wild and urban areas in such close juxtaposition around the bay, actions that seem insig-nificant in isolation add up fast when repeated by the Bay Area’s seven million residents.
Curing the Throwaway Habit
A yellow metal claw dangles from the crane on the deck of the U.S. Army Corps vessel Raccoon, ready to snatch from bay waters floating logs, con-struction materials, and garbage that might prove a navigational hazard. Two such cleanup vessels ply the bay every day. Retired captain Eric Carl-son remembers an average daily haul of about 80 tons of garbage 30 years ago but says the waters have gotten much cleaner since. The Raccoon is more adept at pulling out big debris than small bits of trash. Sometimes it takes the helping hands of an army of volunteers to handpick the trash out of bay environs. In 2005, Coastal Cleanup Day volunteers picked up 173,000 pounds of trash and 30,000 pounds of recyclable materials from creeks, rivers, and shorelines in the Bay Area alone.
The presence of so much human refuse takes a major toll on the envi-ronment. Most insidious of all, however, is plastic trash. Plastic’s primary offense is its longevity. These petroleum products can take many decades to decompose; any breakdown that does occur typically involves flaking into ever smaller pieces. Once gone from land, plastic trash is not forgot-ten. A gull that pokes its head into a six-pack ring, or a sea lion snared by fishing line, will almost certainly die before its plastic necklace degrades. Many marine animals mistake floating plastic for edible jellyfish. Laysan Albatross chicks and adult sea turtles alike have been found dead or starv-ing, stomachs bloated with nothing but plastic bags.
The organic surfaces of plastics also tend to accumulate pollutants such as PCBs, DDT, and other chemicals. Anything that eats these ragged bits absorbs both these chemicals and the plastics themselves—and might it-self wind up in the contents of a tuna sandwich. A 1997 study showed that at least 267 marine species worldwide ingest, or are at risk of entanglement and drowning due to, plastic trash. Closer to home, a 2007 assessment of trash in Bay Area creeks found that more than half of the refuse consisted of plastic and Styrofoam. The survey’s results led regulators to declare 28 water bodies and bay segments “impaired” due to the presence of trash—an entirely preventable impairment. Because plastic trash floats, it tends to
Okamoto.indb 171 5/4/2011 2:51:37 PM

172 T H E E N V I R O N M E N TA L B A C K L A S H
travel in the layer of fresh water at the surface of the bay right out of the Golden Gate.
So much plastic has entered the oceans over the last 30 years that the Pacific now includes a feature called the Great Pacific Garbage Patch. Lo-cated northwest of the Golden Gate and halfway between Oregon and Ha-waii, this region of refuse sprawls over an area twice the size of Texas. Oth-ers have described these waters as a plastic soup that extends as deep as 100 feet. In some parts of the patch, plastic outweighs even plankton by a ratio of six to one. Its tons of garbage are fed by ocean currents from as far away as Japan and California. Ocean currents act like relay runners in a race until, over the course of several years, trash from the Bay Area ends up in the patch.
Bay Area governments are taking steps to keep the estuary and the oceans clean. Cities around the region sweep their streets to remove trash from roadsides and gutters. Oakland charges businesses that produce dis-posable products a fee that goes toward litter pickup, and it bans the use of Styrofoam and plastic utensils in favor of compostable food service-ware made of potato and other starches. And San Francisco limits the use of ubiquitous grocery store plastic bags. Over time, these efforts should help stem the tide of trash that threatens the health of the bay and the oceans alike.
Marshes and shorelines such as this one on Yosemite Slough near San Francisco’s Hunter’s Point have long been dumping grounds for all manner of refuse. (Jude Stalker)
Okamoto.indb 172 5/4/2011 2:51:43 PM

214 R E S T O R AT I O N F R O N T I E R S : T H E W AT E R S H E D
ecosystem coequal to the goal of creating a more reliable water supply for California. Then 2009 biological opinions about what should be done to save endangered smelt and salmon—issued by U.S. Fish and Wildlife Ser-vice and the National Marine Fisheries Service—called for the restoration of 8,000 acres of intertidal and subtidal habitats in the delta and Suisun Marsh. And a new delta stewardship council will for the first time have land use permitting authority.
Despite the focus on physical habitat in the 1990s and 2000s, CALFED and other concerned stakeholders also made some effort during this pe-riod to put more water into the watershed’s creeks and rivers to benefit fish and the ecosystem, and to conserve water so that more might be available for this purpose.
Key Ingredients: A Riparian Recipe
Restoring a river, or even a creek, is not as easy as breaching a dike to con-vert a salt pond back into a wetland. The biggest obstacles standing in the way of restoration on 95 percent of the watershed’s rivers and creeks are dams. While dams may help farms and cities collect water, they also with-hold essential ingredients rivers need to build fish and forest habitats.
“If there is a deficit in people’s understanding of creeks and rivers, it is that they have two jobs: to transport water and to transport sediment,” says Christopher Richard of the Oakland Museum.
Other obstacles to restoration are the levees and riprap lining river-banks and the homes and farms standing in old floodplains. Controlling rivers via engineering may not be sustainable, according to restoration en-gineer Philip Williams. Levees continue to fail, floods continue to swamp homes, and dams never seem to be able to store enough water to slake California’s thirst. Young trees are not growing up to replace old ones along riverbanks, and the new hatchery-raised salmon are not as resilient as their wild cousins.
“The hardest question, if we commit to restoring our rivers, will not be how to do it, but how long to continue investing resources in perpetuating obsolete river engineering works that prevent us from managing rivers in a way that allows them to restore themselves, ” said Williams in a 2003 article in CALFED’s Science Action.
Healthy rivers and creeks need room to move and meander, areas to flood, and vegetation along their banks. They need gravel added below their dams and adequate flows to distribute that gravel downstream. Garden-variety gravel may not be good enough, either, because it won’t smell right to salmon. Indeed, salmon may not use a gravel bed until it has
Okamoto.indb 214 5/4/2011 2:54:46 PM

R E S T O R AT I O N F R O N T I E R S : T H E W AT E R S H E D 215
been “seasoned”—the small rocks having rolled around, interacted with the water, released minerals, and accumulated algae.
With so much concrete lining their shores, rivers and creeks also need new spaces for vegetation to grow, trees to rise, and logs to fall. They need setbacks to invite water onto old floodplains, or bulldozing to re-create a long-lost meander or bend.
“People have historically thought that a migrating, eroding channel meant something was wrong, that a raw riverbank was a bad bank,” says UC Davis’s Eric Larsen, a fluvial geomorphologist who is one of the “go-to” guys for Sacramento River restoration. In reality, rivers create new land by eroding and redepositing sediments. “The river is not alive unless it’s migrating. All its ecological processes are built on the basis of the river moving across the floodplain.”
Riparian specialists concocting restoration recipes are now thinking big. They seek to re-create river processes across entire landscapes. They are looking beyond the need for a new riffle here or a better fish screen there, to how best to sustain 10 mile to 100 mile reaches of river. It is only on such broad scales that riparian processes—in which water, sediments, seeds, and fish interact—come into play. And it is only on these scales that the pitfalls of gardening-style restoration, where benefits are highly local-ized and often short-lived, can be avoided.
Beyond adding good ingredients in the right quantities, any recipe must also keep bad ingredients out of the mix. Poor water quality from agricultural and wastewater discharges, harmful invasive species, and high water temperatures can all too easily negate the value of restoration, or impede its intended purpose.
Rivers make new land such as this point bar on the Sacramento River. As the chan-nel moves away from one bank, gravel collects on the other, allowing cottonwoods and other plants to take root. (Eric Larsen)
Okamoto.indb 215 5/4/2011 2:54:52 PM

252 R E S T O R AT I O N F R O N T I E R S : T H E B AY
Whether restoration promotes methylation, and exactly how it affects the species that live in the baylands, is an open question. Studies so far suggest that seasonal wetting and drying cycles in bay margins and flood-plains, rather than tidal marsh processes, may trigger spikes in methyla-tion. Areas with larger plankton blooms may pump more mercury into the local food web. New studies suggest, however, that birds and fish frequent-ing restoration sites will have levels of mercury similar to, not higher than, those from other areas around the bay.
Mercury, sediments, politics, and design are all factors that will influ-ence future restoration projects around the bay. In the following sections, some of the on-the-ground, nitty-gritty challenges of restoration are ex-plored in more detail.
The Marin Shore
Head up Highway 101 from the Golden Gate Bridge, and the marvels of the bayshore are quick to materialize. At low tide, the mudflats of Richard-son Bay sparkle with dappled light. Along the verge, egrets stalk in the soggy spots. Here and there between Marin’s condo complexes and malls, flashes of green marsh, blue water, and rough ground catch the eye.
What may not be so apparent is the fact that Marin also sports the bay’s rockiest shores. Three peninsulas jut out into the bay between the Golden Gate and San Rafael, restricting wetlands to a few coves and the inlets of Gallinas, Corte Madera, and Coyote creeks. North of the rocky hills and cliffs of San Pedro Point, near the town of Terra Linda, Marin’s shores open and soften. Marshes here once filled the landscape between the bay-shore and Highway 101, and they once fanned out all along the lower reaches of the Petaluma River.
Over the years, many restoration projects on this shore were champi-oned by the Marin Audubon Society, which owns 509 acres of baylands and has restored and enhanced 53 acres. In Southern Marin, at the state’s Corte Madera Ecological Reserve, Audubon used fees from water-quality violators to restore a one-acre field to tidal marsh and create an island for Clapper and Black Rails. Sewage spill funds helped Audubon and state agencies restore tides to the slough at the mouth of San Clemente Creek. And at nearby 31-acre Triangle Marsh, they reconnected ancient wetlands with new ones, and planted gum plant, creeping wild rye, coyote brush, and coast live oaks.
Audubon’s hardest-won projects lie along the Petaluma River in North-ern Marin. Fighting off golf courses, plans for more lagoon-style homes
Okamoto.indb 252 5/4/2011 2:56:40 PM

R E S T O R AT I O N F R O N T I E R S : T H E B AY 253
with private boat docks, and landfill expansions at places like Black Point, Bel Marin Keys, Bahia, and Novato, Audubon partnered with others to protect a 3,000-acre corridor of baylands reaching from the former Ham-ilton airfield all along the Petaluma River into remote ranchlands.
Saving the marshes along the Petaluma River was a great triumph, be-cause it helps connect Marin County habitats with the much wilder 55,000 acres of wetland open spaces of the North Bay rim. Restoring these rural ranchlands and seasonal wetlands involved little more than straightfor-ward dike breaching and revegetation. A far more difficult landscape was Marin’s Hamilton Air Force Base, with its old runways and antenna fields to transform, its regiments of abandoned buildings to tear down, and its oil spills and landfills to mop up.
As part of a multiuse redevelopment of the base into a new community adjacent to shoreline habitats, the California Coastal Conservancy and the U.S. Army Corps of Engineers have been trying to implement one of the most complex wetland restoration designs undertaken in the bay to date. The design is complex because it uses material from harbor dredging proj-ects to bring the long-subsided landscape up to tidal elevations, and be-cause the 2,500-acre project re-creates the entire spectrum of shoreline
Hamilton wetland restora-tion site in Marin County, where dredged material is being beneficially reused to raise subsided lands to ap-propriate levels for new habitats. (Courtesy of the U.S. Army Corps of Engi-neers)
Okamoto.indb 253 5/4/2011 2:56:41 PM

254 R E S T O R AT I O N F R O N T I E R S : T H E B AY
habitats, from mudflat and outboard marsh all the way up to seasonal ponds and upland buffer zones.
“We’re taking areas diked off by man and converted to agricultural use, and then to military use, and restoring them back to what nature had here originally,” explains Eric Polson, consulting civil engineer on the Hamilton project. “It’s going full circle, a 360-degree turnaround.”
Most sites in the midst of restoration look lunar, and Hamilton is no exception. For a long time there were just miles of bare dirt, crisscrossed by levees, and dotted with the bent elbows of backhoes. On a visit during the construction period, the levees and ponds trembled with the passage of yellow trucks with snouts, called “haulers,” as well as the rumblings of half a dozen mudcats. These special bulldozers have a wider track than most, enabling them to operate in mud and fluid environments without slipping.
Before the military could hand over its airfield for restoration, the Army Corps had to do a fair amount of cleanup. Luckily, Hamilton served as an operations center—rather than a weapons or aircraft or shipbuilding factory—and there wasn’t too much contamination.
The lowest hanging fruit for cleanup were the landfill and the shooting range. Like many of the bay’s landfills, Hamilton’s mound of washing ma-chines, car tires, tree trunks, and old fuel drums was capped, greened, and plumbed with vents to off-gas methane. Just as in other hunting areas around the bay, lead shot and bullets had to be scraped off the ground on the shooting range. In the end, workers removed 5,000 cubic yards of soil from the range, which was filled mostly with the spent firepower of the Thompson or “Tommie” machine gun.
These were small cleanups compared to the work that had to be done on the marsh plain outside the outboard levee, where the base’s sewage and storm-water outfalls once discharged to the bay, and where the mili-tary also had a burn pit and debris pile. Here, the corps scraped down five acres and moved 30,000 cubic yards of soil and sludge.
Army Corps environmental manager Ed Keller says the most serious contamination at Hamilton came from leaking fuel tanks, both those used for household heating oil and those employed for aviation gas and jet fuel. In the airfield’s heyday, jet fuel supply tankers hooked up to a pipeline that
INVASIVES MANAGEMENT
Wildlife managers used to tear out the eucalyptus tree windbreaks planted by early ranchers in an effort to restore native species. These days the bay itself is toppling them along the North Bay rim and tidal sloughs. The only thing hu-mans have to do is allow the salt water to reach their root zones.
Okamoto.indb 254 5/4/2011 2:56:41 PM

R E S T O R AT I O N F R O N T I E R S : T H E B AY 255
extended three miles into the bay. Keller had that pipeline flushed and plugged with concrete. On the landward side, he had thousands of feet of leaky fuel line removed, as well as lots of surrounding soil. Keller believes he got lucky because the base was built atop some very fine silt and clay soils. “The soils were extremely tight. Water could not move through them at all, so we had no contaminant plumes,” says Keller. “Even in a firefight-ing training area, where soldiers basically poured fuel on trash and set it on fire, we only had to go 7 feet down and 10 feet beyond the concrete pad in each direction to get all the contaminants. In 40 different wells we sam-pled on the base, there was no contamination.”
Once the base was clean enough, the restoration engineers moved in. Initially, one of their most critical tasks was to build a rather unusual pipe-line from the shoreline out to a spot five miles into the bay where it was deep enough for tugs and barges to maneuver. Without the pipe, engi-neers could not import the key ingredient in their design: dredged sed-iment. But with the help of the pipeline, 10 million cubic yards of sedi-ment—offloaded from barges out in the bay and mixed with water into a slurry—could be pumped through the pipeline and onto subsided areas. In some places, land levels were more than eight feet below sea level. Even better, the project was putting sediments that harbors and marinas wanted removed from their channels and berths to good use elsewhere in the bay—fulfilling a regional “beneficial reuse” goal.
To lay the section of pipeline crossing the soft wetland surface, work-ers made a temporary road for their heavy equipment out of huge wooden timbers and rafted-up rubber mats. As Polson remembers, “We built that over Christmas during bad weather with tides so high our mats were floating. It was pretty dicey.” Once built, however, the pipe allowed crews to work year-round in the marsh, instead of pausing between Feb-ruary and August, when Clapper Rails and Salt Marsh Harvest Mice might be raising young. The pipe is much less disruptive than alternative methods of moving sediment: haulers, backhoes, and other noisy, smelly machinery.
On the site itself, the pipe snakes in and out of various giant pits. Work-ers can move the slurry spray around as they prepare each unit. One day, the units will be a mix of seasonal wetlands, wildlife corridors, tidal wet-lands, tidal pannes, and ponds. “We’re setting a template for a functional wetland, so species can move back in and propagate,” says Polson. “We’re trying to give them the right set of conditions—elevation, sediment, sub-strate, water, hydrology—to get things going in the right direction. You look at natural analogs and do your best to copy them.”
By 2050, visitors should be able to see a pretty good copy of the 2,500 acres of wetlands that historically covered the Hamilton shore.
Okamoto.indb 255 5/4/2011 2:56:41 PM