Embed Size (px)
Citation preview
Natural Image Statistics andNeural Representations
Michael Lewicki
Center for the Neural Basis of Cognition &Department of Computer Science
Carnegie Mellon University
CSH Vision Course / Michael S. Lewicki, CMU áá á
á
? 1
Outline
1. Information theory review, coding of 1D signals
2. Sparse coding, ICA, coding of natural images and motion
3. Representing images with noisy neural populations
4. Learning higher-order image structure
CSH Vision Course / Michael S. Lewicki, CMU áá á
á
? 2
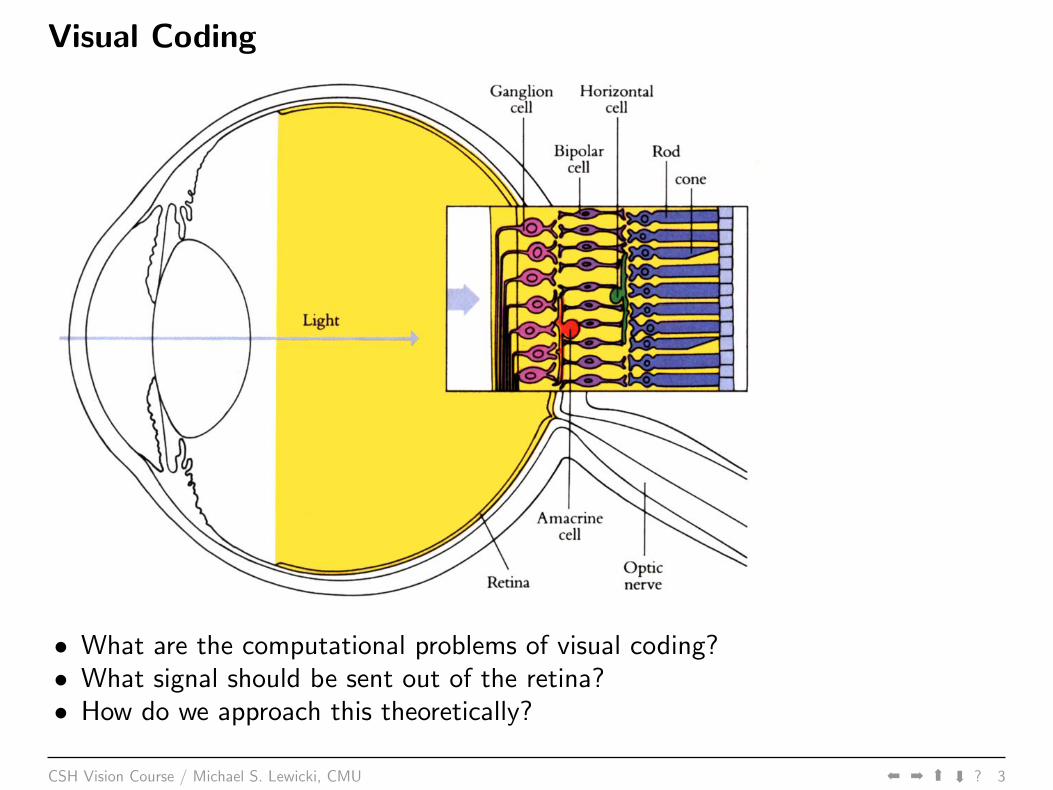
Visual Coding
• What are the computational problems of visual coding?• What signal should be sent out of the retina?• How do we approach this theoretically?
CSH Vision Course / Michael S. Lewicki, CMU áá á
á
? 3
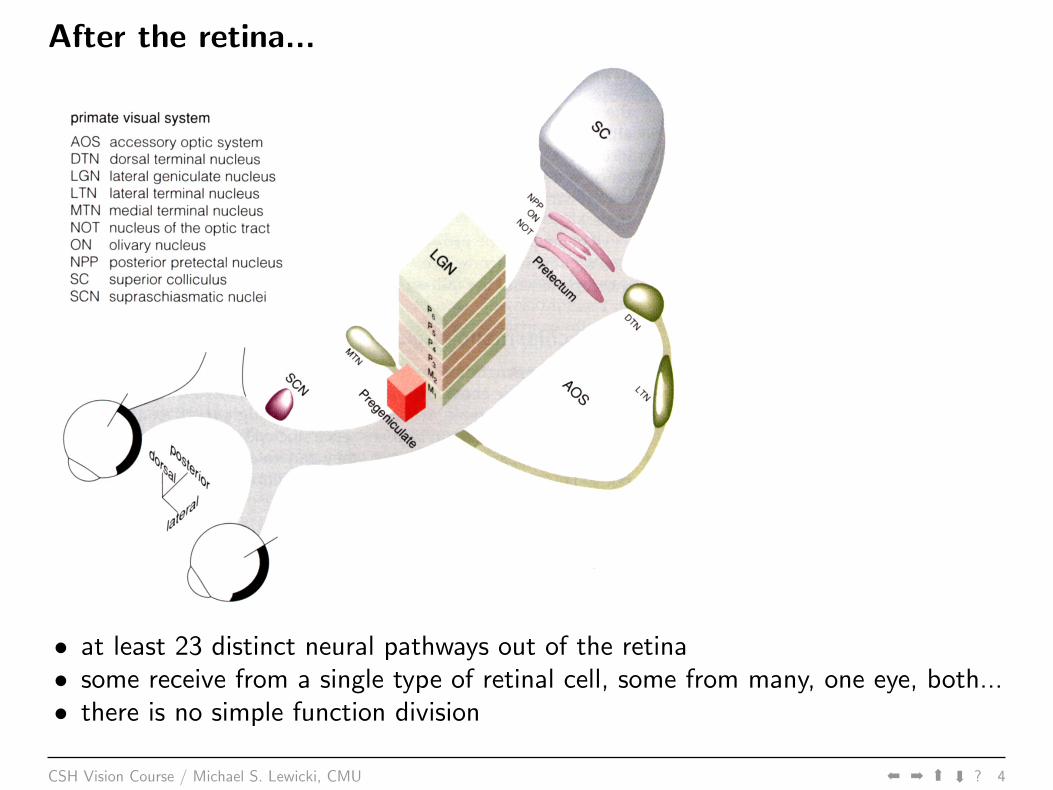
After the retina...
• at least 23 distinct neural pathways out of the retina• some receive from a single type of retinal cell, some from many, one eye, both...• there is no simple function division
CSH Vision Course / Michael S. Lewicki, CMU áá á
á
? 4
Why is it like this?Evolutionary viewpoint:
• success depends on whole organism and cooperation of areas and cell types
• there is no opportunity to “redesign”, functions simply pile up
– “layers and layers of goo”– “not engineering, but tinkering”
• there are few “clean” functional divisions, i.e. there are not distinct channels forcolor or motion
CSH Vision Course / Michael S. Lewicki, CMU áá á
á
? 5
Types of optical systems
• Suprachiasmatic nucleus: generate the circadian rythm
• Accessory optic system: helps stabilize retinal image during head movement
• Superior colliculus: integrates visual and auditory information together withhead movements, directs eyes to regions of interest
• Pretectum: plays role in adjusting size of pupil to changes in light intensity,and in tracking large moving objects
• Pregeniculate: function unknown, but cells are responsive to ambient light level
• lateral geniculate: main “relay” to visual cortex; contains 6 distinct layers,each with 2 sublayers. Organization is very complex and cells have a wide rangeof sensitivities including contrast, color, and motion.
CSH Vision Course / Michael S. Lewicki, CMU áá á
á
? 6
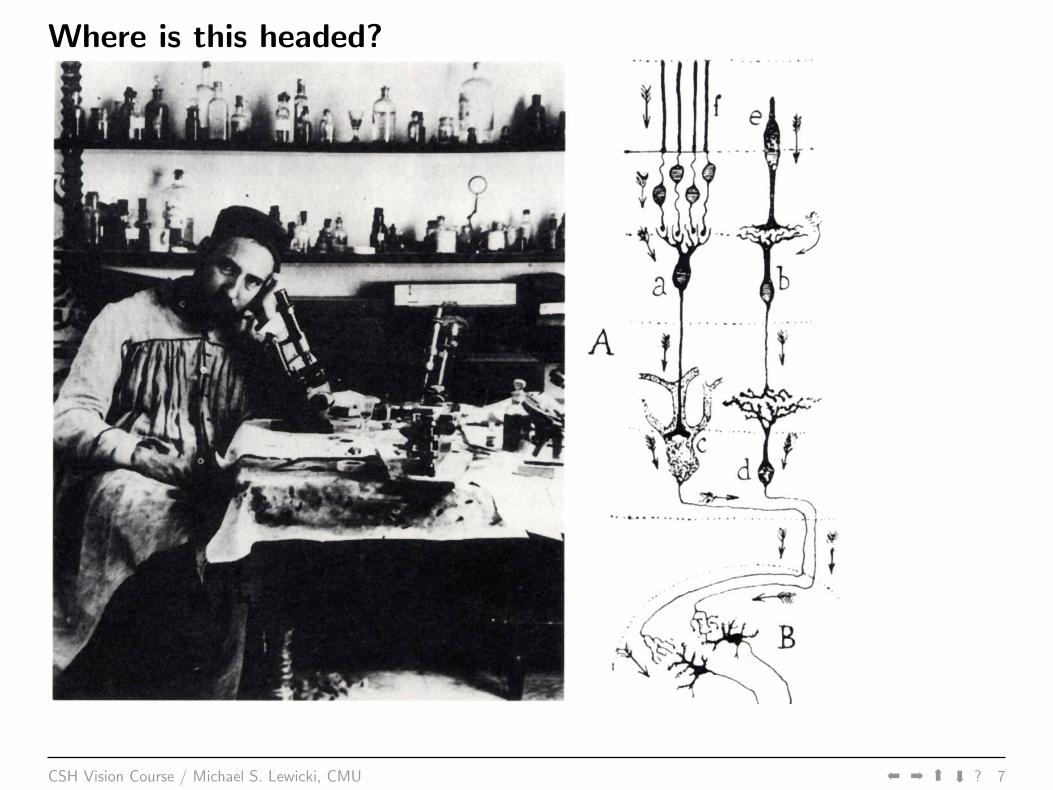
Where is this headed?
CSH Vision Course / Michael S. Lewicki, CMU áá á
á
? 7
A theoretical approach
• Look at the system from a function perspective:What problems does it need to solve?
• abstract from the details, make predictions from theoretical principles
• You can only have data after you do your theory.
• Models are bottom-up, theories are top-down.
• What are the relevant principles?
CSH Vision Course / Michael S. Lewicki, CMU áá á
á
? 8
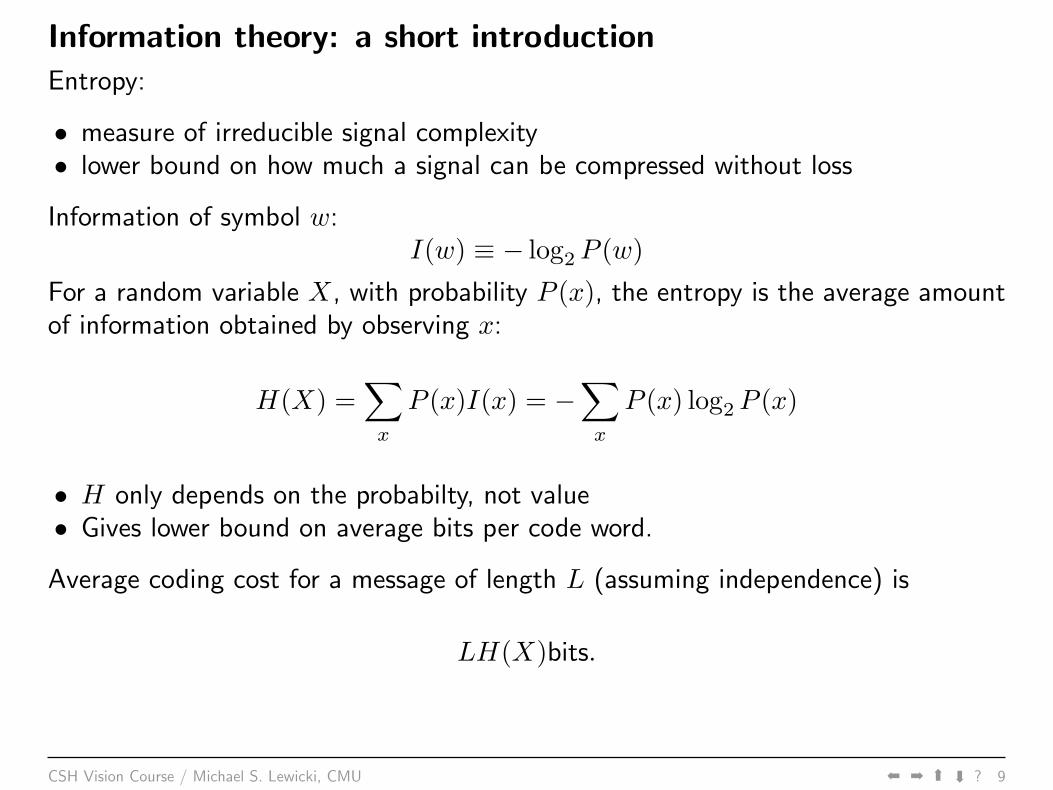
Information theory: a short introductionEntropy:
• measure of irreducible signal complexity• lower bound on how much a signal can be compressed without loss
Information of symbol w:I(w) ≡ − log2 P (w)
For a random variable X, with probability P (x), the entropy is the average amountof information obtained by observing x:
H(X) =∑
x
P (x)I(x) = −∑
x
P (x) log2 P (x)
• H only depends on the probabilty, not value• Gives lower bound on average bits per code word.
Average coding cost for a message of length L (assuming independence) is
LH(X)bits.
CSH Vision Course / Michael S. Lewicki, CMU áá á
á
? 9
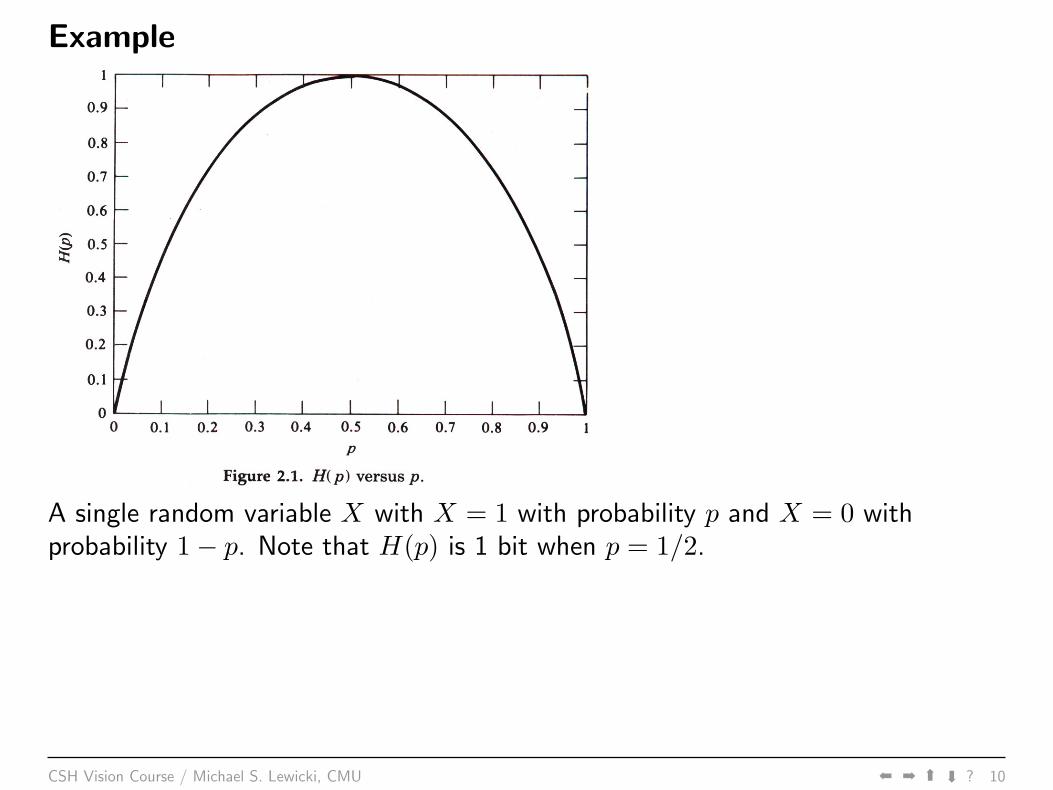
Example
A single random variable X with X = 1 with probability p and X = 0 withprobability 1− p. Note that H(p) is 1 bit when p = 1/2.
CSH Vision Course / Michael S. Lewicki, CMU áá á
á
? 10
CapacityCapacity is the maximum amount of information per symbol:
C = log2 N
Maximum is when all N symbols have equal probability.
• English: C = log2 27 = 4.73 bits/letter• Image: 8× 256× 256 for 8 bit 2562 image.
Actual entropy, i.e. the irreducible part, is much less.Why?
CSH Vision Course / Michael S. Lewicki, CMU áá á
á
? 11
RedundancyRedundancy is a measure of (in)efficiency or actual entropy relative to capacity:
R = 1−H(x)/C
Capacity is maximum when
• code words (symbols) have equal frequency• no inter-symbol redundancy
Examples
• English: letter probs not equal, letters not indep.• Images: pixel value probs not equal, pixels not indep.
CSH Vision Course / Michael S. Lewicki, CMU áá á
á
? 12
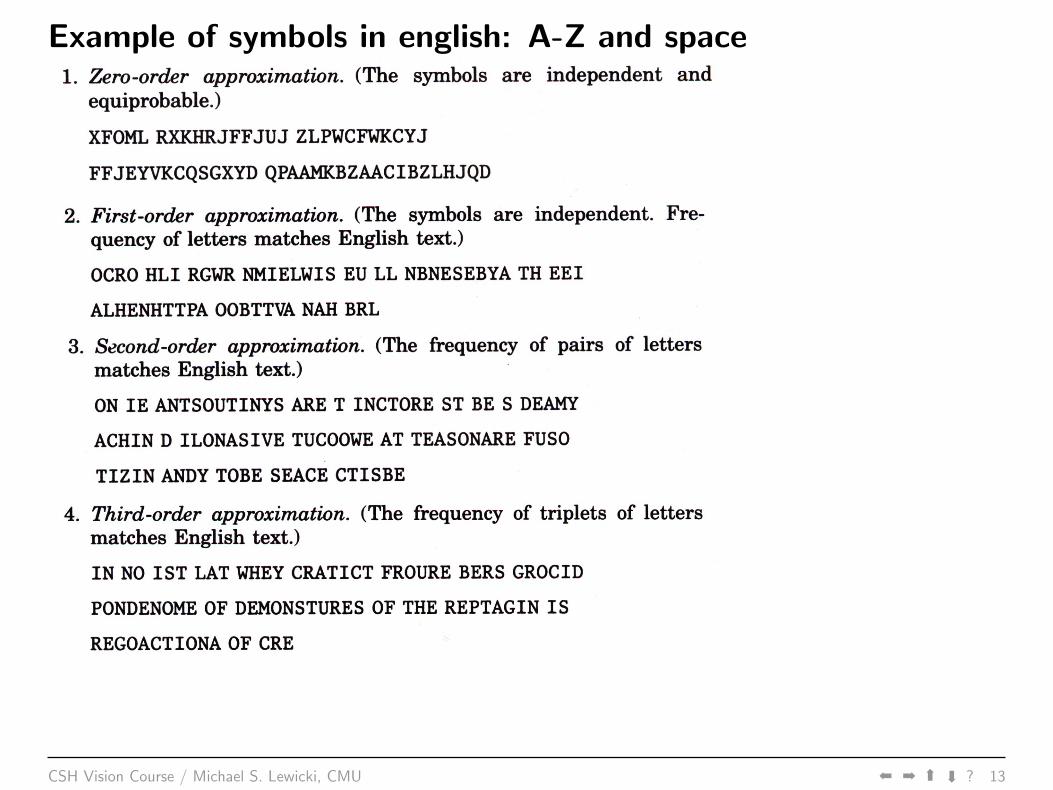
Example of symbols in english: A-Z and space
CSH Vision Course / Michael S. Lewicki, CMU áá á
á
? 13
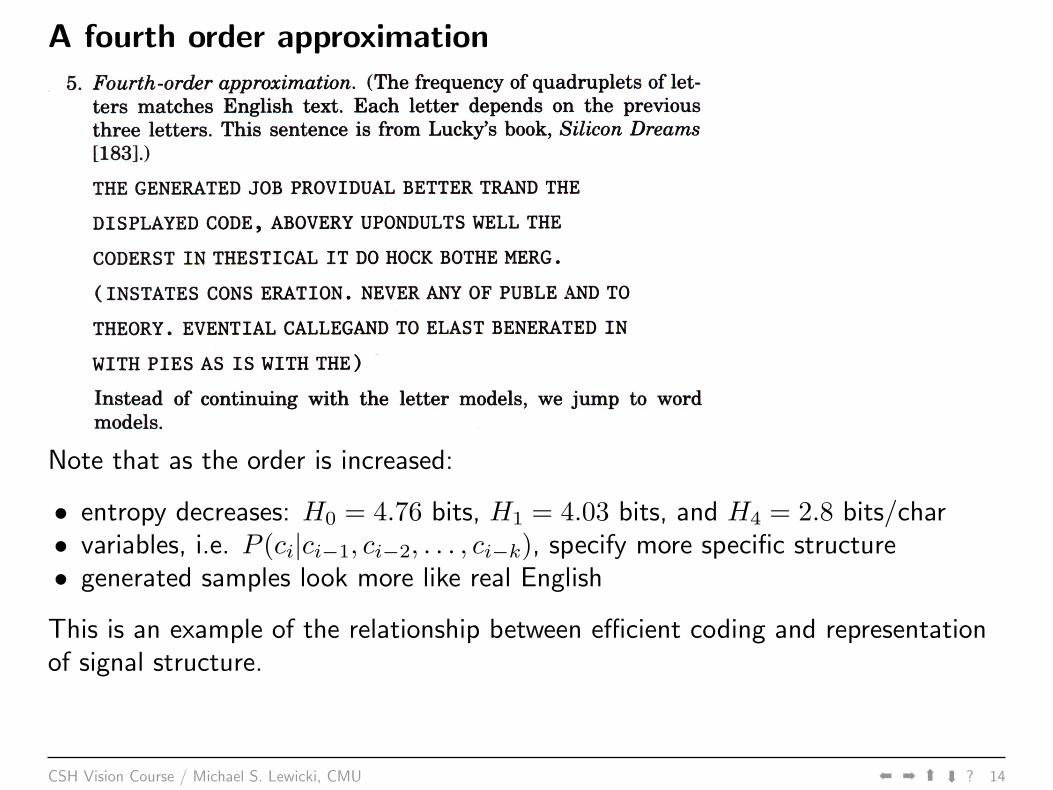
A fourth order approximation
Note that as the order is increased:
• entropy decreases: H0 = 4.76 bits, H1 = 4.03 bits, and H4 = 2.8 bits/char• variables, i.e. P (ci|ci−1, ci−2, . . . , ci−k), specify more specific structure• generated samples look more like real English
This is an example of the relationship between efficient coding and representationof signal structure.
CSH Vision Course / Michael S. Lewicki, CMU áá á
á
? 14
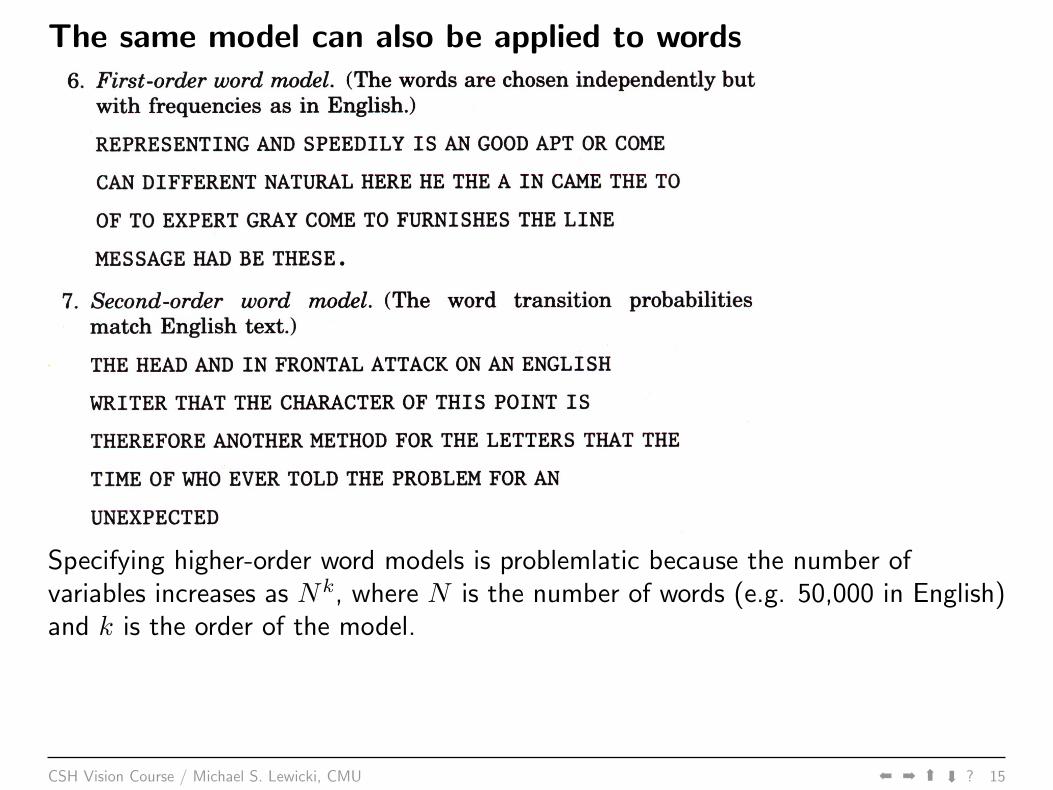
The same model can also be applied to words
Specifying higher-order word models is problemlatic because the number ofvariables increases as Nk, where N is the number of words (e.g. 50,000 in English)and k is the order of the model.
CSH Vision Course / Michael S. Lewicki, CMU áá á
á
? 15
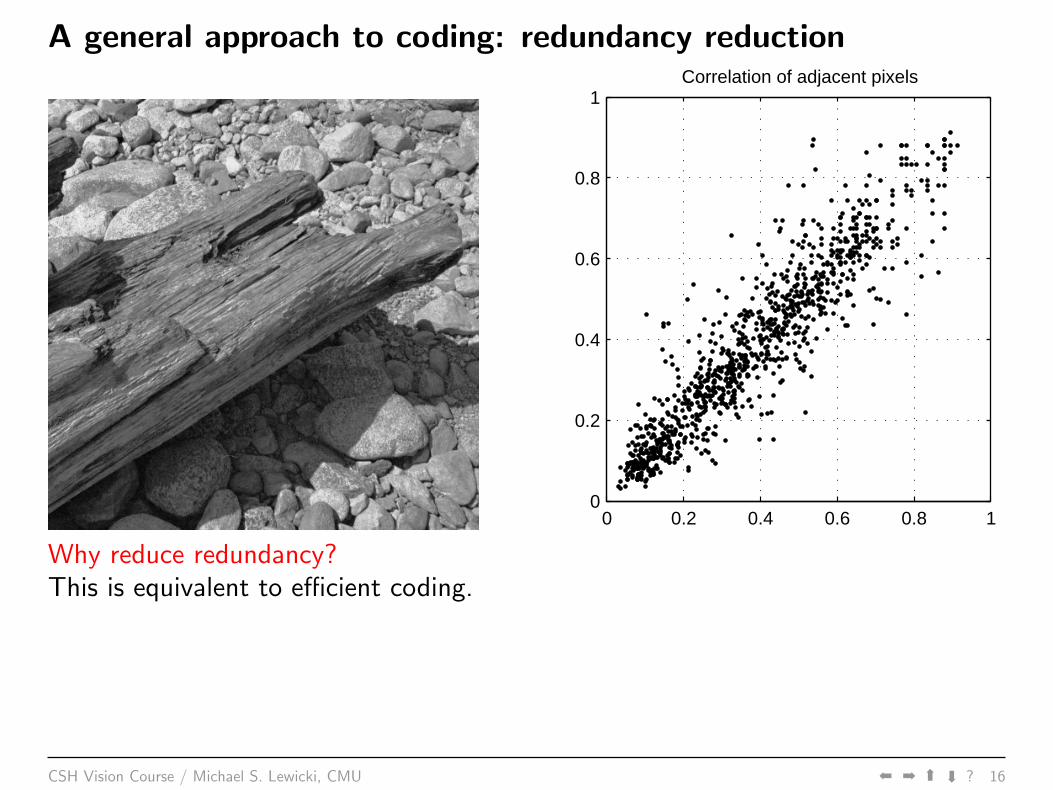
A general approach to coding: redundancy reduction
0 0.2 0.4 0.6 0.8 10
0.2
0.4
0.6
0.8
1Correlation of adjacent pixels
Why reduce redundancy?This is equivalent to efficient coding.
CSH Vision Course / Michael S. Lewicki, CMU áá á
á
? 16
Why code efficiently?Information bottleneck:
• restriction on information flow rate
– channel capacity– computational bottleneck– 5× 10⁶ → 40− 50 bits/sec
• need even probabilities for associative learning
– easy to calc joint probs for independent vars
• facilitate pattern recognition
– independent features are more informative– better sensory codes could simply further processing
CSH Vision Course / Michael S. Lewicki, CMU áá á
á
? 17
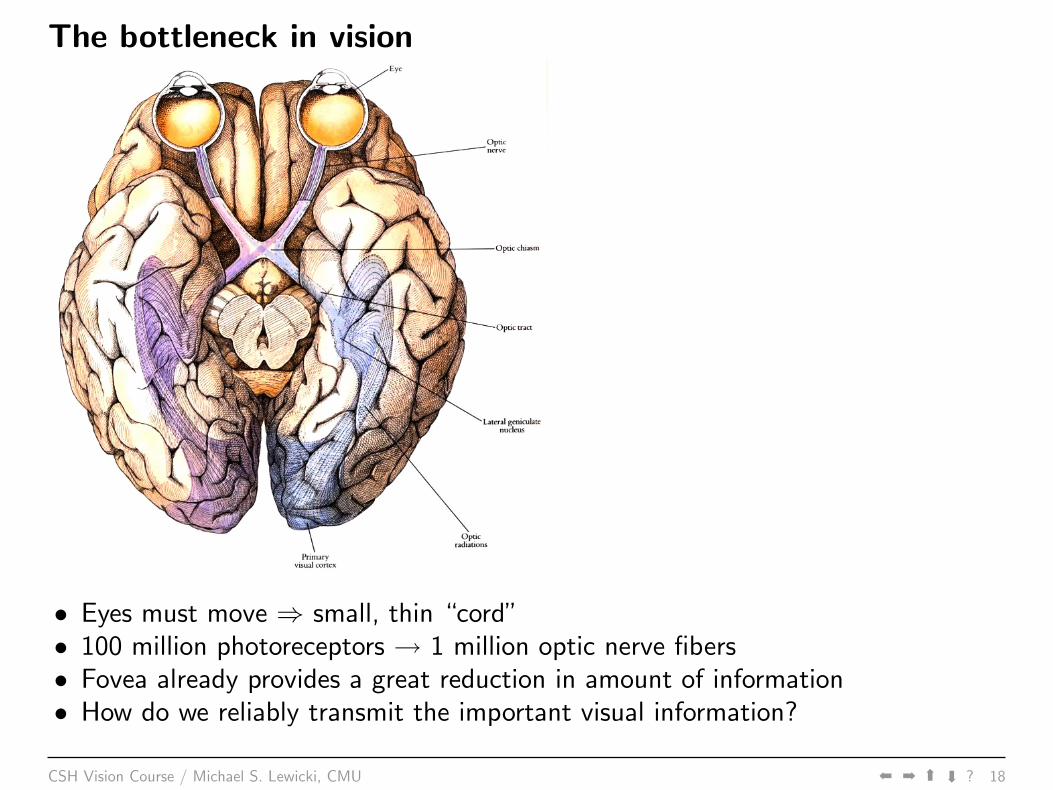
The bottleneck in vision
• Eyes must move ⇒ small, thin “cord”• 100 million photoreceptors → 1 million optic nerve fibers• Fovea already provides a great reduction in amount of information• How do we reliably transmit the important visual information?
CSH Vision Course / Michael S. Lewicki, CMU áá á
á
? 18
A little more information theory
• H(X) is a measure of how much information it takes on average to describerandom variable X.
• If we know p(X), we can calculate entropy or optimize the model for the data,but what if we don’t know p(X) and can only approximate it, e.g. with q(X)?
• How many bits does this inaccuracy cost us?
CSH Vision Course / Michael S. Lewicki, CMU áá á
á
? 19
Relative Entropy
• The relative entropy D(p||q) is a measure of the inefficiency of assumingdistribution q when the true distribution is p.
• If we knew p we could construct code with average code word length H(p).
• If we assume q, the best average code length we can achieve is H(p) + D(p||q)
D(p||q) =∑
x
p(x) logp(x)q(x)
• D(p||q) = 0 ⇐⇒ p = q
• This is also called the Kullback Leibler divergence
• It is not called a distance, becase it is not symmetric and does not satisfy thetriangle inequality.
CSH Vision Course / Michael S. Lewicki, CMU áá á
á
? 20
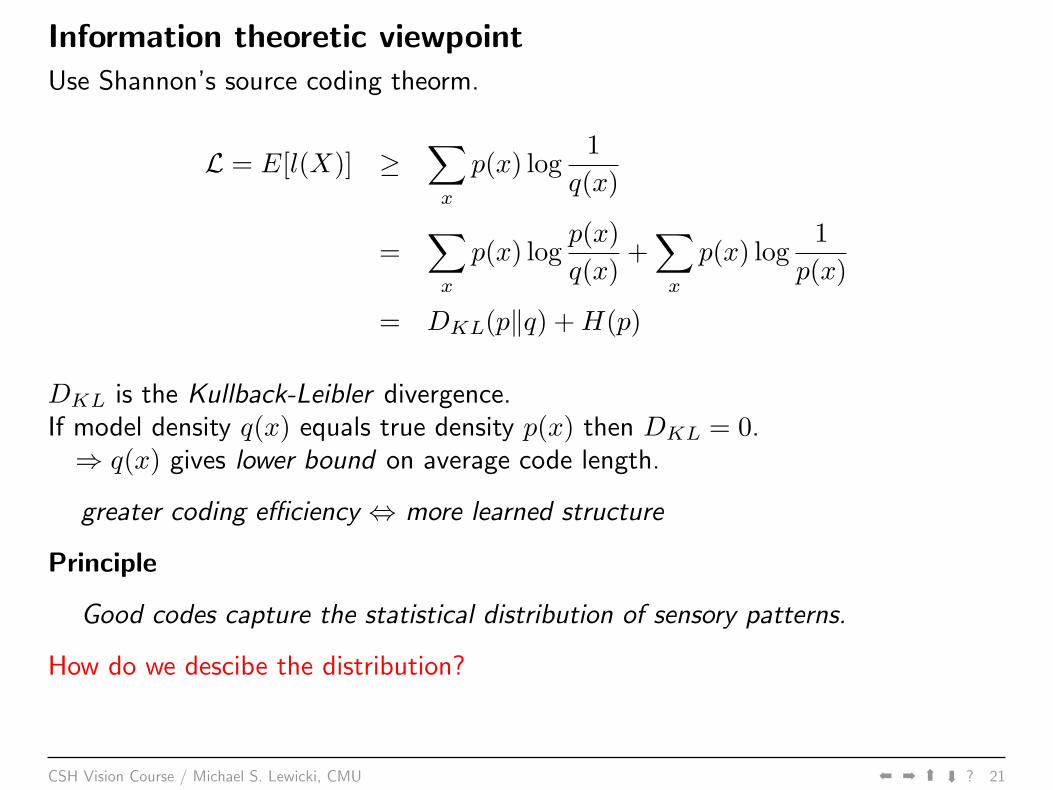
Information theoretic viewpointUse Shannon’s source coding theorm.
L = E[l(X)] ≥∑
x
p(x) log1
q(x)
=∑
x
p(x) logp(x)q(x)
+∑
x
p(x) log1
p(x)
= DKL(p‖q) + H(p)
DKL is the Kullback-Leibler divergence.If model density q(x) equals true density p(x) then DKL = 0.⇒ q(x) gives lower bound on average code length.
greater coding efficiency ⇔ more learned structure
Principle
Good codes capture the statistical distribution of sensory patterns.
How do we descibe the distribution?
CSH Vision Course / Michael S. Lewicki, CMU áá á
á
? 21
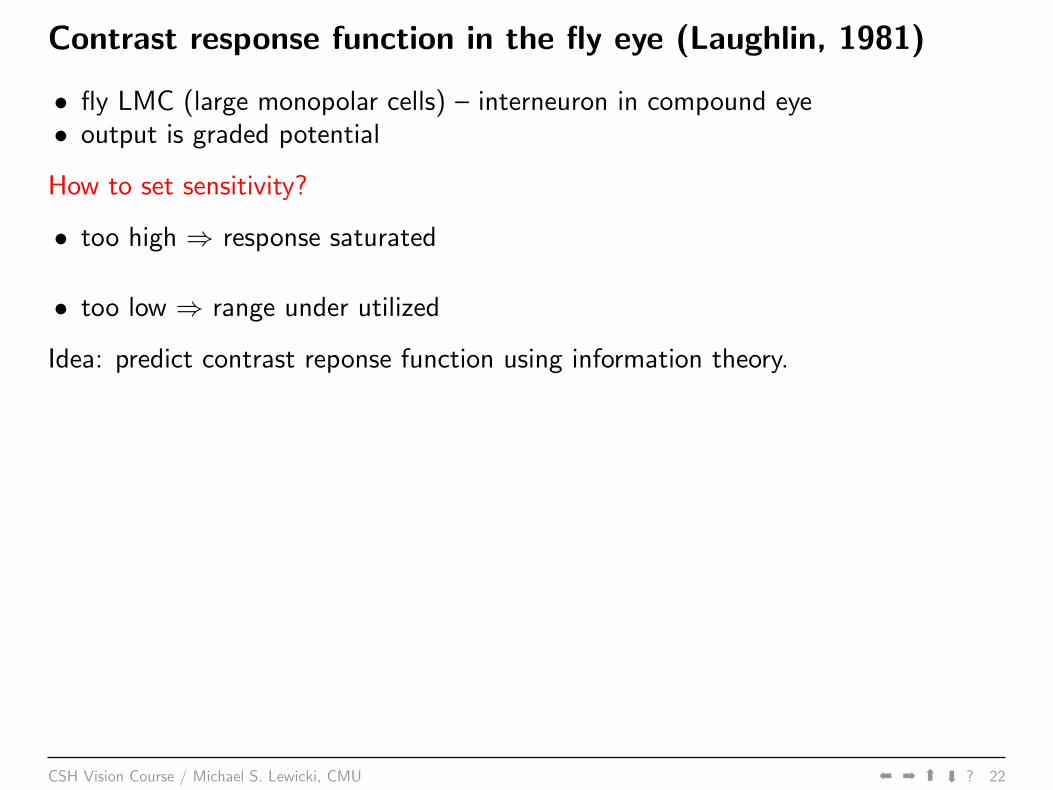
Contrast response function in the fly eye (Laughlin, 1981)
• fly LMC (large monopolar cells) – interneuron in compound eye• output is graded potential
How to set sensitivity?
• too high ⇒ response saturated
• too low ⇒ range under utilized
Idea: predict contrast reponse function using information theory.
CSH Vision Course / Michael S. Lewicki, CMU áá á
á
? 22
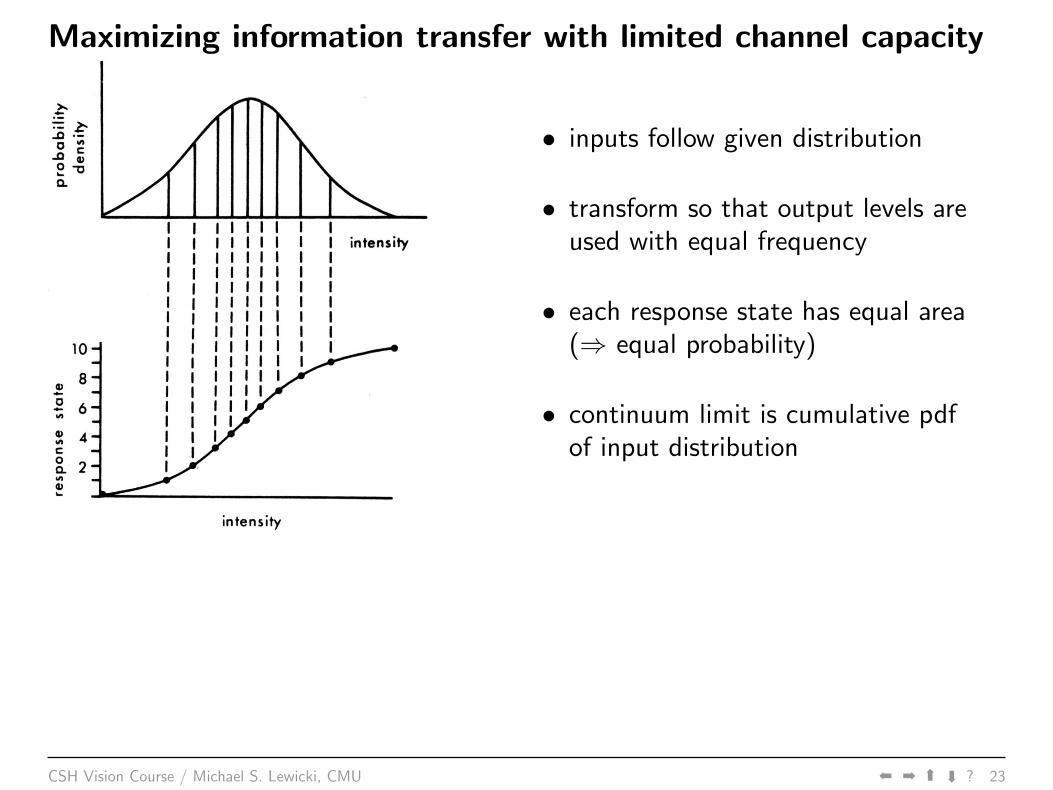
Maximizing information transfer with limited channel capacity
• inputs follow given distribution
• transform so that output levels areused with equal frequency
• each response state has equal area(⇒ equal probability)
• continuum limit is cumulative pdfof input distribution
CSH Vision Course / Michael S. Lewicki, CMU áá á
á
? 23
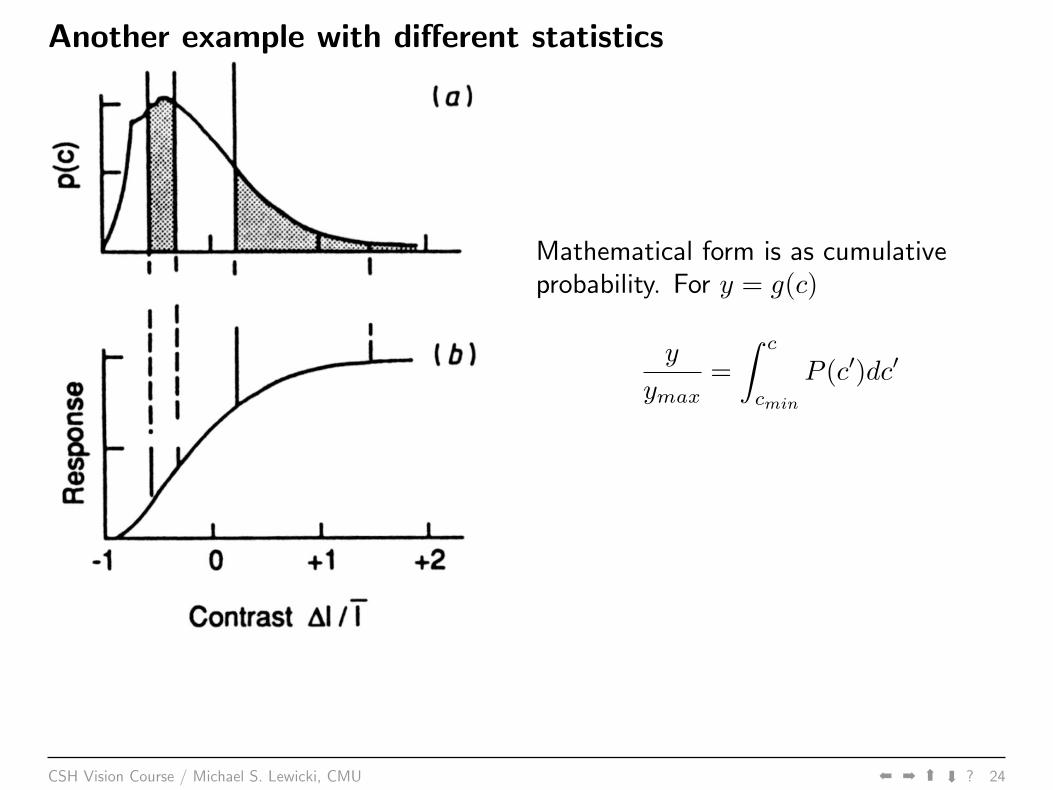
Another example with different statistics
Mathematical form is as cumulativeprobability. For y = g(c)
y
ymax=
∫ c
cmin
P (c′)dc′
CSH Vision Course / Michael S. Lewicki, CMU áá á
á
? 24
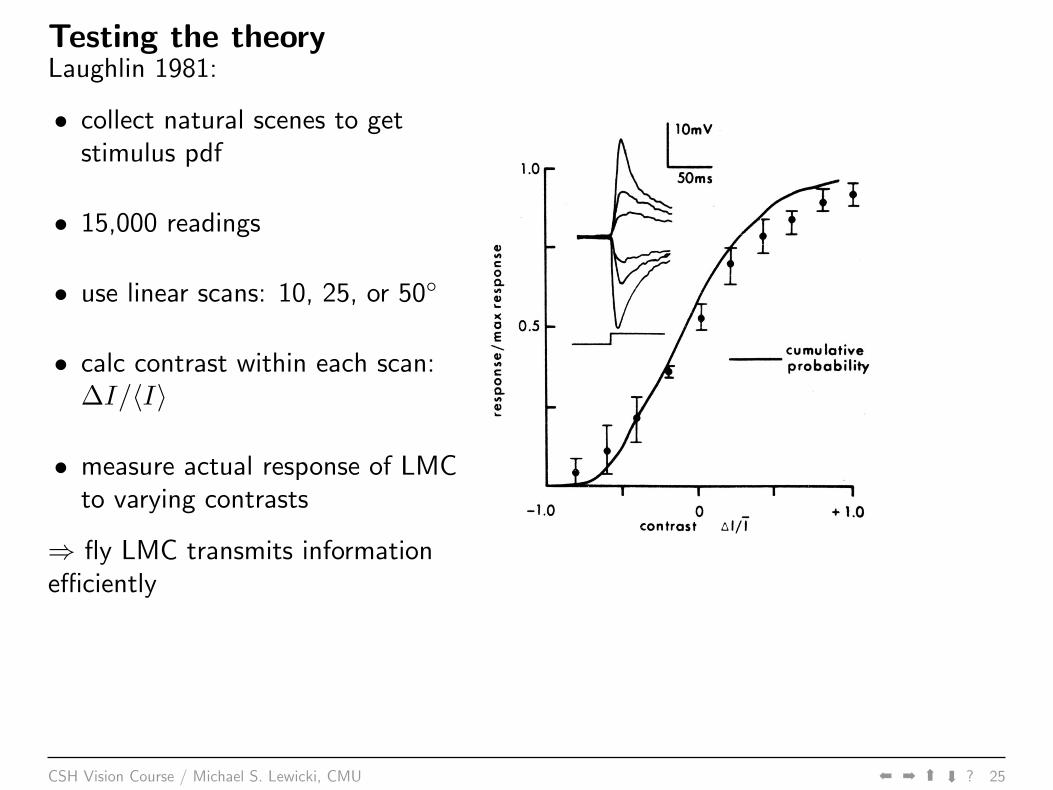
Testing the theoryLaughlin 1981:
• collect natural scenes to getstimulus pdf
• 15,000 readings
• use linear scans: 10, 25, or 50◦
• calc contrast within each scan:∆I/〈I〉
• measure actual response of LMCto varying contrasts
⇒ fly LMC transmits informationefficiently
CSH Vision Course / Michael S. Lewicki, CMU áá á
á
? 25
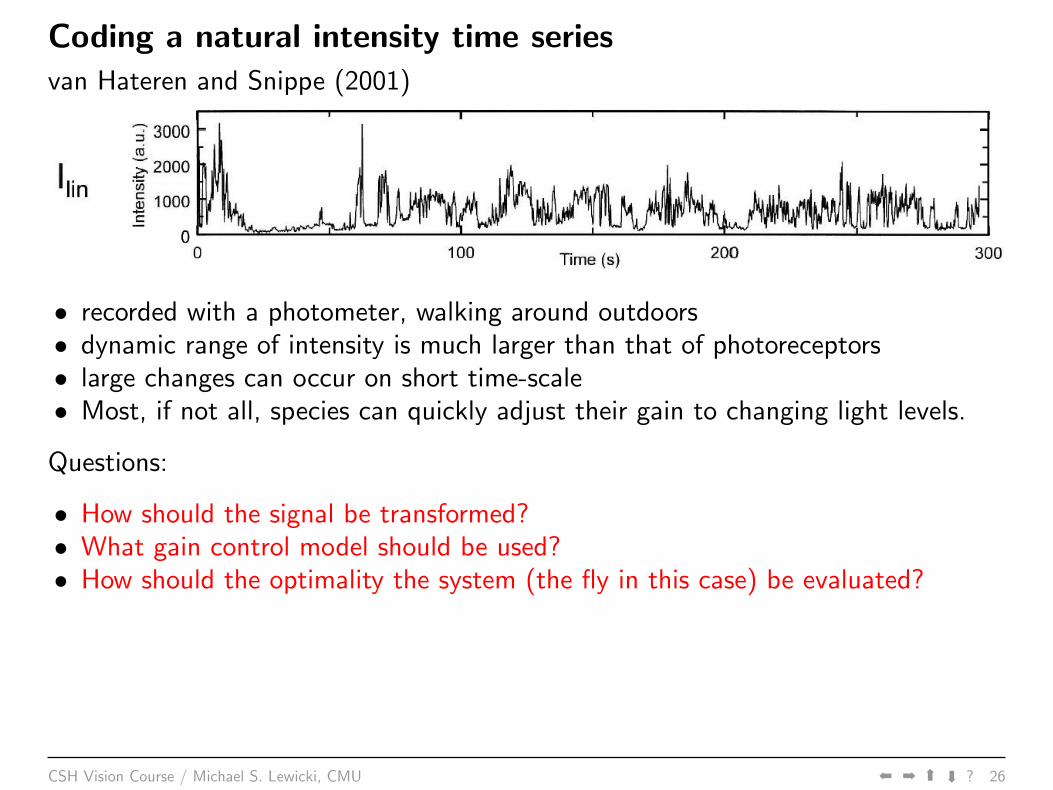
Coding a natural intensity time seriesvan Hateren and Snippe (2001)
• recorded with a photometer, walking around outdoors• dynamic range of intensity is much larger than that of photoreceptors• large changes can occur on short time-scale• Most, if not all, species can quickly adjust their gain to changing light levels.
Questions:
• How should the signal be transformed?• What gain control model should be used?• How should the optimality the system (the fly in this case) be evaluated?
CSH Vision Course / Michael S. Lewicki, CMU áá á
á
? 26
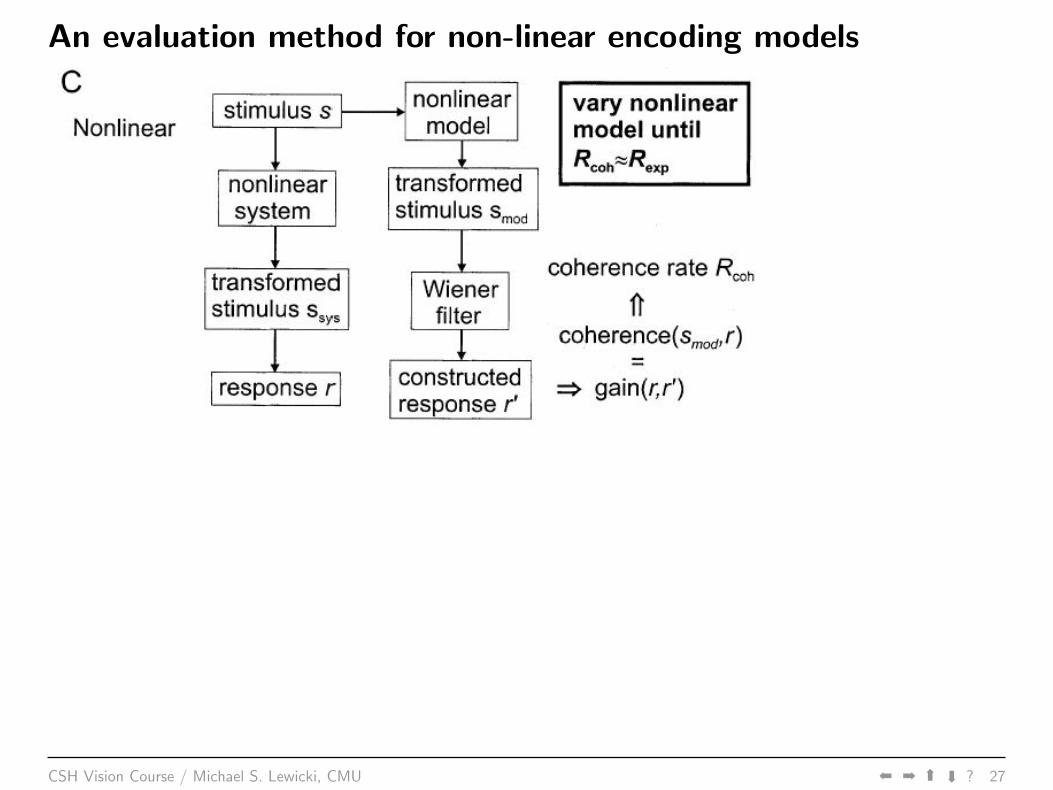
An evaluation method for non-linear encoding models
CSH Vision Course / Michael S. Lewicki, CMU áá á
á
? 27
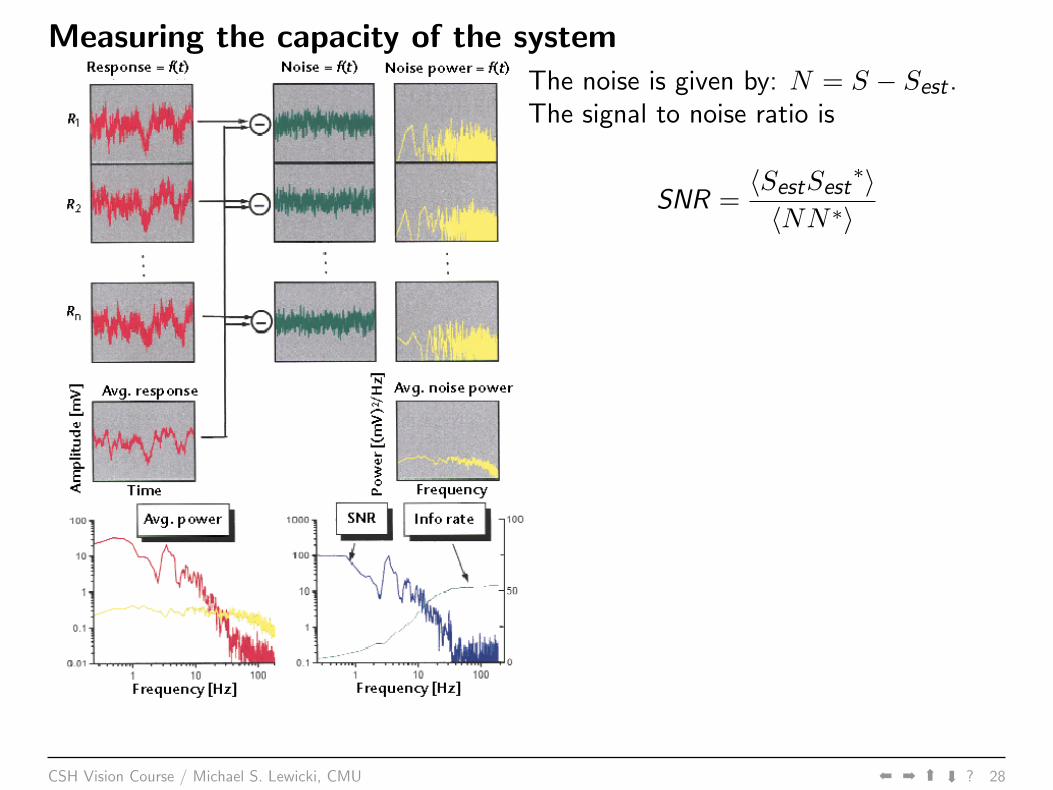
Measuring the capacity of the systemThe noise is given by: N = S − Sest .The signal to noise ratio is
SNR =〈SestSest
∗〉〈NN∗〉
CSH Vision Course / Michael S. Lewicki, CMU áá á
á
? 28
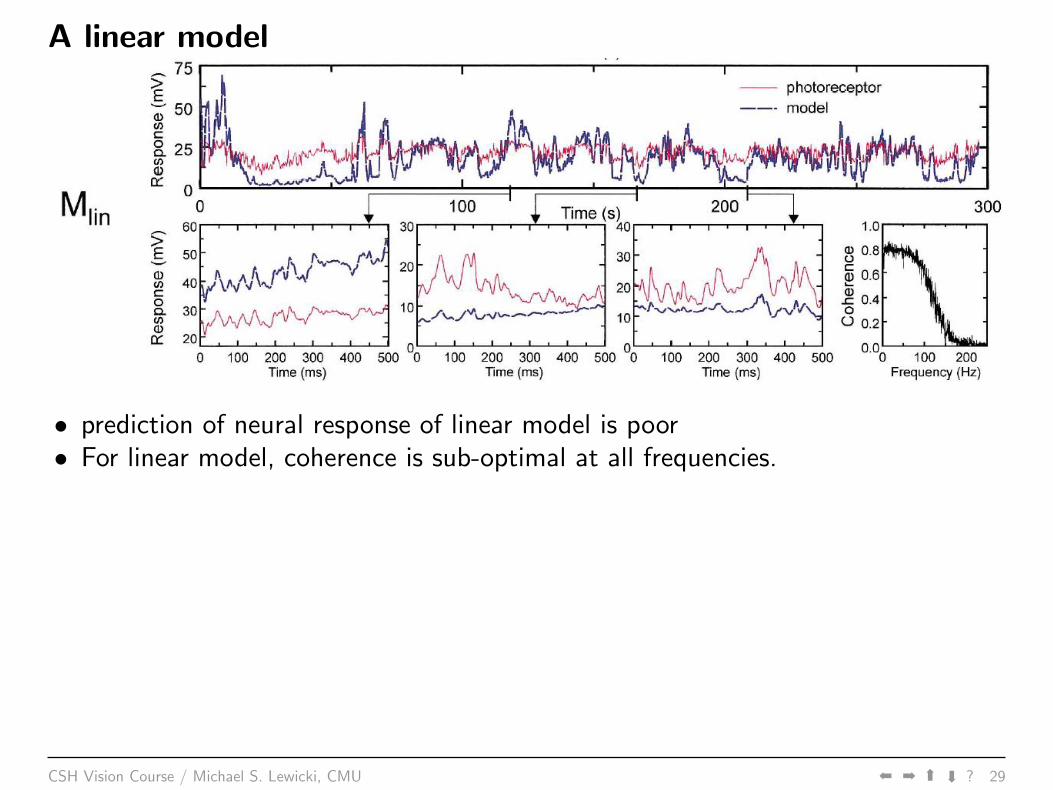
A linear model
• prediction of neural response of linear model is poor• For linear model, coherence is sub-optimal at all frequencies.
CSH Vision Course / Michael S. Lewicki, CMU áá á
á
? 29
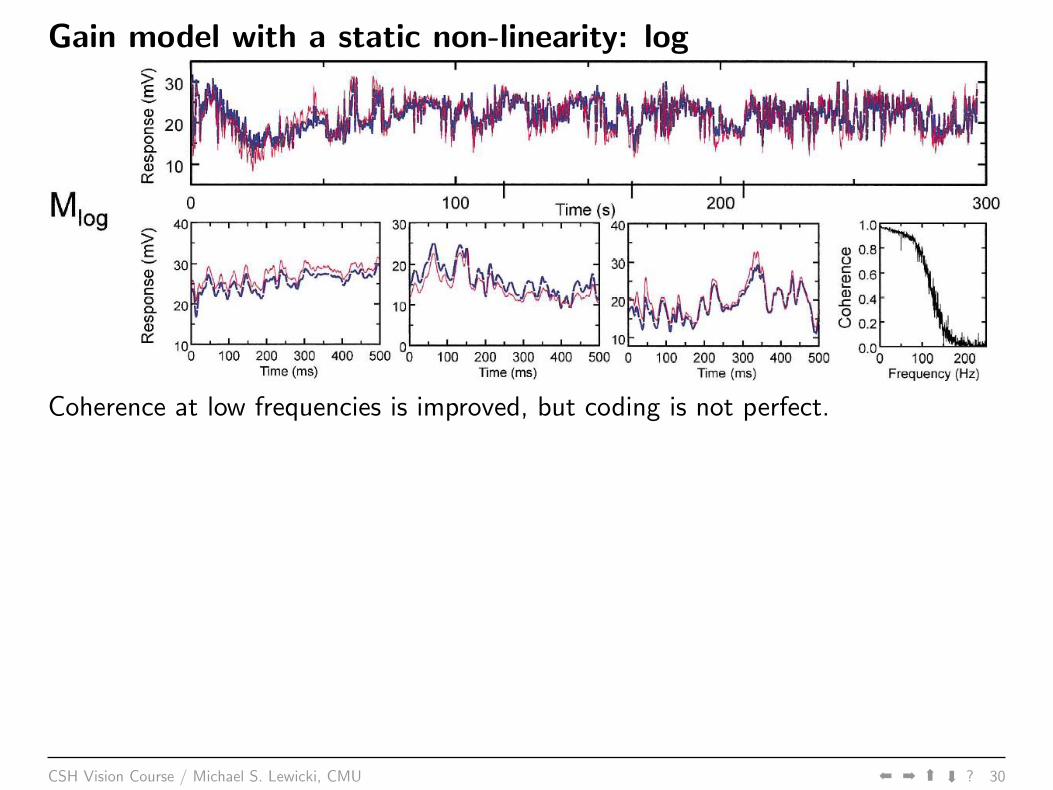
Gain model with a static non-linearity: log
Coherence at low frequencies is improved, but coding is not perfect.
CSH Vision Course / Michael S. Lewicki, CMU áá á
á
? 30
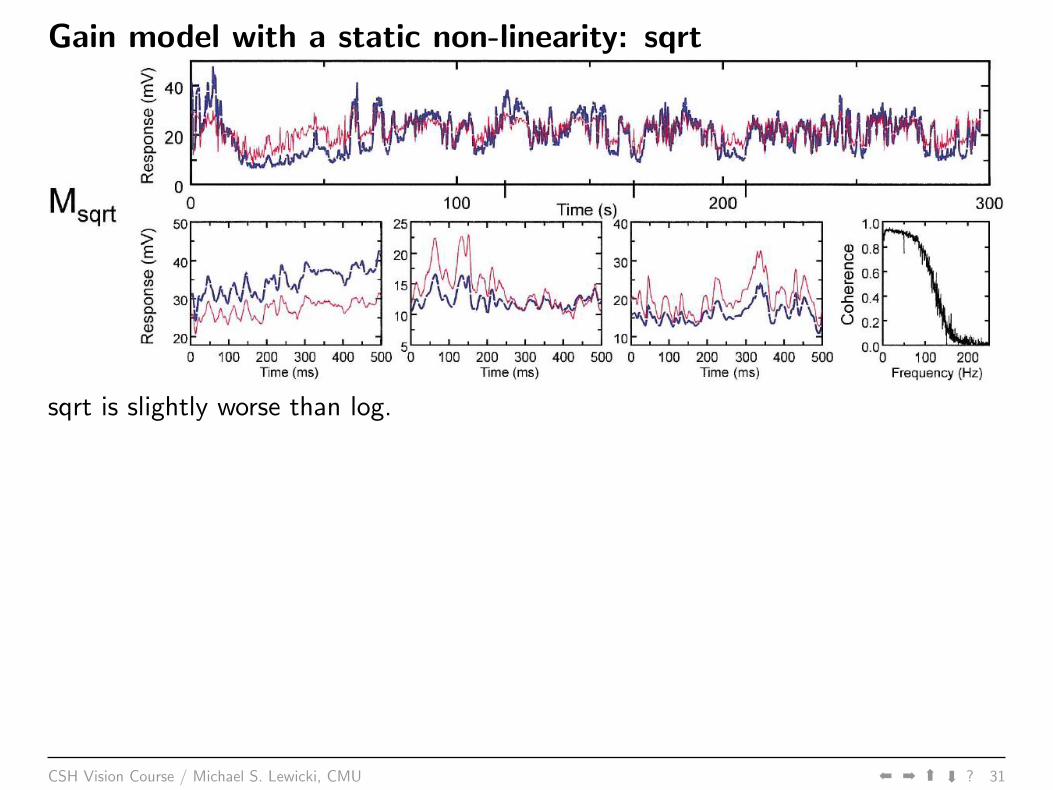
Gain model with a static non-linearity: sqrt
sqrt is slightly worse than log.
CSH Vision Course / Michael S. Lewicki, CMU áá á
á
? 31
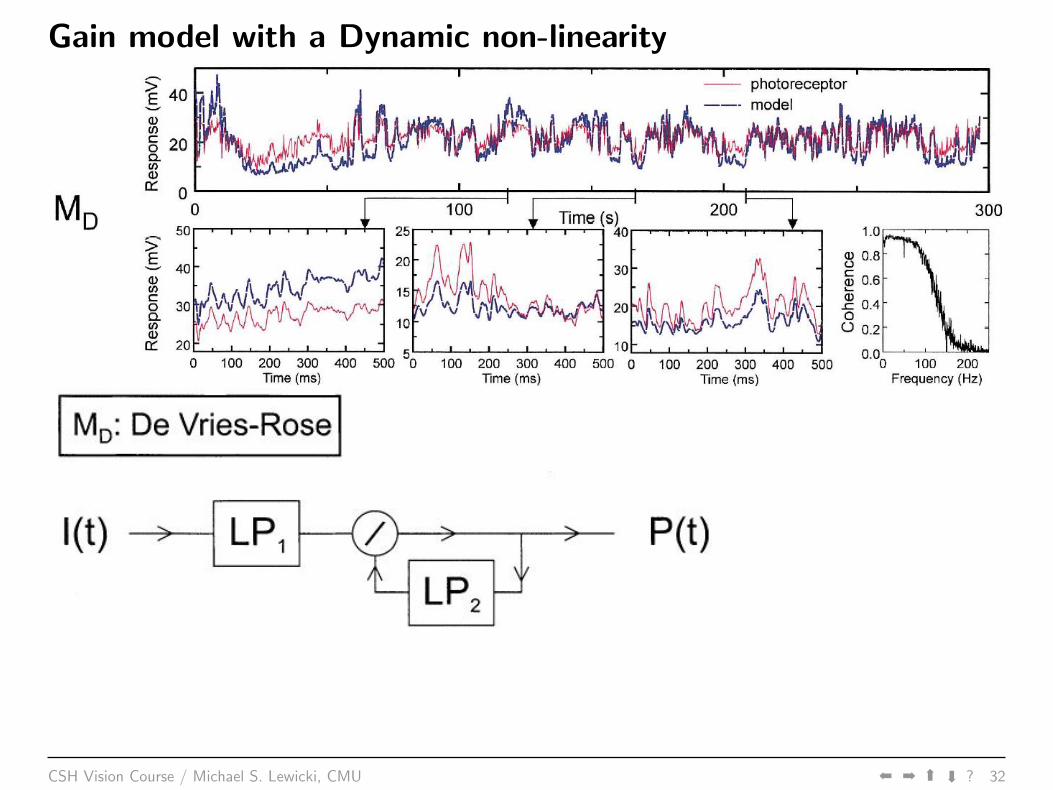
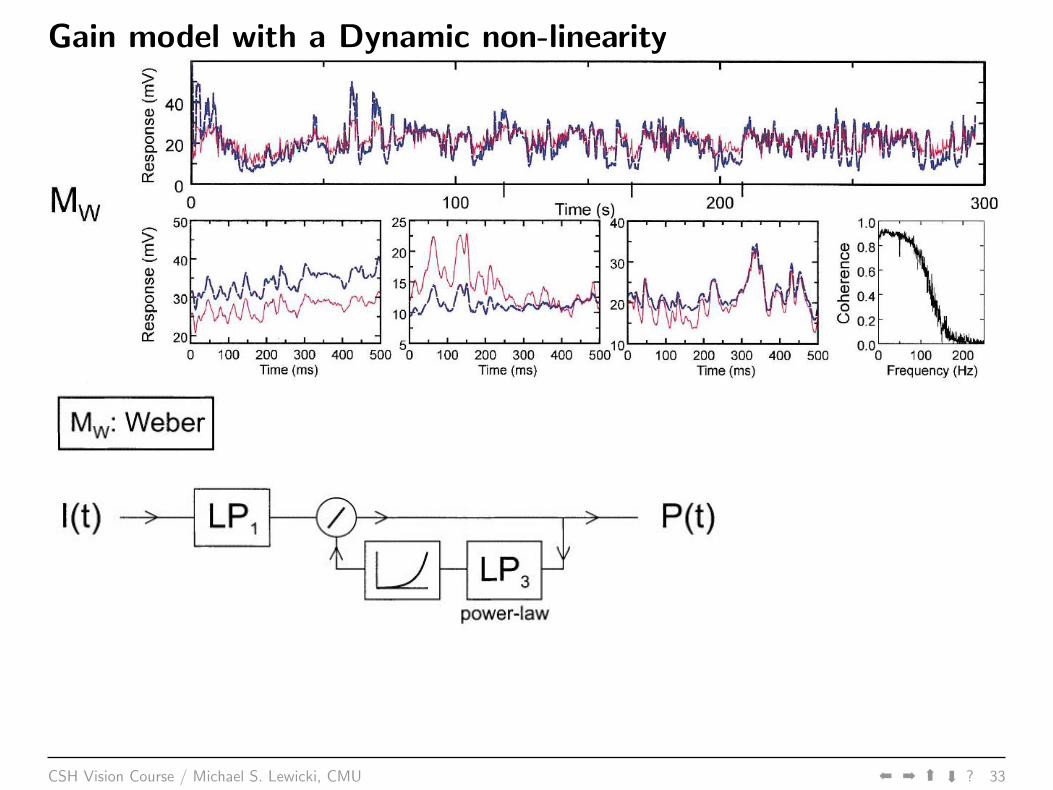
Gain model with a Dynamic non-linearity
CSH Vision Course / Michael S. Lewicki, CMU áá á
á
? 32
Gain model with a Dynamic non-linearity
CSH Vision Course / Michael S. Lewicki, CMU áá á
á
? 33
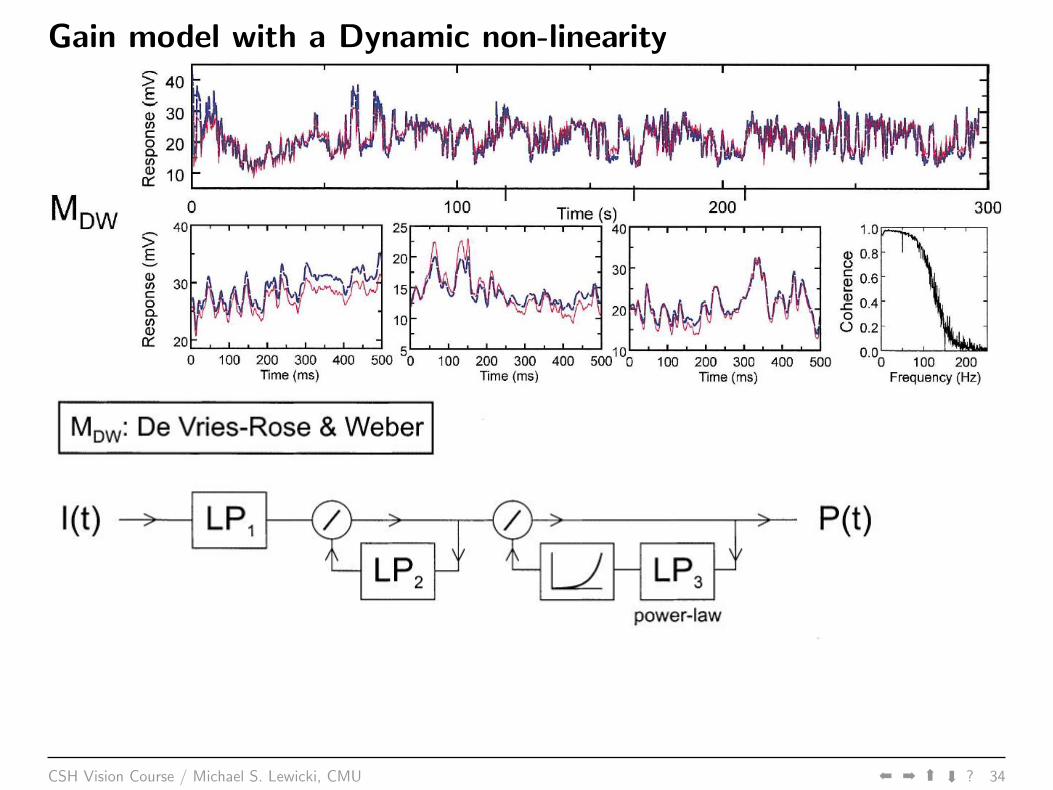
Gain model with a Dynamic non-linearity
CSH Vision Course / Michael S. Lewicki, CMU áá á
á
? 34
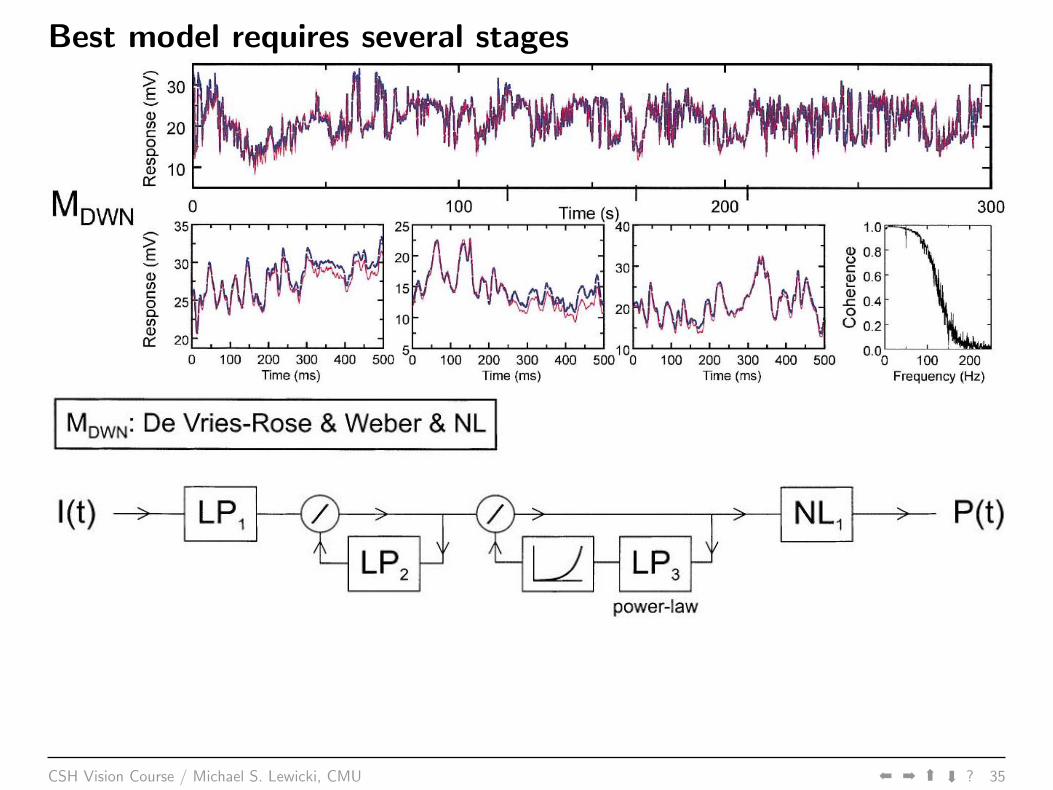
Best model requires several stages
CSH Vision Course / Michael S. Lewicki, CMU áá á
á
? 35
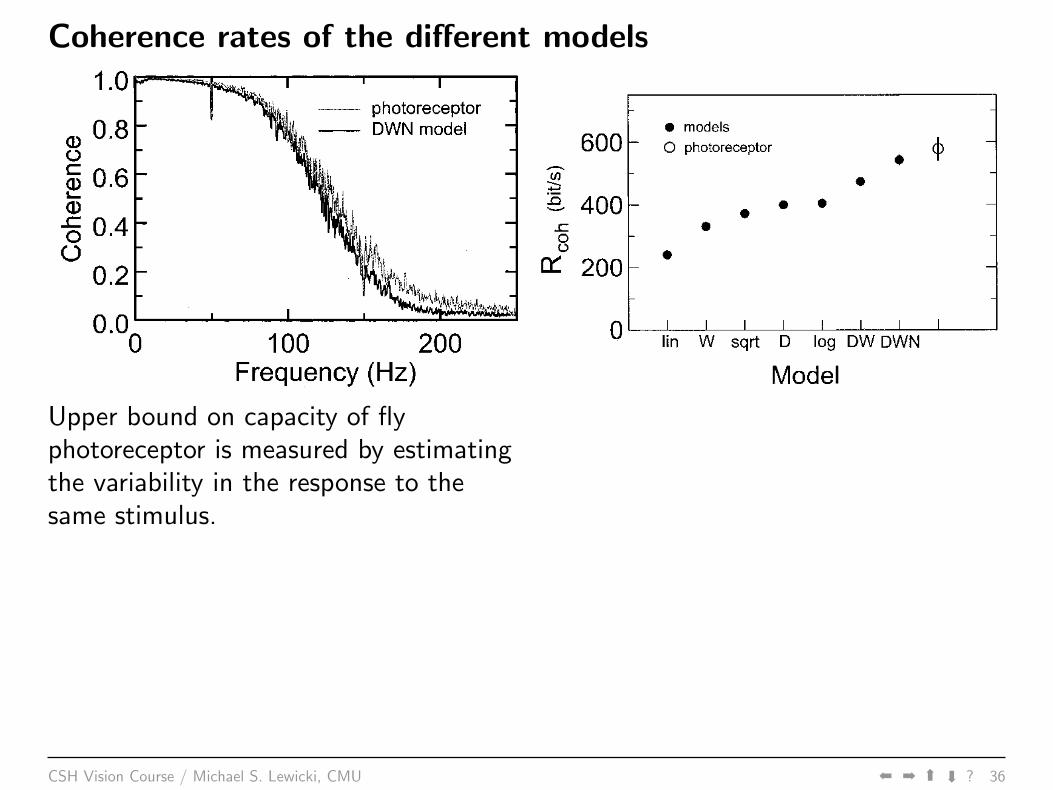
Coherence rates of the different models
Upper bound on capacity of flyphotoreceptor is measured by estimatingthe variability in the response to thesame stimulus.
CSH Vision Course / Michael S. Lewicki, CMU áá á
á
? 36


![Implicit Neural Representations with Periodic Activation ... · Neural ODEs [43] are related to this topic, but are very different in nature. Whereas implicit neural representations](https://img.pdfslide.net/doc/110x75/5f30cf4e0b0a810efd291cc9/implicit-neural-representations-with-periodic-activation-neural-odes-43-are.jpg)