Embed Size (px)
Citation preview
Lake Sunapee Watershed Project Portfolio – Natural Resource Inventory
NATURAL RESOURCE INVENTORY A Natural Resource Inventory (NRI) is a list and description of important, naturally occurring resources, such as water and forest land, in a particular area. This area can be a town, a watershed, a county or a region. New Hampshire is one of the fastest growing states in the area and the growth is expected to continue into the future. With this increase in population size and the steady use of resources, we must figure out a way to maintain the natural resources so that they will be available for future generations. To accomplish this goal, NRI maps and supplemental information can be used to evaluate the status of the resources in an area. The maps can show where resources are located, what the land cover looks like, where the possible contamination sites are as well as many other aspects that the community may want to know about an area. The supplemental information generally explains the map covering topics such as: what does the map show, what does the map mean, how was it developed, and what implications the map can have. NRI information gives an educated idea of what is located on a given area, but it is something that must be kept up to date to be useful. Resource abundances change as do the land cover and other types of resources over time. To have a good idea of what the area of interest is shaping up to look like, updating the NRI maps and supplemental information will have to show what the potential of a given area will be in the future. To understand how to do an NRI and be able to make them convey meaningful information, we used Natural Resource Inventories: A Guide for New Hampshire Communities and Conservation Groups revised and updated by Amanda J Lindley Stone, UNH Cooperative Extension, in 2001. It was originally written by Phil Auger, UNH Cooperative Extension, and Jeanie McIntyre, Upper Valley Land Trust, in 1990-1991. Topics covered in this NRI include:
• Watershed base map………………………………………………….2 • Conserved and unfragmented lands…………………………………..4 • Conserved lands………………………………………………………6 • Land cover……………………………………………………………8 • Rare and threatened species…………………………………………10 • Recreational resources………………………………………………12 • Unfragmented lands…………………………………………………14 • Water resources and contamination sites……………………………16 • Zoning……………………………………………………………….19
Institute for Community and Environment Colby-Sawyer College
1
Lake Sunapee Watershed Project Portfolio – Natural Resource Inventory
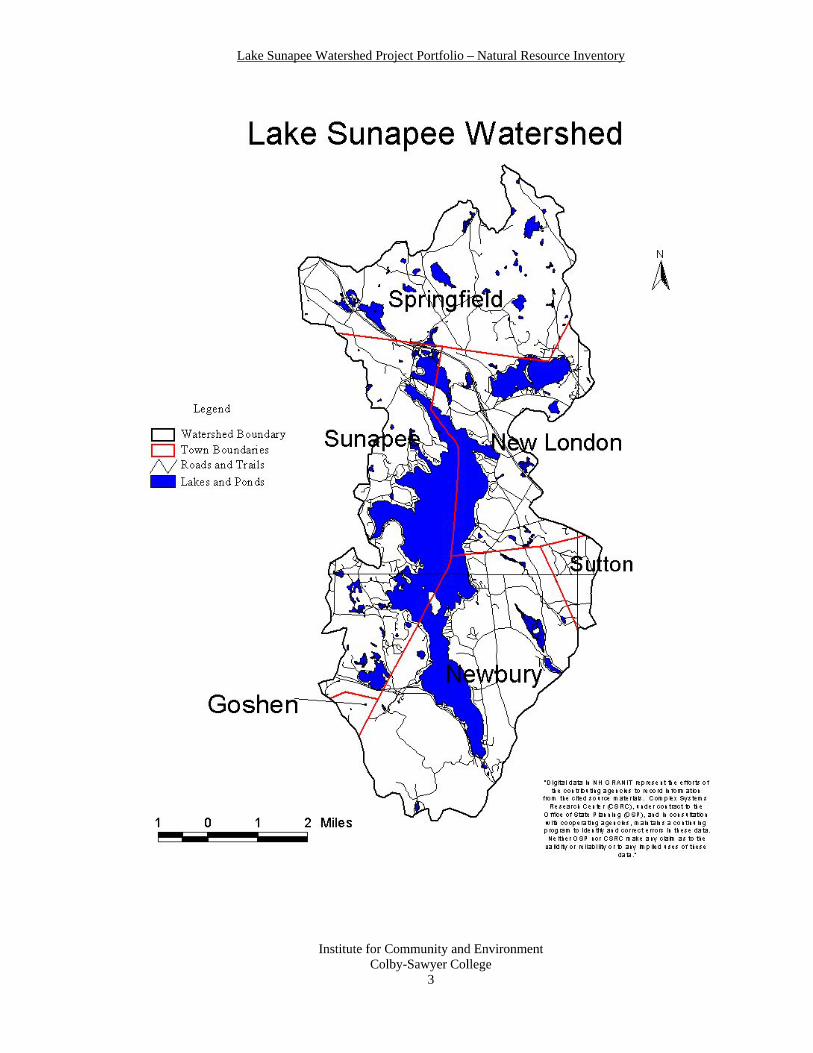
LAKE SUNAPEE WATERSHED BASE MAP Greg Van Steinburgh Natural resources, such as water and forests, are a vital part of New Hampshire’s cultural, economic, and community structure because they provide assets that are necessary for the survival of people, animals, and plants as well as the survival of businesses such as logging companies and recreation-based companies. Certain factors, such as development and land disturbance, have altered resources and have resulted in the displacement of wildlife, loss of recreational areas, scenic vistas, open space, contamination of ground and surface waters, and have increased erosion and flooding. The goal of a Natural Resources Inventory (NRI) is to list and describe important natural occurring resources within a given area. An NRI can be used as a basis for land conservation planning, and allows natural resource information to be included in local planning and zoning. The area, which the NRI covers, is the Lake Sunapee Watershed. The watershed is made up of six towns, and covers over 32,000 acres. Using Geographic Information Systems (GIS), as well as completing field research we established an NRI for the area circa 2003-2004. Although the information is detailed, it is not a definitive source. It is simply a compilation of research that has been gathered about the natural issues associated with the area This information can be used by Lake Sunapee Protective Association (LSPA) to monitor the available natural resources in the area and prevent rapid depletion. The following maps and write ups are shown: Recreation, Conserved Lands, Unfragmented Lands, Land Cover, Rare or Threatened Species, and Water Resources.
Institute for Community and Environment Colby-Sawyer College
2
Lake Sunapee Watershed Project Portfolio – Natural Resource Inventory
Institute for Community and Environment Colby-Sawyer College
3
Lake Sunapee Watershed Project Portfolio – Natural Resource Inventory
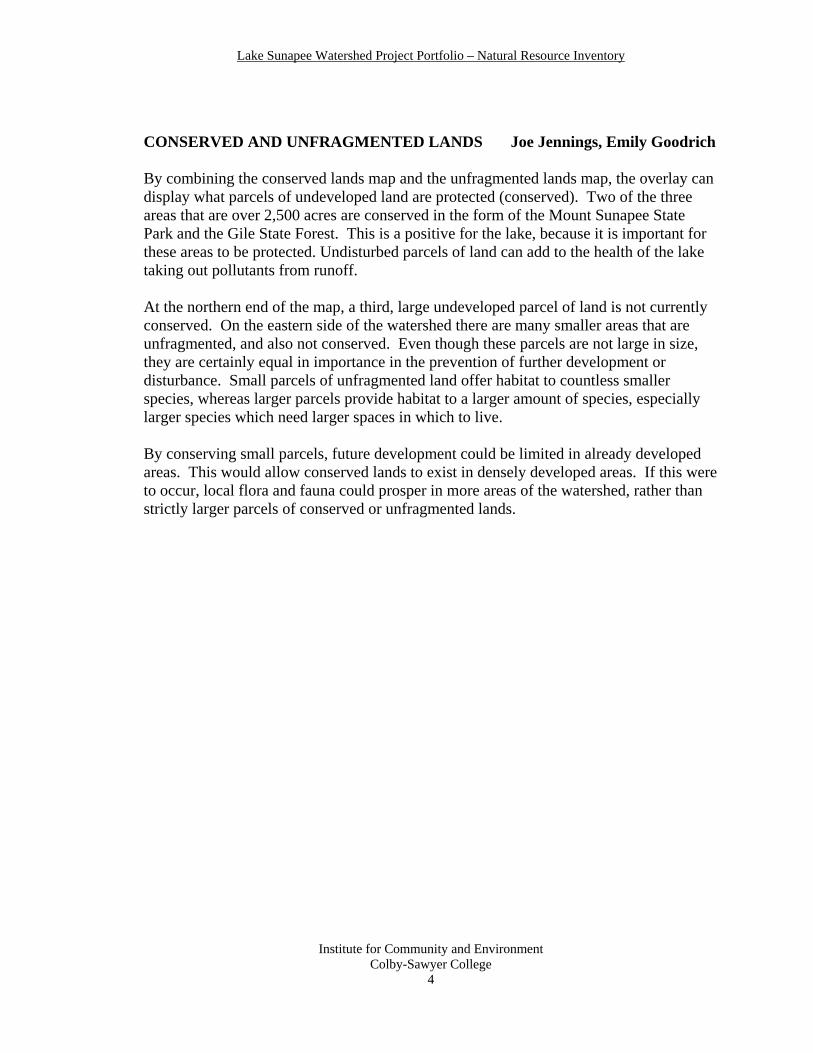
CONSERVED AND UNFRAGMENTED LANDS Joe Jennings, Emily Goodrich By combining the conserved lands map and the unfragmented lands map, the overlay can display what parcels of undeveloped land are protected (conserved). Two of the three areas that are over 2,500 acres are conserved in the form of the Mount Sunapee State Park and the Gile State Forest. This is a positive for the lake, because it is important for these areas to be protected. Undisturbed parcels of land can add to the health of the lake taking out pollutants from runoff. At the northern end of the map, a third, large undeveloped parcel of land is not currently conserved. On the eastern side of the watershed there are many smaller areas that are unfragmented, and also not conserved. Even though these parcels are not large in size, they are certainly equal in importance in the prevention of further development or disturbance. Small parcels of unfragmented land offer habitat to countless smaller species, whereas larger parcels provide habitat to a larger amount of species, especially larger species which need larger spaces in which to live. By conserving small parcels, future development could be limited in already developed areas. This would allow conserved lands to exist in densely developed areas. If this were to occur, local flora and fauna could prosper in more areas of the watershed, rather than strictly larger parcels of conserved or unfragmented lands.
Institute for Community and Environment Colby-Sawyer College
4
Lake Sunapee Watershed Project Portfolio – Natural Resource Inventory
Institute for Community and Environment Colby-Sawyer College
5
Lake Sunapee Watershed Project Portfolio – Natural Resource Inventory
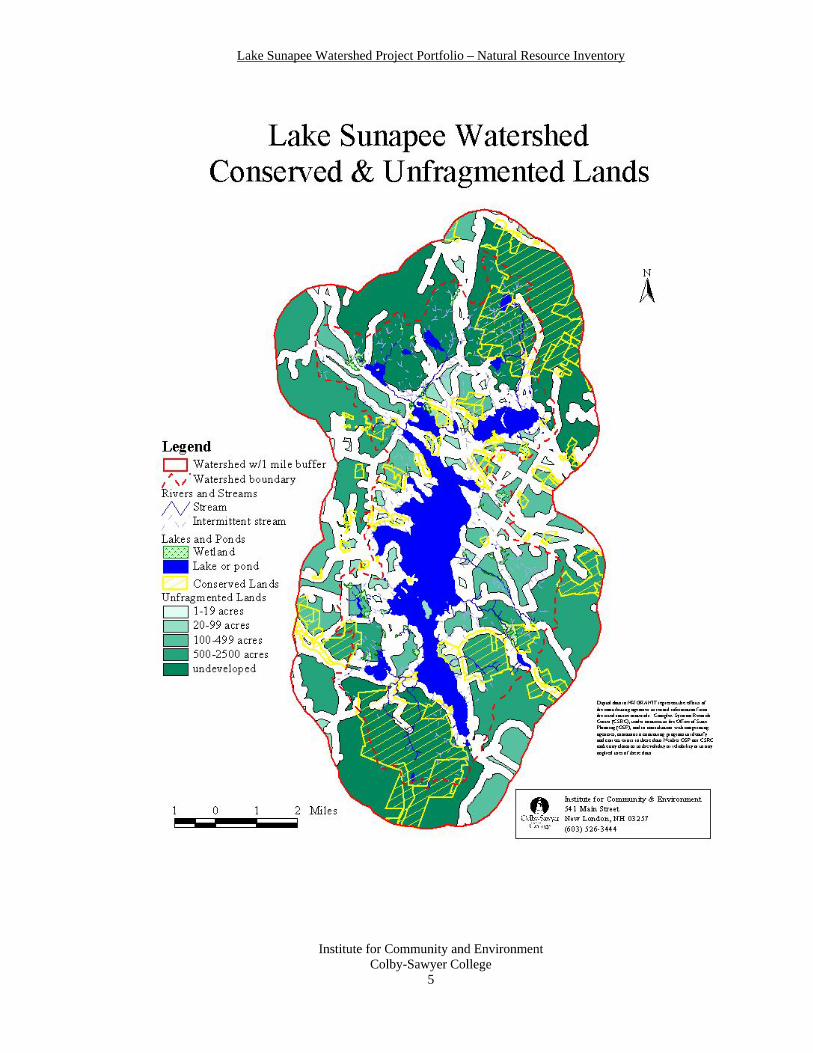
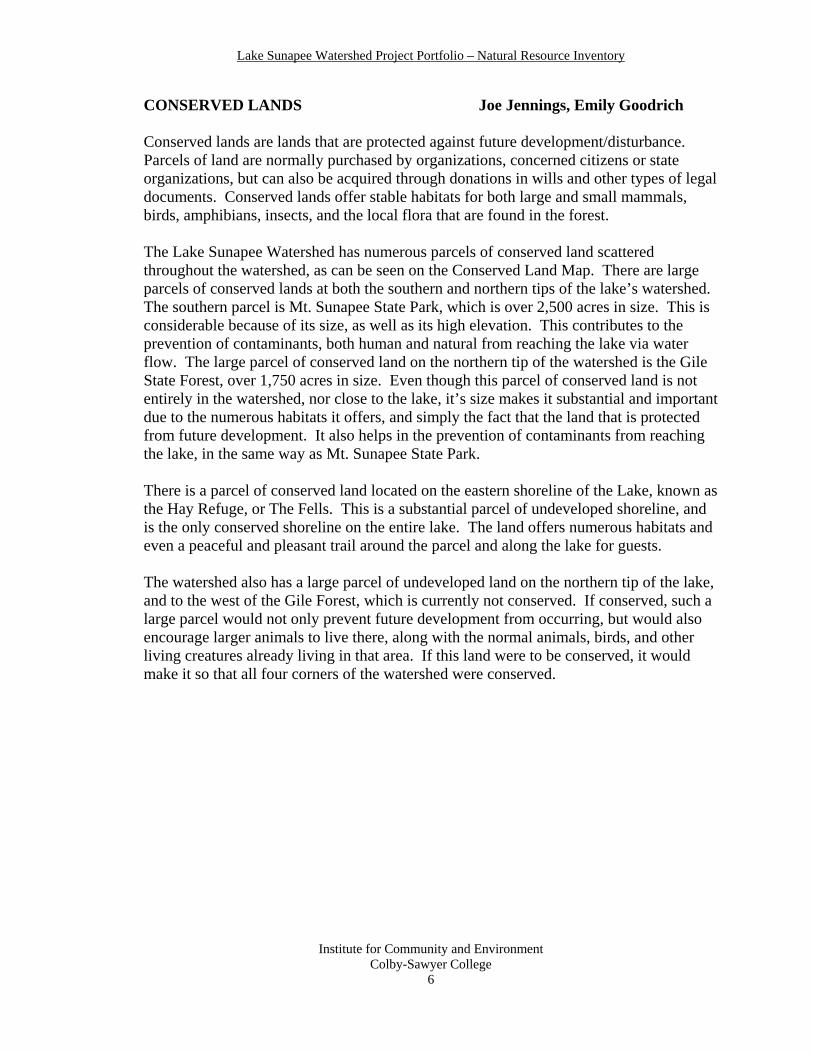
CONSERVED LANDS Joe Jennings, Emily Goodrich Conserved lands are lands that are protected against future development/disturbance. Parcels of land are normally purchased by organizations, concerned citizens or state organizations, but can also be acquired through donations in wills and other types of legal documents. Conserved lands offer stable habitats for both large and small mammals, birds, amphibians, insects, and the local flora that are found in the forest. The Lake Sunapee Watershed has numerous parcels of conserved land scattered throughout the watershed, as can be seen on the Conserved Land Map. There are large parcels of conserved lands at both the southern and northern tips of the lake’s watershed. The southern parcel is Mt. Sunapee State Park, which is over 2,500 acres in size. This is considerable because of its size, as well as its high elevation. This contributes to the prevention of contaminants, both human and natural from reaching the lake via water flow. The large parcel of conserved land on the northern tip of the watershed is the Gile State Forest, over 1,750 acres in size. Even though this parcel of conserved land is not entirely in the watershed, nor close to the lake, it’s size makes it substantial and important due to the numerous habitats it offers, and simply the fact that the land that is protected from future development. It also helps in the prevention of contaminants from reaching the lake, in the same way as Mt. Sunapee State Park. There is a parcel of conserved land located on the eastern shoreline of the Lake, known as the Hay Refuge, or The Fells. This is a substantial parcel of undeveloped shoreline, and is the only conserved shoreline on the entire lake. The land offers numerous habitats and even a peaceful and pleasant trail around the parcel and along the lake for guests. The watershed also has a large parcel of undeveloped land on the northern tip of the lake, and to the west of the Gile Forest, which is currently not conserved. If conserved, such a large parcel would not only prevent future development from occurring, but would also encourage larger animals to live there, along with the normal animals, birds, and other living creatures already living in that area. If this land were to be conserved, it would make it so that all four corners of the watershed were conserved.
Institute for Community and Environment Colby-Sawyer College
6
Lake Sunapee Watershed Project Portfolio – Natural Resource Inventory
Institute for Community and Environment Colby-Sawyer College
7
Lake Sunapee Watershed Project Portfolio – Natural Resource Inventory
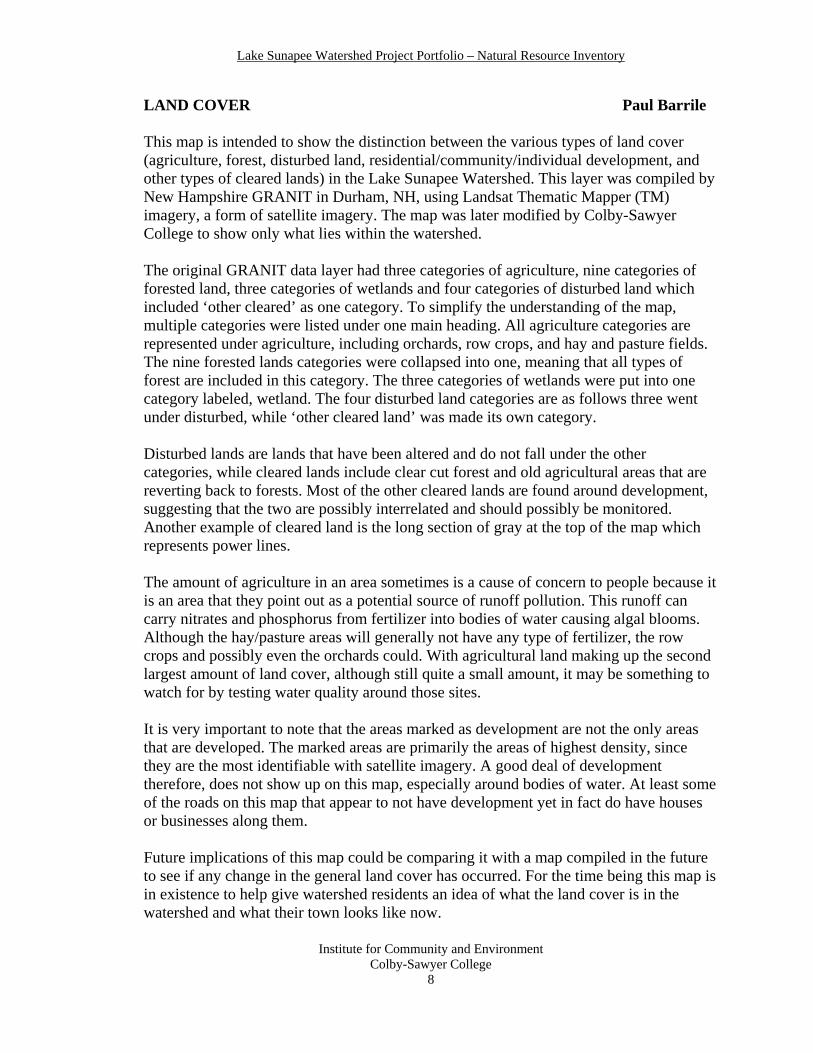
LAND COVER Paul Barrile This map is intended to show the distinction between the various types of land cover (agriculture, forest, disturbed land, residential/community/individual development, and other types of cleared lands) in the Lake Sunapee Watershed. This layer was compiled by New Hampshire GRANIT in Durham, NH, using Landsat Thematic Mapper (TM) imagery, a form of satellite imagery. The map was later modified by Colby-Sawyer College to show only what lies within the watershed. The original GRANIT data layer had three categories of agriculture, nine categories of forested land, three categories of wetlands and four categories of disturbed land which included ‘other cleared’ as one category. To simplify the understanding of the map, multiple categories were listed under one main heading. All agriculture categories are represented under agriculture, including orchards, row crops, and hay and pasture fields. The nine forested lands categories were collapsed into one, meaning that all types of forest are included in this category. The three categories of wetlands were put into one category labeled, wetland. The four disturbed land categories are as follows three went under disturbed, while ‘other cleared land’ was made its own category. Disturbed lands are lands that have been altered and do not fall under the other categories, while cleared lands include clear cut forest and old agricultural areas that are reverting back to forests. Most of the other cleared lands are found around development, suggesting that the two are possibly interrelated and should possibly be monitored. Another example of cleared land is the long section of gray at the top of the map which represents power lines. The amount of agriculture in an area sometimes is a cause of concern to people because it is an area that they point out as a potential source of runoff pollution. This runoff can carry nitrates and phosphorus from fertilizer into bodies of water causing algal blooms. Although the hay/pasture areas will generally not have any type of fertilizer, the row crops and possibly even the orchards could. With agricultural land making up the second largest amount of land cover, although still quite a small amount, it may be something to watch for by testing water quality around those sites. It is very important to note that the areas marked as development are not the only areas that are developed. The marked areas are primarily the areas of highest density, since they are the most identifiable with satellite imagery. A good deal of development therefore, does not show up on this map, especially around bodies of water. At least some of the roads on this map that appear to not have development yet in fact do have houses or businesses along them. Future implications of this map could be comparing it with a map compiled in the future to see if any change in the general land cover has occurred. For the time being this map is in existence to help give watershed residents an idea of what the land cover is in the watershed and what their town looks like now.
Institute for Community and Environment Colby-Sawyer College
8
Lake Sunapee Watershed Project Portfolio – Natural Resource Inventory
Institute for Community and Environment Colby-Sawyer College
9
Lake Sunapee Watershed Project Portfolio – Natural Resource Inventory
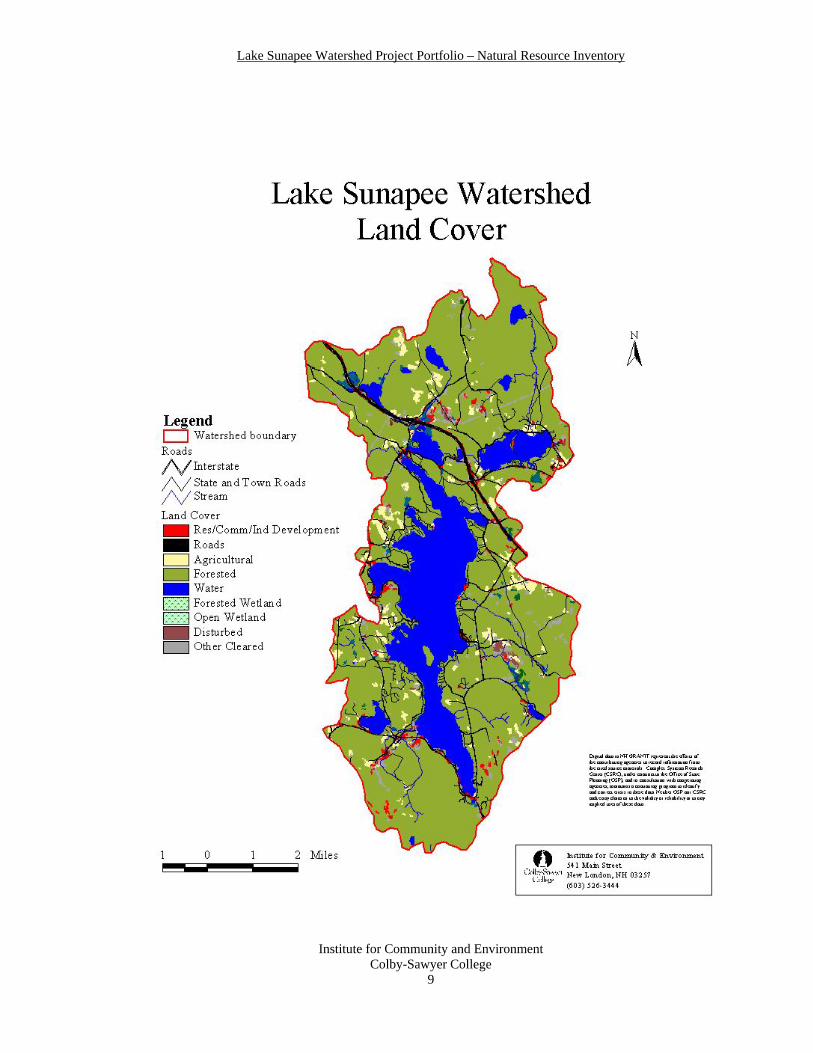
RARE AND THREATENED SPECIES Paul Barrile This map shows the general vicinity of where rare and threatened species may be found in the Lake Sunapee Watershed. To protect the rare and threatened species, a mark is made on the map at an undisclosed distance from the actual site, which is intended to show areas where rare and threatened species exist. The intent is not to give exact locations, but to help keep them hidden from the public and potential human threats to the species. This is also done to protect landowner privacy. By making the mark not exact, it prevents the ability to pinpoint a specific parcel of land where the species might exist. Although a rare species may exist in an area and may be labeled as a plant, animal, or community, the exact species will not be given as another measure of protection for the species against harm. In this instance, all the marked rare and threatened species are plants or plant communities. These species are not the only rare and threatened species in the watershed; they are the ones that have been reported. Rare species are reported to the New Hampshire Natural Heritage Inventory voluntarily by people who have identified them and given their approximate location. It is possible, and quite probable that more rare and threatened species exist in the watershed. They may have not been reported, are not known to be rare or threatened, or may simply have yet not been found. This map is designed to let people in the watershed know that rare and threatened species exist in the watershed. These areas in and around the location of these special species should be, if they are not already, conserved to prevent anything from happening to these rare and threatened species.
Institute for Community and Environment Colby-Sawyer College
10
Lake Sunapee Watershed Project Portfolio – Natural Resource Inventory
Institute for Community and Environment Colby-Sawyer College
11
Lake Sunapee Watershed Project Portfolio – Natural Resource Inventory
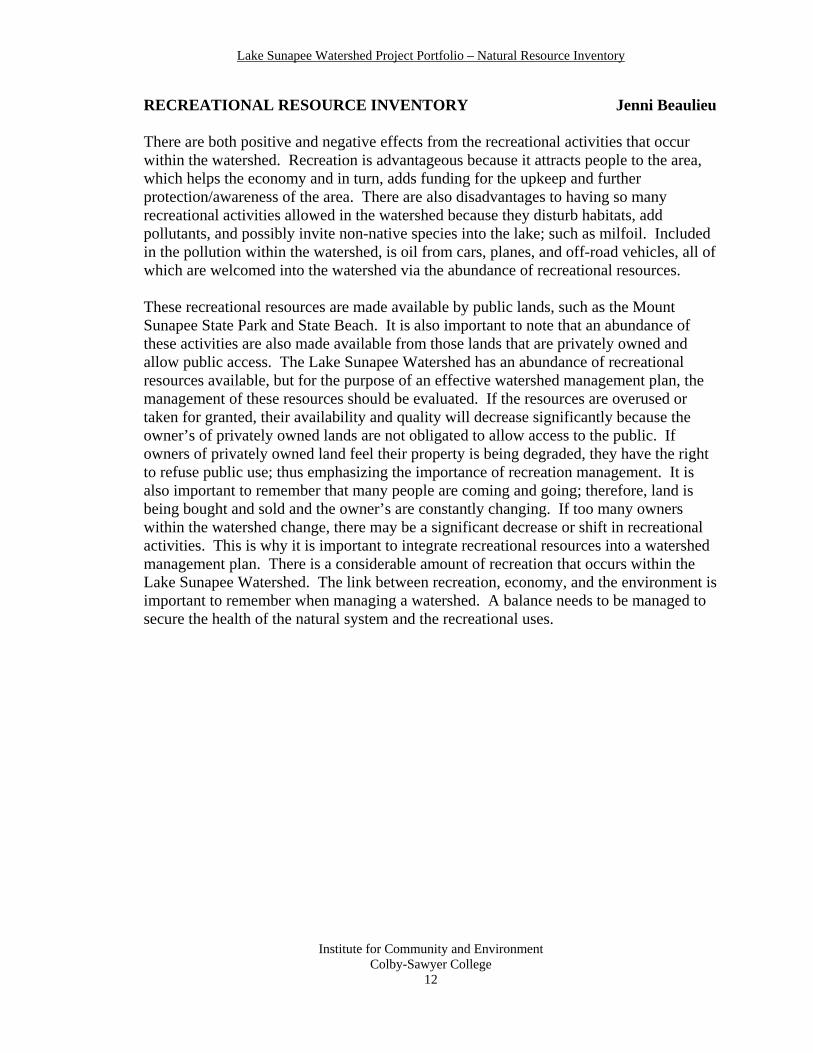
RECREATIONAL RESOURCE INVENTORY Jenni Beaulieu There are both positive and negative effects from the recreational activities that occur within the watershed. Recreation is advantageous because it attracts people to the area, which helps the economy and in turn, adds funding for the upkeep and further protection/awareness of the area. There are also disadvantages to having so many recreational activities allowed in the watershed because they disturb habitats, add pollutants, and possibly invite non-native species into the lake; such as milfoil. Included in the pollution within the watershed, is oil from cars, planes, and off-road vehicles, all of which are welcomed into the watershed via the abundance of recreational resources. These recreational resources are made available by public lands, such as the Mount Sunapee State Park and State Beach. It is also important to note that an abundance of these activities are also made available from those lands that are privately owned and allow public access. The Lake Sunapee Watershed has an abundance of recreational resources available, but for the purpose of an effective watershed management plan, the management of these resources should be evaluated. If the resources are overused or taken for granted, their availability and quality will decrease significantly because the owner’s of privately owned lands are not obligated to allow access to the public. If owners of privately owned land feel their property is being degraded, they have the right to refuse public use; thus emphasizing the importance of recreation management. It is also important to remember that many people are coming and going; therefore, land is being bought and sold and the owner’s are constantly changing. If too many owners within the watershed change, there may be a significant decrease or shift in recreational activities. This is why it is important to integrate recreational resources into a watershed management plan. There is a considerable amount of recreation that occurs within the Lake Sunapee Watershed. The link between recreation, economy, and the environment is important to remember when managing a watershed. A balance needs to be managed to secure the health of the natural system and the recreational uses.
Institute for Community and Environment Colby-Sawyer College
12
Lake Sunapee Watershed Project Portfolio – Natural Resource Inventory
Institute for Community and Environment Colby-Sawyer College
13
Lake Sunapee Watershed Project Portfolio – Natural Resource Inventory
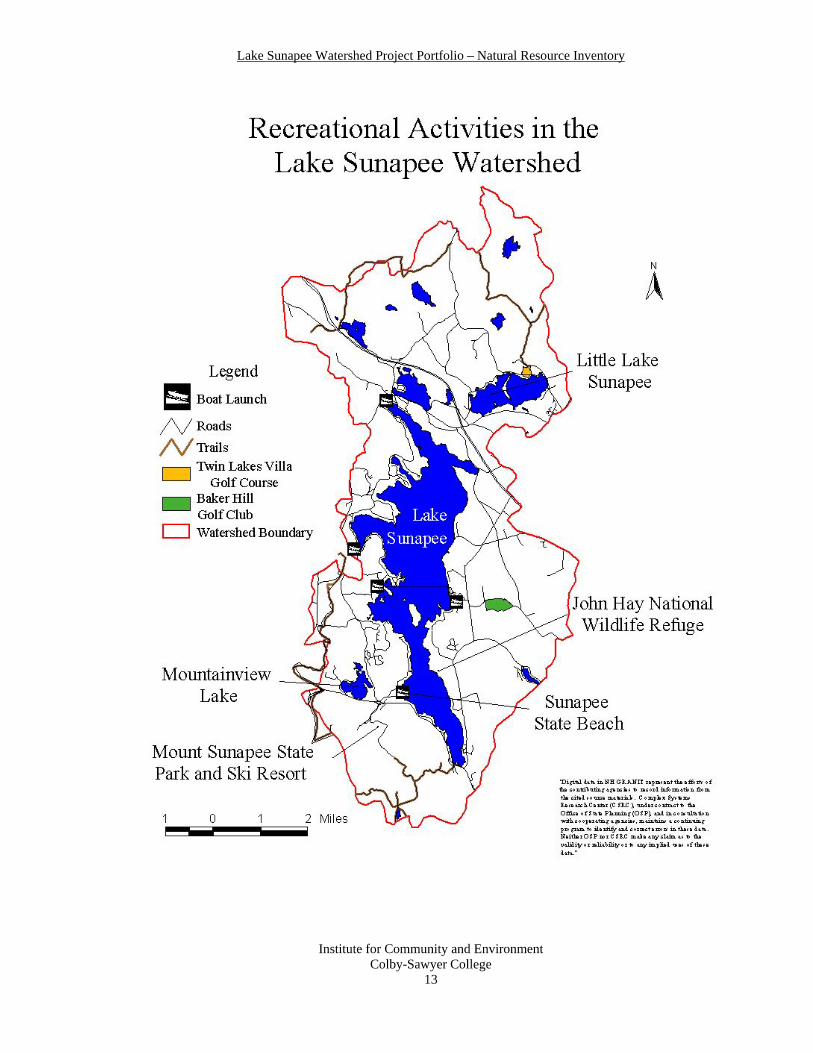
UNFRAGMENTED LANDS Joe Jennings, Emily Goodrich Unfragmented lands are lands that have little development or disturbance. The lands are fragmented by roads that intersect the parcels of land. Larger unfragmented land parcels offer habitat to larger species which require greater areas for survival, as well as habitat to larger amounts of smaller species. Unfragmented lands are also important when developing a land management plan because they are the areas that may be looked at for future conservation easements. When looking at unfragmented lands via the Geographic Information System (GIS) map, there is an assumption of the development in sections of a landscape. A roads layer is downloaded onto a GIS system, which is then buffered 500 feet on each side of paved roads. It can be assumed that where there are roads, there is development. It is quite possible that these lands are forested, farmland, open water, or even a mowed field, meaning that these areas are not necessarily developed, but are possibly disturbed. The GIS system can not tell the difference between these types of lands. The Lake Sunapee Watershed unfragmented lands map shows the different size parcels of land, roads with the 500 foot buffer on each side, and a one mile buffer around the outside of the watershed. This one mile buffer allows the viewer to see the continuation of the watershed’s unfragmented lands. Along the shoreline, there are significant amounts of developed lands, except for a one mile stretch towards the southeastern end of the lake. This area is the Hay Refuge, also known as The Fells. Extensive shoreline development increases the chance of contaminants reaching the waterbody, through impervious surfaces and water flow into the lake. High shoreline development can also lead to light and noise pollution. The Fells offers a one-mile relief from all of these concerns. It should be an important goal to keep this area undeveloped, for both historical and environmental reasons. There are three larger parcels of land that exceed 2,500 acres, located at the northern and southern ends of the lake. These areas have very little developed land, and in addition, two parcels are conserved. The Lake Sunapee Protective Association and surrounding organizations should consider conserving the third unprotected parcel. By conserving this parcel, an additional 2,500 acres of land would be protected from future development and disturbance. The more development a watershed has; the more contaminates flow into the lake by runoff, causing pollution contaminations.
Institute for Community and Environment Colby-Sawyer College
14
Lake Sunapee Watershed Project Portfolio – Natural Resource Inventory
Institute for Community and Environment Colby-Sawyer College
15
Lake Sunapee Watershed Project Portfolio – Natural Resource Inventory
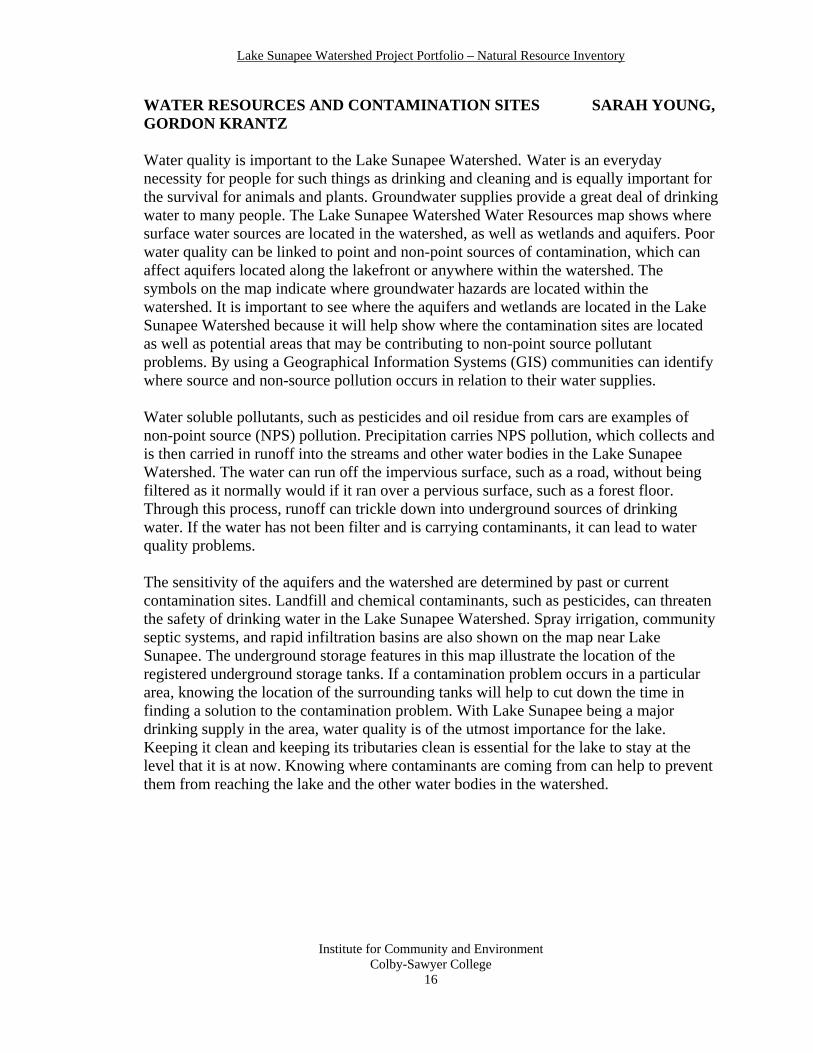
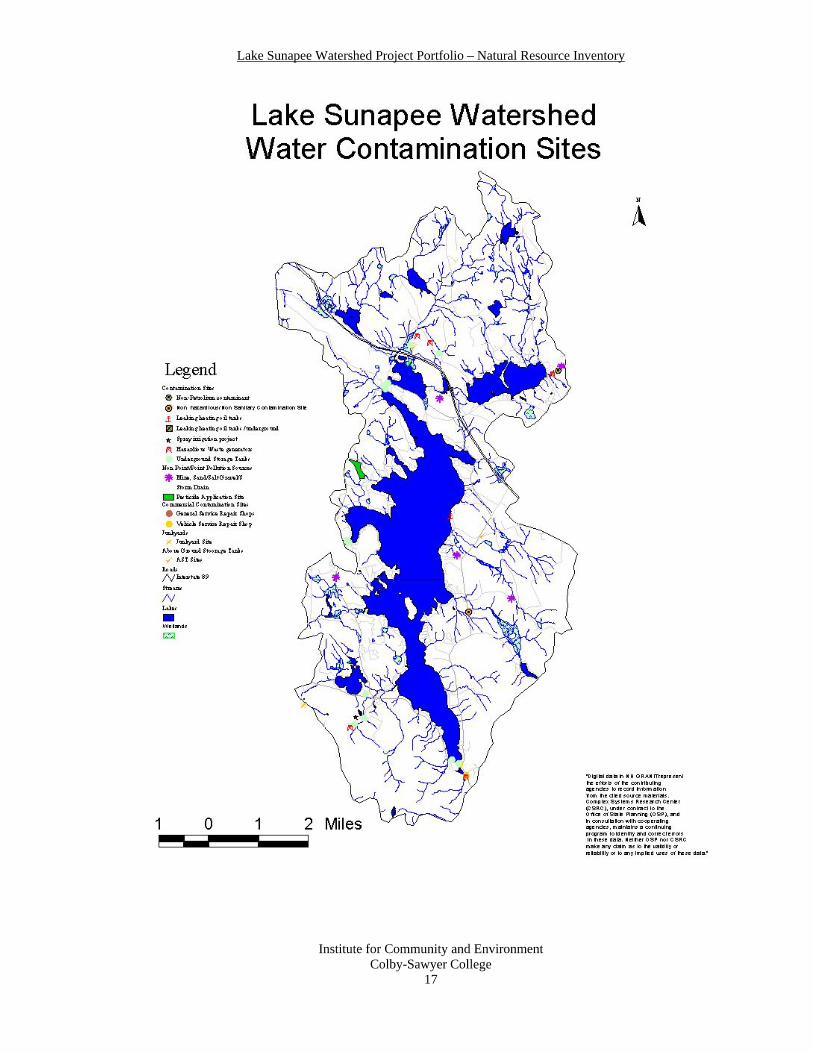
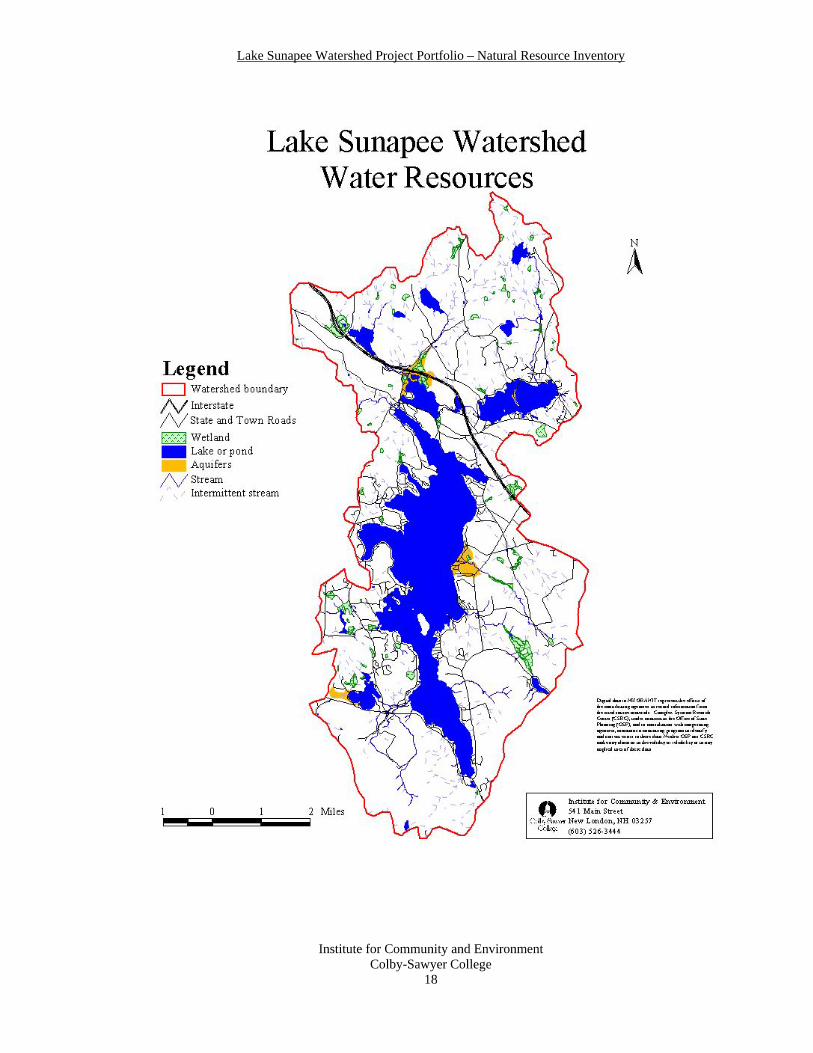
WATER RESOURCES AND CONTAMINATION SITES SARAH YOUNG, GORDON KRANTZ Water quality is important to the Lake Sunapee Watershed. Water is an everyday necessity for people for such things as drinking and cleaning and is equally important for the survival for animals and plants. Groundwater supplies provide a great deal of drinking water to many people. The Lake Sunapee Watershed Water Resources map shows where surface water sources are located in the watershed, as well as wetlands and aquifers. Poor water quality can be linked to point and non-point sources of contamination, which can affect aquifers located along the lakefront or anywhere within the watershed. The symbols on the map indicate where groundwater hazards are located within the watershed. It is important to see where the aquifers and wetlands are located in the Lake Sunapee Watershed because it will help show where the contamination sites are located as well as potential areas that may be contributing to non-point source pollutant problems. By using a Geographical Information Systems (GIS) communities can identify where source and non-source pollution occurs in relation to their water supplies. Water soluble pollutants, such as pesticides and oil residue from cars are examples of non-point source (NPS) pollution. Precipitation carries NPS pollution, which collects and is then carried in runoff into the streams and other water bodies in the Lake Sunapee Watershed. The water can run off the impervious surface, such as a road, without being filtered as it normally would if it ran over a pervious surface, such as a forest floor. Through this process, runoff can trickle down into underground sources of drinking water. If the water has not been filter and is carrying contaminants, it can lead to water quality problems. The sensitivity of the aquifers and the watershed are determined by past or current contamination sites. Landfill and chemical contaminants, such as pesticides, can threaten the safety of drinking water in the Lake Sunapee Watershed. Spray irrigation, community septic systems, and rapid infiltration basins are also shown on the map near Lake Sunapee. The underground storage features in this map illustrate the location of the registered underground storage tanks. If a contamination problem occurs in a particular area, knowing the location of the surrounding tanks will help to cut down the time in finding a solution to the contamination problem. With Lake Sunapee being a major drinking supply in the area, water quality is of the utmost importance for the lake. Keeping it clean and keeping its tributaries clean is essential for the lake to stay at the level that it is at now. Knowing where contaminants are coming from can help to prevent them from reaching the lake and the other water bodies in the watershed.
Institute for Community and Environment Colby-Sawyer College
16
Lake Sunapee Watershed Project Portfolio – Natural Resource Inventory
Institute for Community and Environment Colby-Sawyer College
17
Lake Sunapee Watershed Project Portfolio – Natural Resource Inventory
Institute for Community and Environment Colby-Sawyer College
18
Lake Sunapee Watershed Project Portfolio – Natural Resource Inventory
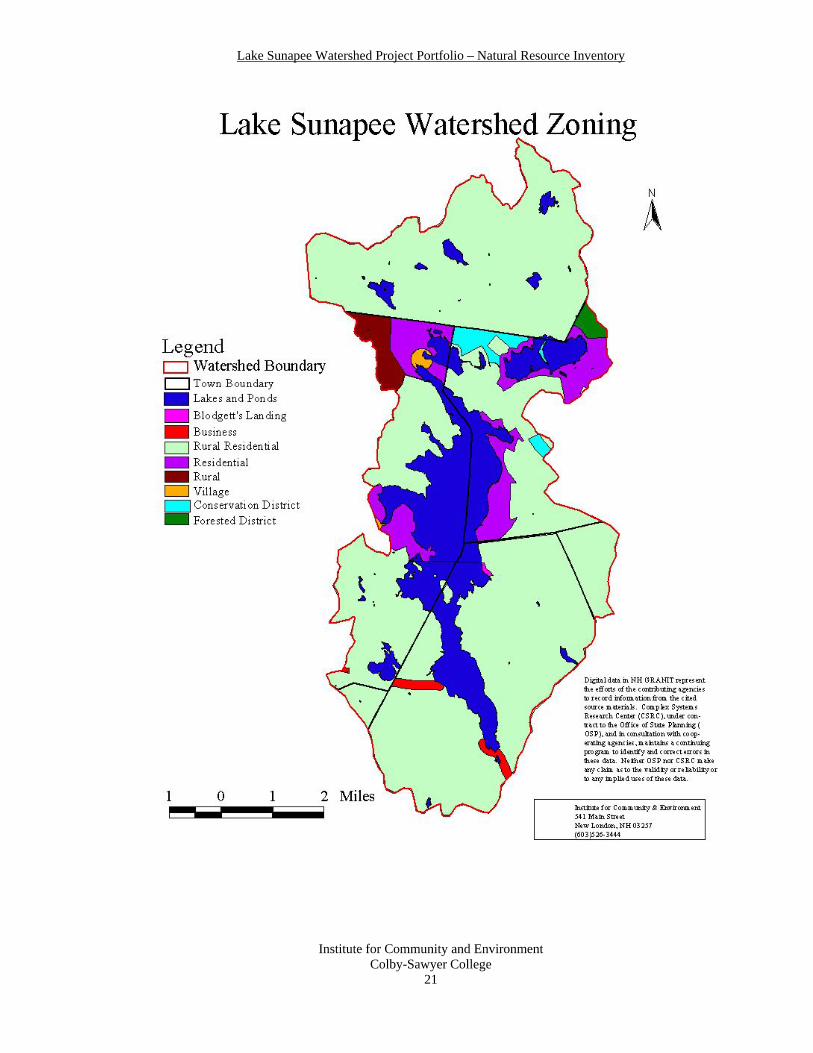
WATERSHED ZONING Tamsen Bolte, Stacey Philbrook Town zoning is an important aspect in relation to watershed health and development. Zoning districts and regulations represent how a town feels about how their land is being used both now and in the future. From very specific regulations to general uses, zoning identifies ways in which the land can be developed. Recognizing distinct zones is a way in which a community can regulate the amount of development in a certain area. In connection to the Lake Sunapee Watershed, a master zoning map can provide information on the types of land uses that currently exist, and where there is potential for future development. In addition to providing information about development, it can also be a useful aid for town municipalities in developing plans for instituting new zoning and/or building regulations. Towns can cross-reference with other towns in comparing how certain land types or areas are being utilized. There can also be merit in examining how certain zones and their regulations affect the lake system. Other information that can be extracted through the use of a watershed zoning map can provide insight about potential conflicts with the watershed’s natural resources. This map could also be used as a tool in conjunction with a watershed build-out plan to identify areas of potential development. Each of the six towns within the Lake Sunapee Watershed have developed and implemented their own individual zoning and building regulations. There are similarities and differences among the various zones that exist within the watershed. Zoning districts for the towns have been categorized based on regulation commonalities, such as minimum lot acreage and permitted land use. This allows for districts to be merged into general districts for the entire watershed. It is important to note that there are slight differences that still exist, and should be observed within each town’s zoning ordinances. However for the purpose of this map, these differences have been overlooked, yet should not be forgotten. From this general zoning map of the Lake Sunapee Watershed, patterns of types of land use can be developed. Future suggestions can then be presented to town councils in attempt to expand existing zones and/or create new zones where zoning regulations are insufficient. Overlay maps, such as conserved and unfragmented lands, could further assist in demonstrating the role of town zoning.
Legend Explanation Zoning Categories: (minimum lot ranges) Business: 10,000 ft2- 2 acres Village: .5 acres Blodgett’s Landing: lots are grandfathered Rural residential: 1.5-3 acres Residential: 1-2 acres Rural: 3 acres Conservation District: 10 acres Forested District: 25 acres
Institute for Community and Environment Colby-Sawyer College
19
Lake Sunapee Watershed Project Portfolio – Natural Resource Inventory
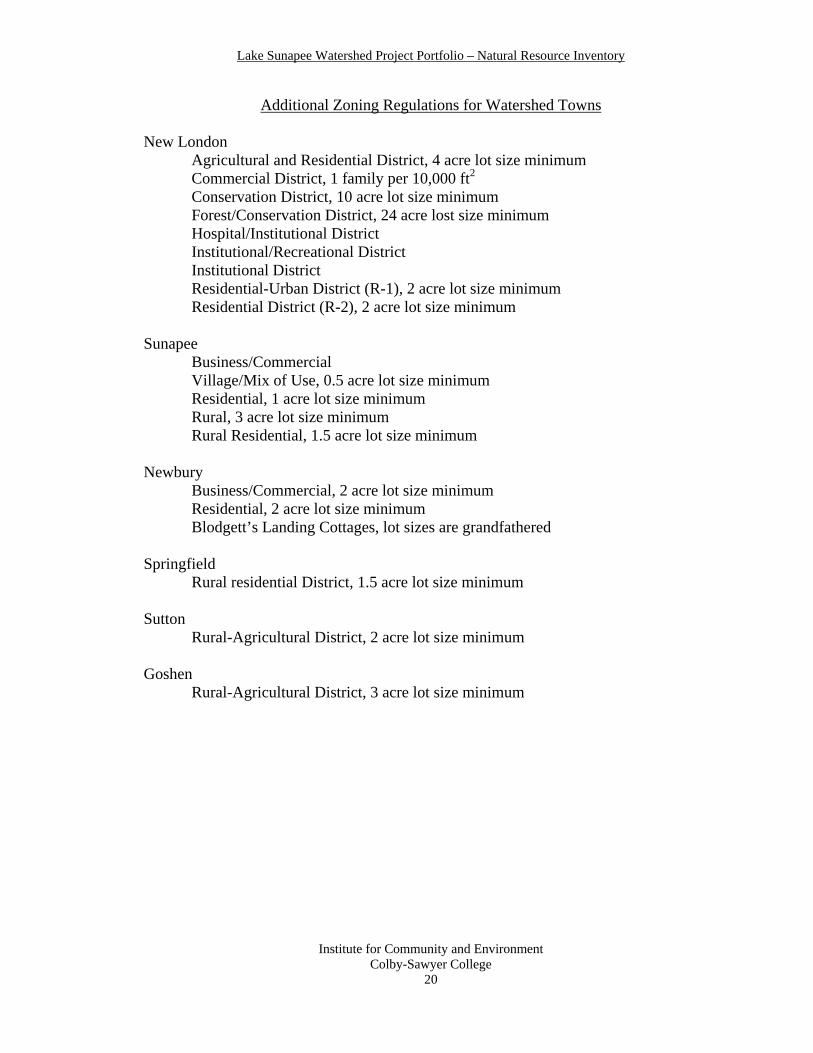
Additional Zoning Regulations for Watershed Towns
New London Agricultural and Residential District, 4 acre lot size minimum Commercial District, 1 family per 10,000 ft2
Conservation District, 10 acre lot size minimum Forest/Conservation District, 24 acre lost size minimum Hospital/Institutional District Institutional/Recreational District Institutional District Residential-Urban District (R-1), 2 acre lot size minimum Residential District (R-2), 2 acre lot size minimum Sunapee Business/Commercial Village/Mix of Use, 0.5 acre lot size minimum Residential, 1 acre lot size minimum Rural, 3 acre lot size minimum Rural Residential, 1.5 acre lot size minimum Newbury Business/Commercial, 2 acre lot size minimum Residential, 2 acre lot size minimum Blodgett’s Landing Cottages, lot sizes are grandfathered Springfield Rural residential District, 1.5 acre lot size minimum Sutton Rural-Agricultural District, 2 acre lot size minimum Goshen Rural-Agricultural District, 3 acre lot size minimum
Institute for Community and Environment Colby-Sawyer College
20
Lake Sunapee Watershed Project Portfolio – Natural Resource Inventory
Institute for Community and Environment Colby-Sawyer College
21