Embed Size (px)
Citation preview
Refiners in Europe should benefit from
margin recovery, weaker currencies and lower gas price in 2015…
…and maybe more so from economic growth in selective regions
Initiate coverage of Hellenic Petroleum and PKN Orlen (both at Buy); establish Buy ratings for MOL Group (from OW) and Petro Rabigh (from OW(V)), Hold rating for Tupras (from N under our previous rating system)
Refiners in Europe have managed to make money in a
challenging environment and finally appear to be
benefiting from lower oil and gas prices and a stronger
US dollar: Greenfield refineries in the Middle East remain a
source of threat from H2 2015 but, on the positive side, we
expect 5-6% lower refining runs in Russia this year.
Although we still expect the recent strength in benchmark
margins to reverse soon, we believe the factors that have
helped the sector to weather the headwinds over the past few
years will remain in place.
The sector’s earnings are much more stable than one might
assume when looking at the refining margin charts. Over the
past five to six years it has often been the pace of economic
growth in the domestic markets and fuel consumption trends
that have had more impact on refiners’ earnings in the
region. As HSBC expects 2015 GDP growth in Hungary,
Czech Republic, Poland and Turkey of 2.8%, 2.2%, 3.4%
and 3.0% respectively, we expect stronger fuel demand in
these countries to benefit the refiners.
With this report we initiate coverage of PKN Orlen (Buy)
and Hellenic Petroleum (Buy) which together with MOL
Group (Buy) and Tupras (Hold) account for 78% of refining
throughput in the above countries and Greece together. We
like PKN Orlen for its high quality diversified portfolio and
scope for moderate dividend growth, Hellenic Petroleum for
its attractive valuation and we continue to like MOL Group,
whose downstream segment returns are in the spotlight and
the valuation is attractive. In Saudi Arabia we like Petro
Rabigh (Buy), which remains a multi-leg growth story.
Natural Resources & Energy EEMEA – Oil and Gas
EEMEA Refiners
Rating and target price summary
Stock Ticker Curr Price Target price
Rating Upside/downside
Hellenic Petroleum
ELPE GA EUR 3.55 5.6 Initiate at Buy 57.7%
MOL Group MOL HB HUF 12120 17500 Buy (from OW) 44.4%PKN Orlen PKN PW PLN 59.25 66.0 Initiate at Buy 11.4%Tupras TUPRS TI TRY 61.65 59.2 Hold (from N) -4.1%Petro Rabigh PETROR AB SAR 21.36 29.0 Buy (from OW(V)) 35.8%
Prices as of close of 27 March 2015. Source: Bloomberg and HSBC estimates
Look beyond refining margins
7 April 2015 Ildar Khaziev*, CFA Analyst OOO HSBC Bank (RR) +7 495 645 4549 [email protected]
Bulent Yurdagul* Analyst HSBC Yatırım Menkul Değerler A.Ş. +90 212 3764612 [email protected]
Sriharsha Pappu* Analyst HSBC Bank Middle East Ltd +971 4223 9624 [email protected]
Govinder Kumar*
Associate, Bangalore
View HSBC Global Research at: http://www.research.hsbc.com
*Employed by a non-US affiliate of HSBC Securities (USA) Inc, and is not registered/qualified pursuant to FINRA regulations
Issuer of report: OOO HSBC Bank (RR) (Limited Liability Company)
Disclaimer & Disclosures This report must be read with the disclosures and the analyst certifications in the Disclosure appendix, and with the Disclaimer, which forms part of it
Extel Survey 2015 runs from March 23rd through to April 30th. If you value our service and insight please vote for HSBC at
www.extelsurveys.com/quickvote
2
Natural Resources & Energy EEMEA – Oil and Gas 7 April 2015
abc
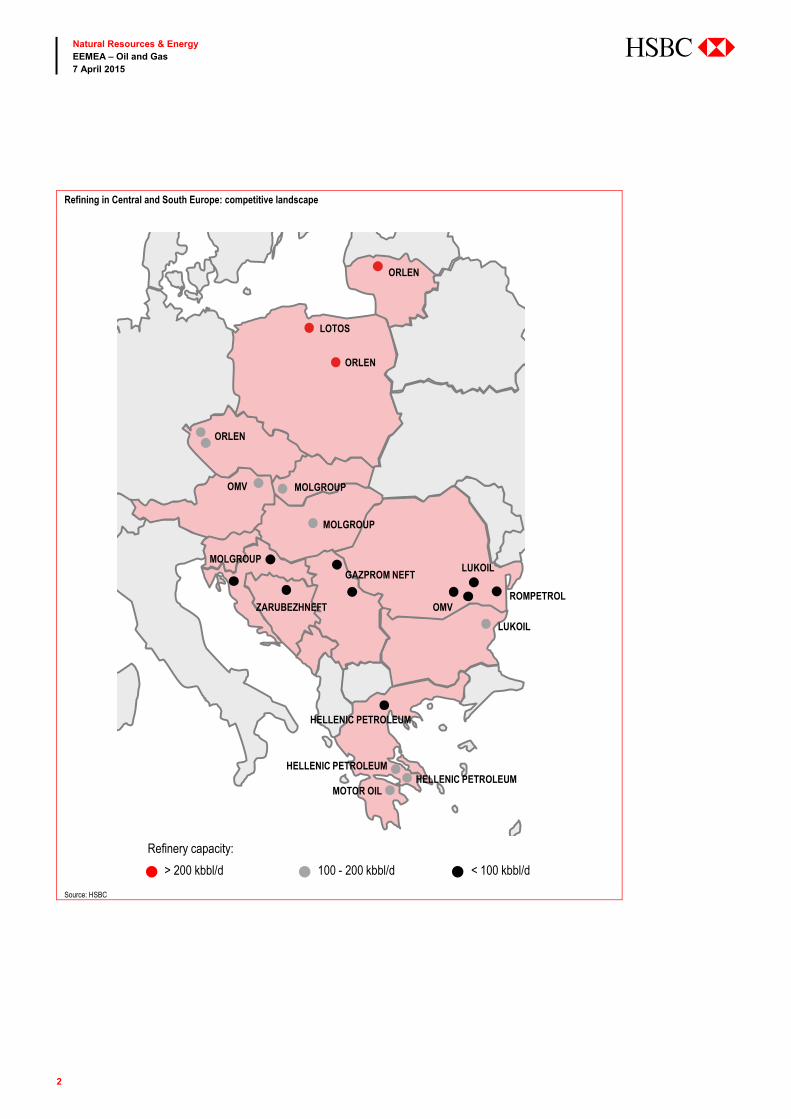
Refining in Central and South Europe: competitive landscape
Source: HSBC
Refinery capacity:
> 200 kbbl/d 100 - 200 kbbl/d < 100 kbbl/d
ORLEN
LOTOS
ORLEN
ORLEN
OMV MOLGROUP
MOLGROUP
MOLGROUP
GAZPROM NEFTLUKOIL
ROMPETROL
LUKOIL
OMVZARUBEZHNEFT
MOTOR OIL
HELLENIC PETROLEUM
HELLENIC PETROLEUMHELLENIC PETROLEUM
3
Natural Resources & Energy EEMEA – Oil and Gas 7 April 2015
abc
Summary 4
European refining sector challenges 8 European refining margins are the weakest globally 8
Weak demand and diesel/output mismatch is a part
of the story 9
Energy and other cost disadvantages are another factor 11
Finally, some tailwinds in 2015 14 Why lower oil price have improved refining margins 14
Conflicting factors to drive margins further in 2015 16
Weaker currencies to support earnings 19
What if the oil price stays low? Watch Russian refining runs 20
How refiners (some) make money in CEEMEA 24 Benchmark margins ignore regional pricing specifics 24
Fuel marketing 26
Petrochemicals 27
Refining margin assumptions 27
Historical performance: 2007-2014 28
Competitive landscape 31
Hellenic Petroleum 32
MOL Group 42
PKN Orlen 51
Tupras 62
Petro Rabigh 67
Disclosure appendix 71
Disclaimer 75
Contents
4
Natural Resources & Energy EEMEA – Oil and Gas 7 April 2015
abc
Competitive pressures coming from Russia and the Middle East, a mismatch between demand and
production capacity across products, weak demand for motor fuels and high energy costs in Europe have
been the key threats to European refiners. European refining margins remain the lowest globally.
However, some refiners have managed to make money in the challenging environment and finally appear
to be benefiting from lower oil and gas prices and a stronger US dollar. Although we expect the recent
strength in benchmark margins to reverse soon, we believe the factors that have helped them to weather
the headwinds over the past few years will remain in place.
On a global scale, we expect refining utilisation rates to remain flat to positive at least until 2017, based
on our demand-supply forecasts. In a regional context, the sector has faced potential threats from
greenfield refineries in the Middle East and growing refining runs in Russia. The former will materialise
from Q2 2015 after the ramp-up of two new refineries in Saudi Arabia and UAE but we note that they
will compete not only in Europe but also in Asia where margins are more attractive. The Russian refining
sector may not be a source of risk in 2015 at all. This is because the recent tax reform and weaker oil
prices have sent the Russian average refining margins to nearly zero since February 2015 and we see
scope for a 5-6% cut in the Russian refining runs this year – this would imply less competition for the
European refiners.
We expect European benchmark refining margins to remain volatile in 2015-2016 but in reality the
refining sector’s earnings are much more stable than one may think when looking at the refining margin
charts. We observe that the benchmark margins oscillate around the refining costs and where the refiners
are really making money is the delivery of fuels to their customers with regional price mark-ups protected
by logistical advantages from importers. Over the past five to six years it has often been the pace of
economic growth in the domestic markets and fuel consumption trends that have had more impact on the
refiners’ earnings in the region. As HSBC expects 2015 GDP growth in Hungary, Czech Republic,
Poland and Turkey of 2.8%, 2.2%, 3.4% and 3.0% respectively, we expect stronger fuel demand in these
countries to benefit the refiners. With this report we initiate coverage of PKN Orlen and Hellenic
Summary
Refiners should benefit from margin recovery, weaker currencies
and lower gas price in 2015…
…and maybe more so from economic growth in selective regions
Initiate coverage of Hellenic Petroleum and PKN Orlen (both at
Buy), establish Buy ratings for MOL Group (from OW) and Petro
Rabigh (from OW(V)) and Hold for Tupras (from Neutral)
5
Natural Resources & Energy EEMEA – Oil and Gas 7 April 2015
abc
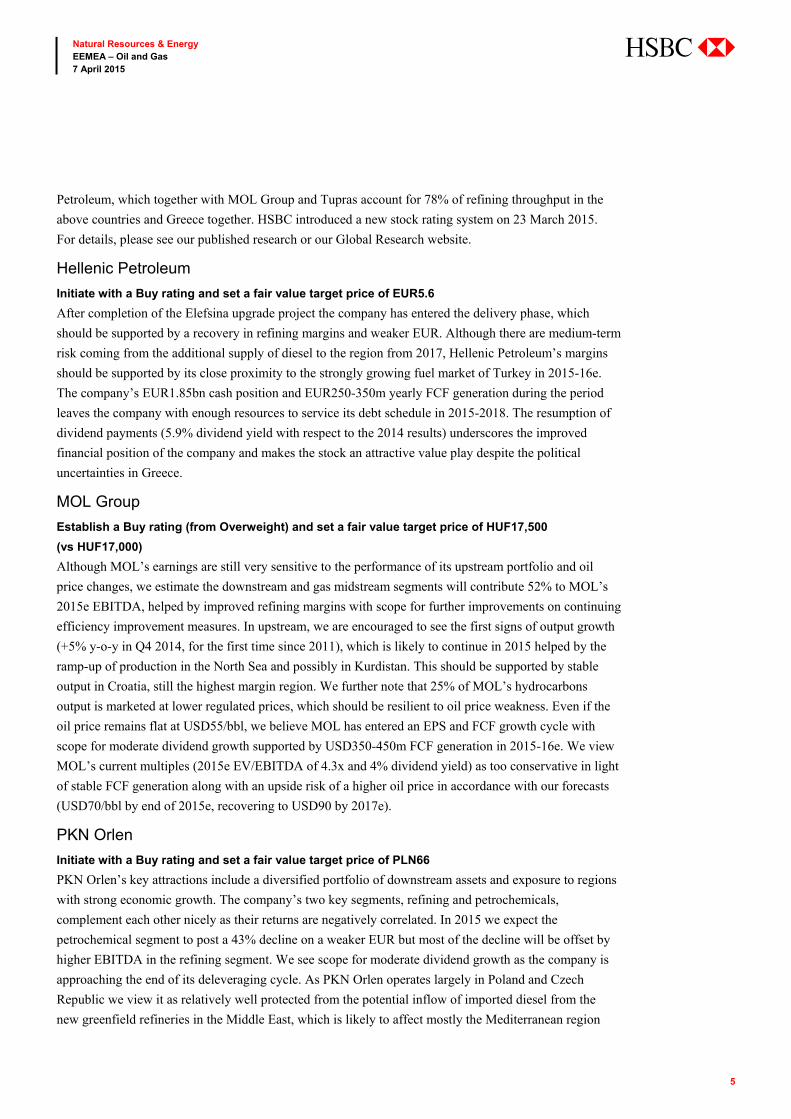
Petroleum, which together with MOL Group and Tupras account for 78% of refining throughput in the
above countries and Greece together. HSBC introduced a new stock rating system on 23 March 2015.
For details, please see our published research or our Global Research website.
Hellenic Petroleum
Initiate with a Buy rating and set a fair value target price of EUR5.6
After completion of the Elefsina upgrade project the company has entered the delivery phase, which
should be supported by a recovery in refining margins and weaker EUR. Although there are medium-term
risk coming from the additional supply of diesel to the region from 2017, Hellenic Petroleum’s margins
should be supported by its close proximity to the strongly growing fuel market of Turkey in 2015-16e.
The company’s EUR1.85bn cash position and EUR250-350m yearly FCF generation during the period
leaves the company with enough resources to service its debt schedule in 2015-2018. The resumption of
dividend payments (5.9% dividend yield with respect to the 2014 results) underscores the improved
financial position of the company and makes the stock an attractive value play despite the political
uncertainties in Greece.
MOL Group
Establish a Buy rating (from Overweight) and set a fair value target price of HUF17,500
(vs HUF17,000)
Although MOL’s earnings are still very sensitive to the performance of its upstream portfolio and oil
price changes, we estimate the downstream and gas midstream segments will contribute 52% to MOL’s
2015e EBITDA, helped by improved refining margins with scope for further improvements on continuing
efficiency improvement measures. In upstream, we are encouraged to see the first signs of output growth
(+5% y-o-y in Q4 2014, for the first time since 2011), which is likely to continue in 2015 helped by the
ramp-up of production in the North Sea and possibly in Kurdistan. This should be supported by stable
output in Croatia, still the highest margin region. We further note that 25% of MOL’s hydrocarbons
output is marketed at lower regulated prices, which should be resilient to oil price weakness. Even if the
oil price remains flat at USD55/bbl, we believe MOL has entered an EPS and FCF growth cycle with
scope for moderate dividend growth supported by USD350-450m FCF generation in 2015-16e. We view
MOL’s current multiples (2015e EV/EBITDA of 4.3x and 4% dividend yield) as too conservative in light
of stable FCF generation along with an upside risk of a higher oil price in accordance with our forecasts
(USD70/bbl by end of 2015e, recovering to USD90 by 2017e).
PKN Orlen
Initiate with a Buy rating and set a fair value target price of PLN66
PKN Orlen’s key attractions include a diversified portfolio of downstream assets and exposure to regions
with strong economic growth. The company’s two key segments, refining and petrochemicals,
complement each other nicely as their returns are negatively correlated. In 2015 we expect the
petrochemical segment to post a 43% decline on a weaker EUR but most of the decline will be offset by
higher EBITDA in the refining segment. We see scope for moderate dividend growth as the company is
approaching the end of its deleveraging cycle. As PKN Orlen operates largely in Poland and Czech
Republic we view it as relatively well protected from the potential inflow of imported diesel from the
new greenfield refineries in the Middle East, which is likely to affect mostly the Mediterranean region

6
Natural Resources & Energy EEMEA – Oil and Gas 7 April 2015
abc
from H2 2015. Although the stock doesn’t look cheap currently, it still trades at a 9% discount to its
mid-cycle average EV/EBITDA multiple.
Tupras
Establish a Hold rating (from Neutral) and set a fair value target price of TRY59.2 (from TRY61)
Tupras has completed the construction of the residuum upgrade project (RUP), the biggest investment
project in the company’s history. The USD3bn project is expected to start operating towards the end of
March or the beginning of April, according to management guidance. We expect RUP to contribute
USD500m annually towards Tupras’ EBITDA (vs company guidance of USD550m), even on a low crude
price and consequently narrower diesel-HSFO spread. Our estimates indicate Tupras’ EBITDA will rise
by 195% y-o-y in 2015e to TRY2,330m. Next year will be the first full year of RUP’s operation and we
forecast 2016e EBITDA to rise further by 10% y-o-y to TRY2,559m. Our estimates are largely in line
with the IBES consensus EBITDA forecasts of TRY2,369m and TRY2,587m for 2015-16e. The
consensus is therefore also assuming a similar amount of RUP-related benefits. We think that the rally in
Tupras’ share price since H2 2014 is also in part driven by the completion and subsequent start-up of
RUP and its benefits are reflected in the company’s share price as well as in consensus estimates. Tupras’
stock, therefore, has only limited further upside, in our view, and hence we establish a Hold rating on the
stock.
Petro Rabigh
Establish Buy rating (from Overweight (V)) and set a fair value target price of SAR29 (vs SAR31)
Petro Rabigh remains a multi-leg equity story set to play out in several phases over the 2015-16
timeframe. In the last 18 months, the company has addressed issues related to its loss-making refinery,
taken a big step towards improving operations at its chemical unit and provided greater clarity around
growth opportunities related to Rabigh 2. None of these factors – improvement in chemical operations or
growth from Rabigh 2 – is correlated to the oil price. We expect to see continued positive news flow
around Rabigh 2 and better operating performance from Rabigh 1 over the next 12-18 months, driving the
next leg of equity upside from current levels. We establish a Buy rating (Overweight (V) earlier) and set a
target price of SAR29 (SAR31 earlier).
7
Natural Resources & Energy EEMEA – Oil and Gas 7 April 2015
abc
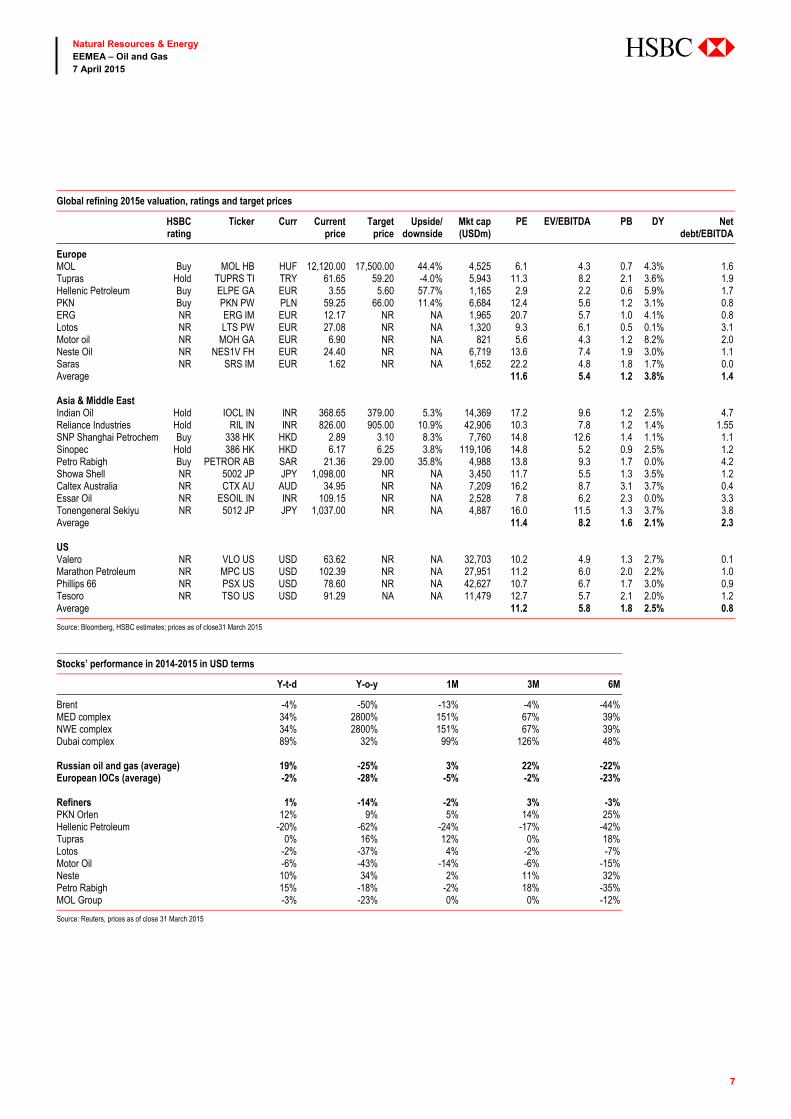
Global refining 2015e valuation, ratings and target prices
HSBC rating
Ticker Curr Current price
Target price
Upside/downside
Mkt cap (USDm)
PE EV/EBITDA PB DY Net debt/EBITDA
Europe MOL Buy MOL HB HUF 12,120.00 17,500.00 44.4% 4,525 6.1 4.3 0.7 4.3% 1.6Tupras Hold TUPRS TI TRY 61.65 59.20 -4.0% 5,943 11.3 8.2 2.1 3.6% 1.9Hellenic Petroleum Buy ELPE GA EUR 3.55 5.60 57.7% 1,165 2.9 2.2 0.6 5.9% 1.7PKN Buy PKN PW PLN 59.25 66.00 11.4% 6,684 12.4 5.6 1.2 3.1% 0.8ERG NR ERG IM EUR 12.17 NR NA 1,965 20.7 5.7 1.0 4.1% 0.8Lotos NR LTS PW EUR 27.08 NR NA 1,320 9.3 6.1 0.5 0.1% 3.1Motor oil NR MOH GA EUR 6.90 NR NA 821 5.6 4.3 1.2 8.2% 2.0Neste Oil NR NES1V FH EUR 24.40 NR NA 6,719 13.6 7.4 1.9 3.0% 1.1Saras NR SRS IM EUR 1.62 NR NA 1,652 22.2 4.8 1.8 1.7% 0.0Average 11.6 5.4 1.2 3.8% 1.4 Asia & Middle East Indian Oil Hold IOCL IN INR 368.65 379.00 5.3% 14,369 17.2 9.6 1.2 2.5% 4.7Reliance Industries Hold RIL IN INR 826.00 905.00 10.9% 42,906 10.3 7.8 1.2 1.4% 1.55SNP Shanghai Petrochem Buy 338 HK HKD 2.89 3.10 8.3% 7,760 14.8 12.6 1.4 1.1% 1.1Sinopec Hold 386 HK HKD 6.17 6.25 3.8% 119,106 14.8 5.2 0.9 2.5% 1.2Petro Rabigh Buy PETROR AB SAR 21.36 29.00 35.8% 4,988 13.8 9.3 1.7 0.0% 4.2Showa Shell NR 5002 JP JPY 1,098.00 NR NA 3,450 11.7 5.5 1.3 3.5% 1.2Caltex Australia NR CTX AU AUD 34.95 NR NA 7,209 16.2 8.7 3.1 3.7% 0.4Essar Oil NR ESOIL IN INR 109.15 NR NA 2,528 7.8 6.2 2.3 0.0% 3.3Tonengeneral Sekiyu NR 5012 JP JPY 1,037.00 NR NA 4,887 16.0 11.5 1.3 3.7% 3.8Average 11.4 8.2 1.6 2.1% 2.3 US Valero NR VLO US USD 63.62 NR NA 32,703 10.2 4.9 1.3 2.7% 0.1Marathon Petroleum NR MPC US USD 102.39 NR NA 27,951 11.2 6.0 2.0 2.2% 1.0Phillips 66 NR PSX US USD 78.60 NR NA 42,627 10.7 6.7 1.7 3.0% 0.9Tesoro NR TSO US USD 91.29 NA NA 11,479 12.7 5.7 2.1 2.0% 1.2Average 11.2 5.8 1.8 2.5% 0.8
Source: Bloomberg, HSBC estimates; prices as of close31 March 2015
Stocks’ performance in 2014-2015 in USD terms
Y-t-d Y-o-y 1M 3M 6M
Brent -4% -50% -13% -4% -44% MED complex 34% 2800% 151% 67% 39% NWE complex 34% 2800% 151% 67% 39% Dubai complex 89% 32% 99% 126% 48% Russian oil and gas (average) 19% -25% 3% 22% -22% European IOCs (average) -2% -28% -5% -2% -23% Refiners 1% -14% -2% 3% -3% PKN Orlen 12% 9% 5% 14% 25% Hellenic Petroleum -20% -62% -24% -17% -42% Tupras 0% 16% 12% 0% 18% Lotos -2% -37% 4% -2% -7% Motor Oil -6% -43% -14% -6% -15% Neste 10% 34% 2% 11% 32% Petro Rabigh 15% -18% -2% 18% -35% MOL Group -3% -23% 0% 0% -12%
Source: Reuters, prices as of close 31 March 2015
8
Natural Resources & Energy EEMEA – Oil and Gas 7 April 2015
abc
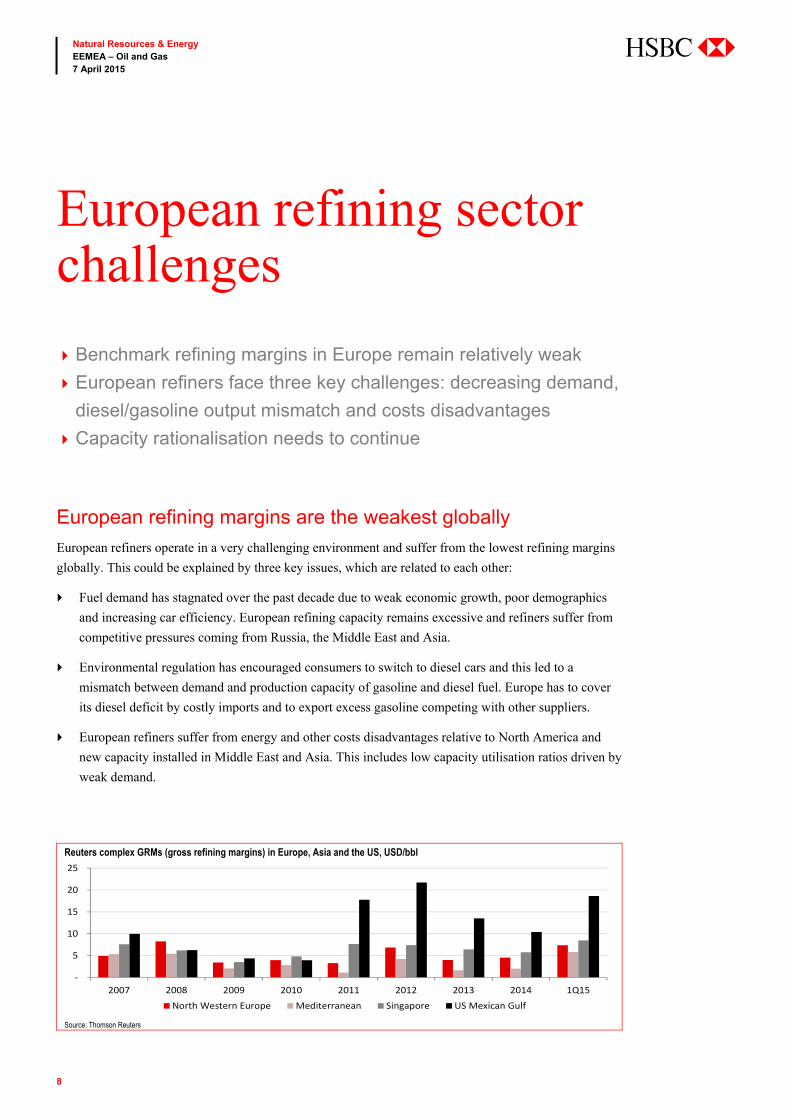
European refining margins are the weakest globally
European refiners operate in a very challenging environment and suffer from the lowest refining margins
globally. This could be explained by three key issues, which are related to each other:
Fuel demand has stagnated over the past decade due to weak economic growth, poor demographics
and increasing car efficiency. European refining capacity remains excessive and refiners suffer from
competitive pressures coming from Russia, the Middle East and Asia.
Environmental regulation has encouraged consumers to switch to diesel cars and this led to a
mismatch between demand and production capacity of gasoline and diesel fuel. Europe has to cover
its diesel deficit by costly imports and to export excess gasoline competing with other suppliers.
European refiners suffer from energy and other costs disadvantages relative to North America and
new capacity installed in Middle East and Asia. This includes low capacity utilisation ratios driven by
weak demand.
European refining sector challenges
Benchmark refining margins in Europe remain relatively weak
European refiners face three key challenges: decreasing demand,
diesel/gasoline output mismatch and costs disadvantages
Capacity rationalisation needs to continue
Reuters complex GRMs (gross refining margins) in Europe, Asia and the US, USD/bbl
Source: Thomson Reuters
-
5
10
15
20
25
2007 2008 2009 2010 2011 2012 2013 2014 1Q15North Western Europe Mediterranean Singapore US Mexican Gulf
9
Natural Resources & Energy EEMEA – Oil and Gas 7 April 2015
abc
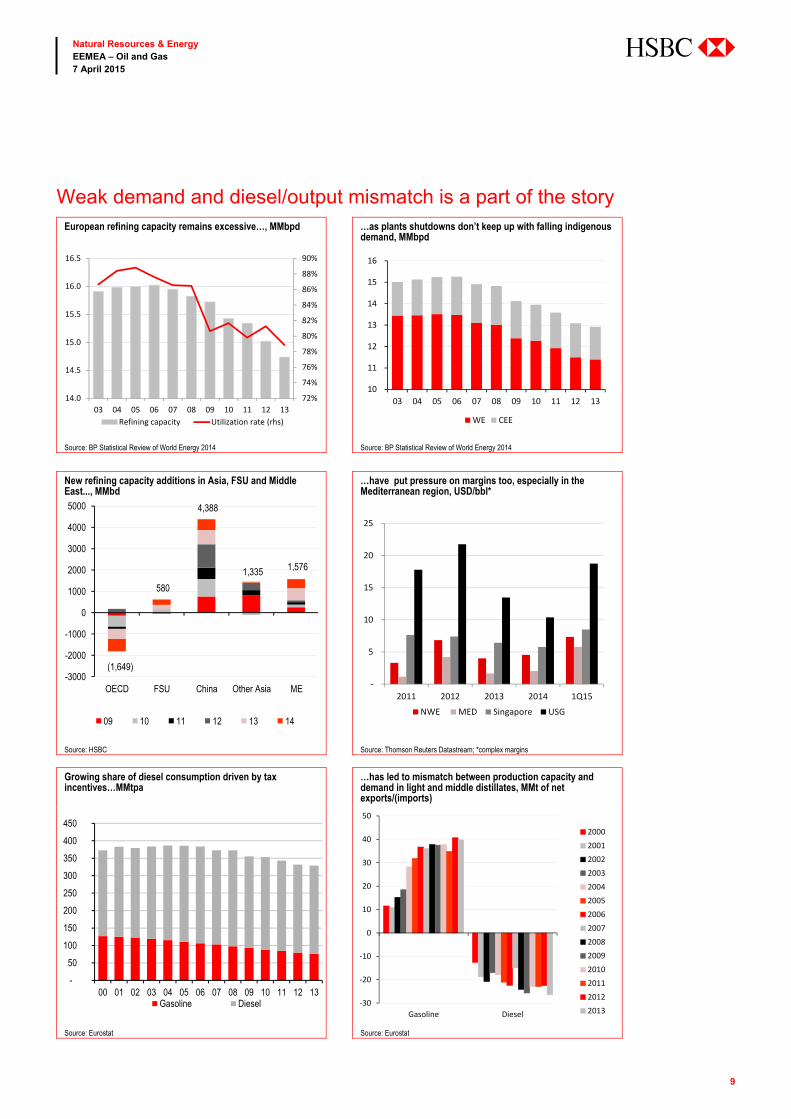
Weak demand and diesel/output mismatch is a part of the story European refining capacity remains excessive…, MMbpd …as plants shutdowns don’t keep up with falling indigenous
demand, MMbpd
Source: BP Statistical Review of World Energy 2014 Source: BP Statistical Review of World Energy 2014
New refining capacity additions in Asia, FSU and Middle East..., MMbd
…have put pressure on margins too, especially in the Mediterranean region, USD/bbl*
Source: HSBC Source: Thomson Reuters Datastream; *complex margins
Growing share of diesel consumption driven by tax incentives…MMtpa
…has led to mismatch between production capacity and demand in light and middle distillates, MMt of net exports/(imports)
Source: Eurostat Source: Eurostat
72%
74%
76%
78%
80%
82%
84%
86%
88%
90%
14.0
14.5
15.0
15.5
16.0
16.5
03 04 05 06 07 08 09 10 11 12 13Refining capacity Utilization rate (rhs)
10
11
12
13
14
15
16
03 04 05 06 07 08 09 10 11 12 13
WE CEE
(1,649)
580
4,388
1,335 1,576
-3000
-2000
-1000
0
1000
2000
3000
4000
5000
OECD FSU China Other Asia ME
09 10 11 12 13 14
-
5
10
15
20
25
2011 2012 2013 2014 1Q15
NWE MED Singapore USG
-
50
100
150
200
250
300
350
400
450
00 01 02 03 04 05 06 07 08 09 10 11 12 13Gasoline Diesel -30
-20
-10
0
10
20
30
40
50
Gasoline Diesel
20002001200220032004200520062007200820092010201120122013
10
Natural Resources & Energy EEMEA – Oil and Gas 7 April 2015
abc
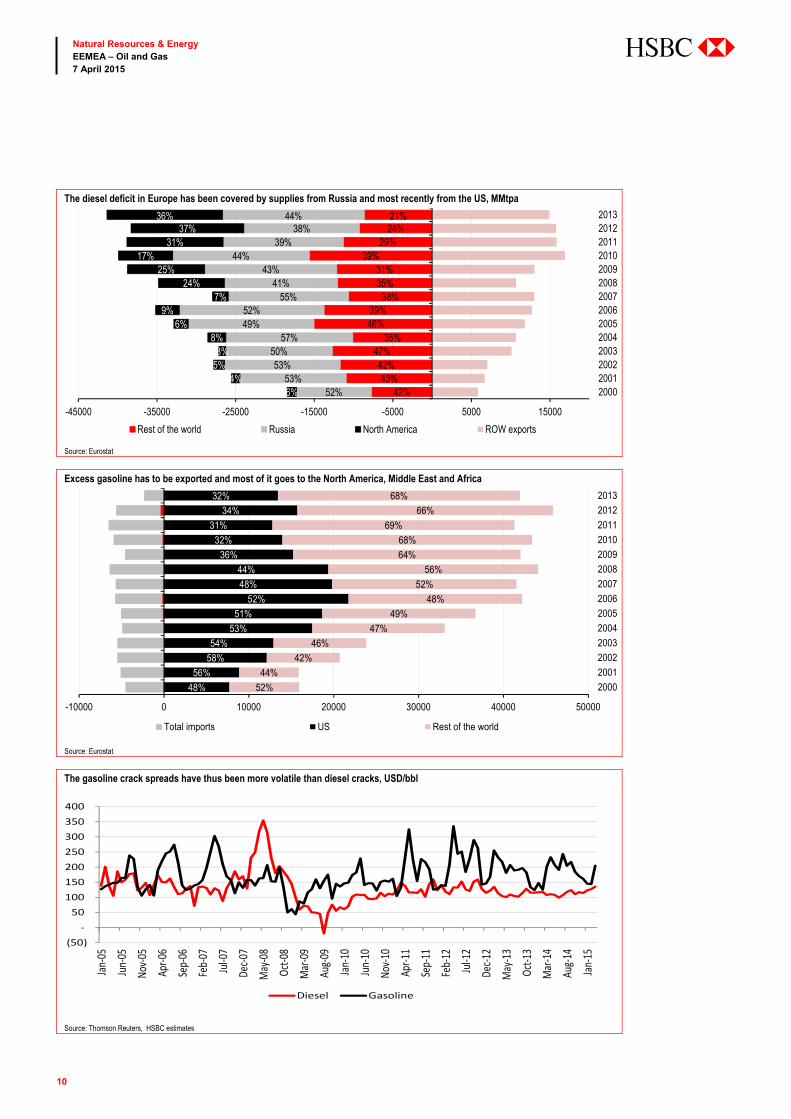
The diesel deficit in Europe has been covered by supplies from Russia and most recently from the US, MMtpa
Source: Eurostat
Excess gasoline has to be exported and most of it goes to the North America, Middle East and Africa
Source: Eurostat
The gasoline crack spreads have thus been more volatile than diesel cracks, USD/bbl
Source: Thomson Reuters, HSBC estimates
42%43%
42%47%
35%46%39%
38%35%31%
39%29%
24%21%
52%53%
53%50%
57%49%52%
55%41%
43%44%
39%38%
44%
6%4%
5%3%
8%6%
9%7%
24%25%
17%31%
37%36%
-45000 -35000 -25000 -15000 -5000 5000 15000
20002001200220032004200520062007200820092010201120122013
Rest of the world Russia North America ROW exports
48%
56%
58%
54%
53%
51%
52%
48%
44%
36%
32%
31%
34%
32%
52%
44%
42%
46%
47%
49%
48%
52%
56%
64%
68%
69%
66%
68%
-10000 0 10000 20000 30000 40000 50000
2000
2001
2002
2003
2004
2005
2006
2007
2008
2009
2010
2011
2012
2013
Total imports US Rest of the world
(50) -
50100150200250300350400
Jan-0
5Ju
n-05
Nov-0
5Ap
r-06
Sep-
06Fe
b-07
Jul-0
7De
c-07
May
-08Oc
t-08
Mar
-09Au
g-09
Jan-1
0Ju
n-10
Nov-1
0Ap
r-11
Sep-
11Fe
b-12
Jul-1
2De
c-12
May
-13Oc
t-13
Mar
-14Au
g-14
Jan-1
5
Diesel Gasoline
11
Natural Resources & Energy EEMEA – Oil and Gas 7 April 2015
abc
Energy and other cost disadvantages are another factor
We have already mentioned that falling fuel demand trend and low capacity utilisation ratios relative to
global competition hurt European refiners as more than half of their processing costs are fixed costs.
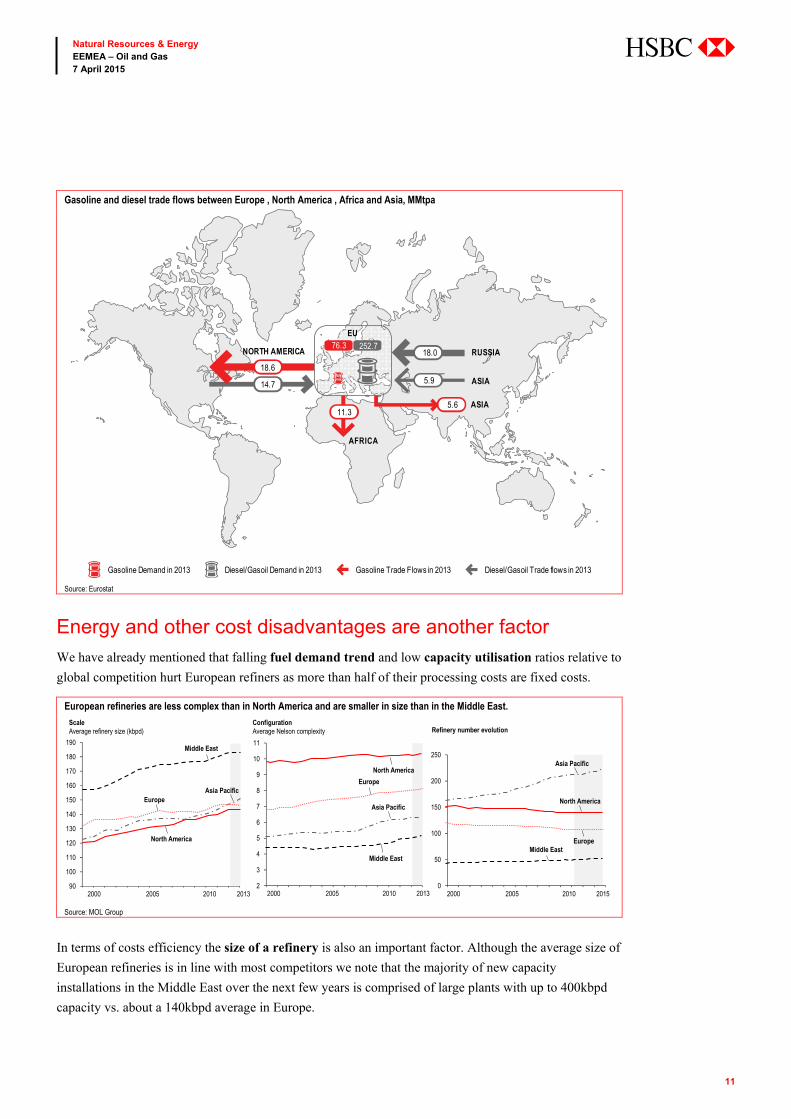
European refineries are less complex than in North America and are smaller in size than in the Middle East.
Source: MOL Group
In terms of costs efficiency the size of a refinery is also an important factor. Although the average size of
European refineries is in line with most competitors we note that the majority of new capacity
installations in the Middle East over the next few years is comprised of large plants with up to 400kbpd
capacity vs. about a 140kbpd average in Europe.
90
100
110
120
130
140
150
160
170
180
190
1999 2000 2001 2002 2003 2004 2005 2006 2007 2008 2009 2010 2011 2012 20132000 2005 2010 2013
Middle East
EuropeAsia Pacific
North America
2
3
4
5
6
7
8
9
10
11
1999 2000 2001 2002 2003 2004 2005 2006 2007 2008 2009 2010 2011 2012 2013
North America
Europe
Asia Pacific
Middle East
2000 2005 2010 20130
50
100
150
200
250
1999 2000 2001 2002 2003 2004 2005 2006 2007 2008 2009 2010 2011 2012 20132000 2005 2010 2015
Asia Pacific
North America
EuropeMiddle East
ScaleAverage refinery size (kbpd)
Configuration Average Nelson complexity Refinery number evolution
Gasoline and diesel trade flows between Europe , North America , Africa and Asia, MMtpa
Source: Eurostat
EU
RUSSIA
ASIA
ASIA
AFRICA
NORTH AMERICA76.3 252.7
18.6
14.7
18.0
5.9
5.611.3
Gasoline Trade Flows in 2013 Diesel/Gasoil Trade flows in 2013Gasoline Demand in 2013 Diesel/Gasoil Demand in 2013

12
Natural Resources & Energy EEMEA – Oil and Gas 7 April 2015
abc
Generally, there are two principal ways to improve the competitiveness of a refinery: investing in higher
complexity and higher energy efficiency. The former enhances the yield of higher value-added products
and could improve capacity utilisation while the latter cuts operating costs.
In simple terms a higher complexity generally indicates higher light and middle distillates yields
(naphtha, gasoline, jet and diesel fuels) and lower heavy distillates yield (fuel and heating oils, bitumen).
More complex refineries generally have higher variable operating costs but generate higher refining
margins. Such refineries can also enjoy the benefit of being able to refine heavier and sourer crude oils,
fuel and heating oils, thus extracting a premium as such feedstock normally trades at a discount.
EU demand is best matched by complex diesel-geared refineries
Source: Fuels Europe, Eurostat
Energy efficiency is another important driver which affects the profitability of refineries as cost of
energy accounts for about half of a refinery’s operating costs. When processing crude oil and other
feedstock a refinery burns a part of its output to heat feedstock flows at its processing units, generate
steam and sometimes electric power. Depending on its configuration, a refinery burns 3% to 10% of its
gross product output, normally heating and fuel oil. More efficient heaters and combustion units thus
consume less fuel and improve the profitability of refineries. For Central and Eastern European refineries,
however, a more important factor in terms of energy efficiency is often the physical size of the refinery,
or rather the distances between the plant units. Most of these refineries were designed and built using the
former USSR construction standards, which dictated larger distances between units as a means of
improving the security of operations in case of fires or explosions. It is not uncommon for a refinery or
any other plant which was built in the USSR under such standards to cover an area of 100 square
kilometres. Although improving the security of operations, such standards led to lower energy efficiency
as longer distance refinery flows generate large amounts of heat losses (distillation and cracking units
operate at temperatures of up to 400 C). There are things which can be done and things which can’t be
done about this but most refiners continue to focus on energy efficiency of their operations. For instance,
MOL’s 2012-2014 downstream efficiency programme delivered cUSD400m savings, 30% of which came
from energy efficiency improvement.
0%
2%
4%
6%
8%
10%
0%
20%
40%
60%
80%
100%
2013 Demand Simple refinery High gasoline High diesel
HFO/Other products Diesel Kero/Jet GasolineNaphtha LPG Losses
13
Natural Resources & Energy EEMEA – Oil and Gas 7 April 2015
abc
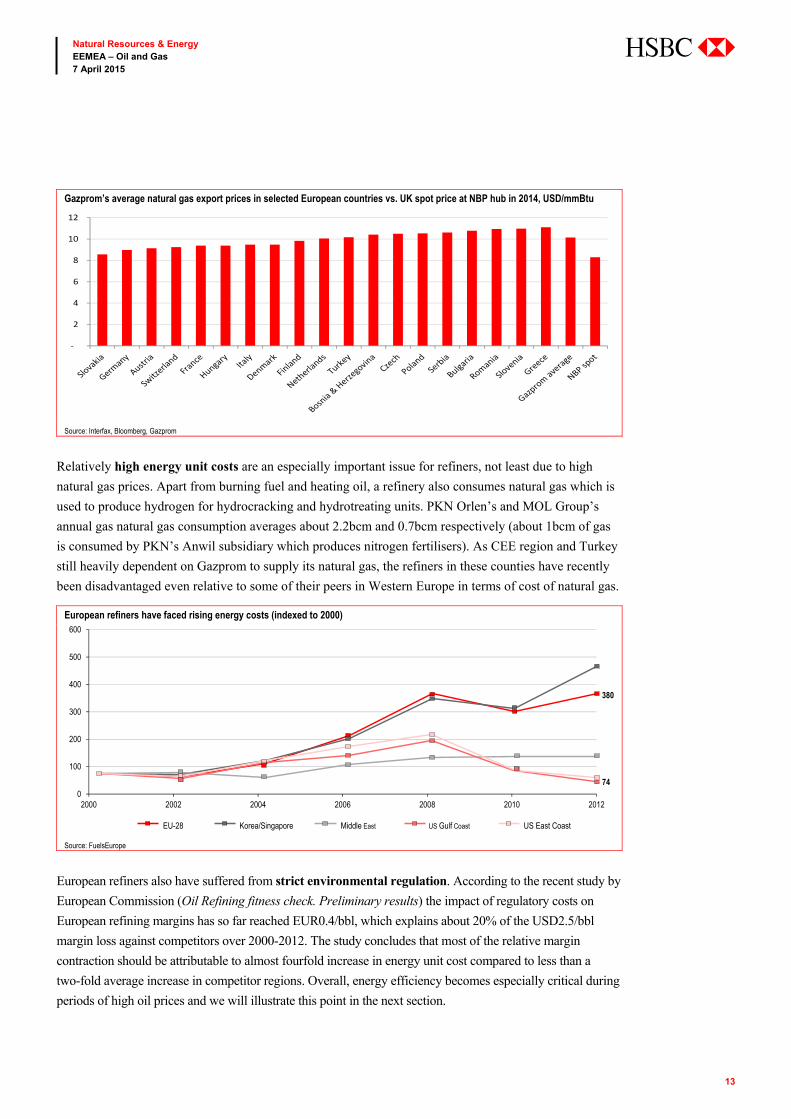
Gazprom’s average natural gas export prices in selected European countries vs. UK spot price at NBP hub in 2014, USD/mmBtu
Source: Interfax, Bloomberg, Gazprom
Relatively high energy unit costs are an especially important issue for refiners, not least due to high
natural gas prices. Apart from burning fuel and heating oil, a refinery also consumes natural gas which is
used to produce hydrogen for hydrocracking and hydrotreating units. PKN Orlen’s and MOL Group’s
annual gas natural gas consumption averages about 2.2bcm and 0.7bcm respectively (about 1bcm of gas
is consumed by PKN’s Anwil subsidiary which produces nitrogen fertilisers). As CEE region and Turkey
still heavily dependent on Gazprom to supply its natural gas, the refiners in these counties have recently
been disadvantaged even relative to some of their peers in Western Europe in terms of cost of natural gas.
European refiners have faced rising energy costs (indexed to 2000)
Source: FuelsEurope
European refiners also have suffered from strict environmental regulation. According to the recent study by
European Commission (Oil Refining fitness check. Preliminary results) the impact of regulatory costs on
European refining margins has so far reached EUR0.4/bbl, which explains about 20% of the USD2.5/bbl
margin loss against competitors over 2000-2012. The study concludes that most of the relative margin
contraction should be attributable to almost fourfold increase in energy unit cost compared to less than a
two-fold average increase in competitor regions. Overall, energy efficiency becomes especially critical during
periods of high oil prices and we will illustrate this point in the next section.
-
2
4
6
8
10
12
0
100
200
300
400
500
600
2000 2002 2004 2006 2008 2010 2012
EU-28 Korea/Singapore Middle East US Gulf Coast US East Coast
380
74
14
Natural Resources & Energy EEMEA – Oil and Gas 7 April 2015
abc
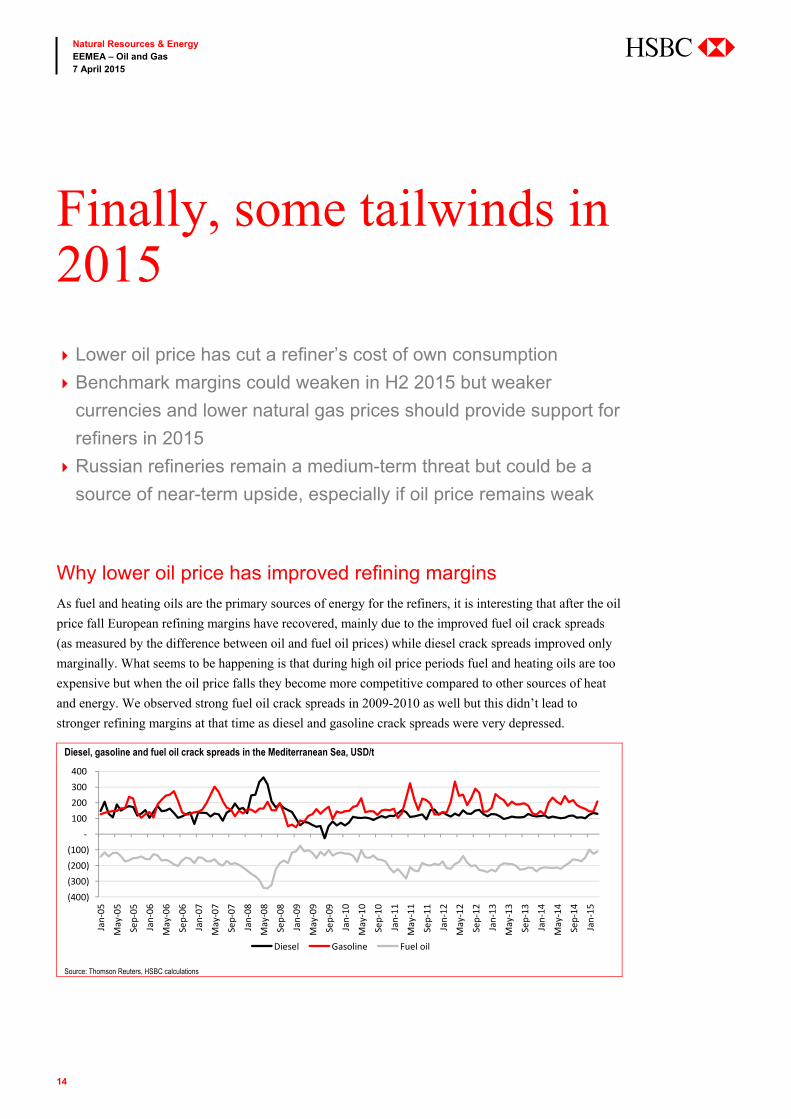
Why lower oil price has improved refining margins
As fuel and heating oils are the primary sources of energy for the refiners, it is interesting that after the oil
price fall European refining margins have recovered, mainly due to the improved fuel oil crack spreads
(as measured by the difference between oil and fuel oil prices) while diesel crack spreads improved only
marginally. What seems to be happening is that during high oil price periods fuel and heating oils are too
expensive but when the oil price falls they become more competitive compared to other sources of heat
and energy. We observed strong fuel oil crack spreads in 2009-2010 as well but this didn’t lead to
stronger refining margins at that time as diesel and gasoline crack spreads were very depressed.
Diesel, gasoline and fuel oil crack spreads in the Mediterranean Sea, USD/t
Source: Thomson Reuters, HSBC calculations
(400) (300) (200) (100)
- 100 200 300 400
Jan-
05
May
-05
Sep-
05
Jan-
06
May
-06
Sep-
06
Jan-
07
May
-07
Sep-
07
Jan-
08
May
-08
Sep-
08
Jan-
09
May
-09
Sep-
09
Jan-
10
May
-10
Sep-
10
Jan-
11
May
-11
Sep-
11
Jan-
12
May
-12
Sep-
12
Jan-
13
May
-13
Sep-
13
Jan-
14
May
-14
Sep-
14
Jan-
15
Diesel Gasoline Fuel oil
Finally, some tailwinds in 2015
Lower oil price has cut a refiner’s cost of own consumption
Benchmark margins could weaken in H2 2015 but weaker
currencies and lower natural gas prices should provide support for
refiners in 2015
Russian refineries remain a medium-term threat but could be a
source of near-term upside, especially if oil price remains weak
15
Natural Resources & Energy EEMEA – Oil and Gas 7 April 2015
abc
Refining margins in the Mediterranean region, USD/bbl
Source: Thomson Reuters
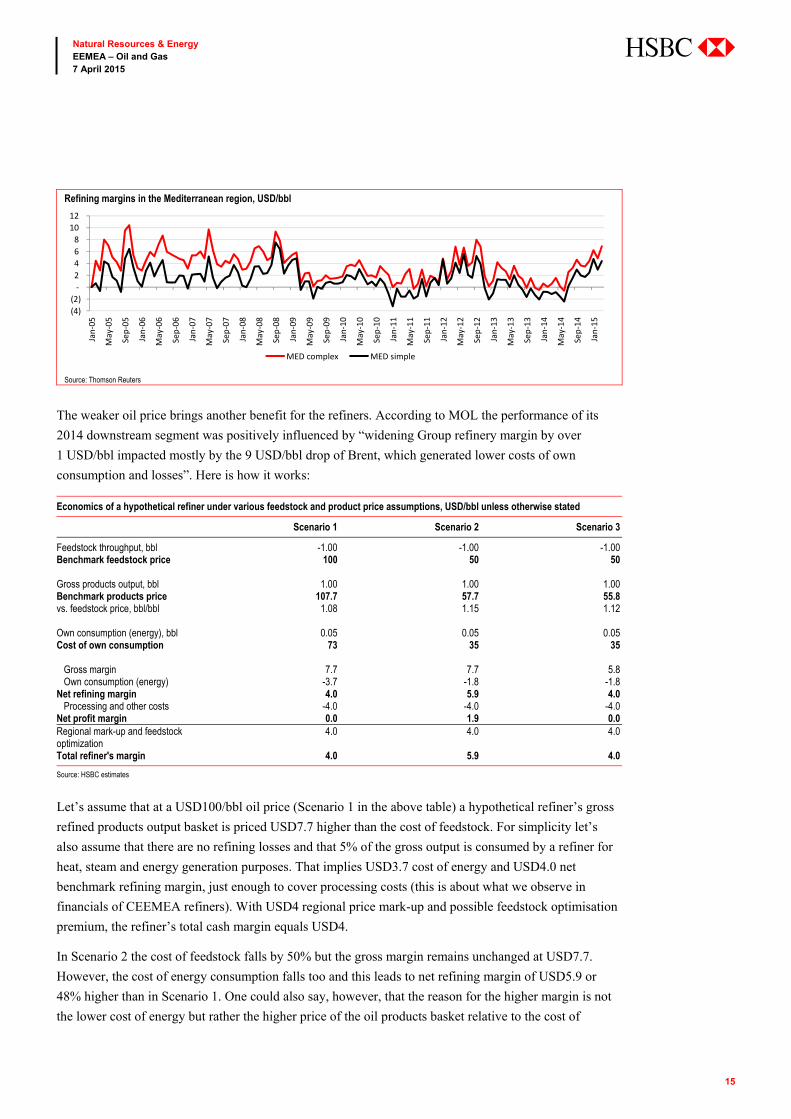
The weaker oil price brings another benefit for the refiners. According to MOL the performance of its
2014 downstream segment was positively influenced by “widening Group refinery margin by over
1 USD/bbl impacted mostly by the 9 USD/bbl drop of Brent, which generated lower costs of own
consumption and losses”. Here is how it works: Economics of a hypothetical refiner under various feedstock and product price assumptions, USD/bbl unless otherwise stated
Scenario 1 Scenario 2 Scenario 3
Feedstock throughput, bbl -1.00 -1.00 -1.00 Benchmark feedstock price 100 50 50 Gross products output, bbl 1.00 1.00 1.00 Benchmark products price 107.7 57.7 55.8 vs. feedstock price, bbl/bbl 1.08 1.15 1.12 Own consumption (energy), bbl 0.05 0.05 0.05 Cost of own consumption 73 35 35 Gross margin 7.7 7.7 5.8 Own consumption (energy) -3.7 -1.8 -1.8 Net refining margin 4.0 5.9 4.0 Processing and other costs -4.0 -4.0 -4.0 Net profit margin 0.0 1.9 0.0 Regional mark-up and feedstock optimization
4.0 4.0 4.0
Total refiner's margin 4.0 5.9 4.0
Source: HSBC estimates
Let’s assume that at a USD100/bbl oil price (Scenario 1 in the above table) a hypothetical refiner’s gross
refined products output basket is priced USD7.7 higher than the cost of feedstock. For simplicity let’s
also assume that there are no refining losses and that 5% of the gross output is consumed by a refiner for
heat, steam and energy generation purposes. That implies USD3.7 cost of energy and USD4.0 net
benchmark refining margin, just enough to cover processing costs (this is about what we observe in
financials of CEEMEA refiners). With USD4 regional price mark-up and possible feedstock optimisation
premium, the refiner’s total cash margin equals USD4.
In Scenario 2 the cost of feedstock falls by 50% but the gross margin remains unchanged at USD7.7.
However, the cost of energy consumption falls too and this leads to net refining margin of USD5.9 or
48% higher than in Scenario 1. One could also say, however, that the reason for the higher margin is not
the lower cost of energy but rather the higher price of the oil products basket relative to the cost of
(4) (2)
- 2 4 6 8
10 12
Jan-
05
May
-05
Sep-
05
Jan-
06
May
-06
Sep-
06
Jan-
07
May
-07
Sep-
07
Jan-
08
May
-08
Sep-
08
Jan-
09
May
-09
Sep-
09
Jan-
10
May
-10
Sep-
10
Jan-
11
May
-11
Sep-
11
Jan-
12
May
-12
Sep-
12
Jan-
13
May
-13
Sep-
13
Jan-
14
May
-14
Sep-
14
Jan-
15
MED complex MED simple
16
Natural Resources & Energy EEMEA – Oil and Gas 7 April 2015
abc
feedstock (at 1.15 on a bbl per bbl basis compared to 1.08 in Scenario 1). If the product basket was priced
12% higher than the cost of feedstock (Scenario 3), that would generate a net refining margin equivalent
to that in Scenario 1. However, the level of the basket premium over the crude oil price is a derivative of
individual crack spreads, which are driven by individual product supply/demand balances and the
respective refining costs, that is refiners are price-takers when it comes to benchmark prices.
Conflicting factors to drive margins further in 2015
We expect the Brent oil price to recover gradually to USD70/bbl by the end of 2015 and average
USD75/bbl in 2016. We continue to believe the current price environment will have the effect intended
by OPEC in curbing non-OPEC output and preserving its market share in the longer term. Between 2014
and 2020, we expect global oil demand to rise by 6mbd, with the effect of weakening economic activity
offset to some degree by positive effects on developed world demand from price elasticity. If our
forecasts prove to be correct, the benefit of the lower oil price on the cost of own consumption for refiners
may thus start fading soon. At the same time, HSBC believes that near-term downside risks to oil prices
remain very real due to a rise in US stockpiles and a possible increase in Iranian exports (for more details
see HSBC report Crude oil market insights – March 2015 published on 23 March 2015).
HSBC crude oil and natural gas forecast
2013 2014 Q1 2015e Q2 2015e Q3 2015e Q4 2015e 2015e 2016e 2017e 2018e
Brent USD/bbl 108.8 98.9 55.0 60.0 65.0 70.0 62.5 75.0 90.0 95.0 WTI USD/bbl 97.9 93.1 48.0 53.0 58.0 63.0 55.5 70.0 85.0 90.0 UK spot gas GBp/th 68.2 50.2 8.0 42.0 42.0 45.0 44.3 48.3 56.3 61.8
Source: Bloomberg, HSBC estimates
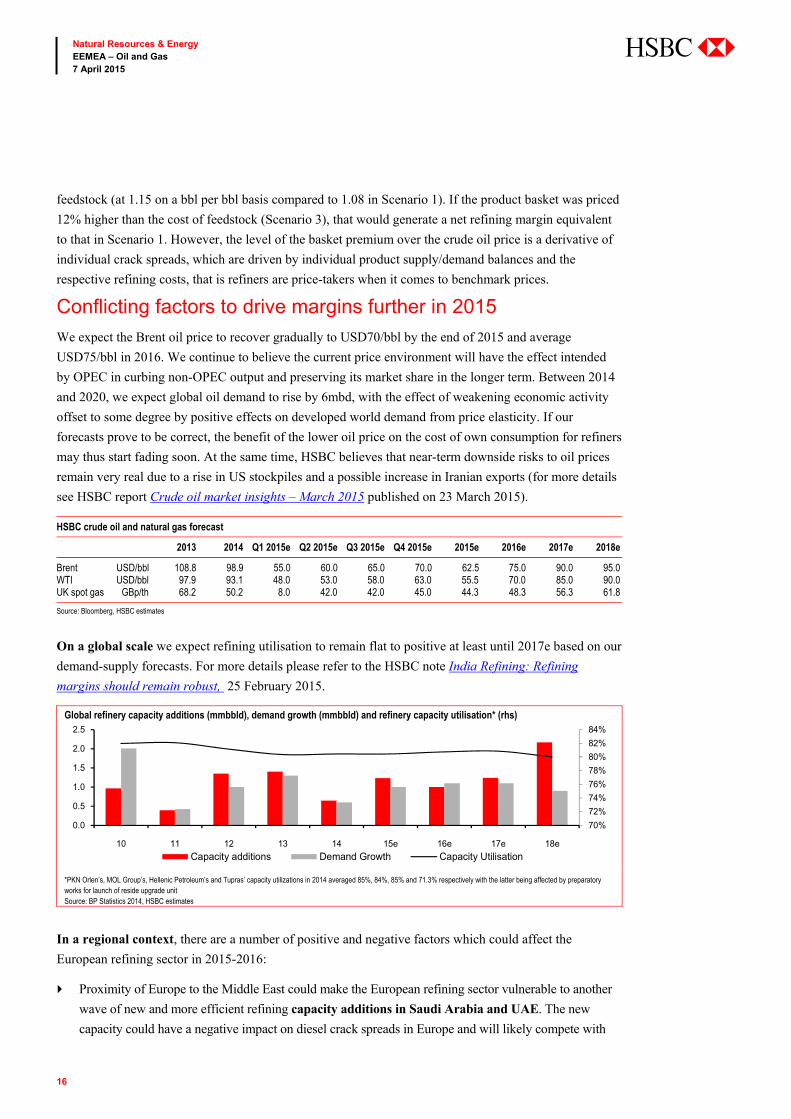
On a global scale we expect refining utilisation to remain flat to positive at least until 2017e based on our
demand-supply forecasts. For more details please refer to the HSBC note India Refining: Refining
margins should remain robust, 25 February 2015.
Global refinery capacity additions (mmbbld), demand growth (mmbbld) and refinery capacity utilisation* (rhs)
*PKN Orlen’s, MOL Group’s, Hellenic Petroleum’s and Tupras’ capacity utilizations in 2014 averaged 85%, 84%, 85% and 71.3% respectively with the latter being affected by preparatory works for launch of reside upgrade unit Source: BP Statistics 2014, HSBC estimates
In a regional context, there are a number of positive and negative factors which could affect the
European refining sector in 2015-2016:
Proximity of Europe to the Middle East could make the European refining sector vulnerable to another
wave of new and more efficient refining capacity additions in Saudi Arabia and UAE. The new
capacity could have a negative impact on diesel crack spreads in Europe and will likely compete with
70%
72%
74%
76%
78%
80%
82%
84%
0.0
0.5
1.0
1.5
2.0
2.5
10 11 12 13 14 15e 16e 17e 18e
Capacity additions Demand Growth Capacity Utilisation
17
Natural Resources & Energy EEMEA – Oil and Gas 7 April 2015
abc
European exports of gasoline to Africa. The possible impact is hard to quantify, however, as the new
capacity will compete on a global scale not only in Europe but most likely in the higher-margin Asian
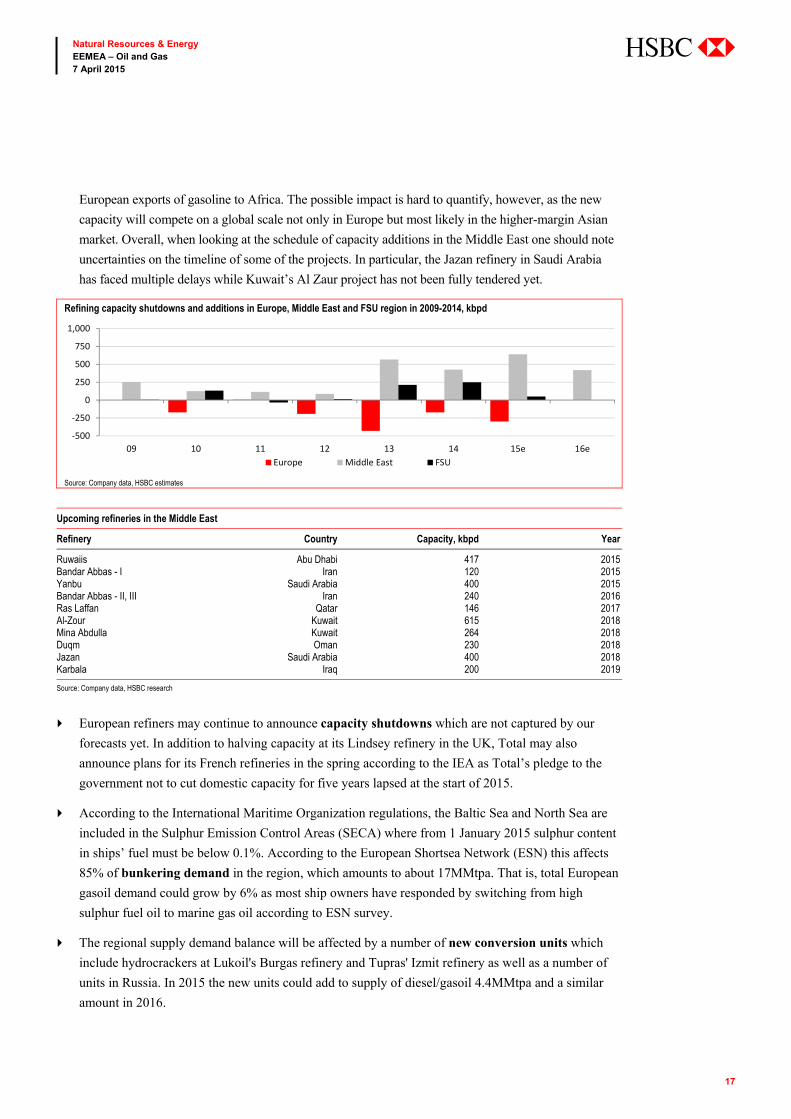
market. Overall, when looking at the schedule of capacity additions in the Middle East one should note
uncertainties on the timeline of some of the projects. In particular, the Jazan refinery in Saudi Arabia
has faced multiple delays while Kuwait’s Al Zaur project has not been fully tendered yet.
Refining capacity shutdowns and additions in Europe, Middle East and FSU region in 2009-2014, kbpd
Source: Company data, HSBC estimates
Upcoming refineries in the Middle East
Refinery Country Capacity, kbpd Year
Ruwaiis Abu Dhabi 417 2015 Bandar Abbas - I Iran 120 2015 Yanbu Saudi Arabia 400 2015 Bandar Abbas - II, III Iran 240 2016 Ras Laffan Qatar 146 2017 Al-Zour Kuwait 615 2018 Mina Abdulla Kuwait 264 2018 Duqm Oman 230 2018 Jazan Saudi Arabia 400 2018 Karbala Iraq 200 2019
Source: Company data, HSBC research
European refiners may continue to announce capacity shutdowns which are not captured by our
forecasts yet. In addition to halving capacity at its Lindsey refinery in the UK, Total may also
announce plans for its French refineries in the spring according to the IEA as Total’s pledge to the
government not to cut domestic capacity for five years lapsed at the start of 2015.
According to the International Maritime Organization regulations, the Baltic Sea and North Sea are
included in the Sulphur Emission Control Areas (SECA) where from 1 January 2015 sulphur content
in ships’ fuel must be below 0.1%. According to the European Shortsea Network (ESN) this affects
85% of bunkering demand in the region, which amounts to about 17MMtpa. That is, total European
gasoil demand could grow by 6% as most ship owners have responded by switching from high
sulphur fuel oil to marine gas oil according to ESN survey.
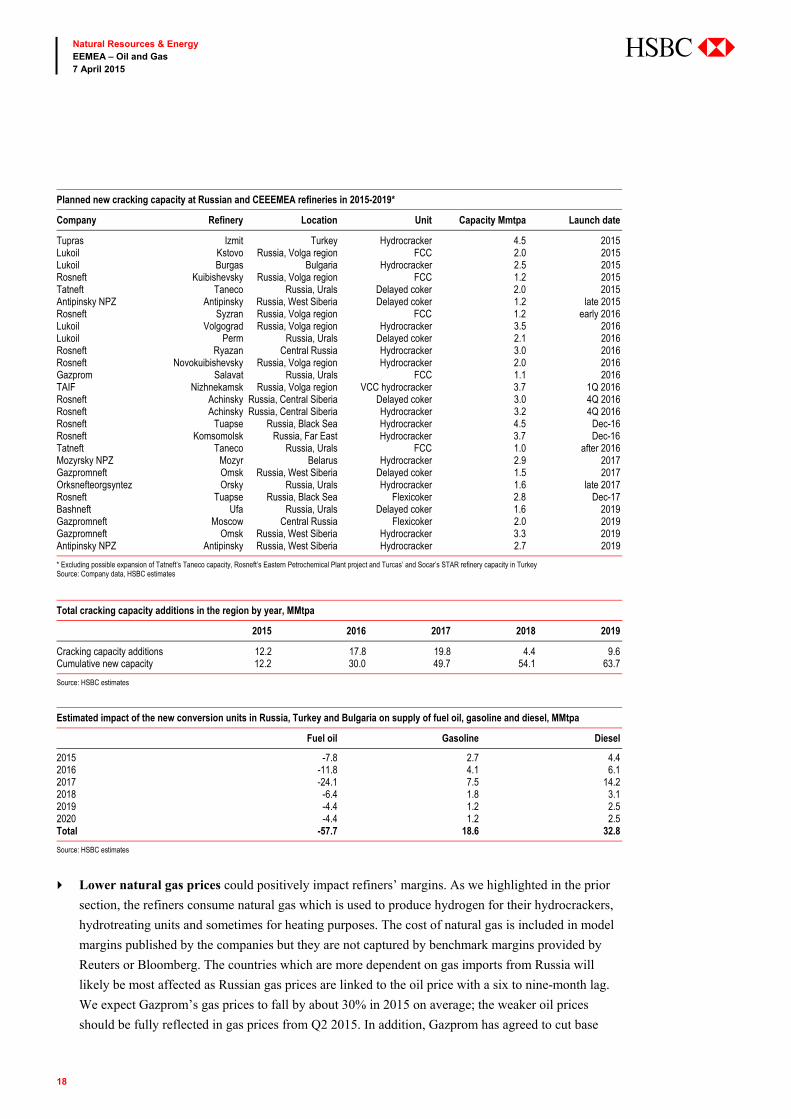
The regional supply demand balance will be affected by a number of new conversion units which
include hydrocrackers at Lukoil's Burgas refinery and Tupras' Izmit refinery as well as a number of
units in Russia. In 2015 the new units could add to supply of diesel/gasoil 4.4MMtpa and a similar
amount in 2016.
-500
-250
0
250
500
750
1,000
09 10 11 12 13 14 15e 16eEurope Middle East FSU
18
Natural Resources & Energy EEMEA – Oil and Gas 7 April 2015
abc
Planned new cracking capacity at Russian and CEEEMEA refineries in 2015-2019*
Company Refinery Location Unit Capacity Mmtpa Launch date
Tupras Izmit Turkey Hydrocracker 4.5 2015 Lukoil Kstovo Russia, Volga region FCC 2.0 2015 Lukoil Burgas Bulgaria Hydrocracker 2.5 2015 Rosneft Kuibishevsky Russia, Volga region FCC 1.2 2015 Tatneft Taneco Russia, Urals Delayed coker 2.0 2015 Antipinsky NPZ Antipinsky Russia, West Siberia Delayed coker 1.2 late 2015 Rosneft Syzran Russia, Volga region FCC 1.2 early 2016 Lukoil Volgograd Russia, Volga region Hydrocracker 3.5 2016 Lukoil Perm Russia, Urals Delayed coker 2.1 2016 Rosneft Ryazan Central Russia Hydrocracker 3.0 2016 Rosneft Novokuibishevsky Russia, Volga region Hydrocracker 2.0 2016 Gazprom Salavat Russia, Urals FCC 1.1 2016 TAIF Nizhnekamsk Russia, Volga region VCC hydrocracker 3.7 1Q 2016 Rosneft Achinsky Russia, Central Siberia Delayed coker 3.0 4Q 2016 Rosneft Achinsky Russia, Central Siberia Hydrocracker 3.2 4Q 2016 Rosneft Tuapse Russia, Black Sea Hydrocracker 4.5 Dec-16 Rosneft Komsomolsk Russia, Far East Hydrocracker 3.7 Dec-16 Tatneft Taneco Russia, Urals FCC 1.0 after 2016 Mozyrsky NPZ Mozyr Belarus Hydrocracker 2.9 2017 Gazpromneft Omsk Russia, West Siberia Delayed coker 1.5 2017 Orksnefteorgsyntez Orsky Russia, Urals Hydrocracker 1.6 late 2017 Rosneft Tuapse Russia, Black Sea Flexicoker 2.8 Dec-17 Bashneft Ufa Russia, Urals Delayed coker 1.6 2019 Gazpromneft Moscow Central Russia Flexicoker 2.0 2019 Gazpromneft Omsk Russia, West Siberia Hydrocracker 3.3 2019 Antipinsky NPZ Antipinsky Russia, West Siberia Hydrocracker 2.7 2019
* Excluding possible expansion of Tatneft’s Taneco capacity, Rosneft’s Eastern Petrochemical Plant project and Turcas’ and Socar’s STAR refinery capacity in Turkey Source: Company data, HSBC estimates
Total cracking capacity additions in the region by year, MMtpa
2015 2016 2017 2018 2019
Cracking capacity additions 12.2 17.8 19.8 4.4 9.6 Cumulative new capacity 12.2 30.0 49.7 54.1 63.7
Source: HSBC estimates
Estimated impact of the new conversion units in Russia, Turkey and Bulgaria on supply of fuel oil, gasoline and diesel, MMtpa
Fuel oil Gasoline Diesel
2015 -7.8 2.7 4.4 2016 -11.8 4.1 6.1 2017 -24.1 7.5 14.2 2018 -6.4 1.8 3.1 2019 -4.4 1.2 2.5 2020 -4.4 1.2 2.5 Total -57.7 18.6 32.8
Source: HSBC estimates
Lower natural gas prices could positively impact refiners’ margins. As we highlighted in the prior
section, the refiners consume natural gas which is used to produce hydrogen for their hydrocrackers,
hydrotreating units and sometimes for heating purposes. The cost of natural gas is included in model
margins published by the companies but they are not captured by benchmark margins provided by
Reuters or Bloomberg. The countries which are more dependent on gas imports from Russia will
likely be most affected as Russian gas prices are linked to the oil price with a six to nine-month lag.
We expect Gazprom’s gas prices to fall by about 30% in 2015 on average; the weaker oil prices
should be fully reflected in gas prices from Q2 2015. In addition, Gazprom has agreed to cut base
19
Natural Resources & Energy EEMEA – Oil and Gas 7 April 2015
abc
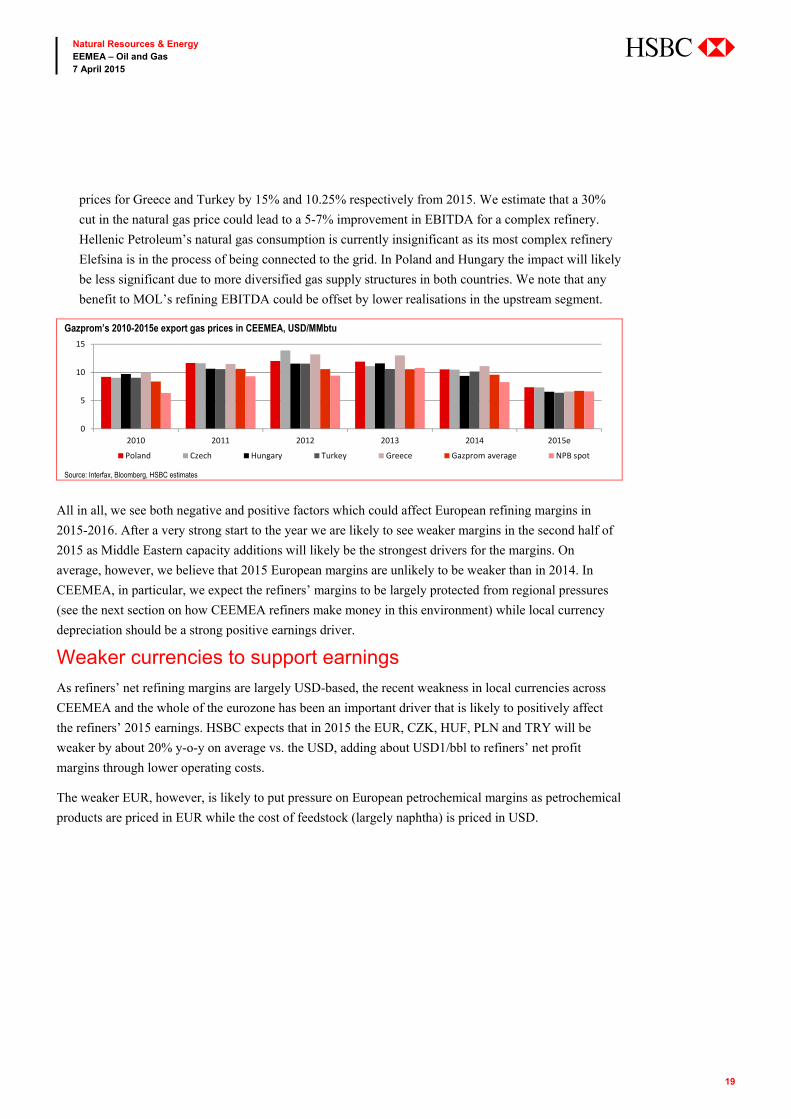
prices for Greece and Turkey by 15% and 10.25% respectively from 2015. We estimate that a 30%
cut in the natural gas price could lead to a 5-7% improvement in EBITDA for a complex refinery.
Hellenic Petroleum’s natural gas consumption is currently insignificant as its most complex refinery
Elefsina is in the process of being connected to the grid. In Poland and Hungary the impact will likely
be less significant due to more diversified gas supply structures in both countries. We note that any
benefit to MOL’s refining EBITDA could be offset by lower realisations in the upstream segment.
Gazprom’s 2010-2015e export gas prices in CEEMEA, USD/MMbtu
Source: Interfax, Bloomberg, HSBC estimates
All in all, we see both negative and positive factors which could affect European refining margins in
2015-2016. After a very strong start to the year we are likely to see weaker margins in the second half of
2015 as Middle Eastern capacity additions will likely be the strongest drivers for the margins. On
average, however, we believe that 2015 European margins are unlikely to be weaker than in 2014. In
CEEMEA, in particular, we expect the refiners’ margins to be largely protected from regional pressures
(see the next section on how CEEMEA refiners make money in this environment) while local currency
depreciation should be a strong positive earnings driver.
Weaker currencies to support earnings
As refiners’ net refining margins are largely USD-based, the recent weakness in local currencies across
CEEMEA and the whole of the eurozone has been an important driver that is likely to positively affect
the refiners’ 2015 earnings. HSBC expects that in 2015 the EUR, CZK, HUF, PLN and TRY will be
weaker by about 20% y-o-y on average vs. the USD, adding about USD1/bbl to refiners’ net profit
margins through lower operating costs.
The weaker EUR, however, is likely to put pressure on European petrochemical margins as petrochemical
products are priced in EUR while the cost of feedstock (largely naphtha) is priced in USD.
0
5
10
15
2010 2011 2012 2013 2014 2015e
Poland Czech Hungary Turkey Greece Gazprom average NPB spot
20
Natural Resources & Energy EEMEA – Oil and Gas 7 April 2015
abc
HSBC forecasts for CZK, HUF, PLN, TRY and EUR
2014a (avg) 2015e (avg) Appr/(depr.) vs USD
2016e (avg) Appr/(depr.) vs USD
2015e (YE) 2016e (YE)
CZK/USD 20.70 26.10 -21% 24.80 5% 25.70 24.50 HUF/USD 232.10 292.70 -21% 280.50 4% 290.50 277.30 PLN/USD 3.20 3.90 -18% 3.70 5% 3.90 3.70 TRY/USD 2.20 2.70 -19% 2.70 0% 2.70 2.70 USD/EUR 1.33 1.04 -22% 1.09 5% 1.05 1.10
Source: HSBC estimates
What if the oil price stays low? Watch Russian refining runs
In our base case scenario (oil price recovery) the continuing modernisation of Russian refineries presents
risks for European diesel cracks. It is interesting, however, how the increased complexity of Russian
refiners could affect the European refining space if the oil price stays weak for longer.
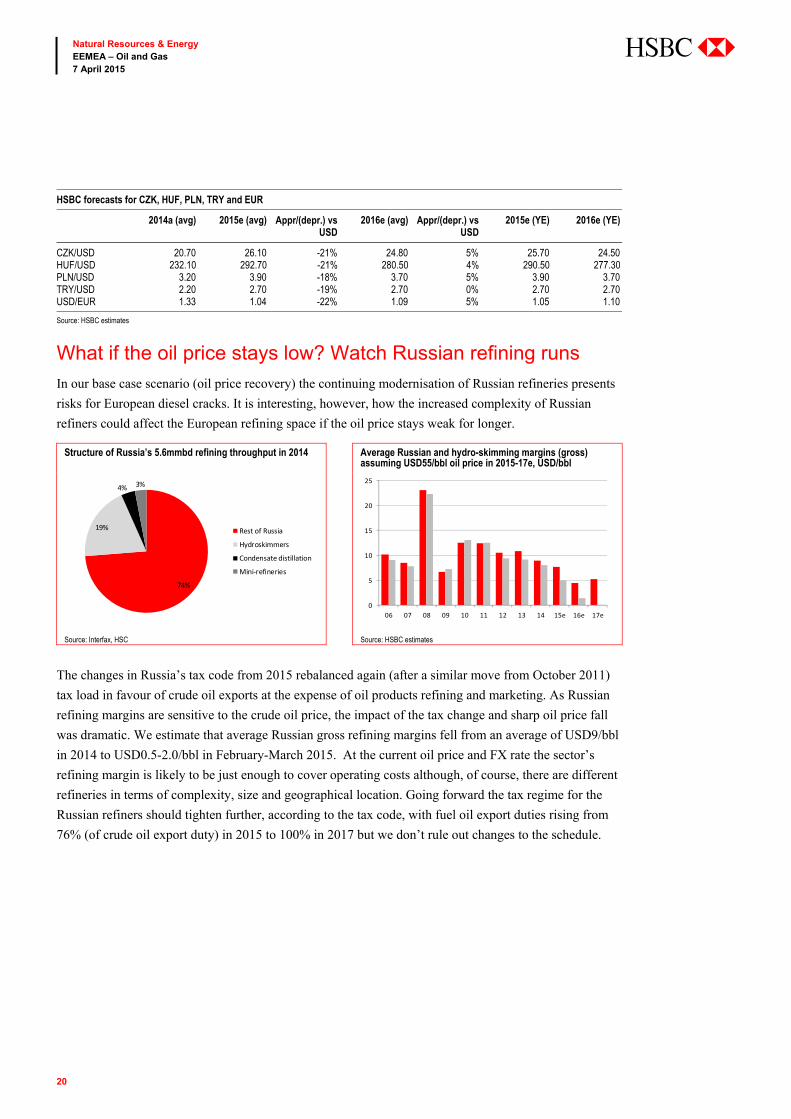
Structure of Russia’s 5.6mmbd refining throughput in 2014 Average Russian and hydro-skimming margins (gross) assuming USD55/bbl oil price in 2015-17e, USD/bbl
Source: Interfax, HSC Source: HSBC estimates
The changes in Russia’s tax code from 2015 rebalanced again (after a similar move from October 2011)
tax load in favour of crude oil exports at the expense of oil products refining and marketing. As Russian
refining margins are sensitive to the crude oil price, the impact of the tax change and sharp oil price fall
was dramatic. We estimate that average Russian gross refining margins fell from an average of USD9/bbl
in 2014 to USD0.5-2.0/bbl in February-March 2015. At the current oil price and FX rate the sector’s
refining margin is likely to be just enough to cover operating costs although, of course, there are different
refineries in terms of complexity, size and geographical location. Going forward the tax regime for the
Russian refiners should tighten further, according to the tax code, with fuel oil export duties rising from
76% (of crude oil export duty) in 2015 to 100% in 2017 but we don’t rule out changes to the schedule.
74%
19%
4% 3%
Rest of Russia
Hydroskimmers
Condensate distillation
Mini-refineries
0
5
10
15
20
25
06 07 08 09 10 11 12 13 14 15e 16e 17e
21
Natural Resources & Energy EEMEA – Oil and Gas 7 April 2015
abc
We estimate Russia’s 2014 hydroskimming (simple) refineries’ capacity at 65MMtpa (1300kbpd)
Refinery 2014 throughput 2014 NCI* Planned new capacity
Komsomolsky (Rosneft) 7.60 3.2 Deep conversion unit by end of 2016 Tuapse (Rosneft) 8.65 1 Hydrocracker, flexicoking and other units, throughput
to grow to 12MMtpa Ukhta (Lukoil) 3.00 2.6 Saratov (Rosneft) 7.06 3.7 Orsk 5.94 3.8 Deep conversion unit by late 2017 Antipinsky 6.24 1.0 Deep conversion unit by 2019 Karsnodarsky 2.47 1.2 Extension plant is being added with 3MMtpa net capacity
addition, deep conversion unit planed by 2020 Afipsky 5.86 1.0 Hydrocracker, delayed coker, new distillation capacity by 2018 Novoshakhtinsky 2.62 1.0 Hydrocracker, new distillation capacity Mariysky 0.91 1.0 Hydrocracker, new distillation capacity Enisey 1.40 1.0 Hydrocracker, new distillation capacity Ilsky 2.72 1.0 FCC, new distillation capacity Yaysky 2.58 1.0 Delayed coker Others 7.30 1.0 Total 65.3
* NCI – Nelson Complexity Index Source: Company data, Infotek, HSBC estimates
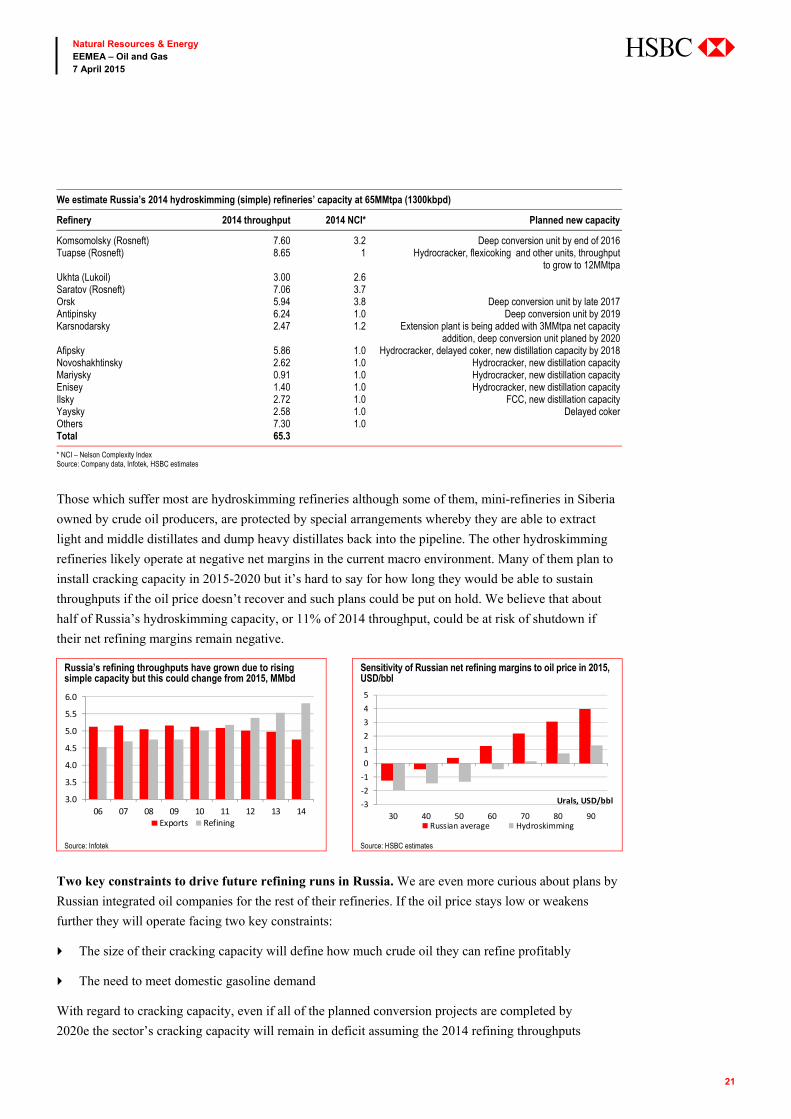
Those which suffer most are hydroskimming refineries although some of them, mini-refineries in Siberia
owned by crude oil producers, are protected by special arrangements whereby they are able to extract
light and middle distillates and dump heavy distillates back into the pipeline. The other hydroskimming
refineries likely operate at negative net margins in the current macro environment. Many of them plan to
install cracking capacity in 2015-2020 but it’s hard to say for how long they would be able to sustain
throughputs if the oil price doesn’t recover and such plans could be put on hold. We believe that about
half of Russia’s hydroskimming capacity, or 11% of 2014 throughput, could be at risk of shutdown if
their net refining margins remain negative.
Russia’s refining throughputs have grown due to rising simple capacity but this could change from 2015, MMbd
Sensitivity of Russian net refining margins to oil price in 2015, USD/bbl
Source: Infotek Source: HSBC estimates
Two key constraints to drive future refining runs in Russia. We are even more curious about plans by
Russian integrated oil companies for the rest of their refineries. If the oil price stays low or weakens
further they will operate facing two key constraints:
The size of their cracking capacity will define how much crude oil they can refine profitably
The need to meet domestic gasoline demand
With regard to cracking capacity, even if all of the planned conversion projects are completed by
2020e the sector’s cracking capacity will remain in deficit assuming the 2014 refining throughputs
3.0
3.5
4.0
4.5
5.0
5.5
6.0
06 07 08 09 10 11 12 13 14Exports Refining
-3-2-1012345
30 40 50 60 70 80 90
Urals, USD/bbl
Russian average Hydroskimming
22
Natural Resources & Energy EEMEA – Oil and Gas 7 April 2015
abc
(fuel oil output was 78MMtpa on the top of about 10MMtpa vacuum gasoil). That is, even if all of these
projects were completed and there were no other constraints, the refiners would be tempted to cut their
runs to a level where marginal refined barrel margin breaks even. The Energy Ministry expects that
Russia’s refining runs will fall by 12% by 2020 but this estimate is sensitive to oil prices, in our view. Estimated impact of the new conversion units in Russia on supply of fuel oil, gasoline and diesel, MMtpa
Fuel oil Gasoline Diesel
2015 -2.3 1.0 0.6 2016 -10.6 3.7 5.3 2017 -24.1 7.5 14.2 2018 -6.4 1.8 3.1 2019 -4.4 1.2 2.5 2020 -4.4 1.2 2.5 Total -52.1 16.5 28.3
Source: HSBC estimates
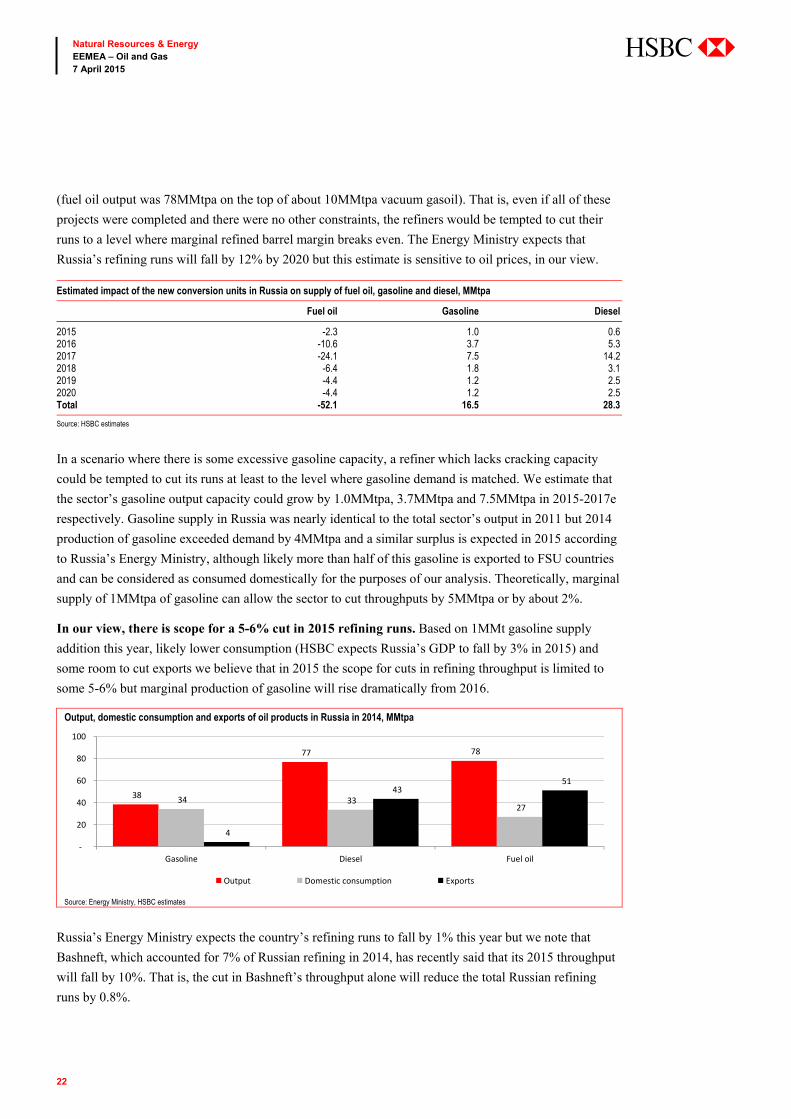
In a scenario where there is some excessive gasoline capacity, a refiner which lacks cracking capacity
could be tempted to cut its runs at least to the level where gasoline demand is matched. We estimate that
the sector’s gasoline output capacity could grow by 1.0MMtpa, 3.7MMtpa and 7.5MMtpa in 2015-2017e
respectively. Gasoline supply in Russia was nearly identical to the total sector’s output in 2011 but 2014
production of gasoline exceeded demand by 4MMtpa and a similar surplus is expected in 2015 according
to Russia’s Energy Ministry, although likely more than half of this gasoline is exported to FSU countries
and can be considered as consumed domestically for the purposes of our analysis. Theoretically, marginal
supply of 1MMtpa of gasoline can allow the sector to cut throughputs by 5MMtpa or by about 2%.
In our view, there is scope for a 5-6% cut in 2015 refining runs. Based on 1MMt gasoline supply
addition this year, likely lower consumption (HSBC expects Russia’s GDP to fall by 3% in 2015) and
some room to cut exports we believe that in 2015 the scope for cuts in refining throughput is limited to
some 5-6% but marginal production of gasoline will rise dramatically from 2016.
Output, domestic consumption and exports of oil products in Russia in 2014, MMtpa
Source: Energy Ministry, HSBC estimates
Russia’s Energy Ministry expects the country’s refining runs to fall by 1% this year but we note that
Bashneft, which accounted for 7% of Russian refining in 2014, has recently said that its 2015 throughput
will fall by 10%. That is, the cut in Bashneft’s throughput alone will reduce the total Russian refining
runs by 0.8%.
38
77 78
34 33 27
4
43 51
-
20
40
60
80
100
Gasoline Diesel Fuel oil
Output Domestic consumption Exports
23
Natural Resources & Energy EEMEA – Oil and Gas 7 April 2015
abc
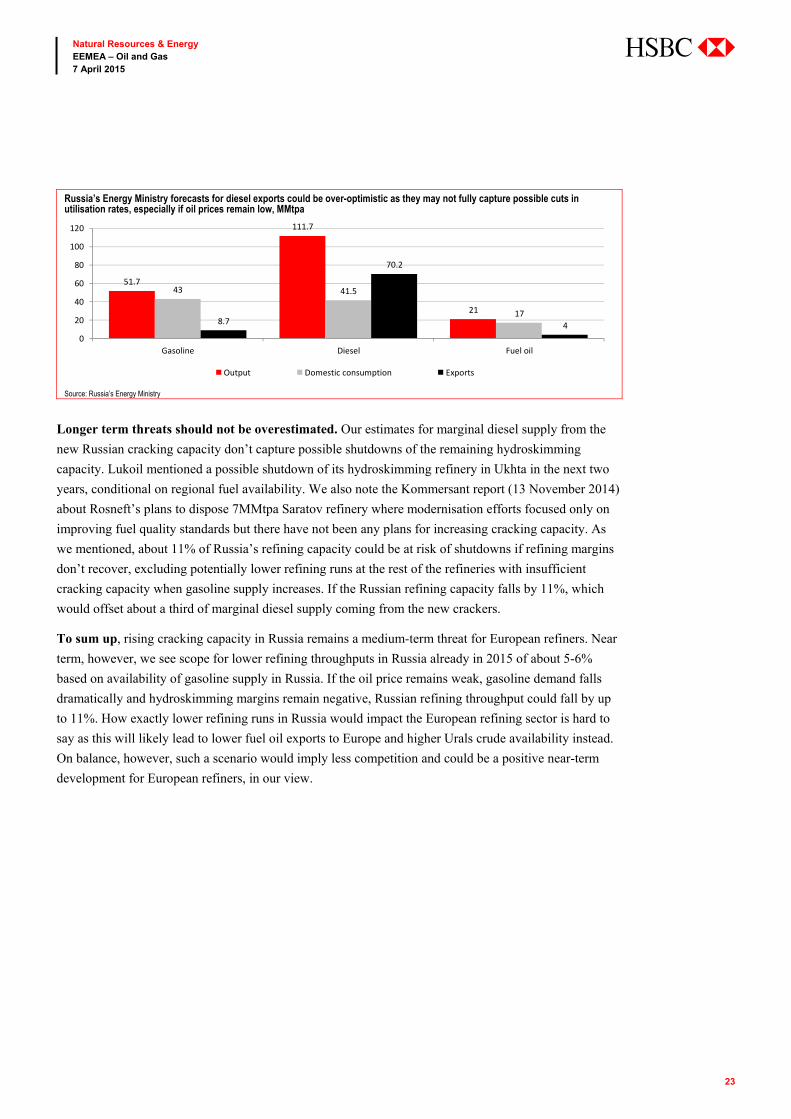
Russia’s Energy Ministry forecasts for diesel exports could be over-optimistic as they may not fully capture possible cuts in utilisation rates, especially if oil prices remain low, MMtpa
Source: Russia’s Energy Ministry
Longer term threats should not be overestimated. Our estimates for marginal diesel supply from the
new Russian cracking capacity don’t capture possible shutdowns of the remaining hydroskimming
capacity. Lukoil mentioned a possible shutdown of its hydroskimming refinery in Ukhta in the next two
years, conditional on regional fuel availability. We also note the Kommersant report (13 November 2014)
about Rosneft’s plans to dispose 7MMtpa Saratov refinery where modernisation efforts focused only on
improving fuel quality standards but there have not been any plans for increasing cracking capacity. As
we mentioned, about 11% of Russia’s refining capacity could be at risk of shutdowns if refining margins
don’t recover, excluding potentially lower refining runs at the rest of the refineries with insufficient
cracking capacity when gasoline supply increases. If the Russian refining capacity falls by 11%, which
would offset about a third of marginal diesel supply coming from the new crackers.
To sum up, rising cracking capacity in Russia remains a medium-term threat for European refiners. Near
term, however, we see scope for lower refining throughputs in Russia already in 2015 of about 5-6%
based on availability of gasoline supply in Russia. If the oil price remains weak, gasoline demand falls
dramatically and hydroskimming margins remain negative, Russian refining throughput could fall by up
to 11%. How exactly lower refining runs in Russia would impact the European refining sector is hard to
say as this will likely lead to lower fuel oil exports to Europe and higher Urals crude availability instead.
On balance, however, such a scenario would imply less competition and could be a positive near-term
development for European refiners, in our view.
51.7
111.7
21
43 41.5
178.7
70.2
40
20
40
60
80
100
120
Gasoline Diesel Fuel oil
Output Domestic consumption Exports
24
Natural Resources & Energy EEMEA – Oil and Gas 7 April 2015
abc
Benchmark margins ignore regional pricing specifics
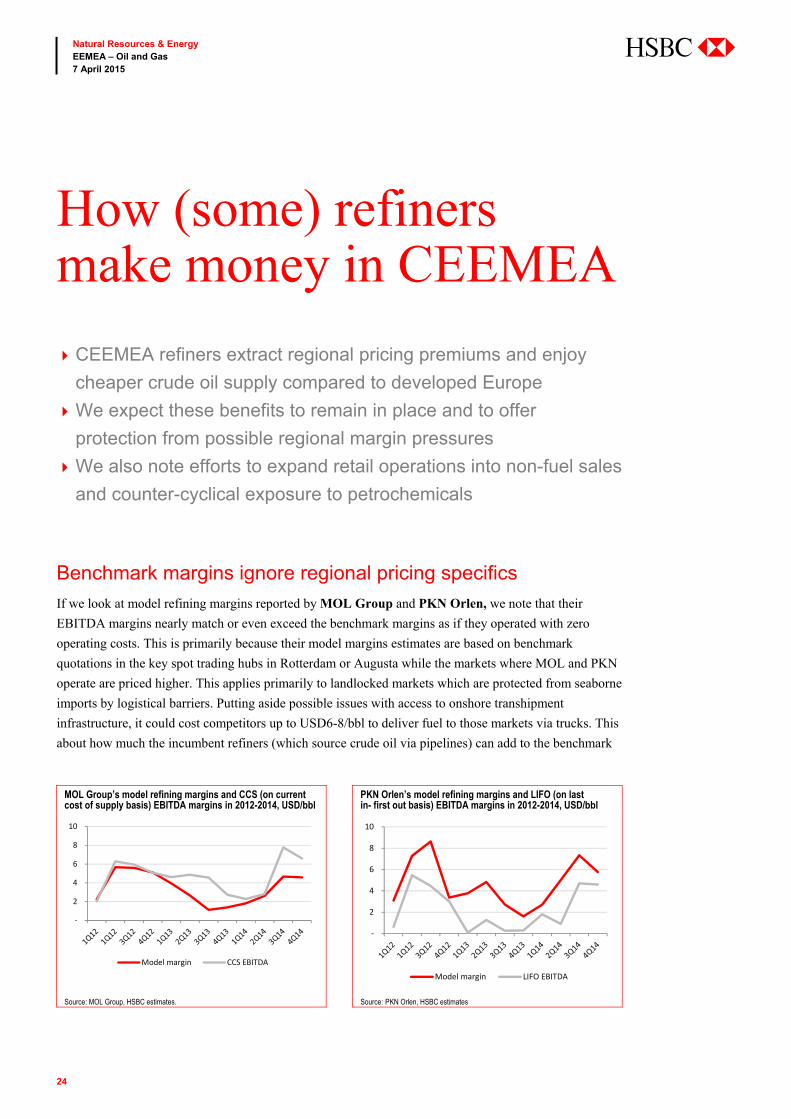
If we look at model refining margins reported by MOL Group and PKN Orlen, we note that their
EBITDA margins nearly match or even exceed the benchmark margins as if they operated with zero
operating costs. This is primarily because their model margins estimates are based on benchmark
quotations in the key spot trading hubs in Rotterdam or Augusta while the markets where MOL and PKN
operate are priced higher. This applies primarily to landlocked markets which are protected from seaborne
imports by logistical barriers. Putting aside possible issues with access to onshore transhipment
infrastructure, it could cost competitors up to USD6-8/bbl to deliver fuel to those markets via trucks. This
about how much the incumbent refiners (which source crude oil via pipelines) can add to the benchmark
How (some) refinersmake money in CEEMEA
CEEMEA refiners extract regional pricing premiums and enjoy
cheaper crude oil supply compared to developed Europe
We expect these benefits to remain in place and to offer
protection from possible regional margin pressures
We also note efforts to expand retail operations into non-fuel sales
and counter-cyclical exposure to petrochemicals
MOL Group’s model refining margins and CCS (on current cost of supply basis) EBITDA margins in 2012-2014, USD/bbl
PKN Orlen’s model refining margins and LIFO (on last in- first out basis) EBITDA margins in 2012-2014, USD/bbl
Source: MOL Group, HSBC estimates. Source: PKN Orlen, HSBC estimates
-
2
4
6
8
10
Model margin CCS EBITDA
-
2
4
6
8
10
Model margin LIFO EBITDA
25
Natural Resources & Energy EEMEA – Oil and Gas 7 April 2015
abc
prices when selling their products in their markets. The opposite, of course, applies to products which
they have to export.
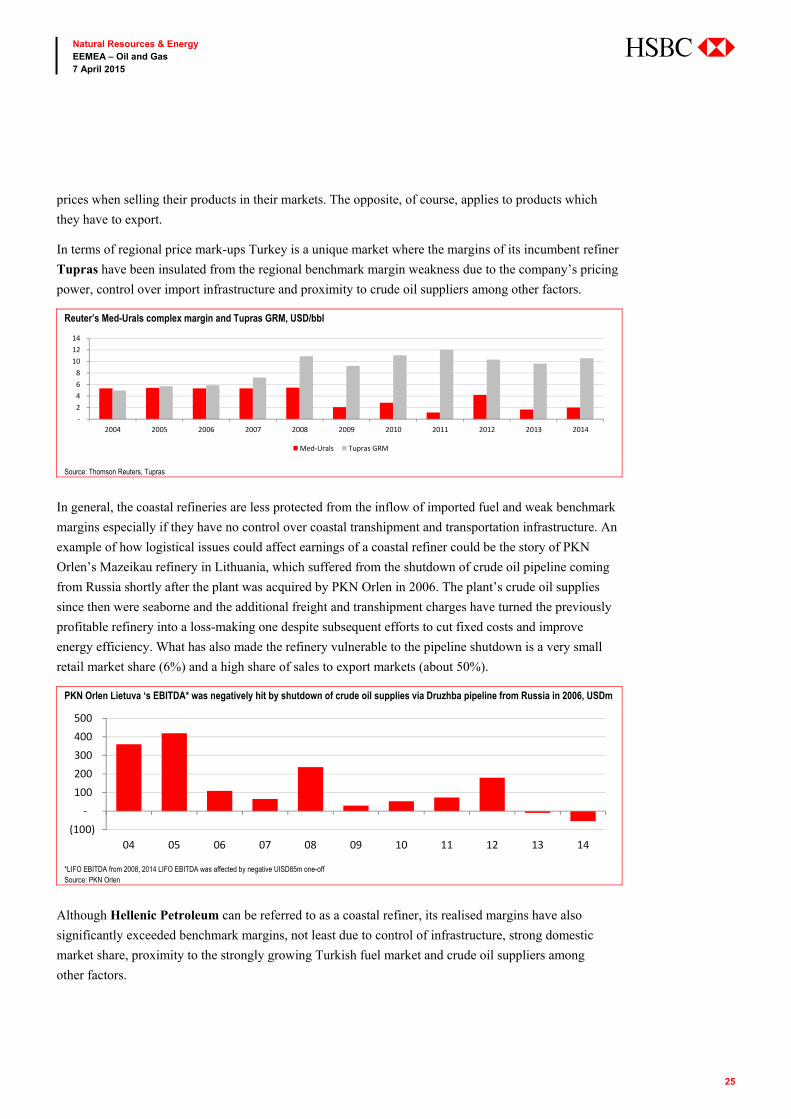
In terms of regional price mark-ups Turkey is a unique market where the margins of its incumbent refiner
Tupras have been insulated from the regional benchmark margin weakness due to the company’s pricing
power, control over import infrastructure and proximity to crude oil suppliers among other factors.
Reuter’s Med-Urals complex margin and Tupras GRM, USD/bbl
Source: Thomson Reuters, Tupras
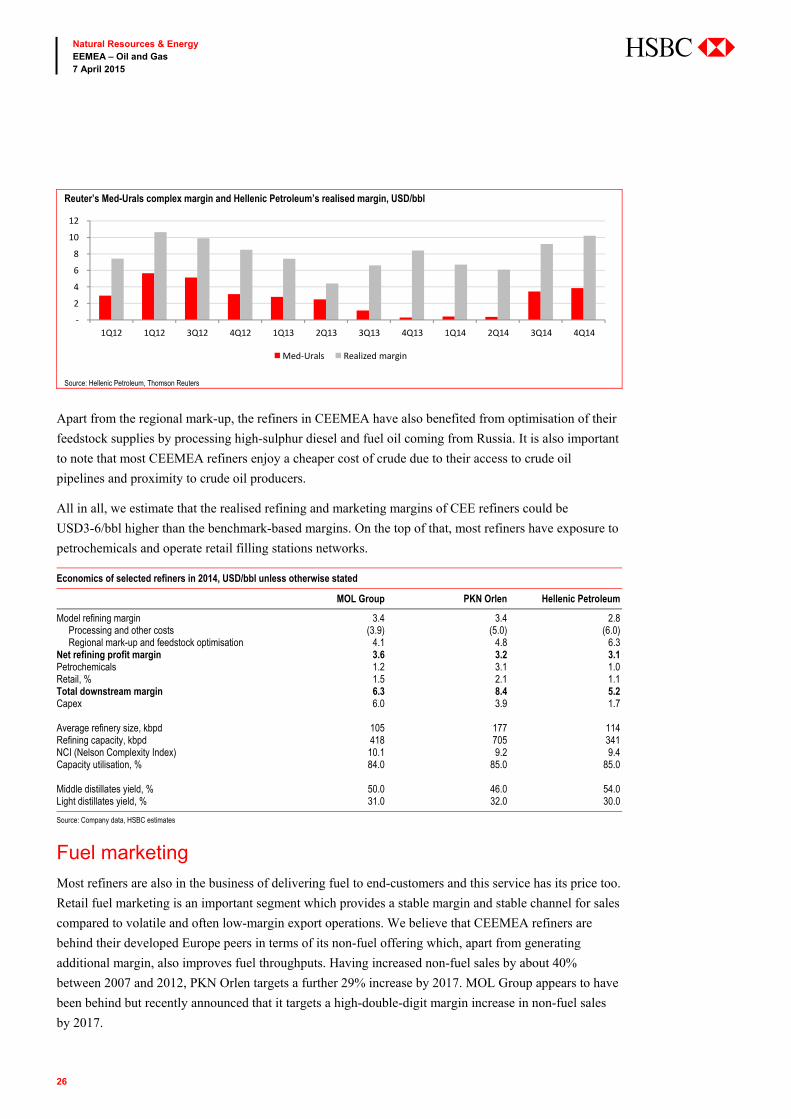
In general, the coastal refineries are less protected from the inflow of imported fuel and weak benchmark
margins especially if they have no control over coastal transhipment and transportation infrastructure. An
example of how logistical issues could affect earnings of a coastal refiner could be the story of PKN
Orlen’s Mazeikau refinery in Lithuania, which suffered from the shutdown of crude oil pipeline coming
from Russia shortly after the plant was acquired by PKN Orlen in 2006. The plant’s crude oil supplies
since then were seaborne and the additional freight and transhipment charges have turned the previously
profitable refinery into a loss-making one despite subsequent efforts to cut fixed costs and improve
energy efficiency. What has also made the refinery vulnerable to the pipeline shutdown is a very small
retail market share (6%) and a high share of sales to export markets (about 50%).
PKN Orlen Lietuva ‘s EBITDA* was negatively hit by shutdown of crude oil supplies via Druzhba pipeline from Russia in 2006, USDm
*LIFO EBITDA from 2008, 2014 LIFO EBITDA was affected by negative UISD85m one-off Source: PKN Orlen
Although Hellenic Petroleum can be referred to as a coastal refiner, its realised margins have also
significantly exceeded benchmark margins, not least due to control of infrastructure, strong domestic
market share, proximity to the strongly growing Turkish fuel market and crude oil suppliers among
other factors.
- 2 4 6 8
10 12 14
2004 2005 2006 2007 2008 2009 2010 2011 2012 2013 2014
Med-Urals Tupras GRM
(100) -
100 200 300 400 500
04 05 06 07 08 09 10 11 12 13 14
26
Natural Resources & Energy EEMEA – Oil and Gas 7 April 2015
abc
Reuter’s Med-Urals complex margin and Hellenic Petroleum’s realised margin, USD/bbl
Source: Hellenic Petroleum, Thomson Reuters
Apart from the regional mark-up, the refiners in CEEMEA have also benefited from optimisation of their
feedstock supplies by processing high-sulphur diesel and fuel oil coming from Russia. It is also important
to note that most CEEMEA refiners enjoy a cheaper cost of crude due to their access to crude oil
pipelines and proximity to crude oil producers.
All in all, we estimate that the realised refining and marketing margins of CEE refiners could be
USD3-6/bbl higher than the benchmark-based margins. On the top of that, most refiners have exposure to
petrochemicals and operate retail filling stations networks.
Economics of selected refiners in 2014, USD/bbl unless otherwise stated
MOL Group PKN Orlen Hellenic Petroleum
Model refining margin 3.4 3.4 2.8 Processing and other costs (3.9) (5.0) (6.0) Regional mark-up and feedstock optimisation 4.1 4.8 6.3 Net refining profit margin 3.6 3.2 3.1 Petrochemicals 1.2 3.1 1.0 Retail, % 1.5 2.1 1.1 Total downstream margin 6.3 8.4 5.2 Capex 6.0 3.9 1.7 Average refinery size, kbpd 105 177 114 Refining capacity, kbpd 418 705 341 NCI (Nelson Complexity Index) 10.1 9.2 9.4 Capacity utilisation, % 84.0 85.0 85.0 Middle distillates yield, % 50.0 46.0 54.0 Light distillates yield, % 31.0 32.0 30.0
Source: Company data, HSBC estimates
Fuel marketing
Most refiners are also in the business of delivering fuel to end-customers and this service has its price too.
Retail fuel marketing is an important segment which provides a stable margin and stable channel for sales
compared to volatile and often low-margin export operations. We believe that CEEMEA refiners are
behind their developed Europe peers in terms of its non-fuel offering which, apart from generating
additional margin, also improves fuel throughputs. Having increased non-fuel sales by about 40%
between 2007 and 2012, PKN Orlen targets a further 29% increase by 2017. MOL Group appears to have
been behind but recently announced that it targets a high-double-digit margin increase in non-fuel sales
by 2017.
-
2
4
6
8
10
12
1Q12 1Q12 3Q12 4Q12 1Q13 2Q13 3Q13 4Q13 1Q14 2Q14 3Q14 4Q14
Med-Urals Realized margin
27
Natural Resources & Energy EEMEA – Oil and Gas 7 April 2015
abc
Fuel retailing is just one important segment of this activity as refiners also compete in aviation and
bunkering fuel segments and the latter is common not only for coastal refiners but also for those with
links to important river corridors, of which the best example is the Danube, Europe’s second-longest river
navigable from the Black Sea to Bavaria in Germany with access to Austria, Slovakia, Hungary, Croatia,
Serbia, Bulgaria, Romania, Moldova and Ukraine.
Petrochemicals
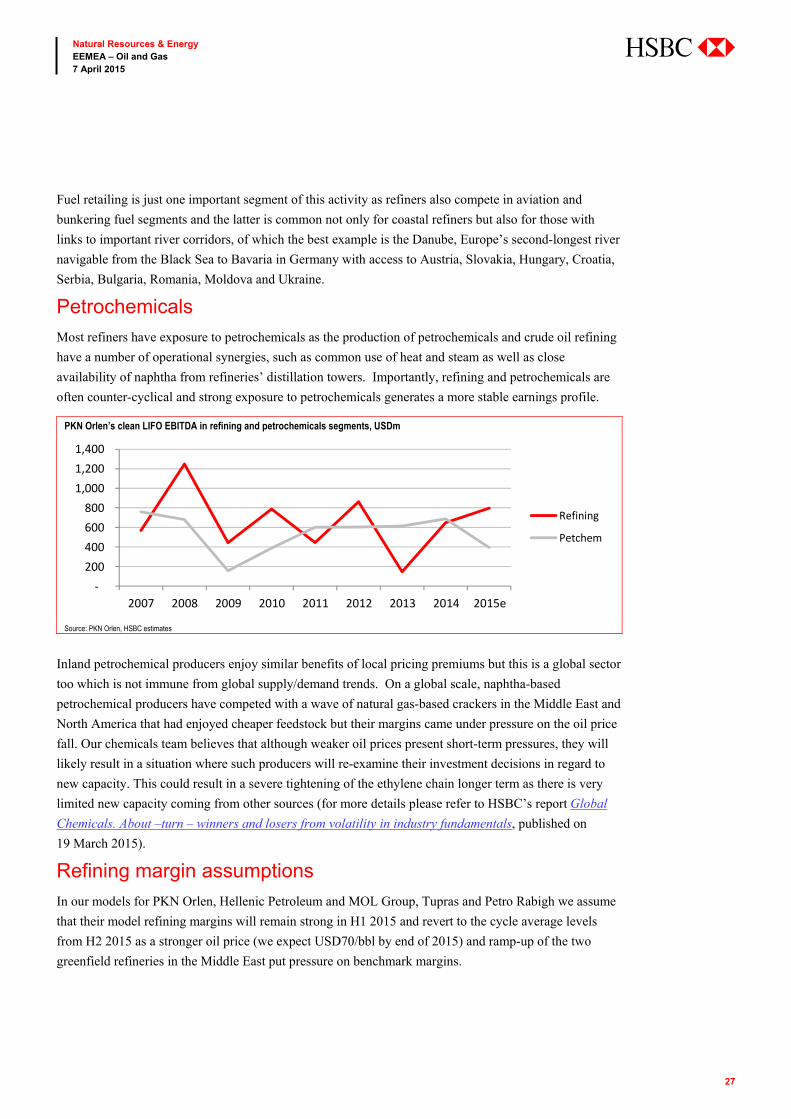
Most refiners have exposure to petrochemicals as the production of petrochemicals and crude oil refining
have a number of operational synergies, such as common use of heat and steam as well as close
availability of naphtha from refineries’ distillation towers. Importantly, refining and petrochemicals are
often counter-cyclical and strong exposure to petrochemicals generates a more stable earnings profile.
PKN Orlen’s clean LIFO EBITDA in refining and petrochemicals segments, USDm
Source: PKN Orlen, HSBC estimates
Inland petrochemical producers enjoy similar benefits of local pricing premiums but this is a global sector
too which is not immune from global supply/demand trends. On a global scale, naphtha-based
petrochemical producers have competed with a wave of natural gas-based crackers in the Middle East and
North America that had enjoyed cheaper feedstock but their margins came under pressure on the oil price
fall. Our chemicals team believes that although weaker oil prices present short-term pressures, they will
likely result in a situation where such producers will re-examine their investment decisions in regard to
new capacity. This could result in a severe tightening of the ethylene chain longer term as there is very
limited new capacity coming from other sources (for more details please refer to HSBC’s report Global
Chemicals. About –turn – winners and losers from volatility in industry fundamentals, published on
19 March 2015).
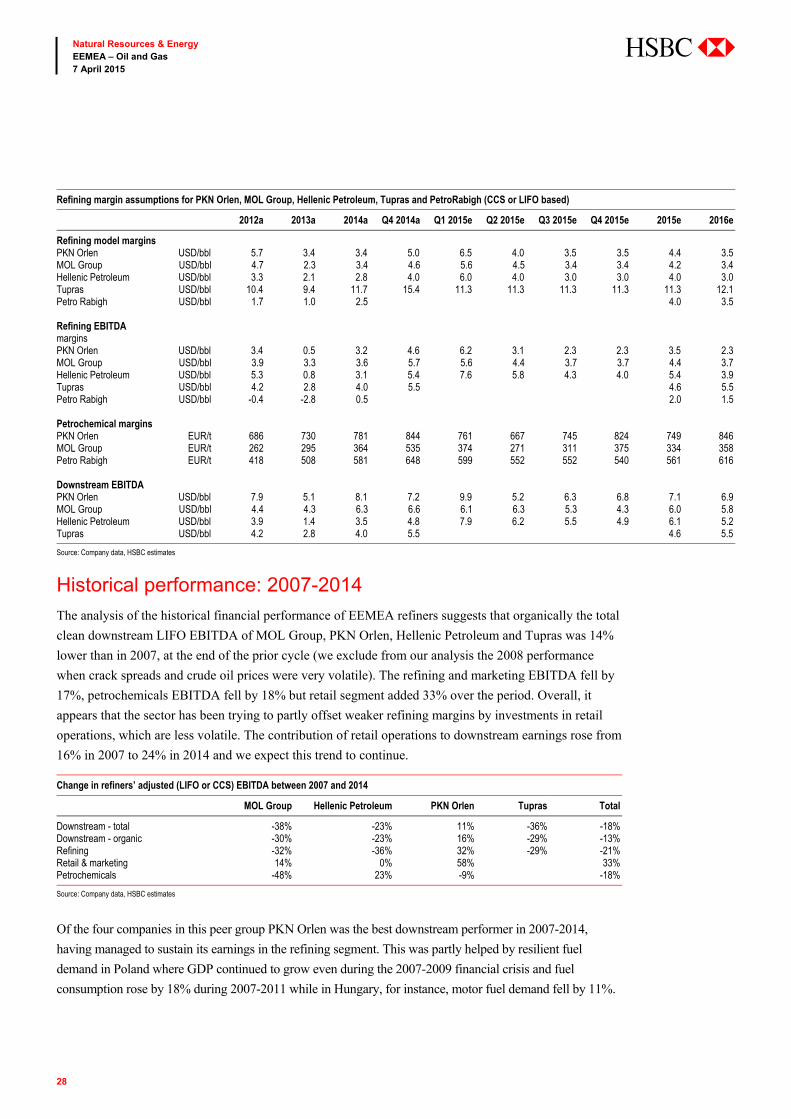
Refining margin assumptions
In our models for PKN Orlen, Hellenic Petroleum and MOL Group, Tupras and Petro Rabigh we assume
that their model refining margins will remain strong in H1 2015 and revert to the cycle average levels
from H2 2015 as a stronger oil price (we expect USD70/bbl by end of 2015) and ramp-up of the two
greenfield refineries in the Middle East put pressure on benchmark margins.
- 200 400 600 800
1,000 1,200 1,400
2007 2008 2009 2010 2011 2012 2013 2014 2015e
Refining
Petchem
28
Natural Resources & Energy EEMEA – Oil and Gas 7 April 2015
abc
Refining margin assumptions for PKN Orlen, MOL Group, Hellenic Petroleum, Tupras and PetroRabigh (CCS or LIFO based)
2012a 2013a 2014a Q4 2014a Q1 2015e Q2 2015e Q3 2015e Q4 2015e 2015e 2016e
Refining model margins PKN Orlen USD/bbl 5.7 3.4 3.4 5.0 6.5 4.0 3.5 3.5 4.4 3.5 MOL Group USD/bbl 4.7 2.3 3.4 4.6 5.6 4.5 3.4 3.4 4.2 3.4 Hellenic Petroleum USD/bbl 3.3 2.1 2.8 4.0 6.0 4.0 3.0 3.0 4.0 3.0 Tupras USD/bbl 10.4 9.4 11.7 15.4 11.3 11.3 11.3 11.3 11.3 12.1 Petro Rabigh USD/bbl 1.7 1.0 2.5 4.0 3.5 Refining EBITDA margins
PKN Orlen USD/bbl 3.4 0.5 3.2 4.6 6.2 3.1 2.3 2.3 3.5 2.3 MOL Group USD/bbl 3.9 3.3 3.6 5.7 5.6 4.4 3.7 3.7 4.4 3.7 Hellenic Petroleum USD/bbl 5.3 0.8 3.1 5.4 7.6 5.8 4.3 4.0 5.4 3.9 Tupras USD/bbl 4.2 2.8 4.0 5.5 4.6 5.5 Petro Rabigh USD/bbl -0.4 -2.8 0.5 2.0 1.5 Petrochemical margins PKN Orlen EUR/t 686 730 781 844 761 667 745 824 749 846 MOL Group EUR/t 262 295 364 535 374 271 311 375 334 358 Petro Rabigh EUR/t 418 508 581 648 599 552 552 540 561 616 Downstream EBITDA PKN Orlen USD/bbl 7.9 5.1 8.1 7.2 9.9 5.2 6.3 6.8 7.1 6.9 MOL Group USD/bbl 4.4 4.3 6.3 6.6 6.1 6.3 5.3 4.3 6.0 5.8 Hellenic Petroleum USD/bbl 3.9 1.4 3.5 4.8 7.9 6.2 5.5 4.9 6.1 5.2 Tupras USD/bbl 4.2 2.8 4.0 5.5 4.6 5.5
Source: Company data, HSBC estimates
Historical performance: 2007-2014
The analysis of the historical financial performance of EEMEA refiners suggests that organically the total
clean downstream LIFO EBITDA of MOL Group, PKN Orlen, Hellenic Petroleum and Tupras was 14%
lower than in 2007, at the end of the prior cycle (we exclude from our analysis the 2008 performance
when crack spreads and crude oil prices were very volatile). The refining and marketing EBITDA fell by
17%, petrochemicals EBITDA fell by 18% but retail segment added 33% over the period. Overall, it
appears that the sector has been trying to partly offset weaker refining margins by investments in retail
operations, which are less volatile. The contribution of retail operations to downstream earnings rose from
16% in 2007 to 24% in 2014 and we expect this trend to continue.
Change in refiners’ adjusted (LIFO or CCS) EBITDA between 2007 and 2014
MOL Group Hellenic Petroleum PKN Orlen Tupras Total
Downstream - total -38% -23% 11% -36% -18% Downstream - organic -30% -23% 16% -29% -13% Refining -32% -36% 32% -29% -21% Retail & marketing 14% 0% 58% 33% Petrochemicals -48% 23% -9% -18%
Source: Company data, HSBC estimates
Of the four companies in this peer group PKN Orlen was the best downstream performer in 2007-2014,
having managed to sustain its earnings in the refining segment. This was partly helped by resilient fuel
demand in Poland where GDP continued to grow even during the 2007-2009 financial crisis and fuel
consumption rose by 18% during 2007-2011 while in Hungary, for instance, motor fuel demand fell by 11%.
29
Natural Resources & Energy EEMEA – Oil and Gas 7 April 2015
abc
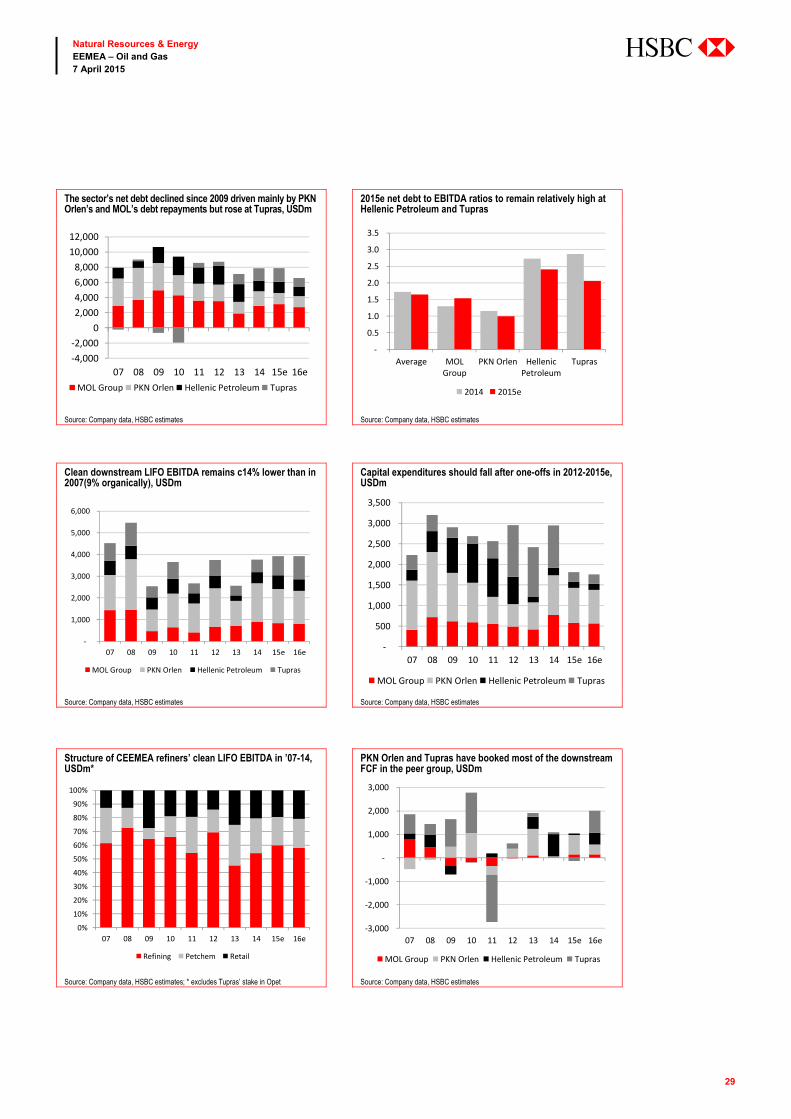
The sector’s net debt declined since 2009 driven mainly by PKN Orlen’s and MOL’s debt repayments but rose at Tupras, USDm
2015e net debt to EBITDA ratios to remain relatively high at Hellenic Petroleum and Tupras
Source: Company data, HSBC estimates Source: Company data, HSBC estimates
Clean downstream LIFO EBITDA remains c14% lower than in 2007(9% organically), USDm
Capital expenditures should fall after one-offs in 2012-2015e, USDm
Source: Company data, HSBC estimates Source: Company data, HSBC estimates
Structure of CEEMEA refiners’ clean LIFO EBITDA in ’07-14, USDm*
PKN Orlen and Tupras have booked most of the downstream FCF in the peer group, USDm
Source: Company data, HSBC estimates; * excludes Tupras’ stake in Opet Source: Company data, HSBC estimates
-4,000-2,000
02,0004,0006,0008,000
10,00012,000
07 08 09 10 11 12 13 14 15e 16eMOL Group PKN Orlen Hellenic Petroleum Tupras
-
0.5
1.0
1.5
2.0
2.5
3.0
3.5
Average MOLGroup
PKN Orlen HellenicPetroleum
Tupras
2014 2015e
-
1,000
2,000
3,000
4,000
5,000
6,000
07 08 09 10 11 12 13 14 15e 16e
MOL Group PKN Orlen Hellenic Petroleum Tupras
-
500
1,000
1,500
2,000
2,500
3,000
3,500
07 08 09 10 11 12 13 14 15e 16e
MOL Group PKN Orlen Hellenic Petroleum Tupras
0%
10%
20%
30%
40%
50%
60%
70%
80%
90%
100%
07 08 09 10 11 12 13 14 15e 16e
Refining Petchem Retail
-3,000
-2,000
-1,000
-
1,000
2,000
3,000
07 08 09 10 11 12 13 14 15e 16e
MOL Group PKN Orlen Hellenic Petroleum Tupras
30
Natural Resources & Energy EEMEA – Oil and Gas 7 April 2015
abc
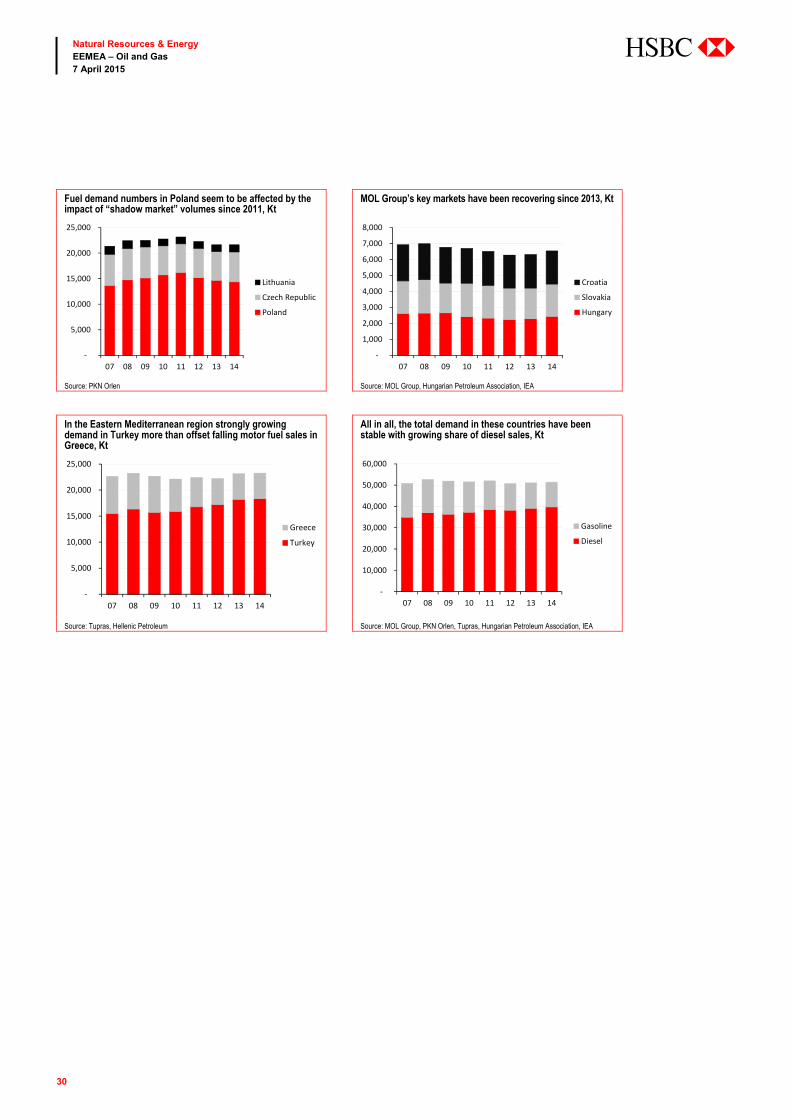
In the Eastern Mediterranean region strongly growing demand in Turkey more than offset falling motor fuel sales in Greece, Kt
All in all, the total demand in these countries have been stable with growing share of diesel sales, Kt
Source: Tupras, Hellenic Petroleum Source: MOL Group, PKN Orlen, Tupras, Hungarian Petroleum Association, IEA
-
5,000
10,000
15,000
20,000
25,000
07 08 09 10 11 12 13 14
Greece
Turkey
-
10,000
20,000
30,000
40,000
50,000
60,000
07 08 09 10 11 12 13 14
Gasoline
Diesel
Fuel demand numbers in Poland seem to be affected by the impact of “shadow market” volumes since 2011, Kt
MOL Group’s key markets have been recovering since 2013, Kt
Source: PKN Orlen Source: MOL Group, Hungarian Petroleum Association, IEA
-
5,000
10,000
15,000
20,000
25,000
07 08 09 10 11 12 13 14
Lithuania
Czech Republic
Poland
-
1,000
2,000
3,000
4,000
5,000
6,000
7,000
8,000
07 08 09 10 11 12 13 14
Croatia
Slovakia
Hungary
31
Natural Resources & Energy EEMEA – Oil and Gas 7 April 2015
abc
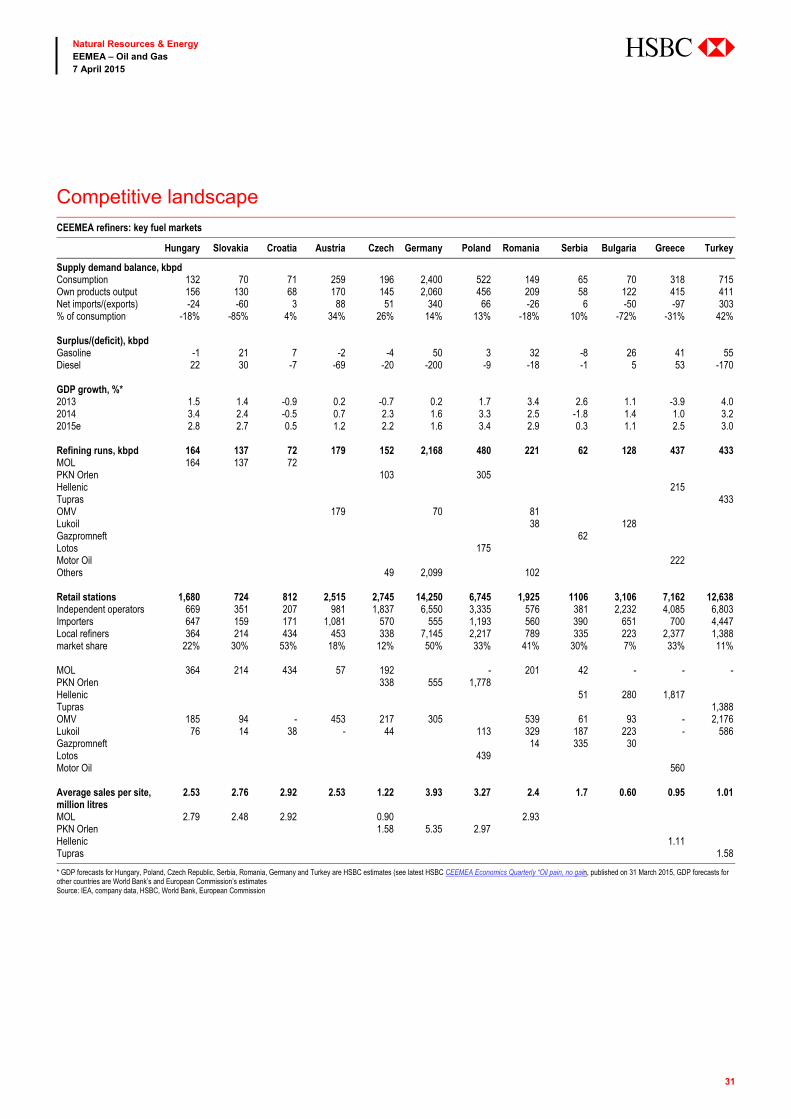
Competitive landscape CEEMEA refiners: key fuel markets
Hungary Slovakia Croatia Austria Czech Germany Poland Romania Serbia Bulgaria Greece Turkey
Supply demand balance, kbpd Consumption 132 70 71 259 196 2,400 522 149 65 70 318 715Own products output 156 130 68 170 145 2,060 456 209 58 122 415 411Net imports/(exports) -24 -60 3 88 51 340 66 -26 6 -50 -97 303% of consumption -18% -85% 4% 34% 26% 14% 13% -18% 10% -72% -31% 42% Surplus/(deficit), kbpd Gasoline -1 21 7 -2 -4 50 3 32 -8 26 41 55Diesel 22 30 -7 -69 -20 -200 -9 -18 -1 5 53 -170 GDP growth, %* 2013 1.5 1.4 -0.9 0.2 -0.7 0.2 1.7 3.4 2.6 1.1 -3.9 4.02014 3.4 2.4 -0.5 0.7 2.3 1.6 3.3 2.5 -1.8 1.4 1.0 3.22015e 2.8 2.7 0.5 1.2 2.2 1.6 3.4 2.9 0.3 1.1 2.5 3.0 Refining runs, kbpd 164 137 72 179 152 2,168 480 221 62 128 437 433 MOL 164 137 72 PKN Orlen 103 305 Hellenic 215 Tupras 433 OMV 179 70 81 Lukoil 38 128 Gazpromneft 62 Lotos 175 Motor Oil 222 Others 49 2,099 102 Retail stations 1,680 724 812 2,515 2,745 14,250 6,745 1,925 1106 3,106 7,162 12,638 Independent operators 669 351 207 981 1,837 6,550 3,335 576 381 2,232 4,085 6,803 Importers 647 159 171 1,081 570 555 1,193 560 390 651 700 4,447 Local refiners 364 214 434 453 338 7,145 2,217 789 335 223 2,377 1,388 market share 22% 30% 53% 18% 12% 50% 33% 41% 30% 7% 33% 11% MOL 364 214 434 57 192 - 201 42 - - -PKN Orlen 338 555 1,778 Hellenic 51 280 1,817 Tupras 1,388 OMV 185 94 - 453 217 305 539 61 93 - 2,176 Lukoil 76 14 38 - 44 113 329 187 223 - 586 Gazpromneft 14 335 30 Lotos 439 Motor Oil 560 Average sales per site, million litres
2.53 2.76 2.92 2.53 1.22 3.93 3.27 2.4 1.7 0.60 0.95 1.01
MOL 2.79 2.48 2.92 0.90 2.93 PKN Orlen 1.58 5.35 2.97 Hellenic 1.11 Tupras 1.58
* GDP forecasts for Hungary, Poland, Czech Republic, Serbia, Romania, Germany and Turkey are HSBC estimates (see latest HSBC CEEMEA Economics Quarterly “Oil pain, no gain, published on 31 March 2015, GDP forecasts for other countries are World Bank’s and European Commission’s estimates Source: IEA, company data, HSBC, World Bank, European Commission
32
Natural Resources & Energy EEMEA – Oil and Gas 7 April 2015
abc
Investment thesis
After completion of the Elefsina upgrade project the company has entered the delivery phase, which should
be supported by a recovery in refining margins and a weaker EUR. Although there are medium-term risks
from the additional supply of diesel to the region from 2017, Hellenic Petroleum’s margins should be
supported by its close proximity to the strongly growing fuel market of Turkey in 2015-16e. The company’s
EUR1.85bn cash position and EUR250-350m yearly FCF generation during the period leaves it with enough
resources to service its debt schedule in 2015-2018. The resumption of dividend payments (5.9% dividend
yield with respect to 2014 results) underscores the improved financial position of the company and makes
the stock an attractive value play, in our view, despite the political uncertainties in Greece,
Introducing Hellenic Petroleum
The largest refiner in Greece. Hellenic Petroleum is the largest refiner in Greece. The Greek
government owns a 35.5% stake and a 42.6% stake belongs to Pan-European Oil & Industrial Holdings
(POIH) owned by Spiro Latsis. The Greek government has mentioned plans to privatise its stake in the
company in the past and overhang risks should be mentioned but the timeline of the possible transaction
is very unclear.
The company operates three of the country’s four refineries that constitute 66% of Greece’s total refining
capacity. Two of Hellenic most complex and largest refineries in the south of the country – Aspropyrgos
and Elefsina – are located close to each other and are operated as an integrated “South Hub” with over
100% capacity utilisation in H2 2014. Its third refinery in Thessaloniki has no cracking capacity and
operates only when there is a favourable external environment with average capacity utilisation of 37% in
2014 (60% in Q4 2014). With a market share of c65%, Hellenic Petroleum has a leadership position in
the domestic fuel market where it competes with Motor Oil (not rated), which operates Greece’s largest
refinery (172kbpd). As Greek domestic demand has fallen by 42% since 2009, the country’s refining
sector has been increasingly export-oriented with Hellenic Petroleum’s export sales volumes reaching
50% in 2014 from 18% in 2009. Hellenic Petroleum also operates a 220Kpta polypropylene plant which
exports 50-60% of its output.
Hellenic Petroleum
The company is in the delivery phase following completion of the
Elefsina upgrade project, deleveraging will now be in focus
Weak domestic demand has been offset by growing export
supplies to the diesel short region but beware of mid-term risks
Initiate with Buy rating and EUR5.6 fair value target price
33
Natural Resources & Energy EEMEA – Oil and Gas 7 April 2015
abc
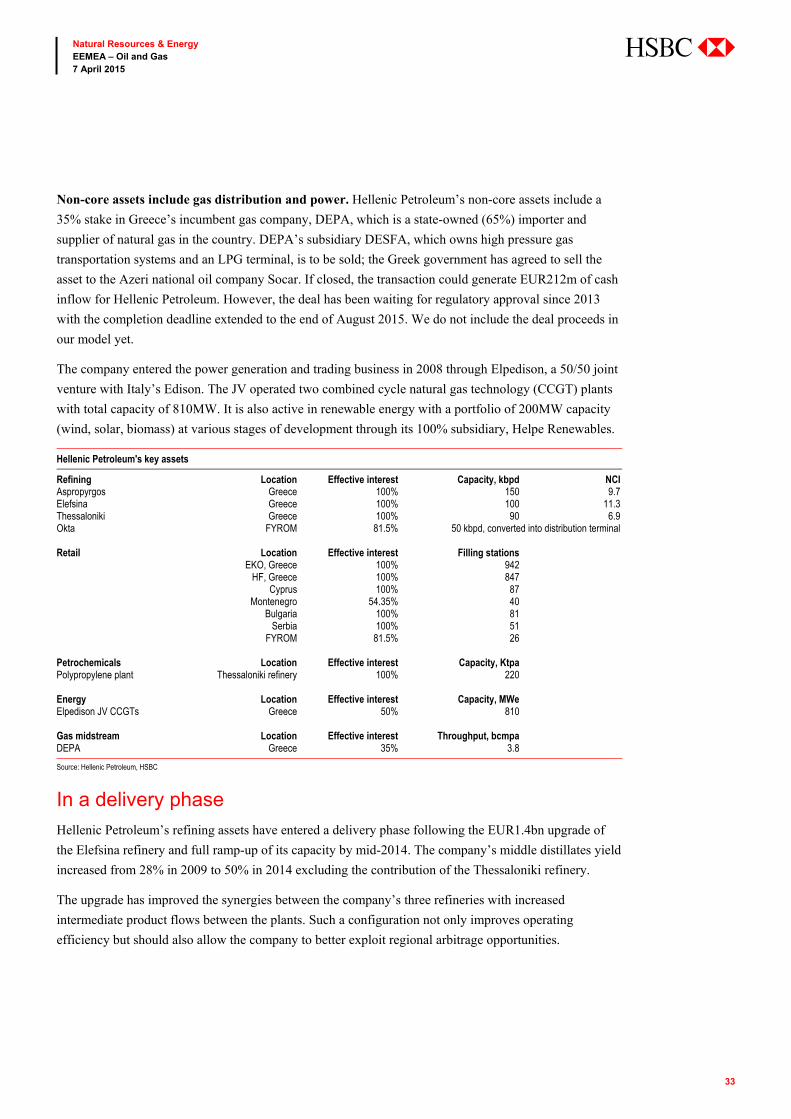
Non-core assets include gas distribution and power. Hellenic Petroleum’s non-core assets include a
35% stake in Greece’s incumbent gas company, DEPA, which is a state-owned (65%) importer and
supplier of natural gas in the country. DEPA’s subsidiary DESFA, which owns high pressure gas
transportation systems and an LPG terminal, is to be sold; the Greek government has agreed to sell the
asset to the Azeri national oil company Socar. If closed, the transaction could generate EUR212m of cash
inflow for Hellenic Petroleum. However, the deal has been waiting for regulatory approval since 2013
with the completion deadline extended to the end of August 2015. We do not include the deal proceeds in
our model yet.
The company entered the power generation and trading business in 2008 through Elpedison, a 50/50 joint
venture with Italy’s Edison. The JV operated two combined cycle natural gas technology (CCGT) plants
with total capacity of 810MW. It is also active in renewable energy with a portfolio of 200MW capacity
(wind, solar, biomass) at various stages of development through its 100% subsidiary, Helpe Renewables.
Hellenic Petroleum's key assets
Refining Location Effective interest Capacity, kbpd NCI Aspropyrgos Greece 100% 150 9.7 Elefsina Greece 100% 100 11.3 Thessaloniki Greece 100% 90 6.9 Okta FYROM 81.5% 50 kbpd, converted into distribution terminal Retail Location Effective interest Filling stations EKO, Greece 100% 942 HF, Greece 100% 847 Cyprus 100% 87 Montenegro 54.35% 40 Bulgaria 100% 81 Serbia 100% 51 FYROM 81.5% 26 Petrochemicals Location Effective interest Capacity, Ktpa Polypropylene plant Thessaloniki refinery 100% 220 Energy Location Effective interest Capacity, MWe Elpedison JV CCGTs Greece 50% 810 Gas midstream Location Effective interest Throughput, bcmpa DEPA Greece 35% 3.8
Source: Hellenic Petroleum, HSBC
In a delivery phase
Hellenic Petroleum’s refining assets have entered a delivery phase following the EUR1.4bn upgrade of
the Elefsina refinery and full ramp-up of its capacity by mid-2014. The company’s middle distillates yield
increased from 28% in 2009 to 50% in 2014 excluding the contribution of the Thessaloniki refinery.
The upgrade has improved the synergies between the company’s three refineries with increased
intermediate product flows between the plants. Such a configuration not only improves operating
efficiency but should also allow the company to better exploit regional arbitrage opportunities.
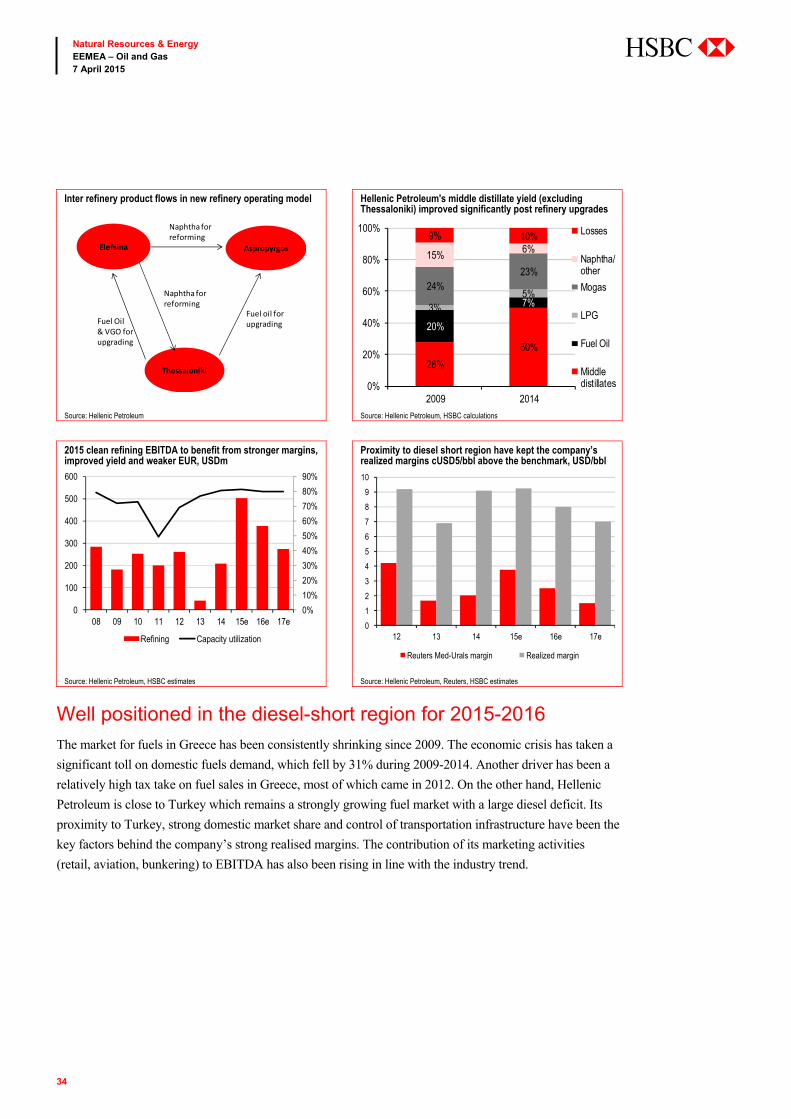
34
Natural Resources & Energy EEMEA – Oil and Gas 7 April 2015
abc
Inter refinery product flows in new refinery operating model Hellenic Petroleum's middle distillate yield (excluding Thessaloniki) improved significantly post refinery upgrades
Source: Hellenic Petroleum Source: Hellenic Petroleum, HSBC calculations
2015 clean refining EBITDA to benefit from stronger margins, improved yield and weaker EUR, USDm
Proximity to diesel short region have kept the company’s realized margins cUSD5/bbl above the benchmark, USD/bbl
Source: Hellenic Petroleum, HSBC estimates Source: Hellenic Petroleum, Reuters, HSBC estimates
Well positioned in the diesel-short region for 2015-2016
The market for fuels in Greece has been consistently shrinking since 2009. The economic crisis has taken a
significant toll on domestic fuels demand, which fell by 31% during 2009-2014. Another driver has been a
relatively high tax take on fuel sales in Greece, most of which came in 2012. On the other hand, Hellenic
Petroleum is close to Turkey which remains a strongly growing fuel market with a large diesel deficit. Its
proximity to Turkey, strong domestic market share and control of transportation infrastructure have been the
key factors behind the company’s strong realised margins. The contribution of its marketing activities
(retail, aviation, bunkering) to EBITDA has also been rising in line with the industry trend.
Elefsina Aspropyrgos
Thessaloniki
Fuel Oil & VGO for upgrading
Naphtha for reforming
Naphtha for reforming
Fuel oil for upgrading
28%
50%
20%
7%3%5%
24%23%
15%6%
9% 10%
0%
20%
40%
60%
80%
100%
2009 2014
Losses
Naphtha/other
Mogas
LPG
Fuel Oil
Middledistillates
0%
10%
20%
30%
40%
50%
60%
70%
80%
90%
0
100
200
300
400
500
600
08 09 10 11 12 13 14 15e 16e 17e
Refining Capacity utilization0
1
2
3
4
5
6
7
8
9
10
12 13 14 15e 16e 17e
Reuters Med-Urals margin Realized margin
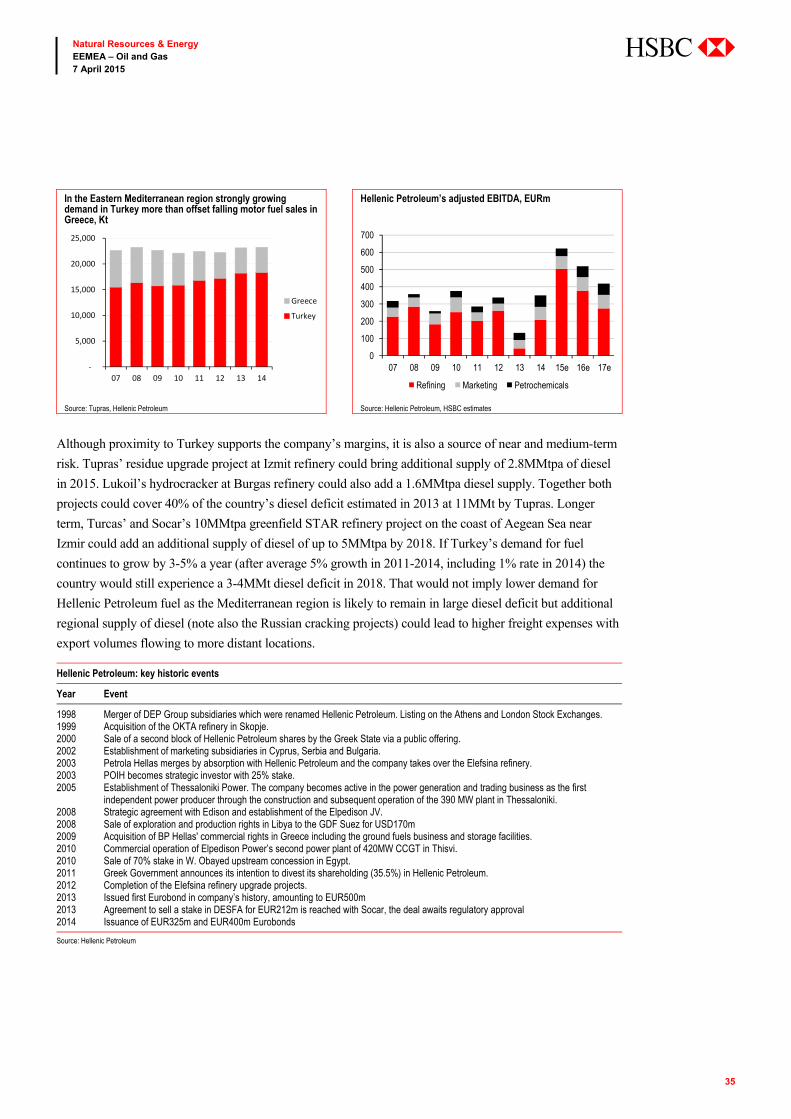
35
Natural Resources & Energy EEMEA – Oil and Gas 7 April 2015
abc
In the Eastern Mediterranean region strongly growing demand in Turkey more than offset falling motor fuel sales in Greece, Kt
Hellenic Petroleum’s adjusted EBITDA, EURm
Source: Tupras, Hellenic Petroleum Source: Hellenic Petroleum, HSBC estimates
Although proximity to Turkey supports the company’s margins, it is also a source of near and medium-term
risk. Tupras’ residue upgrade project at Izmit refinery could bring additional supply of 2.8MMtpa of diesel
in 2015. Lukoil’s hydrocracker at Burgas refinery could also add a 1.6MMtpa diesel supply. Together both
projects could cover 40% of the country’s diesel deficit estimated in 2013 at 11MMt by Tupras. Longer
term, Turcas’ and Socar’s 10MMtpa greenfield STAR refinery project on the coast of Aegean Sea near
Izmir could add an additional supply of diesel of up to 5MMtpa by 2018. If Turkey’s demand for fuel
continues to grow by 3-5% a year (after average 5% growth in 2011-2014, including 1% rate in 2014) the
country would still experience a 3-4MMt diesel deficit in 2018. That would not imply lower demand for
Hellenic Petroleum fuel as the Mediterranean region is likely to remain in large diesel deficit but additional
regional supply of diesel (note also the Russian cracking projects) could lead to higher freight expenses with
export volumes flowing to more distant locations.
Hellenic Petroleum: key historic events
Year Event
1998 Merger of DEP Group subsidiaries which were renamed Hellenic Petroleum. Listing on the Athens and London Stock Exchanges. 1999 Acquisition of the ΟΚΤΑ refinery in Skopje. 2000 Sale of a second block of Hellenic Petroleum shares by the Greek State via a public offering.2002 Establishment of marketing subsidiaries in Cyprus, Serbia and Bulgaria.2003 Petrola Hellas merges by absorption with Hellenic Petroleum and the company takes over the Elefsina refinery.2003 POIH becomes strategic investor with 25% stake. 2005 Establishment of Thessaloniki Power. The company becomes active in the power generation and trading business as the first
independent power producer through the construction and subsequent operation of the 390 MW plant in Thessaloniki. 2008 Strategic agreement with Edison and establishment of the Elpedison JV.2008 Sale of exploration and production rights in Libya to the GDF Suez for USD170m2009 Acquisition of BP Hellas' commercial rights in Greece including the ground fuels business and storage facilities.2010 Commercial operation of Elpedison Power’s second power plant of 420MW CCGT in Thisvi.2010 Sale of 70% stake in W. Obayed upstream concession in Egypt.2011 Greek Government announces its intention to divest its shareholding (35.5%) in Hellenic Petroleum.2012 Completion of the Elefsina refinery upgrade projects. 2013 Issued first Eurobond in company’s history, amounting to EUR500m2013 Agreement to sell a stake in DESFA for EUR212m is reached with Socar, the deal awaits regulatory approval2014 Issuance of EUR325m and EUR400m Eurobonds
Source: Hellenic Petroleum
-
5,000
10,000
15,000
20,000
25,000
07 08 09 10 11 12 13 14
Greece
Turkey
0
100
200
300
400
500
600
700
07 08 09 10 11 12 13 14 15e 16e 17e
Refining Marketing Petrochemicals
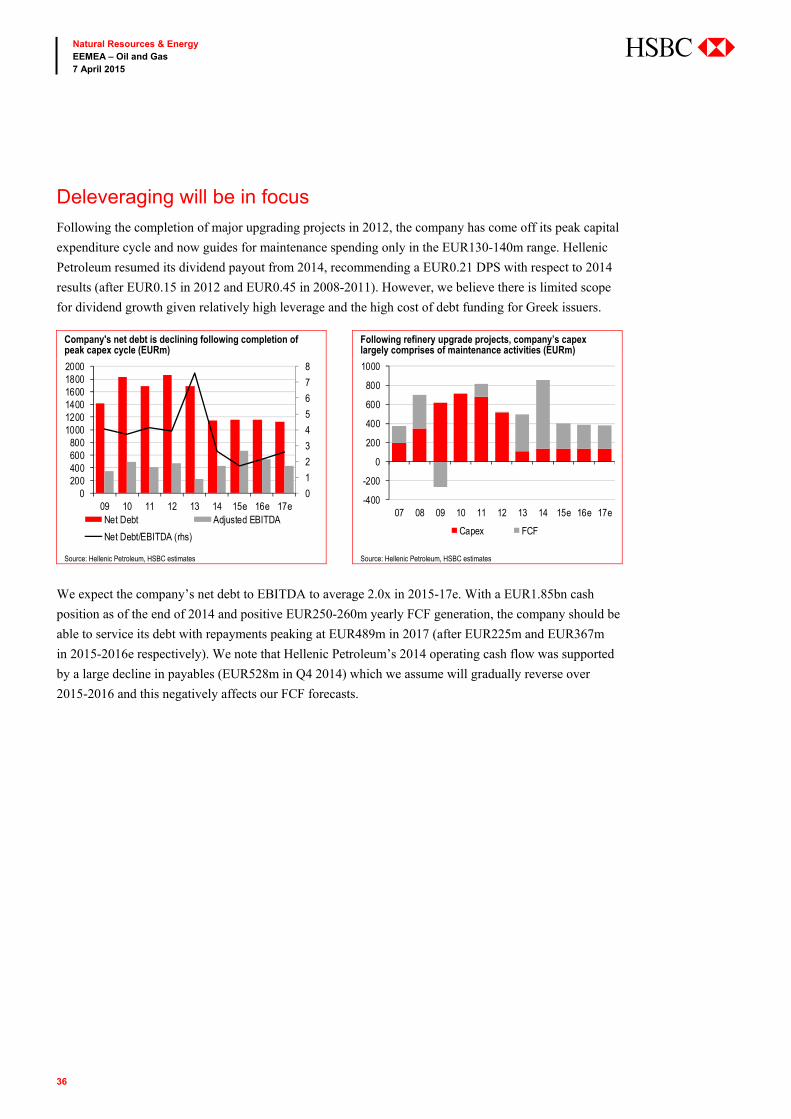
36
Natural Resources & Energy EEMEA – Oil and Gas 7 April 2015
abc
Deleveraging will be in focus
Following the completion of major upgrading projects in 2012, the company has come off its peak capital
expenditure cycle and now guides for maintenance spending only in the EUR130-140m range. Hellenic
Petroleum resumed its dividend payout from 2014, recommending a EUR0.21 DPS with respect to 2014
results (after EUR0.15 in 2012 and EUR0.45 in 2008-2011). However, we believe there is limited scope
for dividend growth given relatively high leverage and the high cost of debt funding for Greek issuers.
We expect the company’s net debt to EBITDA to average 2.0x in 2015-17e. With a EUR1.85bn cash
position as of the end of 2014 and positive EUR250-260m yearly FCF generation, the company should be
able to service its debt with repayments peaking at EUR489m in 2017 (after EUR225m and EUR367m
in 2015-2016e respectively). We note that Hellenic Petroleum’s 2014 operating cash flow was supported
by a large decline in payables (EUR528m in Q4 2014) which we assume will gradually reverse over
2015-2016 and this negatively affects our FCF forecasts.
Company's net debt is declining following completion of peak capex cycle (EURm)
Following refinery upgrade projects, company’s capex largely comprises of maintenance activities (EURm)
Source: Hellenic Petroleum, HSBC estimates Source: Hellenic Petroleum, HSBC estimates
0
1
2
3
4
5
6
7
8
0200400600800
100012001400160018002000
09 10 11 12 13 14 15e 16e 17eNet Debt Adjusted EBITDA
Net Debt/EBITDA (rhs)
-400
-200
0
200
400
600
800
1000
07 08 09 10 11 12 13 14 15e 16e 17e
Capex FCF
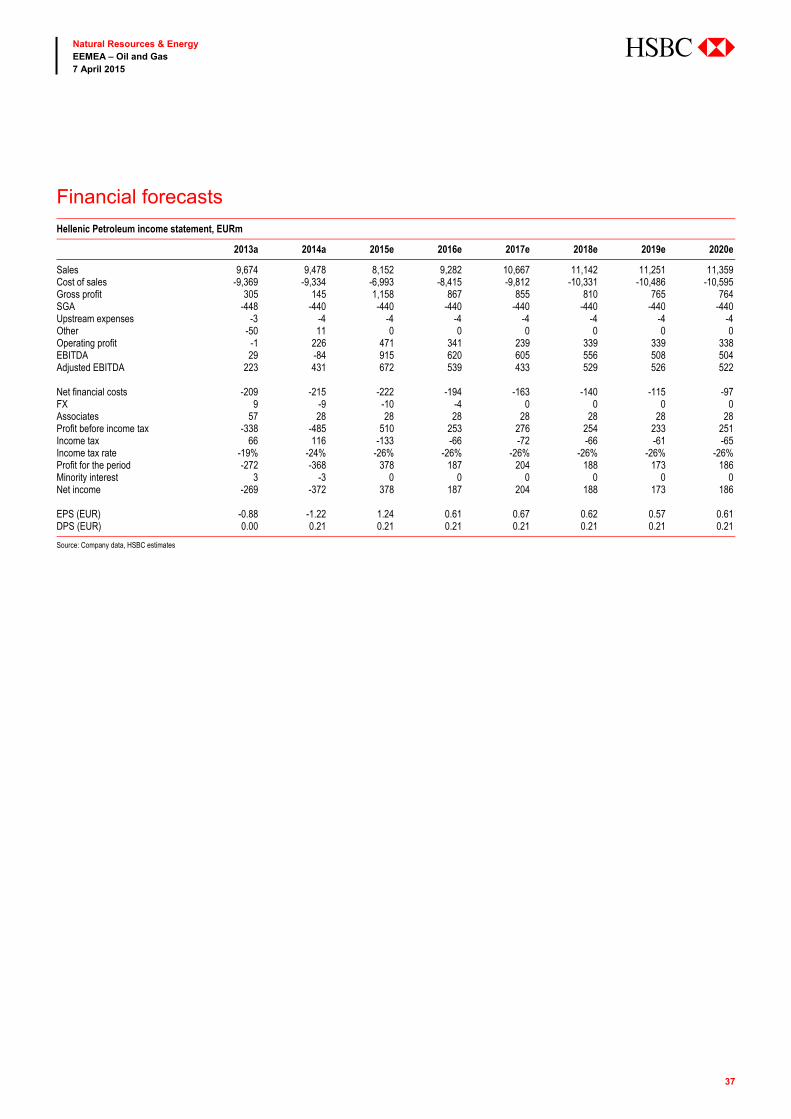
37
Natural Resources & Energy EEMEA – Oil and Gas 7 April 2015
abc
Financial forecasts Hellenic Petroleum income statement, EURm
2013a 2014a 2015e 2016e 2017e 2018e 2019e 2020e
Sales 9,674 9,478 8,152 9,282 10,667 11,142 11,251 11,359Cost of sales -9,369 -9,334 -6,993 -8,415 -9,812 -10,331 -10,486 -10,595Gross profit 305 145 1,158 867 855 810 765 764SGA -448 -440 -440 -440 -440 -440 -440 -440Upstream expenses -3 -4 -4 -4 -4 -4 -4 -4Other -50 11 0 0 0 0 0 0Operating profit -1 226 471 341 239 339 339 338EBITDA 29 -84 915 620 605 556 508 504Adjusted EBITDA 223 431 672 539 433 529 526 522 Net financial costs -209 -215 -222 -194 -163 -140 -115 -97FX 9 -9 -10 -4 0 0 0 0Associates 57 28 28 28 28 28 28 28Profit before income tax -338 -485 510 253 276 254 233 251Income tax 66 116 -133 -66 -72 -66 -61 -65Income tax rate -19% -24% -26% -26% -26% -26% -26% -26%Profit for the period -272 -368 378 187 204 188 173 186Minority interest 3 -3 0 0 0 0 0 0Net income -269 -372 378 187 204 188 173 186 EPS (EUR) -0.88 -1.22 1.24 0.61 0.67 0.62 0.57 0.61DPS (EUR) 0.00 0.21 0.21 0.21 0.21 0.21 0.21 0.21
Source: Company data, HSBC estimates
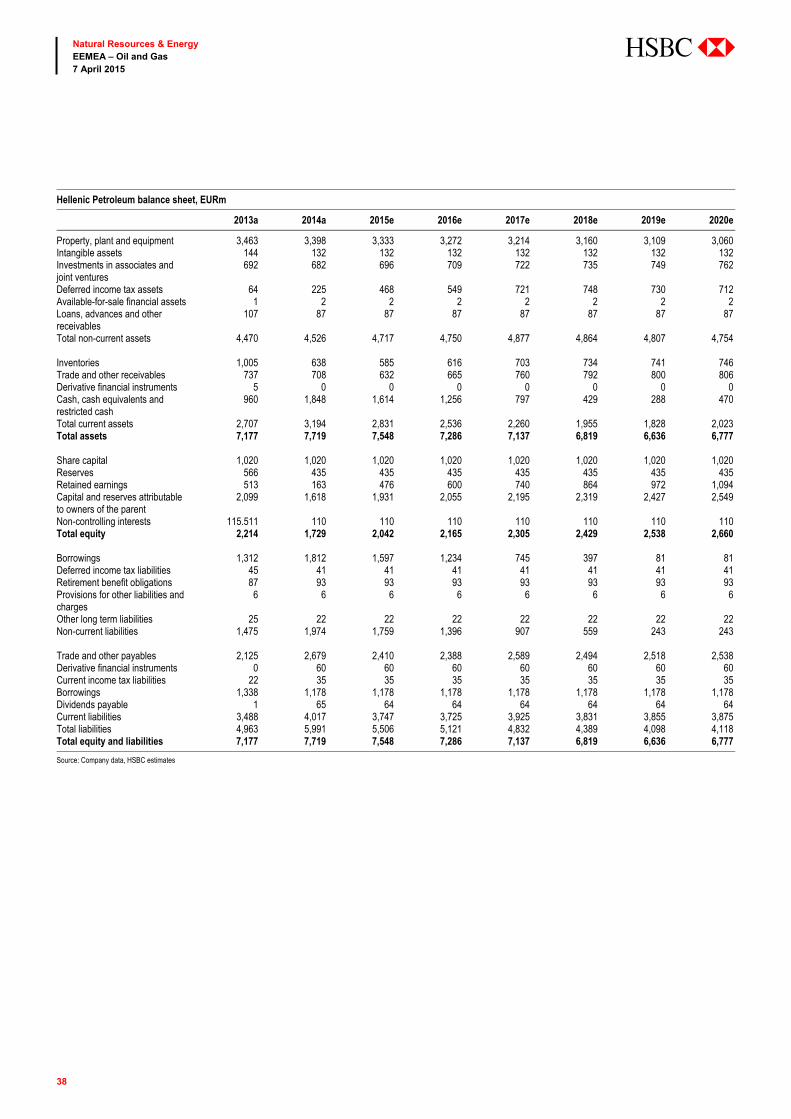
38
Natural Resources & Energy EEMEA – Oil and Gas 7 April 2015
abc
Hellenic Petroleum balance sheet, EURm
2013a 2014a 2015e 2016e 2017e 2018e 2019e 2020e
Property, plant and equipment 3,463 3,398 3,333 3,272 3,214 3,160 3,109 3,060Intangible assets 144 132 132 132 132 132 132 132Investments in associates and joint ventures
692 682 696 709 722 735 749 762
Deferred income tax assets 64 225 468 549 721 748 730 712Available-for-sale financial assets 1 2 2 2 2 2 2 2Loans, advances and other receivables
107 87 87 87 87 87 87 87
Total non-current assets 4,470 4,526 4,717 4,750 4,877 4,864 4,807 4,754 Inventories 1,005 638 585 616 703 734 741 746Trade and other receivables 737 708 632 665 760 792 800 806Derivative financial instruments 5 0 0 0 0 0 0 0Cash, cash equivalents and restricted cash
960 1,848 1,614 1,256 797 429 288 470
Total current assets 2,707 3,194 2,831 2,536 2,260 1,955 1,828 2,023Total assets 7,177 7,719 7,548 7,286 7,137 6,819 6,636 6,777 Share capital 1,020 1,020 1,020 1,020 1,020 1,020 1,020 1,020Reserves 566 435 435 435 435 435 435 435Retained earnings 513 163 476 600 740 864 972 1,094Capital and reserves attributable to owners of the parent
2,099 1,618 1,931 2,055 2,195 2,319 2,427 2,549
Non-controlling interests 115.511 110 110 110 110 110 110 110Total equity 2,214 1,729 2,042 2,165 2,305 2,429 2,538 2,660 Borrowings 1,312 1,812 1,597 1,234 745 397 81 81Deferred income tax liabilities 45 41 41 41 41 41 41 41Retirement benefit obligations 87 93 93 93 93 93 93 93Provisions for other liabilities and charges
6 6 6 6 6 6 6 6
Other long term liabilities 25 22 22 22 22 22 22 22Non-current liabilities 1,475 1,974 1,759 1,396 907 559 243 243 Trade and other payables 2,125 2,679 2,410 2,388 2,589 2,494 2,518 2,538Derivative financial instruments 0 60 60 60 60 60 60 60Current income tax liabilities 22 35 35 35 35 35 35 35Borrowings 1,338 1,178 1,178 1,178 1,178 1,178 1,178 1,178Dividends payable 1 65 64 64 64 64 64 64Current liabilities 3,488 4,017 3,747 3,725 3,925 3,831 3,855 3,875Total liabilities 4,963 5,991 5,506 5,121 4,832 4,389 4,098 4,118Total equity and liabilities 7,177 7,719 7,548 7,286 7,137 6,819 6,636 6,777
Source: Company data, HSBC estimates
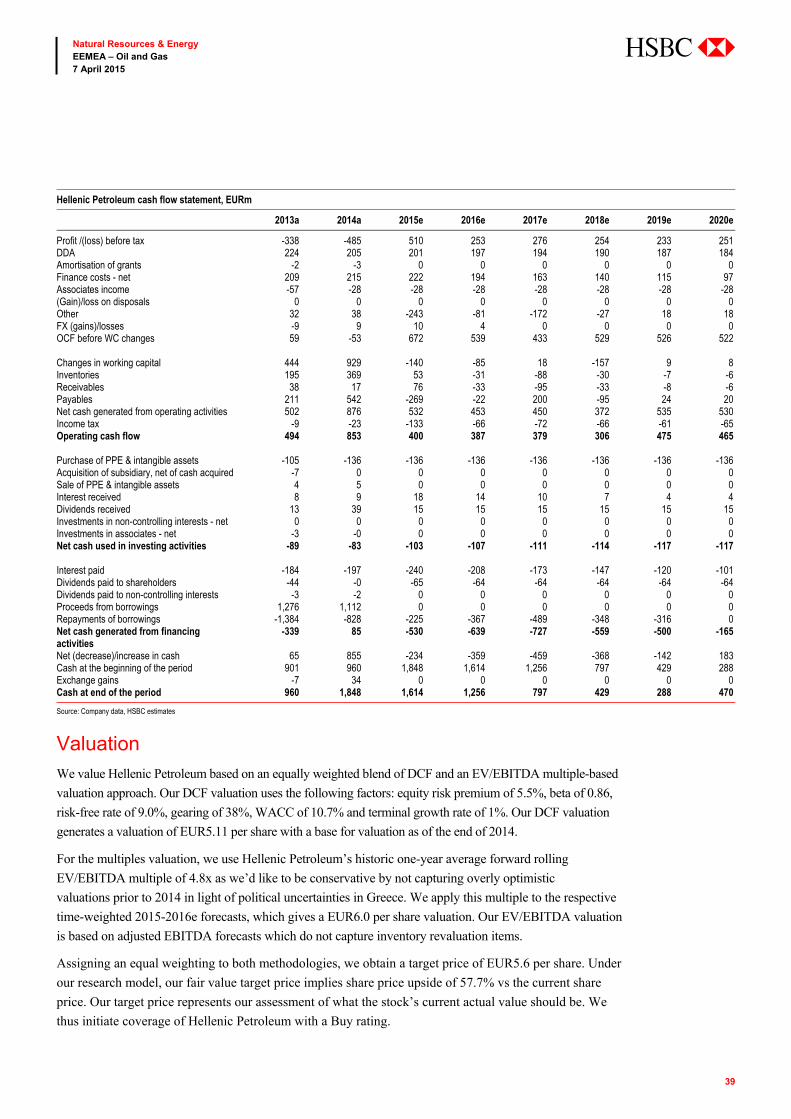
39
Natural Resources & Energy EEMEA – Oil and Gas 7 April 2015
abc
Hellenic Petroleum cash flow statement, EURm
2013a 2014a 2015e 2016e 2017e 2018e 2019e 2020e
Profit /(loss) before tax -338 -485 510 253 276 254 233 251DDA 224 205 201 197 194 190 187 184Amortisation of grants -2 -3 0 0 0 0 0 0Finance costs - net 209 215 222 194 163 140 115 97Associates income -57 -28 -28 -28 -28 -28 -28 -28(Gain)/loss on disposals 0 0 0 0 0 0 0 0Other 32 38 -243 -81 -172 -27 18 18FX (gains)/losses -9 9 10 4 0 0 0 0OCF before WC changes 59 -53 672 539 433 529 526 522 Changes in working capital 444 929 -140 -85 18 -157 9 8Inventories 195 369 53 -31 -88 -30 -7 -6Receivables 38 17 76 -33 -95 -33 -8 -6Payables 211 542 -269 -22 200 -95 24 20Net cash generated from operating activities 502 876 532 453 450 372 535 530Income tax -9 -23 -133 -66 -72 -66 -61 -65Operating cash flow 494 853 400 387 379 306 475 465 Purchase of PPE & intangible assets -105 -136 -136 -136 -136 -136 -136 -136Acquisition of subsidiary, net of cash acquired -7 0 0 0 0 0 0 0Sale of PPE & intangible assets 4 5 0 0 0 0 0 0Interest received 8 9 18 14 10 7 4 4Dividends received 13 39 15 15 15 15 15 15Investments in non-controlling interests - net 0 0 0 0 0 0 0 0Investments in associates - net -3 -0 0 0 0 0 0 0Net cash used in investing activities -89 -83 -103 -107 -111 -114 -117 -117 Interest paid -184 -197 -240 -208 -173 -147 -120 -101Dividends paid to shareholders -44 -0 -65 -64 -64 -64 -64 -64Dividends paid to non-controlling interests -3 -2 0 0 0 0 0 0Proceeds from borrowings 1,276 1,112 0 0 0 0 0 0Repayments of borrowings -1,384 -828 -225 -367 -489 -348 -316 0Net cash generated from financing activities
-339 85 -530 -639 -727 -559 -500 -165
Net (decrease)/increase in cash 65 855 -234 -359 -459 -368 -142 183Cash at the beginning of the period 901 960 1,848 1,614 1,256 797 429 288Exchange gains -7 34 0 0 0 0 0 0Cash at end of the period 960 1,848 1,614 1,256 797 429 288 470
Source: Company data, HSBC estimates
Valuation We value Hellenic Petroleum based on an equally weighted blend of DCF and an EV/EBITDA multiple-based
valuation approach. Our DCF valuation uses the following factors: equity risk premium of 5.5%, beta of 0.86,
risk-free rate of 9.0%, gearing of 38%, WACC of 10.7% and terminal growth rate of 1%. Our DCF valuation
generates a valuation of EUR5.11 per share with a base for valuation as of the end of 2014.
For the multiples valuation, we use Hellenic Petroleum’s historic one-year average forward rolling
EV/EBITDA multiple of 4.8x as we’d like to be conservative by not capturing overly optimistic
valuations prior to 2014 in light of political uncertainties in Greece. We apply this multiple to the respective
time-weighted 2015-2016e forecasts, which gives a EUR6.0 per share valuation. Our EV/EBITDA valuation
is based on adjusted EBITDA forecasts which do not capture inventory revaluation items.
Assigning an equal weighting to both methodologies, we obtain a target price of EUR5.6 per share. Under
our research model, our fair value target price implies share price upside of 57.7% vs the current share
price. Our target price represents our assessment of what the stock’s current actual value should be. We
thus initiate coverage of Hellenic Petroleum with a Buy rating.
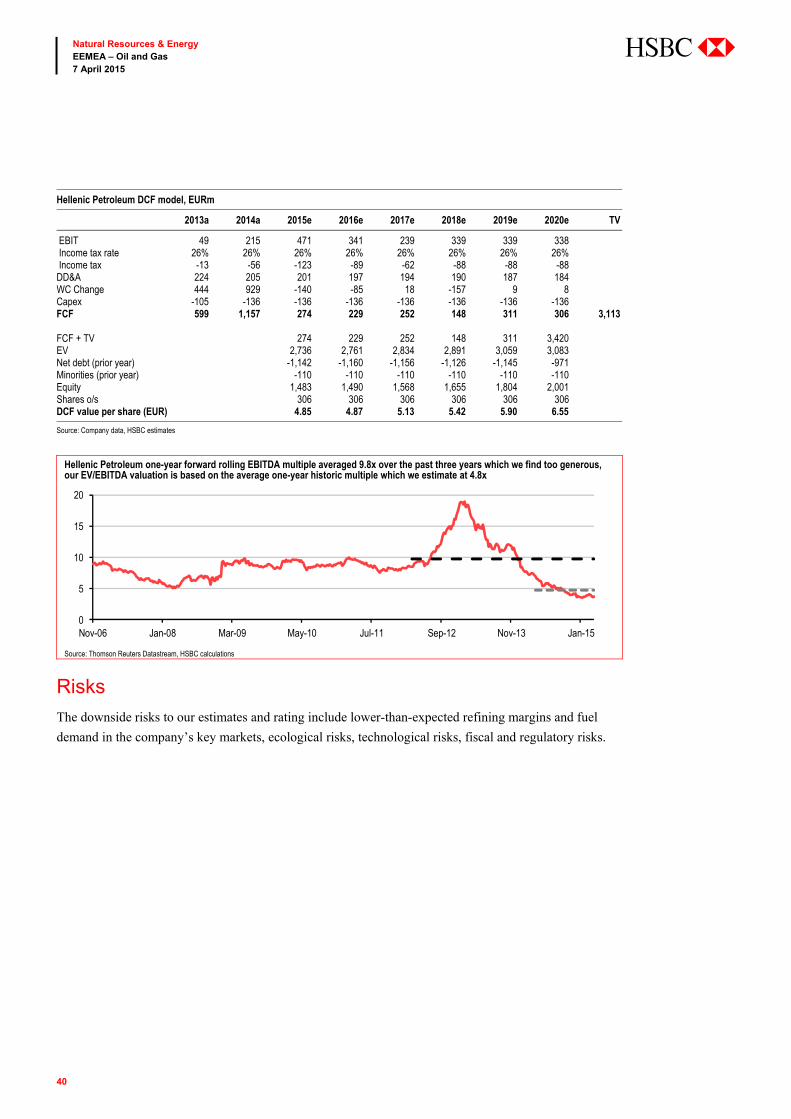
40
Natural Resources & Energy EEMEA – Oil and Gas 7 April 2015
abc
Hellenic Petroleum DCF model, EURm
2013a 2014a 2015e 2016e 2017e 2018e 2019e 2020e TV
EBIT 49 215 471 341 239 339 339 338 Income tax rate 26% 26% 26% 26% 26% 26% 26% 26% Income tax -13 -56 -123 -89 -62 -88 -88 -88 DD&A 224 205 201 197 194 190 187 184 WC Change 444 929 -140 -85 18 -157 9 8 Capex -105 -136 -136 -136 -136 -136 -136 -136 FCF 599 1,157 274 229 252 148 311 306 3,113 FCF + TV 274 229 252 148 311 3,420 EV 2,736 2,761 2,834 2,891 3,059 3,083 Net debt (prior year) -1,142 -1,160 -1,156 -1,126 -1,145 -971 Minorities (prior year) -110 -110 -110 -110 -110 -110 Equity 1,483 1,490 1,568 1,655 1,804 2,001 Shares o/s 306 306 306 306 306 306 DCF value per share (EUR) 4.85 4.87 5.13 5.42 5.90 6.55
Source: Company data, HSBC estimates
Hellenic Petroleum one-year forward rolling EBITDA multiple averaged 9.8x over the past three years which we find too generous, our EV/EBITDA valuation is based on the average one-year historic multiple which we estimate at 4.8x
Source: Thomson Reuters Datastream, HSBC calculations
Risks
The downside risks to our estimates and rating include lower-than-expected refining margins and fuel
demand in the company’s key markets, ecological risks, technological risks, fiscal and regulatory risks.
0
5
10
15
20
Nov-06 Jan-08 Mar-09 May-10 Jul-11 Sep-12 Nov-13 Jan-15
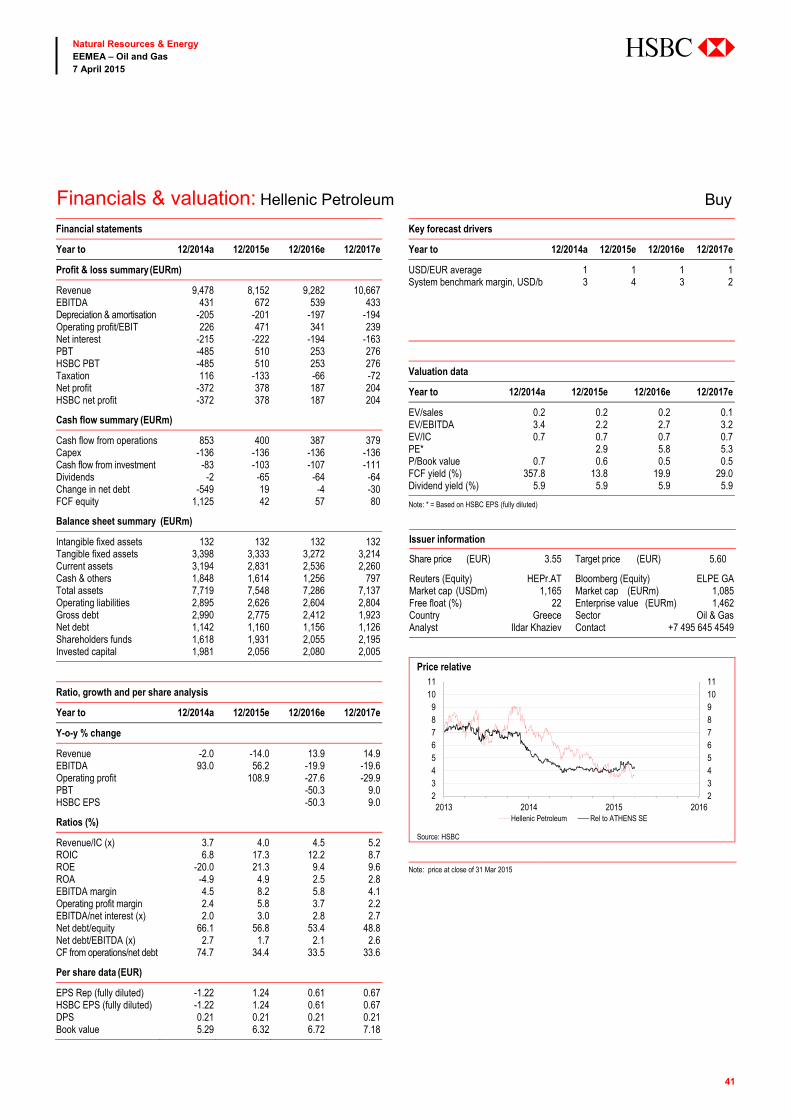
41
Natural Resources & Energy EEMEA – Oil and Gas 7 April 2015
abc
Financials & valuation: Hellenic Petroleum Buy Financial statements
Year to 12/2014a 12/2015e 12/2016e 12/2017e
Profit & loss summary (EURm)
Revenue 9,478 8,152 9,282 10,667EBITDA 431 672 539 433Depreciation & amortisation -205 -201 -197 -194Operating profit/EBIT 226 471 341 239Net interest -215 -222 -194 -163PBT -485 510 253 276HSBC PBT -485 510 253 276Taxation 116 -133 -66 -72Net profit -372 378 187 204HSBC net profit -372 378 187 204
Cash flow summary (EURm)
Cash flow from operations 853 400 387 379Capex -136 -136 -136 -136Cash flow from investment -83 -103 -107 -111Dividends -2 -65 -64 -64Change in net debt -549 19 -4 -30FCF equity 1,125 42 57 80
Balance sheet summary (EURm)
Intangible fixed assets 132 132 132 132Tangible fixed assets 3,398 3,333 3,272 3,214Current assets 3,194 2,831 2,536 2,260Cash & others 1,848 1,614 1,256 797Total assets 7,719 7,548 7,286 7,137Operating liabilities 2,895 2,626 2,604 2,804Gross debt 2,990 2,775 2,412 1,923Net debt 1,142 1,160 1,156 1,126Shareholders funds 1,618 1,931 2,055 2,195Invested capital 1,981 2,056 2,080 2,005
Ratio, growth and per share analysis
Year to 12/2014a 12/2015e 12/2016e 12/2017e
Y-o-y % change
Revenue -2.0 -14.0 13.9 14.9EBITDA 93.0 56.2 -19.9 -19.6Operating profit 108.9 -27.6 -29.9PBT -50.3 9.0HSBC EPS -50.3 9.0
Ratios (%)
Revenue/IC (x) 3.7 4.0 4.5 5.2ROIC 6.8 17.3 12.2 8.7ROE -20.0 21.3 9.4 9.6ROA -4.9 4.9 2.5 2.8EBITDA margin 4.5 8.2 5.8 4.1Operating profit margin 2.4 5.8 3.7 2.2EBITDA/net interest (x) 2.0 3.0 2.8 2.7Net debt/equity 66.1 56.8 53.4 48.8Net debt/EBITDA (x) 2.7 1.7 2.1 2.6CF from operations/net debt 74.7 34.4 33.5 33.6
Per share data (EUR)
EPS Rep (fully diluted) -1.22 1.24 0.61 0.67HSBC EPS (fully diluted) -1.22 1.24 0.61 0.67DPS 0.21 0.21 0.21 0.21Book value 5.29 6.32 6.72 7.18
Key forecast drivers
Year to 12/2014a 12/2015e 12/2016e 12/2017e
USD/EUR average 1 1 1 1System benchmark margin, USD/b 3 4 3 2
Valuation data
Year to 12/2014a 12/2015e 12/2016e 12/2017e
EV/sales 0.2 0.2 0.2 0.1EV/EBITDA 3.4 2.2 2.7 3.2EV/IC 0.7 0.7 0.7 0.7PE* 2.9 5.8 5.3P/Book value 0.7 0.6 0.5 0.5FCF yield (%) 357.8 13.8 19.9 29.0Dividend yield (%) 5.9 5.9 5.9 5.9
Note: * = Based on HSBC EPS (fully diluted)
Issuer information
Share price (EUR) 3.55 Target price (EUR) 5.60 5
7.7
Reuters (Equity) HEPr.AT Bloomberg (Equity) ELPE GAMarket cap (USDm) 1,165 Market cap (EURm) 1,085Free float (%) 22 Enterprise value (EURm) 1,462Country Greece Sector Oil & GasAnalyst Ildar Khaziev Contact +7 495 645 4549
Price relative
Source: HSBC Note: price at close of 31 Mar 2015
234567891011
23456789
1011
2013 2014 2015 2016Hellenic Petroleum Rel to ATHENS SE
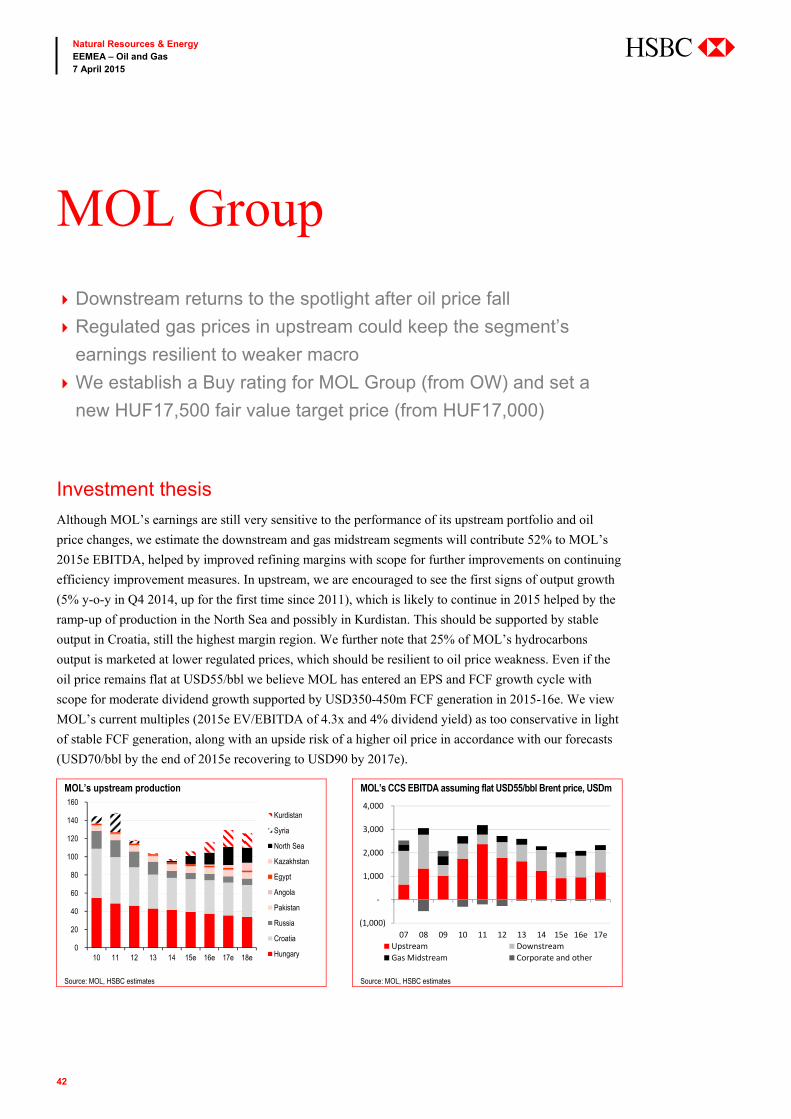
42
Natural Resources & Energy EEMEA – Oil and Gas 7 April 2015
abc
Investment thesis
Although MOL’s earnings are still very sensitive to the performance of its upstream portfolio and oil
price changes, we estimate the downstream and gas midstream segments will contribute 52% to MOL’s
2015e EBITDA, helped by improved refining margins with scope for further improvements on continuing
efficiency improvement measures. In upstream, we are encouraged to see the first signs of output growth
(5% y-o-y in Q4 2014, up for the first time since 2011), which is likely to continue in 2015 helped by the
ramp-up of production in the North Sea and possibly in Kurdistan. This should be supported by stable
output in Croatia, still the highest margin region. We further note that 25% of MOL’s hydrocarbons
output is marketed at lower regulated prices, which should be resilient to oil price weakness. Even if the
oil price remains flat at USD55/bbl we believe MOL has entered an EPS and FCF growth cycle with
scope for moderate dividend growth supported by USD350-450m FCF generation in 2015-16e. We view
MOL’s current multiples (2015e EV/EBITDA of 4.3x and 4% dividend yield) as too conservative in light
of stable FCF generation, along with an upside risk of a higher oil price in accordance with our forecasts
(USD70/bbl by the end of 2015e recovering to USD90 by 2017e).
MOL’s upstream production MOL’s CCS EBITDA assuming flat USD55/bbl Brent price, USDm
Source: MOL, HSBC estimates Source: MOL, HSBC estimates
0
20
40
60
80
100
120
140
160
10 11 12 13 14 15e 16e 17e 18e
Kurdistan
Syria
North Sea
Kazakhstan
Egypt
Angola
Pakistan
Russia
Croatia
Hungary
(1,000)
-
1,000
2,000
3,000
4,000
07 08 09 10 11 12 13 14 15e 16e 17eUpstream DownstreamGas Midstream Corporate and other
MOL Group
Downstream returns to the spotlight after oil price fall
Regulated gas prices in upstream could keep the segment’s
earnings resilient to weaker macro
We establish a Buy rating for MOL Group (from OW) and set a
new HUF17,500 fair value target price (from HUF17,000)

43
Natural Resources & Energy EEMEA – Oil and Gas 7 April 2015
abc
Downstream returns to the spotlight
Back in 2006-08 we would have considered MOL as largely a refiner as its downstream segment
contributed 55% to the company’s clean earnings and 65% to its FCF, on our estimates. From 2009 the
situation has changed dramatically following compression of European refining margins, falling fuel
demand and the acquisition of Croatian INA whose earnings come from upstream while downstream has
been loss-making since 2008. Strong crude oil prices, the launch of production at INA’s project in Syria
and moderate capex spending propelled MOL’s FCF to nearly USD2bn in 2011, the majority of which
came from upstream. Although downstream earnings have been growing since 2011, the segment has
contributed very little towards MOL’s FCF since 2009 as the company has been investing in efficiency
improvements and the number of growth projects, particularly in 2014. We now expect the segment to
start generating stable FCF from 2015e on strong refining margins in H1 2015 and lower capital
expenditures from H2 2015e.
MOL’s CCS EBITDA in 2007-2017e, USDm MOL’s FCF in 2007-2017e, USDm*
Source: MOL Group, HSBC estimates
* FCF estimates exclude a number of acquisitions which MOL added to capital expenditure Source: MOL Group, HSBC estimates
Reintroducing MOL’s downstream
In downstream MOL operates primarily in Hungary, Slovakia and Croatia with exposure to a number of
other countries via a network of retail stations across Central Eastern Europe and North Italy. MOL has
expanded its refining portfolio by acquiring Slovakian incumbent refiner Slovanft in 2000-04, a 49%
stake in Croatian integrated oil and gas company INA (2003-09) and the Mantova refinery in northern
Italy in 2007. The latter was recently converted into a storage and distribution centre due to the poor
economics of the refinery. MOL has more than a 25% fuel market share in its key markets of Hungary,
Croatia and Slovakia. The recent acquisitions of filling stations in Czech Republic from Lukoil and ENI
(the latter has yet to be closed) should increase MOL’s retail market footprint in the country to 318
stations with its market share rising to 12%, on our estimates.
(1,000) (500)
- 500
1,000 1,500 2,000 2,500 3,000 3,500
07 08 09 10 11 12 13 14 15e 16e 17e
Upstream Downstream Gas Midstream Corporate and other
(1,500)
(1,000)
(500)
-
500
1,000
1,500
2,000
2,500
07 08 09 10 11 12 13 14 15e 16e 17eUpstream Downstream
Gas Midstream Corporate and other
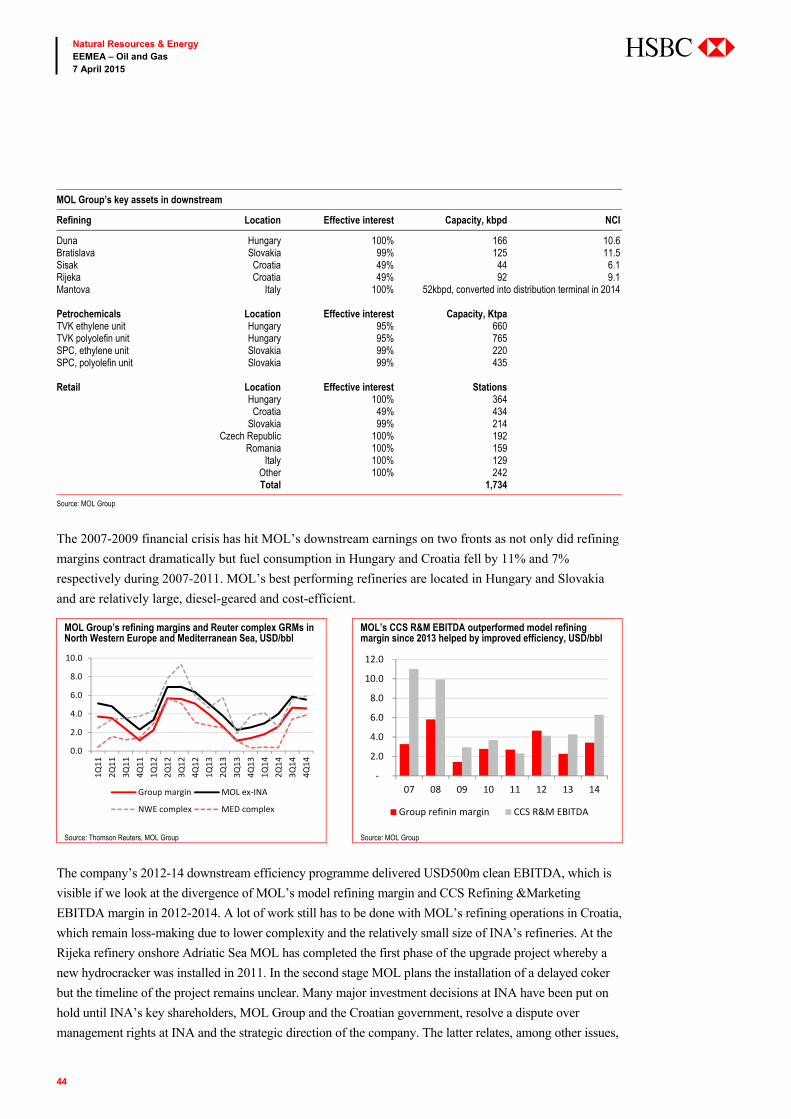
44
Natural Resources & Energy EEMEA – Oil and Gas 7 April 2015
abc
MOL Group’s key assets in downstream
Refining Location Effective interest Capacity, kbpd NCI
Duna Hungary 100% 166 10.6 Bratislava Slovakia 99% 125 11.5 Sisak Croatia 49% 44 6.1 Rijeka Croatia 49% 92 9.1 Mantova Italy 100% 52kbpd, converted into distribution terminal in 2014 Petrochemicals Location Effective interest Capacity, Ktpa TVK ethylene unit Hungary 95% 660 TVK polyolefin unit Hungary 95% 765 SPC, ethylene unit Slovakia 99% 220 SPC, polyolefin unit Slovakia 99% 435 Retail Location Effective interest Stations Hungary 100% 364 Croatia 49% 434 Slovakia 99% 214 Czech Republic 100% 192 Romania 100% 159 Italy 100% 129 Other 100% 242 Total 1,734
Source: MOL Group
The 2007-2009 financial crisis has hit MOL’s downstream earnings on two fronts as not only did refining
margins contract dramatically but fuel consumption in Hungary and Croatia fell by 11% and 7%
respectively during 2007-2011. MOL’s best performing refineries are located in Hungary and Slovakia
and are relatively large, diesel-geared and cost-efficient.
MOL Group’s refining margins and Reuter complex GRMs in North Western Europe and Mediterranean Sea, USD/bbl
MOL’s CCS R&M EBITDA outperformed model refining margin since 2013 helped by improved efficiency, USD/bbl
Source: Thomson Reuters, MOL Group Source: MOL Group
The company’s 2012-14 downstream efficiency programme delivered USD500m clean EBITDA, which is
visible if we look at the divergence of MOL’s model refining margin and CCS Refining &Marketing
EBITDA margin in 2012-2014. A lot of work still has to be done with MOL’s refining operations in Croatia,
which remain loss-making due to lower complexity and the relatively small size of INA’s refineries. At the
Rijeka refinery onshore Adriatic Sea MOL has completed the first phase of the upgrade project whereby a
new hydrocracker was installed in 2011. In the second stage MOL plans the installation of a delayed coker
but the timeline of the project remains unclear. Many major investment decisions at INA have been put on
hold until INA’s key shareholders, MOL Group and the Croatian government, resolve a dispute over
management rights at INA and the strategic direction of the company. The latter relates, among other issues,
0.0
2.0
4.0
6.0
8.0
10.0
1Q11
2Q11
3Q11
4Q11
1Q12
2Q12
3Q12
4Q12
1Q13
2Q13
3Q13
4Q13
1Q14
2Q14
3Q14
4Q14
Group margin MOL ex-INA
NWE complex MED complex
-
2.0
4.0
6.0
8.0
10.0
12.0
07 08 09 10 11 12 13 14
Group refinin margin CCS R&M EBITDA
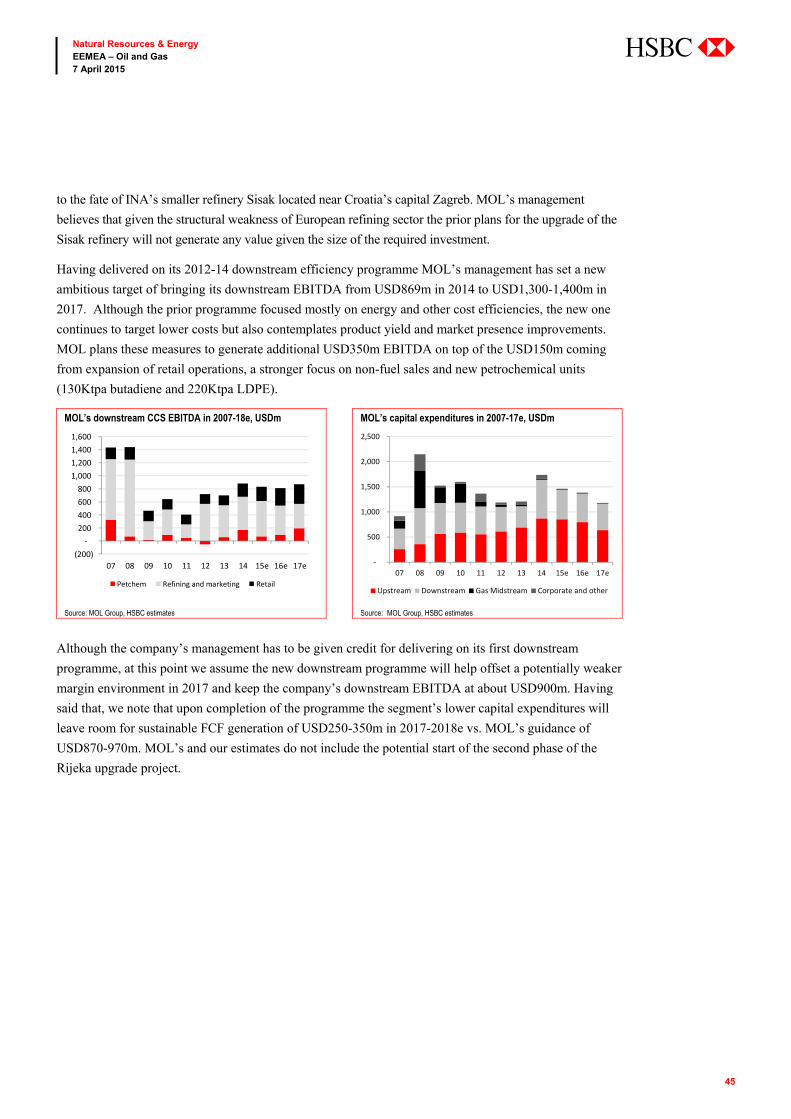
45
Natural Resources & Energy EEMEA – Oil and Gas 7 April 2015
abc
to the fate of INA’s smaller refinery Sisak located near Croatia’s capital Zagreb. MOL’s management
believes that given the structural weakness of European refining sector the prior plans for the upgrade of the
Sisak refinery will not generate any value given the size of the required investment.
Having delivered on its 2012-14 downstream efficiency programme MOL’s management has set a new
ambitious target of bringing its downstream EBITDA from USD869m in 2014 to USD1,300-1,400m in
2017. Although the prior programme focused mostly on energy and other cost efficiencies, the new one
continues to target lower costs but also contemplates product yield and market presence improvements.
MOL plans these measures to generate additional USD350m EBITDA on top of the USD150m coming
from expansion of retail operations, a stronger focus on non-fuel sales and new petrochemical units
(130Ktpa butadiene and 220Ktpa LDPE).
MOL’s downstream CCS EBITDA in 2007-18e, USDm MOL’s capital expenditures in 2007-17e, USDm
Source: MOL Group, HSBC estimates Source: MOL Group, HSBC estimates
Although the company’s management has to be given credit for delivering on its first downstream
programme, at this point we assume the new downstream programme will help offset a potentially weaker
margin environment in 2017 and keep the company’s downstream EBITDA at about USD900m. Having
said that, we note that upon completion of the programme the segment’s lower capital expenditures will
leave room for sustainable FCF generation of USD250-350m in 2017-2018e vs. MOL’s guidance of
USD870-970m. MOL’s and our estimates do not include the potential start of the second phase of the
Rijeka upgrade project.
(200) -
200 400 600 800
1,000 1,200 1,400 1,600
07 08 09 10 11 12 13 14 15e 16e 17e
Petchem Refining and marketing Retail
-
500
1,000
1,500
2,000
2,500
07 08 09 10 11 12 13 14 15e 16e 17e
Upstream Downstream Gas Midstream Corporate and other
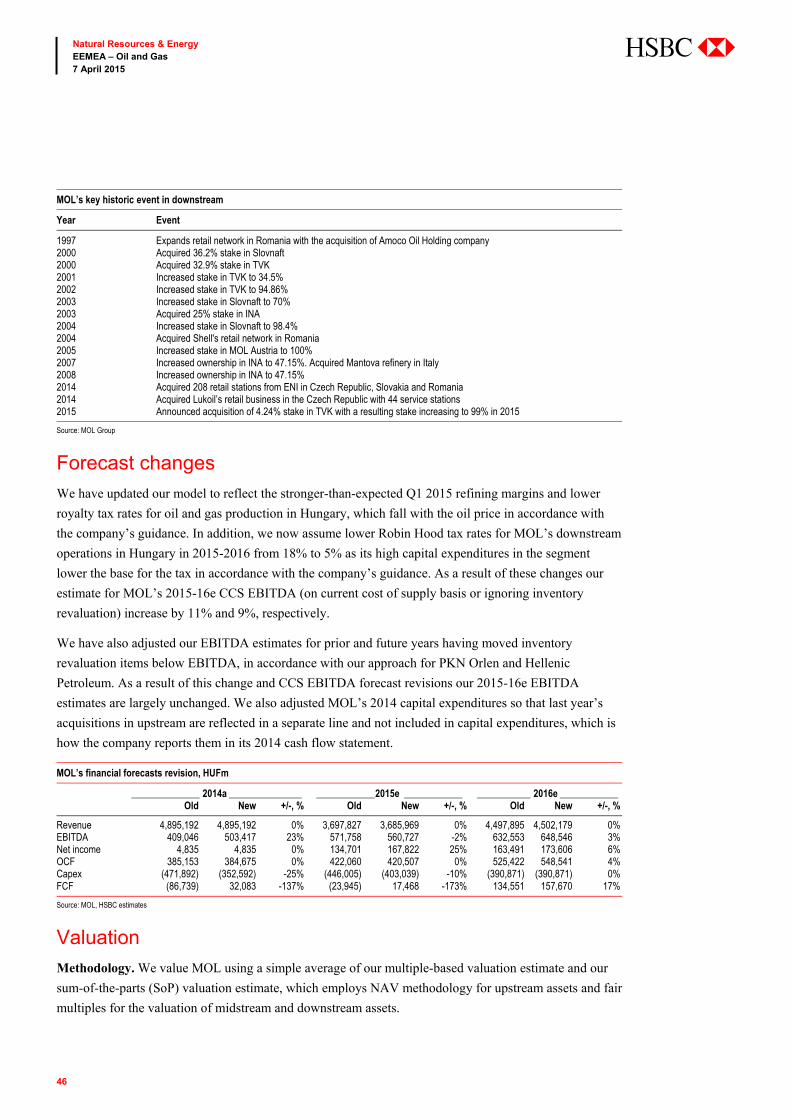
46
Natural Resources & Energy EEMEA – Oil and Gas 7 April 2015
abc
MOL’s key historic event in downstream
Year Event
1997 Expands retail network in Romania with the acquisition of Amoco Oil Holding company 2000 Acquired 36.2% stake in Slovnaft 2000 Acquired 32.9% stake in TVK 2001 Increased stake in TVK to 34.5% 2002 Increased stake in TVK to 94.86% 2003 Increased stake in Slovnaft to 70% 2003 Acquired 25% stake in INA 2004 Increased stake in Slovnaft to 98.4% 2004 Acquired Shell's retail network in Romania 2005 Increased stake in MOL Austria to 100% 2007 Increased ownership in INA to 47.15%. Acquired Mantova refinery in Italy2008 Increased ownership in INA to 47.15% 2014 Acquired 208 retail stations from ENI in Czech Republic, Slovakia and Romania2014 Acquired Lukoil’s retail business in the Czech Republic with 44 service stations2015 Announced acquisition of 4.24% stake in TVK with a resulting stake increasing to 99% in 2015
Source: MOL Group
Forecast changes
We have updated our model to reflect the stronger-than-expected Q1 2015 refining margins and lower
royalty tax rates for oil and gas production in Hungary, which fall with the oil price in accordance with
the company’s guidance. In addition, we now assume lower Robin Hood tax rates for MOL’s downstream
operations in Hungary in 2015-2016 from 18% to 5% as its high capital expenditures in the segment
lower the base for the tax in accordance with the company’s guidance. As a result of these changes our
estimate for MOL’s 2015-16e CCS EBITDA (on current cost of supply basis or ignoring inventory
revaluation) increase by 11% and 9%, respectively.
We have also adjusted our EBITDA estimates for prior and future years having moved inventory
revaluation items below EBITDA, in accordance with our approach for PKN Orlen and Hellenic
Petroleum. As a result of this change and CCS EBITDA forecast revisions our 2015-16e EBITDA
estimates are largely unchanged. We also adjusted MOL’s 2014 capital expenditures so that last year’s
acquisitions in upstream are reflected in a separate line and not included in capital expenditures, which is
how the company reports them in its 2014 cash flow statement.
MOL’s financial forecasts revision, HUFm
______________ 2014a _______________ ____________ 2015e ____________ ___________ 2016e ____________ Old New +/-, % Old New +/-, % Old New +/-, %
Revenue 4,895,192 4,895,192 0% 3,697,827 3,685,969 0% 4,497,895 4,502,179 0% EBITDA 409,046 503,417 23% 571,758 560,727 -2% 632,553 648,546 3% Net income 4,835 4,835 0% 134,701 167,822 25% 163,491 173,606 6% OCF 385,153 384,675 0% 422,060 420,507 0% 525,422 548,541 4% Capex (471,892) (352,592) -25% (446,005) (403,039) -10% (390,871) (390,871) 0% FCF (86,739) 32,083 -137% (23,945) 17,468 -173% 134,551 157,670 17%
Source: MOL, HSBC estimates
Valuation
Methodology. We value MOL using a simple average of our multiple-based valuation estimate and our
sum-of-the-parts (SoP) valuation estimate, which employs NAV methodology for upstream assets and fair
multiples for the valuation of midstream and downstream assets.
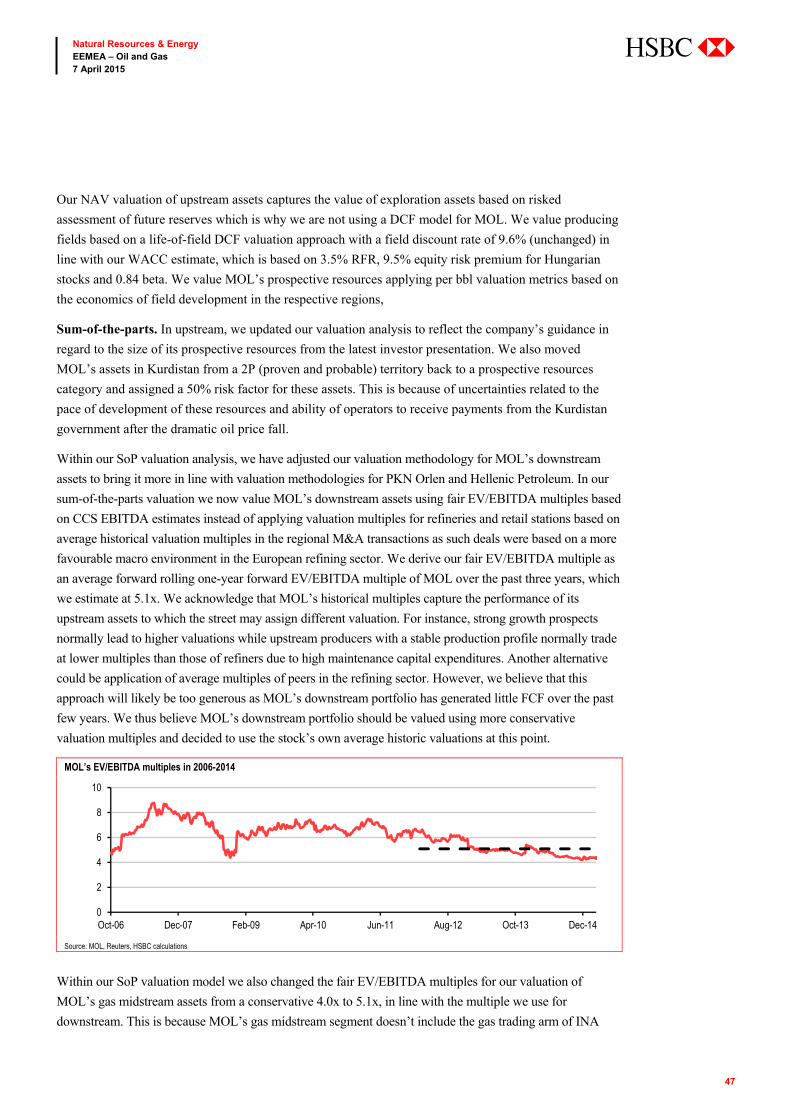
47
Natural Resources & Energy EEMEA – Oil and Gas 7 April 2015
abc
Our NAV valuation of upstream assets captures the value of exploration assets based on risked
assessment of future reserves which is why we are not using a DCF model for MOL. We value producing
fields based on a life-of-field DCF valuation approach with a field discount rate of 9.6% (unchanged) in
line with our WACC estimate, which is based on 3.5% RFR, 9.5% equity risk premium for Hungarian
stocks and 0.84 beta. We value MOL’s prospective resources applying per bbl valuation metrics based on
the economics of field development in the respective regions,
Sum-of-the-parts. In upstream, we updated our valuation analysis to reflect the company’s guidance in
regard to the size of its prospective resources from the latest investor presentation. We also moved
MOL’s assets in Kurdistan from a 2P (proven and probable) territory back to a prospective resources
category and assigned a 50% risk factor for these assets. This is because of uncertainties related to the
pace of development of these resources and ability of operators to receive payments from the Kurdistan
government after the dramatic oil price fall.
Within our SoP valuation analysis, we have adjusted our valuation methodology for MOL’s downstream
assets to bring it more in line with valuation methodologies for PKN Orlen and Hellenic Petroleum. In our
sum-of-the-parts valuation we now value MOL’s downstream assets using fair EV/EBITDA multiples based
on CCS EBITDA estimates instead of applying valuation multiples for refineries and retail stations based on
average historical valuation multiples in the regional M&A transactions as such deals were based on a more
favourable macro environment in the European refining sector. We derive our fair EV/EBITDA multiple as
an average forward rolling one-year forward EV/EBITDA multiple of MOL over the past three years, which
we estimate at 5.1x. We acknowledge that MOL’s historical multiples capture the performance of its
upstream assets to which the street may assign different valuation. For instance, strong growth prospects
normally lead to higher valuations while upstream producers with a stable production profile normally trade
at lower multiples than those of refiners due to high maintenance capital expenditures. Another alternative
could be application of average multiples of peers in the refining sector. However, we believe that this
approach will likely be too generous as MOL’s downstream portfolio has generated little FCF over the past
few years. We thus believe MOL’s downstream portfolio should be valued using more conservative
valuation multiples and decided to use the stock’s own average historic valuations at this point.
MOL’s EV/EBITDA multiples in 2006-2014
Source: MOL, Reuters, HSBC calculations
Within our SoP valuation model we also changed the fair EV/EBITDA multiples for our valuation of
MOL’s gas midstream assets from a conservative 4.0x to 5.1x, in line with the multiple we use for
downstream. This is because MOL’s gas midstream segment doesn’t include the gas trading arm of INA
0
2
4
6
8
10
Oct-06 Dec-07 Feb-09 Apr-10 Jun-11 Aug-12 Oct-13 Dec-14
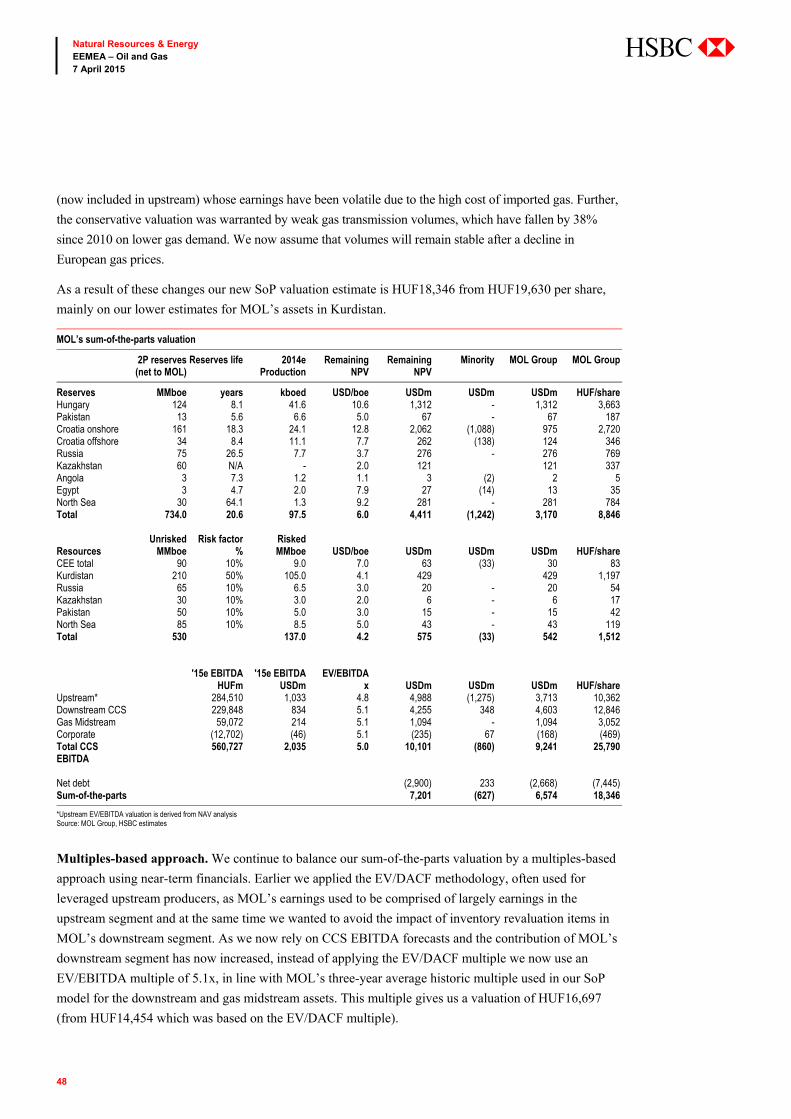
48
Natural Resources & Energy EEMEA – Oil and Gas 7 April 2015
abc
(now included in upstream) whose earnings have been volatile due to the high cost of imported gas. Further,
the conservative valuation was warranted by weak gas transmission volumes, which have fallen by 38%
since 2010 on lower gas demand. We now assume that volumes will remain stable after a decline in
European gas prices.
As a result of these changes our new SoP valuation estimate is HUF18,346 from HUF19,630 per share,
mainly on our lower estimates for MOL’s assets in Kurdistan.
MOL’s sum-of-the-parts valuation
2P reserves (net to MOL)
Reserves life 2014e Production
Remaining NPV
Remaining NPV
Minority MOL Group MOL Group
Reserves MMboe years kboed USD/boe USDm USDm USDm HUF/share Hungary 124 8.1 41.6 10.6 1,312 - 1,312 3,663 Pakistan 13 5.6 6.6 5.0 67 - 67 187 Croatia onshore 161 18.3 24.1 12.8 2,062 (1,088) 975 2,720 Croatia offshore 34 8.4 11.1 7.7 262 (138) 124 346 Russia 75 26.5 7.7 3.7 276 - 276 769 Kazakhstan 60 N/A - 2.0 121 121 337 Angola 3 7.3 1.2 1.1 3 (2) 2 5 Egypt 3 4.7 2.0 7.9 27 (14) 13 35 North Sea 30 64.1 1.3 9.2 281 - 281 784 Total 734.0 20.6 97.5 6.0 4,411 (1,242) 3,170 8,846 Unrisked Risk factor Risked Resources MMboe % MMboe USD/boe USDm USDm USDm HUF/share CEE total 90 10% 9.0 7.0 63 (33) 30 83 Kurdistan 210 50% 105.0 4.1 429 429 1,197 Russia 65 10% 6.5 3.0 20 - 20 54 Kazakhstan 30 10% 3.0 2.0 6 - 6 17 Pakistan 50 10% 5.0 3.0 15 - 15 42 North Sea 85 10% 8.5 5.0 43 - 43 119 Total 530 137.0 4.2 575 (33) 542 1,512 '15e EBITDA '15e EBITDA EV/EBITDA HUFm USDm x USDm USDm USDm HUF/share Upstream* 284,510 1,033 4.8 4,988 (1,275) 3,713 10,362 Downstream CCS 229,848 834 5.1 4,255 348 4,603 12,846 Gas Midstream 59,072 214 5.1 1,094 - 1,094 3,052 Corporate (12,702) (46) 5.1 (235) 67 (168) (469) Total CCS EBITDA
560,727 2,035 5.0 10,101 (860) 9,241 25,790
Net debt (2,900) 233 (2,668) (7,445) Sum-of-the-parts 7,201 (627) 6,574 18,346
*Upstream EV/EBITDA valuation is derived from NAV analysis Source: MOL Group, HSBC estimates
Multiples-based approach. We continue to balance our sum-of-the-parts valuation by a multiples-based
approach using near-term financials. Earlier we applied the EV/DACF methodology, often used for
leveraged upstream producers, as MOL’s earnings used to be comprised of largely earnings in the
upstream segment and at the same time we wanted to avoid the impact of inventory revaluation items in
MOL’s downstream segment. As we now rely on CCS EBITDA forecasts and the contribution of MOL’s
downstream segment has now increased, instead of applying the EV/DACF multiple we now use an
EV/EBITDA multiple of 5.1x, in line with MOL’s three-year average historic multiple used in our SoP
model for the downstream and gas midstream assets. This multiple gives us a valuation of HUF16,697
(from HUF14,454 which was based on the EV/DACF multiple).
49
Natural Resources & Energy EEMEA – Oil and Gas 7 April 2015
abc
Target price and rating. The average of our SoP and multiples-based metrics gives us a new rounded
fair value target price for MOL of HUF17,500 (from HUF17,000). Under our research model, our new
target price implies share price upside of 44.4% vs the current share price. Thus, we establish a Buy rating
from an Overweight rating under HSBC’s previous rating system.
Risks
Key downside risks include: lower-than-expected oil prices and refining margins, lower-than-expected oil
and gas reserves, ecological risks, technological risks, fiscal and regulatory risks.
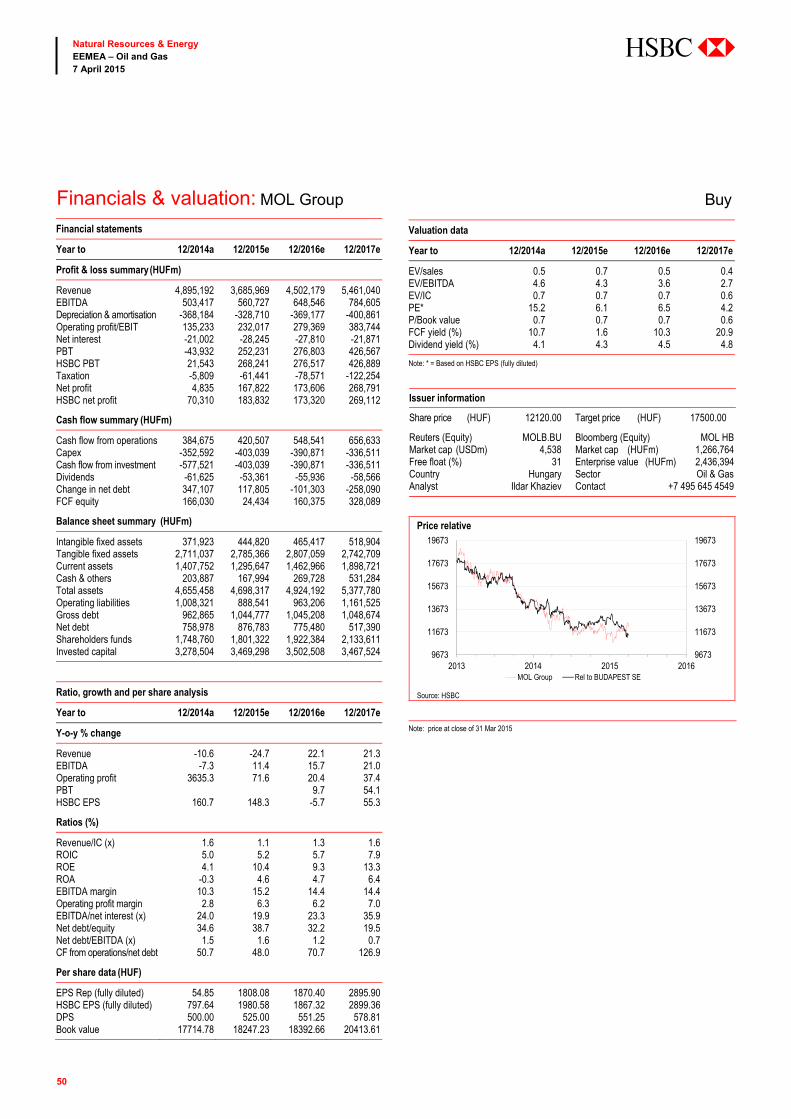
50
Natural Resources & Energy EEMEA – Oil and Gas 7 April 2015
abc
Financials & valuation: MOL Group Buy Financial statements
Year to 12/2014a 12/2015e 12/2016e 12/2017e
Profit & loss summary (HUFm)
Revenue 4,895,192 3,685,969 4,502,179 5,461,040EBITDA 503,417 560,727 648,546 784,605Depreciation & amortisation -368,184 -328,710 -369,177 -400,861Operating profit/EBIT 135,233 232,017 279,369 383,744Net interest -21,002 -28,245 -27,810 -21,871PBT -43,932 252,231 276,803 426,567HSBC PBT 21,543 268,241 276,517 426,889Taxation -5,809 -61,441 -78,571 -122,254Net profit 4,835 167,822 173,606 268,791HSBC net profit 70,310 183,832 173,320 269,112
Cash flow summary (HUFm)
Cash flow from operations 384,675 420,507 548,541 656,633Capex -352,592 -403,039 -390,871 -336,511Cash flow from investment -577,521 -403,039 -390,871 -336,511Dividends -61,625 -53,361 -55,936 -58,566Change in net debt 347,107 117,805 -101,303 -258,090FCF equity 166,030 24,434 160,375 328,089
Balance sheet summary (HUFm)
Intangible fixed assets 371,923 444,820 465,417 518,904Tangible fixed assets 2,711,037 2,785,366 2,807,059 2,742,709Current assets 1,407,752 1,295,647 1,462,966 1,898,721Cash & others 203,887 167,994 269,728 531,284Total assets 4,655,458 4,698,317 4,924,192 5,377,780Operating liabilities 1,008,321 888,541 963,206 1,161,525Gross debt 962,865 1,044,777 1,045,208 1,048,674Net debt 758,978 876,783 775,480 517,390Shareholders funds 1,748,760 1,801,322 1,922,384 2,133,611Invested capital 3,278,504 3,469,298 3,502,508 3,467,524
Ratio, growth and per share analysis
Year to 12/2014a 12/2015e 12/2016e 12/2017e
Y-o-y % change
Revenue -10.6 -24.7 22.1 21.3EBITDA -7.3 11.4 15.7 21.0Operating profit 3635.3 71.6 20.4 37.4PBT 9.7 54.1HSBC EPS 160.7 148.3 -5.7 55.3
Ratios (%)
Revenue/IC (x) 1.6 1.1 1.3 1.6ROIC 5.0 5.2 5.7 7.9ROE 4.1 10.4 9.3 13.3ROA -0.3 4.6 4.7 6.4EBITDA margin 10.3 15.2 14.4 14.4Operating profit margin 2.8 6.3 6.2 7.0EBITDA/net interest (x) 24.0 19.9 23.3 35.9Net debt/equity 34.6 38.7 32.2 19.5Net debt/EBITDA (x) 1.5 1.6 1.2 0.7CF from operations/net debt 50.7 48.0 70.7 126.9
Per share data (HUF)
EPS Rep (fully diluted) 54.85 1808.08 1870.40 2895.90HSBC EPS (fully diluted) 797.64 1980.58 1867.32 2899.36DPS 500.00 525.00 551.25 578.81Book value 17714.78 18247.23 18392.66 20413.61
Valuation data
Year to 12/2014a 12/2015e 12/2016e 12/2017e
EV/sales 0.5 0.7 0.5 0.4EV/EBITDA 4.6 4.3 3.6 2.7EV/IC 0.7 0.7 0.7 0.6PE* 15.2 6.1 6.5 4.2P/Book value 0.7 0.7 0.7 0.6FCF yield (%) 10.7 1.6 10.3 20.9Dividend yield (%) 4.1 4.3 4.5 4.8
Note: * = Based on HSBC EPS (fully diluted)
Issuer information
Share price (HUF) 12120.00 Target price (HUF) 17500.00 4
4.4
Reuters (Equity) MOLB.BU Bloomberg (Equity) MOL HBMarket cap (USDm) 4,538 Market cap (HUFm) 1,266,764Free float (%) 31 Enterprise value (HUFm) 2,436,394Country Hungary Sector Oil & GasAnalyst Ildar Khaziev Contact +7 495 645 4549
Price relative
Source: HSBC Note: price at close of 31 Mar 2015
9673
11673
13673
15673
17673
19673
9673
11673
13673
15673
17673
19673
2013 2014 2015 2016MOL Group Rel to BUDAPEST SE
51
Natural Resources & Energy EEMEA – Oil and Gas 7 April 2015
abc
Investment thesis PKN Orlen’s key attractions include a diversified portfolio of downstream assets and exposure to regions
with strong economic growth. The company’s two key segments, refining and petrochemicals,
complement each other nicely as their returns are negatively correlated. In 2015 we expect the
petrochemical segment to post a 43% decline on a weaker EUR but most of the decline will be offset by
higher EBITDA in the refining segment. We see scope for moderate dividend growth as the company is
approaching the end of its deleveraging cycle. As PKN Orlen operates largely in Poland and Czech
Republic we view it as relatively well protected from the potential inflow of imported diesel from the new
greenfield refineries in the Middle East, which is likely to affect mostly the Mediterranean region from
H2 2015. Although the stock doesn’t look cheap in our view, it currently trades at a 9% discount to its
mid-cycle average EV/EBITDA multiple.
Introducing PKN Orlen PKN Orlen is the largest refiner in Central and Eastern Europe with 2014 refining throughput of 408kbpd
(complexity index of 9.2 vs. Europe’s average of 7.5). One of its key competitive advantages is its large
exposure to the petrochemical segment with combined capacity of nearly 6MMtpa in olefins, polyolefins,
paraxylene, PTA, butadiene, polyvinyl chloride, aromatics and nitrogen fertilisers. The company’s filling
stations network has a 37% market share in Poland, 15% market in Czech Republic, 6% market share in
Germany and 5% market share in Lithuania. PKN Orlen is expanding its exposure to energy by building
two CCGT (combined cycle gas turbine) plants in Poland to complement its CHP (combined heat and
power) plants in Poland, Czech Republic and Lithuania. In addition, the company has made a number of
steps to enter upstream segment which so far is limited to 9kbpd production in Canada (2015e) and
exploration efforts onshore Poland. Upstream contributed only 3% to the company’s earnings in 2014.
PKN Orlen’s key competitor in Poland is Lotos Group (not rated) which operates a refinery in Gdansk
(2014 throughput was 175kbpd).
Polish State Treasury owns a 27.5% stake in the capital of PKN Orlen and has a number of special rights
such as the ability to exercise over 10% of voting rights (the cap for other shareholders) and the ability to
appoint and recall a member of the management board.
PKN Orlen
The company’s downstream portfolio is of high quality and
generates a strong return with scope for dividend growth
We expect weaker petrochemical margin to be offset by strong
results in the refining segment in 2015
Initiate coverage with Buy rating and PLN66 fair value target price
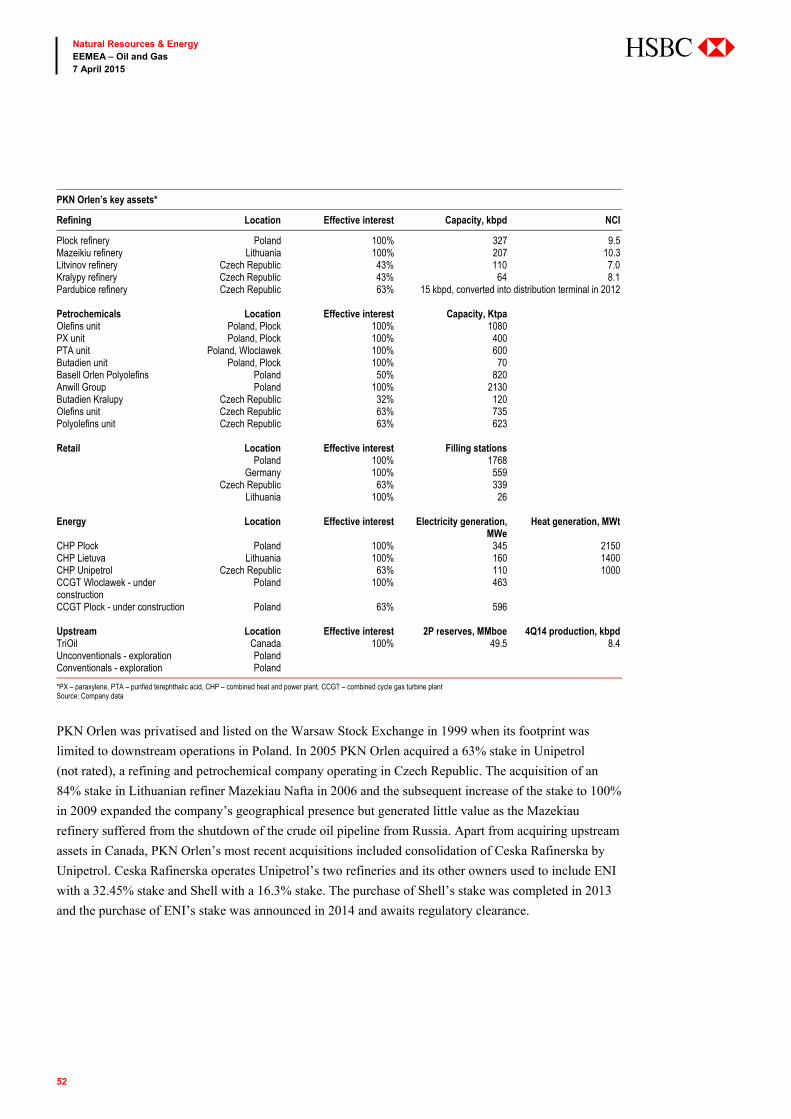
52
Natural Resources & Energy EEMEA – Oil and Gas 7 April 2015
abc
PKN Orlen’s key assets*
Refining Location Effective interest Capacity, kbpd NCI
Plock refinery Poland 100% 327 9.5 Mazeikiu refinery Lithuania 100% 207 10.3 Litvinov refinery Czech Republic 43% 110 7.0 Kralypy refinery Czech Republic 43% 64 8.1 Pardubice refinery Czech Republic 63% 15 kbpd, converted into distribution terminal in 2012 Petrochemicals Location Effective interest Capacity, Ktpa Olefins unit Poland, Plock 100% 1080 PX unit Poland, Plock 100% 400 PTA unit Poland, Wloclawek 100% 600 Butadien unit Poland, Plock 100% 70 Basell Orlen Polyolefins Poland 50% 820 Anwill Group Poland 100% 2130 Butadien Kralupy Czech Republic 32% 120 Olefins unit Czech Republic 63% 735 Polyolefins unit Czech Republic 63% 623 Retail Location Effective interest Filling stations Poland 100% 1768 Germany 100% 559 Czech Republic 63% 339 Lithuania 100% 26 Energy Location Effective interest Electricity generation,
MWeHeat generation, MWt
CHP Plock Poland 100% 345 2150 CHP Lietuva Lithuania 100% 160 1400 CHP Unipetrol Czech Republic 63% 110 1000 CCGT Wloclawek - under construction
Poland 100% 463
CCGT Plock - under construction Poland 63% 596 Upstream Location Effective interest 2P reserves, MMboe 4Q14 production, kbpd TriOil Canada 100% 49.5 8.4 Unconventionals - exploration Poland Conventionals - exploration Poland
*PX – paraxylene, PTA – purified terephthalic acid, CHP – combined heat and power plant, CCGT – combined cycle gas turbine plant Source: Company data
PKN Orlen was privatised and listed on the Warsaw Stock Exchange in 1999 when its footprint was
limited to downstream operations in Poland. In 2005 PKN Orlen acquired a 63% stake in Unipetrol
(not rated), a refining and petrochemical company operating in Czech Republic. The acquisition of an
84% stake in Lithuanian refiner Mazekiau Nafta in 2006 and the subsequent increase of the stake to 100%
in 2009 expanded the company’s geographical presence but generated little value as the Mazekiau
refinery suffered from the shutdown of the crude oil pipeline from Russia. Apart from acquiring upstream
assets in Canada, PKN Orlen’s most recent acquisitions included consolidation of Ceska Rafinerska by
Unipetrol. Ceska Rafinerska operates Unipetrol’s two refineries and its other owners used to include ENI
with a 32.45% stake and Shell with a 16.3% stake. The purchase of Shell’s stake was completed in 2013
and the purchase of ENI’s stake was announced in 2014 and awaits regulatory clearance.
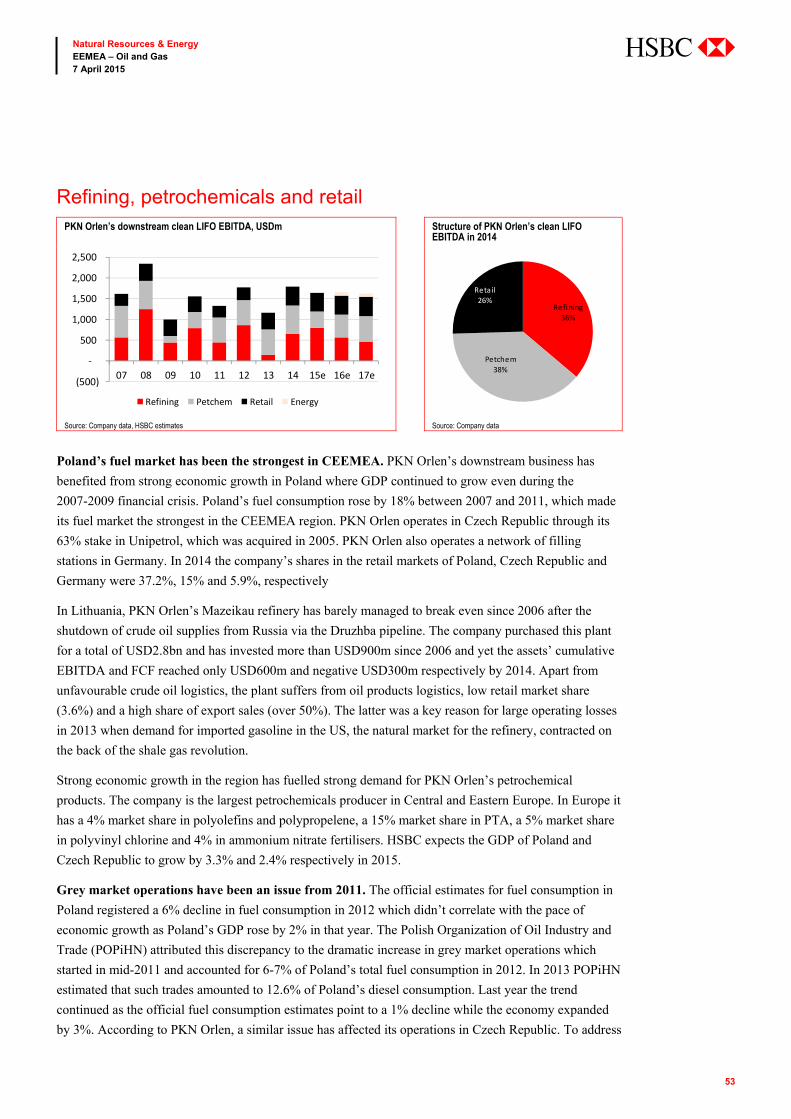
53
Natural Resources & Energy EEMEA – Oil and Gas 7 April 2015
abc
Refining, petrochemicals and retail PKN Orlen’s downstream clean LIFO EBITDA, USDm Structure of PKN Orlen’s clean LIFO
EBITDA in 2014
Source: Company data, HSBC estimates Source: Company data
Poland’s fuel market has been the strongest in CEEMEA. PKN Orlen’s downstream business has
benefited from strong economic growth in Poland where GDP continued to grow even during the
2007-2009 financial crisis. Poland’s fuel consumption rose by 18% between 2007 and 2011, which made
its fuel market the strongest in the CEEMEA region. PKN Orlen operates in Czech Republic through its
63% stake in Unipetrol, which was acquired in 2005. PKN Orlen also operates a network of filling
stations in Germany. In 2014 the company’s shares in the retail markets of Poland, Czech Republic and
Germany were 37.2%, 15% and 5.9%, respectively
In Lithuania, PKN Orlen’s Mazeikau refinery has barely managed to break even since 2006 after the
shutdown of crude oil supplies from Russia via the Druzhba pipeline. The company purchased this plant
for a total of USD2.8bn and has invested more than USD900m since 2006 and yet the assets’ cumulative
EBITDA and FCF reached only USD600m and negative USD300m respectively by 2014. Apart from
unfavourable crude oil logistics, the plant suffers from oil products logistics, low retail market share
(3.6%) and a high share of export sales (over 50%). The latter was a key reason for large operating losses
in 2013 when demand for imported gasoline in the US, the natural market for the refinery, contracted on
the back of the shale gas revolution.
Strong economic growth in the region has fuelled strong demand for PKN Orlen’s petrochemical
products. The company is the largest petrochemicals producer in Central and Eastern Europe. In Europe it
has a 4% market share in polyolefins and polypropelene, a 15% market share in PTA, a 5% market share
in polyvinyl chlorine and 4% in ammonium nitrate fertilisers. HSBC expects the GDP of Poland and
Czech Republic to grow by 3.3% and 2.4% respectively in 2015.
Grey market operations have been an issue from 2011. The official estimates for fuel consumption in
Poland registered a 6% decline in fuel consumption in 2012 which didn’t correlate with the pace of
economic growth as Poland’s GDP rose by 2% in that year. The Polish Organization of Oil Industry and
Trade (POPiHN) attributed this discrepancy to the dramatic increase in grey market operations which
started in mid-2011 and accounted for 6-7% of Poland’s total fuel consumption in 2012. In 2013 POPiHN
estimated that such trades amounted to 12.6% of Poland’s diesel consumption. Last year the trend
continued as the official fuel consumption estimates point to a 1% decline while the economy expanded
by 3%. According to PKN Orlen, a similar issue has affected its operations in Czech Republic. To address
(500)
-
500
1,000
1,500
2,000
2,500
07 08 09 10 11 12 13 14 15e 16e 17e
Refining Petchem Retail Energy
Refining36%
Petchem38%
Reta il26%
54
Natural Resources & Energy EEMEA – Oil and Gas 7 April 2015
abc
this the governments of Czech Republic and Poland have recently introduced special licensing
requirements for fuel importers.
Mandatory stock requirements to loosen. Poland’s Act on Mandatory Stocks requires PKN Orlen
(and other oil companies) to maintain stocks (liquid fuels or crude oil) covering 76 days of consumption.
Clearly, this puts a substantial burden on the company’s balance sheet, exposes it to risks associated with
price fluctuations and also impacts the retail fuel prices. There has been some progress towards making
this act more favourable and the draft amendment was completed in 2013. The draft amendment to the
Act provides mechanisms to gradually reduce mandatory stocks by c30% by end-2017. The amendment is
expected to be adopted in 2015. PKN Orlen, in its Q4 2014 financial results presentation, estimated its
mandatory stocks to decline to 68 days in 2015. In our model we do not forecast the release of inventory
as we like our EBITDA forecasts to be clean from non-recurring items.
In Lithuania, the required level of mandatory stocks is 90 days with Orlen Lietuva and fuel importers
keeping 60-day stocks and a Lithuanian state agency maintaining 30-day stocks. In Czech Republic
mandatory stocks of fuel and crude oil are maintained by a dedicated government agency.
Energy
PKN Orlen’s involvement in power generation is based on its forecasts “of growing electricity demand in
Poland combined with diminishing domestic production capacities”. Output of the company’s two new
CCGT (combined cycle generation turbines) will be partly consumed internally (50% of Wloclawek
CCGT output) with scope for cost savings as PKN Orlen will not have to pay for distribution costs. There
is scope for other cost synergies too as the new units will be based on the existing infrastructure with a
joint use of gas, heat and power. PKN Orlen plans to launch a CCGT plant in Wloclawek in Q4 2015 and
a CCGT plant in Plock in Q4 2017.
PKN Orlen estimates the contribution of its CCGT plant at Woclawek to annual EBITDA at PLN0.2bn or
4% of its clean 2014 LIFO EBITDA.
Upstream
Poland. PKN Orlen’s upstream assets consist of its conventional hydrocarbon and unconventional shale
gas projects in Poland and recently acquired producing assets in Canada. The company has five projects
in Poland – three unconventional shale gas and two conventional hydrocarbon projects – which are
currently in prospecting, exploration and development phases. PKN Orlen targets an output of 2.7 kbpd
from its Poland assets by 2017. We don’t forecast production in Poland in our model yet as the reserves
have yet to be proved.
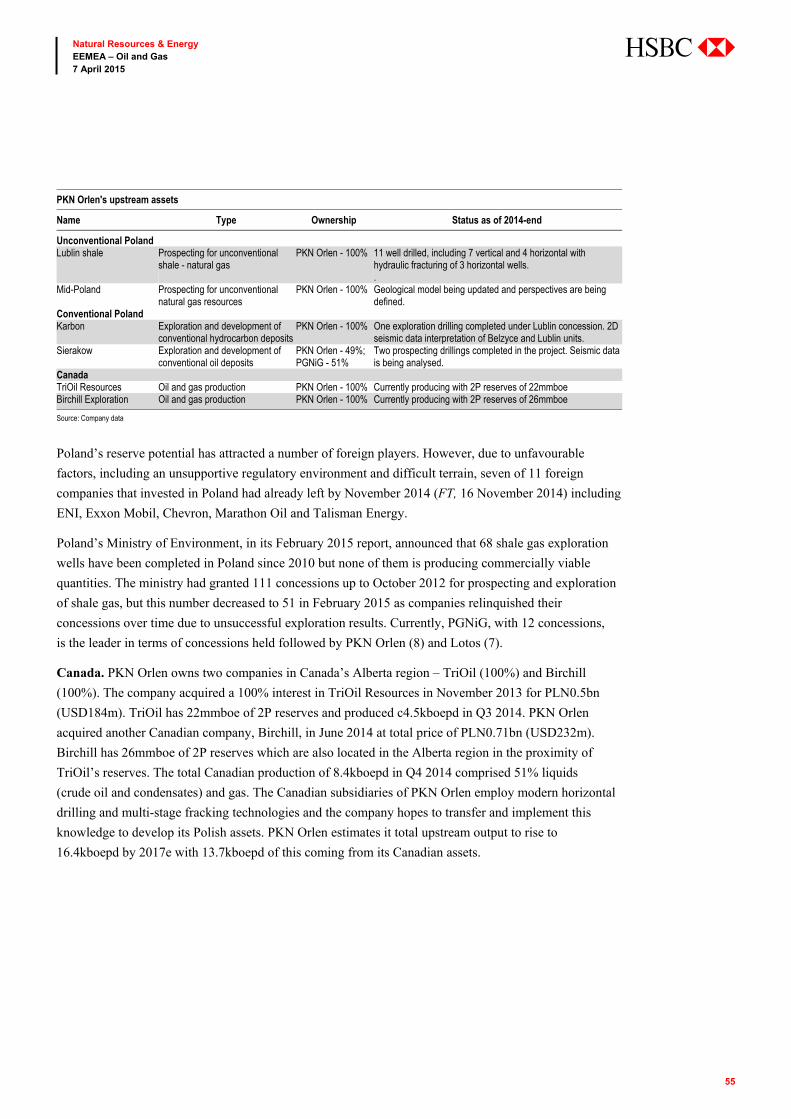
55
Natural Resources & Energy EEMEA – Oil and Gas 7 April 2015
abc
PKN Orlen's upstream assets
Name Type Ownership Status as of 2014-end
Unconventional Poland Lublin shale Prospecting for unconventional
shale - natural gas PKN Orlen - 100% 11 well drilled, including 7 vertical and 4 horizontal with
hydraulic fracturing of 3 horizontal wells. .
Mid-Poland Prospecting for unconventional natural gas resources
PKN Orlen - 100% Geological model being updated and perspectives are being defined.
Conventional Poland Karbon Exploration and development of
conventional hydrocarbon deposits PKN Orlen - 100% One exploration drilling completed under Lublin concession. 2D
seismic data interpretation of Belzyce and Lublin units. Sierakow Exploration and development of
conventional oil deposits PKN Orlen - 49%; PGNiG - 51%
Two prospecting drillings completed in the project. Seismic data is being analysed.
Canada TriOil Resources Oil and gas production PKN Orlen - 100% Currently producing with 2P reserves of 22mmboe Birchill Exploration Oil and gas production PKN Orlen - 100% Currently producing with 2P reserves of 26mmboe
Source: Company data
Poland’s reserve potential has attracted a number of foreign players. However, due to unfavourable
factors, including an unsupportive regulatory environment and difficult terrain, seven of 11 foreign
companies that invested in Poland had already left by November 2014 (FT, 16 November 2014) including
ENI, Exxon Mobil, Chevron, Marathon Oil and Talisman Energy.
Poland’s Ministry of Environment, in its February 2015 report, announced that 68 shale gas exploration
wells have been completed in Poland since 2010 but none of them is producing commercially viable
quantities. The ministry had granted 111 concessions up to October 2012 for prospecting and exploration
of shale gas, but this number decreased to 51 in February 2015 as companies relinquished their
concessions over time due to unsuccessful exploration results. Currently, PGNiG, with 12 concessions,
is the leader in terms of concessions held followed by PKN Orlen (8) and Lotos (7).
Canada. PKN Orlen owns two companies in Canada’s Alberta region – TriOil (100%) and Birchill
(100%). The company acquired a 100% interest in TriOil Resources in November 2013 for PLN0.5bn
(USD184m). TriOil has 22mmboe of 2P reserves and produced c4.5kboepd in Q3 2014. PKN Orlen
acquired another Canadian company, Birchill, in June 2014 at total price of PLN0.71bn (USD232m).
Birchill has 26mmboe of 2P reserves which are also located in the Alberta region in the proximity of
TriOil’s reserves. The total Canadian production of 8.4kboepd in Q4 2014 comprised 51% liquids
(crude oil and condensates) and gas. The Canadian subsidiaries of PKN Orlen employ modern horizontal
drilling and multi-stage fracking technologies and the company hopes to transfer and implement this
knowledge to develop its Polish assets. PKN Orlen estimates it total upstream output to rise to
16.4kboepd by 2017e with 13.7kboepd of this coming from its Canadian assets.
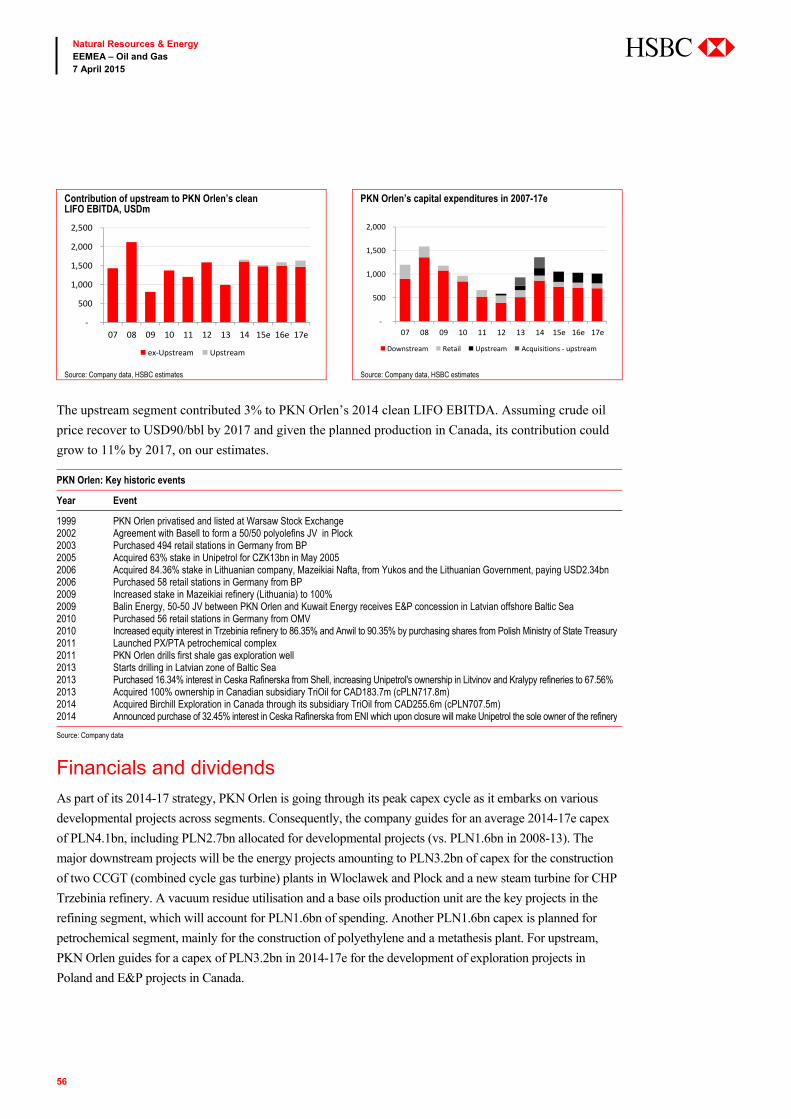
56
Natural Resources & Energy EEMEA – Oil and Gas 7 April 2015
abc
Contribution of upstream to PKN Orlen’s clean LIFO EBITDA, USDm
PKN Orlen’s capital expenditures in 2007-17e
Source: Company data, HSBC estimates Source: Company data, HSBC estimates
The upstream segment contributed 3% to PKN Orlen’s 2014 clean LIFO EBITDA. Assuming crude oil
price recover to USD90/bbl by 2017 and given the planned production in Canada, its contribution could
grow to 11% by 2017, on our estimates.
PKN Orlen: Key historic events
Year Event
1999 PKN Orlen privatised and listed at Warsaw Stock Exchange 2002 Agreement with Basell to form a 50/50 polyolefins JV in Plock2003 Purchased 494 retail stations in Germany from BP 2005 Acquired 63% stake in Unipetrol for CZK13bn in May 20052006 Acquired 84.36% stake in Lithuanian company, Mazeikiai Nafta, from Yukos and the Lithuanian Government, paying USD2.34bn 2006 Purchased 58 retail stations in Germany from BP 2009 Increased stake in Mazeikiai refinery (Lithuania) to 100%2009 Balin Energy, 50-50 JV between PKN Orlen and Kuwait Energy receives E&P concession in Latvian offshore Baltic Sea 2010 Purchased 56 retail stations in Germany from OMV 2010 Increased equity interest in Trzebinia refinery to 86.35% and Anwil to 90.35% by purchasing shares from Polish Ministry of State Treasury 2011 Launched PX/PTA petrochemical complex 2011 PKN Orlen drills first shale gas exploration well 2013 Starts drilling in Latvian zone of Baltic Sea 2013 Purchased 16.34% interest in Ceska Rafinerska from Shell, increasing Unipetrol's ownership in Litvinov and Kralypy refineries to 67.56% 2013 Acquired 100% ownership in Canadian subsidiary TriOil for CAD183.7m (cPLN717.8m)2014 Acquired Birchill Exploration in Canada through its subsidiary TriOil from CAD255.6m (cPLN707.5m)2014 Announced purchase of 32.45% interest in Ceska Rafinerska from ENI which upon closure will make Unipetrol the sole owner of the refinery
Source: Company data
Financials and dividends
As part of its 2014-17 strategy, PKN Orlen is going through its peak capex cycle as it embarks on various
developmental projects across segments. Consequently, the company guides for an average 2014-17e capex
of PLN4.1bn, including PLN2.7bn allocated for developmental projects (vs. PLN1.6bn in 2008-13). The
major downstream projects will be the energy projects amounting to PLN3.2bn of capex for the construction
of two CCGT (combined cycle gas turbine) plants in Wloclawek and Plock and a new steam turbine for CHP
Trzebinia refinery. A vacuum residue utilisation and a base oils production unit are the key projects in the
refining segment, which will account for PLN1.6bn of spending. Another PLN1.6bn capex is planned for
petrochemical segment, mainly for the construction of polyethylene and a metathesis plant. For upstream,
PKN Orlen guides for a capex of PLN3.2bn in 2014-17e for the development of exploration projects in
Poland and E&P projects in Canada.
-
500
1,000
1,500
2,000
2,500
07 08 09 10 11 12 13 14 15e 16e 17e
ex-Upstream Upstream
-
500
1,000
1,500
2,000
07 08 09 10 11 12 13 14 15e 16e 17e
Downstream Retail Upstream Acquisitions - upstream
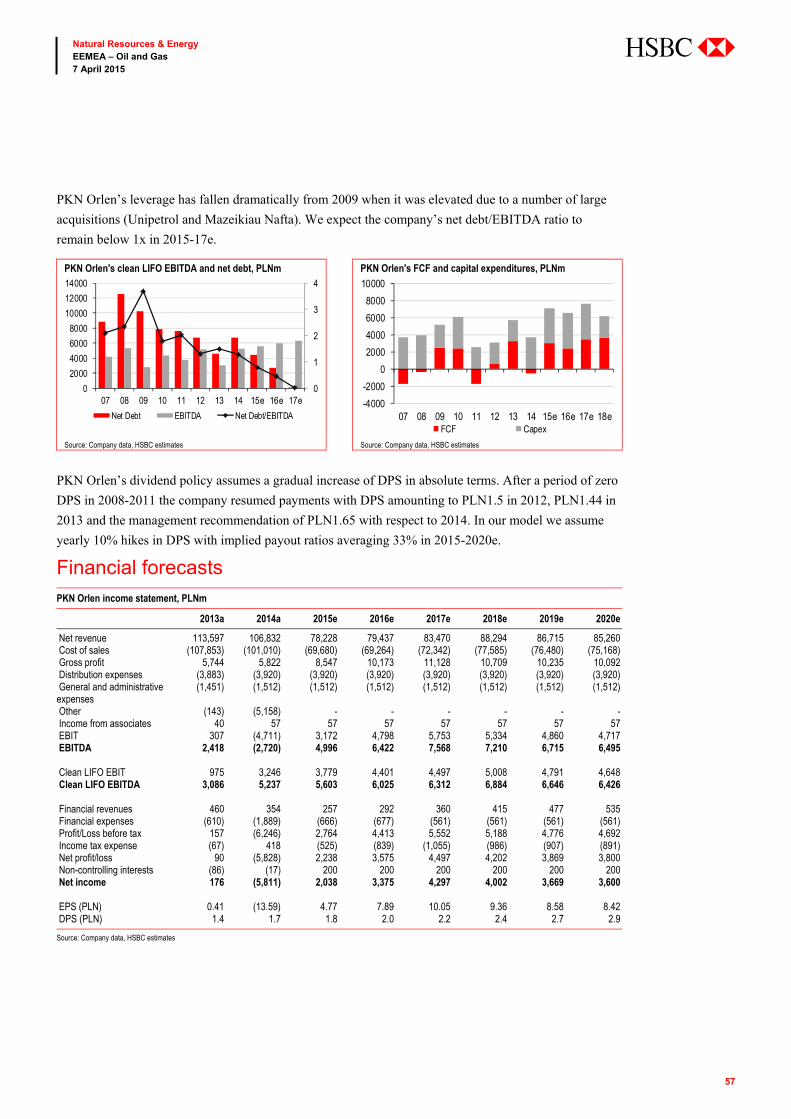
57
Natural Resources & Energy EEMEA – Oil and Gas 7 April 2015
abc
PKN Orlen’s leverage has fallen dramatically from 2009 when it was elevated due to a number of large
acquisitions (Unipetrol and Mazeikiau Nafta). We expect the company’s net debt/EBITDA ratio to
remain below 1x in 2015-17e.
PKN Orlen's clean LIFO EBITDA and net debt, PLNm PKN Orlen's FCF and capital expenditures, PLNm
Source: Company data, HSBC estimates Source: Company data, HSBC estimates
PKN Orlen’s dividend policy assumes a gradual increase of DPS in absolute terms. After a period of zero
DPS in 2008-2011 the company resumed payments with DPS amounting to PLN1.5 in 2012, PLN1.44 in
2013 and the management recommendation of PLN1.65 with respect to 2014. In our model we assume
yearly 10% hikes in DPS with implied payout ratios averaging 33% in 2015-2020e.
Financial forecasts PKN Orlen income statement, PLNm
2013a 2014a 2015e 2016e 2017e 2018e 2019e 2020e
Net revenue 113,597 106,832 78,228 79,437 83,470 88,294 86,715 85,260 Cost of sales (107,853) (101,010) (69,680) (69,264) (72,342) (77,585) (76,480) (75,168) Gross profit 5,744 5,822 8,547 10,173 11,128 10,709 10,235 10,092 Distribution expenses (3,883) (3,920) (3,920) (3,920) (3,920) (3,920) (3,920) (3,920) General and administrative expenses
(1,451) (1,512) (1,512) (1,512) (1,512) (1,512) (1,512) (1,512)
Other (143) (5,158) - - - - - - Income from associates 40 57 57 57 57 57 57 57 EBIT 307 (4,711) 3,172 4,798 5,753 5,334 4,860 4,717 EBITDA 2,418 (2,720) 4,996 6,422 7,568 7,210 6,715 6,495 Clean LIFO EBIT 975 3,246 3,779 4,401 4,497 5,008 4,791 4,648 Clean LIFO EBITDA 3,086 5,237 5,603 6,025 6,312 6,884 6,646 6,426 Financial revenues 460 354 257 292 360 415 477 535 Financial expenses (610) (1,889) (666) (677) (561) (561) (561) (561) Profit/Loss before tax 157 (6,246) 2,764 4,413 5,552 5,188 4,776 4,692 Income tax expense (67) 418 (525) (839) (1,055) (986) (907) (891) Net profit/loss 90 (5,828) 2,238 3,575 4,497 4,202 3,869 3,800 Non-controlling interests (86) (17) 200 200 200 200 200 200 Net income 176 (5,811) 2,038 3,375 4,297 4,002 3,669 3,600 EPS (PLN) 0.41 (13.59) 4.77 7.89 10.05 9.36 8.58 8.42 DPS (PLN) 1.4 1.7 1.8 2.0 2.2 2.4 2.7 2.9
Source: Company data, HSBC estimates
0
1
2
3
4
0
2000
4000
6000
8000
10000
12000
14000
07 08 09 10 11 12 13 14 15e 16e 17e
Net Debt EBITDA Net Debt/EBITDA-4000
-2000
0
2000
4000
6000
8000
10000
07 08 09 10 11 12 13 14 15e 16e 17e 18eFCF Capex
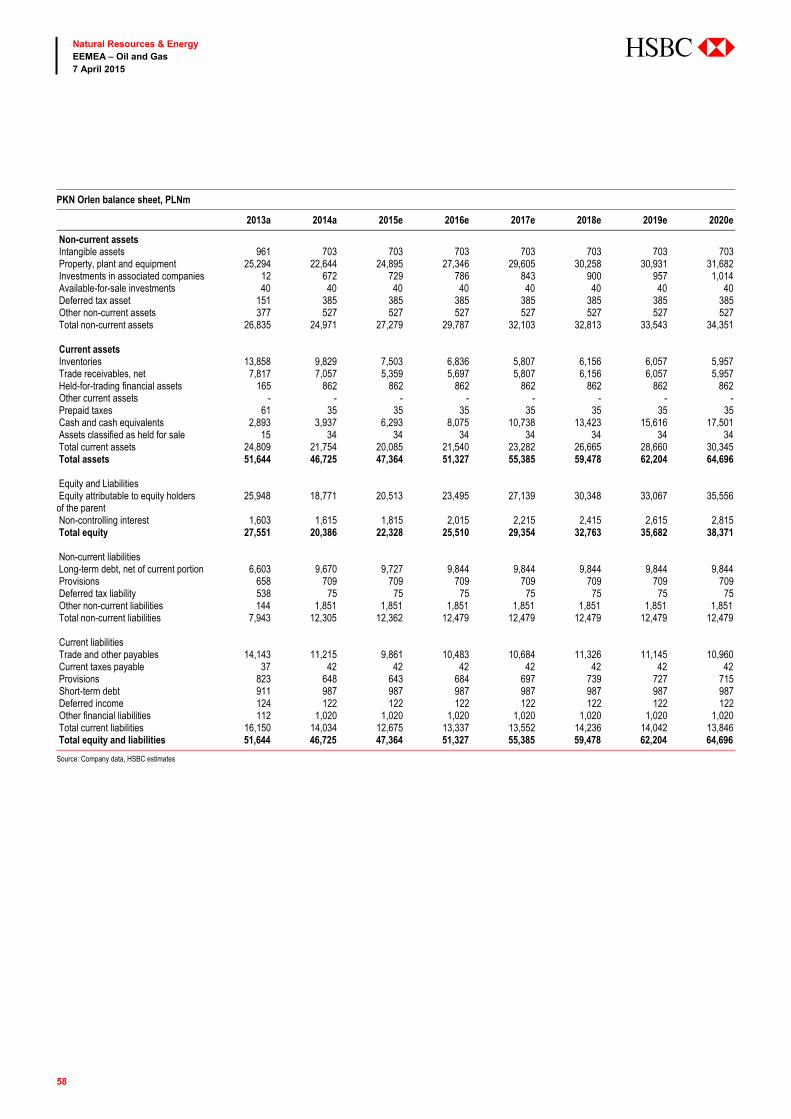
58
Natural Resources & Energy EEMEA – Oil and Gas 7 April 2015
abc
PKN Orlen balance sheet, PLNm
2013a 2014a 2015e 2016e 2017e 2018e 2019e 2020e
Non-current assets Intangible assets 961 703 703 703 703 703 703 703 Property, plant and equipment 25,294 22,644 24,895 27,346 29,605 30,258 30,931 31,682 Investments in associated companies 12 672 729 786 843 900 957 1,014 Available-for-sale investments 40 40 40 40 40 40 40 40 Deferred tax asset 151 385 385 385 385 385 385 385 Other non-current assets 377 527 527 527 527 527 527 527 Total non-current assets 26,835 24,971 27,279 29,787 32,103 32,813 33,543 34,351 Current assets Inventories 13,858 9,829 7,503 6,836 5,807 6,156 6,057 5,957 Trade receivables, net 7,817 7,057 5,359 5,697 5,807 6,156 6,057 5,957 Held-for-trading financial assets 165 862 862 862 862 862 862 862 Other current assets - - - - - - - - Prepaid taxes 61 35 35 35 35 35 35 35 Cash and cash equivalents 2,893 3,937 6,293 8,075 10,738 13,423 15,616 17,501 Assets classified as held for sale 15 34 34 34 34 34 34 34 Total current assets 24,809 21,754 20,085 21,540 23,282 26,665 28,660 30,345 Total assets 51,644 46,725 47,364 51,327 55,385 59,478 62,204 64,696 Equity and Liabilities Equity attributable to equity holders of the parent
25,948 18,771 20,513 23,495 27,139 30,348 33,067 35,556
Non-controlling interest 1,603 1,615 1,815 2,015 2,215 2,415 2,615 2,815 Total equity 27,551 20,386 22,328 25,510 29,354 32,763 35,682 38,371 Non-current liabilities Long-term debt, net of current portion 6,603 9,670 9,727 9,844 9,844 9,844 9,844 9,844 Provisions 658 709 709 709 709 709 709 709 Deferred tax liability 538 75 75 75 75 75 75 75 Other non-current liabilities 144 1,851 1,851 1,851 1,851 1,851 1,851 1,851 Total non-current liabilities 7,943 12,305 12,362 12,479 12,479 12,479 12,479 12,479 Current liabilities Trade and other payables 14,143 11,215 9,861 10,483 10,684 11,326 11,145 10,960 Current taxes payable 37 42 42 42 42 42 42 42 Provisions 823 648 643 684 697 739 727 715 Short-term debt 911 987 987 987 987 987 987 987 Deferred income 124 122 122 122 122 122 122 122 Other financial liabilities 112 1,020 1,020 1,020 1,020 1,020 1,020 1,020 Total current liabilities 16,150 14,034 12,675 13,337 13,552 14,236 14,042 13,846 Total equity and liabilities 51,644 46,725 47,364 51,327 55,385 59,478 62,204 64,696
Source: Company data, HSBC estimates
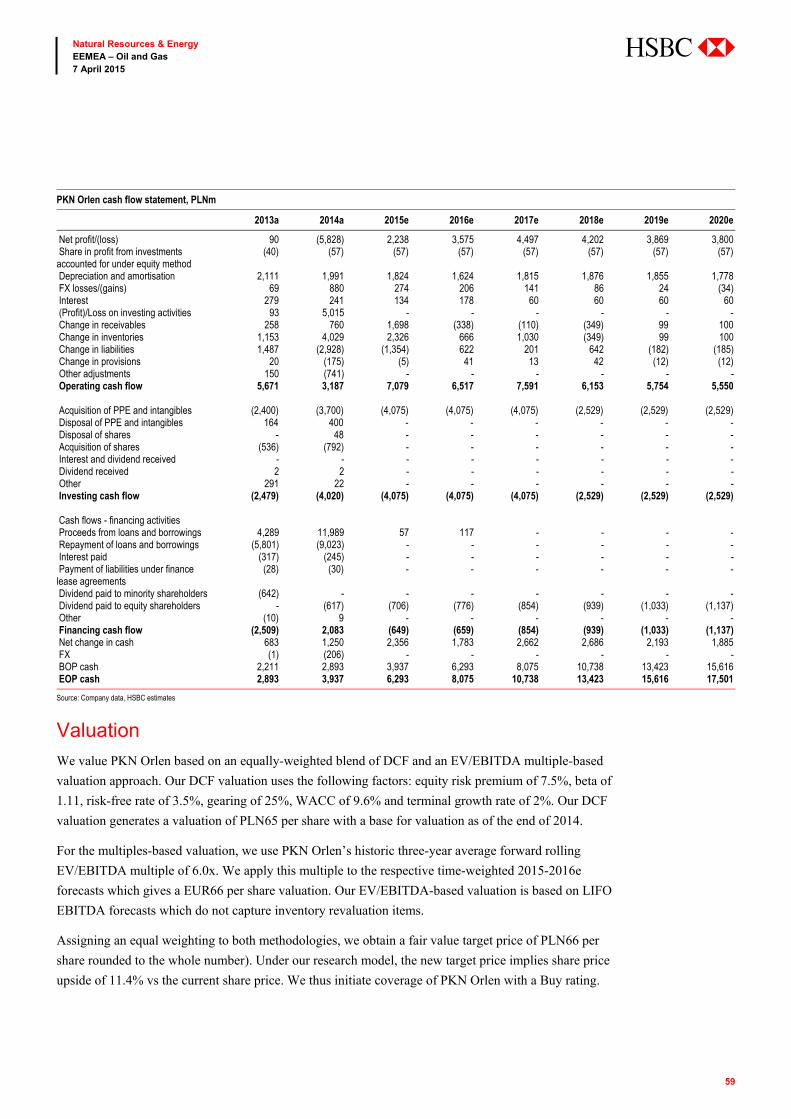
59
Natural Resources & Energy EEMEA – Oil and Gas 7 April 2015
abc
PKN Orlen cash flow statement, PLNm
2013a 2014a 2015e 2016e 2017e 2018e 2019e 2020e
Net profit/(loss) 90 (5,828) 2,238 3,575 4,497 4,202 3,869 3,800 Share in profit from investments accounted for under equity method
(40) (57) (57) (57) (57) (57) (57) (57)
Depreciation and amortisation 2,111 1,991 1,824 1,624 1,815 1,876 1,855 1,778 FX losses/(gains) 69 880 274 206 141 86 24 (34) Interest 279 241 134 178 60 60 60 60 (Profit)/Loss on investing activities 93 5,015 - - - - - - Change in receivables 258 760 1,698 (338) (110) (349) 99 100 Change in inventories 1,153 4,029 2,326 666 1,030 (349) 99 100 Change in liabilities 1,487 (2,928) (1,354) 622 201 642 (182) (185) Change in provisions 20 (175) (5) 41 13 42 (12) (12) Other adjustments 150 (741) - - - - - - Operating cash flow 5,671 3,187 7,079 6,517 7,591 6,153 5,754 5,550 Acquisition of PPE and intangibles (2,400) (3,700) (4,075) (4,075) (4,075) (2,529) (2,529) (2,529) Disposal of PPE and intangibles 164 400 - - - - - - Disposal of shares - 48 - - - - - - Acquisition of shares (536) (792) - - - - - - Interest and dividend received - - - - - - - - Dividend received 2 2 - - - - - - Other 291 22 - - - - - - Investing cash flow (2,479) (4,020) (4,075) (4,075) (4,075) (2,529) (2,529) (2,529) Cash flows - financing activities Proceeds from loans and borrowings 4,289 11,989 57 117 - - - - Repayment of loans and borrowings (5,801) (9,023) - - - - - - Interest paid (317) (245) - - - - - - Payment of liabilities under finance lease agreements
(28) (30) - - - - - -
Dividend paid to minority shareholders (642) - - - - - - - Dividend paid to equity shareholders - (617) (706) (776) (854) (939) (1,033) (1,137) Other (10) 9 - - - - - - Financing cash flow (2,509) 2,083 (649) (659) (854) (939) (1,033) (1,137) Net change in cash 683 1,250 2,356 1,783 2,662 2,686 2,193 1,885 FX (1) (206) - - - - - - BOP cash 2,211 2,893 3,937 6,293 8,075 10,738 13,423 15,616 EOP cash 2,893 3,937 6,293 8,075 10,738 13,423 15,616 17,501
Source: Company data, HSBC estimates
Valuation
We value PKN Orlen based on an equally-weighted blend of DCF and an EV/EBITDA multiple-based
valuation approach. Our DCF valuation uses the following factors: equity risk premium of 7.5%, beta of
1.11, risk-free rate of 3.5%, gearing of 25%, WACC of 9.6% and terminal growth rate of 2%. Our DCF
valuation generates a valuation of PLN65 per share with a base for valuation as of the end of 2014.
For the multiples-based valuation, we use PKN Orlen’s historic three-year average forward rolling
EV/EBITDA multiple of 6.0x. We apply this multiple to the respective time-weighted 2015-2016e
forecasts which gives a EUR66 per share valuation. Our EV/EBITDA-based valuation is based on LIFO
EBITDA forecasts which do not capture inventory revaluation items.
Assigning an equal weighting to both methodologies, we obtain a fair value target price of PLN66 per
share rounded to the whole number). Under our research model, the new target price implies share price
upside of 11.4% vs the current share price. We thus initiate coverage of PKN Orlen with a Buy rating.
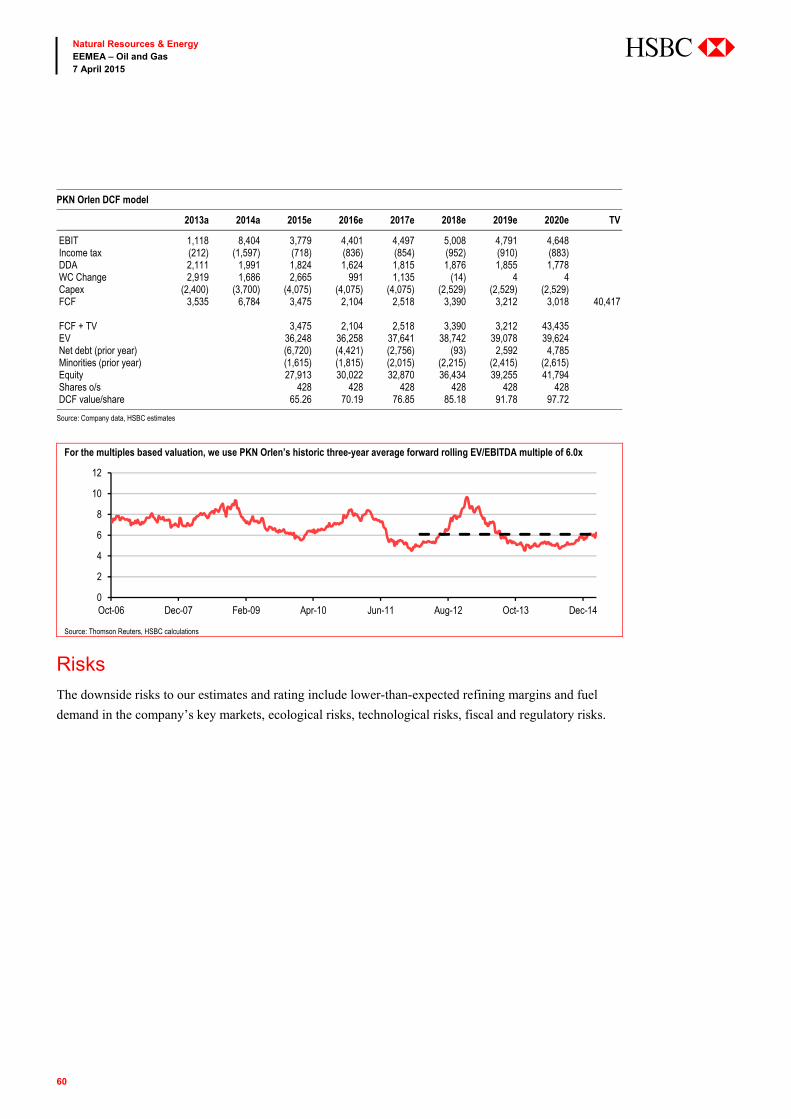
60
Natural Resources & Energy EEMEA – Oil and Gas 7 April 2015
abc
PKN Orlen DCF model
2013a 2014a 2015e 2016e 2017e 2018e 2019e 2020e TV
EBIT 1,118 8,404 3,779 4,401 4,497 5,008 4,791 4,648 Income tax (212) (1,597) (718) (836) (854) (952) (910) (883) DDA 2,111 1,991 1,824 1,624 1,815 1,876 1,855 1,778 WC Change 2,919 1,686 2,665 991 1,135 (14) 4 4 Capex (2,400) (3,700) (4,075) (4,075) (4,075) (2,529) (2,529) (2,529) FCF 3,535 6,784 3,475 2,104 2,518 3,390 3,212 3,018 40,417 FCF + TV 3,475 2,104 2,518 3,390 3,212 43,435 EV 36,248 36,258 37,641 38,742 39,078 39,624 Net debt (prior year) (6,720) (4,421) (2,756) (93) 2,592 4,785 Minorities (prior year) (1,615) (1,815) (2,015) (2,215) (2,415) (2,615) Equity 27,913 30,022 32,870 36,434 39,255 41,794 Shares o/s 428 428 428 428 428 428 DCF value/share 65.26 70.19 76.85 85.18 91.78 97.72
Source: Company data, HSBC estimates
For the multiples based valuation, we use PKN Orlen’s historic three-year average forward rolling EV/EBITDA multiple of 6.0x
Source: Thomson Reuters, HSBC calculations
Risks
The downside risks to our estimates and rating include lower-than-expected refining margins and fuel
demand in the company’s key markets, ecological risks, technological risks, fiscal and regulatory risks.
0
2
4
6
8
10
12
Oct-06 Dec-07 Feb-09 Apr-10 Jun-11 Aug-12 Oct-13 Dec-14
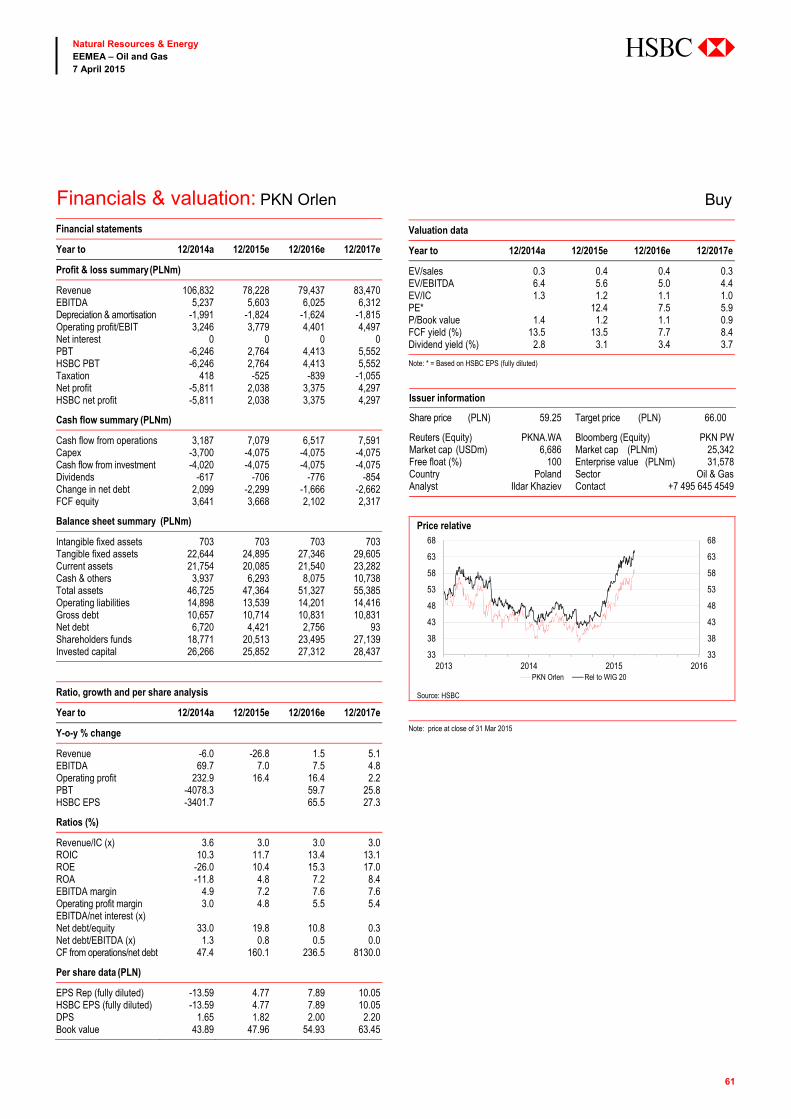
61
Natural Resources & Energy EEMEA – Oil and Gas 7 April 2015
abc
Financials & valuation: PKN Orlen Buy Financial statements
Year to 12/2014a 12/2015e 12/2016e 12/2017e
Profit & loss summary (PLNm)
Revenue 106,832 78,228 79,437 83,470EBITDA 5,237 5,603 6,025 6,312Depreciation & amortisation -1,991 -1,824 -1,624 -1,815Operating profit/EBIT 3,246 3,779 4,401 4,497Net interest 0 0 0 0PBT -6,246 2,764 4,413 5,552HSBC PBT -6,246 2,764 4,413 5,552Taxation 418 -525 -839 -1,055Net profit -5,811 2,038 3,375 4,297HSBC net profit -5,811 2,038 3,375 4,297
Cash flow summary (PLNm)
Cash flow from operations 3,187 7,079 6,517 7,591Capex -3,700 -4,075 -4,075 -4,075Cash flow from investment -4,020 -4,075 -4,075 -4,075Dividends -617 -706 -776 -854Change in net debt 2,099 -2,299 -1,666 -2,662FCF equity 3,641 3,668 2,102 2,317
Balance sheet summary (PLNm)
Intangible fixed assets 703 703 703 703Tangible fixed assets 22,644 24,895 27,346 29,605Current assets 21,754 20,085 21,540 23,282Cash & others 3,937 6,293 8,075 10,738Total assets 46,725 47,364 51,327 55,385Operating liabilities 14,898 13,539 14,201 14,416Gross debt 10,657 10,714 10,831 10,831Net debt 6,720 4,421 2,756 93Shareholders funds 18,771 20,513 23,495 27,139Invested capital 26,266 25,852 27,312 28,437
Ratio, growth and per share analysis
Year to 12/2014a 12/2015e 12/2016e 12/2017e
Y-o-y % change
Revenue -6.0 -26.8 1.5 5.1EBITDA 69.7 7.0 7.5 4.8Operating profit 232.9 16.4 16.4 2.2PBT -4078.3 59.7 25.8HSBC EPS -3401.7 65.5 27.3
Ratios (%)
Revenue/IC (x) 3.6 3.0 3.0 3.0ROIC 10.3 11.7 13.4 13.1ROE -26.0 10.4 15.3 17.0ROA -11.8 4.8 7.2 8.4EBITDA margin 4.9 7.2 7.6 7.6Operating profit margin 3.0 4.8 5.5 5.4EBITDA/net interest (x) Net debt/equity 33.0 19.8 10.8 0.3Net debt/EBITDA (x) 1.3 0.8 0.5 0.0CF from operations/net debt 47.4 160.1 236.5 8130.0
Per share data (PLN)
EPS Rep (fully diluted) -13.59 4.77 7.89 10.05HSBC EPS (fully diluted) -13.59 4.77 7.89 10.05DPS 1.65 1.82 2.00 2.20Book value 43.89 47.96 54.93 63.45
Valuation data
Year to 12/2014a 12/2015e 12/2016e 12/2017e
EV/sales 0.3 0.4 0.4 0.3EV/EBITDA 6.4 5.6 5.0 4.4EV/IC 1.3 1.2 1.1 1.0PE* 12.4 7.5 5.9P/Book value 1.4 1.2 1.1 0.9FCF yield (%) 13.5 13.5 7.7 8.4Dividend yield (%) 2.8 3.1 3.4 3.7
Note: * = Based on HSBC EPS (fully diluted)
Issuer information
Share price (PLN) 59.25 Target price (PLN) 66.00 1
1.4
Reuters (Equity) PKNA.WA Bloomberg (Equity) PKN PWMarket cap (USDm) 6,686 Market cap (PLNm) 25,342Free float (%) 100 Enterprise value (PLNm) 31,578Country Poland Sector Oil & GasAnalyst Ildar Khaziev Contact +7 495 645 4549
Price relative
Source: HSBC Note: price at close of 31 Mar 2015
33
38
43
48
53
58
63
68
33
38
43
48
53
58
63
68
2013 2014 2015 2016PKN Orlen Rel to WIG 20
62
Natural Resources & Energy EEMEA – Oil and Gas 7 April 2015
abc
Investment thesis
Tupras set to reap benefits of RUP as project start-up nears
Tupras has completed construction of the residuum upgrade project (RUP), the biggest investment project
in the company’s history. The USD3bn project is expected to start operating in April, according to
management’s guidance. Even though the RUP start-up has been delayed by almost three months
compared with the company’s earlier guidance of end-2014 start, we think the project’s project
economics are intact. We expect RUP to contribute USD500m annually towards Tupras’ EBITDA
(vs company guidance of USD550m), even with the low crude price and consequently narrower
diesel-HSFO spread (Tupras (TUPRS TI) N: Expect weak Q4 2014 on inventory and FX losses,
23 January 2015). RUP will replace intermediate feedstocks imported and processed by Tupras, which
means not all of the RUP profits will be incremental but the latter strategy has not been profitable lately.
We continue to think that slowing global refining capacity additions alongside refinery shutdowns in
recent years have balanced subdued demand growth, which should prevent refinery margins from falling
to 2009-2011 levels (India refining: Refining margin should remain robust, 25 February 2015), and
thereby support RUP’s and Tupras’ profitability.
Incorporating the delayed start-up of RUP, we estimate Tupras’ EBITDA will rise by 195% y-o-y in
2015e to TRY2,330m. Since next year will the first full year of RUP’s operation, we forecast 2016e
EBITDA to rise by 10% y-o-y to TRY2,559m. Our estimates are largely in line with the IBES consensus
EBITDA forecasts of TRY2,369m and TRY2,587m for 2015-16e. The consensus is therefore also
assuming similar amount of RUP-related benefits. We think the rally in Tupras’ share price since H2
2014is also in part driven by the completion and subsequent start-up of RUP and its benefits are reflected
in the company’s share price as well as in consensus estimates. Tupras’ stock, therefore, has only limited
further upside, in our view, and hence we establish a Hold rating on the stock (from Neutral under our old
rating system).
Tupras
Tupras has not been completely immune to sector weakness
despite benefiting from a dominant position in Turkey
Residuum upgrade project substantial EBITDA contribution
potential remains intact even in low oil price environment
We establish a Hold rating for Tupras (from Neutral) and set a
TRY59.2 fair value target price (from TRY61.0)
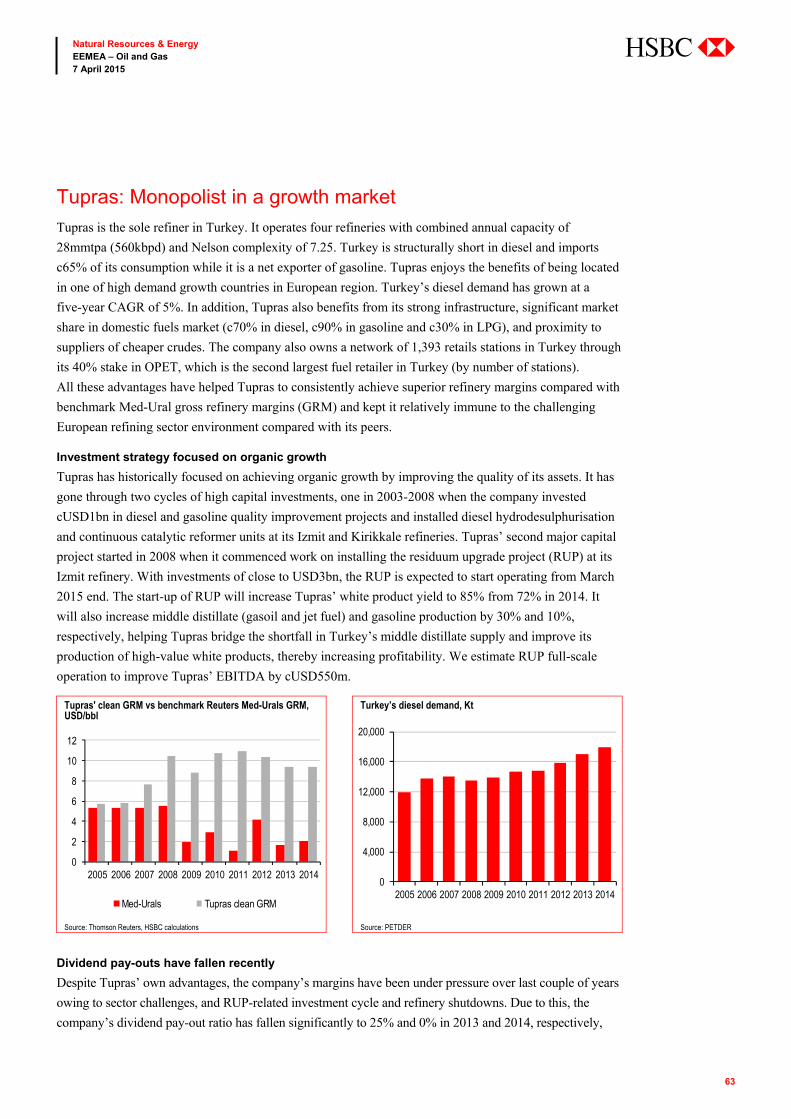
63
Natural Resources & Energy EEMEA – Oil and Gas 7 April 2015
abc
Tupras: Monopolist in a growth market
Tupras is the sole refiner in Turkey. It operates four refineries with combined annual capacity of
28mmtpa (560kbpd) and Nelson complexity of 7.25. Turkey is structurally short in diesel and imports
c65% of its consumption while it is a net exporter of gasoline. Tupras enjoys the benefits of being located
in one of high demand growth countries in European region. Turkey’s diesel demand has grown at a
five-year CAGR of 5%. In addition, Tupras also benefits from its strong infrastructure, significant market
share in domestic fuels market (c70% in diesel, c90% in gasoline and c30% in LPG), and proximity to
suppliers of cheaper crudes. The company also owns a network of 1,393 retails stations in Turkey through
its 40% stake in OPET, which is the second largest fuel retailer in Turkey (by number of stations).
All these advantages have helped Tupras to consistently achieve superior refinery margins compared with
benchmark Med-Ural gross refinery margins (GRM) and kept it relatively immune to the challenging
European refining sector environment compared with its peers.
Investment strategy focused on organic growth
Tupras has historically focused on achieving organic growth by improving the quality of its assets. It has
gone through two cycles of high capital investments, one in 2003-2008 when the company invested
cUSD1bn in diesel and gasoline quality improvement projects and installed diesel hydrodesulphurisation
and continuous catalytic reformer units at its Izmit and Kirikkale refineries. Tupras’ second major capital
project started in 2008 when it commenced work on installing the residuum upgrade project (RUP) at its
Izmit refinery. With investments of close to USD3bn, the RUP is expected to start operating from March
2015 end. The start-up of RUP will increase Tupras’ white product yield to 85% from 72% in 2014. It
will also increase middle distillate (gasoil and jet fuel) and gasoline production by 30% and 10%,
respectively, helping Tupras bridge the shortfall in Turkey’s middle distillate supply and improve its
production of high-value white products, thereby increasing profitability. We estimate RUP full-scale
operation to improve Tupras’ EBITDA by cUSD550m.
Tupras' clean GRM vs benchmark Reuters Med-Urals GRM, USD/bbl
Turkey’s diesel demand, Kt
Source: Thomson Reuters, HSBC calculations Source: PETDER
Dividend pay-outs have fallen recently
Despite Tupras’ own advantages, the company’s margins have been under pressure over last couple of years
owing to sector challenges, and RUP-related investment cycle and refinery shutdowns. Due to this, the
company’s dividend pay-out ratio has fallen significantly to 25% and 0% in 2013 and 2014, respectively,
0
2
4
6
8
10
12
2005 2006 2007 2008 2009 2010 2011 2012 2013 2014
Med-Urals Tupras clean GRM
0
4,000
8,000
12,000
16,000
20,000
2005 2006 2007 2008 2009 2010 2011 2012 2013 2014
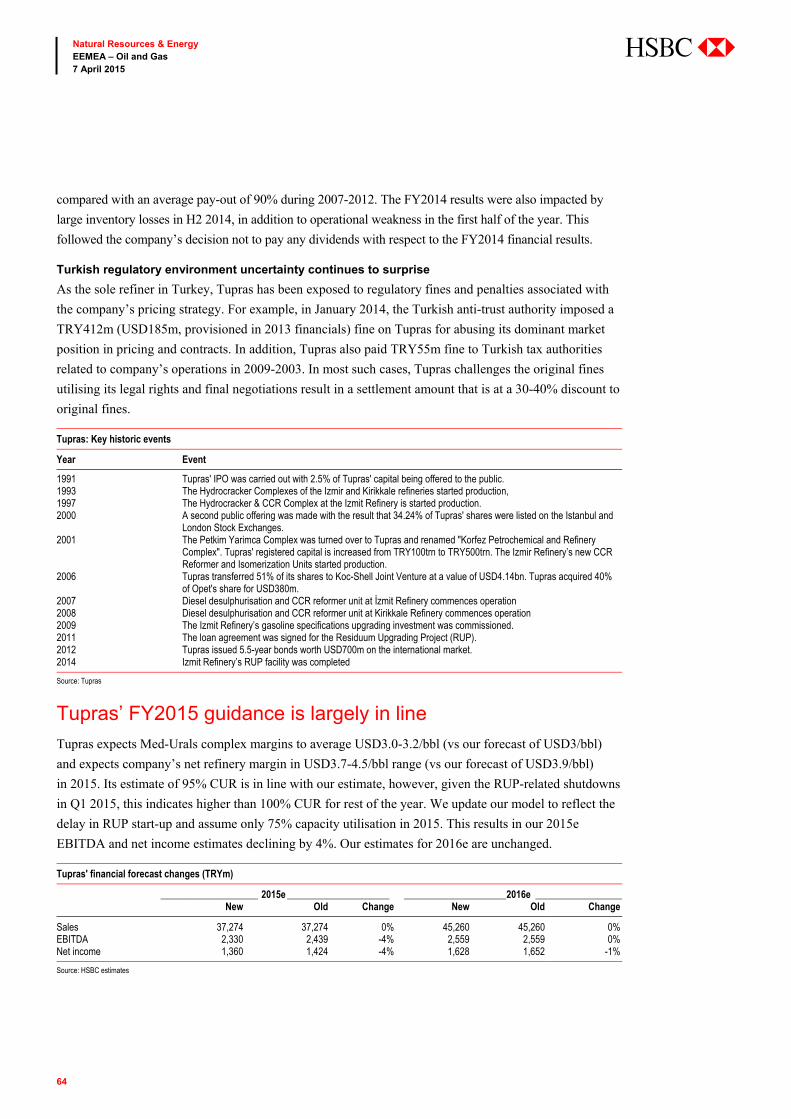
64
Natural Resources & Energy EEMEA – Oil and Gas 7 April 2015
abc
compared with an average pay-out of 90% during 2007-2012. The FY2014 results were also impacted by
large inventory losses in H2 2014, in addition to operational weakness in the first half of the year. This
followed the company’s decision not to pay any dividends with respect to the FY2014 financial results.
Turkish regulatory environment uncertainty continues to surprise
As the sole refiner in Turkey, Tupras has been exposed to regulatory fines and penalties associated with
the company’s pricing strategy. For example, in January 2014, the Turkish anti-trust authority imposed a
TRY412m (USD185m, provisioned in 2013 financials) fine on Tupras for abusing its dominant market
position in pricing and contracts. In addition, Tupras also paid TRY55m fine to Turkish tax authorities
related to company’s operations in 2009-2003. In most such cases, Tupras challenges the original fines
utilising its legal rights and final negotiations result in a settlement amount that is at a 30-40% discount to
original fines.
Tupras: Key historic events
Year Event
1991 Tupras' IPO was carried out with 2.5% of Tupras' capital being offered to the public. 1993 The Hydrocracker Complexes of the Izmir and Kirikkale refineries started production,1997 The Hydrocracker & CCR Complex at the Izmit Refinery is started production.2000 A second public offering was made with the result that 34.24% of Tupras' shares were listed on the Istanbul and
London Stock Exchanges. 2001 The Petkim Yarimca Complex was turned over to Tupras and renamed "Korfez Petrochemical and Refinery
Complex". Tupras' registered capital is increased from TRY100trn to TRY500trn. The Izmir Refinery’s new CCR Reformer and Isomerization Units started production.
2006 Tupras transferred 51% of its shares to Koc-Shell Joint Venture at a value of USD4.14bn. Tupras acquired 40% of Opet's share for USD380m.
2007 Diesel desulphurisation and CCR reformer unit at İzmit Refinery commences operation2008 Diesel desulphurisation and CCR reformer unit at Kirikkale Refinery commences operation2009 The Izmit Refinery’s gasoline specifications upgrading investment was commissioned.2011 The loan agreement was signed for the Residuum Upgrading Project (RUP).2012 Tupras issued 5.5-year bonds worth USD700m on the international market.2014 Izmit Refinery’s RUP facility was completed
Source: Tupras
Tupras’ FY2015 guidance is largely in line
Tupras expects Med-Urals complex margins to average USD3.0-3.2/bbl (vs our forecast of USD3/bbl)
and expects company’s net refinery margin in USD3.7-4.5/bbl range (vs our forecast of USD3.9/bbl)
in 2015. Its estimate of 95% CUR is in line with our estimate, however, given the RUP-related shutdowns
in Q1 2015, this indicates higher than 100% CUR for rest of the year. We update our model to reflect the
delay in RUP start-up and assume only 75% capacity utilisation in 2015. This results in our 2015e
EBITDA and net income estimates declining by 4%. Our estimates for 2016e are unchanged.
Tupras' financial forecast changes (TRYm)
____________________ 2015e _____________________ _____________________ 2016e __________________ New Old Change New Old Change
Sales 37,274 37,274 0% 45,260 45,260 0% EBITDA 2,330 2,439 -4% 2,559 2,559 0% Net income 1,360 1,424 -4% 1,628 1,652 -1%
Source: HSBC estimates
65
Natural Resources & Energy EEMEA – Oil and Gas 7 April 2015
abc
Valuation and risks
We update our model to reflect the actual Q4 2014 financial results. We value the stock using DCF
(50% weight) and multiple-based approaches (25% weight each to PE and EV/EBITDA). Our DCF
valuation for Tupras is TRY60.9 per share (which compares with our earlier 12-month forward DCF
valuation of TRY58.7). This is derived using a benchmark Med-Urals refining margin of USD3.0/bbl in
2015e and USD3.5/bbl thereafter, a risk-free rate assumption of 8.5%, an equity risk premium of 5.5%,
and a beta of 0.91, resulting in a CoE of 13.5%. We use cost of debt of 5.0%, leading to a WACC of
10.7% (from 11.5% on higher leverage). Our DCF model also assumes a terminal growth rate of 3%.
Our EV/EBITDA valuation method yields a valuation of TRY51.6 (from TRY60.3) per share based on
the one-year forward sector average multiple of 6.1x and our EBITDA estimate for 2015. We arrive at a
PE based valuation of TRY63.3 (from TRY66.2) per share using the one-year forward multiple of 10.0x
and our 2015 net income estimate. The weighted average of these three valuation methods results in a fair
value target price of TRY59.2 (which compares with our earlier 12-month forward target price of
TRY61.0). Our target price implies a negative potential return of -4.1%; therefore, we establish a Hold
rating for Tupras (from Neutral).
Risks
Key downside risks include: worse-than-expected global macroeconomic conditions, fewer refining
closures than expected or weaker demand leading to lower refining margins, and further regulatory
intervention on refinery prices in Turkey are the key downside risks to our rating. Better-than-estimated
recovery in refining margins is the main upside risk.
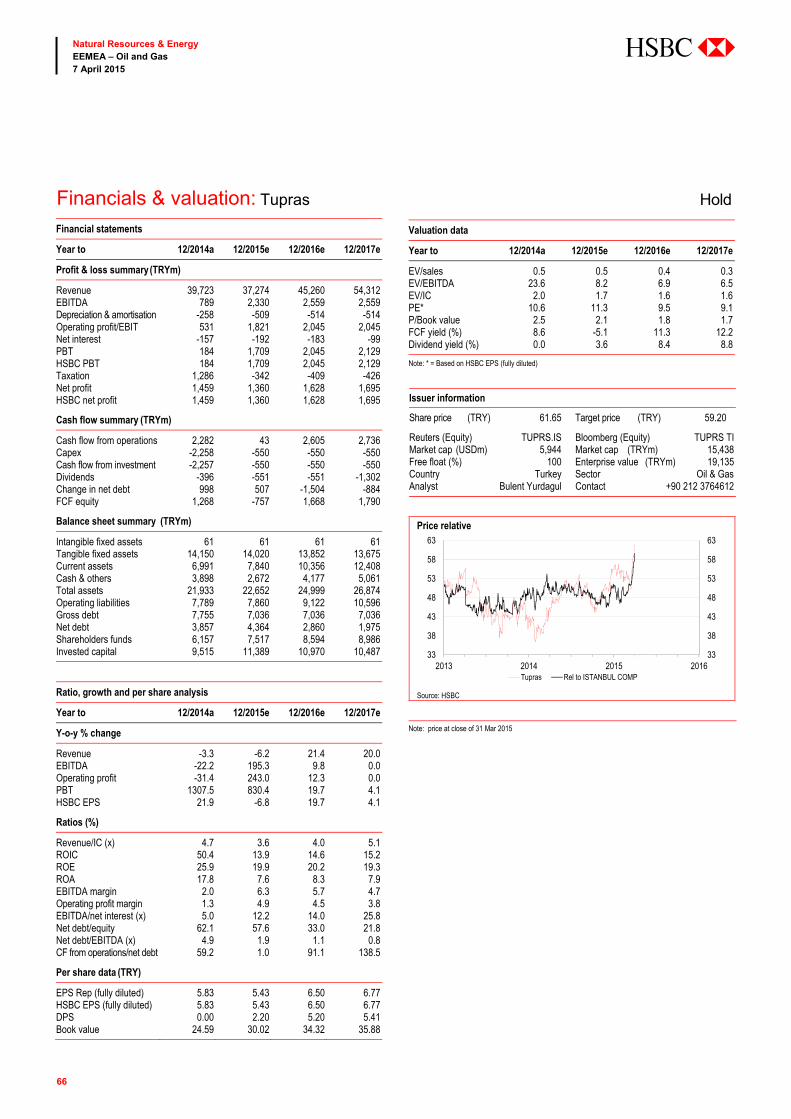
66
Natural Resources & Energy EEMEA – Oil and Gas 7 April 2015
abc
Financials & valuation: Tupras Hold Financial statements
Year to 12/2014a 12/2015e 12/2016e 12/2017e
Profit & loss summary (TRYm)
Revenue 39,723 37,274 45,260 54,312EBITDA 789 2,330 2,559 2,559Depreciation & amortisation -258 -509 -514 -514Operating profit/EBIT 531 1,821 2,045 2,045Net interest -157 -192 -183 -99PBT 184 1,709 2,045 2,129HSBC PBT 184 1,709 2,045 2,129Taxation 1,286 -342 -409 -426Net profit 1,459 1,360 1,628 1,695HSBC net profit 1,459 1,360 1,628 1,695
Cash flow summary (TRYm)
Cash flow from operations 2,282 43 2,605 2,736Capex -2,258 -550 -550 -550Cash flow from investment -2,257 -550 -550 -550Dividends -396 -551 -551 -1,302Change in net debt 998 507 -1,504 -884FCF equity 1,268 -757 1,668 1,790
Balance sheet summary (TRYm)
Intangible fixed assets 61 61 61 61Tangible fixed assets 14,150 14,020 13,852 13,675Current assets 6,991 7,840 10,356 12,408Cash & others 3,898 2,672 4,177 5,061Total assets 21,933 22,652 24,999 26,874Operating liabilities 7,789 7,860 9,122 10,596Gross debt 7,755 7,036 7,036 7,036Net debt 3,857 4,364 2,860 1,975Shareholders funds 6,157 7,517 8,594 8,986Invested capital 9,515 11,389 10,970 10,487
Ratio, growth and per share analysis
Year to 12/2014a 12/2015e 12/2016e 12/2017e
Y-o-y % change
Revenue -3.3 -6.2 21.4 20.0EBITDA -22.2 195.3 9.8 0.0Operating profit -31.4 243.0 12.3 0.0PBT 1307.5 830.4 19.7 4.1HSBC EPS 21.9 -6.8 19.7 4.1
Ratios (%)
Revenue/IC (x) 4.7 3.6 4.0 5.1ROIC 50.4 13.9 14.6 15.2ROE 25.9 19.9 20.2 19.3ROA 17.8 7.6 8.3 7.9EBITDA margin 2.0 6.3 5.7 4.7Operating profit margin 1.3 4.9 4.5 3.8EBITDA/net interest (x) 5.0 12.2 14.0 25.8Net debt/equity 62.1 57.6 33.0 21.8Net debt/EBITDA (x) 4.9 1.9 1.1 0.8CF from operations/net debt 59.2 1.0 91.1 138.5
Per share data (TRY)
EPS Rep (fully diluted) 5.83 5.43 6.50 6.77HSBC EPS (fully diluted) 5.83 5.43 6.50 6.77DPS 0.00 2.20 5.20 5.41Book value 24.59 30.02 34.32 35.88
Valuation data
Year to 12/2014a 12/2015e 12/2016e 12/2017e
EV/sales 0.5 0.5 0.4 0.3EV/EBITDA 23.6 8.2 6.9 6.5EV/IC 2.0 1.7 1.6 1.6PE* 10.6 11.3 9.5 9.1P/Book value 2.5 2.1 1.8 1.7FCF yield (%) 8.6 -5.1 11.3 12.2Dividend yield (%) 0.0 3.6 8.4 8.8
Note: * = Based on HSBC EPS (fully diluted)
Issuer information
Share price (TRY) 61.65 Target price (TRY) 59.20 -
4.0
Reuters (Equity) TUPRS.IS Bloomberg (Equity) TUPRS TIMarket cap (USDm) 5,944 Market cap (TRYm) 15,438Free float (%) 100 Enterprise value (TRYm) 19,135Country Turkey Sector Oil & GasAnalyst Bulent Yurdagul Contact +90 212 3764612
Price relative
Source: HSBC Note: price at close of 31 Mar 2015
33
38
43
48
53
58
63
33
38
43
48
53
58
63
2013 2014 2015 2016Tupras Rel to ISTANBUL COMP
67
Natural Resources & Energy EEMEA – Oil and Gas 7 April 2015
abc
Investment case
PetroRabigh remains a multi-leg equity story set to play out in several phases over the 2015-16
timeframe. In the last 18 months, the company has addressed issues related to its loss-making refinery,
taken a big step towards improving operations at its chemical unit and provided greater clarity around
growth opportunities related to Rabigh 2. None of these factors – improvement in chemical operations or
growth from Rabigh 2 – is correlated to the oil price. We expect to see continued positive news flow
around Rabigh 2 and a better operating performance from Rabigh 1 over the next 12-18 months, driving
the next leg of equity upside from current levels. We establish a Buy rating (Overweight (V) earlier) and
set a target price of SAR29 (SAR31 earlier).
Company description
PetroRabigh was commissioned initially as a 325Mbbl/d basic topping refinery in 1989 and its capacity
was expanded to 400Mbbl/d in 1998. It gets crude from Aramco and most of its refined products are sold
domestically in Saudi Arabia but it gets Asian netback prices for them.
In 2005, Aramco decided to upgrade and expand the existing asset through a 50:50 JV with Sumitomo
Chemical Company. A 25% stake in the company was then offered to the public via an IPO in January
2008, with Aramco and Sumitomo each holding a 37.5% stake thereafter. The total cost of the upgrade
was cUSD10bn, and the project was commissioned in November 2009. The upgrade project was
undertaken in order to increase the complexity of the existing refinery as well as to integrate it into a
brand new world-scale petrochemical complex. The refining capacity was unchanged at 400Mbbl/d,
while the petrochemical business was given an ethane allocation of 95mmscfd from Aramco and would
be supplied with 900ktpa of propylene from the refinery.
Petro Rabigh
Rabigh remains a multi-leg equity story over 2015-16 timeframe
Rabigh-2 essentially a refinery upgrade project
We establish a Buy rating (Overweight (V) earlier) and set a fair
value target price of SAR29 (SAR31 earlier)
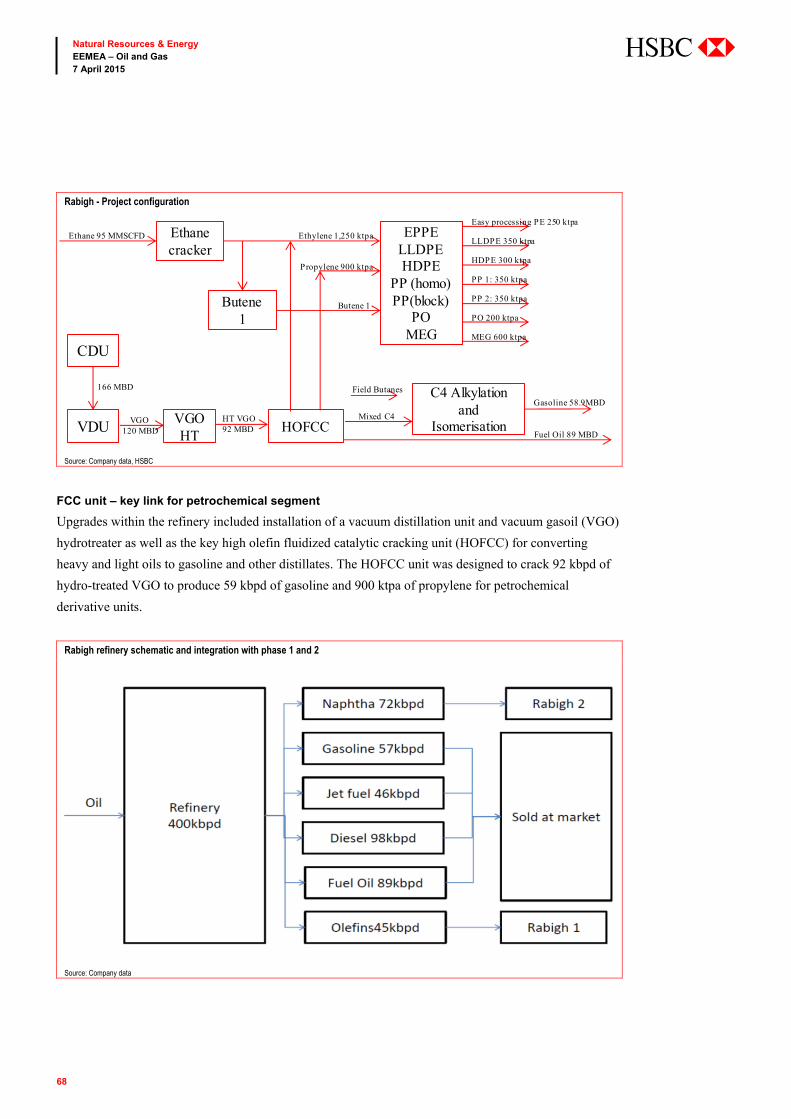
68
Natural Resources & Energy EEMEA – Oil and Gas 7 April 2015
abc
Rabigh - Project configuration
Source: Company data, HSBC
FCC unit – key link for petrochemical segment
Upgrades within the refinery included installation of a vacuum distillation unit and vacuum gasoil (VGO)
hydrotreater as well as the key high olefin fluidized catalytic cracking unit (HOFCC) for converting
heavy and light oils to gasoline and other distillates. The HOFCC unit was designed to crack 92 kbpd of
hydro-treated VGO to produce 59 kbpd of gasoline and 900 ktpa of propylene for petrochemical
derivative units.
Rabigh refinery schematic and integration with phase 1 and 2
Source: Company data
Ethane cracker
Butene1
EPPELLDPEHDPE
PP (homo)PP(block)
POMEG
CDU
VDUVGO HT
HOFCC
C4 Alkylation and
Isomerisation
Ethane 95 MMSCFD Ethylene 1,250 ktpa
Propylene 900 ktpa
Butene 1
Mixed C4
Field Butanes
Fuel Oil 89 MBD
Gasoline 58.9MBD
166 MBD
VGO120 MBD
HT VGO92 MBD
Easy processing PE 250 ktpa
LLDPE 350 ktpa
HDPE 300 ktpa
PP 1: 350 ktpa
PP 2: 350 ktpa
PO 200 ktpa
MEG 600 ktpa
69
Natural Resources & Energy EEMEA – Oil and Gas 7 April 2015
abc
The refining segment, despite accounting for c85% of total company revenues, has been loss-making since
commissioning while most of the profits are generated in the petrochemical unit, mainly due to the
exceptionally low cost base given the high ethane content of its feedstock. This is because the refinery’s
product slate is fairly simple and the economics are challenged by the fact that two of the products – naphtha
and fuel oil – have negative spreads to oil, ie both of these products on average sell for USD5-6/bbl less than
the cost of oil. For PetroRabigh, naphtha accounts for 18% of its refining output, while fuel oil accounts for
22% of the output. If 40% of your product slate as a refinery loses USD5-6/bbl on average, it makes it
difficult for the refinery overall to be profitable – which has been the primary challenge at Rabigh.
Rabigh-2
In order to address this issue and increase profitability of the company, PetroRabigh announced in May
2014 that it wished to merge the second phase of the PetroRabigh project (Rabigh 2) that is currently
under construction into the listed entity PetroRabigh. The centrepiece of Rabigh 2 is a 1.7mntpa aromatics
complex that will use almost all of the existing naphtha production (c3mntpa). We believe that the Phase
2 project is essentially a refinery upgrade project by enhancing the integration into the refinery by adding
aromatics units, expanding the ethylene cracker and producing a range of downstream chemical products.
Valuation and risks
We use a DCF methodology to value PetroRabigh. Our cost of equity is 10.1% and includes a risk-free rate
of 3.5%, a market risk premium of 6% and a beta of 1.1. We use a 5% cost-of-debt assumption and a
30% debt weighting to get to our WACC estimate of 8.6%. This yields a DCF value of SAR24 per share
(SAR26 earlier; for stand-alone Rabigh 1). Given the announcement on 15 May 2014 that Rabigh 2 will be
executed at the list co level, we incorporate the value of Rabigh 2 into our estimates. Our NPV for the
project is SAR7 per share, and we apply a 30% discount to that estimate to account for project delay and
execution risks. We therefore add a SAR5 per share value for Rabigh 2 to our SAR24 DCF value for
standalone Rabigh 1. This yields a value of SAR29 per share (SAR31 earlier), which is our new fair value
target price for the stock. The new target price reflects our assessment of the stock’s actual current value as
compared to our earlier methodology of calculating 12-month target price. As our target price implies upside
of 35.8% to our target price, we establish a Buy rating vs Overweight (V) under our old rating system.
Downside risks: Operating risks: PetroRabigh has faced multiple operating issues in the past.
A continued persistence of such issues would have a negative impact on our estimates and valuation.
Refining margins: The company’s refining segment has faced negative margins on a persistent basis in
the past. We expect margins in the refining segment to improve given the reduction in marketing costs
charged by the parent companies, Aramco and Sumitomo. Any increase in marketing fees, reversing this
reduction, would have a negative impact on our estimates and valuation.
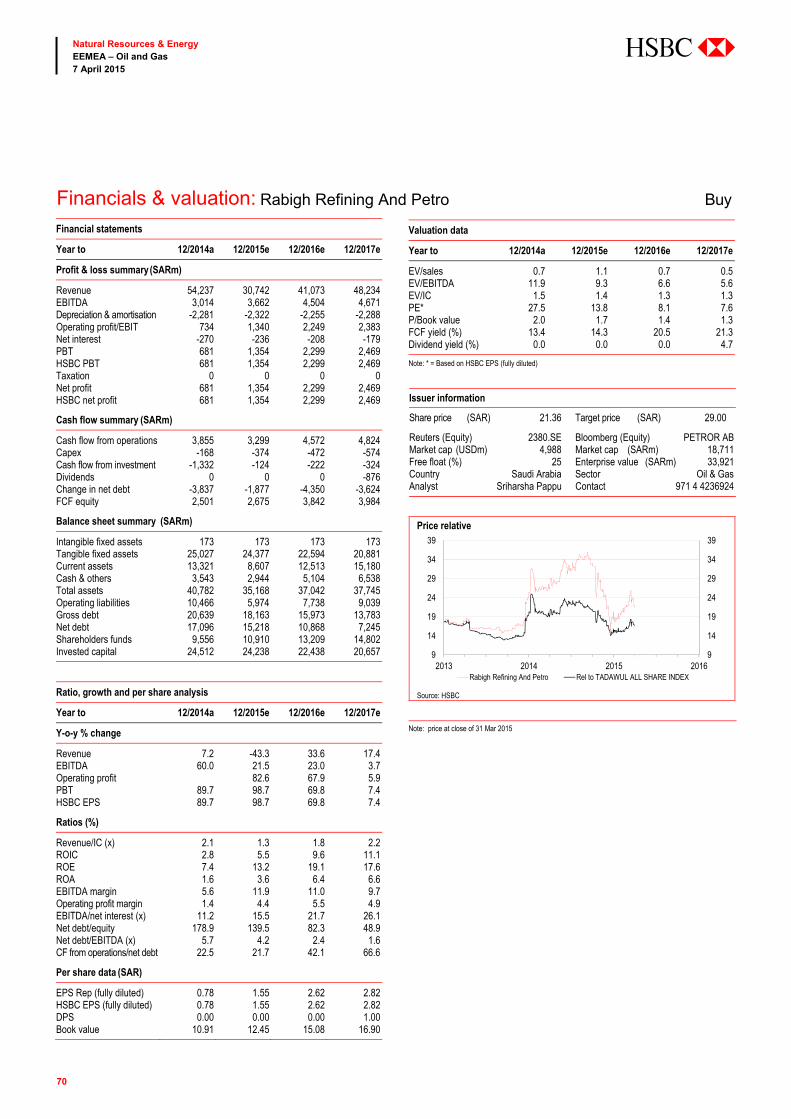
70
Natural Resources & Energy EEMEA – Oil and Gas 7 April 2015
abc
Financials & valuation: Rabigh Refining And Petro Buy Financial statements
Year to 12/2014a 12/2015e 12/2016e 12/2017e
Profit & loss summary (SARm)
Revenue 54,237 30,742 41,073 48,234EBITDA 3,014 3,662 4,504 4,671Depreciation & amortisation -2,281 -2,322 -2,255 -2,288Operating profit/EBIT 734 1,340 2,249 2,383Net interest -270 -236 -208 -179PBT 681 1,354 2,299 2,469HSBC PBT 681 1,354 2,299 2,469Taxation 0 0 0 0Net profit 681 1,354 2,299 2,469HSBC net profit 681 1,354 2,299 2,469
Cash flow summary (SARm)
Cash flow from operations 3,855 3,299 4,572 4,824Capex -168 -374 -472 -574Cash flow from investment -1,332 -124 -222 -324Dividends 0 0 0 -876Change in net debt -3,837 -1,877 -4,350 -3,624FCF equity 2,501 2,675 3,842 3,984
Balance sheet summary (SARm)
Intangible fixed assets 173 173 173 173Tangible fixed assets 25,027 24,377 22,594 20,881Current assets 13,321 8,607 12,513 15,180Cash & others 3,543 2,944 5,104 6,538Total assets 40,782 35,168 37,042 37,745Operating liabilities 10,466 5,974 7,738 9,039Gross debt 20,639 18,163 15,973 13,783Net debt 17,096 15,218 10,868 7,245Shareholders funds 9,556 10,910 13,209 14,802Invested capital 24,512 24,238 22,438 20,657
Ratio, growth and per share analysis
Year to 12/2014a 12/2015e 12/2016e 12/2017e
Y-o-y % change
Revenue 7.2 -43.3 33.6 17.4EBITDA 60.0 21.5 23.0 3.7Operating profit 82.6 67.9 5.9PBT 89.7 98.7 69.8 7.4HSBC EPS 89.7 98.7 69.8 7.4
Ratios (%)
Revenue/IC (x) 2.1 1.3 1.8 2.2ROIC 2.8 5.5 9.6 11.1ROE 7.4 13.2 19.1 17.6ROA 1.6 3.6 6.4 6.6EBITDA margin 5.6 11.9 11.0 9.7Operating profit margin 1.4 4.4 5.5 4.9EBITDA/net interest (x) 11.2 15.5 21.7 26.1Net debt/equity 178.9 139.5 82.3 48.9Net debt/EBITDA (x) 5.7 4.2 2.4 1.6CF from operations/net debt 22.5 21.7 42.1 66.6
Per share data (SAR)
EPS Rep (fully diluted) 0.78 1.55 2.62 2.82HSBC EPS (fully diluted) 0.78 1.55 2.62 2.82DPS 0.00 0.00 0.00 1.00Book value 10.91 12.45 15.08 16.90
Valuation data
Year to 12/2014a 12/2015e 12/2016e 12/2017e
EV/sales 0.7 1.1 0.7 0.5EV/EBITDA 11.9 9.3 6.6 5.6EV/IC 1.5 1.4 1.3 1.3PE* 27.5 13.8 8.1 7.6P/Book value 2.0 1.7 1.4 1.3FCF yield (%) 13.4 14.3 20.5 21.3Dividend yield (%) 0.0 0.0 0.0 4.7
Note: * = Based on HSBC EPS (fully diluted)
Issuer information
Share price (SAR) 21.36 Target price (SAR) 29.00 3
5.8
Reuters (Equity) 2380.SE Bloomberg (Equity) PETROR ABMarket cap (USDm) 4,988 Market cap (SARm) 18,711Free float (%) 25 Enterprise value (SARm) 33,921Country Saudi Arabia Sector Oil & GasAnalyst Sriharsha Pappu Contact 971 4 4236924
Price relative
Source: HSBC Note: price at close of 31 Mar 2015
9
14
19
24
29
34
39
9
14
19
24
29
34
39
2013 2014 2015 2016Rabigh Refining And Petro Rel to TADAWUL ALL SHARE INDEX
71
Natural Resources & Energy EEMEA – Oil and Gas 7 April 2015
abc
Disclosure appendix Analyst Certification The following analyst(s), economist(s), and/or strategist(s) who is(are) primarily responsible for this report, certifies(y) that the opinion(s) on the subject security(ies) or issuer(s) and/or any other views or forecasts expressed herein accurately reflect their personal view(s) and that no part of their compensation was, is or will be directly or indirectly related to the specific recommendation(s) or views contained in this research report: Ildar Khaziev, Bulent Yurdagul and Sriharsha Pappu
Important disclosures
Equities: Stock ratings and basis for financial analysis
HSBC believes an investor's decision to buy or sell a stock should depend on individual circumstances such as the investor's existing holdings, risk tolerance and other considerations and that investors utilise various disciplines and investment horizons when making investment decisions. Ratings should not be used or relied on in isolation as investment advice. Different securities firms use a variety of ratings terms as well as different rating systems to describe their recommendations and therefore investors should carefully read the definitions of the ratings used in each research report. Further, investors should carefully read the entire research report and not infer its contents from the rating because research reports contain more complete information concerning the analysts' views and the basis for the rating.
From 23rd March 2015 HSBC has assigned ratings on the following basis:
The target price is based on the analyst’s assessment of the stock’s actual current value, although we expect it to take six to 12 months for the market price to reflect this. When the target price is more than 20% above the current share price, the stock will be classified as a Buy; when it is between 5% and 20% above the current share price, the stock may be classified as a Buy or a Hold; when it is between 5% below and 5% above the current share price, the stock will be classified as a Hold; when it is between 5% and 20% below the current share price, the stock may be classified as a Hold or a Reduce; and when it is more than 20% below the current share price, the stock will be classified as a Reduce.
Our ratings are re-calibrated against these bands at the time of any 'material change' (initiation or resumption of coverage, change in target price or estimates).
Upside/Downside is the percentage difference between the target price and the share price.
Prior to this date, HSBC’s rating structure was applied on the following basis:
For each stock we set a required rate of return calculated from the cost of equity for that stock’s domestic or, as appropriate, regional market established by our strategy team. The target price for a stock represented the value the analyst expected the stock to reach over our performance horizon. The performance horizon was 12 months. For a stock to be classified as Overweight, the potential return, which equals the percentage difference between the current share price and the target price, including the forecast dividend yield when indicated, had to exceed the required return by at least 5 percentage points over the succeeding 12 months (or 10 percentage points for a stock classified as Volatile*). For a stock to be classified as Underweight, the stock was expected to underperform its required return by at least 5 percentage points over the succeeding 12 months (or 10 percentage points for a stock classified as Volatile*). Stocks between these bands were classified as Neutral.
*A stock was classified as volatile if its historical volatility had exceeded 40%, if the stock had been listed for less than 12 months (unless it was in an industry or sector where volatility is low) or if the analyst expected significant volatility. However, stocks which we did not consider volatile may in fact also have behaved in such a way. Historical volatility was defined as the past month's average of the daily 365-day moving average volatilities. In order to avoid misleadingly frequent changes in rating, however, volatility had to move 2.5 percentage points past the 40% benchmark in either direction for a stock's status to change.
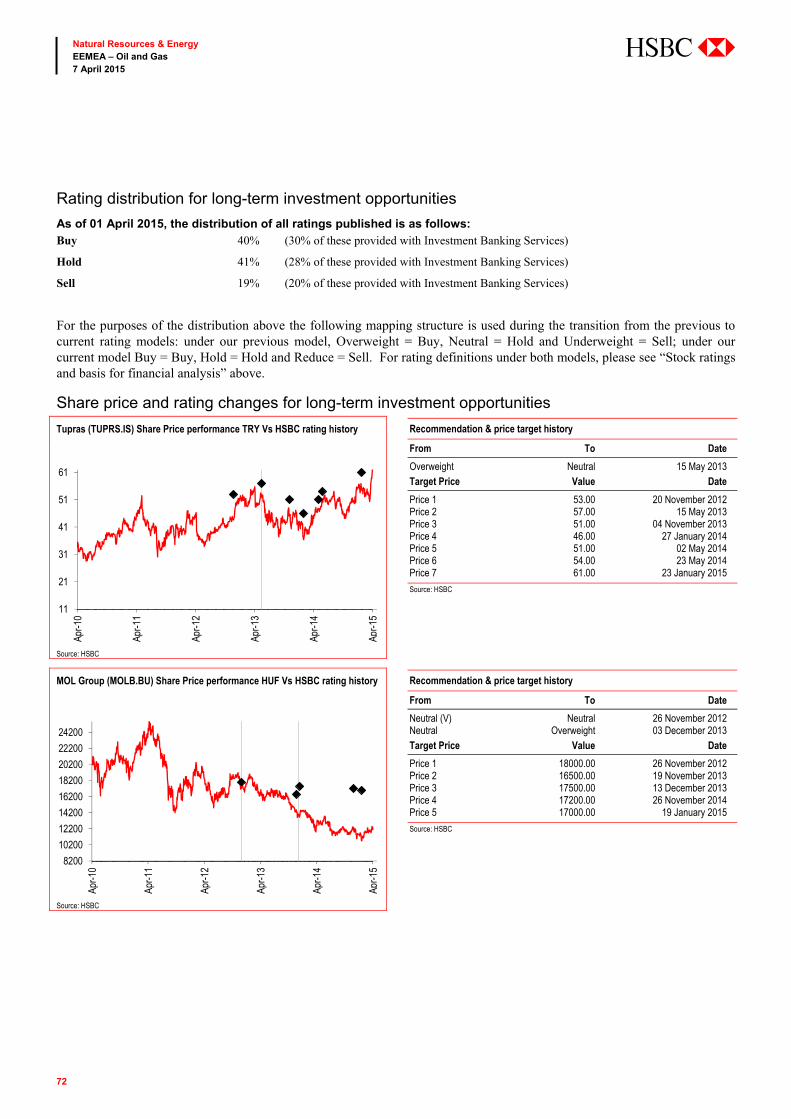
72
Natural Resources & Energy EEMEA – Oil and Gas 7 April 2015
abc
Rating distribution for long-term investment opportunities
As of 01 April 2015, the distribution of all ratings published is as follows: Buy 40% (30% of these provided with Investment Banking Services)
Hold 41% (28% of these provided with Investment Banking Services)
Sell 19% (20% of these provided with Investment Banking Services)
For the purposes of the distribution above the following mapping structure is used during the transition from the previous to current rating models: under our previous model, Overweight = Buy, Neutral = Hold and Underweight = Sell; under our current model Buy = Buy, Hold = Hold and Reduce = Sell. For rating definitions under both models, please see “Stock ratings and basis for financial analysis” above.
Share price and rating changes for long-term investment opportunities
Tupras (TUPRS.IS) Share Price performance TRY Vs HSBC rating history Recommendation & price target history
From To Date
Overweight Neutral 15 May 2013 Target Price Value Date
Price 1 53.00 20 November 2012 Price 2 57.00 15 May 2013 Price 3 51.00 04 November 2013 Price 4 46.00 27 January 2014 Price 5 51.00 02 May 2014 Price 6 54.00 23 May 2014 Price 7 61.00 23 January 2015
Source: HSBC
Source: HSBC MOL Group (MOLB.BU) Share Price performance HUF Vs HSBC rating history Recommendation & price target history
From To Date
Neutral (V) Neutral 26 November 2012 Neutral Overweight 03 December 2013 Target Price Value Date
Price 1 18000.00 26 November 2012 Price 2 16500.00 19 November 2013 Price 3 17500.00 13 December 2013 Price 4 17200.00 26 November 2014 Price 5 17000.00 19 January 2015
Source: HSBC
Source: HSBC
11
21
31
41
51
61
Apr-1
0
Apr-1
1
Apr-1
2
Apr-1
3
Apr-1
4
Apr-1
5
8200
10200
12200
14200
16200
18200
20200
22200
24200
Apr-1
0
Apr-1
1
Apr-1
2
Apr-1
3
Apr-1
4
Apr-1
5
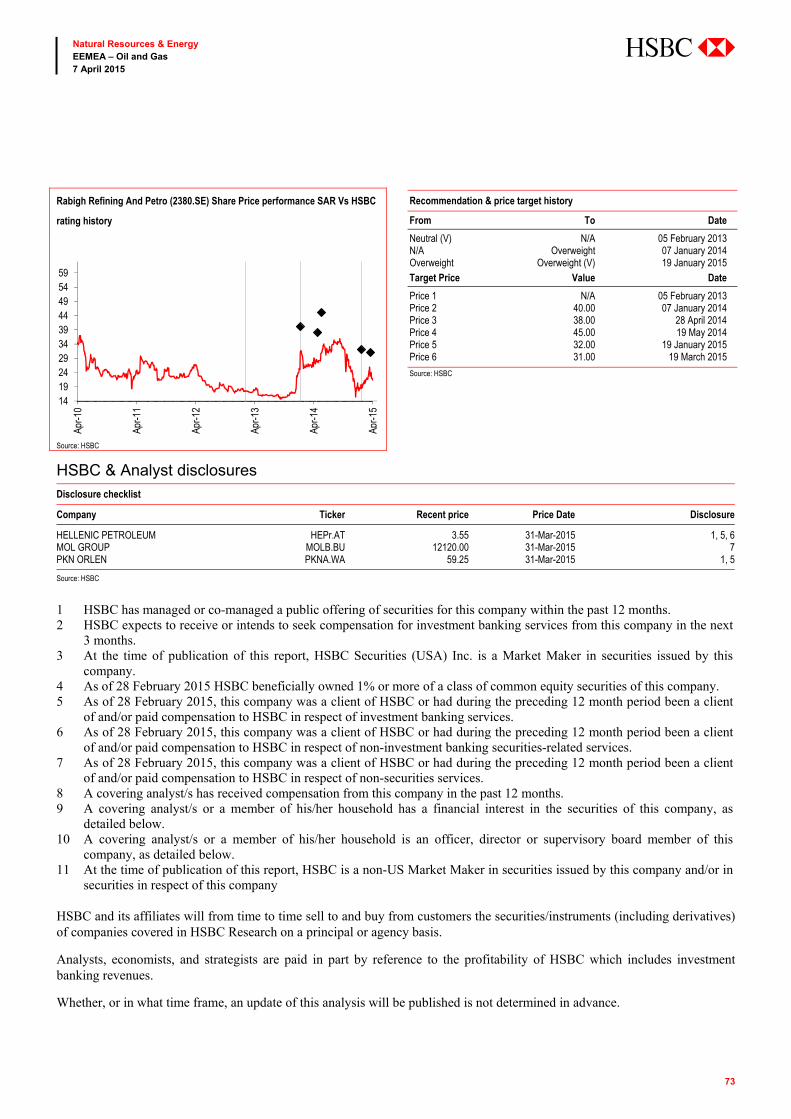
73
Natural Resources & Energy EEMEA – Oil and Gas 7 April 2015
abc
Rabigh Refining And Petro (2380.SE) Share Price performance SAR Vs HSBC
rating history
Recommendation & price target history
From To Date
Neutral (V) N/A 05 February 2013 N/A Overweight 07 January 2014 Overweight Overweight (V) 19 January 2015 Target Price Value Date
Price 1 N/A 05 February 2013 Price 2 40.00 07 January 2014 Price 3 38.00 28 April 2014 Price 4 45.00 19 May 2014 Price 5 32.00 19 January 2015 Price 6 31.00 19 March 2015
Source: HSBC
Source: HSBC HSBC & Analyst disclosures Disclosure checklist
Company Ticker Recent price Price Date Disclosure
HELLENIC PETROLEUM HEPr.AT 3.55 31-Mar-2015 1, 5, 6MOL GROUP MOLB.BU 12120.00 31-Mar-2015 7PKN ORLEN PKNA.WA 59.25 31-Mar-2015 1, 5
Source: HSBC
1 HSBC has managed or co-managed a public offering of securities for this company within the past 12 months. 2 HSBC expects to receive or intends to seek compensation for investment banking services from this company in the next
3 months. 3 At the time of publication of this report, HSBC Securities (USA) Inc. is a Market Maker in securities issued by this
company. 4 As of 28 February 2015 HSBC beneficially owned 1% or more of a class of common equity securities of this company. 5 As of 28 February 2015, this company was a client of HSBC or had during the preceding 12 month period been a client
of and/or paid compensation to HSBC in respect of investment banking services. 6 As of 28 February 2015, this company was a client of HSBC or had during the preceding 12 month period been a client
of and/or paid compensation to HSBC in respect of non-investment banking securities-related services. 7 As of 28 February 2015, this company was a client of HSBC or had during the preceding 12 month period been a client
of and/or paid compensation to HSBC in respect of non-securities services. 8 A covering analyst/s has received compensation from this company in the past 12 months. 9 A covering analyst/s or a member of his/her household has a financial interest in the securities of this company, as
detailed below. 10 A covering analyst/s or a member of his/her household is an officer, director or supervisory board member of this
company, as detailed below. 11 At the time of publication of this report, HSBC is a non-US Market Maker in securities issued by this company and/or in
securities in respect of this company HSBC and its affiliates will from time to time sell to and buy from customers the securities/instruments (including derivatives) of companies covered in HSBC Research on a principal or agency basis.
Analysts, economists, and strategists are paid in part by reference to the profitability of HSBC which includes investment banking revenues.
Whether, or in what time frame, an update of this analysis will be published is not determined in advance.
14192429343944495459
Apr-1
0
Apr-1
1
Apr-1
2
Apr-1
3
Apr-1
4
Apr-1
5
74
Natural Resources & Energy EEMEA – Oil and Gas 7 April 2015
abc
For disclosures in respect of any company mentioned in this report, please see the most recently published report on that company available at www.hsbcnet.com/research.
Additional disclosures 1 This report is dated as at 07 April 2015. 2 All market data included in this report are dated as at close 31 March 2015, unless otherwise indicated in the report. 3 HSBC has procedures in place to identify and manage any potential conflicts of interest that arise in connection with its
Research business. HSBC's analysts and its other staff who are involved in the preparation and dissemination of Research operate and have a management reporting line independent of HSBC's Investment Banking business. Information Barrier procedures are in place between the Investment Banking and Research businesses to ensure that any confidential and/or price sensitive information is handled in an appropriate manner.
75
Natural Resources & Energy EEMEA – Oil and Gas 7 April 2015
abc
Disclaimer * Legal entities as at 30 May 2014 ‘UAE’ HSBC Bank Middle East Limited, Dubai; ‘HK’ The Hongkong and Shanghai Banking Corporation Limited, Hong Kong; ‘TW’ HSBC Securities (Taiwan) Corporation Limited; 'CA' HSBC Bank Canada, Toronto; HSBC Bank, Paris Branch; HSBC France; ‘DE’ HSBC Trinkaus & Burkhardt AG, Düsseldorf; 000 HSBC Bank (RR), Moscow; ‘IN’ HSBC Securities and Capital Markets (India) Private Limited, Mumbai; ‘JP’ HSBC Securities (Japan) Limited, Tokyo; ‘EG’ HSBC Securities Egypt SAE, Cairo; ‘CN’ HSBC Investment Bank Asia Limited, Beijing Representative Office; The Hongkong and Shanghai Banking Corporation Limited, Singapore Branch; The Hongkong and Shanghai Banking Corporation Limited, Seoul Securities Branch; The Hongkong and Shanghai Banking Corporation Limited, Seoul Branch; HSBC Securities (South Africa) (Pty) Ltd, Johannesburg; HSBC Bank plc, London, Madrid, Milan, Stockholm, Tel Aviv; ‘US’ HSBC Securities (USA) Inc, New York; HSBC Yatirim Menkul Degerler AS, Istanbul; HSBC México, SA, Institución de Banca Múltiple, Grupo Financiero HSBC; HSBC Bank Brasil SA – Banco Múltiplo; HSBC Bank Australia Limited; HSBC Bank Argentina SA; HSBC Saudi Arabia Limited; The Hongkong and Shanghai Banking Corporation Limited, New Zealand Branch incorporated in Hong Kong SAR; The Hongkong and Shanghai Banking Corporation Limited, Bangkok Branch
Issuer of report
OOO HSBC Bank (RR) (Limited Liability Company) 2 Paveletskaya Square, Building 2
Moscow 115054,
Russian Federation
Telephone: +7 495 721 1515
Fax: 7 495 258 3154
Website: www.research.hsbc.com
In the UK this document has been issued and approved by OOO HSBC Bank (RR) (Limited Liability Company) for the information of its Clients (as defined in the Rules of FCA) and those of its affiliates only. It is not intended for Retail Clients in the UK. If this research is received by a customer of an affiliate of HSBC, its provision to the recipient is subject to the terms of business in place between the recipient and such affiliate. HSBC Securities (USA) Inc. accepts responsibility for the content of this research report prepared by its non-US foreign affiliate. All U.S. persons receiving and/or accessing this report and wishing to effect transactions in any security discussed herein should do so with HSBC Securities (USA) Inc. in the United States and not with its non-US foreign affiliate, the issuer of this report. In Singapore, this publication is distributed by The Hongkong and Shanghai Banking Corporation Limited, Singapore Branch for the general information of institutional investors or other persons specified in Sections 274 and 304 of the Securities and Futures Act (Chapter 289) (“SFA”) and accredited investors and other persons in accordance with the conditions specified in Sections 275 and 305 of the SFA. This publication is not a prospectus as defined in the SFA. It may not be further distributed in whole or in part for any purpose. The Hongkong and Shanghai Banking Corporation Limited Singapore Branch is regulated by the Monetary Authority of Singapore. Recipients in Singapore should contact a "Hongkong and Shanghai Banking Corporation Limited, Singapore Branch" representative in respect of any matters arising from, or in connection with this report. In Australia, this publication has been distributed by The Hongkong and Shanghai Banking Corporation Limited (ABN 65 117 925 970, AFSL 301737) for the general information of its “wholesale” customers (as defined in the Corporations Act 2001). Where distributed to retail customers, this research is distributed by HSBC Bank Australia Limited (AFSL No. 232595). These respective entities make no representations that the products or services mentioned in this document are available to persons in Australia or are necessarily suitable for any particular person or appropriate in accordance with local law. No consideration has been given to the particular investment objectives, financial situation or particular needs of any recipient. This publication has been distributed in Japan by HSBC Securities (Japan) Limited. It may not be further distributed, in whole or in part, for any purpose. In Hong Kong, this document has been distributed by The Hongkong and Shanghai Banking Corporation Limited in the conduct of its Hong Kong regulated business for the information of its institutional and professional customers; it is not intended for and should not be distributed to retail customers in Hong Kong. The Hongkong and Shanghai Banking Corporation Limited makes no representations that the products or services mentioned in this document are available to persons in Hong Kong or are necessarily suitable for any particular person or appropriate in accordance with local law. All inquiries by such recipients must be directed to The Hongkong and Shanghai Banking Corporation Limited. In Korea, this publication is distributed by The Hongkong and Shanghai Banking Corporation Limited, Seoul Securities Branch ("HBAP SLS") for the general information of professional investors specified in Article 9 of the Financial Investment Services and Capital Markets Act (“FSCMA”). This publication is not a prospectus as defined in the FSCMA. It may not be further distributed in whole or in part for any purpose. HBAP SLS is regulated by the Financial Services Commission and the Financial Supervisory Service of Korea. This publication is distributed in New Zealand by The Hongkong and Shanghai Banking Corporation Limited, New Zealand Branch incorporated in Hong Kong SAR.This document is not and should not be construed as an offer to sell or the solicitation of an offer to purchase or subscribe for any investment. HSBC has based this document on information obtained from sources it believes to be reliable but which it has not independently verified; HSBC makes no guarantee, representation or warranty and accepts no responsibility or liability as to its accuracy or completeness. The opinions contained within the report are based upon publicly available information at the time of publication and are subject to change without notice. Nothing herein excludes or restricts any duty or liability to a customer which HSBC has under the Financial Services and Markets Act 2000 or under the Rules of FCA and PRA. A recipient who chooses to deal with any person who is not a representative of HSBC in the UK will not enjoy the protections afforded by the UK regulatory regime. Past performance is not necessarily a guide to future performance. The value of any investment or income may go down as well as up and you may not get back the full amount invested. Where an investment is denominated in a currency other than the local currency of the recipient of the research report, changes in the exchange rates may have an adverse effect on the value, price or income of that investment. In case of investments for which there is no recognised market it may be difficult for investors to sell their investments or to obtain reliable information about its value or the extent of the risk to which it is exposed. In Canada, this document has been distributed by HSBC Bank Canada and/or its affiliates. Where this document contains market updates/overviews, or similar materials (collectively deemed “Commentary” in Canada although other affiliate jurisdictions may term “Commentary” as either “macro-research” or “research”), the Commentary is not an offer to sell, or a solicitation of an offer to sell or subscribe for, any financial product or instrument (including, without limitation, any currencies, securities, commodities or other financial instruments). © Copyright 2015, OOO HSBC Bank (RR) (Limited Liability Company), ALL RIGHTS RESERVED. No part of this publication may be reproduced, stored in a retrieval system, or transmitted, on any form or by any means, electronic, mechanical, photocopying, recording, or otherwise, without the prior written permission of HSBC Bank plc. MICA (P) 157/06/2014, MICA (P) 136/02/2015 and MICA (P) 041/01/2015
[454615]

abc
Metals and Mining
EMEA Thorsten Zimmermann, CFA +44 20 7991 6835 [email protected]
Ash Lazenby +44 20 7991 2351 [email protected]
Emma Townshend +27 21 794 8345 [email protected]
Derryn Maade +27 11 676 4519 [email protected]
North America & Latin America James Steel +1 212 525 3117 [email protected]
Patrick Chidley, CFA +1 212 525 4915 [email protected]
Botir Sharipov, CFA +1 212 525 5150 [email protected]
Howard Wen +1 212 525 3726 [email protected]
Osmar Camilo +55 11 3847 9502 [email protected]
Asia Chris Chen +852 2822 4277 [email protected]
Jeff Yuan +852 3941 7010 [email protected]
Brian Cho +822 3706 8750 [email protected]
Jigar Mistry, CFA +91 22 2268 1079 [email protected]
Jena Han +822 3706 8772 [email protected]
Kirtan Mehta, CFA +91 80 3001 3779 [email protected]
Energy
Europe Gordon Gray Global Sector Head, Oil and Gas +44 20 7991 6787 [email protected]
Christoffer Gundersen Analyst +44 20 7992 1728 [email protected]
Phillip Lindsay +44 207 991 2577 [email protected]
CEEMEA Bülent Yurdagül +90 212 376 46 12 [email protected]
Ildar Khaziev, CFA +7 495 645 4549 [email protected]
Latam Luiz F Carvalho +55 11 3371 8178 [email protected]
Filipe M Gouveia +55 11 3847 5451 [email protected]
Asia Thomas C. Hilboldt, CFA Regional Head of Oil, Gas and Petrochemical Research, Asia Pacific +852 2822 2922 [email protected]
Dennis Yoo, CFA +852 2996 6917 [email protected]
Kumar Manish +91 22 2268 1238 [email protected]
Alok P Deshpande +91 22 681245 [email protected]
Tingting Si +852 2996 6590 [email protected] Hanyu Zhang +852 2996 6539 [email protected]
Chemicals
Europe Dr Geoff Haire Global Sector Head, Chemicals +44 20 7991 6892 [email protected]
Sebastian Satz, CFA +44 20 7991 6894 [email protected]
CEEMEA Yonah Weisz +972 3 710 1198 [email protected]
Sriharsha Pappu, CFA +971 4 423 6924 [email protected]
Nicholas Paton, CFA +971 4 423 6923 [email protected]
Asia Dennis Yoo, CFA +852 2996 6917 [email protected]
Utilities
Europe Adam Dickens +44 20 7991 6798 [email protected]
Verity Mitchell +44 20 7991 6840 [email protected]
Pablo Cuadrado +34 91 456 62 40 [email protected]
Asia Jenny Cosgrove Regional Head of Utilities and Alternative Energy, Asia Pacific +852 2996 6619 [email protected]
Arun Kumar Singh Analyst +91 22 2268 1778 [email protected]
Gloria Ho +852 2996 6941 [email protected]
Summer Y Y Huang +852 2996 6976 [email protected]
Yeon Lee +822 3706 8778 [email protected]
Latin America Francisco Navarrete +55 11 2169 4612 [email protected]
Tatiane Shibata +55 11 2169 4407 [email protected]
CEEMEA Levent Bayar Analyst +90 212 376 46 17 [email protected]
Dmytro Konovalov +7 495 258 3152 [email protected]
Alternative Energy
Jenny Cosgrove Regional Head of Utilities and Alternative Energy, Asia Pacific +852 2996 6619 [email protected]
Sean McLoughlin +44 20 7991 3464 [email protected]
Charanjit Singh +91 80 3001 3776 [email protected]
Gloria Ho +852 2996 6941 [email protected]
Christian Rath, CFA +49 211 910 3049 [email protected]
Specialist Sales
James Lesser +44 20 7991 1382 [email protected]
Mark Van Lonkhuyzen +44 20 7991 1329 [email protected]
Zara Nathan +44 20 7991 5761 [email protected]
Global Natural Resources & Energy Research Team