Embed Size (px)
Citation preview

Natural variation in cardiac metabolism and geneexpression in Fundulus heteroclitusMarjorie F Oleksiak1, Jennifer L Roach2 & Douglas L Crawford2
Individual variation in gene expression is important forevolutionary adaptation1,2 and susceptibility to diseases andpathologies3,4. In this study, we address the functionalimportance of this variation by comparing cardiac metabolismto patterns of mRNA expression using microarrays. There isextensive variation in both cardiac metabolism and theexpression of metabolic genes among individuals of the teleostfish Fundulus heteroclitus from natural outbred populationsraised in a common environment: metabolism differed amongindividuals by a factor of more than 2, and expression levels of94% of genes were significantly different (P o 0.01) betweenindividuals in a population. This unexpectedly high variationin metabolic gene expression explains much of the variationin metabolism, suggesting that it is biologically relevant. Thepatterns of gene expression that are most important inexplaining cardiac metabolism differ between groups ofindividuals. Apparently, the variation in metabolism seems tobe related to different patterns of gene expression in thedifferent groups of individuals. The magnitude of differences ingene expression in these groups is not important; large changesin expression have no greater predictive value than smallchanges. These data suggest that variation in physiologicalperformance is related to the subtle variation in geneexpression and that this relationship differs among individuals.
Variation in gene expression among outbred natural populations canarise from genetic, environmental, developmental or random biolo-gical effects. Considerable variation in mRNA expression has beendocumented. Among the teleost fish Fundulus, 18% of B1,000 cardiacgenes had significantly different levels of gene expression amongindividuals within a population5. Similarly, B24% of loci differ inexpression among strains of yeast6 and among fruit fly genotypes7. Asmany as 50% of alleles at a locus have quantitative differences in geneexpression due to cis-acting factors8. Additionally, B20–33% of theinterindividual variation in gene expression is due to heritable varia-tion in trans-acting factors9,10. Other factors contribute to variation ingene expression: differences in immune status may explain the 3.3%difference in gene expression among genetically identical mice11.
Individual humans have substantial differences in gene expressionbetween blood samples12,13, partly due to changes in white blood cellconstituency and sampling day. Yet, even with this biological variation,consistent gene expression patterns describe differences betweenindividuals13. Whether this natural variation in gene expression affectsphysiological performance or health needs to be investigated.
To investigate the functional importance of natural variation ingene expression, we compared variation in cardiac metabolism withcardiac gene expression among 16 individuals from two populationsof the killifish Fundulus heteroclitus. Local populations of Fundulus arelarge (410,000 individuals) and distributed along the eastern coast ofNorth America. Migration among populations minimizes randomgenetic drift14 but is not frequent enough to extinguish local adapta-tion15,16. These population characteristics make F. heteroclitus an idealspecies in which to investigate natural variation.
We first determined the rate of cardiac metabolism using threedifferent substrates: glucose, fatty acid, and lactate, ketones andalcohol (LKA). For each substrate, we measured metabolism in
Glucose
Fatty acidLKA
M M M G G M G G M M M G G M G G6 5 2 3 1 3 5 9 8 0 7 2 7 4 8 0>1.75
1.501.100.001.10–1
1.50–1
<1.75–1
Relative change
Figure 1 Cardiac metabolism among 16 individuals (identified by numbers)
from populations from northern Maine (M) and southern Georgia (G) using
three substrates: 5 mM glucose; fatty acid (1 mM palmitic acid bound to
bovine serum albumin); and LKA (5 mM lactate, 5 mM each of two ketones:
hydroxybutyrate and acetoacetate, and 0.1% ethanol). Two inhibitors of
glucose utilization (20 mM 2-deoxyglucose and 10 mM iodoacetate) were
included with fatty acid and LKA. Relative changes are based on residuals
from log-regression of body mass with metabolic rates and refer to the ratio
of the individual value to the overall mean. Principal component analysis
among the 16 individuals for all three measures of metabolism was used to
order individuals with respect to overall metabolism. The first principalcomponent factor captures 78% of the variation in metabolism and can be
thought of as a weighted average for each substrate.
Published online 28 November 2004; doi:10.1038/ng1483
1Department of Environmental & Molecular Toxicology, North Carolina State University, Raleigh, North Carolina 27695-7633, USA. 2Division of Marine Biology andFisheries, NIEHS Marine and Freshwater Biomedical Sciences Center, Rosenstiel School of Marine & Atmospheric Science, University of Miami, Miami, Florida, USA.Correspondence should be addressed to D.L.C. ([email protected]).
NATURE GENETICS VOLUME 37 [ NUMBER 1 [ JANUARY 2005 6 7
L E T T E R S©
2005
Nat
ure
Pub
lishi
ng G
roup
ht
tp://
ww
w.n
atur
e.co
m/n
atur
egen
etic
s

triplicate from isolated heart ventricles and then isolated RNA andused it for microarray analyses. Because we raised the fish in acommon environment for 49 months, differences among individualsrepresent genetic and other biological variation expected to be foundamong outbred organisms, including humans.
Cardiac metabolism (corrected for body mass) varied 2.25- to 11-fold among the 16 individuals, depending on substrate (Fig. 1 andSupplementary Table 1 online). The ability of an individual to use asubstrate also varied: individuals that were good at metabolizing onesubstrate often were inferior at using other substrates (Fig. 1), and thecorrelations between substrate-specific metabolism were not signifi-cant (r o 0.4). Even with large variation within populations, therewere significant differences between populations: northern popula-tions had significantly greater metabolic rates for glucose and fattyacid (P o 0.02) and nearly significantly greater rates for LKA (P ¼0.06; P values are not adjusted for multiple testing).
To precisely measure mRNA expression for enzymes that mightaffect metabolism, we examined 119 metabolic genes using micro-arrays in a loop design with 16-fold replication17,18. The expression of94% of genes (112 of 119) was significantly different among indivi-duals in a population (P r 0.01; Fig. 2 and Supplementary Table 2online). We determined significance using a nested analysis of var-iance5 (ANOVA). An ANOVA calculates F statistics, and significantF values require variance among samples to be significantly larger thanunderlying variation19. Thus, the high proportion of significantdifferences between individuals may reflect the precision of microarraymeasurements (average coefficient of variation for the 16 replicatemeasures is 2.6%). To examine type I errors among all 119 genes, wecomputed 1,000 permutations of the original data across all genes andidentified the maximum F value among each permuted set20. Usingthe multiple test–corrected F statistic (P ¼ 2.5 � 10�4), expression of84% of genes (100 of 119) was significantly different. Using Bonfer-roni’s correction yielded the same result. To examine whether one or afew individuals account for this high variation in gene expression, wedetermined the number of genes whose expression was significantlydifferent for all permutations of six out of eight individuals for eachpopulation. In the northern population, 112 genes, on average, had
1.5-fold
2
4
6
8
10
12
14
16
18
log2 difference relative to population mean
–log
10 P
val
ue
–1 –0.5 0 0.5 1 1.5 2 2.5
M M G M G M M G M G G M G G M G5 3 5 7 2 6 0 3 4 8 1 8 9 7 2 0
Group 1 Group 2 Group 3
NADH Fe-S1Aldehyde DH 13-hydroxy-3-methylglutaryl-CoA reductaseAcetyl-CoA acetyltrans 2Acetyl-CoA synIsocitrate DH 3Fatty acid binding 7 brainVacuolar ATP syn CPEP carboxykinaseATPase Cu transporting ATriglyceride lipaseHypoxia inducible factor 3 AHepatocyte nuclear factor 4AForkhead box P2Cyto C oxidase VIIIaNADH Fe-Sox–red 75 KDUbiqL-cyto C red FeSAcid sphingomyelinase-like phosphodiesterase
NADHflavoprotein2ATP syn H+F1 deltaAsp amino transferseNADH-Ub ox–red 19 KDNADH-Ub ox–red B22NADH-Ub ox–red ASHIUbiqL-cyto C red 7.2KDCold inducible RNA-bindingNADH-coenzyme Q reductase 30KDUbiql-cyto C reductase core IATP syn H+transporting F1 g1G3APDHNADH 2ATP syn BCyto C oxidase VIIIbCyto C oxidase VIIACyto C oxidase VIA
M M G M G M M G M G G M G G M G5 3 5 7 2 6 0 3 4 8 1 8 9 7 2 0
a b
Figure 3 Hierarchical cluster of metabolic gene expression. Average level of expression for each individual (16 replicates per individual). Individuals
(columns) with similar patterns of expression among genes are grouped together, and genes (rows) with similar expression among individuals are grouped
together. (a) All 119 metabolic genes. Gene names are supplied in Supplementary Table 2 online. Blue gene trees (left) are shown in b. (b) Select clusters of
genes emphasizing alternating patterns of up-down regulations. For a and b, colors are same as in Figure 1. Center correlation with complete linkage was
used. Individuals (identified by numbers) are from populations from northern Maine (M) and southern Georgia (G).
Figure 2 Significant differences in gene expression in a population versus
difference relative to the population mean. The x axis shows log2 values for
the ratio of minimum (negative log2 values) and maximum values (positive
log2 values) relative to population mean. The y axis shows negative log10
values of P values for significant differences in a population (e.g., 4 is equal
to a P value of 10�4). The gray horizontal box encloses genes with
nonsignificant differences in a population (P 4 0.01). Vertical lines enclose
values where minimum and maximum values differ by a factor of o1.5.
All P values less than 10�17 are truncated to equal 10�17. Blue circles
indicate individuals from northern Maine; red crosses, individuals from
southern Georgia.
6 8 VOLUME 37 [ NUMBER 1 [ JANUARY 2005 NATURE GENETICS
L E T T E R S©
2005
Nat
ure
Pub
lishi
ng G
roup
ht
tp://
ww
w.n
atur
e.co
m/n
atur
egen
etic
s
significantly different expression (P o 0.01, range 104–117). In thesouthern population, 94 genes had significantly different expression(P o 0.01, range 82–106). These data indicate that the statisticallysignificant differences in gene expression were not due to one or fewindividuals or to experimental procedures affecting one or fewindividuals. These differences do not reflect obvious biological differ-ences; all individuals were healthy, postreproductive males. Body mass(range 4.8–31.8 g) also had little effect on gene expression: only 2 of119 genes (1.7%) correlated significantly (P o 0.05) with body mass.
Technical differences probably do not cause the gene expressiondifferences among individuals in a population. All samples werecollected in the morning during a 2-d period, and populations wererandomly associated with days. Additionally, the large number ofdifferences in gene expression was found in each population sepa-rately. Finally, if technical variation was large, statistically significantassociations between gene expression and measures of metabolismwould have been difficult to find.
Although abundant variation occurred among individuals in popu-lations, the expression of 10% of genes (12 of 119) was significantlydifferent between populations (Supplementary Table 3 online). Aftera multiple test Fmax20 correction (P o 5.9 � 10�4), 4 of the 12differences between populations were significant. The differencesbetween populations provide additional evidence for the substantialvariation in gene expression in a species.
Hierarchical clustering of gene expression (Fig. 3) formed threegroups of individuals. All three groups consisted of individuals fromboth populations, and gene clusters were not associated with enzymesfrom one particular pathway. Among groups, gene expression patternsalternated (Fig. 3b): genes upregulated in individuals from group 2were downregulated in individuals from group 3 and vice versa. Thecorrelations for gene expression among individuals and between thesegroups reflect this alternating pattern of expression: the correlationcoefficient between groups 1 and 3 was �0.58 (P o 0.01), betweengroups 2 and 3 was �0.87 (P o 0.01) and between groups 2 and 1 was0.11 (P 4 0.05), whereas all 21 significant correlations amongindividuals in a group were positive (Supplementary Table 4 online).There were fewer differences in gene expression among groupedindividuals (74–90) than within populations (112) and more differ-ences between groups (50) than between populations (12). Thesetwo observations are improbable (P o 0.01) based on randompermutations of the data.
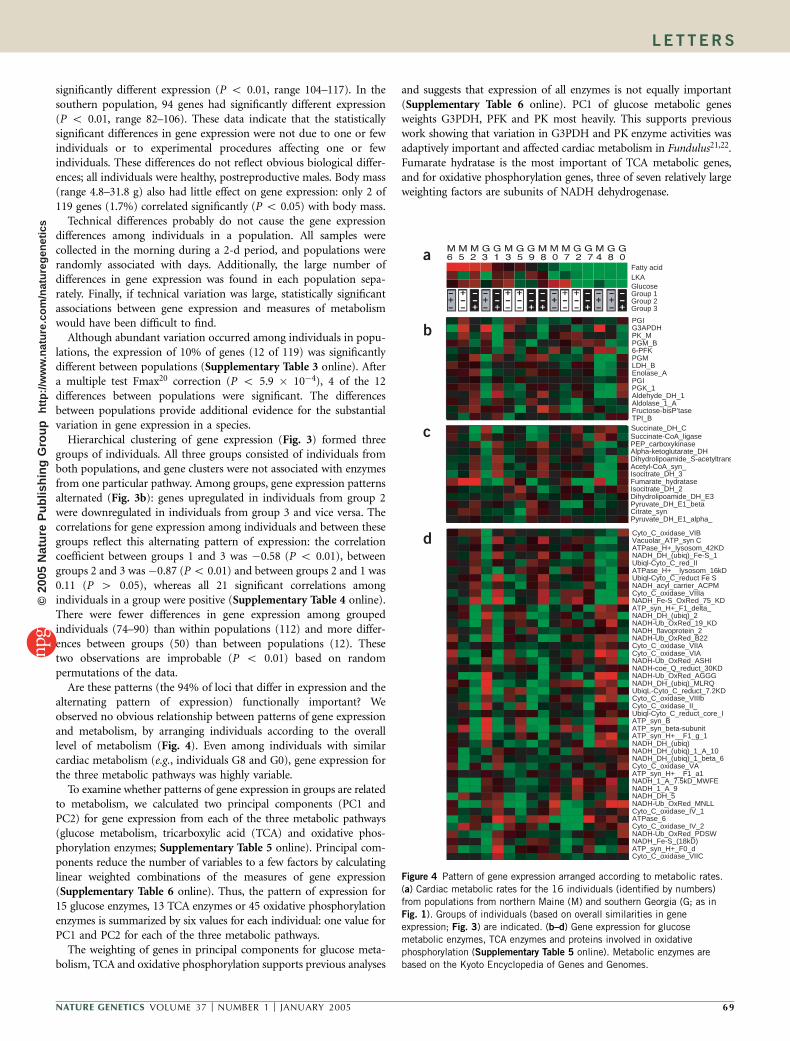
Are these patterns (the 94% of loci that differ in expression and thealternating pattern of expression) functionally important? Weobserved no obvious relationship between patterns of gene expressionand metabolism, by arranging individuals according to the overalllevel of metabolism (Fig. 4). Even among individuals with similarcardiac metabolism (e.g., individuals G8 and G0), gene expression forthe three metabolic pathways was highly variable.
To examine whether patterns of gene expression in groups are relatedto metabolism, we calculated two principal components (PC1 andPC2) for gene expression from each of the three metabolic pathways(glucose metabolism, tricarboxylic acid (TCA) and oxidative phos-phorylation enzymes; Supplementary Table 5 online). Principal com-ponents reduce the number of variables to a few factors by calculatinglinear weighted combinations of the measures of gene expression(Supplementary Table 6 online). Thus, the pattern of expression for15 glucose enzymes, 13 TCA enzymes or 45 oxidative phosphorylationenzymes is summarized by six values for each individual: one value forPC1 and PC2 for each of the three metabolic pathways.
The weighting of genes in principal components for glucose meta-bolism, TCA and oxidative phosphorylation supports previous analyses
and suggests that expression of all enzymes is not equally important(Supplementary Table 6 online). PC1 of glucose metabolic genesweights G3PDH, PFK and PK most heavily. This supports previouswork showing that variation in G3PDH and PK enzyme activities wasadaptively important and affected cardiac metabolism in Fundulus21,22.Fumarate hydratase is the most important of TCA metabolic genes,and for oxidative phosphorylation genes, three of seven relatively largeweighting factors are subunits of NADH dehydrogenase.
Group 1
Fatty acidLKAGlucose
Group 2Group 3
Cyto_C_oxidase_VIBVacuolar_ATP_syn CATPase_H+_lysosom_42KDNADH_DH_(ubiq)_Fe-S_1Ubiql-Cyto_C_red_IIATPase_H+__lysosom_16kDUbiql-Cyto_C_reduct Fe SNADH_acyl_carrier_ACPMCyto_C_oxidase_VIIIaNADH_Fe-S_OxRed_75_KDATP_syn_H+_F1_delta_NADH_DH_(ubiq)_2NADH-Ub_OxRed_19_KDNADH_flavoprotein_2NADH-Ub_OxRed_B22Cyto_C_oxidase_VIIACyto_C_oxidase_VIANADH-Ub_OxRed_ASHINADH-coe_Q_reduct_30KDNADH-Ub_OxRed_AGGGNADH_DH_(ubiq)_MLRQUbiqL-Cyto_C_reduct_7.2KDCyto_C_oxidase_VIIIbCyto_C_oxidase_II_Ubiql-Cyto_C_reduct_core_IATP_syn_BATP_syn_beta-subunitATP_syn_H+__F1_g_1NADH_DH_(ubiq)NADH_DH_(ubiq)_1_A_10NADH_DH_(ubiq)_1_beta_6Cyto_C_oxidase_VAATP_syn_H+__F1_a1NADH_1_A_7.5kD_MWFENADH_1_A_9NADH_DH_5NADH-Ub_OxRed_MNLLCyto_C_oxidase_IV_1ATPase_6Cyto_C_oxidase_IV_2NADH-Ub_OxRed_PDSWNADH_Fe-S_(18kD)ATP_syn_H+_F0_dCyto_C_oxidase_VIIC
Succinate_DH_CSuccinate-CoA_ligasePEP_carboxykinaseAlpha-ketoglutarate_DHDihydrolipoamide_S-acetyltransAcetyl-CoA_syn_Isocitrate_DH_3Fumarate_hydrataseIsocitrate_DH_2Dihydrolipoamide_DH_E3Pyruvate_DH_E1_betaCitrate_synPyruvate_DH_E1_alpha_
PGIG3APDHPK_MPGM_B6-PFKPGMLDH_BEnolase_APGIPGK_1Aldehyde_DH_1Aldolase_1_AFructose-bisP’taseTPI_B
a
b
c
d
Figure 4 Pattern of gene expression arranged according to metabolic rates.
(a) Cardiac metabolic rates for the 16 individuals (identified by numbers)
from populations from northern Maine (M) and southern Georgia (G; as in
Fig. 1). Groups of individuals (based on overall similarities in gene
expression; Fig. 3) are indicated. (b–d) Gene expression for glucose
metabolic enzymes, TCA enzymes and proteins involved in oxidative
phosphorylation (Supplementary Table 5 online). Metabolic enzymes are
based on the Kyoto Encyclopedia of Genes and Genomes.
NATURE GENETICS VOLUME 37 [ NUMBER 1 [ JANUARY 2005 6 9
L E T T E R S©
2005
Nat
ure
Pub
lishi
ng G
roup
ht
tp://
ww
w.n
atur
e.co
m/n
atur
egen
etic
s

Most variation in cardiac metabolism is explained by combinationsof gene expression (Fig. 5). To define which sets of genes are mostinformative, we used a step-wise regression analysis with substrate-specific metabolism as the dependent variable to select among the sixprincipal components (Fig. 5 and Supplementary Table 7 online).Although we calculated principal components based on gene expres-sion for all 16 individuals, the same principal component does notexplain metabolism for all three groups of individuals (Fig. 5), nordoes any principal component account for more than 34% ofmetabolic variation among all individuals (Supplementary Table 7online). Instead, among the three groups, different patterns of geneexpression (different principal components) explain substrate-specificmetabolism. Only once does the same principal component have asimilar effect on metabolism in different groups (Fig. 5b,c).
Do the three groups represent meaningful combinations of indivi-duals, or could they occur by chance? We found that fewer differencesin gene expression occur in groups than occur randomly, moredifferences occur between groups than among random permutationsand higher correlations in gene expression exist within groups thanbetween them (Supplementary Table 4 online). Finally, alternategroups (formed by random permutations) that explain metabolismwith equivalent significances occur with frequencies of 1.7%, 2.85% or4.8% for glucose, fatty acid or LKA, respectively, indicating that theserelationships are unlikely to occur by chance.
We suggest that associations between mRNA expression and meta-bolism are meaningful. First, mRNAs for these metabolic genes encodeenzymes that catalyze and regulate catabolism of substrates, and therate of catalysis affects metabolism, not the other way around. Second,the summation of gene expression in a pathway (the principalcomponents) is experimentally independent of measures of metabolicrates. The regression analyses indicate statistically significant associa-tions between specific principal components and substrate-specificmetabolism, suggesting that they are biologically dependent. Finally,associated changes in metabolism and metabolic gene expression areexpected (e.g., glucose metabolism is related to expression of eitherglucose enzymes or oxidative phosphorylation genes). What is unex-pected are the variations: variation in how well an individual uses a
Group 1individuals
Group 3individuals
Group 2individuals
0.8
0.4
0.0
– 0.4
–1.0
1.0 1.4 1.8 2.2 2.6 3.0 13.8 14.2 14.6 15.0
–0.5 0.0 0.5 1.5 –22
–25 –24 –23
–20 –18 –22 –20 –181.0
0.2
0.1
0.0
– 0.1
– 0.2
– 0.3
1.0
0.0
–1.0
–2.0
–3.0
PC2 Gly
13.8 14.2 14.6 15.0
PC2 Gly
PC2 OxP
–25 –24 –23
PC2 OxP
PC1 TCA
PC1 OxP PC1 OxPPC1 Gly
–1.0 –0.5 0.0 0.5 1.51.0
PC1 Gly
P = 0.04
P = 0.04
P = 0.04 P = 0.07
P = 0.03 P = 0.03
P = 0.10 P = 0.04
P < 0.001
R2 = 81%
R2 = 80%
R2 = 78%
R2 = 61%
R2 = 64%
R2 = 65%
R2 = 58% R2
= 75%
R2 = 70%
Glu
cose
met
abol
ism
Fat
ty a
cid
met
abol
ism
LKA
met
abol
ism
a b c
d e f
g h i
Figure 5 Different patterns of gene expression explain the variation in
metabolism. The group-specific (group indicated at the top of each column)
relationships between substrate-specific metabolism (y axis) and the most
informative principal component (x axis; bold line, filled symbols) are shown.
Individuals from the other groups (hollow symbols, thin lines) are included
in each graph to illustrate the differences among groups. The most
informative principal components (Supplementary Table 6 online) were
defined by step-wise regression. The R2 value is for the relationship between
the principal component listed and metabolism. The P value is given for the
final step-wise regression involving one or more principal components
(Supplementary Table 7 online). Groups of individuals were as in Figure 3.
Blue squares, group 1; red stars, group 2; green circles, group 3. Gly,
glucose metabolic enzymes; OxP, oxidative phosphorylation enzymes; TCA,
Krebs cycle (TCA) enzymes.
Relative changeRelative changeRelative change
Abs
olut
e co
rrel
atio
n co
effic
ient
Abs
olut
e co
rrel
atio
n co
effic
ient
Abs
olut
e co
rrel
atio
n co
effic
ient
All 16 Group 3Group 2Group 1
1.5
1.0
0.8
0.6
0.4
0.2
0.0
2 2.5 3 3.5 41.5
1.0
0.8
0.6
0.4
0.2
0.0
2 2.5 3 3.5 41.5
1.0
0.8
0.6
0.4
0.2
0.0
2 2.5 3 3.5 4
a b c
Figure 6 Relative changes versus correlation with metabolism. Relative changes (maximum:minimum ratio; on the x axis) for group 1 (blue squares),
group 2 (red circles), group 3 (green diamonds) or all 16 individuals (black triangle) are plotted against the absolute values of the correlation coefficients
of gene expression with the three measures of metabolism (a, glucose; b, fatty acid; c, LKA; on the y axis). Relative changes in gene expression in a group
are correlated with the variation among individuals with r 4 0.91 (i.e., larger variation among individuals with larger maximum:minimum ratios). If genes
with large differences in expression are more important, genes with large variation (and, therefore, large relative differences) should have larger correlations
with metabolism.
7 0 VOLUME 37 [ NUMBER 1 [ JANUARY 2005 NATURE GENETICS
L E T T E R S©
2005
Nat
ure
Pub
lishi
ng G
roup
ht
tp://
ww
w.n
atur
e.co
m/n
atur
egen
etic
s
substrate, variation in mRNA expression and variation among groupsin which genes are associated with substrate-specific metabolism.
Many studies use arbitrary relative changes (e.g., by a factor of 2) todesignate important changes in gene expression. To investigate whethergenes with large changes in expression have a more significant relation-ship with metabolism, we plotted the correlation of gene expressionwith metabolism against the relative change in gene expression (Fig. 6).There was little relationship between the magnitude of the differencesin gene expression among individuals and the strength of the correla-tion to metabolism (Fig. 6; r2 o 8%, P 4 0.5). In each of the threegroups of individuals, many genes were highly correlated with sub-strate-specific metabolism. But only in group 1 were genes whoseexpression changed by a factor of 42 highly correlated with all threemeasures of metabolism. Yet even these correlations were no greaterthan those for genes with relatively small changes in expression. Thesedata suggest that small relative changes in gene expression can be asfunctionally important as larger ones; therefore, arbitrarily setting arelative difference as biologically important is inappropriate.
Metabolism and metabolic gene expression in heart ventriclesisolated from ‘common gardened’ male F. heteroclitus varied consider-ably (Figs. 1–3): substrate-specific metabolism varied by a factor of2–11, and expression of 94% of genes was significantly different(P o 0.01) between individuals in a population. These differencesrepresent variation expected among natural outbred populations andarises from genetic and other biological sources of variation. Mostdifferences in gene expression in a population are small: expression ofo16% of significant genes changed by a factor of 42. For Fundulus,the many subtle variations in gene expression account for thedifferences in cardiac metabolism, suggesting that the variation ingene expression is biologically meaningful. Unexpectedly, the patternsof gene expression that explain substrate-specific metabolism aredifferent for the three groups of individuals.
Our data, and other studies5,12,13, identify abundant variationamong individuals. Failure to consider this type of biological variationcan result in the misidentification of genes that merely representstanding genetic or natural biological variation as ‘important’.
METHODSOrganism. We collected teleost fish F. heteroclitus at Wiscasset, Maine, and
Sapelo Island, Georgia, by seine and minnow trap, kept them in controlled
temperature and aeration conditions and acclimated them to common condi-
tions (20 1C, 15 ppt salinity) in recirculating aquaria for at least nine months
before experiments. We killed fish by cervical dislocation, measured heart
ventricular metabolism and then stored the ventricle in RNAlater (Ambion
Inc.) at �20 1C. We used only healthy male fish.
Metabolism. We determined metabolism in isolated male heart ventricles by
measuring the use of oxygen in a closed, well-mixed chamber. We measured
metabolic rates in triplicate for each of three different substrates: 5 mM glucose,
1 mM fatty acid (palmitic acid–bovine serum albumin) or LKA (5 mM lactate,
ketones and 0.1% ethanol). We used two inhibitors of glucose metabolism
(20 mM 2-deoxy-glucose and 10 mM iodoacetic acid) when measuring fatty
acid and LKA metabolism. We isolated heart ventricles, expelled blood and then
splayed them open to expose internal surfaces. The total time to isolate heart
ventricles and measure metabolism in triplicate for all three substrates was B20
min. Heart metabolism is stable for 445 min for these conditions. Because all
measures of metabolism are affected by body mass, we used residuals from log10
regression of body mass versus metabolism for all analyses. These measures of
cardiac metabolism are uncorrelated with body mass (r o 0.14, P 4 0.2).
RNA isolation. We isolated total RNA from male heart ventricles using a
modified guanidinium thiocyanate buffer and then purified it using the Qiagen
RNeasy Mini kit in accordance with the manufacturer’s protocols. We
quantified purified RNA spectrophotometrically and assessed RNA quality
using the Agilent 2100 Bioanalyzer. We prepared RNA for hybridization by
amplification using Ambion Amino Allyl MessageAmp aRNA Kit to form copy
template RNA by T7 amplification. Amino-allyl UTP was incorporated into
targets during T7 transcription, and resulting amino-allyl aRNA was coupled to
Cy3 and Cy5 dyes (Amersham Biosciences).
Microarrays. We printed microarrays using 192 cDNAs from a F. heteroclitus
cardiac library encoding essential proteins for cellular metabolism based on the
Kyoto Encyclopedia of Genes and Genomes. These cDNAs were a subset of
440,000 expressed sequences in our database, all of which may be found at our
project website23,24. These 192 cDNAs were amplified with amine-linked
primers and printed on 3D Link Activated slides (Surmodics Inc.) using a
SpotArray Enterprise piezoelectric microarray printer (PerkinElmer Life
Sciences Inc.) at Louisiana State University. Slides were blocked in accordance
with slide manufacturer protocols. We printed the suite of 192 amplified
cDNAs as a group in eight spatially separated replicates. We printed four
hybridization zones of these eight replicate arrays per slide, with each zone
separated by a hydrophobic barrier.
Of the 192 genes, we analyzed only 119. Eight of the unanalyzed genes were
negative controls: random genomic amplification or Ctenophore-specific
cDNAs (gift from M. Q. Martindale, University of Hawaii). The other 65
unanalyzed genes either saturated the photomultiplier tube or had signals less
than the negative controls. All measures of gene expression were normalized by
sum normalization and regional lowess as implemented in R (see URLs).
The loop design was used previously5,17. This approach does not rely on
hybridization to a single reference. Instead, each individual is hybridized to two
slides totaling 16 arrays (each slide had eight, spatially separated, replicate
arrays) and each array is hybridized with two individuals: one individual
labeled with Cy3 and the other with Cy5. Each slide had different combinations
of individuals. The loop formed was M6-G0-M2-G2-M5-G3-M4-G8-M0-G1-M8-G7-M3-G5-M7-G9-M6, where each arrow
represents a separate hybridization with the individual at the base of the arrow
labeled with Cy3 and the individual at the head of the arrow labeled with Cy5.
We carried out statistical analyses of metabolic data and step-wise regression
using StatView (version 5; SAS Institute). Statistical analyses of microarray data,
principal components, permutations and correlations used matrix algebra
programming environment (MATLAB Version 6.5.1, Math Works). We deter-
mined significant differences in gene expression using a nested analysis of
variance5. To correct for type I errors among all 119 genes, we computed 1,000
permutations of the original data across all genes and identified the maximum
F value among each permuted set20. These corrected P values yielded the same
results as a Bonferroni correction. Principal components analysis utilized
MATLAB ‘‘princomp’’ subroutines that use covariance matrices to calculate
principal components. Hierarchical clustering of gene expression (Fig. 3) used
the Macintosh version25 of Eisen’s Cluster and Treeview26. We used differences
from the grand mean and clustered them by both genes and individuals using
centered correlations with complete linkage. There are 4,368 possible combina-
tions of 5 out of 16 individuals; 2,052 of these do not contain a majority of
members (three or more) from the defined groups (Fig. 3). We used these 2,052
combinations of individuals to test the statistical significance in these groups.
To examine whether the three defined groups are better than a random
combination of individuals, we selected 1,000 random samples of the 2 �1013 possible permutation of 16 individuals. We divided them into three groups
(1–5 for group 1, 6–10 for group 2 and 11–16 for group 3). We applied
ANOVA, with the MSerror calculated from the variance among individuals, to
each group for each gene and determined the number of genes that were
significantly different among groups for each of the 1,000 random permuta-
tions. To examine the robustness of the relationship between metabolism and
the six principal components, we regressed the principal component for each of
three groups from 1,000 random permutations against each measure of
metabolism (6,000 regressions per measure of metabolism) and identified the
principal component with the lowest P value for each group. We used the three
principal components with the lowest P values (one per group) to define the
joint probability for the three groups’ relationships to each measure of
metabolism. We compared these joint probabilities from the minimal P values
for the random permutations (one for each measure of metabolism) with the
NATURE GENETICS VOLUME 37 [ NUMBER 1 [ JANUARY 2005 7 1
L E T T E R S©
2005
Nat
ure
Pub
lishi
ng G
roup
ht
tp://
ww
w.n
atur
e.co
m/n
atur
egen
etic
s
joint probabilities from the defined three groups (Fig. 3) for the first principal
component entered into the step-wise regression.
URLs. Our project website is available at http://crawford.rsmas.miami.edu.
The Kyoto Encyclopedia of Genes and Genomes is available at http://www.
genome.ad.jp/kegg. The FunnyBase Fundulus EST database is available at http://
genomics.rsmas.Miami.edu/funnybase/super_craw4. R/MAANOVA is available
at http://www.jax.org/staff/churchill/labsite/software/anova/rmaanova/index.
html. The article ‘‘Normalization of cDNA microarray data’’ is available at
http://www.stat.berkeley.edu/users/terry/zarray/Html/normspie.html. Hierar-
chical Clustering (Mac) is available at http://bonsai.ims.u-tokyo.ac.jp/
~mdehoon/software/cluster/software.htm#ctv. Eisen’s Hierarchical Clustering
is available at http://rana.lbl.gov/EisenSoftware.htm.
Note: Supplementary information is available on the Nature Genetics website.
ACKNOWLEDGMENTSWe thank S. Hand for use of the pizeo-electric microarray printer and for criticalbut insightful thoughts and reading of the manuscript and G. Churchill, A.Whitehead, A. Clark and M. Q. Martindale for discussions and critical reading ofthe manuscript. This work was supported by the US National Science Foundation(Division of Ocean Sciences) and the US National Institutes of Health (NationalHeart, Lung, and Blood Institute and National Institute of EnvironmentalHealth Sciences).
COMPETING INTERESTS STATEMENTThe authors declare that they have no competing financial interests.
Received 20 September; accepted 1 November 2004
Published online at http://www.nature.com/naturegenetics/
1. Pierce, V.A. & Crawford, D.L. Phylogenetic analysis of glycolytic enzyme expression.Science 276, 256–259 (1997).
2. Ferea, T.L., Botstein, D., Brown, P.O. & Rosenzweig, R.F. Systematic changes in geneexpression patterns following adaptive evolution in yeast. Proc. Natl. Acad. Sci. USA96, 9721–9726 (1999).
3. Sorlie, T. et al. Gene expression patterns of breast carcinomas distinguish tumorsubclasses with clinical implications. Proc. Natl. Acad. Sci. USA 98, 10869–10874(2001).
4. Alizadeh, A.A. et al. Distinct types of diffuse large B-cell lymphoma identified by geneexpression profiling. Nature 403, 503–511 (2000).
5. Oleksiak, M.F., Churchill, G.A. & Crawford, D.L. Variation in gene expression within andamong natural populations. Nat. Genet. 32, 261–266 (2002).
6. Brem, R.B., Yvert, G., Clinton, R. & Kruglyak, L. Genetic dissection of transcriptionalregulation in budding yeast. Science 296, 752–755 (2002).
7. Jin, W. et al. The contributions of sex, genotype and age to transcriptional variance inDrosophila melanogaster. Nat. Genet. 29, 389–395 (2001).
8. Knight, J.C. Allele-specific gene expression uncovered. Trends Genet. 20, 113–116(2004).
9. Bray, N.J., Buckland, P.R., Owen, M.J. & O’Donovan, M.C. Cis-acting variation in theexpression of a high proportion of genes in human brain. Hum. Genet. 113, 149–153(2003).
10. Yvert, G. et al. Trans-acting regulatory variation in Saccharomyces cerevisiae and therole of transcription factors. Nat. Genet. 35, 57–64 (2003).
11. Pritchard, C.C., Hsu, L., Delrow, J. & Nelson, P.S. Project normal: Defining normalvariance in mouse gene expression. Proc. Natl. Acad. Sci. USA 98, 13266–13271(2001).
12. Whitney, A.R. et al. Individuality and variation in gene expression patterns in humanblood. Proc. Natl. Acad. Sci. USA 100, 1896–1901 (2003).
13. Radich, J.P. et al. Individual-specific variation of gene expression in peripheral bloodleukocytes. Genomics 83, 980–988 (2004).
14. Brown, B.L. & Chapman, R.W. Gene flow and mitochondrial DNA variation in thekillifish Fundulus heteroclitus. Evolution 45, 1147–1161 (1991).
15. Crawford, D.L. & Powers, D.A. Molecular basis of evolutionary adaptation at the lactatedehydrogenase-B locus in the fish Fundulus heteroclitus. Proc. Natl. Acad. Sci. USA86, 9365–9369 (1989).
16. Powers, D.A. et al. A multidisciplinary approach to the selectionist/neutralist con-troversy using the model teleost, variation Fundulus heteroclitus. in Oxford Surveys inEvolutionary Biology (eds. Futuyma, D. & Antonovics, J.) 43–108 (Oxford UniversityPress, New York, 1993).
17. Kerr, M.K. et al. Statistical analysis of a gene expression microarray experiment withreplication. Statistica Sinica 12, 203–217 (2002).
18. Kerr, M.K. & Churchill, G.A. Statistical design and the analysis of gene expressionmicroarray data. Genet. Res. 77, 123–128 (2001).
19. Sokal, R.R. & Rohlf, F.J. Biometry (W.H. Freeman, New York, 1981).20. Westfall, P.H. & Young, S.S. Resampling-Based Multiple Testing: Examples and
Methods for P-Value Adjustment 340 (Wiley, New York, 1993).21. Pierce, V.A. & Crawford, D.L. Phylogenetic analysis of glycolytic enzyme expression.
Science 275, 256–259 (1997).22. Podrabsky, J.E., Javillonar, C., Hand Steven, C. & Crawford, D.L. Intraspecific variation
in aerobic metabolism and glycolytic enzyme expression in heart ventricles. Am. J.Physiol. 279, R2344–R2348 (2000).
23. Paschall, J.E. et al. FunnyBase: a systems level functional annotation of FundulusESTs for the analysis of gene expression. BMC Genomics (in the press).
24. Oleksiak, M.F., Kolell, K. & Crawford, D.L. The utility of natural populations formicroarray analyses: isolation of genes necessary for functional genomic studies.Mar. Biotechnol. 3, S203–S211 (2001).
25. de Hoon, M.J., Imoto, S., Nolan, J. & Miyano, S. Open source clustering software.Bioinformatics 20, 1453–1454 (2004).
26. Eisen, M.B., Spellman, P.T., Brown, P.O. & Botstein, D. Cluster analysis and display ofgenome-wide expression patterns. Proc. Natl. Acad. Sci. USA 95, 14863–14868(1998).
7 2 VOLUME 37 [ NUMBER 1 [ JANUARY 2005 NATURE GENETICS
L E T T E R S©
2005
Nat
ure
Pub
lishi
ng G
roup
ht
tp://
ww
w.n
atur
e.co
m/n
atur
egen
etic
s