Embed Size (px)
Citation preview
1
Natural variation in expression of the HECT E3 ligase
UPL3 influences seed size and crop yields in Brassica
napus by altering regulatory gene expression.
Charlotte Miller1, Rachel Wells1, Neil McKenzie1, Martin Trick1, Joshua Ball1, Abdelhak Fatihi2,
Bertrand Debreuq2, Thierry Chardot2, Loic Lepiniec2, Michael W Bevan1*
1 Department of Cell and Developmental Biology, John Innes Centre, Norwich UK
2 Institut Jean-Pierre Bourgin, INRA, AgroParisTech, CNRS, Université Paris-Saclay, INRA
Versailles, route de Saint-Cyr, FR
*Corresponding author
Michael W. Bevan. Orcid ID 0000-0001-8264-2354
Cell and Developmental Biology Dept
John Innes Centre
Norwich Research Park
Norwich NR4 7UH, UK
Tel +44 1603 450520
All rights reserved. No reuse allowed without permission. The copyright holder for this preprint (which was not peer-reviewed) is the author/funder.. https://doi.org/10.1101/334581doi: bioRxiv preprint
All rights reserved. No reuse allowed without permission. The copyright holder for this preprint (which was not peer-reviewed) is the author/funder.. https://doi.org/10.1101/334581doi: bioRxiv preprint
All rights reserved. No reuse allowed without permission. The copyright holder for this preprint (which was not peer-reviewed) is the author/funder.. https://doi.org/10.1101/334581doi: bioRxiv preprint
All rights reserved. No reuse allowed without permission. The copyright holder for this preprint (which was not peer-reviewed) is the author/funder.. https://doi.org/10.1101/334581doi: bioRxiv preprint
All rights reserved. No reuse allowed without permission. The copyright holder for this preprint (which was not peer-reviewed) is the author/funder.. https://doi.org/10.1101/334581doi: bioRxiv preprint
All rights reserved. No reuse allowed without permission. The copyright holder for this preprint (which was not peer-reviewed) is the author/funder.. https://doi.org/10.1101/334581doi: bioRxiv preprint
All rights reserved. No reuse allowed without permission. The copyright holder for this preprint (which was not peer-reviewed) is the author/funder.. https://doi.org/10.1101/334581doi: bioRxiv preprint
2
Abstract
Identifying genetic variation that increases crop yields is a primary objective in plant breeding.
We have used association analyses of Brassica napus (oilseed rape/canola) accessions to
identify genetic variation in the promoter of a HECT E3 ligase gene, BnaUPL3.C03, that
influences seed size and final yield. We establish a mechanism in which UPL3 mediates the
proteasomal degradation of LEC2, a master regulator of seed maturation. Reduced UPL3
expression increases LEC2 protein levels and prolongs the expression of lipid biosynthetic
genes and seed maturation. Natural variation in BnaUPL3.C03 expression has not yet been
exploited in current Brassica napus breeding lines and can thus be used as a new approach to
maximize future yields in this important oil crop.
All rights reserved. No reuse allowed without permission. The copyright holder for this preprint (which was not peer-reviewed) is the author/funder.. https://doi.org/10.1101/334581doi: bioRxiv preprint
3
Introduction
In major oil-producing crops, such as Brassica napus (oilseed rape), the composition of seed
storage lipids has been optimised for different end uses, from human nutrition to industrial
applications, by identifying allelic variation in biosynthetic enzymes and pathways1. For
example, elite oilseed rape varieties now have greatly enhanced nutritional value, with high
linoleic acid, reduced erucic acid and optimal linoleic to linolenic acid ratios. However,
increasing overall production of storage lipids to meet projected future demands for both food
and industrial uses remains a key objective for achieving food security and sustainable industrial
production.
An interacting network of transcription factors establishes and maintains embryo development
and promotes the accumulation of seed storage lipid and protein2,3. Loss-of-function mutations
in four conserved regulatory genes lead to curtailed seed maturation, loss of dormancy, and
ectopic vegetative development. FUSCA3 (FUS3), ABSCISIC ACID INSENSITIVE 3 (ABI3) and
LEAFY COTYLEDON 2 (LEC2) encode AFL-B3-family transcription factors, while LEAFY
COTYLEDON 1 (LEC1) encodes an NFY-Y CCAAT binding transcription factor. These “LAFL”
genes4,5 induce seed maturation and inhibit germination, and are down-regulated at the initiation
of seed dormancy and desiccation tolerance. LEC2 and FUS3 expression is repressed by
miRNA-mediated mechanisms during early embryogenesis6,7 to ensure the correct timing of
storage reserve accumulation. At later stages of seed development, the B3-domain protein
VAL3 recruits Histone Deacetylase19 (HDAC19) to the promoters of LAFL genes and silences
their expression by altering levels of histone methylation and acetylation8. The stability of LAFL
proteins is also controlled during seed maturation and dormancy. ABI3-interacting protein 2
(AIP2) is an E3 ligase that ubiquitylates both ABI39 and FUS310, suggesting that regulation of
All rights reserved. No reuse allowed without permission. The copyright holder for this preprint (which was not peer-reviewed) is the author/funder.. https://doi.org/10.1101/334581doi: bioRxiv preprint
4
LAFL protein levels has an important role in seed maturation and the transition to dormancy.
The SNF kinase AKIN10 phosphorylates and stabilises FUS311,12 and WRI113, a transcription
factor regulated by LEC2 that promotes expression of glycolytic and lipid biosynthesis genes.
Improved understanding of the control of these important seed maturation master regulators will
be important for optimising seed yields.
An important strategy in crop improvement aims to identify new sources of genetic variation
from diverse germplasm resources for increasing crop productivity14. Genome-Wide Association
Studies (GWAS) are increasingly used for identifying variation associated with traits in crops
and their wild relatives. For example, associations between sequence variation, gene
expression levels and oil composition have been used to identify genetic variation in known
genes conferring oil quality traits in oilseed rape15,16. GWAS also has potential for the discovery
of gene functions, and, when utilized fully, can lead to a deeper understanding of mechanisms
underlying complex traits such as crop yield. Here we use Associative Transcriptomics in
Brassica napus to identify genetic variation in the promoter region of BnaUPL3.C03, encoding
an ortholog of the HECT E3 ubiquitin ligase UPL317,18, that is associated with increased seed
size and field yields. We establish a mechanism in which lower expression of BnaUPL3.C03
maintains higher levels of LEC2 protein during seed maturation by reduced UPL3-mediated
LEC2 ubiquitylation, leading to increased seed lipid levels and overall increased seed yields.
Analysis of BnaUPL3.C03 in elite oilseed rape varieties shows that variation in its expression
has not yet been exploited in breeding programmes and thus can be used to increase crop
yields.
Results
Associative Transcriptomics identifies a negative correlation between BnaUPL3.C03
expression and seed weight per pod in B. napus
All rights reserved. No reuse allowed without permission. The copyright holder for this preprint (which was not peer-reviewed) is the author/funder.. https://doi.org/10.1101/334581doi: bioRxiv preprint
5
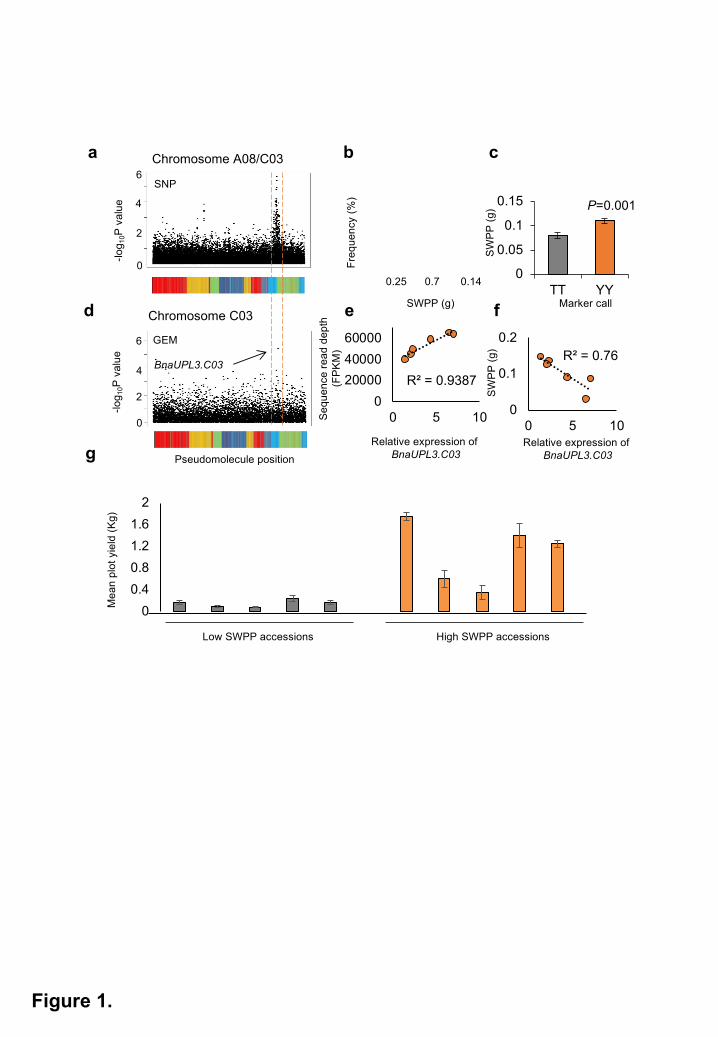
A panel of 94 B. napus oilseed rape accessions with high genetic diversity (Supplementary
Table 1), for which leaf transcriptome data from each accession was mapped to a sequenced
reference genome15, was screened for yield-related phenotypic variation. High levels of trait
variation were observed. Trait associations with both sequence variation, in the form of hemi-
SNPs in the polyploid genome of B. napus, and gene expression levels, assessed as Reads Per
Kilobase per Million (RPKM) mapped reads in a Gene Expression Marker analysis (GEM), were
then calculated. This identified significant associations between variation in seed weight per
pod (SWPP) and SNP variation in homoeologous regions of linkage groups A08 and C03
(Figure 1a and Supplementary Figure 1). SWPP phenotype data displayed a normal distribution
appropriate for Mixed Linear Model analyses (Figure 1b). Assessment of phenotypic variation
segregating with alleles for the most significant SNP marker, JCVI_5587:125, revealed that
accessions inheriting “T” at this locus had SWPP values ~20% lower than those accessions
inheriting the hemi-SNP genotype, “Y” (C/T) (Figure 1c). GEM analyses showed significant
association of SWPP with varying expression of a single C genome-assigned unigene within
this region, C_EX097784. (Figure 1d and Supplementary Figure 1). This unigene corresponded
to an ortholog of the Arabidopsis UBIQUITIN PROTEIN LIGASE 3 (UPL3) encoding a HECT E3
ligase17,18.
Two UPL3 homologs in B. napus, BnaUPL3.C03 and BnaUPL3.A08, were identified based on
protein sequence similarity and conserved synteny between Arabidopsis, B. rapa and B.
oleracea. Supplementary Figure 2 illustrates the high protein sequence similarity between the
single Arabidopsis and two B.napus UPL3 orthologs. Associative Transcriptomics analyses
identified significant differential expression of the BnaUPL3.C03 gene between GWAS
accessions displaying high variation in SWPP (Figure 1d and Supplementary Figure 1). Gene-
specific qRT-PCR analyses confirmed this differential expression at the BnaUPL3.C03 locus in
seedlings of six lines selected for high- or low- SWPP (Figure 1e). Correlating BnaUPL3.C03
All rights reserved. No reuse allowed without permission. The copyright holder for this preprint (which was not peer-reviewed) is the author/funder.. https://doi.org/10.1101/334581doi: bioRxiv preprint
6
expression levels with SWPP revealed a negative relationship, with accessions displaying low
BnaUPL3.C03 exhibiting high SWPP (Figure 1f). qRT-PCR analyses of BnaUPL3.A08
expression in the set of six lines with high- or low- SWPP showed no significant differences in
expression levels and variation in SWPP (Supplementary Figure 3). This is consistent with the
absence of an association between transcript levels at the BnaUPL3.A08 locus and SWPP
determined by Associative Transcriptomics analyses (Supplementary Figure 1).
A subset of 10 GWAS accessions (Supplementary Table 2) exhibiting both differential
expression of BnaUPL3.C03 and high variation in SWPP were grown under field conditions in a
replicated yield trial. Mean plot yields across accessions showed a positive correlation between
SWPP values and plot yields of the accessions (R2=0.49) (Figure 1g), showing that SWPP is an
important measure of seed yield under field conditions.
Previous studies in Arabidopsis, a close relative of B. napus, identified roles for UPL3 in
mediating the proteasomal degradation of GLABROUS 3 (GL3) and ENHANCER OF
GLABROUS 3 (EGL3), both known regulators of trichome morphogenesis. Enhanced
GL3/EGL3 protein levels in a upl3 mutant altered leaf trichome morphogenesis17,18,19.
Assessment of leaf hairs across a subset of B. napus GWAS accessions showing maximal
variation in BnaUPL3.C03 expression revealed segregation of a trichome phenotype
(Supplementary Figure 4), suggesting differential UPL3 expression influences trichome
morphogenesis in oilseed rape. Although AtUPL3 appears to have a conserved role in trichome
morphogenesis, there is no evidence that AtUPL3 has a role in seed development.
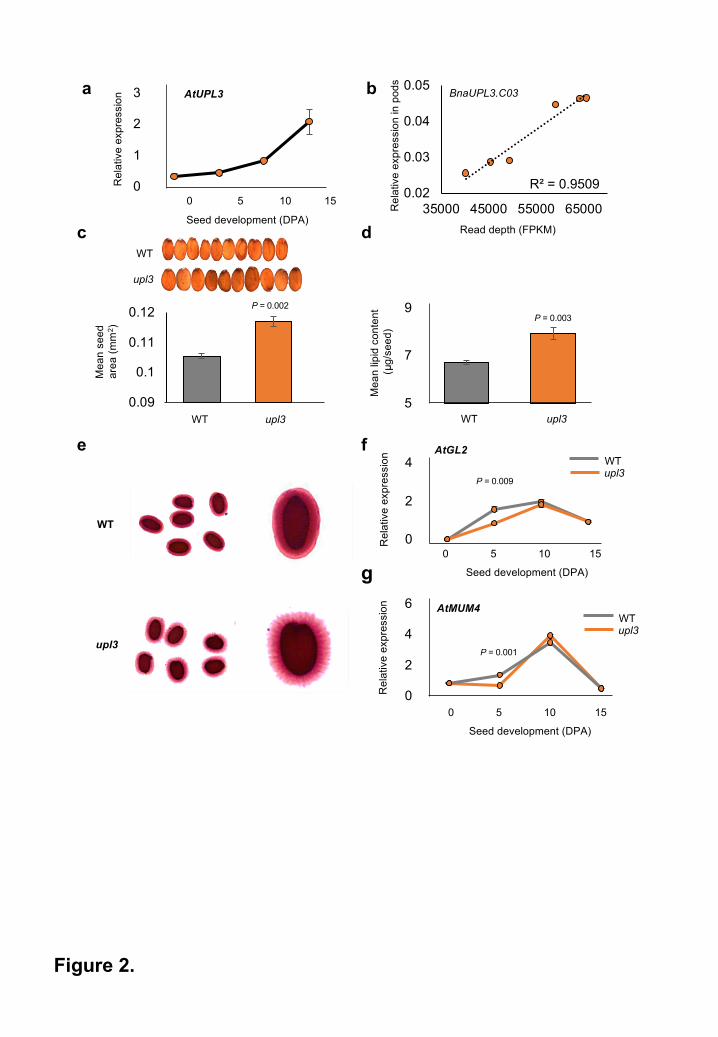
In Arabidopsis, UPL3 transcript levels increased steadily during seed development, with highest
expression levels observed during the seed maturation phase (Figure 2a), suggesting a
potential role for UPL3 in seed maturation. BnaUPL3.C03 is differentially expressed in seedlings
of B. napus accessions displaying high variation in SWPP (Figure 1f), therefore variation of
All rights reserved. No reuse allowed without permission. The copyright holder for this preprint (which was not peer-reviewed) is the author/funder.. https://doi.org/10.1101/334581doi: bioRxiv preprint
7
BnaUPL3.C03 expression was measured using q-RT-PCR in developing pods at 45 Days Post
Anthesis (DPA) in six accessions with low- and high- SWPP. Figure 2b confirms that variation in
BnaUPL3.C03 expression in pods was tightly correlated with that in leaves measured using
RNAseq.
Arabidopsis and B. rapa mutants lacking UPL3 function exhibit increased seed size
The potential role of AtUPL3 in regulating seed development was assessed in an Arabidopsis T-
DNA insertion line (Salk_015534) with complete loss of AtUPL3 expression (data not shown).
upl3 mutant seeds were approximately 10% larger (Figure 2c) and displayed a 12% increase in
lipid content (Figure 2d) relative to seeds of WT plants. Analysis of seed lipid composition
revealed no significant changes in fatty acid composition (Supplementary Table 3). A potential
loss-of-function stop codon in the single B. rapa UPL3 gene was identified using a TILLING
(Targeting Induced Local Lesions IN Genomes) resource for B. rapa 20. Supplementary Figure 5
shows that a line homozygous for the UPL3 mutation had larger seeds compared to a line that
segregated the UPL3 mutation. These results established a potential role for UPL3 in regulating
seed size in Arabidopsis and Brassica.
UPL3 indirectly influences seed mucilage biosynthesis via GL2
Arabidopsis upl3 mutant seeds exhibited altered mucilage extrusion upon imbibition (Figure 2e).
UPL3-mediates the proteasomal degradation of the bHLH transcription factors GL3 and EGL319.
These proteins function as part of a complex to regulate the expression of GLABROUS 2 (GL2),
encoding a homeodomain transcription factor that activates expression of MUCILAGE-
MODIFIED 4 (MUM4), encoding a mucilage biosynthetic enzyme 21. This EGL3/GL3 complex
activates GL2 expression in leaves, but represses GL2 expression in seeds, depending on the
type of MYB transcription factor in the complex 22. The single repeat MYB GmMYB73, a
possible homolog of Arabidopsis TRY and CPC, repressed GL2 expression in seeds and
All rights reserved. No reuse allowed without permission. The copyright holder for this preprint (which was not peer-reviewed) is the author/funder.. https://doi.org/10.1101/334581doi: bioRxiv preprint

8
interacted with EGL3 and GL3 23. Thus, reduced UPL3- mediated destabilization of EGL3 and
GL3 in the upl3 mutant may elevate GL3 and EGL3 levels, leading to increased repression of
GL2 expression. A significant reduction in the expression of both GL2 (Figure 2f) and MUM4
(Figure 2g) was observed at 5DPA in developing seeds of the upl3 mutant, and may explain the
altered mucilage extrusion observed in the Arabidopsis upl3 mutant siliques.
GL2 also negatively regulates seed lipid content by suppression of PHOSPHOLIPASE D
ALPHA 1 (PLDα1) gene expression23. However, no significant difference in the expression of
PLDɑ1 was observed in WT and upl3 mutant seeds (data not shown). Therefore, UPL3 may
target other proteins for degradation during seed maturation that influence seed size and
storage reserve accumulation.
upl3 mutants have increased expression of seed maturation genes
Several genes influence both seed lipid content and seed size in Arabidopsis, including
APETALA 2 (AP2)24, LEC1 and LEC225. The expression of these genes was assessed during
the development of upl3 and WT seeds using q-RT-PCR. No differences in the expression of
AP2 (Figure 3a) or LEC2 (Figure 3b) were seen between upl3 and WT seeds. However,
significant increases in LEC1 expression were observed in upl3 mutant seeds at 10 DPA
compared to WT (Figure 3c). Transcription of LEC1 is positively regulated by LEC226,27. Given
the observed increase in LEC1, but not LEC2, expression, it is possible that altered UPL3
expression may affect LEC2 protein levels, thus altering LEC1 expression in upl3 mutant seeds.
This was tested by measuring expression of WRINKLED 1 (WRI1) and MYB118, which are also
regulated by LEC228,29. Increased expression of both genes was observed in upl3 mutant
siliques relative to WT from 10 Days Post Anthesis (DPA) (Figures 3d and 3e), supporting the
hypothesis that UPL3 may influence LEC2 protein levels and expression of target genes.
UPL3 reduces LEC2-mediated transcription of seed maturation genes
All rights reserved. No reuse allowed without permission. The copyright holder for this preprint (which was not peer-reviewed) is the author/funder.. https://doi.org/10.1101/334581doi: bioRxiv preprint
9
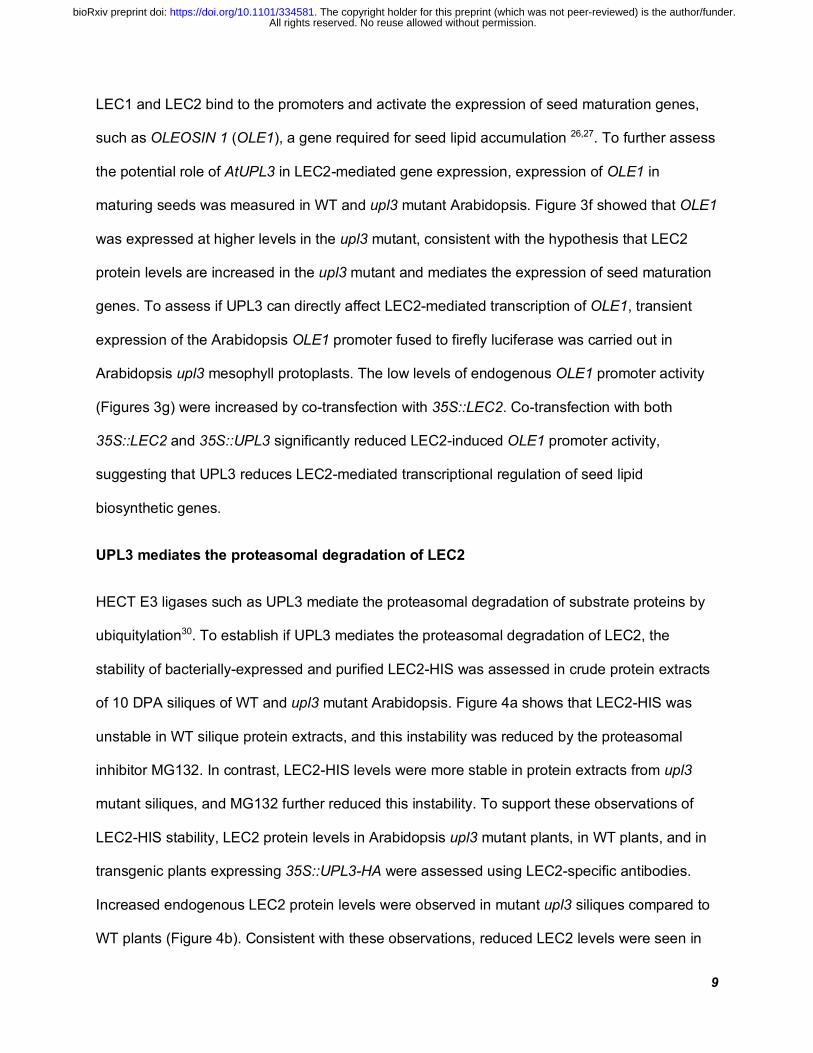
LEC1 and LEC2 bind to the promoters and activate the expression of seed maturation genes,
such as OLEOSIN 1 (OLE1), a gene required for seed lipid accumulation 26,27. To further assess
the potential role of AtUPL3 in LEC2-mediated gene expression, expression of OLE1 in
maturing seeds was measured in WT and upl3 mutant Arabidopsis. Figure 3f showed that OLE1
was expressed at higher levels in the upl3 mutant, consistent with the hypothesis that LEC2
protein levels are increased in the upl3 mutant and mediates the expression of seed maturation
genes. To assess if UPL3 can directly affect LEC2-mediated transcription of OLE1, transient
expression of the Arabidopsis OLE1 promoter fused to firefly luciferase was carried out in
Arabidopsis upl3 mesophyll protoplasts. The low levels of endogenous OLE1 promoter activity
(Figures 3g) were increased by co-transfection with 35S::LEC2. Co-transfection with both
35S::LEC2 and 35S::UPL3 significantly reduced LEC2-induced OLE1 promoter activity,
suggesting that UPL3 reduces LEC2-mediated transcriptional regulation of seed lipid
biosynthetic genes.
UPL3 mediates the proteasomal degradation of LEC2
HECT E3 ligases such as UPL3 mediate the proteasomal degradation of substrate proteins by
ubiquitylation30. To establish if UPL3 mediates the proteasomal degradation of LEC2, the
stability of bacterially-expressed and purified LEC2-HIS was assessed in crude protein extracts
of 10 DPA siliques of WT and upl3 mutant Arabidopsis. Figure 4a shows that LEC2-HIS was
unstable in WT silique protein extracts, and this instability was reduced by the proteasomal
inhibitor MG132. In contrast, LEC2-HIS levels were more stable in protein extracts from upl3
mutant siliques, and MG132 further reduced this instability. To support these observations of
LEC2-HIS stability, LEC2 protein levels in Arabidopsis upl3 mutant plants, in WT plants, and in
transgenic plants expressing 35S::UPL3-HA were assessed using LEC2-specific antibodies.
Increased endogenous LEC2 protein levels were observed in mutant upl3 siliques compared to
WT plants (Figure 4b). Consistent with these observations, reduced LEC2 levels were seen in
All rights reserved. No reuse allowed without permission. The copyright holder for this preprint (which was not peer-reviewed) is the author/funder.. https://doi.org/10.1101/334581doi: bioRxiv preprint
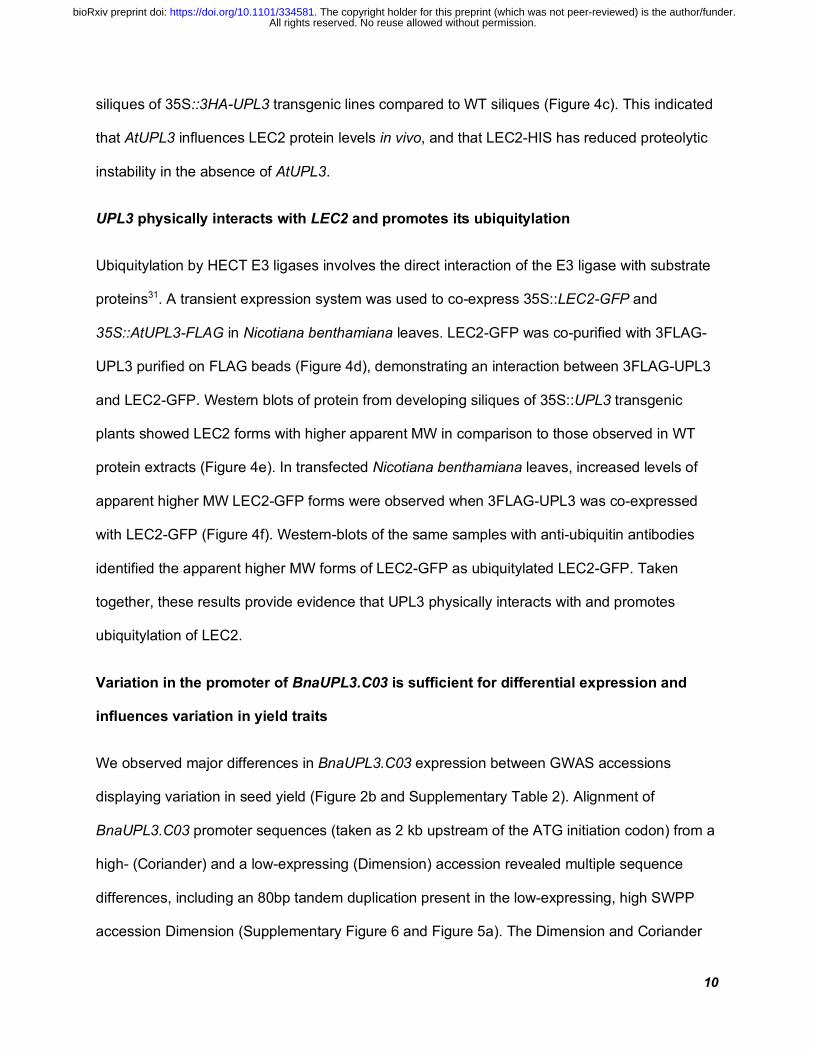
10
siliques of 35S::3HA-UPL3 transgenic lines compared to WT siliques (Figure 4c). This indicated
that AtUPL3 influences LEC2 protein levels in vivo, and that LEC2-HIS has reduced proteolytic
instability in the absence of AtUPL3.
UPL3 physically interacts with LEC2 and promotes its ubiquitylation
Ubiquitylation by HECT E3 ligases involves the direct interaction of the E3 ligase with substrate
proteins31. A transient expression system was used to co-express 35S::LEC2-GFP and
35S::AtUPL3-FLAG in Nicotiana benthamiana leaves. LEC2-GFP was co-purified with 3FLAG-
UPL3 purified on FLAG beads (Figure 4d), demonstrating an interaction between 3FLAG-UPL3
and LEC2-GFP. Western blots of protein from developing siliques of 35S::UPL3 transgenic
plants showed LEC2 forms with higher apparent MW in comparison to those observed in WT
protein extracts (Figure 4e). In transfected Nicotiana benthamiana leaves, increased levels of
apparent higher MW LEC2-GFP forms were observed when 3FLAG-UPL3 was co-expressed
with LEC2-GFP (Figure 4f). Western-blots of the same samples with anti-ubiquitin antibodies
identified the apparent higher MW forms of LEC2-GFP as ubiquitylated LEC2-GFP. Taken
together, these results provide evidence that UPL3 physically interacts with and promotes
ubiquitylation of LEC2.
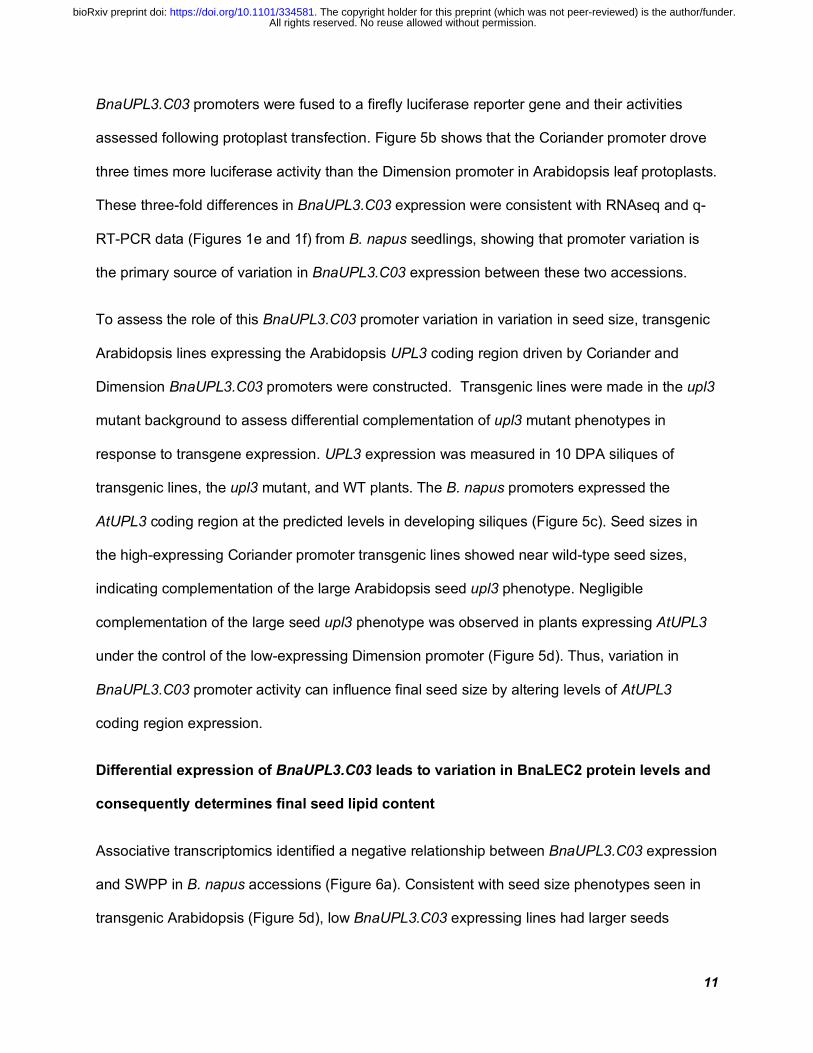
Variation in the promoter of BnaUPL3.C03 is sufficient for differential expression and
influences variation in yield traits
We observed major differences in BnaUPL3.C03 expression between GWAS accessions
displaying variation in seed yield (Figure 2b and Supplementary Table 2). Alignment of
BnaUPL3.C03 promoter sequences (taken as 2 kb upstream of the ATG initiation codon) from a
high- (Coriander) and a low-expressing (Dimension) accession revealed multiple sequence
differences, including an 80bp tandem duplication present in the low-expressing, high SWPP
accession Dimension (Supplementary Figure 6 and Figure 5a). The Dimension and Coriander
All rights reserved. No reuse allowed without permission. The copyright holder for this preprint (which was not peer-reviewed) is the author/funder.. https://doi.org/10.1101/334581doi: bioRxiv preprint
11
BnaUPL3.C03 promoters were fused to a firefly luciferase reporter gene and their activities
assessed following protoplast transfection. Figure 5b shows that the Coriander promoter drove
three times more luciferase activity than the Dimension promoter in Arabidopsis leaf protoplasts.
These three-fold differences in BnaUPL3.C03 expression were consistent with RNAseq and q-
RT-PCR data (Figures 1e and 1f) from B. napus seedlings, showing that promoter variation is
the primary source of variation in BnaUPL3.C03 expression between these two accessions.
To assess the role of this BnaUPL3.C03 promoter variation in variation in seed size, transgenic
Arabidopsis lines expressing the Arabidopsis UPL3 coding region driven by Coriander and
Dimension BnaUPL3.C03 promoters were constructed. Transgenic lines were made in the upl3
mutant background to assess differential complementation of upl3 mutant phenotypes in
response to transgene expression. UPL3 expression was measured in 10 DPA siliques of
transgenic lines, the upl3 mutant, and WT plants. The B. napus promoters expressed the
AtUPL3 coding region at the predicted levels in developing siliques (Figure 5c). Seed sizes in
the high-expressing Coriander promoter transgenic lines showed near wild-type seed sizes,
indicating complementation of the large Arabidopsis seed upl3 phenotype. Negligible
complementation of the large seed upl3 phenotype was observed in plants expressing AtUPL3
under the control of the low-expressing Dimension promoter (Figure 5d). Thus, variation in
BnaUPL3.C03 promoter activity can influence final seed size by altering levels of AtUPL3
coding region expression.
Differential expression of BnaUPL3.C03 leads to variation in BnaLEC2 protein levels and
consequently determines final seed lipid content
Associative transcriptomics identified a negative relationship between BnaUPL3.C03 expression
and SWPP in B. napus accessions (Figure 6a). Consistent with seed size phenotypes seen in
transgenic Arabidopsis (Figure 5d), low BnaUPL3.C03 expressing lines had larger seeds
All rights reserved. No reuse allowed without permission. The copyright holder for this preprint (which was not peer-reviewed) is the author/funder.. https://doi.org/10.1101/334581doi: bioRxiv preprint
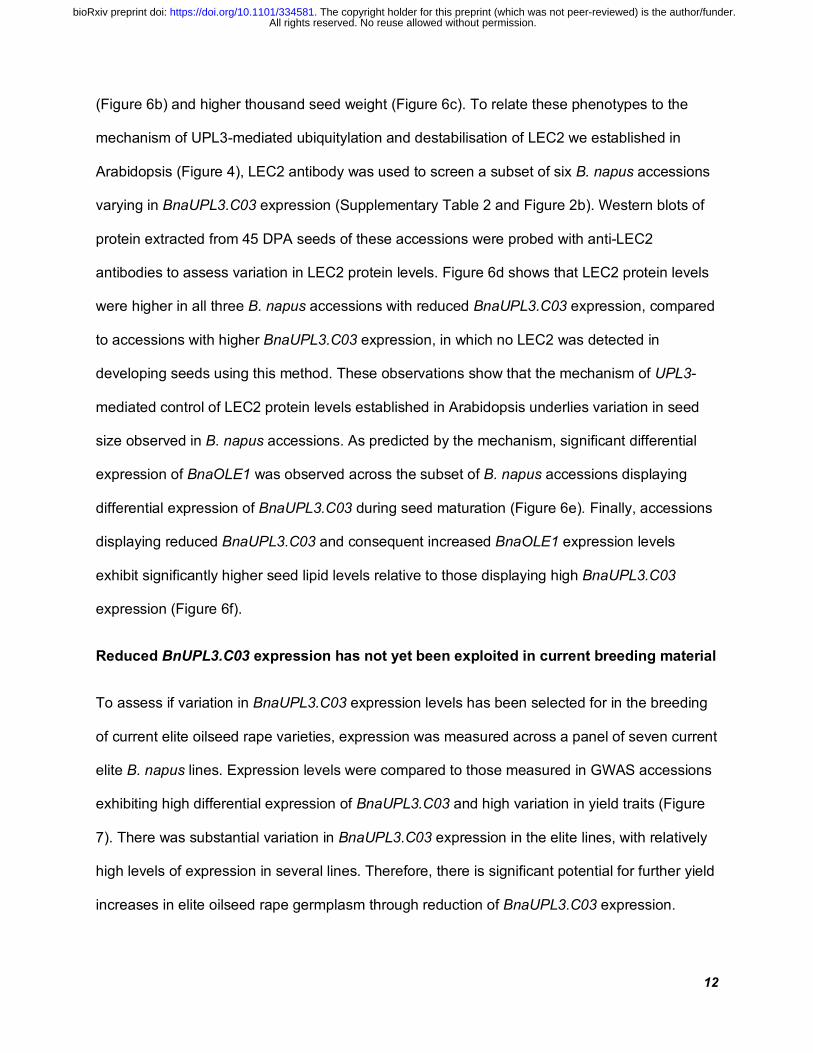
12
(Figure 6b) and higher thousand seed weight (Figure 6c). To relate these phenotypes to the
mechanism of UPL3-mediated ubiquitylation and destabilisation of LEC2 we established in
Arabidopsis (Figure 4), LEC2 antibody was used to screen a subset of six B. napus accessions
varying in BnaUPL3.C03 expression (Supplementary Table 2 and Figure 2b). Western blots of
protein extracted from 45 DPA seeds of these accessions were probed with anti-LEC2
antibodies to assess variation in LEC2 protein levels. Figure 6d shows that LEC2 protein levels
were higher in all three B. napus accessions with reduced BnaUPL3.C03 expression, compared
to accessions with higher BnaUPL3.C03 expression, in which no LEC2 was detected in
developing seeds using this method. These observations show that the mechanism of UPL3-
mediated control of LEC2 protein levels established in Arabidopsis underlies variation in seed
size observed in B. napus accessions. As predicted by the mechanism, significant differential
expression of BnaOLE1 was observed across the subset of B. napus accessions displaying
differential expression of BnaUPL3.C03 during seed maturation (Figure 6e). Finally, accessions
displaying reduced BnaUPL3.C03 and consequent increased BnaOLE1 expression levels
exhibit significantly higher seed lipid levels relative to those displaying high BnaUPL3.C03
expression (Figure 6f).
Reduced BnUPL3.C03 expression has not yet been exploited in current breeding material
To assess if variation in BnaUPL3.C03 expression levels has been selected for in the breeding
of current elite oilseed rape varieties, expression was measured across a panel of seven current
elite B. napus lines. Expression levels were compared to those measured in GWAS accessions
exhibiting high differential expression of BnaUPL3.C03 and high variation in yield traits (Figure
7). There was substantial variation in BnaUPL3.C03 expression in the elite lines, with relatively
high levels of expression in several lines. Therefore, there is significant potential for further yield
increases in elite oilseed rape germplasm through reduction of BnaUPL3.C03 expression.
All rights reserved. No reuse allowed without permission. The copyright holder for this preprint (which was not peer-reviewed) is the author/funder.. https://doi.org/10.1101/334581doi: bioRxiv preprint
13
Discussion
Using Associative Transcriptomics15 we identified variation in the promoter of a B. napus gene,
BnaUPL3.C03, that modulates seed size, lipid content and field yields in this important oilseed
crop. BnaUPL3.C03 encodes an orthologue of the Arabidopsis HECT E3 ligase UPL3 gene. We
show that it promotes the ubiquitylation and destabilization of LEC2, a “hub” transcriptional
regulator of seed storage processes3. Reduced BnaUPL3.C03 expression maintains higher
levels of LEC2 during seed maturation, prolonging transcriptional activation of storage lipid
genes, leading to larger seeds with elevated lipid levels in B. napus. Lines with relatively low
BnaUPL3.C03 expression had robust yield increases in field conditions compared to lines with
higher BnaUPL3.C03 expression. Variation in UPL3 expression levels in elite oilseed rape
cultivars identifies a promising approach for achieving further increases in oilseed yields by
selecting for reduced UPL3 expression levels.
Comparison of assemblies of the BnaUPL3.C03 gene and flanking sequences from two B.
napus lines with low and high BnaUPL3.C03 expression identified high levels of promoter
sequence variation, including an 80bp duplication 900bp upstream of the initiation codon, that
segregated with high SWPP and reduced BnaUPL3.C03 expression (Figure 5a). Transient
assays showed that a 2kb 5’ flanking region from high- and low-expressing BnaUPL3.C03
alleles promoted the expected expression differences (Figure 5b). Driving expression of the
Arabidopsis UPL3 coding sequence with B. napus promoter variants led to differential
complementation of the Arabidopsis upl3 mutant seed phenotypes (Figure 5d). This established
that natural variation in the BnaUPL3.C03 promoter is sufficient to induce variation in seed size
and yield traits. Variation in other regions of the BnaUPL3.C03 gene, including the coding
region, may also have the potential to contribute to variation in expression and yield observed in
B. napus varieties.
All rights reserved. No reuse allowed without permission. The copyright holder for this preprint (which was not peer-reviewed) is the author/funder.. https://doi.org/10.1101/334581doi: bioRxiv preprint
14
Such genetic variation influencing gene regulation is an increasingly important resource for trait
improvement, including increasing seed yields. For example, natural variation in the copy
number of a promoter silencing element of the FZP gene underlies variation in spikelet numbers
in rice panicles and is an important determinant of yield 32. Similarly, QTL analyses identified
promoter variation in the rice GW7 gene that, combined with variation that reduced expression
of an SPL16 transcriptional repressor of GW7, led to 10% increases in grain yield and improved
quality33. A deletion in the promoter region of GW5 in Nipponbare rice lines reduced expression
and increased grain width34, and similarly, promoter deletions in GSE5 accounted for wide
grains in indica rice varieties35. More generally, genetic variation in chromatin accessibility (a
mark of promoter activity) explained about 40% of heritable variation in many quantitative traits
in maize36. These reports, and the study described here, reveal the exceptional promise of
accessing variation in promoter sequences and altered transcriptional activity for identifying new
regulatory mechanisms and for the quantitative manipulation of complex traits such as yield in
crop plants.
UPL3 was first identified in Arabidopsis as a loss-of-function mutation in a HECT E3 ligase gene
causing increased leaf hair branching17,18. UPL3 expression increased during seed maturation in
Arabidopsis (Figure 2a), and an ortholog, BnaUPL3.C03, was differentially expressed in the
pods of B. napus lines (Figure 2b) that varied in seed weight per pod (Figure 1a). LEC2, a
transcriptional regulator of seed storage processes, is more stable in a upl3 loss-of-function
mutation in Arabidopsis (Figure 4a) and UPL3 promoted the ubiquitylation and destablisation of
LEC2 (Figures 3e and 3f). Consistent with these observations, in maturing seeds of B. napus
lines with low BnaUPL3.C03 expression, LEC2 protein levels remain higher than in lines
displaying higher BnaUPL3.C03 transcript levels (Figure 6d). These observations suggested
that UPL3 ubiquitin ligase activity modulates levels of LEC2 protein during seed maturation.
LEC1 is directly activated by LEC2, and together they activate the expression of genes involved
All rights reserved. No reuse allowed without permission. The copyright holder for this preprint (which was not peer-reviewed) is the author/funder.. https://doi.org/10.1101/334581doi: bioRxiv preprint
15
in promoting seed lipid accumulation, such OLE1. Consistent with this, we observed elevated
OLE1 expression levels in upl3 mutant seeds relative to WT and showed that BnaOLE1 is
differentially expressed between B. napus accessions displaying differential expression of
BnaUPL3.C03. These observations show that reduced levels of UPL3 maintain higher levels of
LEC2 protein during seed maturation, thus prolonging the duration of expression of seed
maturation genes, leading to increased seed lipid in Arabidopsis upl3 mutants and B. napus
accessions with reduced BnaUPL3.C03 expression.
At earlier stages of seed development, the seed coat in Arabidopsis upl3 mutants has altered
mucilage and reduced expression of GL2 (Figure 2f), a transcription factor controlling epidermal
cell differentiation37. GL2 promotes expression of the rhamnose biosynthesis gene MUM4 that is
required for seed mucilage production21,37, and expression of MUM4 is also reduced during
testa development in upl3 (Figure 2g). This observation revealed a unifying role of UPL3 in
regulating both testa and embryo maturation by modulating levels of transcription factors during
different stages of seed development. These transcription factors, GL3 and EGL319, and LEC2
(this study) in turn modulate expression of other transcription factors and biosynthetic genes
involved in testa and embryo development.
Altered expression of LAFL genes has profound developmental consequences such as ectopic
embryogenesis5,38, but induced expression of LEC2 in vegetative tissues does increase lipid
accumulation25,39. These studies show that the activities of LEC2 expression in storage
processes and embryo development are difficult to separate, probably due to the timings of
expression, interdependence and partial redundancy of LAFL gene function. By identifying a
mechanism controlling LEC2 protein levels during seed maturation, we have shown that it is
possible to elevate lipid levels during normal embryo development (Figures 2d). Mis-expression
of WRI1 permits normal seed development while increasing lipid content40,41 by extending seed
maturation, consistent with our observations of elevated WRI1 expression in upl3 (Figure 3e).
All rights reserved. No reuse allowed without permission. The copyright holder for this preprint (which was not peer-reviewed) is the author/funder.. https://doi.org/10.1101/334581doi: bioRxiv preprint
16
Intensive breeding is optimizing oilseed lipid composition for different end-uses, but
comparatively slow progress is being made in increasing yields of oilseed crops such as oilseed
rape, with current rates of yield increase predicted to be insufficient to meet future needs42.
Variation in the promoter of BnaUPL3.C03 that reduces expression and increases seed lipid
content has not yet been exploited in oilseed rape breeding (Figure 7), demonstrating how lipid
content and seed yields could be increased without influencing composition. The presence of a
functional LEC2 ortholog in soybean43, and the expression of LEC2 and other B3-domain
transcription factor homologs during seed lipid synthesis in sunflower 44 and oil palm45 reveals
the potential of UPL3-mediated regulation of LEC2 to increase seed lipid levels and overall
yields in other major oilseed crops.
Methods
Plant material and growth conditions
Phenotype data was collected from 94 accessions representing winter, spring and Chinese
oilseed rape from the OREGIN Brassica napus fixed foundation diversity set15. Plants were
grown in a randomised, triplicated experimental design in a Kedar house under natural light with
no controlled heating. Prior to transplantation, plants were grown (18/15°C day/night, 16hr light)
for 4 weeks before 6 weeks vernalisation (4°C, 8hr light). 20 typical pods were collected from
each mature plant and digitally imaged. Pod length (Podl) was measured using ImageJ46. Pods
were weighed (PW) before threshing to remove seeds. Seed numbers, average seed length
(SL), width (SW), area (SA), single seed weight (SSW) and thousand grain weight (TGW) were
measured for each sample using a Marvin device (GTA Sensorik GmbH, Germany). Numbers of
seeds per pod (SPP), seed weight per pod (SWPP) and seed density (SDen) were calculated
from these data. Field yields of selected accessions were grown in four replicated field plots
All rights reserved. No reuse allowed without permission. The copyright holder for this preprint (which was not peer-reviewed) is the author/funder.. https://doi.org/10.1101/334581doi: bioRxiv preprint
17
(1.25m x 6m, Church Farm, Bawburgh, Norfolk, UK) in a randomized design and harvested by
combine. Total plot yield was determined for each plot and an average plot yield taken.
All Arabidopsis thaliana mutant and transgenic lines used were in Col-0 background. Plants were
grown on soil in a growth chamber with 16/8 hr day/night at 22°C after 48 hours stratification at
5°C. A sequence indexed T-DNA insertion line in At4G38600 (UPL3), Salk_015334, was obtained
from The Nottingham Arabidopsis Stock Centre (NASC). Genotyping primers were designed
using the primer design tool http://signal.salk.edu/tdnaprimers.2.html: Primer sequences are in
Supplementary Table 2. Genotyping used TAKARA EX taq (Takara Bio, USA).
To identify loss-of-function mutations in UPL3 in Brassicas, the TILLING population 20 of B. rapa
(the A genome donor to B. napus) was screened for mutations in the predicted gene Bra010737
on chromosome A08 that encodes the single ortholog of Arabidopsis thaliana UPL3. The
predicted B. rapa gene was defined by a full- length transcript Bra010737.1. There was only one
clear ortholog of UPL3 in B.rapa, consistent with two copies present in the amphidiploid B. napus
on chromosomes A08 and C03. Two premature stop codon mutations were identified in
Bra010737 (Supplementary Figure 7) in lines JI32517 and JI30043. Primers were designed to
amplify genomic DNA from the mutated region (Supplementary Table 4) and used to validate the
TILLING mutations. Line JI32517-B was validated and used in further studies. The line was selfed
and progeny screened for homozygous (G>A) and “WT” (C>T) changes by sequencing of the
locus. Seeds were harvested from the “WT” and upl3 mutant and their area measured using
ImageJ.
A subset of B. napus accessions and a panel of elite B. napus breeding lines were grown under
glasshouse conditions after vernalisation. Leaf material was harvested from the first true leaf
and stored at -70℃ prior to further processing. Developing pods were staged by tagging when
petals were beginning to emerge from the developing bud, taken as zero days post anthesis
(DPA). Samples for RNA isolation were collected at 45 DPA and stored at -70℃. For expression
All rights reserved. No reuse allowed without permission. The copyright holder for this preprint (which was not peer-reviewed) is the author/funder.. https://doi.org/10.1101/334581doi: bioRxiv preprint
18
analyses in Arabidopsis, WT and upl3 mutant plants were grown as described, without
vernalization, and floral buds tagged when petals were beginning to emerge from the
developing bud (0 DPA). Siliques were then harvested at 0, 5, 10 and 15 DPA and tissue
samples stored at -70℃.
Population structure analysis
Associative Transcriptomics analysis was carried out as described15. The population structure Q
matrix was re-calculated using unlinked markers across the set of 94 lines. One SNP per 500 kb
interval along pseudomolecules, excluding regions less than 1000 kb from centromeres 47, were
selected for Bayesian population structure analysis via STRUCTURE 2.3.3 48. This analysis
incorporated a minor allele frequency of 5%. The optimum number of K populations was
selected as described 15.
SNP analysis
SNP data, STRUCTURE Q matrix and phenotypes of the 94 accessions were combined using
TASSEL (V4.0). Following the removal of minor alleles (frequency <0.05) ~144,000 SNPs were
used to calculate a kinship (K) matrix to estimate the pairwise relatedness between individuals.
Data sets were analysed using both Generalised and Mixed Linear Models (GLM and MLM).
Goodness of fit of the model was determined by a QQ plot of the observed versus the expected
-log10P values. -log10P values were plotted in chromosome order and visualized using R
programming scripts ( http://www.R-project.org/.)
GEM analysis
Relationships between GEM sequence read depth (RPKM) and trait data variation were
analysed by Linear regression analysis using R. -log10P values were plotted in pseudomolecule
order and visualized using R scripts.
All rights reserved. No reuse allowed without permission. The copyright holder for this preprint (which was not peer-reviewed) is the author/funder.. https://doi.org/10.1101/334581doi: bioRxiv preprint
19
DNA constructs
The p35S::3HA-AtUPL3 transgenic line was generated by cloning AtUPL3 cDNA into the
pENTR TOPO-D vector (Thermofisher, UK) using the primers described in Supplementary
Table 4. LR Clonase mix II (Thermofisher, UK) was used to transfer the AtUPL3 CDS into the
35S PB7HA binary vector. All constructs were sequenced before use. The p35S::3HA-AtUPL3
construct was transformed into Agrobacterium tumefaciens strain GV3101, and Arabidopsis
Col-0 plants were transformed using the floral dip method49.
Promoters of the BnaUPL3.C03 gene from the high- and low- expressing accessions Coriander
and Dimension were amplified using primers described in Supplementary Table 4. AtUPL3 CDS
in the pENTR TOPO-D vector was transferred into the binary vector pEarley201 using LR
Clonase, and BnaUPL3.C03 promoter PCR products, digested with Stu1 and Xho1, were
ligated into the pEarly 201-AtUPL3 CDS plasmid. The BnaUPL3.C03 promoter::AtUPL3 CDS
construct was transformed into Agrobacterium tumefaciens strain GV3101, and Arabidopsis
upl3 mutant plants were transformed using the floral dip method49.
Arabidopsis and Brassica seed size quantification
Arabidopsis seeds were harvested from mature plants and the seeds imaged at 10x
magnification. B. napus and B.rapa seeds were harvested from mature plants and scanned
using a photocopier. Seed area was quantified using ImageJ particle analysis.
Ruthenium red staining
Seed mucilage phenotypes were assessed using methods described by50. Stained seeds were
imaged at 10x magnification.
Seed lipid quantification and profiling
All rights reserved. No reuse allowed without permission. The copyright holder for this preprint (which was not peer-reviewed) is the author/funder.. https://doi.org/10.1101/334581doi: bioRxiv preprint
20
Fatty acid profile analyses in Arabidopsis were carried out using the methods described by51.
Lipid content of B. napus seeds were measured using Near Infrared Spectroscopy52.
PCR and sequencing
All PCR reactions were carried out using Phusion High Fidelity DNA polymerase (New England
BioLabs) according to manufacturer's instructions. Capillary sequencing was carried out by
GATC Biotech (Germany).
cDNA synthesis and q-RT-PCR
RNA was extracted using the SPECTRUM Total Plant RNA kit (Sigma, UK). 1ug of RNA was
treated with RQ1 RNase-Free DNase (Promega, USA) and cDNA synthesis was carried out
using the GoScript Reverse Transcription system (Promega, USA) using Oligo dT. All protocols
were carried out using manufacturers’ guidelines. cDNA samples were diluted 1:10 in water
before use. Q-RT-PCR was carried out using SYBR green real time PCR mastermix
(Thermofisher) and performed using Lightcycler 480 (Roche, Switzerland). Primer sequences
used for q-RT-PCR are in Supplementary Table 4. Primer efficiencies and relative expression
calculations were performed according to methods described53. All q-RT-PCR assays were
repeated at least twice.
Promoter transactivation assay
Promoters and full length cDNAs of selected Arabidopsis Col-0 genes were amplified by PCR
using Phusion polymerase (Thermo Scientific) according to the manufacturer's guidelines.
Promoter primer sequences are in Supplementary Table 2. PCR reactions were purified using
Wizard SV Gel and PCR Clean up system (Promega, UK) and inserted into pENTR D-TOPO
vector (Thermofisher, UK), and an LR reaction was used to clone promoters into a Firefly
Luciferase reporter vector fLUC (pUGW35). LEC2 and UPL3 CDS were transferred using LR
All rights reserved. No reuse allowed without permission. The copyright holder for this preprint (which was not peer-reviewed) is the author/funder.. https://doi.org/10.1101/334581doi: bioRxiv preprint
21
Clonase into PB7HA and PW1266 respectively to create p35S::3HA-LEC2 and p35S::3FLAG-
UPL3. A 35S::Renilla luciferase construct was used to quantify relative promoter activities.
Plasmid preparations for transient assays were prepared using the Qiagen Plasmid Maxi Kit
according to manufacturer’s instructions.
Promoter transactivation assays were carried out using protoplasts isolated from upl3 leaves 54.
Assays were carried in triplicate using 5ug of plasmid and 100ul of purified protoplasts
(approximately 50,000 cells). After an overnight incubation at room temperature, transfected
protoplasts were harvested and promoter activity assessed using the Dual Luciferase Reporter
assay system (Promega, USA). The ratio of Firefly Luciferase to Renilla Luciferase was
determined using the dual assay Promega protocol on a Glomax 20/20 luminometer (Promega,
USA). All transactivation assays were repeated at least twice.
Total protein extraction from B. napus pods and Arabidopsis siliques
Material was ground to a fine powder in liquid nitrogen and resuspended in extraction buffer
(1ml/g fresh weight) (25mM Tris-HCl pH 8.0, 10mM NaCl, 10mM MgCl2, 4mM AEBSF and
50µM MG132). Following an incubation on ice for 30 minutes, samples were centrifuged at
maximum speed for 5 minutes at 4℃. Supernatant was then added to a fresh tube and
centrifugation repeated for 10 minutes. Total protein content was assessed using Bradford
reagent (Bio-Lab) according to manufacturer's instructions.
Protein expression in E. coli BL21
Arabidopsis LEC2 CDS was amplified from cDNA using primers described in Supplementary
Table 4. Following purification, PCR products were digested with and ligated into digested pET-
24a vector. Plasmids were transformed into BL21 E. coli cells. Following overnight growth, a
single colony was used to inoculate 10ml liquid LB+ kanamycin 25 μg/ml and incubated at 37°C
overnight. The following day, 4ml of this culture was used to inoculate 400ml LB+kanamycin
All rights reserved. No reuse allowed without permission. The copyright holder for this preprint (which was not peer-reviewed) is the author/funder.. https://doi.org/10.1101/334581doi: bioRxiv preprint
22
and incubated for 2 hours at 37°C. IPTG was then added to 100μM and the culture incubated at
28°C for 3 hours to induce protein expression. Cultures were then centrifuged at 3,500rpm for
10 minutes at 4°C and the cell pellet suspended in 7.5ml of suspension buffer (50mM HEPES
pH 7.5, 150mM NaCl, 1% TritonX-100; 10% glycerol; 1 Roche EDTA-FREE inhibitor cocktail
tablet). Cells were sonicated 4 x 10 seconds with 20 sec intervals on ice, and sonicates were
centrifuged at 12,000g for 20 minutes at 4°C. Protein purification was carried out using
Dynabeads ® His-tag magnetic beads (Novex). Prior to use, beads were washed 3 times in
wash buffer (50 mM HEPES (PH7.5); 150 mM NaCl; 10% glycerol). The sonicate was then
added to washed beads and incubated at 4°C with rotation for 30 minutes. Beads were then
washed 3 times with suspension buffer and 3 times with wash buffer. His-tagged protein was
eluted from beads using 120μl elution buffer (300mM Imidazole, pH 7.5, 1x PBS pH 7.5, 0.3M
NaCl, 0.1% Tween-20, 10% glycerol). Purified protein was quantified using Bradford reagent
(Bio-Rad) and stored at -70°C in 15μl aliquots.
Cell-free degradation assay and western blot analyses
Total protein was extracted from 10-15 DPA siliques taken from WT and upl3 mutant plants
using the following extraction buffer: 25mM Tris-HCL pH7.5, 10mM NaCl, 10mM MgCl2 and
4mM AEBSF. Following protein quantification using BioRad reagent (Bio-Lab), 20µg total
protein was added to degradation buffer (25mM Tris-HCL, 10mM MgCl2, 5mM DTT, 10mM
NaCl, 10mM ATP and 5µg E.coli-expressed LEC2-HIS). 30µl samples were incubated at 22℃
for 0, 5, 10 and 15 minutes in the presence or absence of 200 μM MG132. Reactions were
stopped with 4x SDS Laemmli sample buffer (Bio-Rad) and samples denatured at 96°C for 5
minutes. Samples were loaded on 4-20% gradient SDS gels and probed with anti-HIS antibody
to visualise LEC2-HIS protein. LEC2 protein was also measured using purified rabbit polyclonal
antibodies raised against the antigenic peptide ARKDFYRFSSFDNKKL from LEC2 coupled to
keyhole limpet haemocyanin (New England Peptides, USA). This assay was repeated three
All rights reserved. No reuse allowed without permission. The copyright holder for this preprint (which was not peer-reviewed) is the author/funder.. https://doi.org/10.1101/334581doi: bioRxiv preprint
23
times. Western blots used antibodies at the following dilutions: anti-FLAG 1/1000; anti-GFP
1/5000; anti-tubulin 1/5000; anti-HA 1/1000; anti LEC2 1/1000. Secondary antibodies used for
LEC2 were anti-rabbit 1/5000; for tubulin anti-mouse 1/5000. Western blots were developed
with FEMTO Max peroxidase substrate (Fisher Scientific).
Transient expression in Nicotiana benthamiana
The Arabidopsis UPL3 cDNA TOPO construct cloned into the 3xFLAG PW1266 vector. Full
length Arabidopsis LEC2 cDNA was amplified using primers described in Supplementary Table
4. Following cloning into pENTR TOPO-D, LEC2 CDS was transferred by LR reaction to
pEARLEY 103. The resulting constructs, p35S::3XFLAG-UPL3 and p35S::LEC2-GFP were
transformed into Agrobacterium tumefaciens GV3101 and 10 ml cultures grown at 28°C for 48
hours before transfection into leaves of 4 week old Nicotiana benthamiana plants using a 1 ml
syringe without a needle. Agrobacterium cultures were transfected into the underside of the
leaves and after 48 hours, transfected regions were excised and stored in liquid nitrogen before
purification. Protein extracts were purified using M2 FLAG beads (Sigma). Purified protein was
eluted from beads using 1X SDS buffer and heated at 96C for 5 minutes. Samples were loaded
onto a 4-20% gradient SDS gel and western blotted with anti-GFP antibody or anti FLAG
antibodies to assess 3FLAG-UPL3 - LEC2-HIS interactions. For assessing LEC-GFP
ubiquitylation in transient assays, total protein was extracted after transfection for 48 hrs and
Western blotted using anti-GFP and then anti-ubiquitin. To detect in vivo ubiquitylation of LEC2,
total protein was extracted from pooled 10-15 DPA siliques of a 35S::AtUPL3-HA transgenic line
and from WT plants. Transgene expression was assessed following purification on Pierce Anti-
HA magnetic beads (Thermo Scientific) and total protein extracts probed using anti-LEC2 to
assess LEC2 ubiquitylation. Protein samples in SDS sample buffer were electrophoresed on
precast 12%, 20% or 4-20% gradient SDS polyacrylamide gels (RunBlue, Expedeon Ltd,
Cambridge, UK), transferred to PVDF membranes (Roche Diagnostics, Burgess Hill, UK) and
All rights reserved. No reuse allowed without permission. The copyright holder for this preprint (which was not peer-reviewed) is the author/funder.. https://doi.org/10.1101/334581doi: bioRxiv preprint
24
immunoblotted. PVDF membranes were washed for 10 min in 50 ml PBS after transfer, then
treated with blocking solution (5% w/v milk powder, 0.1% v/v Tween-20 in PBS) for an hour.
Primary antibodies were diluted in blocking solution and incubated with the membrane for 1 h
before 5 washes with PBST (PBS with 0.1% v/v Tween-20) at room temperature. Washed
membranes were then treated with FEMTO Max peroxidase substrate (Fisher Scientific,
Loughborough, UK) for 5 min before exposure to X-ray film.
Acknowledgements
This work was supported by an ERA-CAPS grant (“ABCEED”) to MWB and LL. MWB was also
supported by a Biological and Biotechnological Sciences Research Council (BBSRC) Institute
Strategic Grants GRO (BB/J004588/1) and GEN (BB/P013511/1). LL is also supported by
Labex Saclay Plant Sciences-SPS (ANR-10-LABX-0040-SPS). We thank Jingkun Ma for advice
on transient expression and luciferase assays.
Author Contributions
CM, MWB, RW, BD and LL designed the study; CM, NMcK, RW, JB and AF performed
experiments, CM and MWB analyzed data and wrote the paper.
Competing Interests
The authors declare no competing interests.
Figure Legends
All rights reserved. No reuse allowed without permission. The copyright holder for this preprint (which was not peer-reviewed) is the author/funder.. https://doi.org/10.1101/334581doi: bioRxiv preprint
25
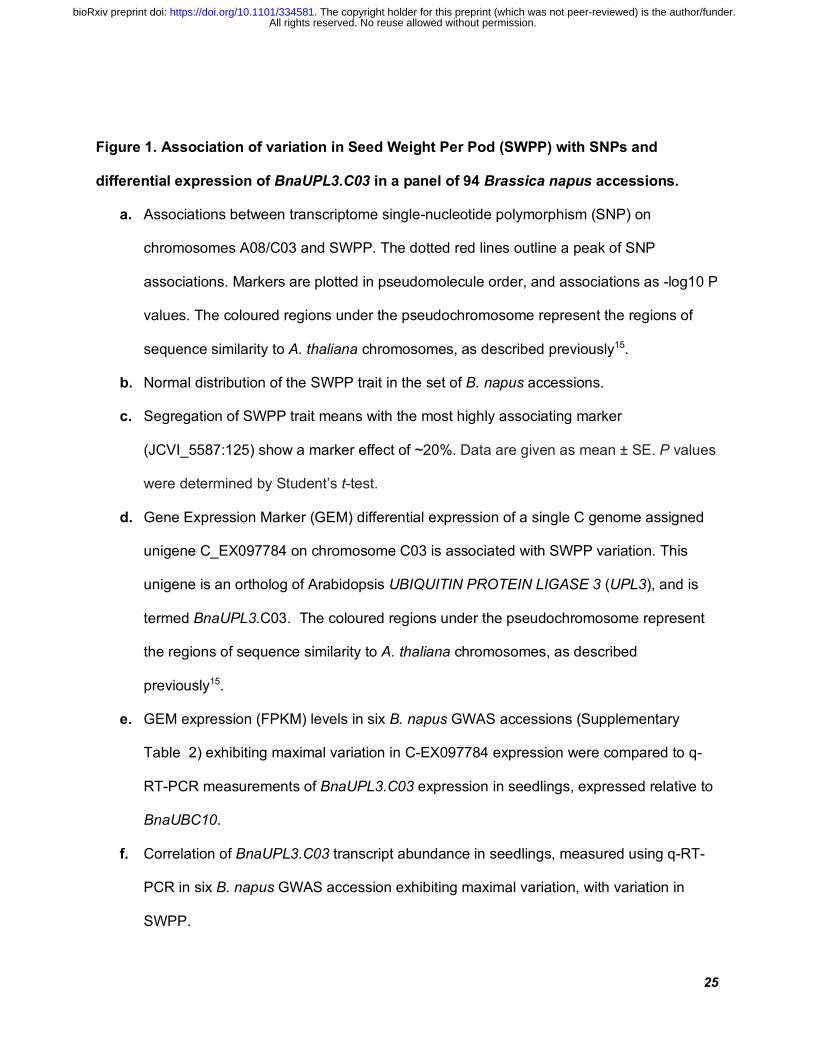
Figure 1. Association of variation in Seed Weight Per Pod (SWPP) with SNPs and
differential expression of BnaUPL3.C03 in a panel of 94 Brassica napus accessions.
a. Associations between transcriptome single-nucleotide polymorphism (SNP) on
chromosomes A08/C03 and SWPP. The dotted red lines outline a peak of SNP
associations. Markers are plotted in pseudomolecule order, and associations as -log10 P
values. The coloured regions under the pseudochromosome represent the regions of
sequence similarity to A. thaliana chromosomes, as described previously15.
b. Normal distribution of the SWPP trait in the set of B. napus accessions.
c. Segregation of SWPP trait means with the most highly associating marker
(JCVI_5587:125) show a marker effect of ~20%. Data are given as mean ± SE. P values
were determined by Student’s t-test.
d. Gene Expression Marker (GEM) differential expression of a single C genome assigned
unigene C_EX097784 on chromosome C03 is associated with SWPP variation. This
unigene is an ortholog of Arabidopsis UBIQUITIN PROTEIN LIGASE 3 (UPL3), and is
termed BnaUPL3.C03. The coloured regions under the pseudochromosome represent
the regions of sequence similarity to A. thaliana chromosomes, as described
previously15.
e. GEM expression (FPKM) levels in six B. napus GWAS accessions (Supplementary
Table 2) exhibiting maximal variation in C-EX097784 expression were compared to q-
RT-PCR measurements of BnaUPL3.C03 expression in seedlings, expressed relative to
BnaUBC10.
f. Correlation of BnaUPL3.C03 transcript abundance in seedlings, measured using q-RT-
PCR in six B. napus GWAS accession exhibiting maximal variation, with variation in
SWPP.
All rights reserved. No reuse allowed without permission. The copyright holder for this preprint (which was not peer-reviewed) is the author/funder.. https://doi.org/10.1101/334581doi: bioRxiv preprint
26
g. A subset of ten GWAS accessions with maximal variation in SWPP were grown in
replicated plots in field conditions between March-Aug 2016 and mean plot yields
measured after combining. Plot yields are shown as mean ± SE.
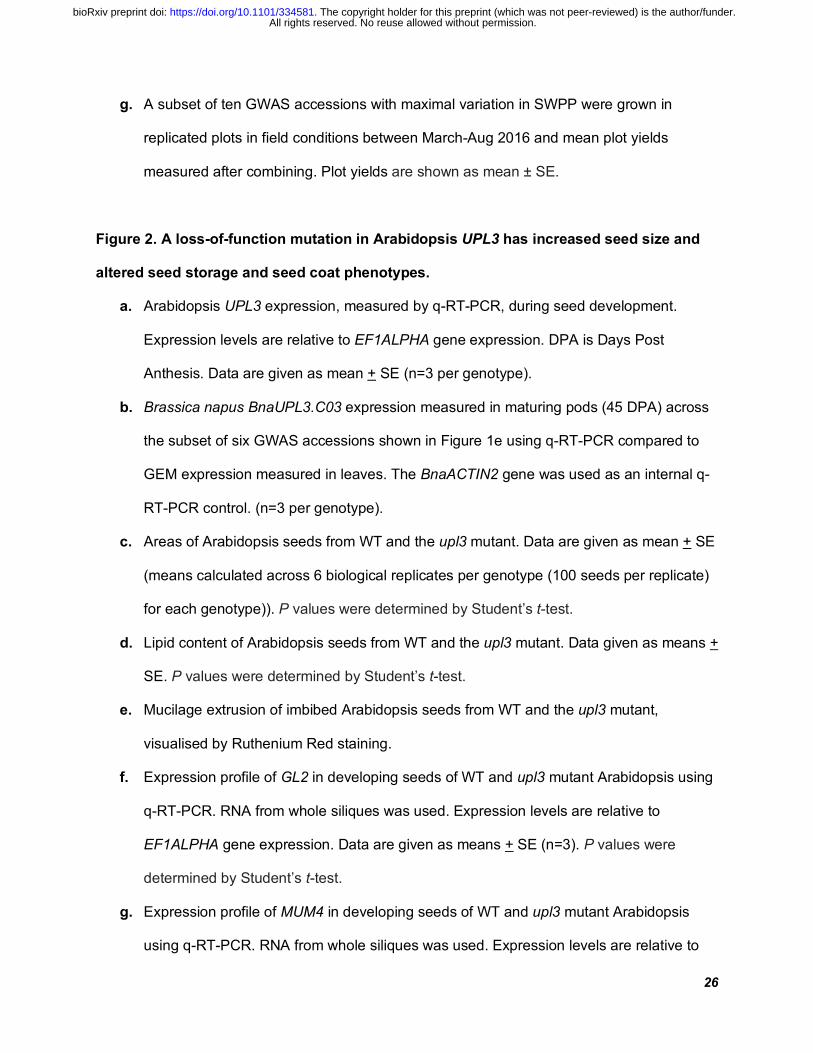
Figure 2. A loss-of-function mutation in Arabidopsis UPL3 has increased seed size and
altered seed storage and seed coat phenotypes.
a. Arabidopsis UPL3 expression, measured by q-RT-PCR, during seed development.
Expression levels are relative to EF1ALPHA gene expression. DPA is Days Post
Anthesis. Data are given as mean + SE (n=3 per genotype).
b. Brassica napus BnaUPL3.C03 expression measured in maturing pods (45 DPA) across
the subset of six GWAS accessions shown in Figure 1e using q-RT-PCR compared to
GEM expression measured in leaves. The BnaACTIN2 gene was used as an internal q-
RT-PCR control. (n=3 per genotype).
c. Areas of Arabidopsis seeds from WT and the upl3 mutant. Data are given as mean + SE
(means calculated across 6 biological replicates per genotype (100 seeds per replicate)
for each genotype)). P values were determined by Student’s t-test.
d. Lipid content of Arabidopsis seeds from WT and the upl3 mutant. Data given as means +
SE. P values were determined by Student’s t-test.
e. Mucilage extrusion of imbibed Arabidopsis seeds from WT and the upl3 mutant,
visualised by Ruthenium Red staining.
f. Expression profile of GL2 in developing seeds of WT and upl3 mutant Arabidopsis using
q-RT-PCR. RNA from whole siliques was used. Expression levels are relative to
EF1ALPHA gene expression. Data are given as means + SE (n=3). P values were
determined by Student’s t-test.
g. Expression profile of MUM4 in developing seeds of WT and upl3 mutant Arabidopsis
using q-RT-PCR. RNA from whole siliques was used. Expression levels are relative to
All rights reserved. No reuse allowed without permission. The copyright holder for this preprint (which was not peer-reviewed) is the author/funder.. https://doi.org/10.1101/334581doi: bioRxiv preprint
27
EF1ALPHA gene expression. Data are given as means + SE (n=3). P values were
determined by Student’s t-test.
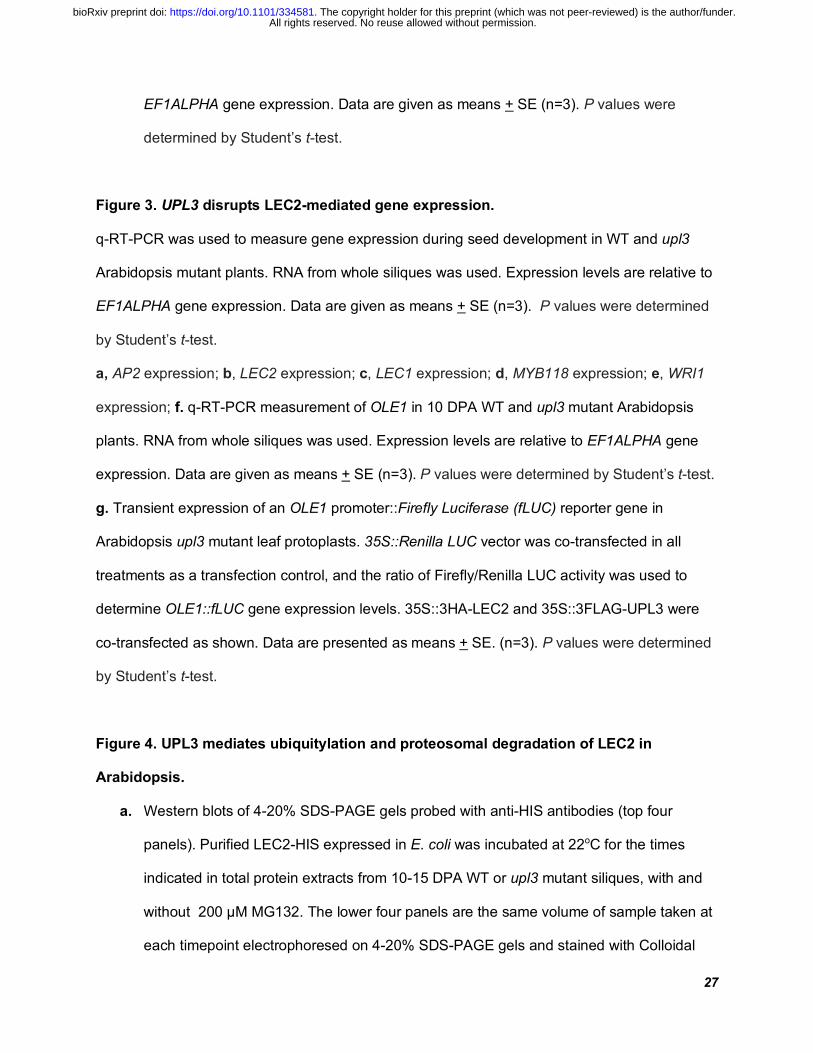
Figure 3. UPL3 disrupts LEC2-mediated gene expression.
q-RT-PCR was used to measure gene expression during seed development in WT and upl3
Arabidopsis mutant plants. RNA from whole siliques was used. Expression levels are relative to
EF1ALPHA gene expression. Data are given as means + SE (n=3). P values were determined
by Student’s t-test.
a, AP2 expression; b, LEC2 expression; c, LEC1 expression; d, MYB118 expression; e, WRI1
expression; f. q-RT-PCR measurement of OLE1 in 10 DPA WT and upl3 mutant Arabidopsis
plants. RNA from whole siliques was used. Expression levels are relative to EF1ALPHA gene
expression. Data are given as means + SE (n=3). P values were determined by Student’s t-test.
g. Transient expression of an OLE1 promoter::Firefly Luciferase (fLUC) reporter gene in
Arabidopsis upl3 mutant leaf protoplasts. 35S::Renilla LUC vector was co-transfected in all
treatments as a transfection control, and the ratio of Firefly/Renilla LUC activity was used to
determine OLE1::fLUC gene expression levels. 35S::3HA-LEC2 and 35S::3FLAG-UPL3 were
co-transfected as shown. Data are presented as means + SE. (n=3). P values were determined
by Student’s t-test.
Figure 4. UPL3 mediates ubiquitylation and proteosomal degradation of LEC2 in
Arabidopsis.
a. Western blots of 4-20% SDS-PAGE gels probed with anti-HIS antibodies (top four
panels). Purified LEC2-HIS expressed in E. coli was incubated at 22oC for the times
indicated in total protein extracts from 10-15 DPA WT or upl3 mutant siliques, with and
without 200 μM MG132. The lower four panels are the same volume of sample taken at
each timepoint electrophoresed on 4-20% SDS-PAGE gels and stained with Colloidal
All rights reserved. No reuse allowed without permission. The copyright holder for this preprint (which was not peer-reviewed) is the author/funder.. https://doi.org/10.1101/334581doi: bioRxiv preprint
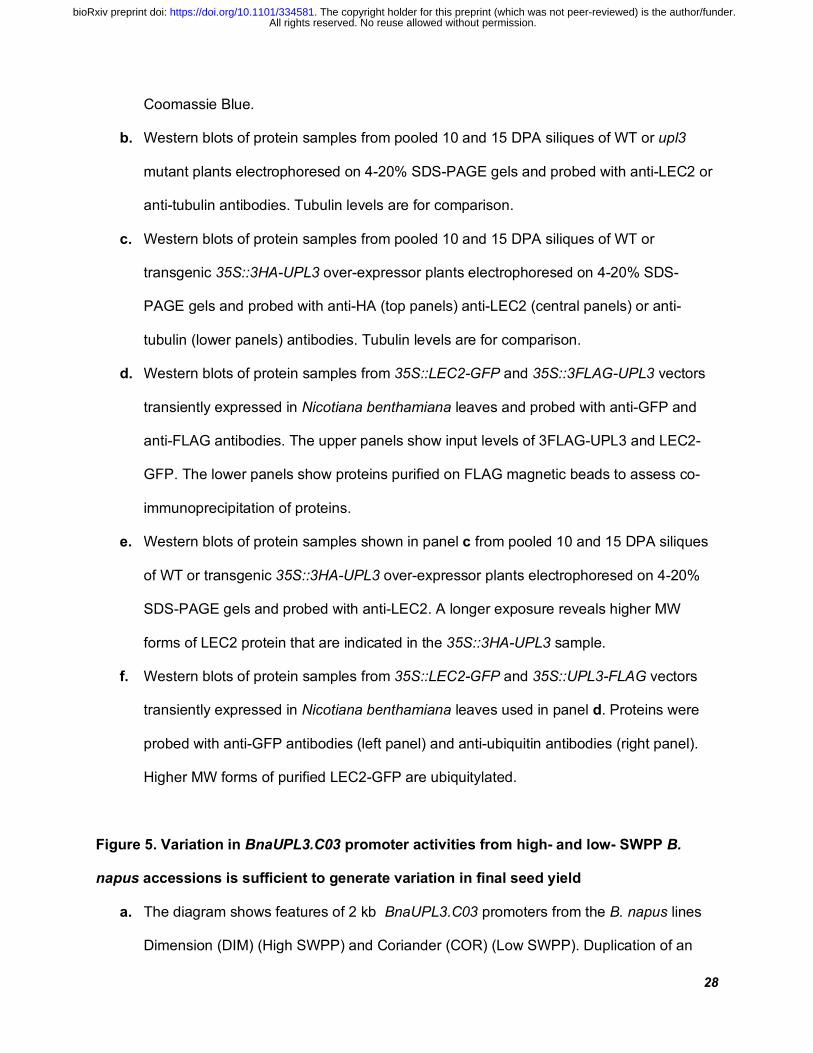
28
Coomassie Blue.
b. Western blots of protein samples from pooled 10 and 15 DPA siliques of WT or upl3
mutant plants electrophoresed on 4-20% SDS-PAGE gels and probed with anti-LEC2 or
anti-tubulin antibodies. Tubulin levels are for comparison.
c. Western blots of protein samples from pooled 10 and 15 DPA siliques of WT or
transgenic 35S::3HA-UPL3 over-expressor plants electrophoresed on 4-20% SDS-
PAGE gels and probed with anti-HA (top panels) anti-LEC2 (central panels) or anti-
tubulin (lower panels) antibodies. Tubulin levels are for comparison.
d. Western blots of protein samples from 35S::LEC2-GFP and 35S::3FLAG-UPL3 vectors
transiently expressed in Nicotiana benthamiana leaves and probed with anti-GFP and
anti-FLAG antibodies. The upper panels show input levels of 3FLAG-UPL3 and LEC2-
GFP. The lower panels show proteins purified on FLAG magnetic beads to assess co-
immunoprecipitation of proteins.
e. Western blots of protein samples shown in panel c from pooled 10 and 15 DPA siliques
of WT or transgenic 35S::3HA-UPL3 over-expressor plants electrophoresed on 4-20%
SDS-PAGE gels and probed with anti-LEC2. A longer exposure reveals higher MW
forms of LEC2 protein that are indicated in the 35S::3HA-UPL3 sample.
f. Western blots of protein samples from 35S::LEC2-GFP and 35S::UPL3-FLAG vectors
transiently expressed in Nicotiana benthamiana leaves used in panel d. Proteins were
probed with anti-GFP antibodies (left panel) and anti-ubiquitin antibodies (right panel).
Higher MW forms of purified LEC2-GFP are ubiquitylated.
Figure 5. Variation in BnaUPL3.C03 promoter activities from high- and low- SWPP B.
napus accessions is sufficient to generate variation in final seed yield
a. The diagram shows features of 2 kb BnaUPL3.C03 promoters from the B. napus lines
Dimension (DIM) (High SWPP) and Coriander (COR) (Low SWPP). Duplication of an
All rights reserved. No reuse allowed without permission. The copyright holder for this preprint (which was not peer-reviewed) is the author/funder.. https://doi.org/10.1101/334581doi: bioRxiv preprint
29
80bp sequence repeat in Dimension is shown. The diagrams are not to scale.
b. The DIM and COR promoters described in panel A were fused with a Firefly Luciferase
reporter gene and transfected into Arabidopsis upl3 mutant protoplasts. The activities of
each promoter are shown relative to co-expressed 35S::Renilla luciferase. Data are
given as means + SE (n=3). P values were determined by Student’s t-test.
c. BnaUPL3.C03 promoters from the B. napus lines Dimension (DIM) and Coriander (COR)
were fused to the coding region of Arabidopsis UPL3 and transformed into upl3 mutant
Arabidopsis. q-RT-PCR of AtUPL3 expression in wild-type and and transgenic
Arabidopsis lines were measured and are shown relative to the AtEIF1ALPHA gene.
Data are given as means + SE (at least 3 biological replicates per genotype). P values
were determined by Student’s t-test.
d. Seed area was quantified in WT, upl3 mutant, COR::AtUPL3 and DIM::AtUPL3
transgenic lines. Data shown are means + SE based on seed area measurements
across at least 100 seeds per genotype and with at least 3 biological replicates per
genotype. P values were determined by Student’s t-test.
Figure 6. Relationships between BnaUPL3.C03 expression levels in high- and low- SWPP
B. napus accessions to seed size, seed LEC2 protein levels, and seed lipid content.
a. BnaUPL3.C03 expression levels in 45 DPA seeds in B. napus Dimension (DIM) with
high SWPP, and Coriander accessions with low SWPP measured by q-RT-PCR.
Expression levels are relative to the BnaACTIN2 gene. Data are presented as means +
SE where n=3 for each genotype. P values were determined by Student’s t-test.
b. Seed sizes in the low-expressing BnaUPL3.C03 line Dimension and the high expressing
BnaUPL3.C03 line Coriander.
c. Thousand seed weights of low-expressing BnaUPL3.C03 line Dimension and the high
expressing BnaUPL3.C03 line Coriander. Data are shown as means + SE. Seeds were
All rights reserved. No reuse allowed without permission. The copyright holder for this preprint (which was not peer-reviewed) is the author/funder.. https://doi.org/10.1101/334581doi: bioRxiv preprint
30
weighed in batches of 100 seed and thousand seed weight calculated based on these
values. n=3 for each genotype included. P values were determined by Student’s t-test.
d. LEC2 protein levels in 45 DPA seeds of three low BnaUPL3.C03 expressing, and three
high BnaUPL3.C03 expressing accessions (Supplementary Table 2). Western blots of
seed protein extract were probed with anti-LEC2 (top panel) and with anti-tubulin (lower
panel) as a protein loading control.
e. Expression of BnaOLE1 was quantified by q-RT-PCR in low expressing BnaUPL3.C03
(Dimension) and high expressing BnaUPL3.C03 (Coriander) accessions. Expression
levels are relative to the BnaACTIN2 gene. n=3 for each genotype. Primers were
designed to measure expression of both BnaC01g17050D and BnaA01g14480D
BnaOLE1 genes. P values were determined by Student’s t-test.
f. Lipid content of mature seeds of low expressing BnaUPL3.C03 (Dimension) and high
expressing BnaUPL3.C03 (Coriander) accessions. P values were determined by
Student’s t-test.
Figure 7. Selection for low BnaUPL3.C03 expression has not yet been exploited in elite
breeding lines
BnaUPL3.C03 expression levels in 45 DPA seeds of seven current elite commercial cultivars of
oilseed rape were measured using q-RT-PCR and compared with expression levels of
BnaUPL3.C03 from GWAS accessions Samurai and Licrown x Express, which exhibit high and
low BnaUPL3.C03 expression levels, and low and high SWPP phenotypes, respectively.
BnaACTIN2 gene expression was used for comparison using q-RT-PCR control. Data are
presented as means +SE (n=3 for each genotype).
All rights reserved. No reuse allowed without permission. The copyright holder for this preprint (which was not peer-reviewed) is the author/funder.. https://doi.org/10.1101/334581doi: bioRxiv preprint
31
References
1. Napier, J. A. & Graham, I. A. Tailoring plant lipid composition: designer oilseeds come of
age. Curr. Opin. Plant Biol. 13, 330–337 (2010).
2. Fatihi, A. et al. Deciphering and modifying LAFL transcriptional regulatory network in seed
for improving yield and quality of storage compounds. Plant Sci. 250, 198–204 (2016).
3. Boulard, C., Fatihi, A., Lepiniec, L. & Dubreucq, B. Regulation and evolution of the
interaction of the seed B3 transcription factors with NF-Y subunits. Biochim. Biophys. Acta
1860, 1069–1078 (2017).
4. Santos-Mendoza, M. et al. Deciphering gene regulatory networks that control seed
development and maturation in Arabidopsis. Plant J. 54, 608–620 (2008).
5. Roscoe, T. T., Guilleminot, J., Bessoule, J.-J., Berger, F. & Devic, M. Complementation of
Seed Maturation Phenotypes by Ectopic Expression of ABSCISIC ACID INSENSITIVE3,
FUSCA3 and LEAFY COTYLEDON2 in Arabidopsis. Plant Cell Physiol. 56, 1215–1228
(2015).
6. Nodine, M. D. & Bartel, D. P. MicroRNAs prevent precocious gene expression and enable
pattern formation during plant embryogenesis. Genes Dev. 24, 2678–2692 (2010).
7. Willmann, M. R., Mehalick, A. J., Packer, R. L. & Jenik, P. D. MicroRNAs regulate the
timing of embryo maturation in Arabidopsis. Plant Physiol. 155, 1871–1884 (2011).
8. Zhou, Y. et al. HISTONE DEACETYLASE19 interacts with HSL1 and participates in the
repression of seed maturation genes in Arabidopsis seedlings. Plant Cell 25, 134–148
(2013).
9. Zhang, X., Garreton, V. & Chua, N.-H. The AIP2 E3 ligase acts as a novel negative
regulator of ABA signaling by promoting ABI3 degradation. Genes Dev. 19, 1532–1543
(2005).
10. Duong, S., Vonapartis, E., Li, C.-Y., Patel, S. & Gazzarrini, S. The E3 ligase ABI3-
All rights reserved. No reuse allowed without permission. The copyright holder for this preprint (which was not peer-reviewed) is the author/funder.. https://doi.org/10.1101/334581doi: bioRxiv preprint
32
INTERACTING PROTEIN2 negatively regulates FUSCA3 and plays a role in cotyledon
development in Arabidopsis thaliana. J. Exp. Bot. 68, 1555–1567 (2017).
11. Chan, A. et al. SnRK1 phosphorylation of FUSCA3 positively regulates embryogenesis,
seed yield, and plant growth at high temperature in Arabidopsis. J. Exp. Bot. 68, 4219–
4231 (2017).
12. Tsai, A. Y.-L. & Gazzarrini, S. AKIN10 and FUSCA3 interact to control lateral organ
development and phase transitions in Arabidopsis. Plant J. 69, 809–821 (2012).
13. Zhai, Z., Liu, H. & Shanklin, J. Phosphorylation of WRINKLED1 by KIN10 Results in Its
Proteasomal Degradation, Providing a Link between Energy Homeostasis and Lipid
Biosynthesis. Plant Cell 29, 871–889 (2017).
14. Bevan, M. W. et al. Genomic innovation for crop improvement. Nature 543, 346–354
(2017).
15. Harper, A. L. et al. Associative transcriptomics of traits in the polyploid crop species
Brassica napus. Nat. Biotechnol. 30, 798–802 (2012).
16. Lu, K. et al. Genome-Wide Association and Transcriptome Analyses Reveal Candidate
Genes Underlying Yield-determining Traits in Brassica napus. Front. Plant Sci. 8, 206
(2017).
17. Downes, B. P., Stupar, R. M., Gingerich, D. J. & Vierstra, R. D. The HECT ubiquitin-protein
ligase (UPL) family in Arabidopsis: UPL3 has a specific role in trichome development. Plant
J. 35, 729–742 (2003).
18. El Refy, A. et al. The Arabidopsis KAKTUS gene encodes a HECT protein and controls the
number of endoreduplication cycles. Mol. Genet. Genomics 270, 403–414 (2003).
19. Patra, B., Pattanaik, S. & Yuan, L. Ubiquitin protein ligase 3 mediates the proteasomal
degradation of GLABROUS 3 and ENHANCER OF GLABROUS 3, regulators of trichome
development and flavonoid biosynthesis in Arabidopsis. Plant J. 74, 435–447 (2013).
20. Stephenson, P. et al. A rich TILLING resource for studying gene function in Brassica rapa.
All rights reserved. No reuse allowed without permission. The copyright holder for this preprint (which was not peer-reviewed) is the author/funder.. https://doi.org/10.1101/334581doi: bioRxiv preprint
33
BMC Plant Biol. 10, 62 (2010).
21. Shi, L., Katavic, V., Yu, Y., Kunst, L. & Haughn, G. Arabidopsis glabra2 mutant seeds
deficient in mucilage biosynthesis produce more oil. Plant J. 69, 37–46 (2012).
22. Song, S.-K. et al. Cell fate in the Arabidopsis root epidermis is determined by competition
between WEREWOLF and CAPRICE. Plant Physiol. 157, 1196–1208 (2011).
23. Liu, Y.-F. et al. Soybean GmMYB73 promotes lipid accumulation in transgenic plants. BMC
Plant Biol. 14, 73 (2014).
24. Ohto, M.-A., Floyd, S. K., Fischer, R. L., Goldberg, R. B. & Harada, J. J. Effects of
APETALA2 on embryo, endosperm, and seed coat development determine seed size in
Arabidopsis. Sex. Plant Reprod. 22, 277–289 (2009).
25. Santos Mendoza, M., Dubreucq, B., Miquel, M., Caboche, M. & Lepiniec, L. LEAFY
COTYLEDON 2 activation is sufficient to trigger the accumulation of oil and seed specific
mRNAs in Arabidopsis leaves. FEBS Lett. 579, 4666–4670 (2005).
26. Santos-Mendoza, M. et al. Deciphering gene regulatory networks that control seed
development and maturation in Arabidopsis. Plant J. 54, 608–620 (2008).
27. Baud, S. et al. Deciphering the Molecular Mechanisms Underpinning the Transcriptional
Control of Gene Expression by Master Transcriptional Regulators in Arabidopsis Seed.
Plant Physiol. 171, 1099–1112 (2016).
28. Barthole, G. et al. MYB118 represses endosperm maturation in seeds of Arabidopsis. Plant
Cell 26, 3519–3537 (2014).
29. Baud, S., Wuillème, S., To, A., Rochat, C. & Lepiniec, L. Role of WRINKLED1 in the
transcriptional regulation of glycolytic and fatty acid biosynthetic genes in Arabidopsis. Plant
J. 60, 933–947 (2009).
30. Maspero, E. et al. Structure of a ubiquitin-loaded HECT ligase reveals the molecular basis
for catalytic priming. Nat. Struct. Mol. Biol. 20, 696–701 (2013).
31. Yau, R. & Rape, M. The increasing complexity of the ubiquitin code. Nat. Cell Biol. 18, 579–
All rights reserved. No reuse allowed without permission. The copyright holder for this preprint (which was not peer-reviewed) is the author/funder.. https://doi.org/10.1101/334581doi: bioRxiv preprint
34
586 (2016).
32. Bai, X. et al. Duplication of an upstream silencer of FZP increases grain yield in rice. Nat
Plants 3, 885–893 (2017).
33. Wang, S. et al. The OsSPL16-GW7 regulatory module determines grain shape and
simultaneously improves rice yield and grain quality. Nat. Genet. 47, 949–954 (2015).
34. Liu, J. et al. GW5 acts in the brassinosteroid signalling pathway to regulate grain width and
weight in rice. Nat Plants 3, 17043 (2017).
35. Duan, P. et al. Natural Variation in the Promoter of GSE5 Contributes to Grain Size
Diversity in Rice. Mol. Plant 10, 685–694 (2017).
36. Rodgers-Melnick, E., Vera, D. L., Bass, H. W. & Buckler, E. S. Open chromatin reveals the
functional maize genome. Proc. Natl. Acad. Sci. U. S. A. 113, E3177–84 (2016).
37. Lin, Q. et al. GLABRA2 Directly Suppresses Basic Helix-Loop-Helix Transcription Factor
Genes with Diverse Functions in Root Hair Development. Plant Cell 27, 2894–2906 (2015).
38. Stone, S. L. et al. LEAFY COTYLEDON2 encodes a B3 domain transcription factor that
induces embryo development. Proc. Natl. Acad. Sci. U. S. A. 98, 11806–11811 (2001).
39. Andrianov, V. et al. Tobacco as a production platform for biofuel: overexpression of
Arabidopsis DGAT and LEC2 genes increases accumulation and shifts the composition of
lipids in green biomass. Plant Biotechnol. J. 8, 277–287 (2010).
40. Kanai, M., Mano, S., Kondo, M., Hayashi, M. & Nishimura, M. Extension of oil biosynthesis
during the mid-phase of seed development enhances oil content in Arabidopsis seeds.
Plant Biotechnol. J. 14, 1241–1250 (2016).
41. van Erp, H., Kelly, A. A., Menard, G. & Eastmond, P. J. Multigene engineering of
triacylglycerol metabolism boosts seed oil content in Arabidopsis. Plant Physiol. 165, 30–36
(2014).
42. Ray, D. K., Mueller, N. D., West, P. C. & Foley, J. A. Yield Trends Are Insufficient to Double
Global Crop Production by 2050. PLoS One 8, e66428 (2013).
All rights reserved. No reuse allowed without permission. The copyright holder for this preprint (which was not peer-reviewed) is the author/funder.. https://doi.org/10.1101/334581doi: bioRxiv preprint
35
43. Manan, S. et al. Soybean LEC2 Regulates Subsets of Genes Involved in Controlling the
Biosynthesis and Catabolism of Seed Storage Substances and Seed Development. Front.
Plant Sci. 8, 1604 (2017).
44. Badouin, H. et al. The sunflower genome provides insights into oil metabolism, flowering
and Asterid evolution. Nature 546, 148–152 (2017).
45. Singh, R. et al. Oil palm genome sequence reveals divergence of interfertile species in Old
and New worlds. Nature 500, 335–339 (2013).
46. Schneider, C. A., Rasband, W. S. & Eliceiri, K. W. NIH Image to ImageJ: 25 years of image
analysis. Nat. Methods 9, 671–675 (2012).
47. Mason, A. S. et al. A user guide to the Brassica 60K Illumina InfiniumTM SNP genotyping
array. Theor. Appl. Genet. 130, 621–633 (2017).
48. Pritchard, J. K., Stephens, M. & Donnelly, P. Inference of population structure using
multilocus genotype data. Genetics 155, 945–959 (2000).
49. Clough, S. J. & Bent, A. F. Floral dip: a simplified method for Agrobacterium-mediated
transformation of Arabidopsis thaliana. Plant J. 16, 735–743 (1998).
50. McFarlane, H., Gendre, D. & Western, T. Seed Coat Ruthenium Red Staining Assay. BIO-
PROTOCOL 4, (2014).
51. Li, Y., Beisson, F., Pollard, M. & Ohlrogge, J. Oil content of Arabidopsis seeds: the
influence of seed anatomy, light and plant-to-plant variation. Phytochemistry 67, 904–915
(2006).
52. Wang, J., Liu, H. & Ren, G. Near-infrared spectroscopy (NIRS) evaluation and regional
analysis of Chinese faba bean (Vicia faba L.). The Crop Journal 2, 28–37 (2014).
53. Pfaffl, M. W. A new mathematical model for relative quantification in real-time RT–PCR.
Nucleic Acids Res. 29, e45–e45 (2001).
54. Wu, F.-H. et al. Tape-Arabidopsis Sandwich - a simpler Arabidopsis protoplast isolation
method. Plant Methods 5, 16 (2009).
All rights reserved. No reuse allowed without permission. The copyright holder for this preprint (which was not peer-reviewed) is the author/funder.. https://doi.org/10.1101/334581doi: bioRxiv preprint
6
4
2
0
4
2
0
6
SNP
Chromosome A08/C03
BnaUPL3.C03
Chromosome C03
GEM
0
0.05
0.1
0.15
TT YY
R² = 0.93870
200004000060000
0 5 10
R² = 0.76
0
0.1
0.2
0 5 10
a b c
d e f
Low SWPP accessions High SWPP accessions
-log 1
0P v
alue
Freq
uenc
y (%
)
SWPP (g) Marker call
SWPP
(g)
Relative expression of BnaUPL3.C03
SWPP
(g)
Relative expression ofBnaUPL3.C03
Sequ
ence
read
dep
th(F
PKM
)
g
0.25 0.7 0.14
Figure 1.
P=0.001
Mea
n pl
ot y
ield
(Kg)
-log 1
0P v
alue
Pseudomolecule position
00.40.81.21.6
2
0.09
0.1
0.11
0.12
0
1
2
3
0
2
4
6
0
2
4
5
7
9
Rel
ativ
e ex
pres
sion
Seed development (DPA)
a b
Rel
ativ
e ex
pres
sion
in p
ods
Read depth (FPKM)
WT
upl3
Mea
n se
ed
area
(mm
2 )
c d
Mea
n lip
id c
onte
nt(μ
g/se
ed)
upl3
WT
e f
P = 0.009
Seed development (DPA)
Rel
ativ
e ex
pres
sion
AtUPL3
Rel
ativ
e ex
pres
sion
Seed development (DPA)
g
AtGL2
AtMUM4
Figure 2.
WT upl3 WT upl3
0 5 10 15
WTupl3
WTupl3
0 5 10 15
0 5 10 15
R² = 0.95090.02
0.03
0.04
0.05
35000 45000 55000 65000
BnaUPL3.C03
P = 0.002P = 0.003
P = 0.001
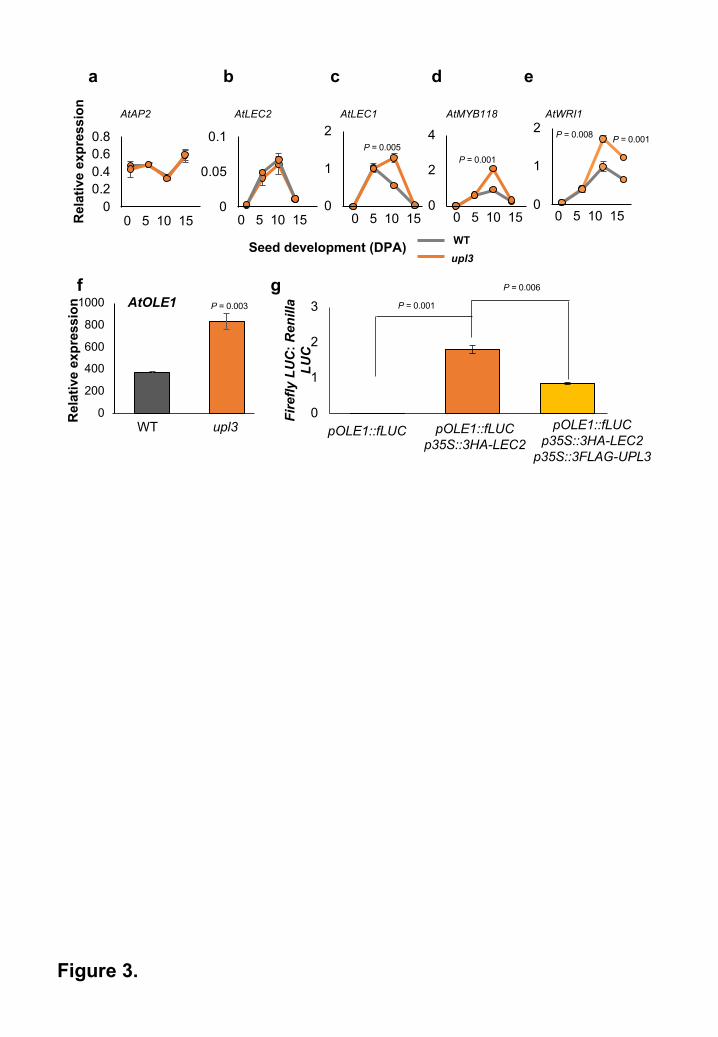
0
200
400
600
800
1000
0
2
4
0
1
2
0
1
2
0
1
2
3
AtAP2 AtLEC2 AtLEC1 AtMYB118 AtWRI1
Rel
ativ
e ex
pres
sion
Seed development (DPA)
a b c d e
f gP = 0.001
P = 0.006
pOLE1::fLUCp35S::3HA-LEC2
p35S::3FLAG-UPL3
pOLE1::fLUCp35S::3HA-LEC2
pOLE1::fLUC
AtOLE1 P = 0.003Fi
refly
LU
C: R
enill
aLU
C
Figure 3.
WTupl3
WT upl3
Rel
ativ
e ex
pres
sion
00.20.40.60.8
0
0.05
0.1P = 0.005
P = 0.001
P = 0.008 P = 0.001
0 5 10 15 0 5 10 15 0 5 10 15 0 5 10 15 0 5 10 15
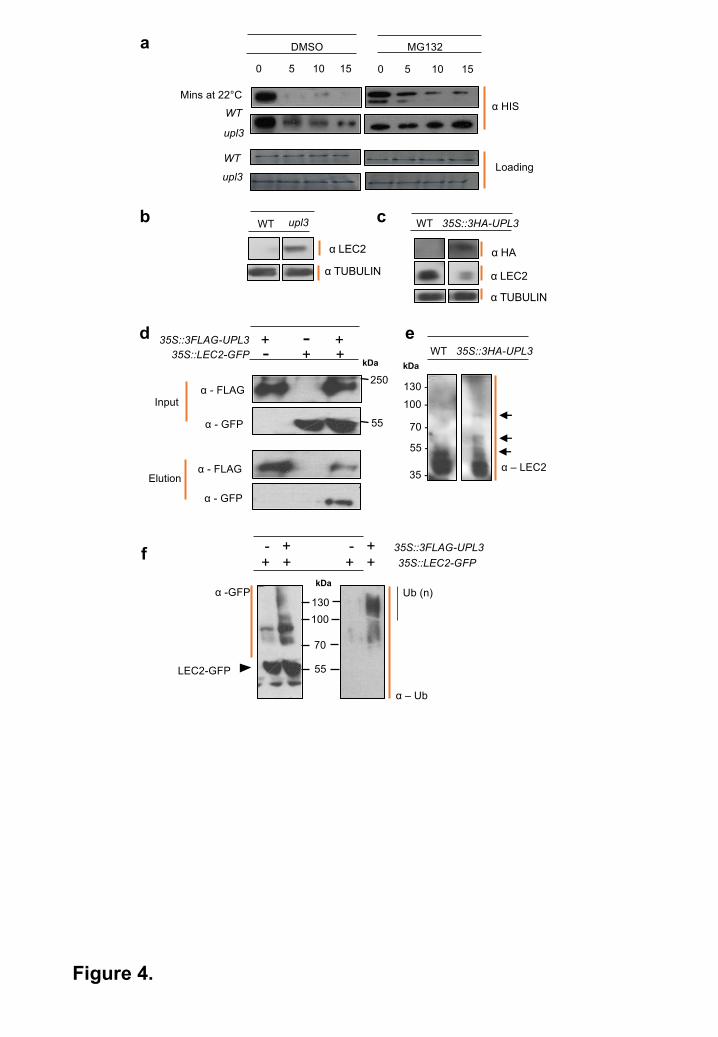
WT
upl3
MG132 DMSO
α HIS
Mins at 22°C
a
α LEC2
α LEC2
α TUBULIN
α HA
WT upl3
α TUBULIN
α - GFP
+ - +
Input
α - FLAG
Elution
- + +
0 5 10 15 0 5 10 15
WT
upl3
Loading
LEC2-GFP
α – Ub
Ub (n)α -GFP
35S::3FLAG-UPL335S::LEC2-GFP+ + + +
- + - +
WT 35S::3HA-UPL3
70
55
100
130
55 -
70 -
100 -
130 -
kDa
kDa
35 -α – LEC2
WT 35S::3HA-UPL3
α - GFP
α - FLAG
b c
d e
f
Figure 4.
35S::3FLAG-UPL335S::LEC2-GFP
kDa
250
55
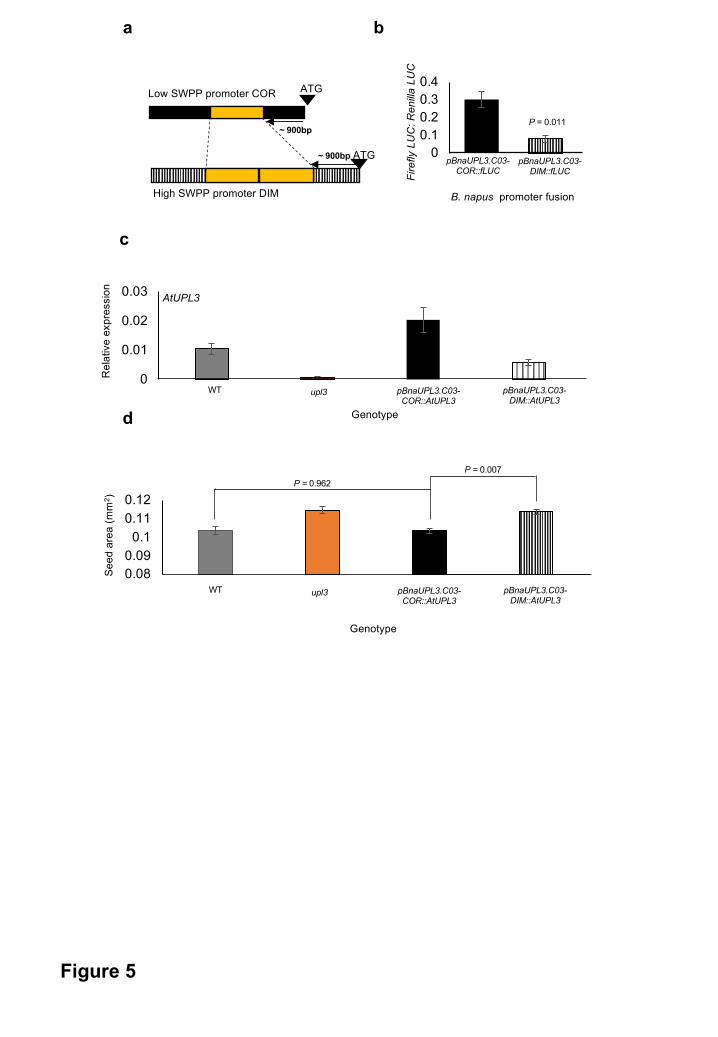
0
0.01
0.02
0.03
00.10.20.30.4ATG
ATG~ 900bp
Low SWPP promoter COR
High SWPP promoter DIM
~ 900bp
pBnaUPL3.C03-COR::fLUC
a b
c
0.080.090.1
0.110.12
Figure 5
Rel
ativ
e ex
pres
sion AtUPL3
Genotype
B. napus promoter fusion
pBnaUPL3.C03-DIM::fLUC
P = 0.011
pBnaUPL3.C03-COR::AtUPL3
pBnaUPL3.C03-DIM::AtUPL3
upl3WT
Fire
fly L
UC
: Ren
illaLU
C
pBnaUPL3.C03-COR::AtUPL3
pBnaUPL3.C03-DIM::AtUPL3
upl3WT
Genotype
Seed
are
a (m
m2 )
d
P = 0.007P = 0.962
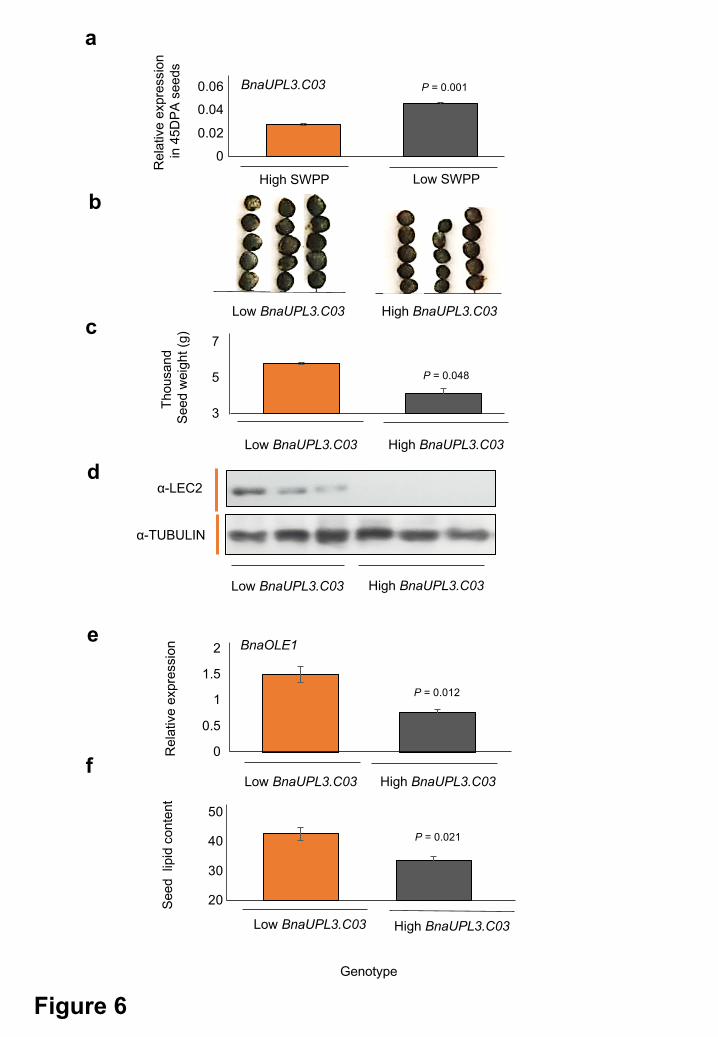
0
0.5
1
1.5
2
3
5
7
0
0.02
0.04
0.06
α-LEC2
α-TUBULIN
Low BnaUPL3.C03 High BnaUPL3.C03
b
a
c
*
d
Low BnaUPL3.C03 High BnaUPL3.C03
Seed lip
id c
onte
nt
Rela
tive e
xpre
ssio
n
in 4
5D
PA
seeds
High SWPP Low SWPP
P = 0.001
Low BnaUPL3.C03 High BnaUPL3.C03
e
f
Rela
tive e
xpre
ssio
n
Low BnaUPL3.C03 High BnaUPL3.C03
BnaOLE1
Thousa
nd
Seed w
eig
ht (g
)
Figure 6
Low BnaUPL3.C03 High BnaUPL3.C03
Genotype
BnaUPL3.C03
P = 0.012
20
30
40
50
P = 0.021
P = 0.048
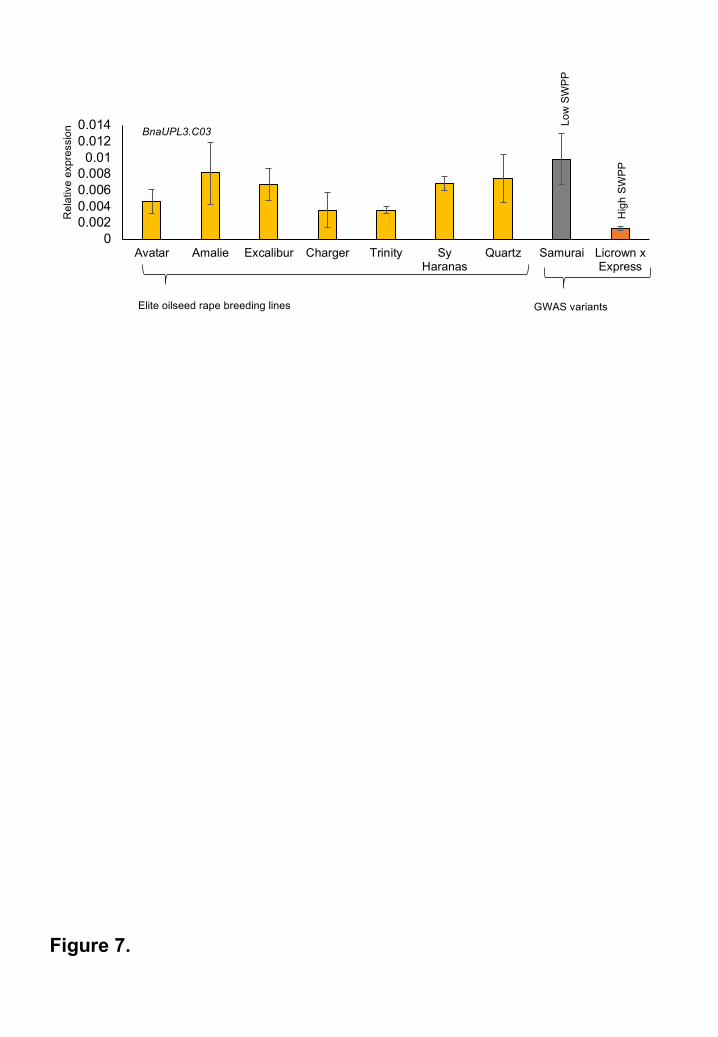
00.0020.0040.0060.0080.01
0.0120.014
Avatar Amalie Excalibur Charger Trinity SyHaranas
Quartz Samurai Licrown xExpress
Figure 7.
Low
SW
PP
Hig
hS
WP
P
Rel
ativ
e ex
pres
sion
Elite oilseed rape breeding lines GWAS variants
BnaUPL3.C03