Embed Size (px)
Citation preview

Naturallypositive
Management report 01-03/2017Lenzing Group
lenzing.com
Fo
to: M
arku
s R
enne
r
Q1 2017
2 Interim report 01-03/2017 LenzinG Group
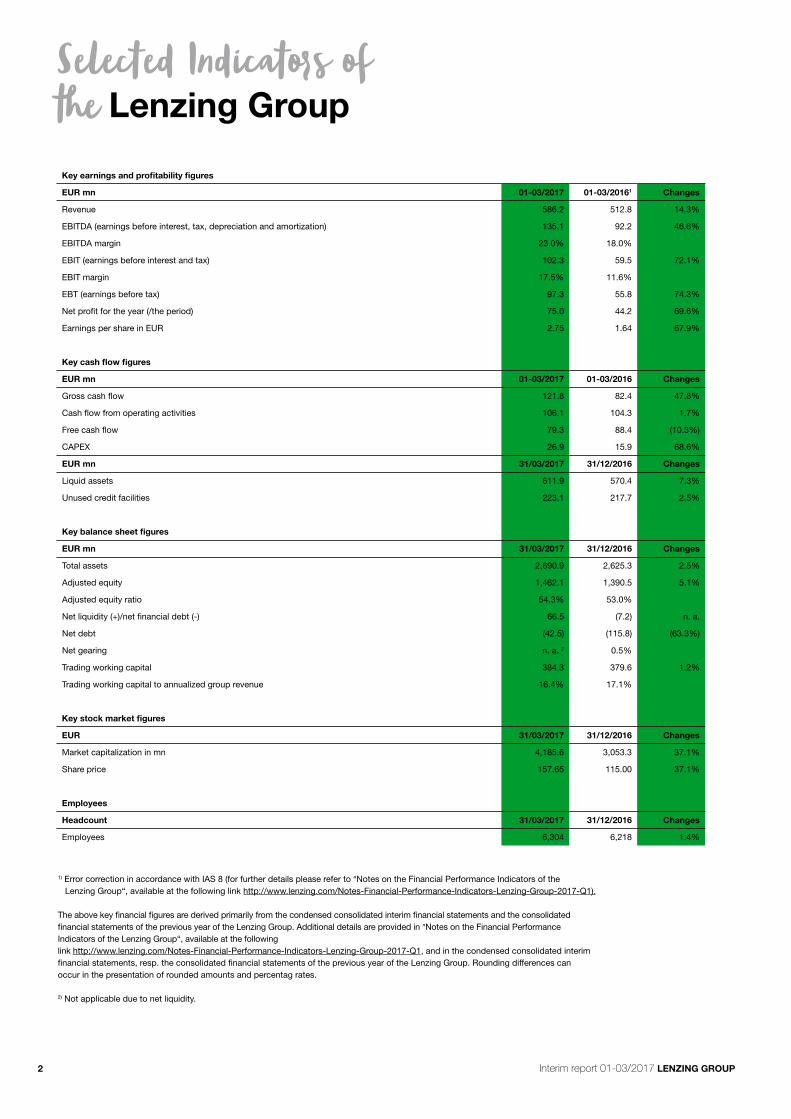
Key earnings and profitability figures
eur mn 01-03/2017 01-03/20161 Changes
Revenue 586.2 512.8 14.3%
EBITDA (earnings before interest, tax, depreciation and amortization) 135.1 92.2 46.6%
EBITDA margin 23.0% 18.0%
EBIT (earnings before interest and tax) 102.3 59.5 72.1%
EBIT margin 17.5% 11.6%
EBT (earnings before tax) 97.3 55.8 74.3%
Net profit for the year (/the period) 75.0 44.2 69.6%
Earnings per share in EUR 2.75 1.64 67.9%
Key cash flow figures
eur mn 01-03/2017 01-03/2016 Changes
Gross cash flow 121.8 82.4 47.8%
Cash flow from operating activities 106.1 104.3 1.7%
Free cash flow 79.3 88.4 (10.3%)
CAPEX 26.9 15.9 68.6%
eur mn 31/03/2017 31/12/2016 Changes
Liquid assets 611.9 570.4 7.3%
Unused credit facilities 223.1 217.7 2.5%
Key balance sheet figures
eur mn 31/03/2017 31/12/2016 Changes
Total assets 2,690.9 2,625.3 2.5%
Adjusted equity 1,462.1 1,390.5 5.1%
Adjusted equity ratio 54.3% 53.0%
Net liquidity (+)/net financial debt (-) 66.5 (7.2) n. a.
Net debt (42.5) (115.8) (63.3%)
Net gearing n. a. 2 0.5%
Trading working capital 384.3 379.6 1.2%
Trading working capital to annualized group revenue 16.4% 17.1%
Key stock market figures
eur 31/03/2017 31/12/2016 Changes
Market capitalization in mn 4,185.6 3,053.3 37.1%
Share price 157.65 115.00 37.1%
employees
Headcount 31/03/2017 31/12/2016 Changes
Employees 6,304 6,218 1.4%
1) Error correction in accordance with IAS 8 (for further details please refer to “Notes on the Financial Performance Indicators of the Lenzing Group“, available at the following link http://www.lenzing.com/Notes-Financial-Performance-Indicators-Lenzing-Group-2017-Q1).
The above key financial figures are derived primarily from the condensed consolidated interim financial statements and the consolidated financial statements of the previous year of the Lenzing Group. Additional details are provided in “Notes on the Financial Performance Indicators of the Lenzing Group“, available at the following link http://www.lenzing.com/Notes-Financial-Performance-Indicators-Lenzing-Group-2017-Q1, and in the condensed consolidated interim financial statements, resp. the consolidated financial statements of the previous year of the Lenzing Group. Rounding differences can occur in the presentation of rounded amounts and percentag rates.
2) Not applicable due to net liquidity.
Selected Indicators of the Lenzing Group
3 Interim report 01-03/2017 LenzinG Group
Management Report 01-03/2017
The economic environment during the first three months of 2017 was somewhat better than the previous quarters. The International Monetary Fund (IMF) raised its forecast for growth this year to 3.5 percent, following a plus of 3.1 percent in 2016. The outlook for the industrial countries, in particular the USA, has improved. The emerging countries are again expected to generate more than three-fourths of global growth in 2017, while less developed countries should benefit from higher raw material prices. Uncertainties for these scenarios can be found in political developments like the Brexit and increasingly protectionist tendencies.
The global fiber markets were characterized by very different developments in the first quarter of 2017: Rising demand combined with unchanged production volumes and the further reduction of high inventories in China led to a stable cotton price. Polyester fiber prices began to increase at mid-quarter, but again fell below the level at the start of the year due to a decline in oil and raw material prices. Standard viscose prices remained stable during the usual seasonal hole before the Chinese new year due to environmentally-related production cutbacks in China, and then rose sharply. The restart of several lines in March triggered a decline in prices, which have since stabilized at a good level.
The Lenzing Group got off to a very good start in this sector environment and recorded a substantial year-on-year increase in revenue and earnings for the first three months of 2017 – to mark the best quarter in the company’s history.
The consistent implementation of the sCore TEN corporate strategy with its focus on profitable growth is continuing: the new sales and marketing offices in Turkey and Korea will allow the Lenzing Group to provide its customers with even better service. The expansion of special fibers is also progressing well with the groundbreaking ceremony in Heiligenkreuz (Austria) and the start of construction in Mobile, Alabama (USA). Lenzing further underscored its leadership in sustainability with the presentation of the new RefibraTM branded lyocell fibers at the Première Vision in Paris, one of the most important textile trade fairs, and the parallel market launch of shirts made of these fibers in the Zara stores operated by the world’s largest fashion retailer Inditex. The innovation pipeline remains well-filled.
Group revenue rose by 14.3 percent to EUR 586.2 mn in the first quarter of 2017. This growth was based on higher selling prices, related to the Chinese new year as well as an improved product
mix, the reduction of inventories and more favorable currency exchange rates.
The cost of material and other purchased services were slightly higher due to the development of raw material and pulp prices. Personnel expenses increased as a result of adjustments required by collective bargaining agreements, additional hiring for the expansion of production capacity and the more intensive direct servicing of customers in our sales and marketing offices.
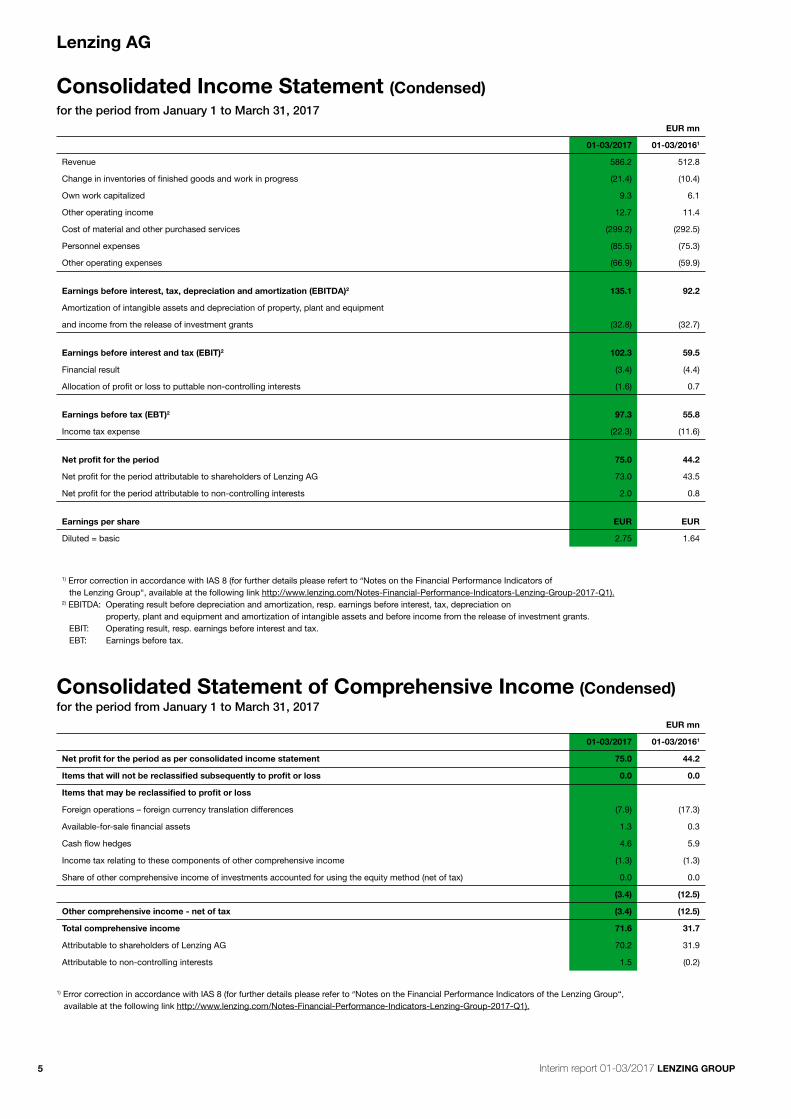
EBITDA (earnings before interest, tax, depreciation and amortization) rose by 46.6 percent to EUR 135.1 mn and EBIT (earnings before interest and tax) by 72.1 percent to EUR 102.3 mn. EBT (earnings before tax) increased by 74.3 percent to EUR 97.3 mn. The resulting rise in income tax expenses led to a 69.6 percent improvement in net profit to EUR 75 mn. Earnings per share equaled EUR 2.75, compared with EUR 1.64 in the first quarter of the previous year.
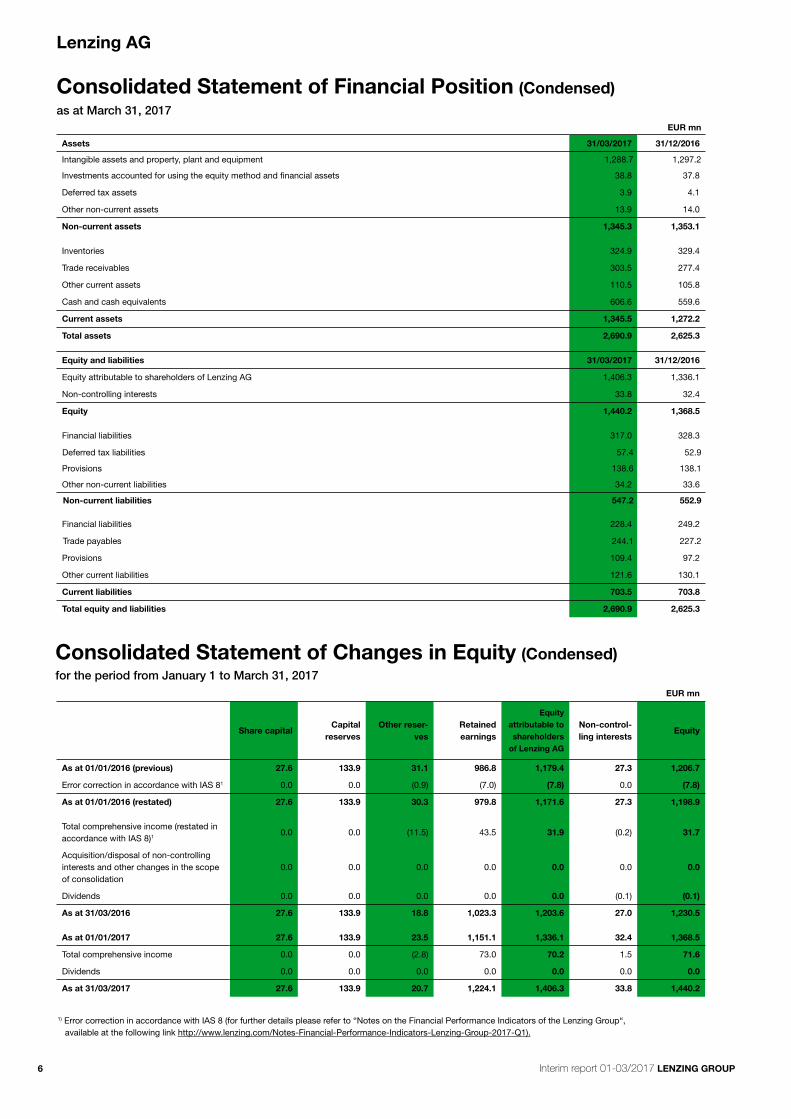
The most important changes in the statement of financial position are related to trade receivables and trade payables, cash and cash equivalents and financial liabilities. The factors responsible for these developments included a reduction in the factoring volume, the increase in investments, an increase in liquidity due to higher cash flow and the scheduled repayment of expiring financing.
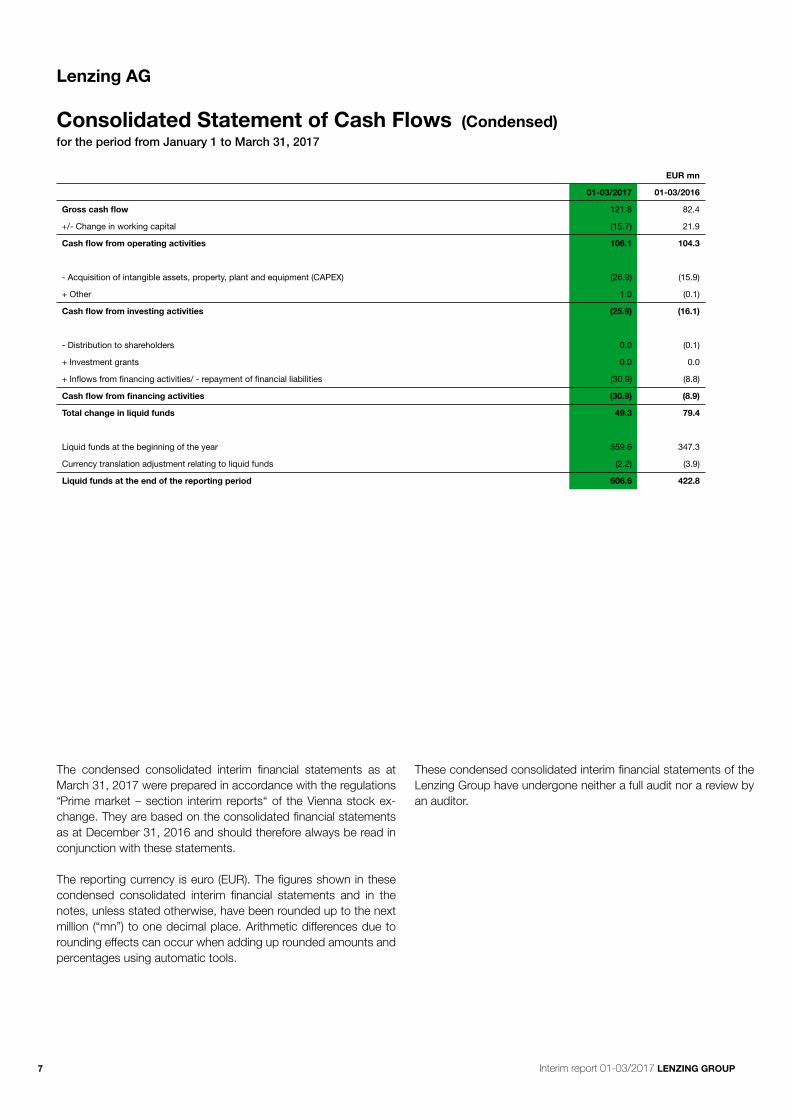
CAPEX (investments in intangible assets, property, plant and equipment) was 68.6 percent higher at EUR 26.9 mn in the first quarter of 2017. This increase reflected the ongoing capacity expansion projects in Heiligenkreuz and Mobile.
Gross cash flow rose by 47.8 percent to EUR 121.8 mn due to higher prices, an improvement in the product mix, the reduction of inventories and more favorable exchange rates. Liquid assets were 7.3 percent higher than the beginning of the year at EUR 611.9 mn. With net liquidity of EUR 66.5 mn, the Lenzing Group was virtually debt-free at the end of the first quarter of 2017.
Based on the substantial earnings improvement in 2016 and the solid liquidity position, the Management Board and Supervisory Board made a recommendation to the 73rd Annual General Meeting on April 25, 2017 to distribute a dividend of EUR 3 per share (previous year: EUR 2) plus a special dividend of EUR 1.2 per share for the 2016 financial year. The shareholders approved this recommendation by a clear majority.
4 Interim report 01-03/2017 LenzinG Group
outlook
The International Monetary Fund is forecasting a slight acceleration in global economic growth to 3.5 percent in 2017. However, the political environment will be a source of greater uncertainty. Developments on the fiber markets should be slightly more positive, but still volatile. The market will continue to feel the effects of further reductions in cotton inventories in China. Polyester fiber prices will remain at a low level in line with market expectations, leading to a further increase in interfiber competition.
The wood-based cellulose fiber segment, which is relevant for Lenzing, should again outpace the overall fiber market. The demand for these cellulose fibers was very good at the beginning of 2017, with the long-term trend pointing towards further growth in viscose and, above all, wood-based cellulose specialty fibers. On the supply side, the market is not expected to see the entry of any notable new production capacity in 2017.
Lenzing is very well positioned in this environment. In 2017 we will continue to focus on the disciplined implementation of the sCore TEN strategy and, specifically, on specialization and sustainability- driven innovation. The steady expansion of the specialty fiber capacities and the intensification of our brand management will be essential to increasing consumers’ awareness for the unique selling proposition of our fiber products.
The Lenzing Group had an excellent start into the year 2017 and registered strong demand for its fibers during the first quarter which, in turn, led to continued very high capacity utilization in all product groups. The market price index for viscose fibers was substantially higher than in the comparable prior year period. Under the assumption of unchanged conditions in the fiber market and stable exchange rates, Lenzing expects a considerable improvement in results in the fiscal year 2017 compared to 2016.
Stefan Doboczky robert van de Kerkhof Thomas obendrauf Heiko Arnold Chief Executive Officer Chief Commercial Officer Chief Financial Officer Chief Technology Officer
5 Interim report 01-03/2017 LenzinG Group
Lenzing AG
Consolidated income Statement (Condensed)for the period from January 1 to March 31, 2017
eur mn
01-03/2017 01-03/20161
Revenue 586.2 512.8
Change in inventories of finished goods and work in progress (21.4) (10.4)
Own work capitalized 9.3 6.1
Other operating income 12.7 11.4
Cost of material and other purchased services (299.2) (292.5)
Personnel expenses (85.5) (75.3)
Other operating expenses (66.9) (59.9)
earnings before interest, tax, depreciation and amortization (eBiTDA)2 135.1 92.2
Amortization of intangible assets and depreciation of property, plant and equipment
and income from the release of investment grants (32.8) (32.7)
earnings before interest and tax (eBiT)2 102.3 59.5
Financial result (3.4) (4.4)
Allocation of profit or loss to puttable non-controlling interests (1.6) 0.7
earnings before tax (eBT)2 97.3 55.8
Income tax expense (22.3) (11.6)
net profit for the period 75.0 44.2
Net profit for the period attributable to shareholders of Lenzing AG 73.0 43.5
Net profit for the period attributable to non-controlling interests 2.0 0.8
earnings per share eur eur
Diluted = basic 2.75 1.64
for the period from January 1 to March 31, 2017eur mn
01-03/2017 01-03/20161
net profit for the period as per consolidated income statement 75.0 44.2
items that will not be reclassified subsequently to profit or loss 0.0 0.0
items that may be reclassified to profit or loss
Foreign operations – foreign currency translation differences (7.9) (17.3)
Available-for-sale financial assets 1.3 0.3
Cash flow hedges 4.6 5.9
Income tax relating to these components of other comprehensive income (1.3) (1.3)
Share of other comprehensive income of investments accounted for using the equity method (net of tax) 0.0 0.0
(3.4) (12.5)
other comprehensive income - net of tax (3.4) (12.5)
Total comprehensive income 71.6 31.7
Attributable to shareholders of Lenzing AG 70.2 31.9
Attributable to non-controlling interests 1.5 (0.2)
1) Error correction in accordance with IAS 8 (for further details please refer to “Notes on the Financial Performance Indicators of the Lenzing Group“, available at the following link http://www.lenzing.com/Notes-Financial-Performance-Indicators-Lenzing-Group-2017-Q1).
Consolidated Statement of Comprehensive income (Condensed)
1) Error correction in accordance with IAS 8 (for further details please refert to “Notes on the Financial Performance Indicators of the Lenzing Group“, available at the following link http://www.lenzing.com/Notes-Financial-Performance-Indicators-Lenzing-Group-2017-Q1).2) EBITDA: Operating result before depreciation and amortization, resp. earnings before interest, tax, depreciation on property, plant and equipment and amortization of intangible assets and before income from the release of investment grants. EBIT: Operating result, resp. earnings before interest and tax. EBT: Earnings before tax.
6 Interim report 01-03/2017 LenzinG Group
Lenzing AG
Consolidated Statement of Financial position (Condensed)as at March 31, 2017
eur mn
Assets 31/03/2017 31/12/2016
Intangible assets and property, plant and equipment 1,288.7 1,297.2
Investments accounted for using the equity method and financial assets 38.8 37.8
Deferred tax assets 3.9 4.1
Other non-current assets 13.9 14.0
non-current assets 1,345.3 1,353.1
Inventories 324.9 329.4
Trade receivables 303.5 277.4
Other current assets 110.5 105.8
Cash and cash equivalents 606.6 559.6
Current assets 1,345.5 1,272.2
Total assets 2,690.9 2,625.3
equity and liabilities 31/03/2017 31/12/2016
Equity attributable to shareholders of Lenzing AG 1,406.3 1,336.1
Non-controlling interests 33.8 32.4
equity 1,440.2 1,368.5
Financial liabilities 317.0 328.3
Deferred tax liabilities 57.4 52.9
Provisions 138.6 138.1
Other non-current liabilities 34.2 33.6
non-current liabilities 547.2 552.9
Financial liabilities 228.4 249.2
Trade payables 244.1 227.2
Provisions 109.4 97.2
Other current liabilities 121.6 130.1
Current liabilities 703.5 703.8
Total equity and liabilities 2,690.9 2,625.3
eur mn
Share capitalCapital
reserves other reser-
vesretained earnings
equity attributable to shareholders
of Lenzing AG
non-control-ling interests
equity
As at 01/01/2016 (previous) 27.6 133.9 31.1 986.8 1,179.4 27.3 1,206.7
Error correction in accordance with IAS 81 0.0 0.0 (0.9) (7.0) (7.8) 0.0 (7.8)
As at 01/01/2016 (restated) 27.6 133.9 30.3 979.8 1,171.6 27.3 1,198.9
Total comprehensive income (restated in accordance with IAS 8)1
0.0 0.0 (11.5) 43.5 31.9 (0.2) 31.7
Acquisition/disposal of non-controlling interests and other changes in the scope of consolidation
0.0 0.0 0.0 0.0 0.0 0.0 0.0
Dividends 0.0 0.0 0.0 0.0 0.0 (0.1) (0.1)
As at 31/03/2016 27.6 133.9 18.8 1,023.3 1,203.6 27.0 1,230.5
As at 01/01/2017 27.6 133.9 23.5 1,151.1 1,336.1 32.4 1,368.5
Total comprehensive income 0.0 0.0 (2.8) 73.0 70.2 1.5 71.6
Dividends 0.0 0.0 0.0 0.0 0.0 0.0 0.0
As at 31/03/2017 27.6 133.9 20.7 1,224.1 1,406.3 33.8 1,440.2
1) Error correction in accordance with IAS 8 (for further details please refer to “Notes on the Financial Performance Indicators of the Lenzing Group“, available at the following link http://www.lenzing.com/Notes-Financial-Performance-Indicators-Lenzing-Group-2017-Q1).
Consolidated Statement of Changes in equity (Condensed)for the period from January 1 to March 31, 2017
7 Interim report 01-03/2017 LenzinG Group
Lenzing AG
Consolidated Statement of Cash Flows (Condensed)for the period from January 1 to March 31, 2017
eur mn
01-03/2017 01-03/2016
Gross cash flow 121.8 82.4
+/- Change in working capital (15.7) 21.9
Cash flow from operating activities 106.1 104.3
- Acquisition of intangible assets, property, plant and equipment (CAPEX) (26.9) (15.9)
+ Other 1.0 (0.1)
Cash flow from investing activities (25.9) (16.1)
- Distribution to shareholders 0.0 (0.1)
+ Investment grants 0.0 0.0
+ Inflows from financing activities/ - repayment of financial liabilities (30.9) (8.8)
Cash flow from financing activities (30.9) (8.9)
Total change in liquid funds 49.3 79.4
Liquid funds at the beginning of the year 559.6 347.3
Currency translation adjustment relating to liquid funds (2.2) (3.9)
Liquid funds at the end of the reporting period 606.6 422.8
The condensed consolidated interim financial statements as at March 31, 2017 were prepared in accordance with the regulations “Prime market – section interim reports“ of the Vienna stock ex-change. They are based on the consolidated financial statements as at December 31, 2016 and should therefore always be read in conjunction with these statements.
The reporting currency is euro (EUR). The figures shown in these condensed consolidated interim financial statements and in the notes, unless stated otherwise, have been rounded up to the next million (“mn”) to one decimal place. Arithmetic differences due to rounding effects can occur when adding up rounded amounts and percentages using automatic tools.
These condensed consolidated interim financial statements of the Lenzing Group have undergone neither a full audit nor a review by an auditor.
imprintCopyright and published by Lenzing AG4860 Lenzing, Austriawww.lenzing.com
Concept and design: Kommhaus
note:This English translation of the interim report was prepared for the company´s convenience only. It is a non-binding translation of the German condensed interim report. In the event of discrepancies between this English translation and the German original the latter shall prevail.
This interim group report also contains forward looking state-ments based on current assessment and assumptions made by Lenzing Group to the best of its knowledge. State-ments using the words “should”, “may”, “will”, “expected”, “intended”, “assume”, “suppose”, “estimate”, “plan”, “anticipate”, “is of the opinion”, “to my knowledge”, “in my estimation” or similar formulations indicate such forward-looking statements. The forecasts relating to the future development of the Lenzing Group are estimates based on the information available at the time of this interim group report going to print.
If the assumptions on which the forecasts are based do not occur or risks arise at a level that was not anticipated, actual results may deviate from forecasts.
Rounding differences can occur when adding up rounded amounts and percentages. The interim group report was prepared with the utmost care to ensure the accuracy and completeness of informa-tion in all sections. Nonetheless, errors due to rounding, typeset-ting and printing cannot be completely ruled out.


![Optimization Online - A Low Dimensional Semidefinite ...SDP arises naturally from Lagrangian relaxation, see e.g., [25]. Alternatively, one can lift the problem using the positive](https://img.pdfslide.net/doc/110x75/60909c1e343fd13be7403886/optimization-online-a-low-dimensional-semideinite-sdp-arises-naturally-from.jpg)