Embed Size (px)
Citation preview
NATURE OF OXYGEN SPECIES ON Au(111)AND Ag(111) MODEL CATALYSTS AND
THEIR ROLE IN O-H, C-H, C-C, N-H BONDACTIVATION
a dissertation submitted tothe graduate school of engineering and science
of bilkent universityin partial fulfillment of the requirements for
the degree ofdoctor of philosophy
inchemistry
ByMustafa Karatok
October 2017
NATURE OF OXYGEN SPECIES ON Au(111) AND Ag(111)MODEL CATALYSTS AND THEIR ROLE IN O-H, C-H, C-C, N-HBOND ACTIVATIONBy Mustafa KaratokOctober 2017
We certify that we have read this dissertation and that in our opinion it is fullyadequate, in scope and in quality, as a dissertation for the degree of Doctor ofPhilosophy.
Emrah Ozensoy(Advisor)
Sefik Suzer
Oguz Gulseren
Ahmet Oral
Hande ToffoliApproved for the Graduate School of Engineering and Science:
Ezhan KarasanDirector of the Graduate School
ii
ABSTRACT
NATURE OF OXYGEN SPECIES ON Au(111) ANDAg(111) MODEL CATALYSTS AND THEIR ROLE IN
O-H, C-H, C-C, N-H BOND ACTIVATION
Mustafa KaratokPh.D. in Chemistry
Advisor: Emrah OzensoyOctober 2017
Metal-catalyzed heterogeneous oxidation reactions have high importance for thelarge-scale production of the commodity chemicals vastly used in the chemicalindustry. Controlling the selectivity in such processes to increase the productyield and minimize the production of undesired byproducts requires a molecularlevel understanding of the bond activation mechanisms. Thus, understandingthe nature of oxygen species in various bond cleavage processes is critical. Inthe current work, nature of oxygen species was studied on the planar Au(111)and Ag(111) single crystal model catalyst surfaces via x-ray photoelectron spec-troscopy (XPS), temperature programmed desorption/ temperature programmedreaction spectroscopy (TPD/TPRS), low energy electron diffraction (LEED) andinfrared reflection absorption spectroscopy (IRAS) techniques under ultra-highvacuum (UHV) conditions. Ozone (O3) was utilized as the oxygen delivery agentproviding atomic oxygen to the reacting surface. Various oxygen species weredetermined on both Au(111) and Ag(111) model catalysts and their role in O-H,C-H, C-C and N-H bond activation was investigated by using probe moleculessuch as methanol, acetaldehyde and ammonia. Three different oxygen speciessuch as atomic oxygen (Oa), subsurface oxygen (Osub) and surface oxide (Oox)were determined on Au(111) single crystal. Oxygen accumulation on Au(111)surface at 140 K for θO<1.0 MLE of oxygen coverage resulted in the surfaceatomic oxygen (Oa) formation while 2D surface oxide (Oox) started to grow forθO>1.0 MLE of oxygen coverage at the same temperature. It was also shownthat oxygen atoms dissolved (Osub) into the bulk of the Au(111) single crystalwhen oxygen was accumulated at 473 K. Atomic oxygen species (Oa) on Au(111)was found to be very active for the cleavage of O-H and C-H bonds in methanol;C-C bond in acetaldehyde; N-H bond in ammonia molecules. Surface oxide (Oox)overlayer was also active for methanol oxidation, however it showed very high
iii
iv
selectivity towards CO2. Dissolved oxygen atoms (Osub) revealed almost no ac-tivity in methanol oxidation reactions on Au(111). In a similar manner, threedifferent oxygen species were determined on the Ag(111) surface such as surfaceatomic oxygen (Oa), surface oxide (Oox) and bulk-like oxide (Obulk) species. Dis-ordered atomic oxygen (Oa) and surface oxide (Oox) overlayers prepared at 140K on Ag(111) for θO ≤ 0.2 MLE were found to be very active for O-H and C-H bond cleavage producing formaldehyde as the dominant product. Increasingoxygen quantity for both oxygen species (0.7 MLE ≤ θO ≤ 1.3 MLE) resultedmostly CO2 formation. Oa (θO < 1.10 MLE) was also found to be highly activein N-H bond cleavage for ammonia and selective to N2 as the dominant product.On the other hand, ordered p(5×1) and c(4×8) surface oxide (Oox) overlayerson Ag(111) prepared 473 K were found to be almost entirely inactive for N-Hcleavage. Extreme oxygen exposures on Ag(111) (θO > 1.93 MLE ) at 140 Kled to bulk-like silver oxide (Obulk) species with poor N2 selectivity in ammoniaoxidation and increasing extent of formation of toxic pollutants such as NO andN2O.
Keywords: Oxidation Catalyst, Bond Activation, Model Catalyst, Au(111),Ag(111).
OZET
OKSIJEN TURLERININ Au(111) VE Ag(111) MODELKATALIZORLERI UZERINDEKI DOGASI VE O-H,
C-H, C-C, N-H BAG AKTIVASYONUNDAKI ROLLERI
Mustafa KaratokKimya, Doktora
Tez Danısmanı: Emrah OzensoyEkim 2017
Metal katalizli heterojen oksidasyon reaksiyonları, kimya endustrisinde buyukolcekli olarak uretilen urunlerin uretiminde buyuk onem tasımaktadır. Urunverimini arttırmak ve istenmeyen yan urunlerin uretimini en aza indirmek icinbu tur proseslerde seciciligin kontrolu, molekul seviyesinde bag aktive etmemekanizmalarının anlasılmasını gerektirmektedir. Bu nedenle, cesitli bag kırılmasureclerinde oksijen turlerinin dogasını anlamak kritik onem tasımaktadır. Mev-cut calısmada, x-ısını fotoelektron spektroskopisi (XPS), sıcaklık programlı des-orpsiyon / sıcaklık programlı reaksiyon spektroskopisi (TPD / TPRS), dusuk en-erjili elektron kırınımı (LEED) ve kızılotesi yansıma absorpsiyon spektroskopisi(IRAS) teknikleri kullanılarak duzlemsel Au(111) ve Ag(111) tek kristal modelkatalizor yuzeyleri uzerindeki oksijen turlerinin dogası ultra-yuksek vakum(UHV) kosulları altında incelenmistir. Atomik oksijeni saglaması bakımındanoksijen kaynagı olarak ozon (O3) kullanılmıstır. Au(111) ve Ag(111) modelkatalizorler uzerindeki cesitli oksijen turleri belirlenip, bu turlerin metanol, ase-taldehit ve amonyak gibi molekuller kullanılarak O-H, C-H, C-C ve N-H bag ak-tivasyonlarındaki rolu arastırılmıstır. Au(111) tek kristali uzerinde yuzey atomikoksijen (Oa), yuzey altı oksijen (Osub) ve yuzey oksit (Oox) olmak uzere uc farklıoksijen turu belirlenmistir. Au(111) uzerinde 140 K sıcaklıkta, 1 tek katmanesdegeri (MLE) ve daha az miktarda oksijen birikimi, atomik yuzey oksijeni(Oa) olusumuyla sonuclanırken, aynÄś sıcaklıkta 1 MLE’den daha fazla oksijenbirikimiyle birlikte 2 boyutlu yuzey oksit olusmaya basladıgı saptanmıstır. Ayrıcaoksijenin 473 K sıcaklıktaki yuzeye gonderilmesiyle oksijen atomlarının Au(111)tek kristalinin icerisinde cozundugu (Osub) gosterilmistir. Yuzeyde bulunan oksi-jen atomlarının (Oa) metanoldeki O-H ve C-H; asetaldehitteki C-C; amonyaktakiN-H baglarının kırılmasında cok aktif oldugu gorulmustur. Yuzeydeki oksit kat-manının (Oox) da metanol ile tepkimeye girdigi, fakat bu tepkime sonucunda CO2
v
vi
olusmasına karsı cok yuksek secicilikte oldugu gorulmustur. Au(111) tek kristaliicerisinde cozunmus olan oksijen atomları (Osub) metanol oksidasyon reaksiyon-larında neredeyse hic aktivite gostermemistir. Benzer sekilde Ag(111) tek kristaliuzerinde yuzey atomik oksijen (Oa), yuzey oksit (Oox) ve balk oksit (Obulk) ol-mak uzere uc farklı oksijen turu belirlenmistir. 140 K sıcaklıkta 0.2 MLE vedaha az oksijen ile olusturulan duzensiz dizilmis atomik oksijen (Oa) ve yuzeyoksit (Oox) katmanlarının metanoldeki O-H ve C-H baglarının kırılmasında aktifoldugu ve baskın urun olarak formaldehit olusturdugu gorulmustur. Artan ok-sijen miktarıyla birlikte (0.7 MLE ≤ θO ≤ 1.3 MLE), bahsedilen her iki turde cogunlukla CO2 olusumuna sebep olmaktadır. Ayrıca Oa turunun (θO <
1.10 MLE) amonyak molekulundeki N-H bag kırılmasında aktif oldugu ve baskınurun olarak N2 olusturdugu saptanmıstır. Diger taraftan, Ag(111) tek kristaliuzerinde 473 K sıcaklıkta olusturulan p(5×1) ve c(4×8) yuzey dizilimindeki yuzeyoksit (Oox) katmanının N-H bag kırılmasında neredeyse tamamen pasif oldugugorulmustur. Ag(111) uzerinde 140 K sıcaklıkta yuksek oksijene (θO > 1.93 MLE)maruz bırakılarak olusturulan balk gumus oksit (Obulk) turunun ise amonyak ok-sidasyonu tepkimesinde N2 olusumuna karsı dusuk secicilik gosterdigi ve NO, N2Ogibi toksik kirleticilerin olusumunu artırdıgı saptanmıstır.
Anahtar sozcukler : Oksidasyon Katalizoru, Bag Aktivasyonu, Model Katalizor,Au(111), Ag(111).
Acknowledgements
First of all, I would like to express my sincere gratitude to my advisor, Dr.Emrah Ozensoy for his patience, motivation and immense knowledge. I deeplyappreciated that he believed in my potential and gave me an opportunity to bepart of his team. His guidance helped me all throughout my research and he hasbecome my role model with his scientific enthusiasm and vision.
Besides my advisor, I would like to thank the rest of my thesis committee, Dr.Sefik Suzer, Dr. Coskun Kocabas, Dr. Hande Toffoli, Dr. Oguz Gulseren andDr. Ahmet Oral for their insightful comments and invaluable time.
My sincere thanks goes to my former lab mate, Dr. Evgeny Vovk, for hispatience and support in the first few tough years of my graduate work. I alsothank to my lab mates Asad Shah, Ali Vala Koc and Bartu Karakurt for theircollaboration, companionship and for all the fun we have had in the lab.
I owe my deepest gratitude to a spectacular craftsman, Ethem Anber, not onlyfor his help in technical problems and for giving useful design ideas, but also forsharing his life experiences and for his advice.
I would like to thank to Sean McWhorter for his friendship and for encouragingme in my desperate times. I would also like to thank to other group members thatI worked with in different projects: Dr. Zafer Say, Dr. Deniz Erdogan, KeremEmre Ercan, Merve Kurt, Aybegum Samast, Elif Persembe, Merve Balcı, and oneof my lunch partner in the last months, Mohammed Irfan, for their cooperationand friendship.
I also would like to acknowledge Dr. Mehmet Erbudak from ETH Zurich forhis contributions regarding the construction of the UHV experimental setup.
I would like to thank to the Scientific and Technological Research Council ofTurkey (TUBITAK) (Project code: 112T589) for the financial support.
I would like to offer my special thanks to my mom and dad, for their love andsupport during my education.
Finally my deepest appreciation goes to my wife, Dr. Zahide Pamir Kara-tok, who was very patient and thoughtful although she was conducting her ownstressful research. She supported me all the time and deserves all the credit forencouraging me to apply to Bilkent in the first place.
vii
Contents
1 Introduction 11.1 Motivation of the Study . . . . . . . . . . . . . . . . . . . . . . . 11.2 Nature of Oxygen on Au(111) Single Crystal . . . . . . . . . . . . 31.3 Nature of Oxygen on Ag(111) Single Crystal . . . . . . . . . . . . 5
2 Experimental 82.1 Temperature Programmed Desorption/ Reaction Spectroscopy . . 92.2 X-ray Photoemission Spectroscopy . . . . . . . . . . . . . . . . . 132.3 Infrared Reflection Absorption Spectroscopy . . . . . . . . . . . . 152.4 Low Energy Electron Diffraction . . . . . . . . . . . . . . . . . . . 192.5 Atomic Oxygen Accumulation Methods . . . . . . . . . . . . . . . 21
2.5.1 NO2 and water co-adsorption . . . . . . . . . . . . . . . . 222.5.2 Ozone Decomposition . . . . . . . . . . . . . . . . . . . . . 24
3 Bond Activation on Gold 263.1 Characterization of the Au(111) Single Crystal Surface . . . . . . 263.2 Oxygen Behavior on Au(111) Single Crystal . . . . . . . . . . . . 29
3.2.1 Examination of the Activity of Oxygen Overlayers onAu(111) by Titration with CO Molecules . . . . . . . . . . 37
3.3 C-H and O-H Activation on Au(111) Single Crystal . . . . . . . . 383.3.1 Methanol on Clean Au(111) Single Crystal . . . . . . . . . 393.3.2 Methanol on Oxygen pre-covered Au(111) Single Crystal . 41
3.4 C-C Activation on Au(111) Single Crystal . . . . . . . . . . . . . 453.4.1 Acetaldehyde and Methyl Formate on Clean Au(111) Single
Crystal . . . . . . . . . . . . . . . . . . . . . . . . . . . . . 45
viii
CONTENTS ix
3.4.2 Acetaldehyde on Oxygen Pre-covered Au(111) . . . . . . . 493.5 N-H Activation on Au(111) . . . . . . . . . . . . . . . . . . . . . 52
3.5.1 Ammonia adsorption on clean Au(111) . . . . . . . . . . . 523.5.2 Ammonia on Oxygen Pre-covered Au(111) . . . . . . . . . 53
4 Bond Activation on Silver 564.1 Characterization of the Ag(111) Single Crystal Surface . . . . . . 564.2 Oxygen Behavior on Ag(111) Single Crystal . . . . . . . . . . . . 584.3 C-H and O-H Activation on Ag(111) . . . . . . . . . . . . . . . . 65
4.3.1 Methanol on Clean Ag(111) . . . . . . . . . . . . . . . . . 664.3.2 Methanol on oxygen pre-covered Ag(111) . . . . . . . . . . 684.3.3 The Effect of Methanol Dosage Temperature to the
Methanol Oxidation Reaction Pathways . . . . . . . . . . 754.4 N-H Activation on Ag(111) . . . . . . . . . . . . . . . . . . . . . . 77
4.4.1 Ammonia on Clean Ag(111) . . . . . . . . . . . . . . . . . 774.4.2 Ammonia on Oxygen Pre-covered Ag(111) . . . . . . . . . 81
5 Conclusions 875.1 Bond Activation by Au(111) . . . . . . . . . . . . . . . . . . . . . 875.2 Bond Activation by Ag(111) . . . . . . . . . . . . . . . . . . . . . 89
A Diagram of the IRAS Setup 108
B QMS Fragmentation Patterns of the Chemicals 109
C Infrared Frequencies and Mode Assignments for Methanol andMethoxy Species on Ag(111) 110
D Alternative depiction of TPRS data for ammonia SCO reaction111
E TPRS profiles for NH3 and H2O during ammonia SCO reaction112
F List of Publications 113
List of Figures
1.1 (100), (110) and (111) fcc crystal surfaces. Adapted from Ref. [14](All atoms are identical, color coding for different layers are forvisualization only) . . . . . . . . . . . . . . . . . . . . . . . . . . 3
2.1 Pictures of the multicomponent UHV system . . . . . . . . . . . . 92.2 Schematic setup for TPD experiments under UHV conditions.
Adapted from Ref. [65] . . . . . . . . . . . . . . . . . . . . . . . . 102.3 Representative TPD spectra for (a) zeroth, (b) first and (c) second
order desorption kinetics. Adapted from Ref. [68] . . . . . . . . . 122.4 (a) Diagram of the photoemission process. (b) Universal curve that
is plot of IMFP values of the metals as a function of the kineticenergy of electrons. Figures were adapted from Ref. [65] . . . . . 14
2.5 (a) A dual anode x-ray source configuration. Adapted fromRef. [72] (b) A double-pass cylindrical Mirror Energy Analyzer.Adapted from Ref. [73] . . . . . . . . . . . . . . . . . . . . . . . . 15
2.6 (a) Phase shifts of IR light components as a function of the angleof incidence on a metal surface. Adapted from Ref. [74]. (b) Aschematic representation of dipole moments of a diatomic moleculelocated perpendicular and parallel to the metal surface and theirimage dipoles on the surface. (c) Electric field and intensity func-tions of p-polarized light in copper surface as a function of theangle of incidence. Adapted from Ref. [74] . . . . . . . . . . . . . 17
2.7 Scaled-drawings and final view of the IRAS chamber that was de-signed and manufactured in the current work . . . . . . . . . . . . 18
x
LIST OF FIGURES xi
2.8 Scaled-drawings and final view of the IRAS setup that was designedand manufactured in the current work . . . . . . . . . . . . . . . 19
2.9 (a) Constructive interference phenomena and the relationship be-tween the real space vs. k-space basis vectors in a LEED exper-iment. (b) A schematic of a LEED configuration. Adapted fromRef. [75] . . . . . . . . . . . . . . . . . . . . . . . . . . . . . . . 21
2.10 Custom-design NO2 dosing line equipped with a stainless steel discpinhole (Diameter = 5 µm). . . . . . . . . . . . . . . . . . . . . . 23
2.11 Schematic of the custom-made Pb(NO3)2(s)-based NO2 deliverysystem. . . . . . . . . . . . . . . . . . . . . . . . . . . . . . . . . . 23
2.12 Details of the custom-made ozonizer and ozone trap accommodat-ing the silica gel. . . . . . . . . . . . . . . . . . . . . . . . . . . . 24
2.13 (a) Commercial ozone generator, ozone trap (b) before and (c)after ozone storage. . . . . . . . . . . . . . . . . . . . . . . . . . 25
3.1 Reconstructed Au(111) unit cell [89]. b) STM image of a recon-structed Au(111) surface (size 120×120 nm2) in UHV. Inset showsan atomic resolution image (8×6 nm2) where the unit cell is markedwith a rectangle. Adapted from Ref. [91] . . . . . . . . . . . . . . 27
3.2 A representative survey XP spectrum of the clean Au(111) singlecrystal. . . . . . . . . . . . . . . . . . . . . . . . . . . . . . . . . . 28
3.3 (a) Au 4f XP spectrum (b) LEED pattern of the clean Au(111)single crystal. . . . . . . . . . . . . . . . . . . . . . . . . . . . . . 29
3.4 O2 TPD profiles with increasing coverage of atomic oxygen onAu(111) prepared via ozone decomposition at 460 K (a), 300 K(b) and 140 K (c). . . . . . . . . . . . . . . . . . . . . . . . . . . 31
3.5 Au 4f region XP spectra of high coverage oxygen layers (θO = 2MLE) on Au(111) prepared at 460 K (a), 300 K (b) and 140 K (c)in comparison to the clean Au(111) single crystal. . . . . . . . . . 34
3.6 Au4f region XP spectra of Au(111) including 0.8 MLE oxygen over-layer prepared at 140 K in comparison to Au 4f spectrum of cleanAu(111) surface. . . . . . . . . . . . . . . . . . . . . . . . . . . . . 35

LIST OF FIGURES xii
3.7 O 1s XP spectra of the oxygen overlayers on Au(111) preparedand monitored at 140 K. The right panel shows the O 1s spectrumrecorded after heating of the 0.9 MLE oxygen layer to 300 K (thespectrum was acquired at 300 K). . . . . . . . . . . . . . . . . . . 36
3.8 TPD profiles of O/Au(111) overlayers before and after reactionwith CO. TPD profiles showing m/z=32 desorption channel foroxygen recorded after∼0.7 MLE of oxygen accumulation at (a) 460K, (b) 300 K and (c) 140 K (red spectra) and spectra monitoredafter subsequent 3.0 L of CO exposure (10−8 Torr × 5 min.) onthe analogous O/Au(111) overlayers at 140 K (blue spectra). . . . 38
3.9 TPD profiles (m/z=31) obtained after methanol adsorption onclean Au(111) surface at 90 K as a function of increasing methanolcoverage. Reprinted with permission from [110] Copyright (2017)Springer (order number: 4206641091824). . . . . . . . . . . . . . . 40
3.10 IRAS spectra of monolayer and multilayer of methanol on cleanAu(111) . . . . . . . . . . . . . . . . . . . . . . . . . . . . . . . . 41
3.11 TPRS profiles for the reaction of methanol with oxygen accumu-lated at (a) 460 K, (b) 140 K on Au(111). . . . . . . . . . . . . . 42
3.12 TPRS profile showing desorption channels of methyl formate (ox-idative coupling product) and formaldehyde (partial oxidationproduct) obtained after methanol exposure to oxygen pre-coveredAu(111). . . . . . . . . . . . . . . . . . . . . . . . . . . . . . . . . 43
3.13 TPRS profiles for the reaction of methanol with (a) 0.3 MLE (b)1.2 MLE of oxygen accumulated at 300 K on Au(111) . . . . . . . 44
3.14 Coverage-dependent TPD profiles for the m/z = 29 desorptionchannel obtained via acetaldehyde (CH3CHO(g)) adsorption onthe clean Au(111) model catalyst surface at 90 K. Inset empha-sizes the non-monotonic intensity of the chemisorbed acetaldehydedesorption feature at 139 K as a function of acetaldehyde coverage. 47
3.15 Coverage-dependent TPD profiles for the m/z=43 desorption chan-nel obtained via methyl acetate (CH3COOCH3(g)) adsorption onthe clean Au(111) model catalyst surface at 90 K. . . . . . . . . . 48
LIST OF FIGURES xiii
3.16 TPRS profiles for various desorption channels obtained after 2.9MLE of acetaldehyde accumulation at 90 K on 0.1 MLE of oxygenpre-covered Au(111) model catalyst surface at 140 K . . . . . . . 50
3.17 TPD profiles (m/z = 17) obtained after ammonia adsorption onclean Au(111) surface at 90 K as a function of increasing ammoniacoverage . . . . . . . . . . . . . . . . . . . . . . . . . . . . . . . . 52
3.18 TPRS profiles for the reaction of ammonia (0.6 MLE) at 83 K (a)and 190 K (b) on 0.3 MLE oxygen pre-covered gold surface at 190K. . . . . . . . . . . . . . . . . . . . . . . . . . . . . . . . . . . . 54
3.19 TPRS profiles for the reaction of ammonia (0.6 MLE) at 190 K on0.6 MLE oxygen pre-covered gold surface at 190 K. . . . . . . . . 55
4.1 A representative survey XP spectrum of the clean Ag(111) singlecrystal. . . . . . . . . . . . . . . . . . . . . . . . . . . . . . . . . . 57
4.2 (a) Ag 3d XP spectrum (b) LEED pattern of the clean Ag(111)single crystal. . . . . . . . . . . . . . . . . . . . . . . . . . . . . . 58
4.3 (a) TPD profiles for oxygen desorption (m/z = 32) obtained byincreasing ozone exposures on clean Ag(111) at 140 K. (b) Relativeoxygen surface coverages (obtained via integrated TPD desorptionsignals in part (a)) for surface and subsurface oxygen species onAg(111) as a function of ozone exposure. . . . . . . . . . . . . . . 60
4.4 LEED images of O/Ag(111) overlayers obtained by introducingdifferent ozone exposures at 140 K on clean Ag(111) surface fol-lowed by pumping and annealing to 473 K in UHV. (a) LEEDimage of the p(5x1)-O/Ag(111) overlayer (θO = 0.83 MLE) and(b) its simulated (theoretical) LEED pattern. (c) LEED imageof the c(4x8)-O/Ag(111) overlayer (θO = 1.10 MLE) and (d) itssimulated (theoretical) LEED pattern. . . . . . . . . . . . . . . . 62
4.5 O 1s XPS spectra of O/Ag(111) as a function of increasing oxygencoverage obtained by increasing exposures of ozone at 140 K. Inseton the right shows the integrated O 1s/Ag 3d signal ratio as afunction of oxygen coverage. Inset on the left shows the O 1s XPSspectra for O/Ag(111) with θO = 2.66 MLE dosed at 140 K (red)and dosed at 473 K (black). . . . . . . . . . . . . . . . . . . . . . 64
LIST OF FIGURES xiv
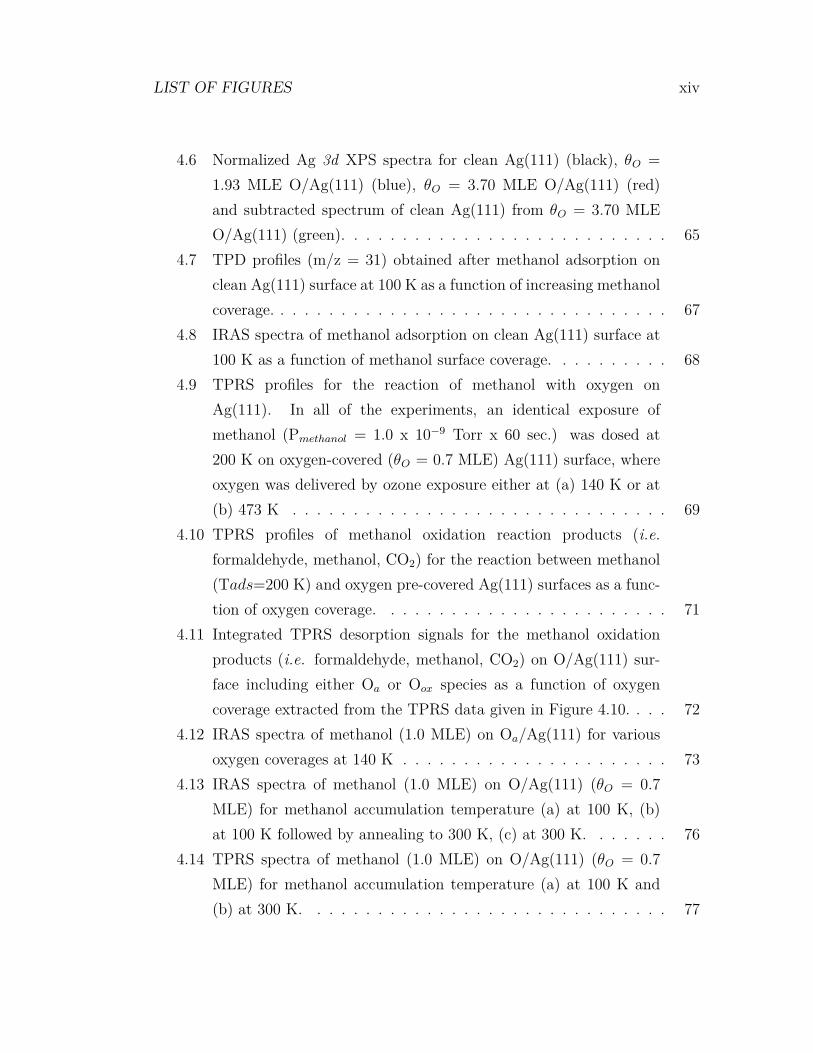
4.6 Normalized Ag 3d XPS spectra for clean Ag(111) (black), θO =1.93 MLE O/Ag(111) (blue), θO = 3.70 MLE O/Ag(111) (red)and subtracted spectrum of clean Ag(111) from θO = 3.70 MLEO/Ag(111) (green). . . . . . . . . . . . . . . . . . . . . . . . . . . 65
4.7 TPD profiles (m/z = 31) obtained after methanol adsorption onclean Ag(111) surface at 100 K as a function of increasing methanolcoverage. . . . . . . . . . . . . . . . . . . . . . . . . . . . . . . . . 67
4.8 IRAS spectra of methanol adsorption on clean Ag(111) surface at100 K as a function of methanol surface coverage. . . . . . . . . . 68
4.9 TPRS profiles for the reaction of methanol with oxygen onAg(111). In all of the experiments, an identical exposure ofmethanol (Pmethanol = 1.0 x 10⁻⁹ Torr x 60 sec.) was dosed at200 K on oxygen-covered (θO = 0.7 MLE) Ag(111) surface, whereoxygen was delivered by ozone exposure either at (a) 140 K or at(b) 473 K . . . . . . . . . . . . . . . . . . . . . . . . . . . . . . . 69
4.10 TPRS profiles of methanol oxidation reaction products (i.e.formaldehyde, methanol, CO2) for the reaction between methanol(Tads=200 K) and oxygen pre-covered Ag(111) surfaces as a func-tion of oxygen coverage. . . . . . . . . . . . . . . . . . . . . . . . 71
4.11 Integrated TPRS desorption signals for the methanol oxidationproducts (i.e. formaldehyde, methanol, CO2) on O/Ag(111) sur-face including either Oa or Oox species as a function of oxygencoverage extracted from the TPRS data given in Figure 4.10. . . . 72
4.12 IRAS spectra of methanol (1.0 MLE) on Oa/Ag(111) for variousoxygen coverages at 140 K . . . . . . . . . . . . . . . . . . . . . . 73
4.13 IRAS spectra of methanol (1.0 MLE) on O/Ag(111) (θO = 0.7MLE) for methanol accumulation temperature (a) at 100 K, (b)at 100 K followed by annealing to 300 K, (c) at 300 K. . . . . . . 76
4.14 TPRS spectra of methanol (1.0 MLE) on O/Ag(111) (θO = 0.7MLE) for methanol accumulation temperature (a) at 100 K and(b) at 300 K. . . . . . . . . . . . . . . . . . . . . . . . . . . . . . 77
LIST OF FIGURES xv
4.15 TPD profiles (m/z=17) obtained after ammonia adsorption onclean Ag(111) surface at 90 K as a function of increasing ammoniacoverage. . . . . . . . . . . . . . . . . . . . . . . . . . . . . . . . . 78
4.16 IRAS spectra of ammonia adsorption on clean Ag(111) surface at90 K as a function of ammonia surface coverage. . . . . . . . . . . 80
4.17 TPRS profiles for the reaction of ammonia with oxygen on Ag(111).In all of the experiments, an identical exposure of NH3 (PNH3 =2.0 x 10⁻⁹ Torr x 60 s) was dosed at 250 K on oxygen-covered(θO = 0.21 MLE) Ag(111) surface, where oxygen was delivered byozone exposure either at 140 K (multi-colored spectra) or at 473K (grey-colored spectra). . . . . . . . . . . . . . . . . . . . . . . . 82
4.18 TPRS profiles of various ammonia SCO reaction products (i.e.N2, NO, N2O) for the reaction between ammonia and oxygen pre-covered Ag(111) surfaces as a function of oxygen coverage. For allof the data, oxygen was delivered on Ag(111) by ozone exposureat 140 K, while NH3 was delivered using an identical ammoniaexposure at 250 K (PNH3 = 2.0 x 10¹⁰−9 Torr x 60 s) . . . . . . . 84
4.19 Integrated TPD desorption signals for the main ammonia SCOproducts (i.e. N2, NO, N2O) on O/Ag(111) surface as a functionof oxygen coverage extracted from the TPRS data given in Figure4.18. . . . . . . . . . . . . . . . . . . . . . . . . . . . . . . . . . . 85
5.1 Reactivity and selectivity trends of methanol oxidation reaction onO/Au(111) as a function of oxygen coverage and temperature. . . 88
5.2 Reactivity and selectivity trends of ammonia SCO on O/Ag(111)as a function of oxygen coverage and temperature. . . . . . . . . . 90
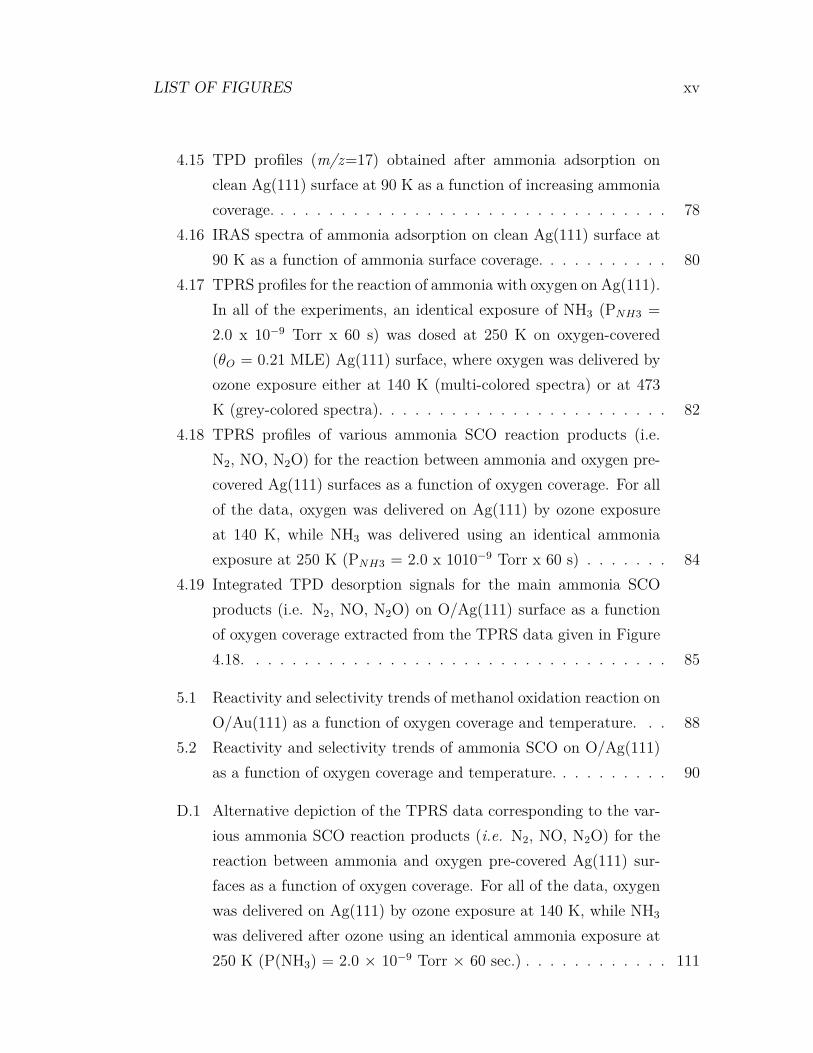
D.1 Alternative depiction of the TPRS data corresponding to the var-ious ammonia SCO reaction products (i.e. N2, NO, N2O) for thereaction between ammonia and oxygen pre-covered Ag(111) sur-faces as a function of oxygen coverage. For all of the data, oxygenwas delivered on Ag(111) by ozone exposure at 140 K, while NH3
was delivered after ozone using an identical ammonia exposure at250 K (P(NH3) = 2.0 × 10⁻⁹ Torr × 60 sec.) . . . . . . . . . . . . 111

LIST OF FIGURES xvi
E.1 TPRS profiles for NH3 (m/z = 17) and H2O (m/z = 18) desorptionchannels obtained during the reaction between ammonia and oxy-gen pre-covered Ag(111) surfaces as a function of oxygen coverageas shown in Figure 4.18 of the main text. . . . . . . . . . . . . . . 112
List of Tables
4.1 Vibrational frequency assignments for the NH3/Ag(111) IRASdata presented in Figure 4.16 . . . . . . . . . . . . . . . . . . . . 81
xvii
Chapter 1
Introduction
1.1 Motivation of the Study
Catalytic processes contribute to the production of most of the materials andchemicals that we use in our daily life e.g. food, fabric, construction material,oil, pharmaceutical industries. Furthermore, most of the processes, especially inchemical industry, rely on heterogeneous catalytic reactions [1, 2]. Despite thelimited surface area of solid catalysts compared to homogeneous catalysis, ease ofseparation and wide range of operation conditions make heterogeneous catalysisan industrially advantageous approach. Metal-catalyzed heterogeneous oxidationreactions are particularly crucial for the large scale production of commonly usedcommodity chemicals [3]. For example, formaldehyde is produced in industrialscale from methanol partial oxidation on solid silver catalysts [4]. Synthesis ofcarbonyl derivatives from alcohols constitutes an important portion of organicchemical product synthesis [5]. Several carbonyl derivatives such as aldehydes,ketones, carboxylic acids and esters can be synthesized from the correspondingalcohols by conventional organic synthesis methods [6]. However, these methodshave strong environmental drawbacks due to the use of heavy-metal salts asoxidizing agents, generation of undesired byproducts and the utilization of toxicsolvents [5, 7, 8]. Thus, heterogeneous catalysis enables large scale chemical
1

production via green chemistry methods.
Selectivity is the main concern in the catalytic oxidation reactions. For exam-ple, in the formaldehyde production process from methanol on silver catalysts,formic acid and carbon dioxide are also produced as byproducts [4]. It was shownthat the same reaction leads to methyl formate formation on gold catalyst as aresult of a coupling reaction pathway [9]. Various metals were shown to be activein ammonia oxidation reaction for the purpose of ammonia abatement. Depend-ing on the reaction conditions, the formation of the toxic byproducts such as NO,NO2, N2O were reported in addition to the main product, N2 [10]. Controllingthe selectivity in such reactions in order to increase the product yield and tominimize the production of undesired byproducts requires a molecular level un-derstanding of the bond activation mechanisms. Thus, understanding the natureof oxygen in the O-H, C-H, C-C and N-H bond cleavage processes for oxidationreactions is critical in terms of the selectivity of the catalyst.
Catalytic activity of metal nanoparticles varies with the nanoparticle size andshape as well as with the nature of the support material. However, understandingthe structure-catalytic functionality relationships are quite challenging. In orderto obtain fundamental insights regarding the detailed catalytic mechanisms ofthe catalysts, atomically well-defined planar model catalysts can be used a ver-satile platform where surface structure and reaction parameters can be readilycontrolled. However, such well-defined model catalysts can not survive under at-mospheric conditions due to the adsorption of atoms and molecules in the air. Inorder to maintain the catalyst surface clean for a long time and to perform atomicscale experiments, ultra high vacuum (UHV) is needed. Thus, well-defined modelcatalysts such as Au(111) and Ag(111) single crystals under UHV conditions areideal environments to examine the nature of oxygen for oxidation reactions.
There are three common crystal structures for stacking bulk metal atoms,namely face-centered cubic (fcc), body centered cubic (bcc) and hexagonal closepacked (hcp). While the alkali metals and a few transitions metals crystallize inbcc, most of the metals prefer stacking in either fcc or hcp system [11]. Surfacestructure of the metals varies depending on their bulk crystal arrangement. Most
2
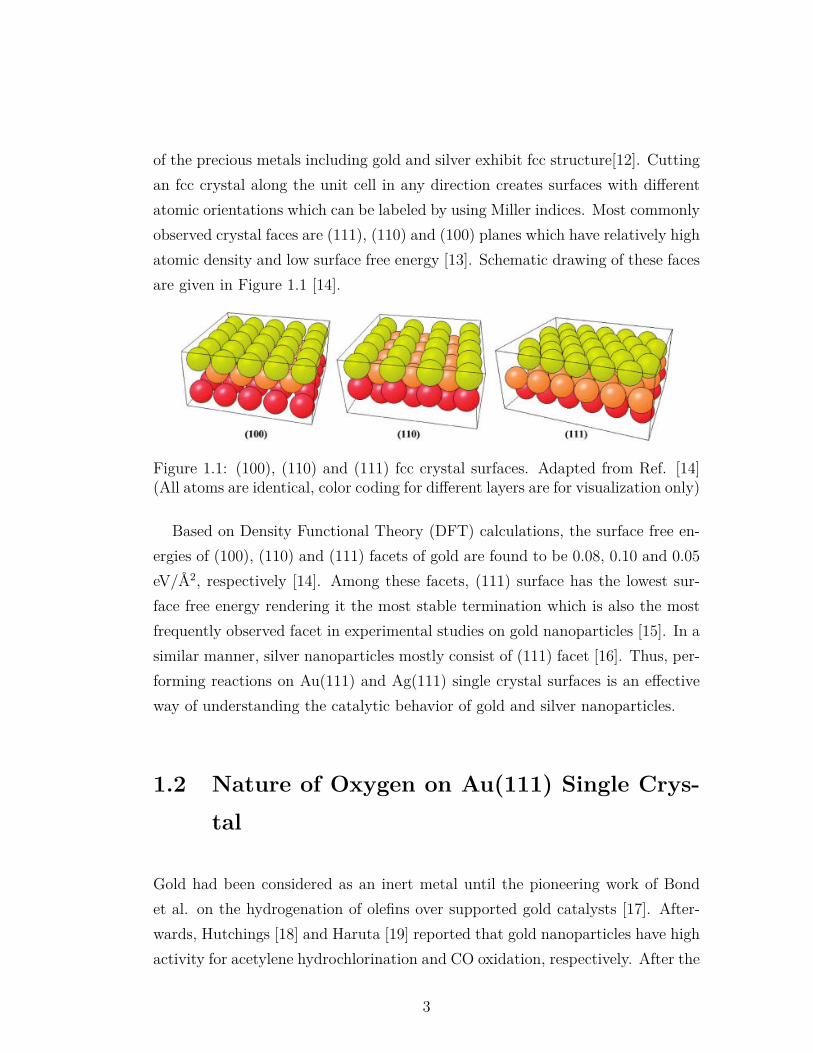
of the precious metals including gold and silver exhibit fcc structure[12]. Cuttingan fcc crystal along the unit cell in any direction creates surfaces with differentatomic orientations which can be labeled by using Miller indices. Most commonlyobserved crystal faces are (111), (110) and (100) planes which have relatively highatomic density and low surface free energy [13]. Schematic drawing of these facesare given in Figure 1.1 [14].
Figure 1.1: (100), (110) and (111) fcc crystal surfaces. Adapted from Ref. [14](All atoms are identical, color coding for different layers are for visualization only)
Based on Density Functional Theory (DFT) calculations, the surface free en-ergies of (100), (110) and (111) facets of gold are found to be 0.08, 0.10 and 0.05eV/A2, respectively [14]. Among these facets, (111) surface has the lowest sur-face free energy rendering it the most stable termination which is also the mostfrequently observed facet in experimental studies on gold nanoparticles [15]. In asimilar manner, silver nanoparticles mostly consist of (111) facet [16]. Thus, per-forming reactions on Au(111) and Ag(111) single crystal surfaces is an effectiveway of understanding the catalytic behavior of gold and silver nanoparticles.
1.2 Nature of Oxygen on Au(111) Single Crys-tal
Gold had been considered as an inert metal until the pioneering work of Bondet al. on the hydrogenation of olefins over supported gold catalysts [17]. After-wards, Hutchings [18] and Haruta [19] reported that gold nanoparticles have highactivity for acetylene hydrochlorination and CO oxidation, respectively. After the
3
discovery of catalytically active gold, numerous reports were published in variousheterogeneous catalytic applications such as water-gas shift reaction, CO oxida-tion, hydrocarbon oxidation, NO reduction, alkene epoxidation, selective alcoholand aldehyde oxidation reactions [20, 21]. Bonding of partial oxidation reactionintermediates/byproducts on gold surfaces are relatively weak compared to othercatalytically active metals favoring catalytic selectivity on gold [22]. Highly se-lective catalytic character of gold makes it unique and this property allows theproduction of carbonyl derivatives by selective oxidation reactions.
In order to understand the nature of oxygen on Au(111) single crystal sur-faces, numerous studies were performed and different oxygen species were men-tioned in the literature. Min et al. reported three different oxygen species suchas chemisorbed oxygen, surface oxide and bulk oxide on Au(111) single crystaldepending on the adsorption temperature and quantity of oxygen [23]. In thisstudy, the most active species for CO oxidation was reported as the chemisorbedoxygen which was formed at 200 K. In another study, Baker et al. utilized HighResolution Electron Energy Loss (HREEL) spectroscopy to investigate the oxy-gen overlayers on the Au(111) surface and reported two oxygen features [24]. Inagreement with theoretical calculations, the first feature which is dominant at lowcoverages was attributed to chemisorbed oxygen atoms in 3-fold sites; while thesecond feature which prominent at near saturation coverages was associated withsurface oxide. Besides, the transformation of the active oxygen species to theinactive ones was reported by Ojifinni et al. [25]. In this study, oxygen speciesformed at 77 K was shown to be active towards CO oxidation and pre-annealingof O/Au(111) overlayers to a certain temperature was shown to increase the quan-tity of inactive oxygen species. It was suggested that at higher temperatures theadsorbed atomic oxygen species transform from the metastable state (which isresponsible for greater reactivity) to a more stable (i.e. less reactive) state.
Another debate about the oxygen species on gold catalysts is the formation ofgold oxide. Former studies showed that gold oxide on the bulk metallic gold canbe formed at stronger oxidizing conditions depending on the method of oxygenlayer preparation [26, 27, 28]. However gold oxide shows low stability and starts todecompose at room temperature [27]. Although it was mentioned in the literature
4
many times that bulk gold oxide is formed after ambient ozone treatment atelevated temperatures, the conclusive experimental evidences were not presented[14, 24, 23, 29]. In another study, Klyushin et al. demonstrated with in-situXPS that gold oxide on the gold foil was stable only in the presence of ozone (0.3mbar) and decomposed under vacuum at 373 K or even in the presence of ozoneat temperatures higher than 523 K [28]. In the same work, estimated thicknessof the oxide phase was 0.4±0.1 nm which coincides with the smallest axis of theAu2O3 unit cell, pointing to the formation of surface gold oxide.
Surface morphology of the Au(111) single crystal was also investigated afterthe formation of oxygen overlayers and it was demonstrated that gold surfacemorphology changed drastically after atomic oxygen adsorption. According to aScanning Tunneling Microscopy (STM) data, adsorption of oxygen on the cleanAu(111) surface initiates reconstruction of the characteristic herringbone struc-ture to a stripped one [30] and leads to corrugation of the surface [23]. Corru-gation manifests itself as release of the gold atoms from the surface yielding aroughened surface. The degree of corrugation depends on oxygen coverage andpreparation temperature; the corrugation is stronger at high coverages and hightemperatures. DFT studies in the literature agree with the experimental resultssuggesting the formation of corrugated gold surface and conclude that the cost ofadatom creation can easily be compensated at high oxygen coverages [31, 32]. Itis interesting that the morphology of the corrugated surface remains unchangedafter removal of the surface oxygen by reaction with CO [33].
1.3 Nature of Oxygen on Ag(111) Single Crys-tal
O/Ag(111) system is an important catalytic system which has been thoroughlyinvestigated within the context of different catalytic reactions in the last fewdecades both experimentally [34, 35, 36, 37, 38, 39, 40, 41, 42, 43, 44] and/or
5
theoretically [45, 46, 47, 48, 49, 50]. Campbell reported that atomic oxygen pop-ulated at 490 K by high pressure (5 Torr) O2 dosage on Ag(111) is active for COoxidation [38]. Ertl and co-workers reported two distinct surface oxygen atoms onAg(111) and claimed that only one type of surface oxygen which was stable up to900 K took part in the methanol partial oxidation reaction to formaldehyde [51].They also reported that dissolved oxygen species was inactive in this reaction. Inanother study, Bukhtiyarov and co-workers revealed two types of oxygen specieson a silver foil which were claimed to be ionic and covalent oxygen [52]. Theyfound that the covalent oxygen takes part in ethylene epoxidation reaction whileionic oxygen yields only CO2. In their following work, they found that covalentoxygen is active for an electrophilic addition to the C=C bond of ethylene whilethe ionic oxygen is active in a nucleophilic attack to C-H bond [42]. Thus, theynamed these oxygen species as electrophilic and nucleophilic oxygen. .
Oxygen containing Ag(111) surfaces are known to undergo surface reconstruc-tion readily. The most commonly observed reconstruction of this system is thep(4x4) structure which was first observed by Rovida et al. [34]. The atomic struc-ture of the p(4x4) reconstruction was revised in 2000 [53] and even a more recentmodel was proposed by Schnadt et al. in 2006 [49]. In addition, other recon-structions of the O/Ag(111) system were also observed such as (
√3×√
3)R30◦
[54], c(3×5√
3)rect [49], (7×7) [44], c(4×8) [50] and p(4×5√
3)rect structures[50]. Reconstruction process of Ag(111) surface was reviewed by Michaelides etal. [55].
Yet, recent studies indicate that O/Ag(111) structure proves to be an elu-sive system to understand in a comprehensive manner at the atomic scale[56, 57, 58, 59, 60, 61, 62]. Rocha et al. revealed five different atomic oxygenspecies by ambient pressure XPS on silver single crystals, polycrystalline silverand powders depending on the oxygen accumulation temperature and quantity[63]. Atomic oxygen species reported in that particular study have different elec-tronic structures and their role in oxidation reactions on silver catalysts are stillquestionable. In another study in 2016, Derouin et al. showed that sub-surfaceoxygen formation on Ag(111) single crystal strongly depended on the reactionconditions and such species existed during the industrial conditions of ethylene
6

epoxidation reaction [58]. Thus, sub-surface oxygen might also have a criticalrole in various oxidation reactions on silver catalysts.
7
Chapter 2
Experimental
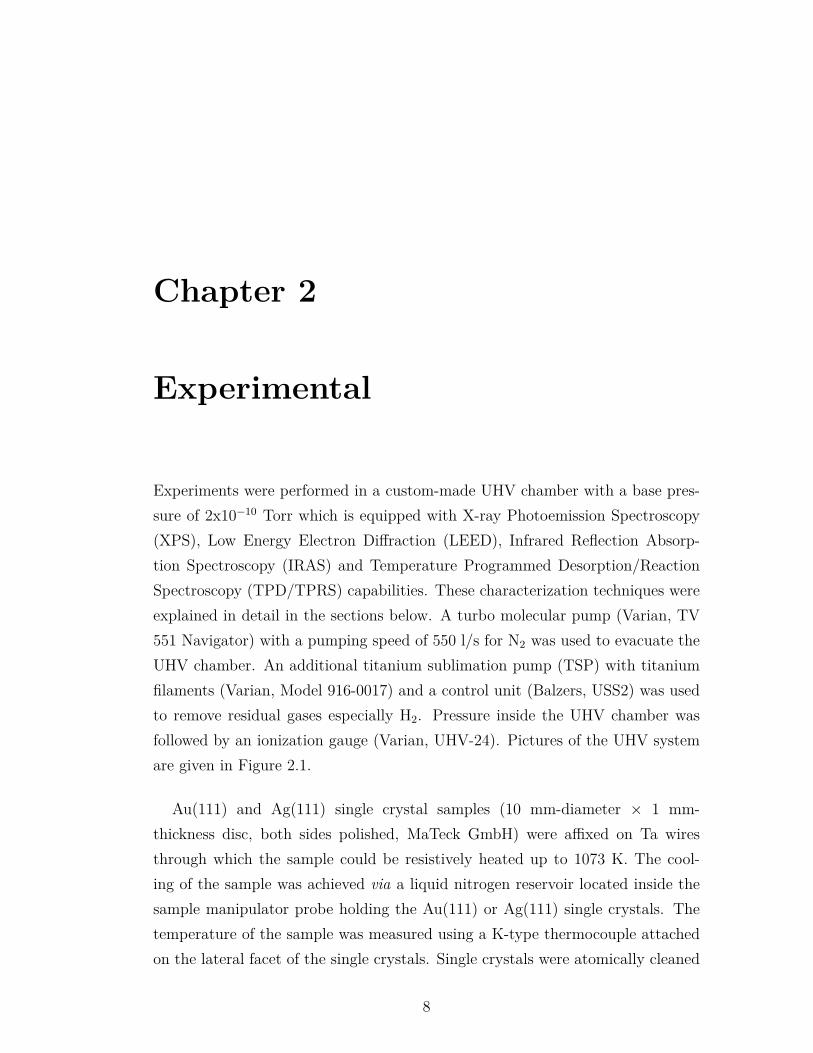
Experiments were performed in a custom-made UHV chamber with a base pres-sure of 2x10⁻¹⁰ Torr which is equipped with X-ray Photoemission Spectroscopy(XPS), Low Energy Electron Diffraction (LEED), Infrared Reflection Absorp-tion Spectroscopy (IRAS) and Temperature Programmed Desorption/ReactionSpectroscopy (TPD/TPRS) capabilities. These characterization techniques wereexplained in detail in the sections below. A turbo molecular pump (Varian, TV551 Navigator) with a pumping speed of 550 l/s for N2 was used to evacuate theUHV chamber. An additional titanium sublimation pump (TSP) with titaniumfilaments (Varian, Model 916-0017) and a control unit (Balzers, USS2) was usedto remove residual gases especially H2. Pressure inside the UHV chamber wasfollowed by an ionization gauge (Varian, UHV-24). Pictures of the UHV systemare given in Figure 2.1.
Au(111) and Ag(111) single crystal samples (10 mm-diameter × 1 mm-thickness disc, both sides polished, MaTeck GmbH) were affixed on Ta wiresthrough which the sample could be resistively heated up to 1073 K. The cool-ing of the sample was achieved via a liquid nitrogen reservoir located inside thesample manipulator probe holding the Au(111) or Ag(111) single crystals. Thetemperature of the sample was measured using a K-type thermocouple attachedon the lateral facet of the single crystals. Single crystals were atomically cleaned
8
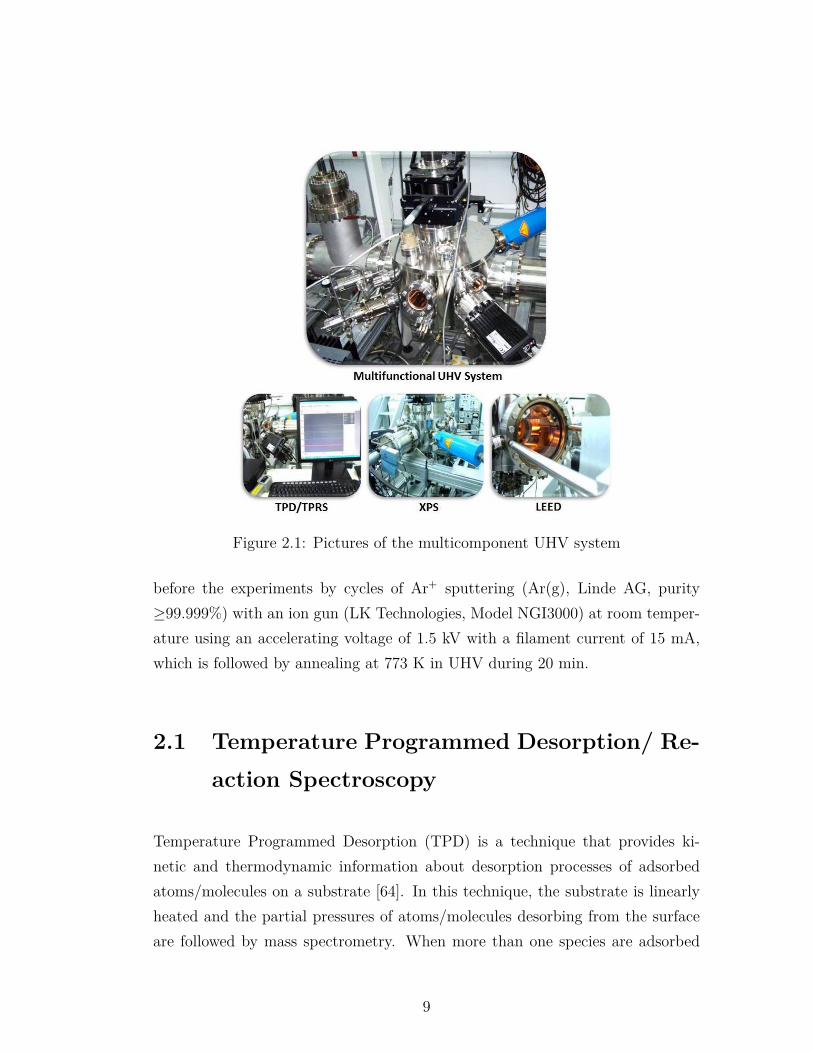
Figure 2.1: Pictures of the multicomponent UHV system
before the experiments by cycles of Ar+ sputtering (Ar(g), Linde AG, purity≥99.999%) with an ion gun (LK Technologies, Model NGI3000) at room temper-ature using an accelerating voltage of 1.5 kV with a filament current of 15 mA,which is followed by annealing at 773 K in UHV during 20 min.
2.1 Temperature Programmed Desorption/ Re-action Spectroscopy
Temperature Programmed Desorption (TPD) is a technique that provides ki-netic and thermodynamic information about desorption processes of adsorbedatoms/molecules on a substrate [64]. In this technique, the substrate is linearlyheated and the partial pressures of atoms/molecules desorbing from the surfaceare followed by mass spectrometry. When more than one species are adsorbed
9
on a substrate, this technique is called Temperature Programmed Reaction Spec-troscopy (TPRS). The schematic setup for TPD experiments under UHV condi-tions were given in Figure 2.2. In the current work, PID-controlled linear sampleheater (Heatwave, Model 101303) and a quadrupole mass spectrometer (QMS)(Ametek Dycor Dymaxion DM200) were used for the TPD/TPRS experiments.All of the TPD/TPRS experiments were performed with a heating rate of 1 K/s,70 eV QMS beam energy and 30 ms dwell time for each desorption channel.
Figure 2.2: Schematic setup for TPD experiments under UHV conditions.Adapted from Ref. [65]
In TPD/TPRS experiments, shape of the partial pressure curve as a functionof temperature contains information about desorption kinetics because the QMSsignal is proportional to the rate of desorption if the pumping speed is largeenough [66]. Equation 2.1 is the Polanyi-Wigner equation which indicates therelationship between desorption rate, desorption energy, desorption order andtemperature [65].
r = −dθdt
= kdesθn = ν(θ)θnexp
(−Edes(θ)
RT
)(2.1)
T = To + βt (2.2)
10

where r is the rate of desorption; θ is the adsorbate coverage in monolayers; tis the time; kdes is the reaction rate constant for desorption; n is the order ofdesorption; ν is the pre-exponential factor of desorption; Edes is the activationenergy of desorption; R is the gas constant; T is the temperature; To is thetemperature at which the experiment starts; β is the heating rate (i.e. dT/dt).
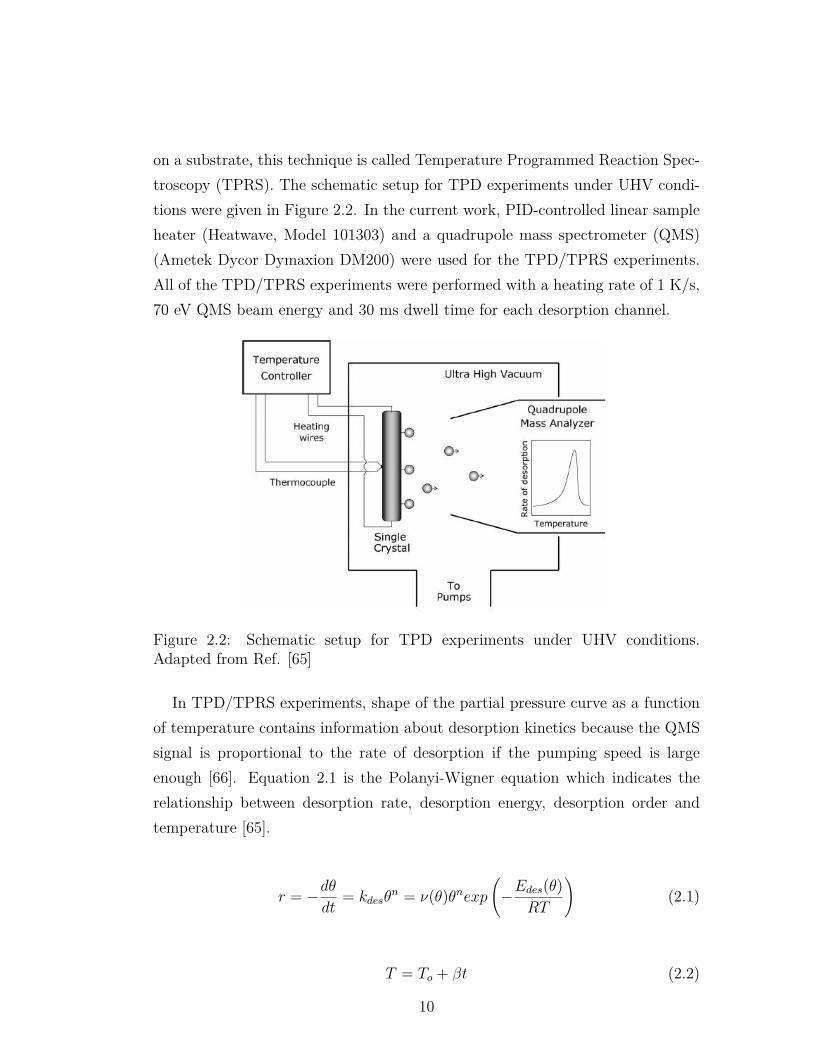
At very low temperatures, Edes>RT and no desorption occurs. Edes/RT ratiodecreases with increasing temperature and desorption is observed in a certaintemperature range. The desorption temperature of the atoms/molecules and thepeak shape are affected by the desorption order. Representative TPD spectrafor zeroth, first and second order desorption kinetics are given in Figure 2.3.Zeroth order desorption kinetics (n=0 in the Polanyi-Wigner equation) indicatesthat the desorption rate does not depend on coverage and increases exponentiallywith increasing temperature. As can be seen in Figure 2.3a, all signals withvarious coverages have a common leading edge with a rapid drop after desorptiontemperature maxima. In addition, peak positions shift to higher temperaturewith increasing coverage. Zeroth-order desorption is mostly observed in multilayersystems where the reservoir of the evolving molecules are practically infinite (i.e.in large excess).
First-order desorption kinetics (n=1) implies that the desorption rate is pro-portional to the coverage. TPD spectra exhibiting first-order desorption kineticsare given in Figure 2.3b. In this figure, the desorption maximum is constantat any coverage and all desorption signals have a characteristic asymmetric peakshape. First-order desorption behavior is common for atomic and non-dissociativeadsorption/desorption of molecules in a reversible manner. In addition, for adsor-bate overlayers following layer-by-layer growth mode, non-dissociative desorptionintensities for sub-monolayer coverages converge to a saturation intensity wherethe surface of the substrate is fully covered with the adsorbate. This saturationpoint can be used to quantitatively determine the relative coverages of the otherdesorption curves [67]. In the second-order desorption kinetics, the desorptionrate is proportional to θ2 and as can be seen in Figure 2.3c, peak maximumshifts to lower temperatures as a function of adsorbate coverage. Recombinativedesorption of atoms/molecules upon dissociative adsorption typically exhibits
11
second-order desorption kinetics [64].
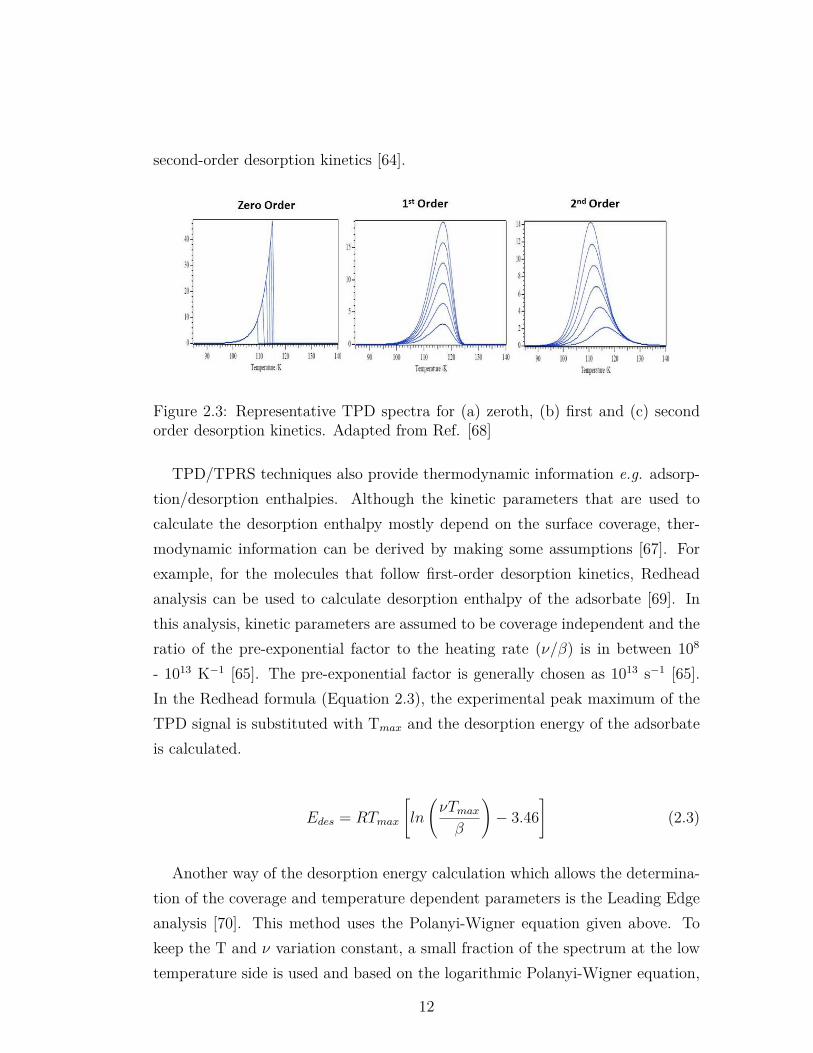
Figure 2.3: Representative TPD spectra for (a) zeroth, (b) first and (c) secondorder desorption kinetics. Adapted from Ref. [68]
TPD/TPRS techniques also provide thermodynamic information e.g. adsorp-tion/desorption enthalpies. Although the kinetic parameters that are used tocalculate the desorption enthalpy mostly depend on the surface coverage, ther-modynamic information can be derived by making some assumptions [67]. Forexample, for the molecules that follow first-order desorption kinetics, Redheadanalysis can be used to calculate desorption enthalpy of the adsorbate [69]. Inthis analysis, kinetic parameters are assumed to be coverage independent and theratio of the pre-exponential factor to the heating rate (ν/β) is in between 108
- 1013 K−1 [65]. The pre-exponential factor is generally chosen as 1013 s−1 [65].In the Redhead formula (Equation 2.3), the experimental peak maximum of theTPD signal is substituted with Tmax and the desorption energy of the adsorbateis calculated.
Edes = RTmax
[ln
(νTmax
β
)− 3.46
](2.3)
Another way of the desorption energy calculation which allows the determina-tion of the coverage and temperature dependent parameters is the Leading Edgeanalysis [70]. This method uses the Polanyi-Wigner equation given above. Tokeep the T and ν variation constant, a small fraction of the spectrum at the lowtemperature side is used and based on the logarithmic Polanyi-Wigner equation,
12

ln r is plotted vs. 1/T. After that, Edes can be determined from the slope thisArrhenius plot. This method uses the minimum number of assumptions however,the quality (i.e. signal to noise, S/N) of the spectrum must be extremely goodto have accurate analysis [65].
2.2 X-ray Photoemission Spectroscopy
X-ray Photoelectron Spectroscopy (XPS) is a surface sensitive technique that isbased on the photoelectric effect [65]. In this technique, electrons at differentenergy levels in solids are ejected via irradiation by x-rays and these electronsprovide information on the atomic composition of the analyte and the oxidationstates of the elements [71]. A diagram of the photoemission process is given inFigure 2.4a. In this process, photon with a known energy (hν) is absorbed byan electron in the core level of atom with a certain binding energy (Eb). Thiselectron is ejected through the vacuum level with a certain kinetic energy (Ekin).The kinetic energy is measured by an electron analyzer and the binding energyof the electron can be calculated by using the Equation 2.4. In this equation, φis the work function of the spectrometer.
Eb = hν − Ekin − φ (2.4)
Electrons have a certain traveling depth in a solid matrix depending on theirkinetic energy. The average traveling distance of an electron between two inelasticcollisions for a certain Ekin is called Inelastic Mean Free Path (IMFP) [71]. SinceIMFP is less then 1-2 nm between the kinetic energy range of 10-1000 eV for avariety of metals, XPS is a surface sensitive method [71]. IMFP values of atomicsolids plotted against Ekin of the electrons - which is also called the ”universalcurve” - is given in Figure 2.4b. As can be seen in this plot, the escape depthis the lowest at the kinetic energy of ca. 50-100 eV indicating electron detectionfrom the outermost layer. It is agreed as a general rule that 95% of the detectedelectrons are coming from the thickness that three times the IMFP [71].
13
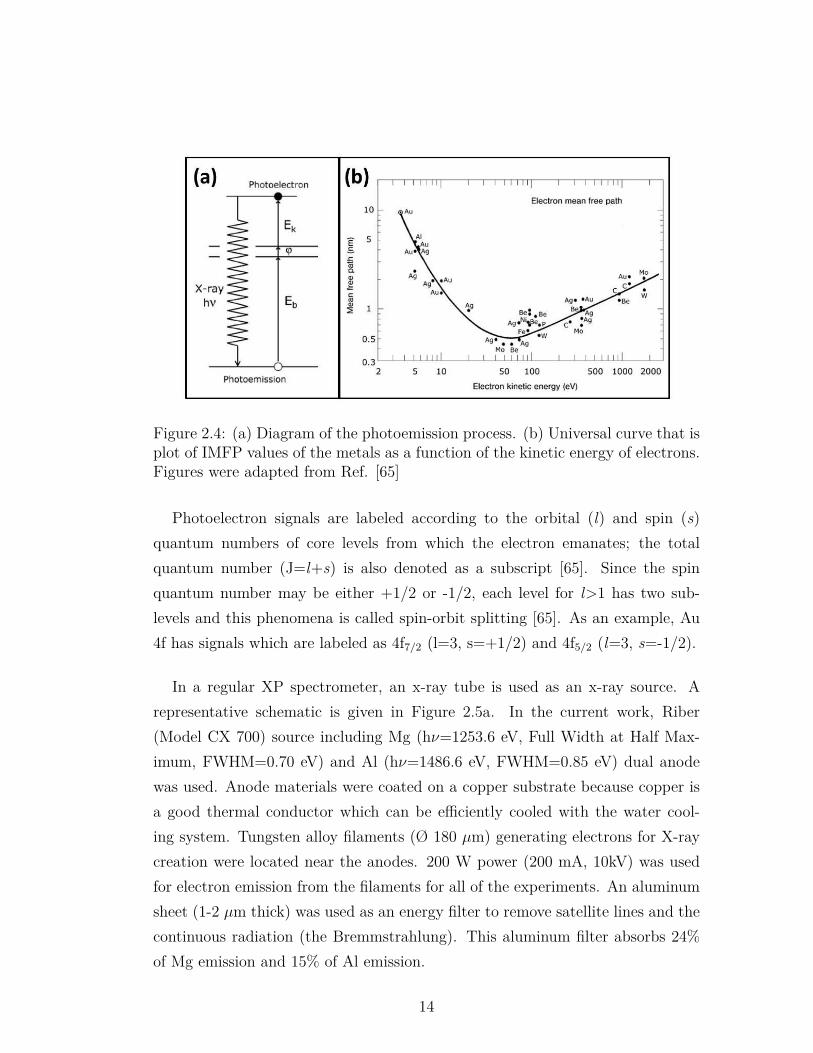
Figure 2.4: (a) Diagram of the photoemission process. (b) Universal curve that isplot of IMFP values of the metals as a function of the kinetic energy of electrons.Figures were adapted from Ref. [65]
Photoelectron signals are labeled according to the orbital (l) and spin (s)quantum numbers of core levels from which the electron emanates; the totalquantum number (J=l+s) is also denoted as a subscript [65]. Since the spinquantum number may be either +1/2 or -1/2, each level for l>1 has two sub-levels and this phenomena is called spin-orbit splitting [65]. As an example, Au4f has signals which are labeled as 4f7/2 (l=3, s=+1/2) and 4f5/2 (l=3, s=-1/2).
In a regular XP spectrometer, an x-ray tube is used as an x-ray source. Arepresentative schematic is given in Figure 2.5a. In the current work, Riber(Model CX 700) source including Mg (hν=1253.6 eV, Full Width at Half Max-imum, FWHM=0.70 eV) and Al (hν=1486.6 eV, FWHM=0.85 eV) dual anodewas used. Anode materials were coated on a copper substrate because copper isa good thermal conductor which can be efficiently cooled with the water cool-ing system. Tungsten alloy filaments (Ø 180 µm) generating electrons for X-raycreation were located near the anodes. 200 W power (200 mA, 10kV) was usedfor electron emission from the filaments for all of the experiments. An aluminumsheet (1-2 µm thick) was used as an energy filter to remove satellite lines and thecontinuous radiation (the Bremmstrahlung). This aluminum filter absorbs 24%of Mg emission and 15% of Al emission.
14
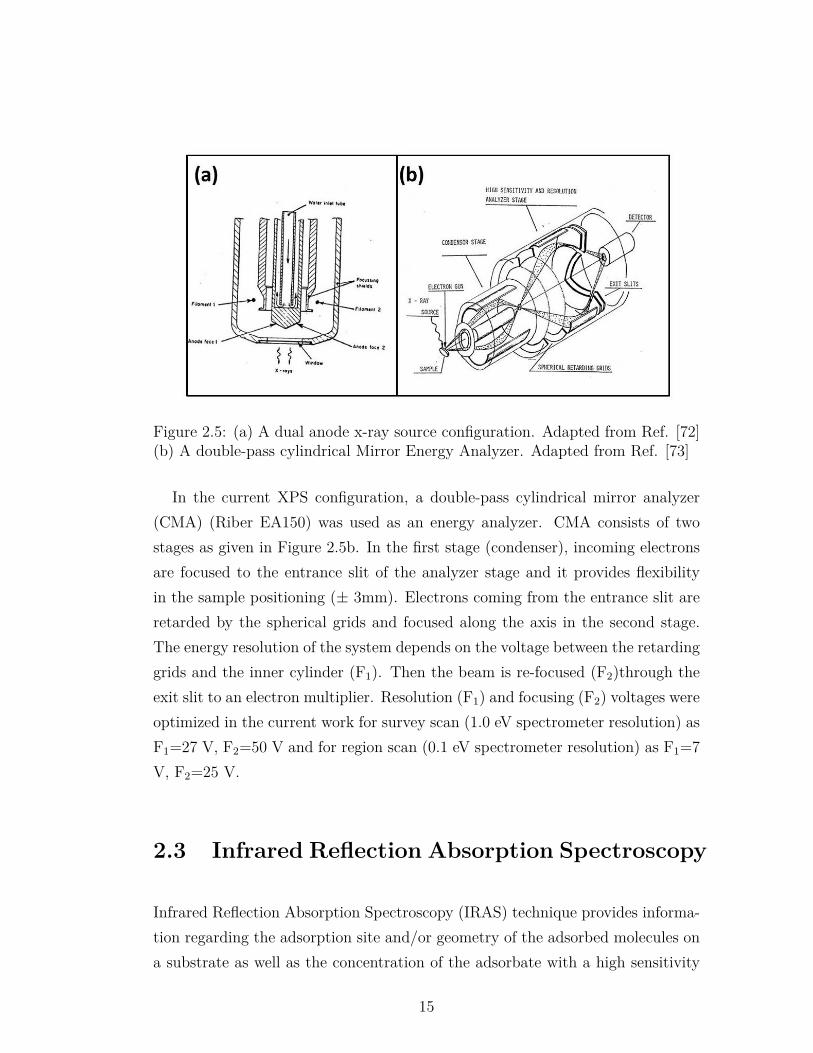
Figure 2.5: (a) A dual anode x-ray source configuration. Adapted from Ref. [72](b) A double-pass cylindrical Mirror Energy Analyzer. Adapted from Ref. [73]
In the current XPS configuration, a double-pass cylindrical mirror analyzer(CMA) (Riber EA150) was used as an energy analyzer. CMA consists of twostages as given in Figure 2.5b. In the first stage (condenser), incoming electronsare focused to the entrance slit of the analyzer stage and it provides flexibilityin the sample positioning (± 3mm). Electrons coming from the entrance slit areretarded by the spherical grids and focused along the axis in the second stage.The energy resolution of the system depends on the voltage between the retardinggrids and the inner cylinder (F1). Then the beam is re-focused (F2)through theexit slit to an electron multiplier. Resolution (F1) and focusing (F2) voltages wereoptimized in the current work for survey scan (1.0 eV spectrometer resolution) asF1=27 V, F2=50 V and for region scan (0.1 eV spectrometer resolution) as F1=7V, F2=25 V.
2.3 Infrared Reflection Absorption Spectroscopy
Infrared Reflection Absorption Spectroscopy (IRAS) technique provides informa-tion regarding the adsorption site and/or geometry of the adsorbed molecules ona substrate as well as the concentration of the adsorbate with a high sensitivity
15
(1/1000 of a CO monolayer) [74].In addition, the high spectral resolution of IRAS(1-5 cm−1) enables detection of the adsorbates which have similar vibrational fre-quencies in contrast to other vibrational techniques such as Electron Energy LossSpectroscopy (EELS, typical resolution > 30 cm−1) [74]. Besides, its broad work-ing pressure range from UHV to atmosphere and its compatibility with a varietyof surfaces make IRAS a widely used technique [74].
In this method, a collimated IR beam is reflected from the surface to be ana-lyzed and collected by a detector. Electric field of incident infrared light has twocomponents namely s-polarized and p-polarized lights which are perpendicularand parallel to the plane of incidence, respectively. These components interactwith the metal electrons and a phase shift occurs on the metal surface depend-ing on the angle of incidence (φ). Phase shifts of both components of light asa function of the angle of incidence are given in Figure 2.6a. As can be seenin this figure, s-component of the incident light shifts 180◦ for all angles thatresults destructive interference. Lack of the parallel component of electric fieldreveals a selection rule for conducting (e.g. metallic) surfaces that only the vi-brational modes perpendicular to the surface can interact with the electric field.A schematic explanation of this phenomena is given in Figure 2.6b.
In contrast to the s-component, phase shift of the p-polarized light changesdrastically with angle of incidence and the shift remains less than 90◦ between0<φ<85. As an example, surface electric field of copper metal at a frequency of2000 cm−1 as a function of φ is given in Figure 2.6c (dashed line). In addition, theintensity of absorption is proportional to the square of the surface electric field[74]. This function reaches a maximum at close to grazing incidence in Figure2.6c (solid line). In order to increase the IRAS signal intensity, IRAS experimentsare performed close to grazing angle of incidence.
In the current work, IRAS setup including source and detector compart-ments and an additional UHV chamber was designed and manufactured. Scaled-drawings of the IRAS chamber with all dimensions and a picture of the man-ufactured chamber are given in Figure 2.7. ConFlat (CF, Outer Diameter=8in) flanges were attached to connect IRAS chamber to the main UHV chamber
16
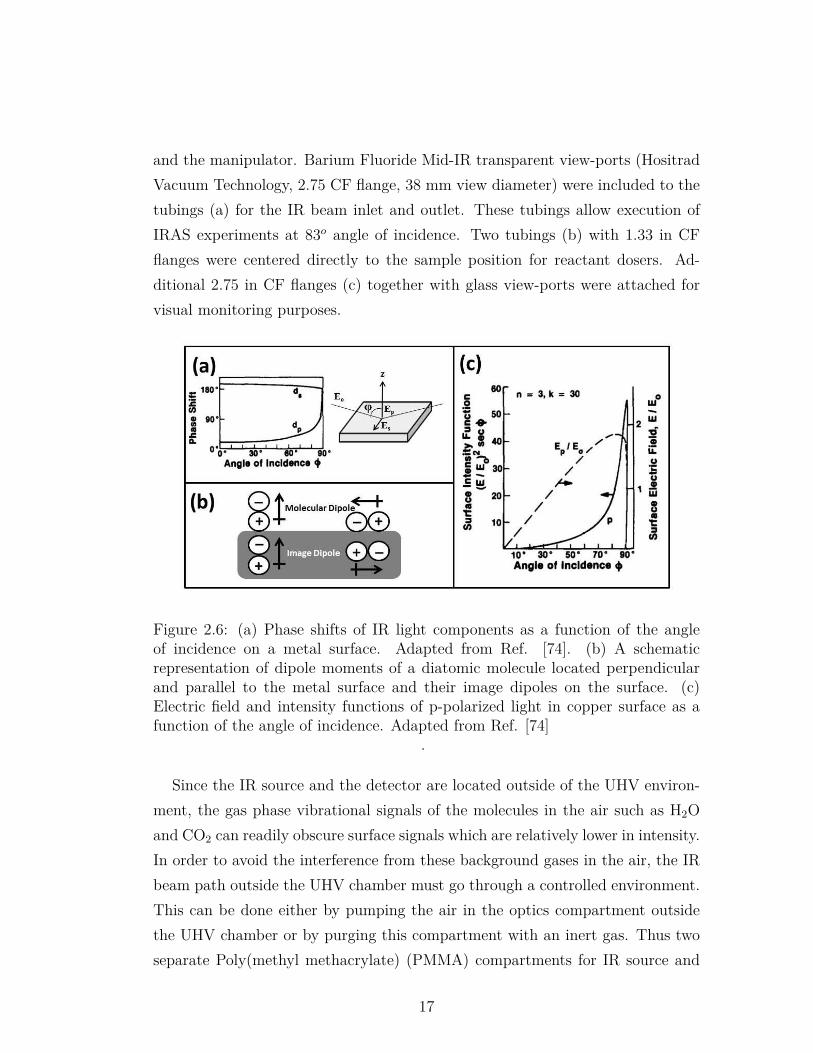
and the manipulator. Barium Fluoride Mid-IR transparent view-ports (HositradVacuum Technology, 2.75 CF flange, 38 mm view diameter) were included to thetubings (a) for the IR beam inlet and outlet. These tubings allow execution ofIRAS experiments at 83o angle of incidence. Two tubings (b) with 1.33 in CFflanges were centered directly to the sample position for reactant dosers. Ad-ditional 2.75 in CF flanges (c) together with glass view-ports were attached forvisual monitoring purposes.
Figure 2.6: (a) Phase shifts of IR light components as a function of the angleof incidence on a metal surface. Adapted from Ref. [74]. (b) A schematicrepresentation of dipole moments of a diatomic molecule located perpendicularand parallel to the metal surface and their image dipoles on the surface. (c)Electric field and intensity functions of p-polarized light in copper surface as afunction of the angle of incidence. Adapted from Ref. [74]
.
Since the IR source and the detector are located outside of the UHV environ-ment, the gas phase vibrational signals of the molecules in the air such as H2Oand CO2 can readily obscure surface signals which are relatively lower in intensity.In order to avoid the interference from these background gases in the air, the IRbeam path outside the UHV chamber must go through a controlled environment.This can be done either by pumping the air in the optics compartment outsidethe UHV chamber or by purging this compartment with an inert gas. Thus twoseparate Poly(methyl methacrylate) (PMMA) compartments for IR source and
17
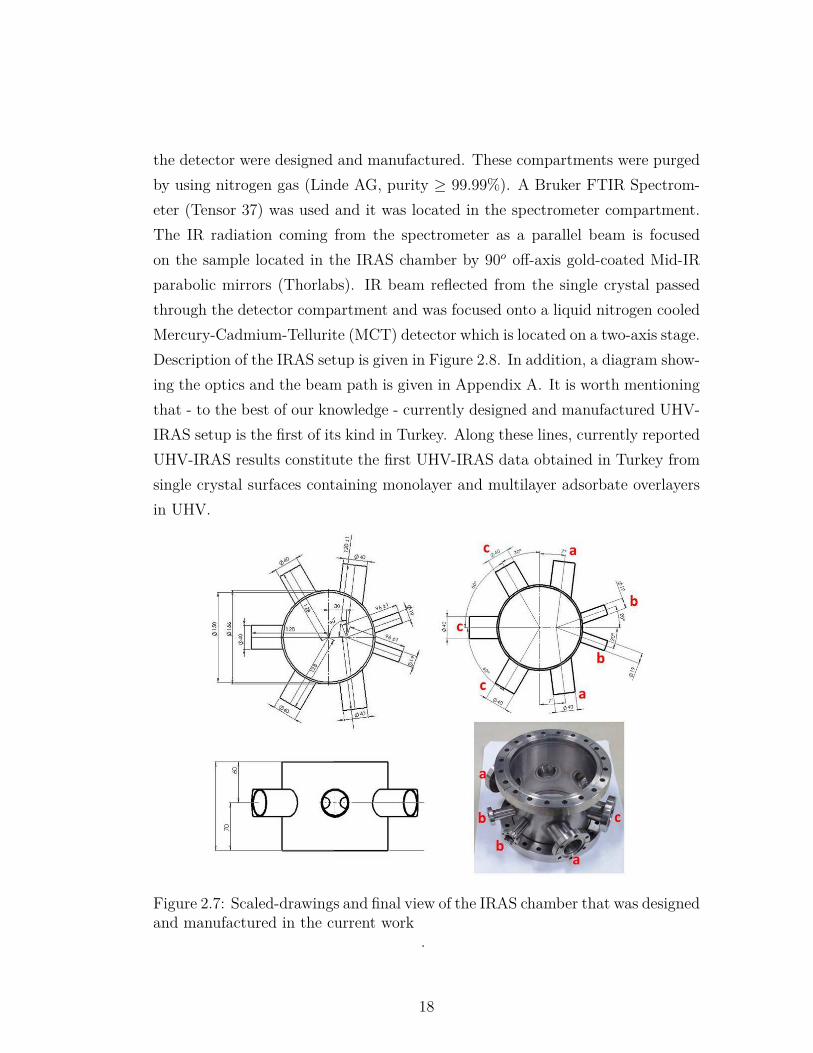
the detector were designed and manufactured. These compartments were purgedby using nitrogen gas (Linde AG, purity ≥ 99.99%). A Bruker FTIR Spectrom-eter (Tensor 37) was used and it was located in the spectrometer compartment.The IR radiation coming from the spectrometer as a parallel beam is focusedon the sample located in the IRAS chamber by 90o off-axis gold-coated Mid-IRparabolic mirrors (Thorlabs). IR beam reflected from the single crystal passedthrough the detector compartment and was focused onto a liquid nitrogen cooledMercury-Cadmium-Tellurite (MCT) detector which is located on a two-axis stage.Description of the IRAS setup is given in Figure 2.8. In addition, a diagram show-ing the optics and the beam path is given in Appendix A. It is worth mentioningthat - to the best of our knowledge - currently designed and manufactured UHV-IRAS setup is the first of its kind in Turkey. Along these lines, currently reportedUHV-IRAS results constitute the first UHV-IRAS data obtained in Turkey fromsingle crystal surfaces containing monolayer and multilayer adsorbate overlayersin UHV.
Figure 2.7: Scaled-drawings and final view of the IRAS chamber that was designedand manufactured in the current work
.
18
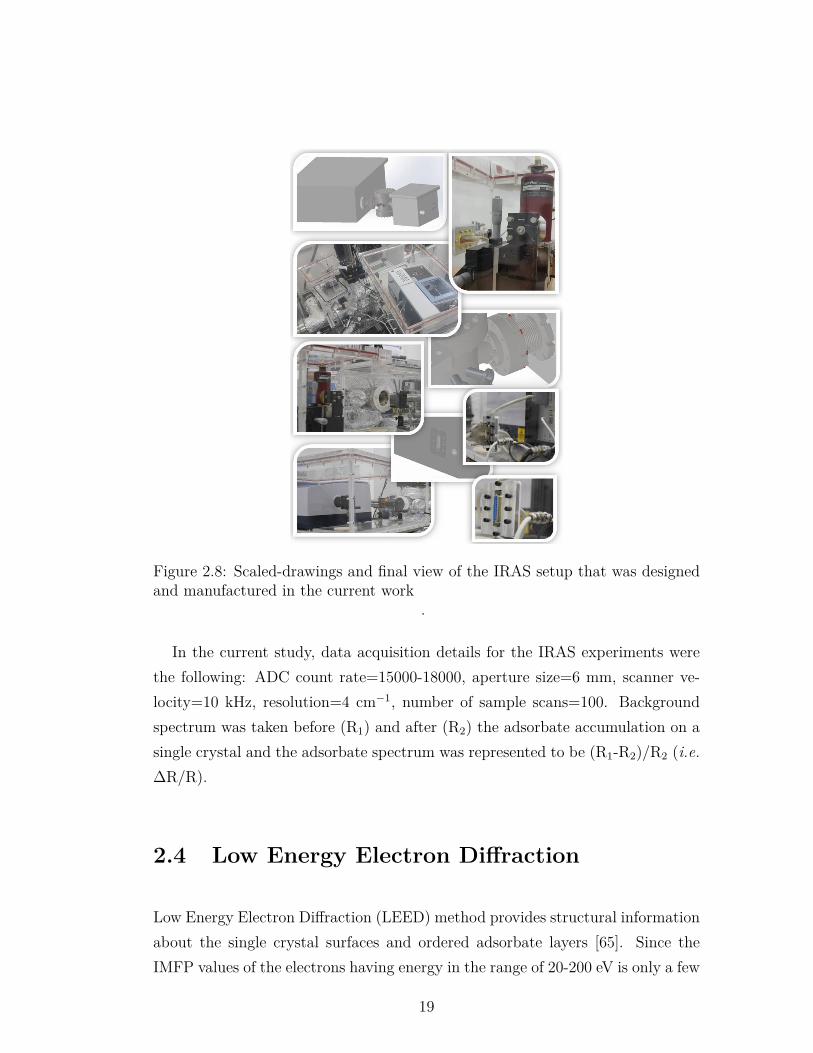
Figure 2.8: Scaled-drawings and final view of the IRAS setup that was designedand manufactured in the current work
.
In the current study, data acquisition details for the IRAS experiments werethe following: ADC count rate=15000-18000, aperture size=6 mm, scanner ve-locity=10 kHz, resolution=4 cm−1, number of sample scans=100. Backgroundspectrum was taken before (R1) and after (R2) the adsorbate accumulation on asingle crystal and the adsorbate spectrum was represented to be (R1-R2)/R2 (i.e.∆R/R).
2.4 Low Energy Electron Diffraction
Low Energy Electron Diffraction (LEED) method provides structural informationabout the single crystal surfaces and ordered adsorbate layers [65]. Since theIMFP values of the electrons having energy in the range of 20-200 eV is only a few
19
Angstrom, diffracted electrons carry information only from the outermost layers[75]. Thus, LEED is a very convenient method to investigate surface structuresof the single crystals. In this method, electrons are accelerated by an electrongun towards a single crystal surface and the beam of electrons scatters from thesurface. Elastically scattered electrons show constructive interference due to theperiodic order of the surface atoms when the Bragg condition given in Equation2.5 is satisfied where, n is the order of diffraction, λ is the wavelength of theelectrons, a is the distance between two atoms in the surface, α is the anglebetween the scattered electrons and the surface normal [65].
nλ = asinα (2.5)
When the scattered electrons are collected on a fluorescent screen, bright spotsin each direction of the constructive interferences are observed. This set of brightspots forms the LEED pattern which is the scaled representation of the realsurface pattern in the reciprocal (k) space. The real space unit cell vectors (ai)can be determined from the basis vectors in k-space (ai
∗) by linear algebraicoperations. The relationship between the k-space and real space basis vectorstogether with the constructive interference phenomena are summarized in Figure2.9a.
Schematic of a LEED configuration is given in Figure 2.9b. Number of gridslocated between the sample and the screen varies with different configurations.Those grids are either grounded to minimize the electrostatic deflection of theelectrons or negatively biased (e.g. suppressor grids) with respect to the gun po-tential to transmit only elastically scattered electrons. Besides, a few kV positivepotential is applied to the fluorescent screen (2.0 kV in the current work) in orderto collect electrons and make spots visible.
20
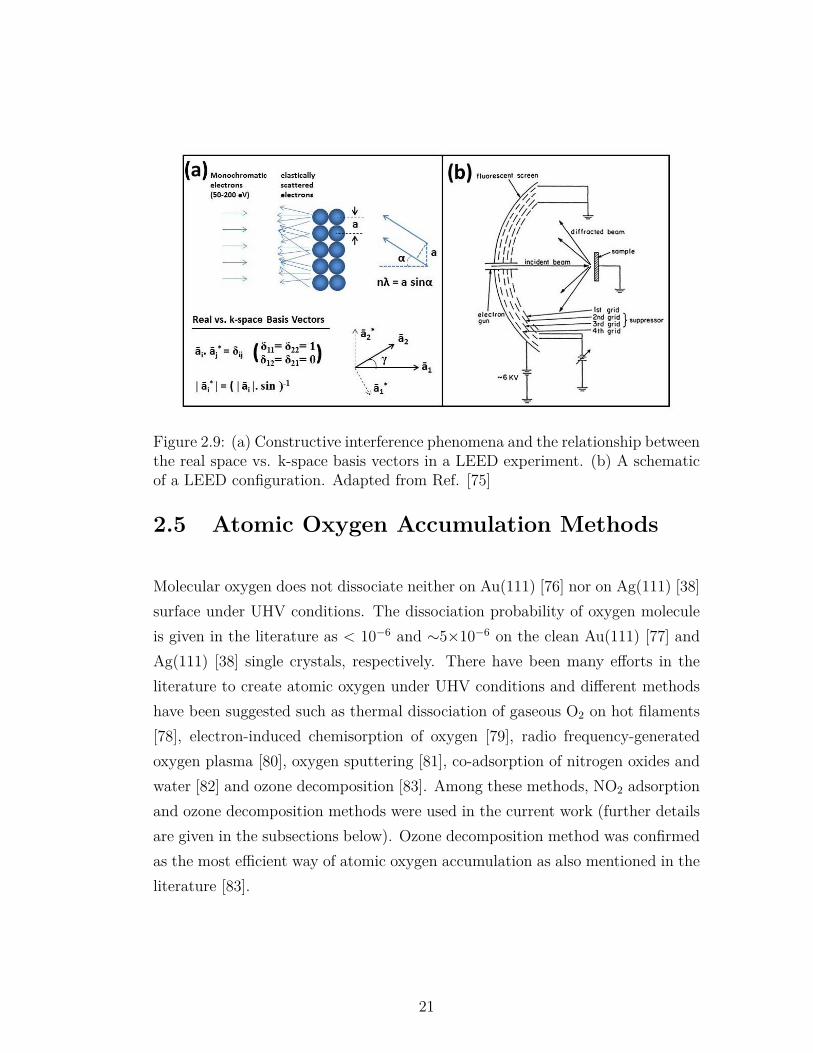
Figure 2.9: (a) Constructive interference phenomena and the relationship betweenthe real space vs. k-space basis vectors in a LEED experiment. (b) A schematicof a LEED configuration. Adapted from Ref. [75]
2.5 Atomic Oxygen Accumulation Methods
Molecular oxygen does not dissociate neither on Au(111) [76] nor on Ag(111) [38]surface under UHV conditions. The dissociation probability of oxygen moleculeis given in the literature as < 10−6 and ∼5×10⁻⁶ on the clean Au(111) [77] andAg(111) [38] single crystals, respectively. There have been many efforts in theliterature to create atomic oxygen under UHV conditions and different methodshave been suggested such as thermal dissociation of gaseous O2 on hot filaments[78], electron-induced chemisorption of oxygen [79], radio frequency-generatedoxygen plasma [80], oxygen sputtering [81], co-adsorption of nitrogen oxides andwater [82] and ozone decomposition [83]. Among these methods, NO2 adsorptionand ozone decomposition methods were used in the current work (further detailsare given in the subsections below). Ozone decomposition method was confirmedas the most efficient way of atomic oxygen accumulation as also mentioned in theliterature [83].
21
2.5.1 NO2 and water co-adsorption
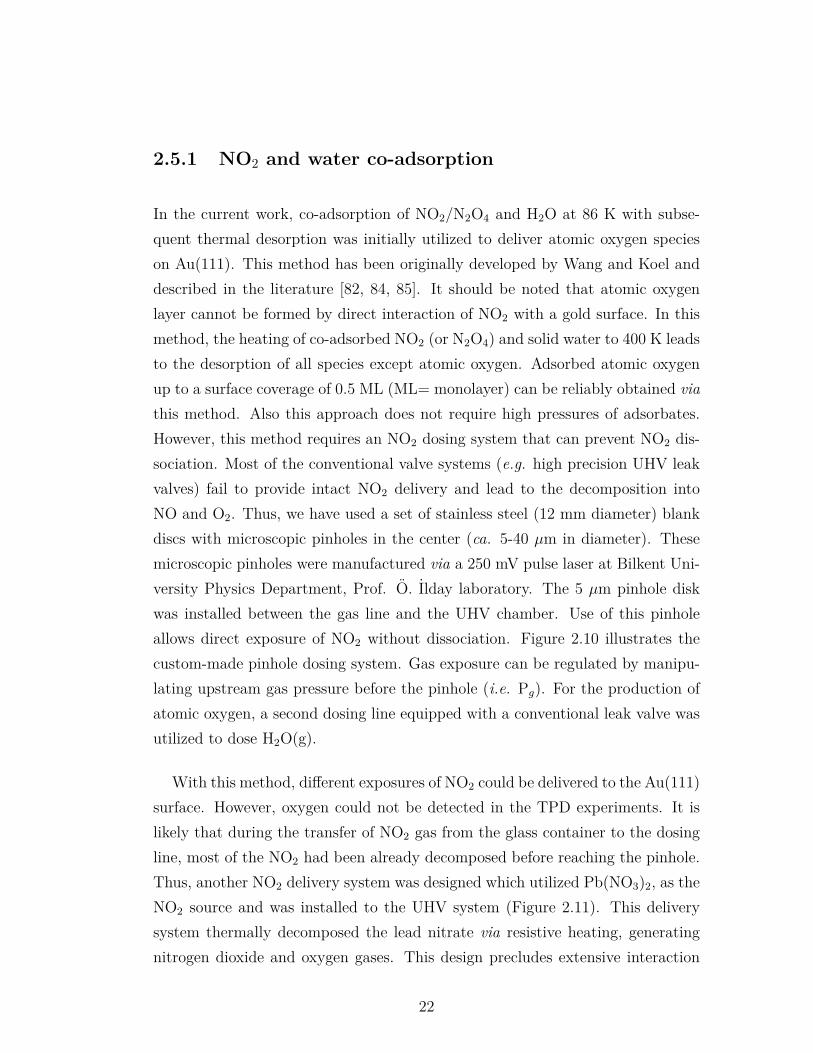
In the current work, co-adsorption of NO2/N2O4 and H2O at 86 K with subse-quent thermal desorption was initially utilized to deliver atomic oxygen specieson Au(111). This method has been originally developed by Wang and Koel anddescribed in the literature [82, 84, 85]. It should be noted that atomic oxygenlayer cannot be formed by direct interaction of NO2 with a gold surface. In thismethod, the heating of co-adsorbed NO2 (or N2O4) and solid water to 400 K leadsto the desorption of all species except atomic oxygen. Adsorbed atomic oxygenup to a surface coverage of 0.5 ML (ML= monolayer) can be reliably obtained viathis method. Also this approach does not require high pressures of adsorbates.However, this method requires an NO2 dosing system that can prevent NO2 dis-sociation. Most of the conventional valve systems (e.g. high precision UHV leakvalves) fail to provide intact NO2 delivery and lead to the decomposition intoNO and O2. Thus, we have used a set of stainless steel (12 mm diameter) blankdiscs with microscopic pinholes in the center (ca. 5-40 µm in diameter). Thesemicroscopic pinholes were manufactured via a 250 mV pulse laser at Bilkent Uni-versity Physics Department, Prof. O. Ilday laboratory. The 5 µm pinhole diskwas installed between the gas line and the UHV chamber. Use of this pinholeallows direct exposure of NO2 without dissociation. Figure 2.10 illustrates thecustom-made pinhole dosing system. Gas exposure can be regulated by manipu-lating upstream gas pressure before the pinhole (i.e. Pg). For the production ofatomic oxygen, a second dosing line equipped with a conventional leak valve wasutilized to dose H2O(g).
With this method, different exposures of NO2 could be delivered to the Au(111)surface. However, oxygen could not be detected in the TPD experiments. It islikely that during the transfer of NO2 gas from the glass container to the dosingline, most of the NO2 had been already decomposed before reaching the pinhole.Thus, another NO2 delivery system was designed which utilized Pb(NO3)2, as theNO2 source and was installed to the UHV system (Figure 2.11). This deliverysystem thermally decomposed the lead nitrate via resistive heating, generatingnitrogen dioxide and oxygen gases. This design precludes extensive interaction
22
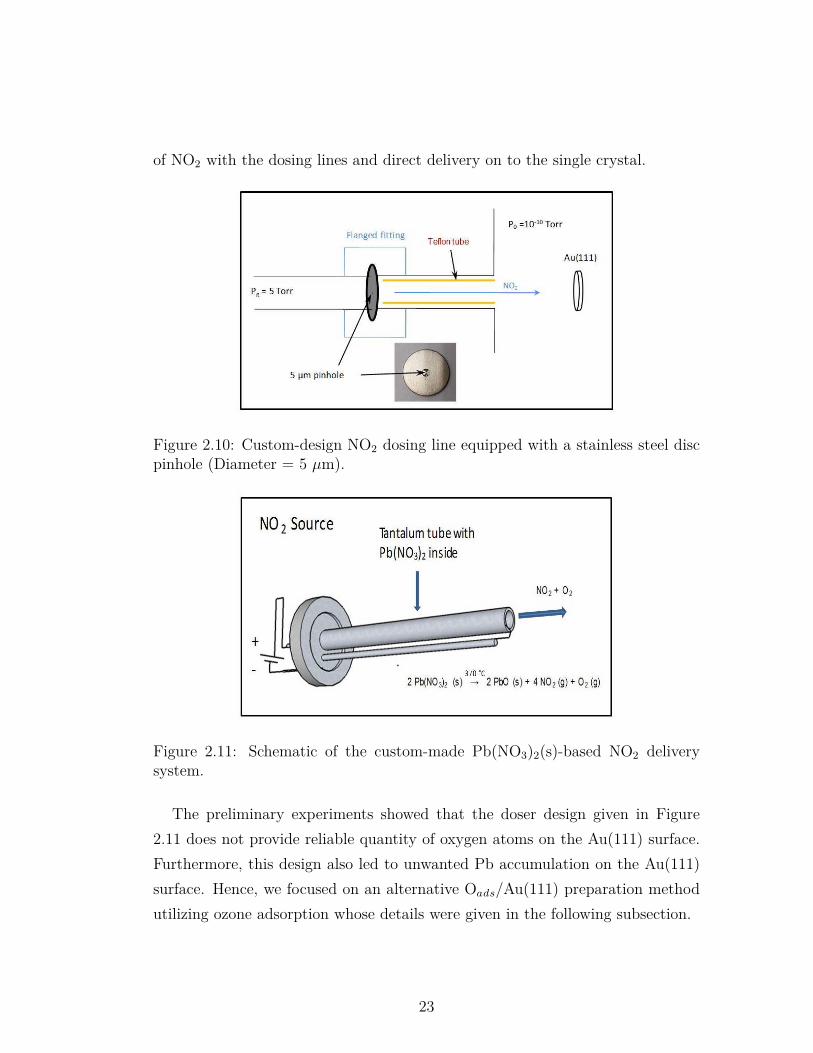
of NO2 with the dosing lines and direct delivery on to the single crystal.
Figure 2.10: Custom-design NO2 dosing line equipped with a stainless steel discpinhole (Diameter = 5 µm).
Figure 2.11: Schematic of the custom-made Pb(NO3)2(s)-based NO2 deliverysystem.
The preliminary experiments showed that the doser design given in Figure2.11 does not provide reliable quantity of oxygen atoms on the Au(111) surface.Furthermore, this design also led to unwanted Pb accumulation on the Au(111)surface. Hence, we focused on an alternative Oads/Au(111) preparation methodutilizing ozone adsorption whose details were given in the following subsection.
23

2.5.2 Ozone Decomposition
As mentioned previously, ozone decomposition method is widely utilized forpreparation of Oads/Au surfaces due to its high effectiveness. Furthermore, iteliminates the necessity to cool the single crystal sample to liquid nitrogen tem-perature and the Oads layer can be prepared at/above room temperature. How-ever there are some difficulties in using this method. Ozone is produced viaatmospheric pressure of oxygen which cannot be directly dosed to the UHV sys-tem. Therefore, an ozone pre-concentrator was designed and manufactured whereozone is first accumulated in a silica gel trap at dry ice temperature (-78 ◦C).Note that while ozone could be captured and stored in/on the silica gel, O2 didnot adsorb onto the silica gel. Then, after evacuation of the excess oxygen, thetrap is carefully heated to desorb ozone and ozone is dosed into the UHV system.It should be noted that ozone desorption from silica gel is a very rapid processand care must be taken to prevent explosion due to the rapid pressure rise in thetrap. A custom-made corona discharge ozonizer was modified with the silica gelozone trap system which was connected to UHV system through a pinhole dosingline (Figure 2.12). The ozone in the ozonizer was produced by generating oxygenplasma using a high voltage (6 kV) bias on platinum pins at high oxygen pressure(∼700 Torr).
Figure 2.12: Details of the custom-made ozonizer and ozone trap accommodatingthe silica gel.
24
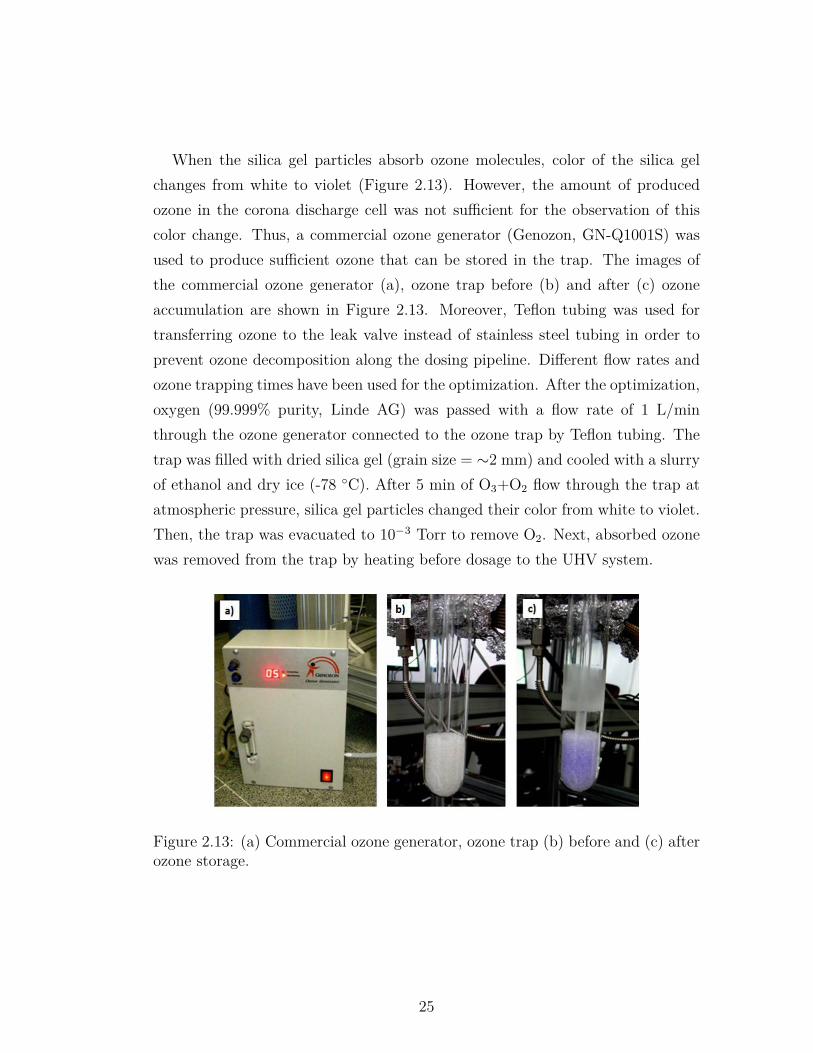
When the silica gel particles absorb ozone molecules, color of the silica gelchanges from white to violet (Figure 2.13). However, the amount of producedozone in the corona discharge cell was not sufficient for the observation of thiscolor change. Thus, a commercial ozone generator (Genozon, GN-Q1001S) wasused to produce sufficient ozone that can be stored in the trap. The images ofthe commercial ozone generator (a), ozone trap before (b) and after (c) ozoneaccumulation are shown in Figure 2.13. Moreover, Teflon tubing was used fortransferring ozone to the leak valve instead of stainless steel tubing in order toprevent ozone decomposition along the dosing pipeline. Different flow rates andozone trapping times have been used for the optimization. After the optimization,oxygen (99.999% purity, Linde AG) was passed with a flow rate of 1 L/minthrough the ozone generator connected to the ozone trap by Teflon tubing. Thetrap was filled with dried silica gel (grain size = ∼2 mm) and cooled with a slurryof ethanol and dry ice (-78 ◦C). After 5 min of O3+O2 flow through the trap atatmospheric pressure, silica gel particles changed their color from white to violet.Then, the trap was evacuated to 10−3 Torr to remove O2. Next, absorbed ozonewas removed from the trap by heating before dosage to the UHV system.
Figure 2.13: (a) Commercial ozone generator, ozone trap (b) before and (c) afterozone storage.
25
Chapter 3
Bond Activation on Gold
Section 3.4 in this Chapter is reprinted (adapted) with permission from (Karatok,M., Vovk, E. I., Shah, A. A., Turksoy, A., Ozensoy, E. ”Acetaldehyde PartialOxidation on the Au (111) Model Catalyst Surface: C-C Bond Activation andFormation of Methyl Acetate as an Oxidative Coupling Product. Surface Science,2015, 641, pp 289-293). Copyright (2017) Elsevier.
3.1 Characterization of the Au(111) SingleCrystal Surface
Some metals exhibit rearrangement in their surface atoms under UHV condi-tions to further decrease the surface free energy such as e.g. W(100), Mo(100),Ir(100) [2] and Au(111). Gold is the only fcc metal whose (111) facet exhibitsreconstruction under UHV conditions [86]. The reconstruction of Au(111) sur-face has been investigated by numerous methods such as Low Energy ElectronDiffraction (LEED) [87], Helium Atom Diffraction (HAD) [88], Scanning Tun-neling Microscopy (STM) [86, 89], and DFT calculations [90]. ReconstructedAu(111) surface has a 22×
√3 surface unit cell structure and it is thought to orig-
inate from dislocated low-coordination surface atoms which tend to maximize
26

their coordination [89]. Due to the contraction/dislocation of surface atoms, theunit cell contains 23 atoms instead of 22 atoms. Thus, partial dislocations areperiodically formed because of the mismatching epitaxy of surface atoms and thesublayer. These dislocation domains create hills with a height of 0.1-0.2 A todecrease the stress on the surface and so, a zigzag pattern which is called the”herringbone structure” is formed [89]. Schematic drawing of the reconstructedAu(111) unit cell and an STM image of the herringbone structure are shown inFigure 3.1.
Figure 3.1: Reconstructed Au(111) unit cell [89]. b) STM image of a recon-structed Au(111) surface (size 120×120 nm2) in UHV. Inset shows an atomic res-olution image (8×6 nm2) where the unit cell is marked with a rectangle. Adaptedfrom Ref. [91]
Au(111) surface was atomically cleaned by multiple cycles of Ar+ sputtering,followed by subsequent annealing at 773 K under UHV conditions. The cleannessof the surface was confirmed by XPS. Trace amount of argon, sulfur and carbonatoms (i.e. natural contaminations in gold ores) were detected together with goldsignals before the cleaning procedure. Sputtering-annealing cycle was repeateduntil the impurities dropped below detection limits. A representative survey scanof the clean Au(111) single crystal after Ar+ sputtering and annealing cycles isshown in Figure 3.2. As can be seen in Figure 3.2, all photoemission signalsbelong to the gold sample and no contamination exists on the Au(111) singlecrystal.
27
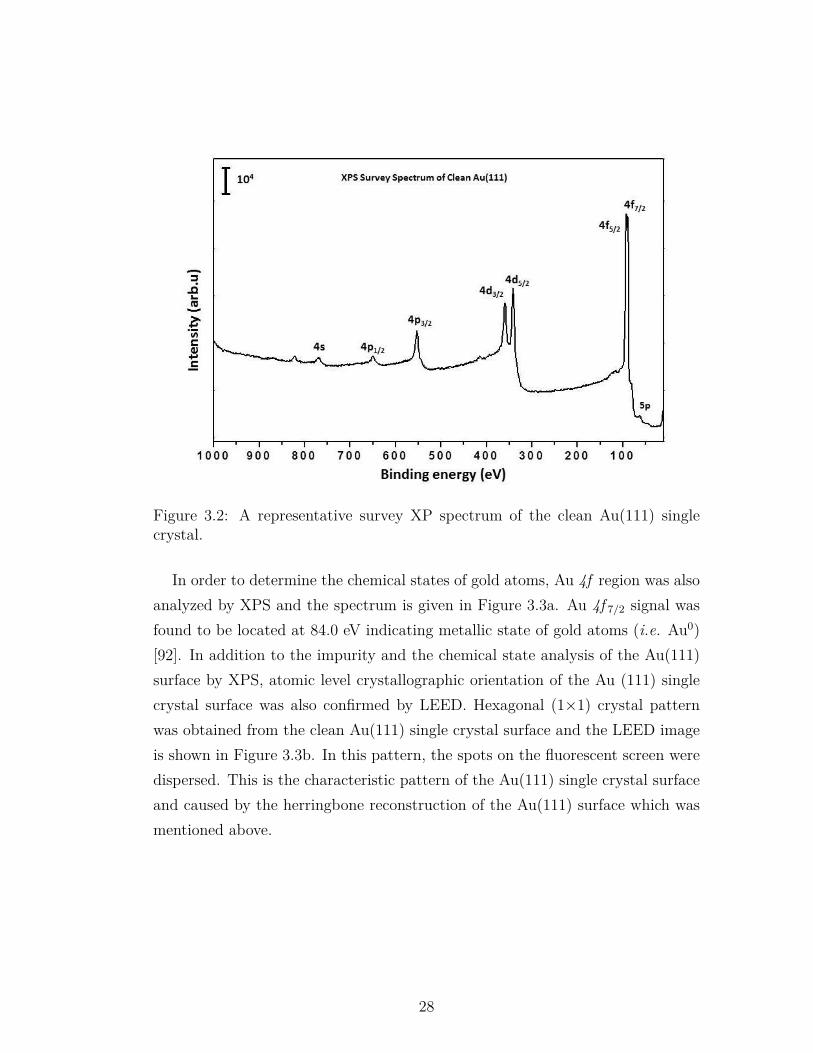
Figure 3.2: A representative survey XP spectrum of the clean Au(111) singlecrystal.
In order to determine the chemical states of gold atoms, Au 4f region was alsoanalyzed by XPS and the spectrum is given in Figure 3.3a. Au 4f 7/2 signal wasfound to be located at 84.0 eV indicating metallic state of gold atoms (i.e. Au0)[92]. In addition to the impurity and the chemical state analysis of the Au(111)surface by XPS, atomic level crystallographic orientation of the Au (111) singlecrystal surface was also confirmed by LEED. Hexagonal (1×1) crystal patternwas obtained from the clean Au(111) single crystal surface and the LEED imageis shown in Figure 3.3b. In this pattern, the spots on the fluorescent screen weredispersed. This is the characteristic pattern of the Au(111) single crystal surfaceand caused by the herringbone reconstruction of the Au(111) surface which wasmentioned above.
28

Figure 3.3: (a) Au 4f XP spectrum (b) LEED pattern of the clean Au(111) singlecrystal.
3.2 Oxygen Behavior on Au(111) Single Crystal
In order to understand the nature of oxygen on Au(111), TPD experiments ofoxygen layers prepared at various temperatures were performed. TPD spectrashowing m/z=32 (O2) with increasing ozone exposure at 460 K (a), 300 K (b)and 140 K (c) are given in Figure 3.4. In the literature, Saliba et al. performedsimilar TPD experiments of oxygen via ozone adsorption on the Au(111) surfaceat 300 K [93]. They concluded that oxygen desorption follows first-order kinetics.In the following works (whatever temperature and atomic oxygen preparationmethod was utilized), researchers associated the oxygen desorption with firstorder or pseudo-first order kinetics even though the TPD spectra does not fit thefirst-order kinetics [77]. The observed inconsistencies in TPD spectra with first-order behavior were associated with restructuring and corrugation of the surfacewhich is indeed confirmed by STM [23].
In the current work, oxygen TPD spectra of the oxygen layers prepared at460 K (Figure 3.4a) reveal a common leading edge of the spectral curves with
29

increasing temperature. The spectra also show a sharp decline at the end ofdesorption. Furthermore, the spectra do not converge to a saturation coverage;O2 desorption signal continuously grows with ozone exposure. This behaviorunambiguously indicates zero-order desorption kinetics. Similar O2 TPD spectrawere reported by Gong et al. for atomic oxygen layers prepared at 77 K usinga radio frequency generated plasma jet [94]. Zero-order desorption kinetics canbe expected when the reservoir of desorbing molecules is infinite, as in the caseof multilayer desorption. The possible suggested structures of the oxygen layersthat can lead to zero-order O2 desorption are 1) bulk gold oxide (Obulk); thedecomposition rate of which does not depend on oxygen content and 2) subsurfaceatomic oxygen (Osub) dissolved into the bulk of gold single crystal. No oxideformation was detected by XPS at 460 K (discussed below) and it was deducedthat oxygen dissolves into the bulk when it is accumulated at 460 K temperature.Former studies in the literature support our discussion. Min et al. showed thatCO oxidation rate decreases when ozone exposure temperature increases from 200K to 400 K [23]. In their study, bigger oxygen island formation on the Au(111)surface at 400 K compared to 200 K was demonstrated by STM; and the presenceof the inaccessible oxygen atoms dissolving in big islands at higher temperatureand decrease of the reaction rate were reported. Parker et al. also mentionedthat CO oxidation rate increases when the surface temperature decreases [83]. Inanother study, Sault et al. prepared atomic oxygen on Au(110)-(1×2) surface atroom temperature (RT) by using hot filament and found 10% of remained oxygenafter high pressure H2 titration at 400 K [95].
The desorption behavior is different for oxygen layers prepared at 300 K (Fig-ure 3.4b) and 140 K on Au(111) (Figure 3.4c). Saturation coverage was reachedwhen the oxygen layer was prepared at 140 K. Very similar TPD spectra (toptwo spectra in Figure 3.4c) were observed which were individually exposed to0.8 L and 2.4 L of ozone. Saturation coverage was also observed by Wang et al.on Au(111) by NO2+H2O co-adsorption method for atomic oxygen accumulationat 86 K [82]. Starting from the lowest coverage in Figure 3.4c, intensity of thedesorption signal continuously increases and its maximum shifts to higher tem-peratures. After a certain exposure (the fifth spectrum from bottom), the peak
30
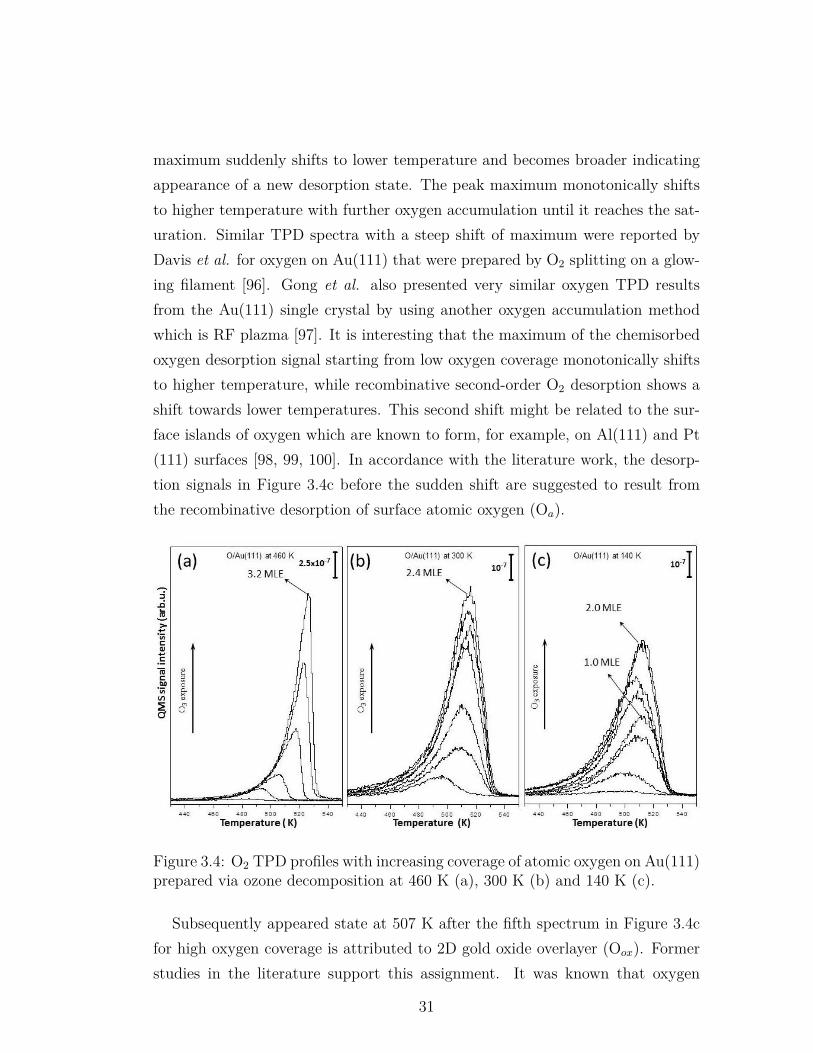
maximum suddenly shifts to lower temperature and becomes broader indicatingappearance of a new desorption state. The peak maximum monotonically shiftsto higher temperature with further oxygen accumulation until it reaches the sat-uration. Similar TPD spectra with a steep shift of maximum were reported byDavis et al. for oxygen on Au(111) that were prepared by O2 splitting on a glow-ing filament [96]. Gong et al. also presented very similar oxygen TPD resultsfrom the Au(111) single crystal by using another oxygen accumulation methodwhich is RF plazma [97]. It is interesting that the maximum of the chemisorbedoxygen desorption signal starting from low oxygen coverage monotonically shiftsto higher temperature, while recombinative second-order O2 desorption shows ashift towards lower temperatures. This second shift might be related to the sur-face islands of oxygen which are known to form, for example, on Al(111) and Pt(111) surfaces [98, 99, 100]. In accordance with the literature work, the desorp-tion signals in Figure 3.4c before the sudden shift are suggested to result fromthe recombinative desorption of surface atomic oxygen (Oa).
Figure 3.4: O2 TPD profiles with increasing coverage of atomic oxygen on Au(111)prepared via ozone decomposition at 460 K (a), 300 K (b) and 140 K (c).
Subsequently appeared state at 507 K after the fifth spectrum in Figure 3.4cfor high oxygen coverage is attributed to 2D gold oxide overlayer (Oox). Formerstudies in the literature support this assignment. It was known that oxygen
31
atoms locate on Au(111) surface at 3-fold position for low coverages [33, 24].However, a new vibrational feature in HREELS spectrum was reported for highoxygen coverage by Baker et al. and it was concluded that 2D gold oxide layerwas formed [24] for high oxygen accumulation. In another study, Gottfried etal. showed that oxygen originating from gold oxide decomposition had lowerdesorption temperature compared to the chemisorbed atomic oxygen [101]. Incontrast to the current study, TPD signals of the gold oxide and atomic oxygenwere well separated in Gottfried’s work. It must however be considered that adifferent gold single crystal surface, Au(110)-(1×2), and a different heating ratewere used in their work.
DFT studies in the literature support the surface gold oxide (Oox) assignmentin the current work as well. Miller et al. found that d-band densities of statesfor surface gold atoms increase with increasing oxygen coverage, which meansincreased overlap of oxygen and surface gold orbitals [102]. Baker et al. arguedthat release of gold atoms from the surface is favorable at high oxygen coverages,where Au-O bond becomes stronger [33]. In another study, Baker et al. calculatedcharges on the oxygen atoms at different coverages and found more covalentAu-O interaction with increasing coverage [31]. It must be considered as analternative explanation that desorption temperature shift may also be related tothe changing surface structure with increasing oxygen quantity which is shown bySTM [23]. Goodman’s work shows that oxygen desorption features are completelydifferent on Au(110) and Au(111) surfaces; peak positions are 470 K and 535 K,respectively [96].
In Figure 3.4c, the integrated peak area of the signal where the saturation wasreached and that of the signal before shifting (fourth spectrum from bottom inFigure 3.4c) were calculated. The ratio between the integrated areas of thesesignals was found to be precisely 2:1. This ratio is in agreement with the modelwhere the concentration of oxygen atoms in 2D gold oxide layer (Oox) is doubleof that in fully covered surface atomic oxygen layer. In our oxygen coveragecalculations, integrated area of the signal belonging to fully covered surface atomicoxygen (fourth spectrum from bottom in the Figure 3.4c) was assumed to be 1.0MLE and taken as a reference for oxygen coverage in other TPD experiments.
32
Therefore the saturation coverage in the corresponding figure was determined tobe 2.0 MLE.
Figure 3.4b presents the TPD spectra of oxygen prepared by ozone accumula-tion at 300 K. Oxygen desorption behavior in Figure 3.4b was very close to theKoel’s work in the literature that oxygen was accumulated by ozone exposure at300 K [93]. In their study, the behavior of TPD spectra were assigned to first-order desorption kinetics. However,it is difficult to assign this behavior directly tofirst-order desorption kinetics. The maximum of the peaks monotonically shiftsto higher temperatures with increasing oxygen coverage. In the current study, thesaturation coverage was not observed in contrast to the literature work, howeverthe rate of adsorption at high coverages significantly decreases. These spectrain the current study were tentatively associated with a desorption state whichdemonstrates zero-order kinetics for the O/Au(111) layers prepared at 460 K anda second desorption state with peak maximum at 515 K which was related to thesurface atomic oxygen (Oa).
Figure 3.5 represents Au 4f XP spectra of Au(111) single crystal including2.0 MLE oxygen layers that were prepared at corresponding temperatures incomparison to the Au 4f spectrum of the clean Au(111) surface. For oxygenlayers prepared at 460 K and 300 K (Figure 3.5a and b), no sufficient difference isobserved in the Au 4f spectra between clean and oxygen containing surfaces andgold was only found in metallic state. Therefore, oxygen that was accumulatedat elevated temperature (460 K), which followed zero-order desorption kinetics inFigure 3.4a, can be associated with atomic oxygen dissolved in the bulk of goldsingle crystal. However, the monitored XP spectra cannot absolutely prove theabsence of gold oxide 3D gold oxide agglomerates which are difficult to detectwith XPS method due to the experimental detection limits. When the saturatedoxygen overlayer was prepared at 140 K, FWHM of Au 4f signal slightly increasedas can be seen in Figure 3.5c compared to the spectrum of the clean Au(111).Subtraction of these signals from each other indicates the existence of oxidizedgold atoms.
Gold oxide formation was also previously reported in the literature. Koslowski
33
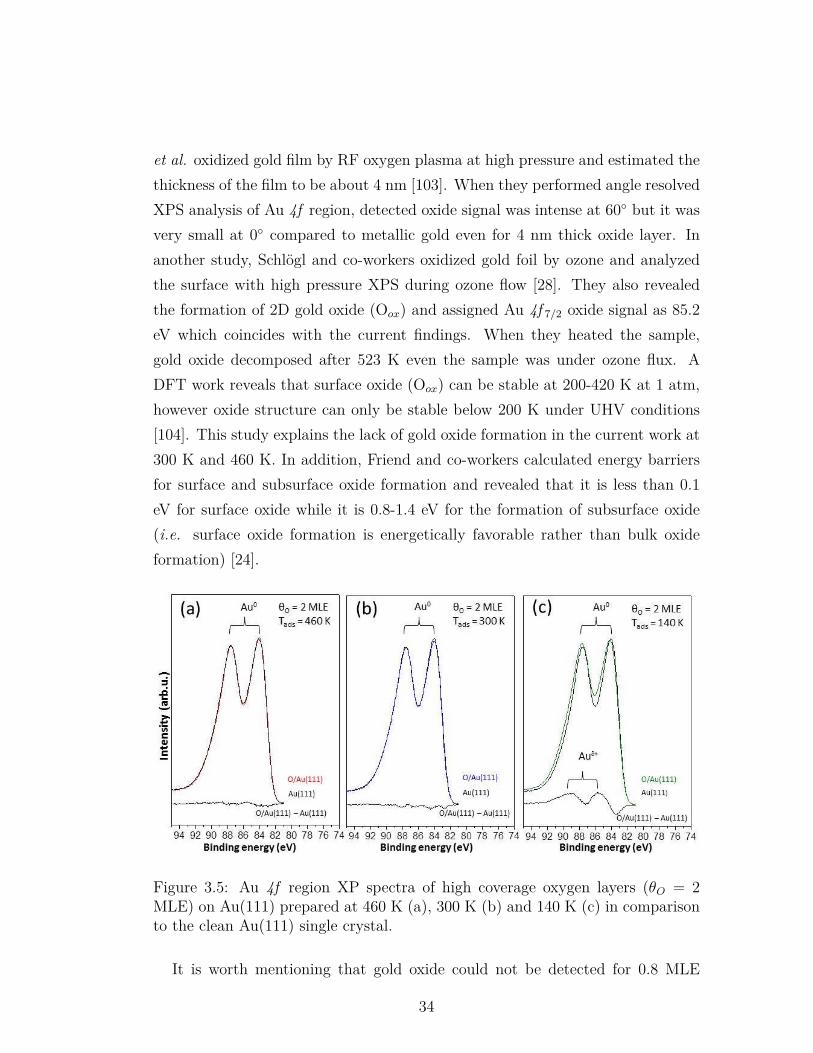
et al. oxidized gold film by RF oxygen plasma at high pressure and estimated thethickness of the film to be about 4 nm [103]. When they performed angle resolvedXPS analysis of Au 4f region, detected oxide signal was intense at 60◦ but it wasvery small at 0◦ compared to metallic gold even for 4 nm thick oxide layer. Inanother study, Schlogl and co-workers oxidized gold foil by ozone and analyzedthe surface with high pressure XPS during ozone flow [28]. They also revealedthe formation of 2D gold oxide (Oox) and assigned Au 4f 7/2 oxide signal as 85.2eV which coincides with the current findings. When they heated the sample,gold oxide decomposed after 523 K even the sample was under ozone flux. ADFT work reveals that surface oxide (Oox) can be stable at 200-420 K at 1 atm,however oxide structure can only be stable below 200 K under UHV conditions[104]. This study explains the lack of gold oxide formation in the current work at300 K and 460 K. In addition, Friend and co-workers calculated energy barriersfor surface and subsurface oxide formation and revealed that it is less than 0.1eV for surface oxide while it is 0.8-1.4 eV for the formation of subsurface oxide(i.e. surface oxide formation is energetically favorable rather than bulk oxideformation) [24].
Figure 3.5: Au 4f region XP spectra of high coverage oxygen layers (θO = 2MLE) on Au(111) prepared at 460 K (a), 300 K (b) and 140 K (c) in comparisonto the clean Au(111) single crystal.
It is worth mentioning that gold oxide could not be detected for 0.8 MLE
34
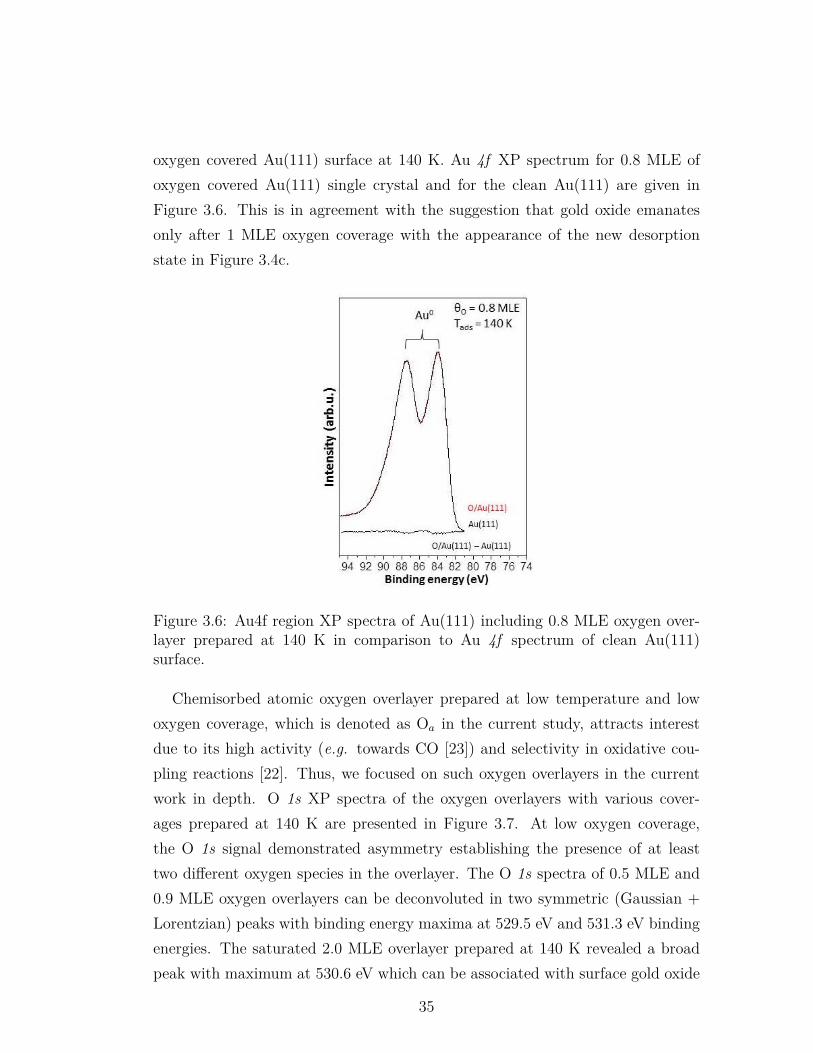
oxygen covered Au(111) surface at 140 K. Au 4f XP spectrum for 0.8 MLE ofoxygen covered Au(111) single crystal and for the clean Au(111) are given inFigure 3.6. This is in agreement with the suggestion that gold oxide emanatesonly after 1 MLE oxygen coverage with the appearance of the new desorptionstate in Figure 3.4c.
Figure 3.6: Au4f region XP spectra of Au(111) including 0.8 MLE oxygen over-layer prepared at 140 K in comparison to Au 4f spectrum of clean Au(111)surface.
Chemisorbed atomic oxygen overlayer prepared at low temperature and lowoxygen coverage, which is denoted as Oa in the current study, attracts interestdue to its high activity (e.g. towards CO [23]) and selectivity in oxidative cou-pling reactions [22]. Thus, we focused on such oxygen overlayers in the currentwork in depth. O 1s XP spectra of the oxygen overlayers with various cover-ages prepared at 140 K are presented in Figure 3.7. At low oxygen coverage,the O 1s signal demonstrated asymmetry establishing the presence of at leasttwo different oxygen species in the overlayer. The O 1s spectra of 0.5 MLE and0.9 MLE oxygen overlayers can be deconvoluted in two symmetric (Gaussian +Lorentzian) peaks with binding energy maxima at 529.5 eV and 531.3 eV bindingenergies. The saturated 2.0 MLE overlayer prepared at 140 K revealed a broadpeak with maximum at 530.6 eV which can be associated with surface gold oxide
35
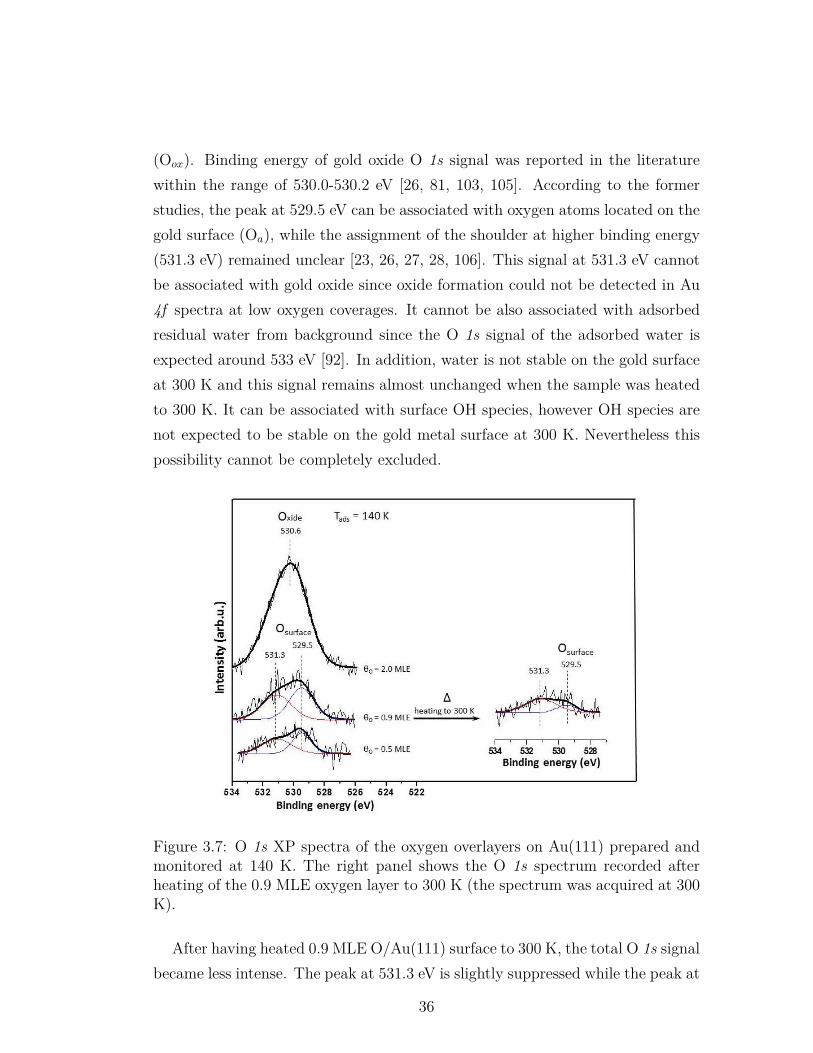
(Oox). Binding energy of gold oxide O 1s signal was reported in the literaturewithin the range of 530.0-530.2 eV [26, 81, 103, 105]. According to the formerstudies, the peak at 529.5 eV can be associated with oxygen atoms located on thegold surface (Oa), while the assignment of the shoulder at higher binding energy(531.3 eV) remained unclear [23, 26, 27, 28, 106]. This signal at 531.3 eV cannotbe associated with gold oxide since oxide formation could not be detected in Au4f spectra at low oxygen coverages. It cannot be also associated with adsorbedresidual water from background since the O 1s signal of the adsorbed water isexpected around 533 eV [92]. In addition, water is not stable on the gold surfaceat 300 K and this signal remains almost unchanged when the sample was heatedto 300 K. It can be associated with surface OH species, however OH species arenot expected to be stable on the gold metal surface at 300 K. Nevertheless thispossibility cannot be completely excluded.
Figure 3.7: O 1s XP spectra of the oxygen overlayers on Au(111) prepared andmonitored at 140 K. The right panel shows the O 1s spectrum recorded afterheating of the 0.9 MLE oxygen layer to 300 K (the spectrum was acquired at 300K).
After having heated 0.9 MLE O/Au(111) surface to 300 K, the total O 1s signalbecame less intense. The peak at 531.3 eV is slightly suppressed while the peak at
36
529.5 eV was suppressed by around 80%. One can see from the TPD experimentsthat at temperature below 300 K oxygen does not desorb from the Au(111) surface(see Figure 3.4). Therefore it is logical to suggest the diffusion of oxygen atomsinto the bulk of the Au(111) single crystal. Besides, the O 1s component at higherbinding energy (531.3 eV) is tentatively attributed to subsurface atomic oxygen(Osub). This assignment is in agreement with theoretical calculations of oxygenatoms on Al(111) surface, where it was shown that oxygen atoms in 3-fold sitebelow the surface have higher O 1s BE than oxygen atoms above the surface [99].
3.2.1 Examination of the Activity of Oxygen Overlayerson Au(111) by Titration with CO Molecules
In order to determine the activity of the oxygen overlayers that were prepared atthree different temperatures, CO was used as a probe molecule to titrate oxygenatoms. Since CO interacts with atomic oxygen on the Au(111) surface alreadyat 77 K, the activity of the oxygen overlayers was examined in the following way:oxygen overlayers were prepared at various temperatures (the estimated oxygencoverage was θO = 0.7 MLE) and followed by CO accumulation at relatively highexposure (3.0 L) at 140 K to remove all of the active oxygen. The subsequentTPD (m/z=32 channel) spectra of unreacted oxygen are presented in Figure3.8 in comparison to the spectra of the oxygen overlayers without CO treatment.One can see that the quantity of inactive oxygen strongly depended on the oxygenoverlayer preparation temperature and increased with the increasing temperature.
37
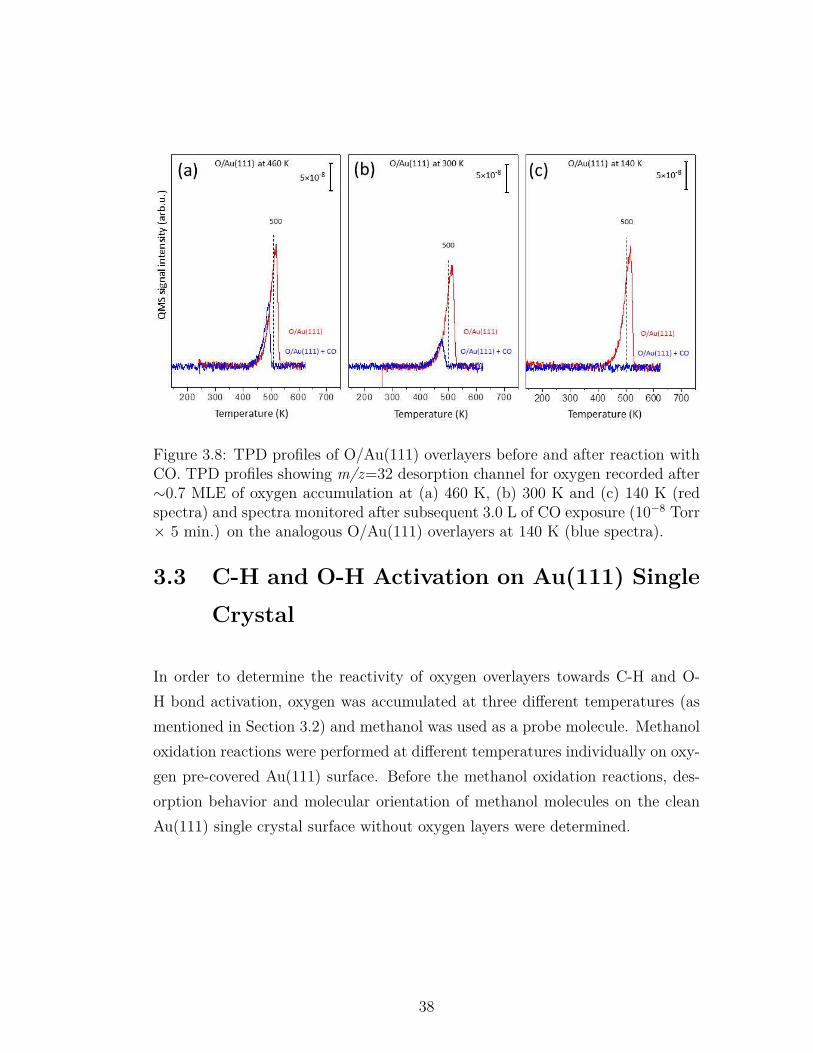
Figure 3.8: TPD profiles of O/Au(111) overlayers before and after reaction withCO. TPD profiles showing m/z=32 desorption channel for oxygen recorded after∼0.7 MLE of oxygen accumulation at (a) 460 K, (b) 300 K and (c) 140 K (redspectra) and spectra monitored after subsequent 3.0 L of CO exposure (10−8 Torr× 5 min.) on the analogous O/Au(111) overlayers at 140 K (blue spectra).
3.3 C-H and O-H Activation on Au(111) SingleCrystal
In order to determine the reactivity of oxygen overlayers towards C-H and O-H bond activation, oxygen was accumulated at three different temperatures (asmentioned in Section 3.2) and methanol was used as a probe molecule. Methanoloxidation reactions were performed at different temperatures individually on oxy-gen pre-covered Au(111) surface. Before the methanol oxidation reactions, des-orption behavior and molecular orientation of methanol molecules on the cleanAu(111) single crystal surface without oxygen layers were determined.
38

3.3.1 Methanol on Clean Au(111) Single Crystal
Methanol adsorption was carried out on the clean Au(111) surface at 90 K andm/z=31 signal which corresponds to the most intense fragment in the mass spec-trum of gas-phase methanol was monitored in TPD experiments. Fragmentationpattern of methanol during Residual Gas Analysis (RGA) is given in AppendixB. In all of the TPD experiments, methanol was found to desorb molecularly ina reversible manner from the clean Au(111) single crystal surface. TPD spectraof m/z=31 signal as a function of methanol exposure are given in Figure 3.9. InFigure 3.9, desorption maximum located at ∼155 K was observed for the lowestmethanol coverage of θmethanol = 0.1 MLE. With increasing methanol coverage,the major methanol desorption feature at 155 K almost reached saturation whichwas immediately followed by the appearance of an additional desorption max-imum at 140 K that can be assigned to the formation of multilayer methanoloverlayers. This signal (fourth spectrum from the bottom) was used to estimatethe relative methanol coverages. For this purpose, the multilayer signal at 140K was deconvoluted and subtracted from the whole desorption spectrum and theintegrated desorption signal between 100 K and 500 K associated with the desorp-tion maximum at 155 K was used to estimate θmethanol = 1 MLE. With increasingmethanol coverage, amorphous (α2) and crystalline (α1) methanol multilayers ap-peared at 142 and 137 K; respectively. Weak and broad features at ca. 170 K and210 K which were more pronounced at higher methanol coverages (θmethanol ≥ 3.8MLE) can be associated with strongly bonded methanol species on coordinatelyunsaturated points and extended defects on the Au(111) single crystal surface.The methanol TPD spectra in Figure 3.9 are in very good agreement with theliterature [107].
IRAS spectra of methanol on the clean Au(111) surface (at high exposurescorresponding to θmethanol > 1.0 MLE) at 90 K and 140 K are shown in Figure3.10. At 140 K, saturated chemisorbed monolayer of methanol is expected to beformed while at 90 K, multilayer methanol is formed. Signal assignments are ina good agreement with the literature for methanol on Au(111) [108] and Cu(110)[109]. The characteristic ν(CO) band at 1031 cm−1 is observed at 140 K while
39
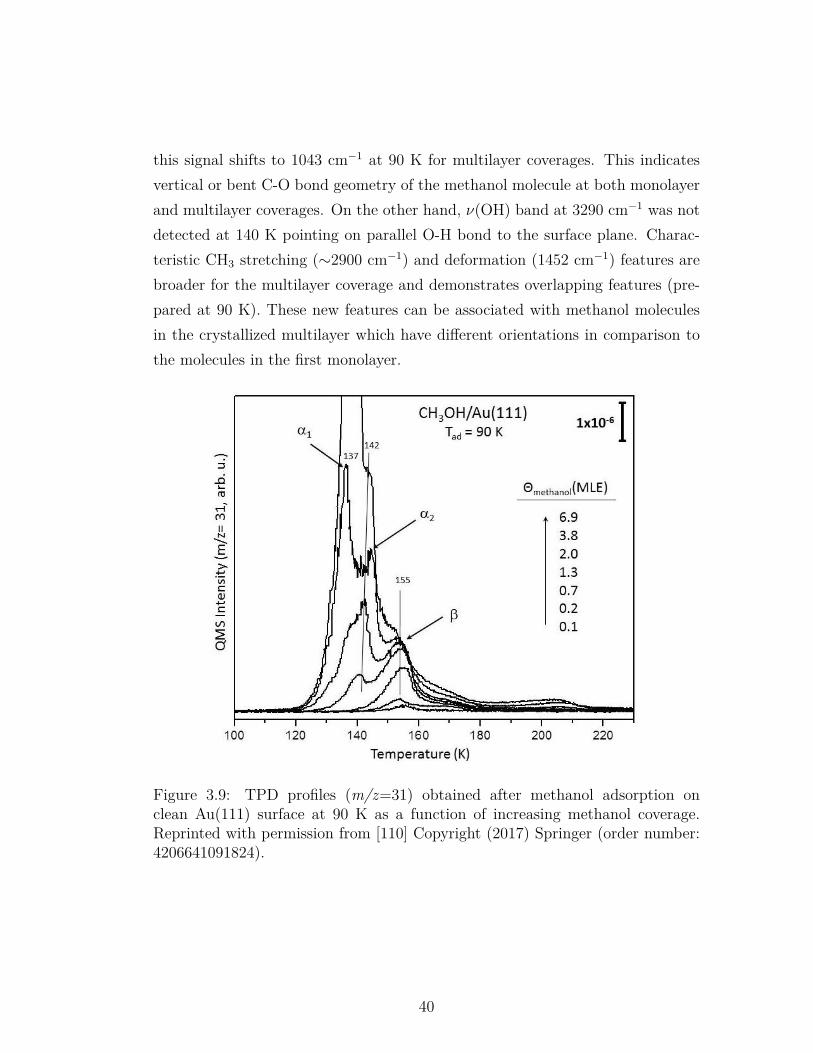
this signal shifts to 1043 cm−1 at 90 K for multilayer coverages. This indicatesvertical or bent C-O bond geometry of the methanol molecule at both monolayerand multilayer coverages. On the other hand, ν(OH) band at 3290 cm−1 was notdetected at 140 K pointing on parallel O-H bond to the surface plane. Charac-teristic CH3 stretching (∼2900 cm−1) and deformation (1452 cm−1) features arebroader for the multilayer coverage and demonstrates overlapping features (pre-pared at 90 K). These new features can be associated with methanol moleculesin the crystallized multilayer which have different orientations in comparison tothe molecules in the first monolayer.
Figure 3.9: TPD profiles (m/z=31) obtained after methanol adsorption onclean Au(111) surface at 90 K as a function of increasing methanol coverage.Reprinted with permission from [110] Copyright (2017) Springer (order number:4206641091824).
40
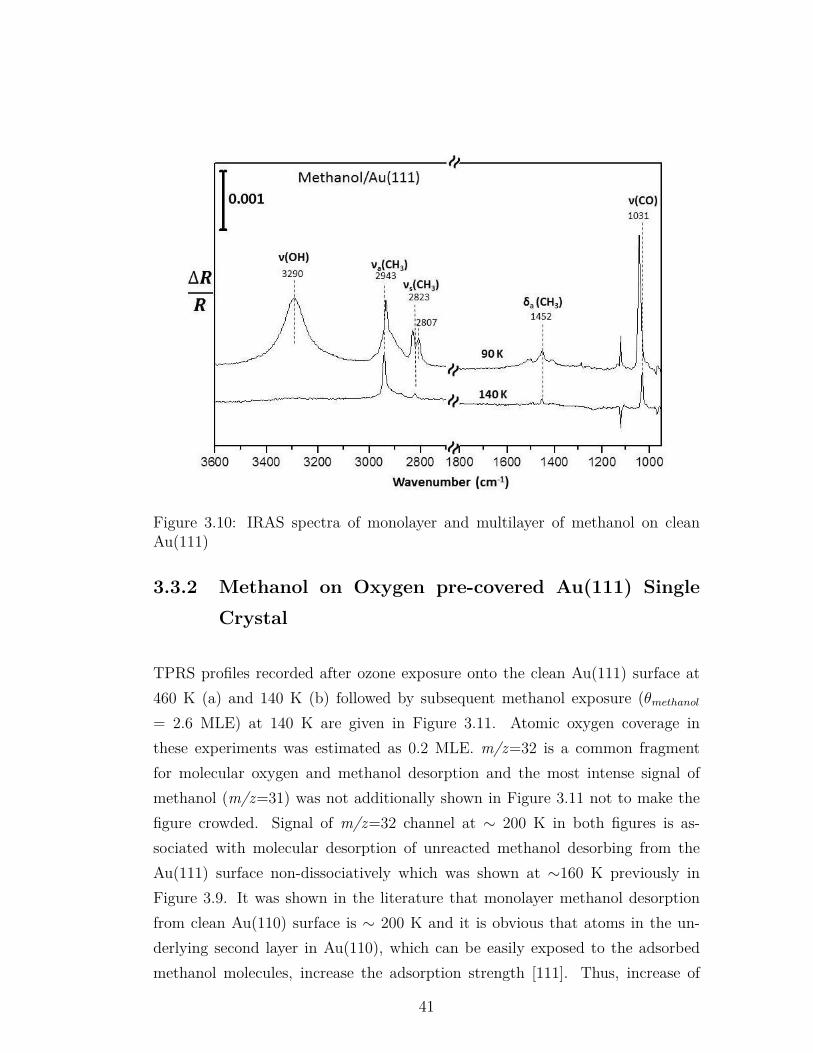
Figure 3.10: IRAS spectra of monolayer and multilayer of methanol on cleanAu(111)
3.3.2 Methanol on Oxygen pre-covered Au(111) SingleCrystal
TPRS profiles recorded after ozone exposure onto the clean Au(111) surface at460 K (a) and 140 K (b) followed by subsequent methanol exposure (θmethanol
= 2.6 MLE) at 140 K are given in Figure 3.11. Atomic oxygen coverage inthese experiments was estimated as 0.2 MLE. m/z=32 is a common fragmentfor molecular oxygen and methanol desorption and the most intense signal ofmethanol (m/z=31) was not additionally shown in Figure 3.11 not to make thefigure crowded. Signal of m/z=32 channel at ∼ 200 K in both figures is as-sociated with molecular desorption of unreacted methanol desorbing from theAu(111) surface non-dissociatively which was shown at ∼160 K previously inFigure 3.9. It was shown in the literature that monolayer methanol desorptionfrom clean Au(110) surface is ∼ 200 K and it is obvious that atoms in the un-derlying second layer in Au(110), which can be easily exposed to the adsorbedmethanol molecules, increase the adsorption strength [111]. Thus, increase of
41
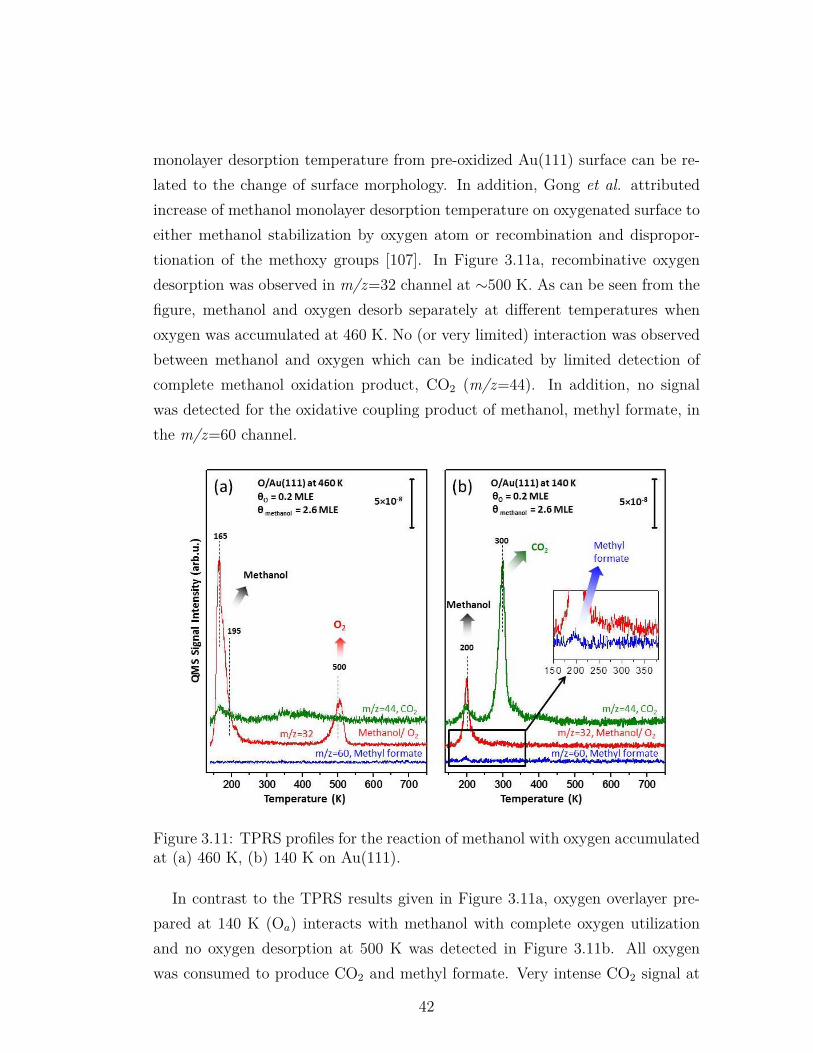
monolayer desorption temperature from pre-oxidized Au(111) surface can be re-lated to the change of surface morphology. In addition, Gong et al. attributedincrease of methanol monolayer desorption temperature on oxygenated surface toeither methanol stabilization by oxygen atom or recombination and dispropor-tionation of the methoxy groups [107]. In Figure 3.11a, recombinative oxygendesorption was observed in m/z=32 channel at ∼500 K. As can be seen from thefigure, methanol and oxygen desorb separately at different temperatures whenoxygen was accumulated at 460 K. No (or very limited) interaction was observedbetween methanol and oxygen which can be indicated by limited detection ofcomplete methanol oxidation product, CO2 (m/z=44). In addition, no signalwas detected for the oxidative coupling product of methanol, methyl formate, inthe m/z=60 channel.
Figure 3.11: TPRS profiles for the reaction of methanol with oxygen accumulatedat (a) 460 K, (b) 140 K on Au(111).
In contrast to the TPRS results given in Figure 3.11a, oxygen overlayer pre-pared at 140 K (Oa) interacts with methanol with complete oxygen utilizationand no oxygen desorption at 500 K was detected in Figure 3.11b. All oxygenwas consumed to produce CO2 and methyl formate. Very intense CO2 signal at
42
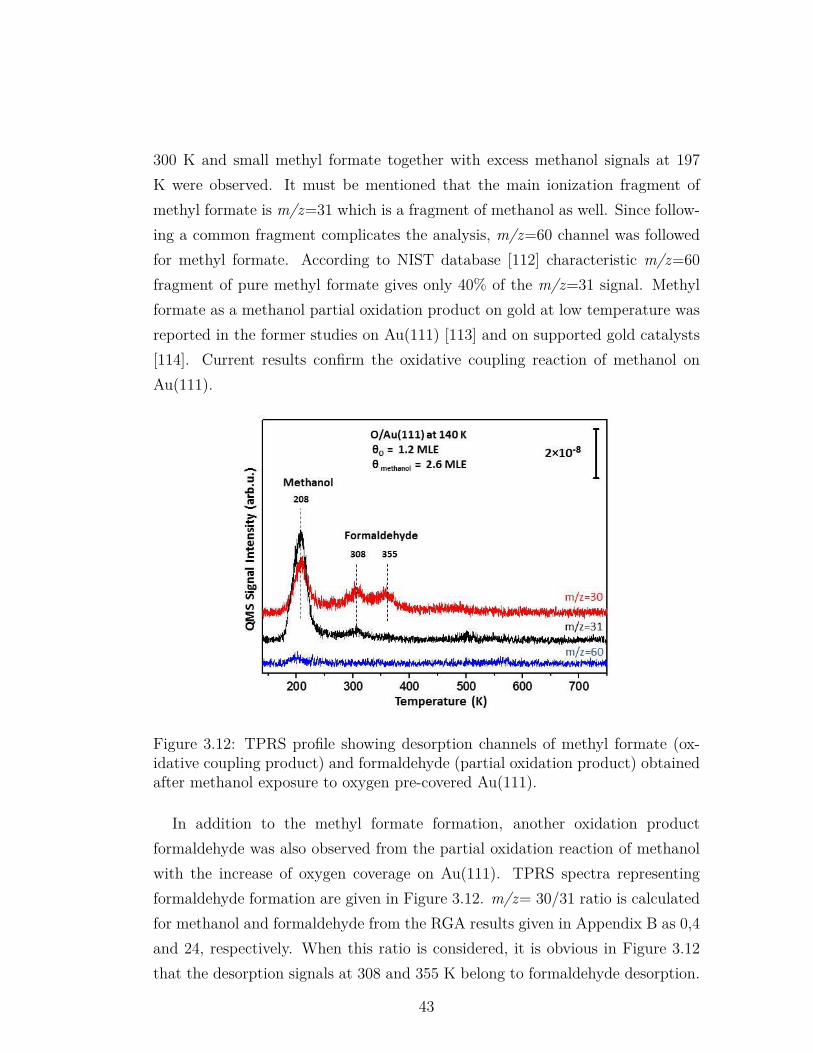
300 K and small methyl formate together with excess methanol signals at 197K were observed. It must be mentioned that the main ionization fragment ofmethyl formate is m/z=31 which is a fragment of methanol as well. Since follow-ing a common fragment complicates the analysis, m/z=60 channel was followedfor methyl formate. According to NIST database [112] characteristic m/z=60fragment of pure methyl formate gives only 40% of the m/z=31 signal. Methylformate as a methanol partial oxidation product on gold at low temperature wasreported in the former studies on Au(111) [113] and on supported gold catalysts[114]. Current results confirm the oxidative coupling reaction of methanol onAu(111).
Figure 3.12: TPRS profile showing desorption channels of methyl formate (ox-idative coupling product) and formaldehyde (partial oxidation product) obtainedafter methanol exposure to oxygen pre-covered Au(111).
In addition to the methyl formate formation, another oxidation productformaldehyde was also observed from the partial oxidation reaction of methanolwith the increase of oxygen coverage on Au(111). TPRS spectra representingformaldehyde formation are given in Figure 3.12. m/z= 30/31 ratio is calculatedfor methanol and formaldehyde from the RGA results given in Appendix B as 0,4and 24, respectively. When this ratio is considered, it is obvious in Figure 3.12that the desorption signals at 308 and 355 K belong to formaldehyde desorption.
43
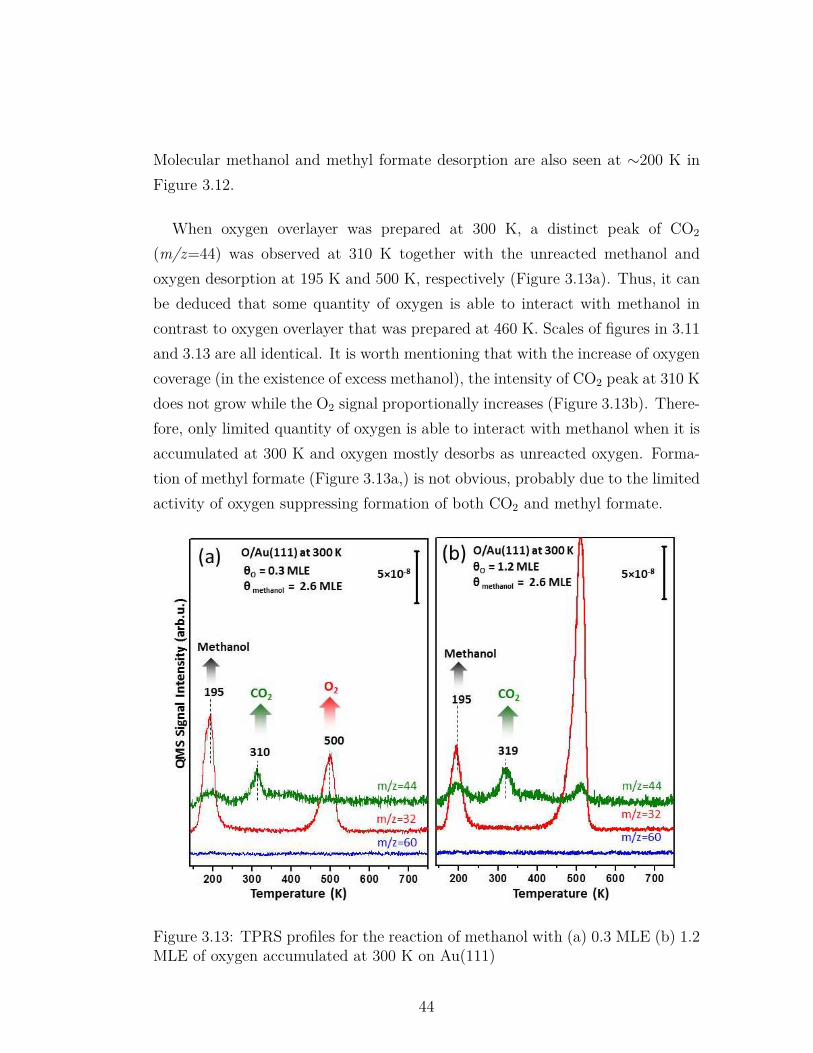
Molecular methanol and methyl formate desorption are also seen at ∼200 K inFigure 3.12.
When oxygen overlayer was prepared at 300 K, a distinct peak of CO2
(m/z=44) was observed at 310 K together with the unreacted methanol andoxygen desorption at 195 K and 500 K, respectively (Figure 3.13a). Thus, it canbe deduced that some quantity of oxygen is able to interact with methanol incontrast to oxygen overlayer that was prepared at 460 K. Scales of figures in 3.11and 3.13 are all identical. It is worth mentioning that with the increase of oxygencoverage (in the existence of excess methanol), the intensity of CO2 peak at 310 Kdoes not grow while the O2 signal proportionally increases (Figure 3.13b). There-fore, only limited quantity of oxygen is able to interact with methanol when it isaccumulated at 300 K and oxygen mostly desorbs as unreacted oxygen. Forma-tion of methyl formate (Figure 3.13a,) is not obvious, probably due to the limitedactivity of oxygen suppressing formation of both CO2 and methyl formate.
Figure 3.13: TPRS profiles for the reaction of methanol with (a) 0.3 MLE (b) 1.2MLE of oxygen accumulated at 300 K on Au(111)
44
Overall, surface atomic oxygen (Oa) activates O-H and C-H bond to yieldformaldehyde and methyl formate with the reaction of methanol on Au(111)single crystal while dissolved oxygen atom (Osub) has limited reactivity towardsthis reaction. In addition, 2D surface gold oxide (Oox) mostly gives CO2 as a totaloxidation product. Methanol oxidation reaction mechanism on Au(111) surfacewas suggested in the literature by Friend and co-workers as follows [113]: Activeoxygen (denoted as Oa in the current study) activates O-H bond of methanoland forms methoxy on the surface (Eq 3.1). Then formaldehyde is formed byβ-H elimination (i.e. C-H bond cleavage) (Eq 3.2). Formaldehyde either desorbsto the gas phase or is attacked by another methoxy to form methyl formate (Eq3.3). Reaction of formaldehyde with adsorbed atomic oxygen yields consecutivelyformate and CO2 (Eqs 3.4-3.5).
2CH3OH(g) +O(a)→ 2CH3O(a) +H2O(g) (3.1)
CH3O(a)→ H2CO(a) +H(a) (3.2)
H2CO(a) + CH3O(a)→ HCOOCH3(g) +H(a) (3.3)
H2CO(a) +O(a)→ HCOO(a) +H(a) (3.4)
HCOO(a)→ CO2(g) +H(a) (3.5)
3.4 C-C Activation on Au(111) Single Crystal
3.4.1 Acetaldehyde and Methyl Formate on CleanAu(111) Single Crystal
Before the investigation of the interaction between adsorbed oxygen species withacetaldehyde on the Au(111) model catalyst surface, it is instructive to exam-ine the adsorption/desorption phenomena corresponding to the reactant and theproduct. Thus, the adsorption and desorption properties of acetaldehyde andmethyl acetate on the clean Au(111) model catalyst surface were investigated.
45
QMS fragmentation patterns of acetaldehyde and methyl acetate was given inAppendix B. Detailed analysis of the coverage-dependent adsorption behaviorof acetaldehyde on the clean Au(111) model catalyst surface at 90 K is given inFigure 3.14. The TPD results presented in Figure 3.14 are in very good agree-ment with the former work of Pan et al. [115]. Based on this former report,117 K and 124 K desorption features in Figure 3.14 can be attributed to themolecular desorption of acetaldehyde from multilayer states, where the formerfeature can be associated with an amorphous acetaldehyde multilayer while thelatter corresponds to a crystalline multilayer phase. The characteristic desorptionsignal at 139 K can be assigned to the desorption of acetaldehyde from the firstmonolayer on the Au(111) surface. On the other hand, the high temperaturedesorption signal located at ca. 194 K is associated with the decomposition ofthe polymerized forms of acetaldehyde on the Au(111) model catalyst surface. Itis worth mentioning that polymerization of acetaldehyde has been reported ona variety of single crystal surfaces where the polymerization was confirmed byTPD and/or High Resolution Electron Energy Loss Spectroscopy (HREELS) onRu(001) [116], Pt(111) and Sn/Pt(111) [117], and Ag(111) [118], while acetalde-hyde polymerization was not observed on Pd(111) [119].
As can be seen in Figure 3.14, relative acetaldehyde coverages present on theAu(111) surface can be calibrated using the 139 K desorption signal correspond-ing to the molecular acetaldehyde in the first monolayer. By considering themaximum integrated desorption signal that can be attained by the 139 K (i.e.monolayer) peak in the absence of any multilayer features located at 124 K or117 K, one can estimate the approximate saturation coverage of adsorbed speciesin the first monolayer. This can be achieved by integrating the m/z=29 TPDcurve between 128-223 K at the particular exposure corresponding to a maxi-mum intensity of the 139 K feature (i.e. εAcetaldehyde = 0.010 L). This approachis based on the presumption that during the completion of the first monolayer,albeit a limited extent, polymeric states start to appear before the saturation ofthe monolayer feature at 139 K.
Along these lines, the interplay between the monolayer desorption feature at139 K and the polymerization-related desorption states located at 185, 194 and
46

202 K in Figure 3.14; is worth discussing in further detail. It is plausible thatduring the completion of the first monolayer, 2D polymeric acetaldehyde speciesmay be formed in addition to the adsorbed acetaldehyde species. This particular2D polymeric state has a characteristic decomposition temperature of 185 K. Ascan be seen in the inset of Figure 3.14, at high acetaldehyde surface coveragesexceeding a monolayer, intensity of the 139 K feature starts to attenuate at theexpense of the growth of the multilayer features (i.e. 124, 117 K) along with newand strong desorption signals at 194 and 202 K. Therefore, it can be argued thatat high surface coverages of acetaldehyde on Au(111), polymerization starts todominate which lead to the formation of strongly bound 3D polymeric species[116], decomposing and desorbing at elevated temperatures (i.e. at 194 and 202K).
Figure 3.14: Coverage-dependent TPD profiles for the m/z = 29 desorption chan-nel obtained via acetaldehyde (CH3CHO(g)) adsorption on the clean Au(111)model catalyst surface at 90 K. Inset emphasizes the non-monotonic intensityof the chemisorbed acetaldehyde desorption feature at 139 K as a function ofacetaldehyde coverage.
47
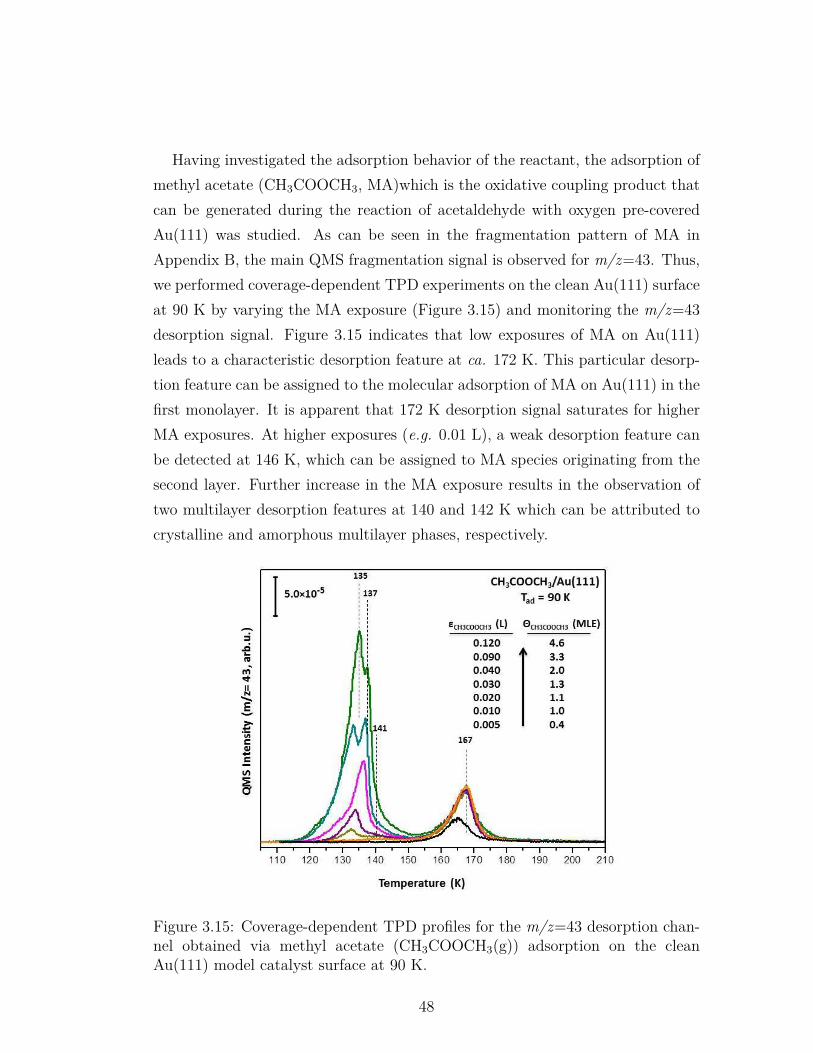
Having investigated the adsorption behavior of the reactant, the adsorption ofmethyl acetate (CH3COOCH3, MA)which is the oxidative coupling product thatcan be generated during the reaction of acetaldehyde with oxygen pre-coveredAu(111) was studied. As can be seen in the fragmentation pattern of MA inAppendix B, the main QMS fragmentation signal is observed for m/z=43. Thus,we performed coverage-dependent TPD experiments on the clean Au(111) surfaceat 90 K by varying the MA exposure (Figure 3.15) and monitoring the m/z=43desorption signal. Figure 3.15 indicates that low exposures of MA on Au(111)leads to a characteristic desorption feature at ca. 172 K. This particular desorp-tion feature can be assigned to the molecular adsorption of MA on Au(111) in thefirst monolayer. It is apparent that 172 K desorption signal saturates for higherMA exposures. At higher exposures (e.g. 0.01 L), a weak desorption feature canbe detected at 146 K, which can be assigned to MA species originating from thesecond layer. Further increase in the MA exposure results in the observation oftwo multilayer desorption features at 140 and 142 K which can be attributed tocrystalline and amorphous multilayer phases, respectively.
Figure 3.15: Coverage-dependent TPD profiles for the m/z=43 desorption chan-nel obtained via methyl acetate (CH3COOCH3(g)) adsorption on the cleanAu(111) model catalyst surface at 90 K.
48
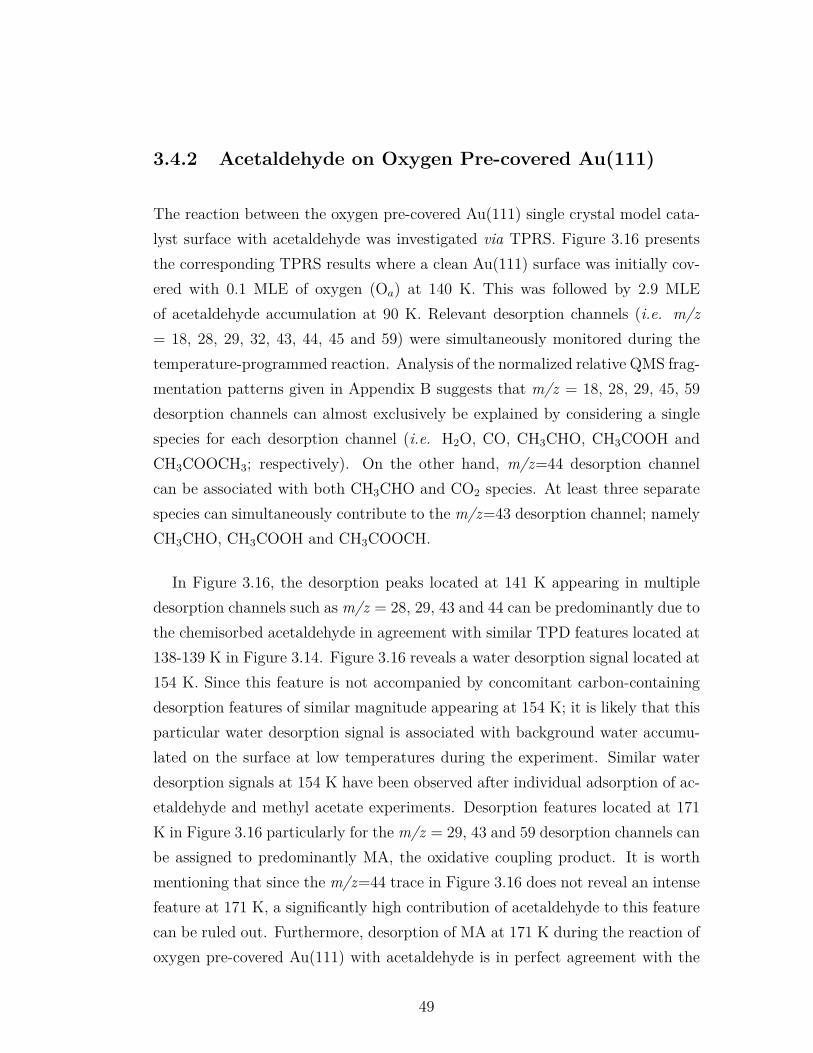
3.4.2 Acetaldehyde on Oxygen Pre-covered Au(111)
The reaction between the oxygen pre-covered Au(111) single crystal model cata-lyst surface with acetaldehyde was investigated via TPRS. Figure 3.16 presentsthe corresponding TPRS results where a clean Au(111) surface was initially cov-ered with 0.1 MLE of oxygen (Oa) at 140 K. This was followed by 2.9 MLEof acetaldehyde accumulation at 90 K. Relevant desorption channels (i.e. m/z= 18, 28, 29, 32, 43, 44, 45 and 59) were simultaneously monitored during thetemperature-programmed reaction. Analysis of the normalized relative QMS frag-mentation patterns given in Appendix B suggests that m/z = 18, 28, 29, 45, 59desorption channels can almost exclusively be explained by considering a singlespecies for each desorption channel (i.e. H2O, CO, CH3CHO, CH3COOH andCH3COOCH3; respectively). On the other hand, m/z=44 desorption channelcan be associated with both CH3CHO and CO2 species. At least three separatespecies can simultaneously contribute to the m/z=43 desorption channel; namelyCH3CHO, CH3COOH and CH3COOCH.
In Figure 3.16, the desorption peaks located at 141 K appearing in multipledesorption channels such as m/z = 28, 29, 43 and 44 can be predominantly due tothe chemisorbed acetaldehyde in agreement with similar TPD features located at138-139 K in Figure 3.14. Figure 3.16 reveals a water desorption signal located at154 K. Since this feature is not accompanied by concomitant carbon-containingdesorption features of similar magnitude appearing at 154 K; it is likely that thisparticular water desorption signal is associated with background water accumu-lated on the surface at low temperatures during the experiment. Similar waterdesorption signals at 154 K have been observed after individual adsorption of ac-etaldehyde and methyl acetate experiments. Desorption features located at 171K in Figure 3.16 particularly for the m/z = 29, 43 and 59 desorption channels canbe assigned to predominantly MA, the oxidative coupling product. It is worthmentioning that since the m/z=44 trace in Figure 3.16 does not reveal an intensefeature at 171 K, a significantly high contribution of acetaldehyde to this featurecan be ruled out. Furthermore, desorption of MA at 171 K during the reaction ofoxygen pre-covered Au(111) with acetaldehyde is in perfect agreement with the
49
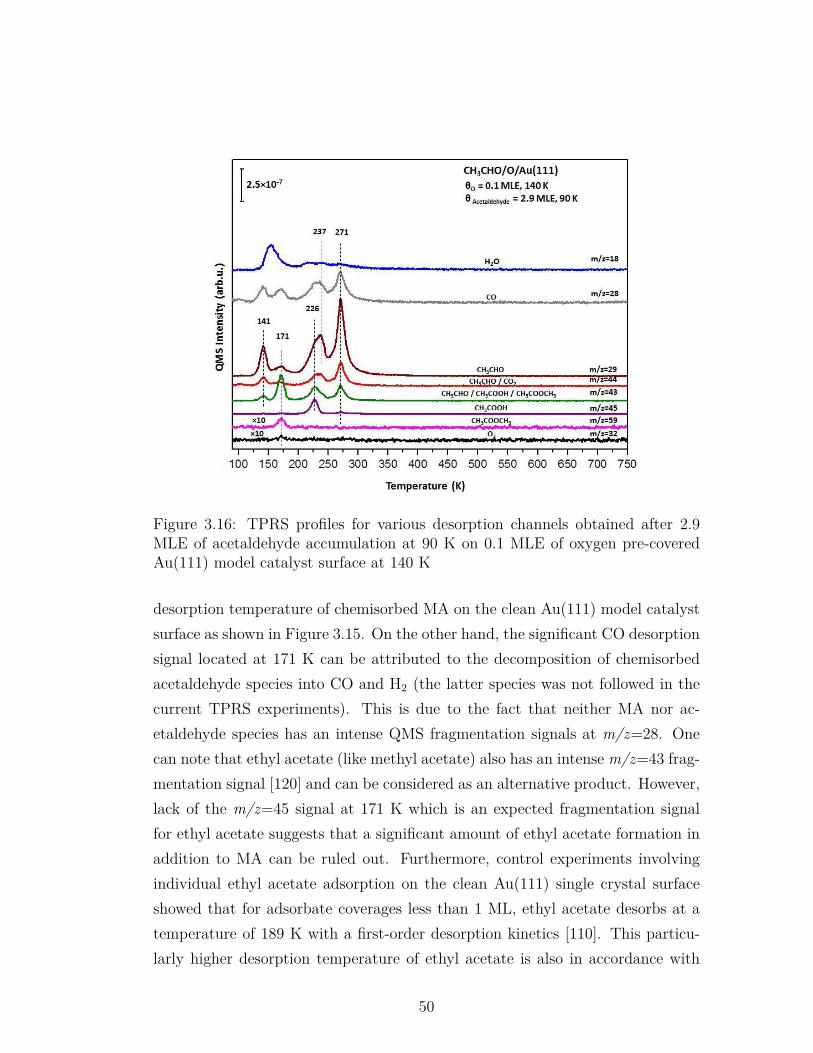
Figure 3.16: TPRS profiles for various desorption channels obtained after 2.9MLE of acetaldehyde accumulation at 90 K on 0.1 MLE of oxygen pre-coveredAu(111) model catalyst surface at 140 K
desorption temperature of chemisorbed MA on the clean Au(111) model catalystsurface as shown in Figure 3.15. On the other hand, the significant CO desorptionsignal located at 171 K can be attributed to the decomposition of chemisorbedacetaldehyde species into CO and H2 (the latter species was not followed in thecurrent TPRS experiments). This is due to the fact that neither MA nor ac-etaldehyde species has an intense QMS fragmentation signals at m/z=28. Onecan note that ethyl acetate (like methyl acetate) also has an intense m/z=43 frag-mentation signal [120] and can be considered as an alternative product. However,lack of the m/z=45 signal at 171 K which is an expected fragmentation signalfor ethyl acetate suggests that a significant amount of ethyl acetate formation inaddition to MA can be ruled out. Furthermore, control experiments involvingindividual ethyl acetate adsorption on the clean Au(111) single crystal surfaceshowed that for adsorbate coverages less than 1 ML, ethyl acetate desorbs at atemperature of 189 K with a first-order desorption kinetics [110]. This particu-larly higher desorption temperature of ethyl acetate is also in accordance with
50
the interpretation that the 171 K feature in the m/z=43 trace of Figure 3.16 ispredominantly associated with MA rather than ethyl acetate.
Figure 3.16 shows that at higher temperatures, TPRS data reveal a distinctdesorption feature at 226 K for the m/z=45 channel which is exclusively associ-ated with acetic acid. It is worth mentioning that this particular feature cannotbe attributed to diethyl ether; since there is no detectable feature in the m/z=59TPRS channel of Figure 3.16 at 226 K. Influence of the acetic acid desorption isalso visible in other relevant desorption traces such as m/z=29, 43, 44. Howeverbehavior of m/z=29, 43, 44 at T ≥ 200 K is more complex due to the contribu-tion to these desorption channels from the desorption products of polymerizedacetaldehyde species as well as decomposed acetic acid [121]. On the other hand,the desorption signals appearing at 237 K in m/z=28, 29, 43, 44 traces of Figure3.16 have a smaller contribution from acetic acid due to the lack of the m/z=45desorption signal at 237 K and reflect a convoluted identity that can be associ-ated with acetaldehyde and CO2. However, lack of a significant H2O desorptionsignal (i.e. m/z=18 in Figure 3.16) within the temperature window of 200-300K suggest that total oxidation is not significant under such reaction conditions.Finally increasing the reaction temperature to 271 K leads to the evolution ofstrong desorption signals which can be originating from the decomposition ofpolymerization products of acetaldehyde as well as the decomposition of aceticacid. It is worth mentioning that no significant O2 (i.e. m/z=32) desorption wasdetected throughout the TPRS experiments given in Figure 3.16.
As a result, surface atomic oxygen (Oa) reacts with acetaldehyde on Au(111)surface and yields two different partial oxidation products namely, methyl acetateand acetic acid without the formation of significant quantities of carbon dioxide.Since the formation of methyl acetate as the oxidative coupling reaction productimplies C-C bond activation; it was demonstrated that Oa containing Au(111)single crystal model catalyst surface can activate C-C bonds.
51
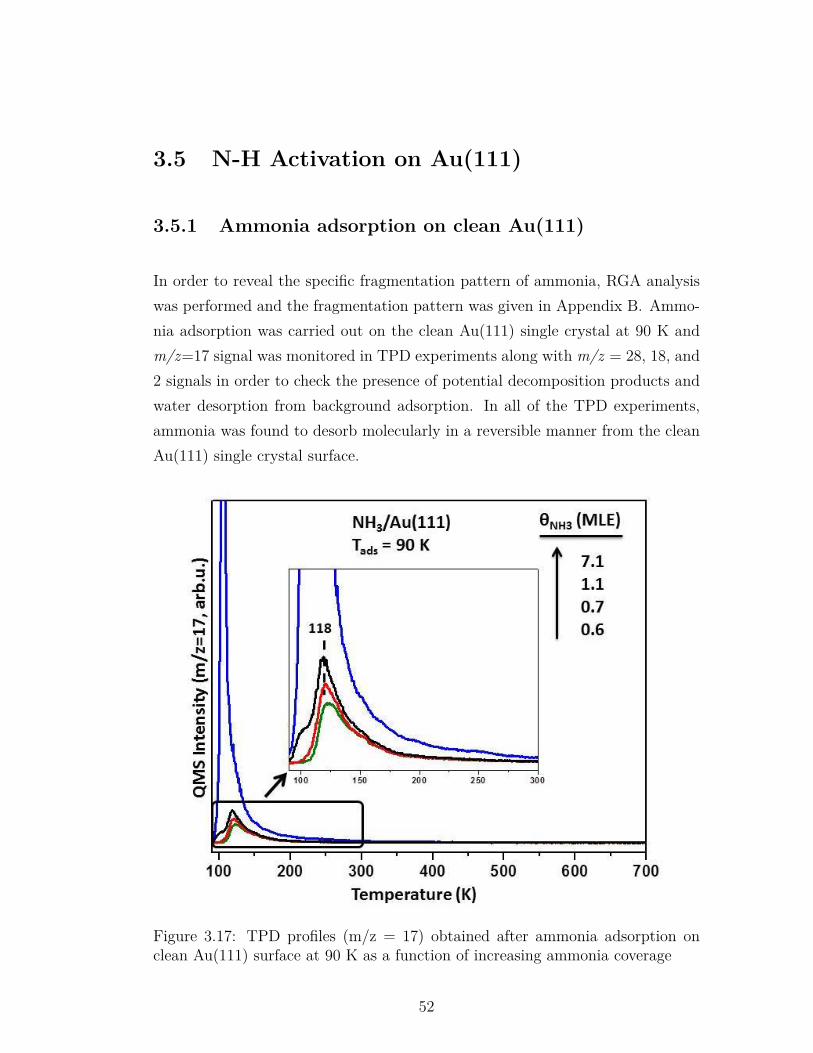
3.5 N-H Activation on Au(111)
3.5.1 Ammonia adsorption on clean Au(111)
In order to reveal the specific fragmentation pattern of ammonia, RGA analysiswas performed and the fragmentation pattern was given in Appendix B. Ammo-nia adsorption was carried out on the clean Au(111) single crystal at 90 K andm/z=17 signal was monitored in TPD experiments along with m/z = 28, 18, and2 signals in order to check the presence of potential decomposition products andwater desorption from background adsorption. In all of the TPD experiments,ammonia was found to desorb molecularly in a reversible manner from the cleanAu(111) single crystal surface.
Figure 3.17: TPD profiles (m/z = 17) obtained after ammonia adsorption onclean Au(111) surface at 90 K as a function of increasing ammonia coverage
52
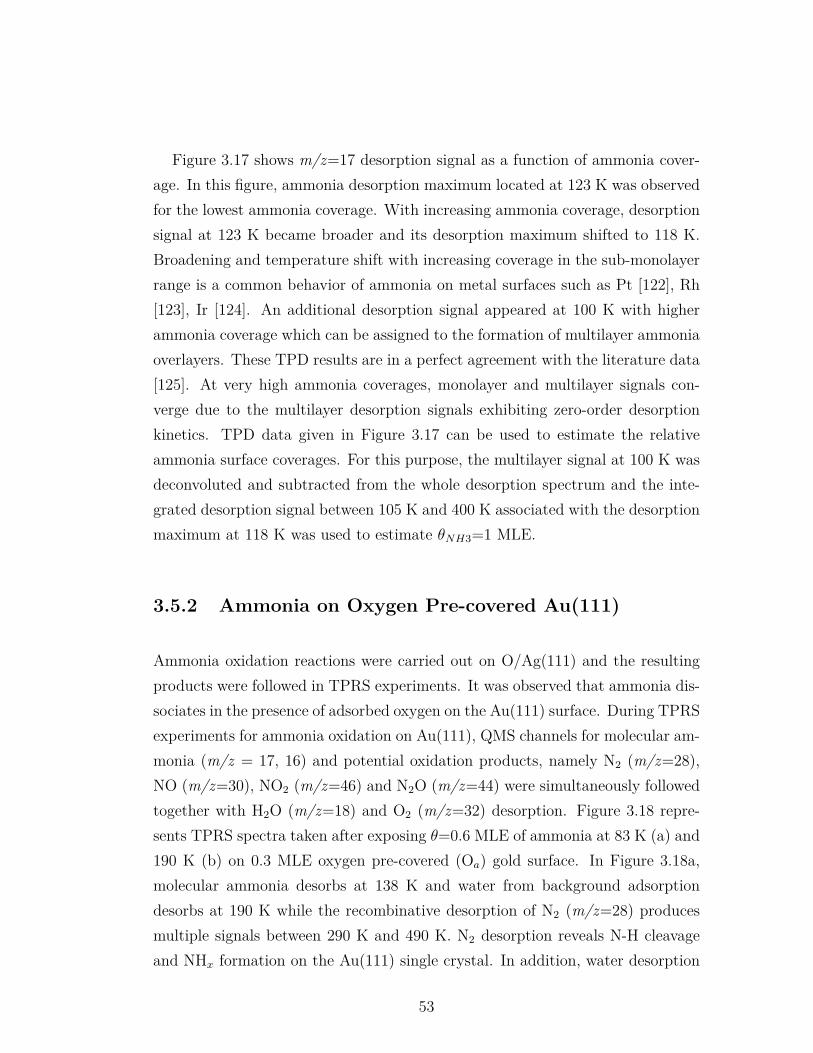
Figure 3.17 shows m/z=17 desorption signal as a function of ammonia cover-age. In this figure, ammonia desorption maximum located at 123 K was observedfor the lowest ammonia coverage. With increasing ammonia coverage, desorptionsignal at 123 K became broader and its desorption maximum shifted to 118 K.Broadening and temperature shift with increasing coverage in the sub-monolayerrange is a common behavior of ammonia on metal surfaces such as Pt [122], Rh[123], Ir [124]. An additional desorption signal appeared at 100 K with higherammonia coverage which can be assigned to the formation of multilayer ammoniaoverlayers. These TPD results are in a perfect agreement with the literature data[125]. At very high ammonia coverages, monolayer and multilayer signals con-verge due to the multilayer desorption signals exhibiting zero-order desorptionkinetics. TPD data given in Figure 3.17 can be used to estimate the relativeammonia surface coverages. For this purpose, the multilayer signal at 100 K wasdeconvoluted and subtracted from the whole desorption spectrum and the inte-grated desorption signal between 105 K and 400 K associated with the desorptionmaximum at 118 K was used to estimate θNH3=1 MLE.
3.5.2 Ammonia on Oxygen Pre-covered Au(111)
Ammonia oxidation reactions were carried out on O/Ag(111) and the resultingproducts were followed in TPRS experiments. It was observed that ammonia dis-sociates in the presence of adsorbed oxygen on the Au(111) surface. During TPRSexperiments for ammonia oxidation on Au(111), QMS channels for molecular am-monia (m/z = 17, 16) and potential oxidation products, namely N2 (m/z=28),NO (m/z=30), NO2 (m/z=46) and N2O (m/z=44) were simultaneously followedtogether with H2O (m/z=18) and O2 (m/z=32) desorption. Figure 3.18 repre-sents TPRS spectra taken after exposing θ=0.6 MLE of ammonia at 83 K (a) and190 K (b) on 0.3 MLE oxygen pre-covered (Oa) gold surface. In Figure 3.18a,molecular ammonia desorbs at 138 K and water from background adsorptiondesorbs at 190 K while the recombinative desorption of N2 (m/z=28) producesmultiple signals between 290 K and 490 K. N2 desorption reveals N-H cleavageand NHx formation on the Au(111) single crystal. In addition, water desorption
53
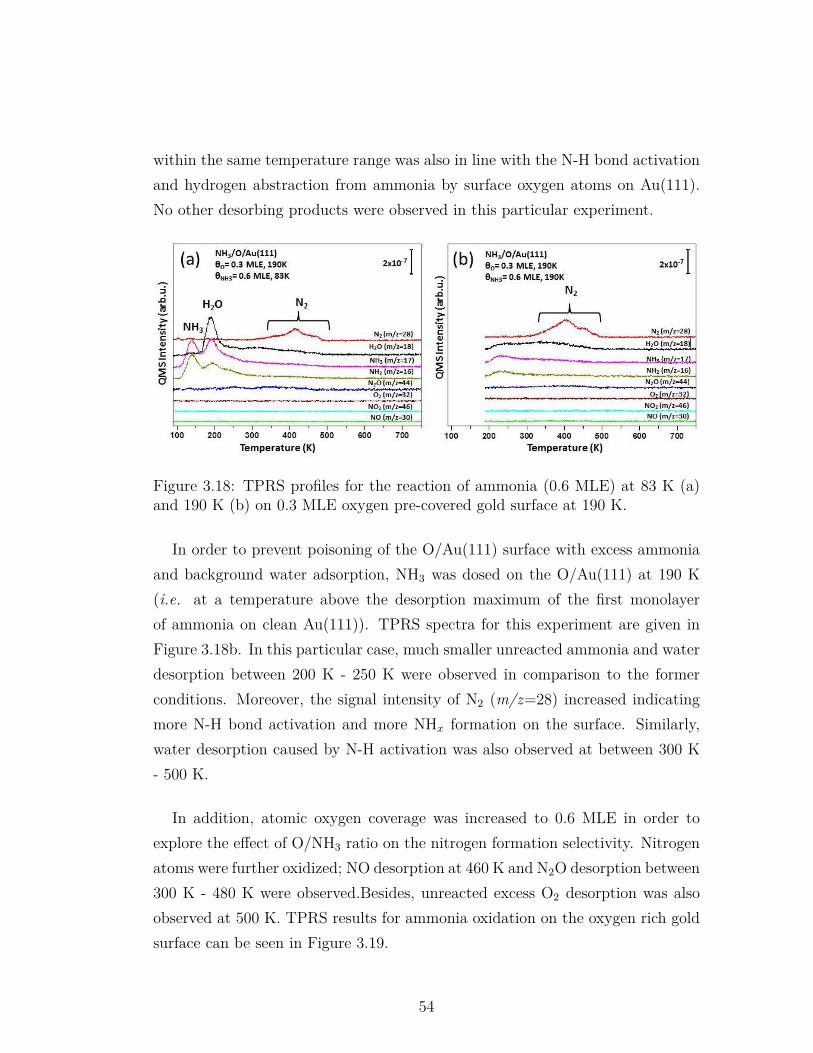
within the same temperature range was also in line with the N-H bond activationand hydrogen abstraction from ammonia by surface oxygen atoms on Au(111).No other desorbing products were observed in this particular experiment.
Figure 3.18: TPRS profiles for the reaction of ammonia (0.6 MLE) at 83 K (a)and 190 K (b) on 0.3 MLE oxygen pre-covered gold surface at 190 K.
In order to prevent poisoning of the O/Au(111) surface with excess ammoniaand background water adsorption, NH3 was dosed on the O/Au(111) at 190 K(i.e. at a temperature above the desorption maximum of the first monolayerof ammonia on clean Au(111)). TPRS spectra for this experiment are given inFigure 3.18b. In this particular case, much smaller unreacted ammonia and waterdesorption between 200 K - 250 K were observed in comparison to the formerconditions. Moreover, the signal intensity of N2 (m/z=28) increased indicatingmore N-H bond activation and more NHx formation on the surface. Similarly,water desorption caused by N-H activation was also observed at between 300 K- 500 K.
In addition, atomic oxygen coverage was increased to 0.6 MLE in order toexplore the effect of O/NH3 ratio on the nitrogen formation selectivity. Nitrogenatoms were further oxidized; NO desorption at 460 K and N2O desorption between300 K - 480 K were observed.Besides, unreacted excess O2 desorption was alsoobserved at 500 K. TPRS results for ammonia oxidation on the oxygen rich goldsurface can be seen in Figure 3.19.
54
Figure 3.19: TPRS profiles for the reaction of ammonia (0.6 MLE) at 190 K on0.6 MLE oxygen pre-covered gold surface at 190 K.
As a result, surface oxygen atom (Oa) activates N-H bond in ammonia moleculeand selectively yields N2 without any other oxidation products such as NO andN2O for low coverage. The selectivity of the ammonia oxidation reaction to theproducts can be tuned by the oxygen quantity.
55
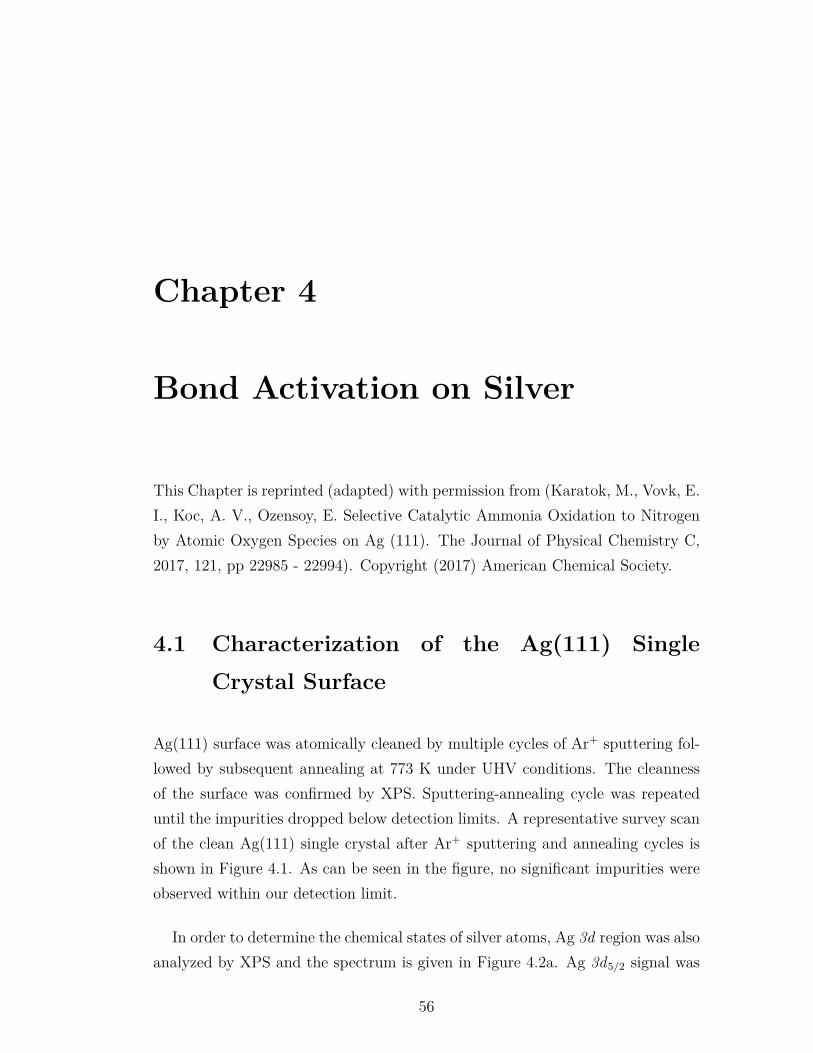
Chapter 4
Bond Activation on Silver
This Chapter is reprinted (adapted) with permission from (Karatok, M., Vovk, E.I., Koc, A. V., Ozensoy, E. Selective Catalytic Ammonia Oxidation to Nitrogenby Atomic Oxygen Species on Ag (111). The Journal of Physical Chemistry C,2017, 121, pp 22985 - 22994). Copyright (2017) American Chemical Society.
4.1 Characterization of the Ag(111) SingleCrystal Surface
Ag(111) surface was atomically cleaned by multiple cycles of Ar+ sputtering fol-lowed by subsequent annealing at 773 K under UHV conditions. The cleannessof the surface was confirmed by XPS. Sputtering-annealing cycle was repeateduntil the impurities dropped below detection limits. A representative survey scanof the clean Ag(111) single crystal after Ar+ sputtering and annealing cycles isshown in Figure 4.1. As can be seen in the figure, no significant impurities wereobserved within our detection limit.
In order to determine the chemical states of silver atoms, Ag 3d region was alsoanalyzed by XPS and the spectrum is given in Figure 4.2a. Ag 3d5/2 signal was
56
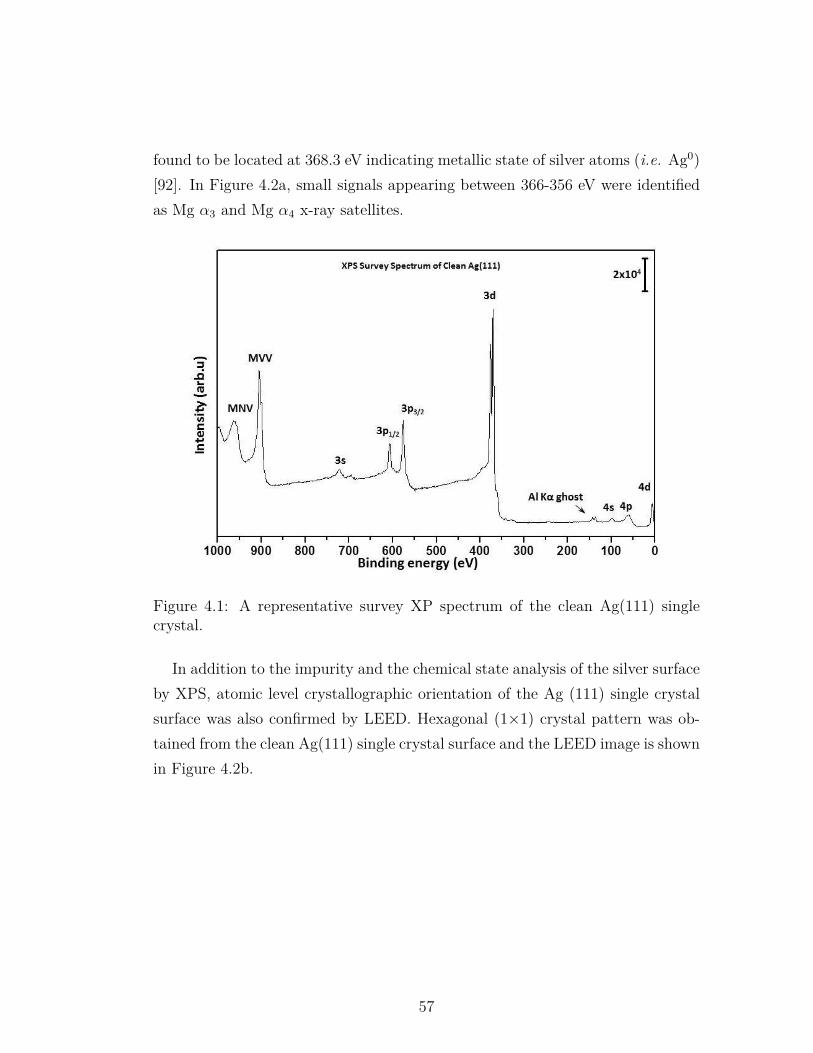
found to be located at 368.3 eV indicating metallic state of silver atoms (i.e. Ag0)[92]. In Figure 4.2a, small signals appearing between 366-356 eV were identifiedas Mg α3 and Mg α4 x-ray satellites.
Figure 4.1: A representative survey XP spectrum of the clean Ag(111) singlecrystal.
In addition to the impurity and the chemical state analysis of the silver surfaceby XPS, atomic level crystallographic orientation of the Ag (111) single crystalsurface was also confirmed by LEED. Hexagonal (1×1) crystal pattern was ob-tained from the clean Ag(111) single crystal surface and the LEED image is shownin Figure 4.2b.
57
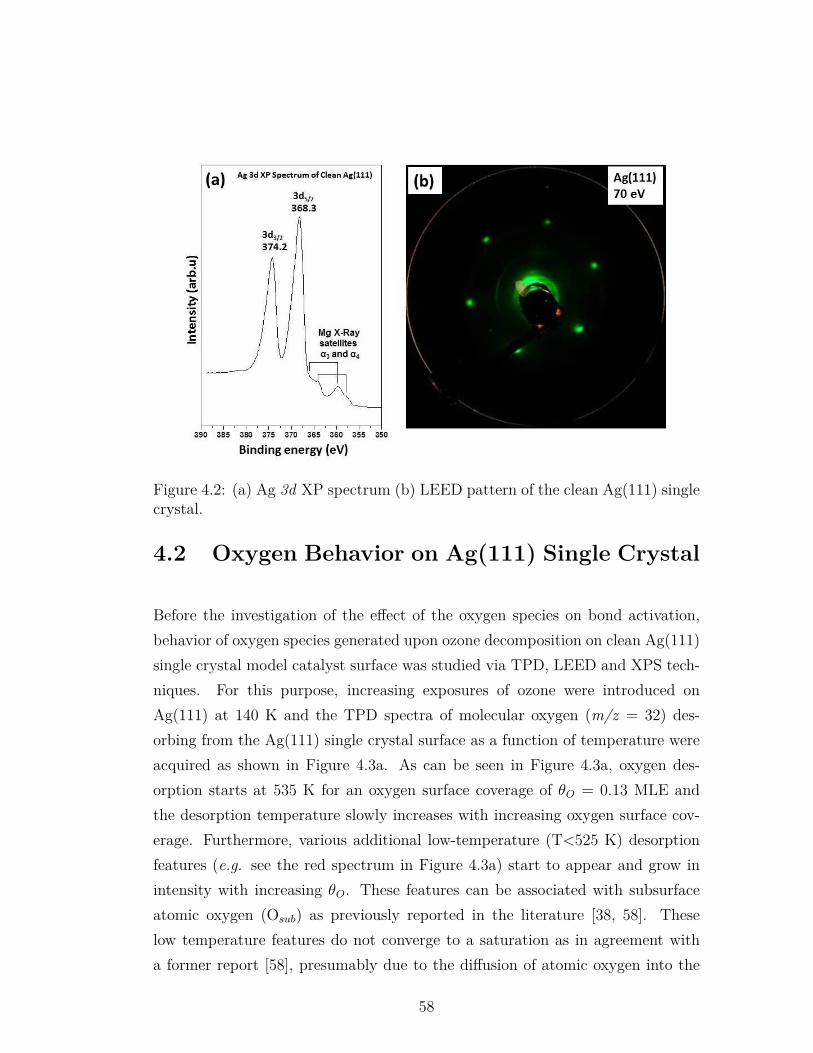
Figure 4.2: (a) Ag 3d XP spectrum (b) LEED pattern of the clean Ag(111) singlecrystal.
4.2 Oxygen Behavior on Ag(111) Single Crystal
Before the investigation of the effect of the oxygen species on bond activation,behavior of oxygen species generated upon ozone decomposition on clean Ag(111)single crystal model catalyst surface was studied via TPD, LEED and XPS tech-niques. For this purpose, increasing exposures of ozone were introduced onAg(111) at 140 K and the TPD spectra of molecular oxygen (m/z = 32) des-orbing from the Ag(111) single crystal surface as a function of temperature wereacquired as shown in Figure 4.3a. As can be seen in Figure 4.3a, oxygen des-orption starts at 535 K for an oxygen surface coverage of θO = 0.13 MLE andthe desorption temperature slowly increases with increasing oxygen surface cov-erage. Furthermore, various additional low-temperature (T<525 K) desorptionfeatures (e.g. see the red spectrum in Figure 4.3a) start to appear and grow inintensity with increasing θO. These features can be associated with subsurfaceatomic oxygen (Osub) as previously reported in the literature [38, 58]. Theselow temperature features do not converge to a saturation as in agreement witha former report [58], presumably due to the diffusion of atomic oxygen into the
58
subsurface. Campbell et al. argued that oxygen atoms could be more stable onthe silver surface rather than in bulk silver oxide based on the heat of adsorptionof oxygen atoms on Ag(111) as compared to the heat of formation of bulk silveroxide [38]. Therefore, bulk oxide formation due to oxygen diffusion to the silversubsurface seems to be rather unlikely at low oxygen coverages. However forma-tion of bulk-silver oxide at high oxygen coverages is feasible and will be discussedin more detail below. Along these lines, by exploiting isotopically labeled oxygenmolecules, Backx et al. showed that subsurface oxygen in the Ag(110) surfacedesorbs at lower temperatures than the surface oxygen atoms [126]. TPD data forO/Ag(111) (Figure 4.3a) obtained via ozone decomposition is in good agreementwith a former study, where NO2 decomposition was utilized for atomic oxygendelivery on Ag(111) [127].
Integrated TPD signals corresponding to surface (Oa) and subsurface (Osub)oxygen species in Figure 4.3a were also calculated individually and plotted as afunction of ozone exposure (Figure 4.3b). In this latter plot, monolayer coveragereaches a plateau around 0.04 L which may be attributed to the saturation of thefirst overlayer on the surface. The absolute surface saturation coverage of the firstoxygen monolayer on Ag(111) was previously calculated by Campbell et al. [38]for a (4x4)-O/Ag(111) surface structure at this coverage. It is worth mentioningthat in the current work, (4x4)-O/Ag(111) structure was not observed in any ofthe investigated coverages, because this structure is not stable when oxygen isaccumulated under UHV conditions [60, 61]. Nevertheless, in the current work,the saturation exposure of 0.04 L was attributed to 1 MLE and was used tocalibrate and quantify other desorption signals. As can be seen in Figure 4.3b,for the ozone exposures above 0.08 L, surface oxygen coverage starts to exceedthe convergence coverage of 1 MLE. This can be explained by the transformationof the surface oxygen overlayer to form a new structure with a higher oxygendensity. We tentatively assign this latter structure to a bulk-like silver oxide.
Analysis of the Ag(111) single crystal surface after various ozone exposuresat 140 K by LEED revealed no ordered structures suggesting randomly locatedoxygen species at 140 K for all oxygen coverages. However, annealing of the
59
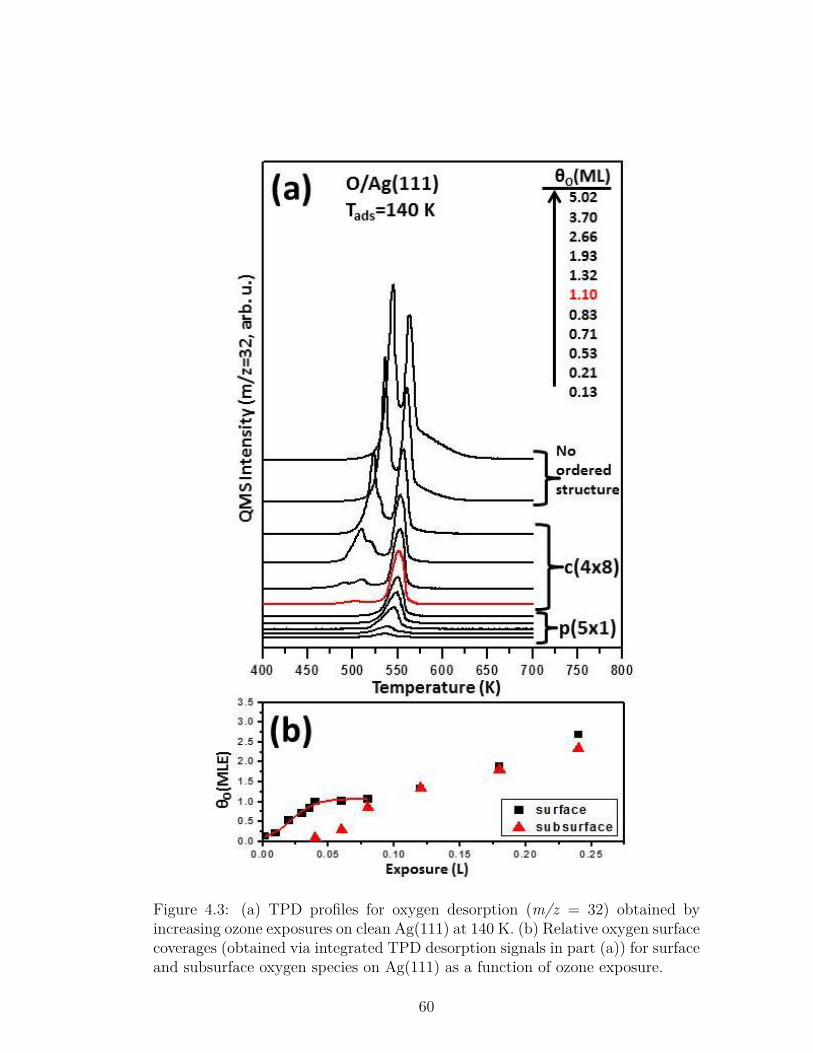
Figure 4.3: (a) TPD profiles for oxygen desorption (m/z = 32) obtained byincreasing ozone exposures on clean Ag(111) at 140 K. (b) Relative oxygen surfacecoverages (obtained via integrated TPD desorption signals in part (a)) for surfaceand subsurface oxygen species on Ag(111) as a function of ozone exposure.
60
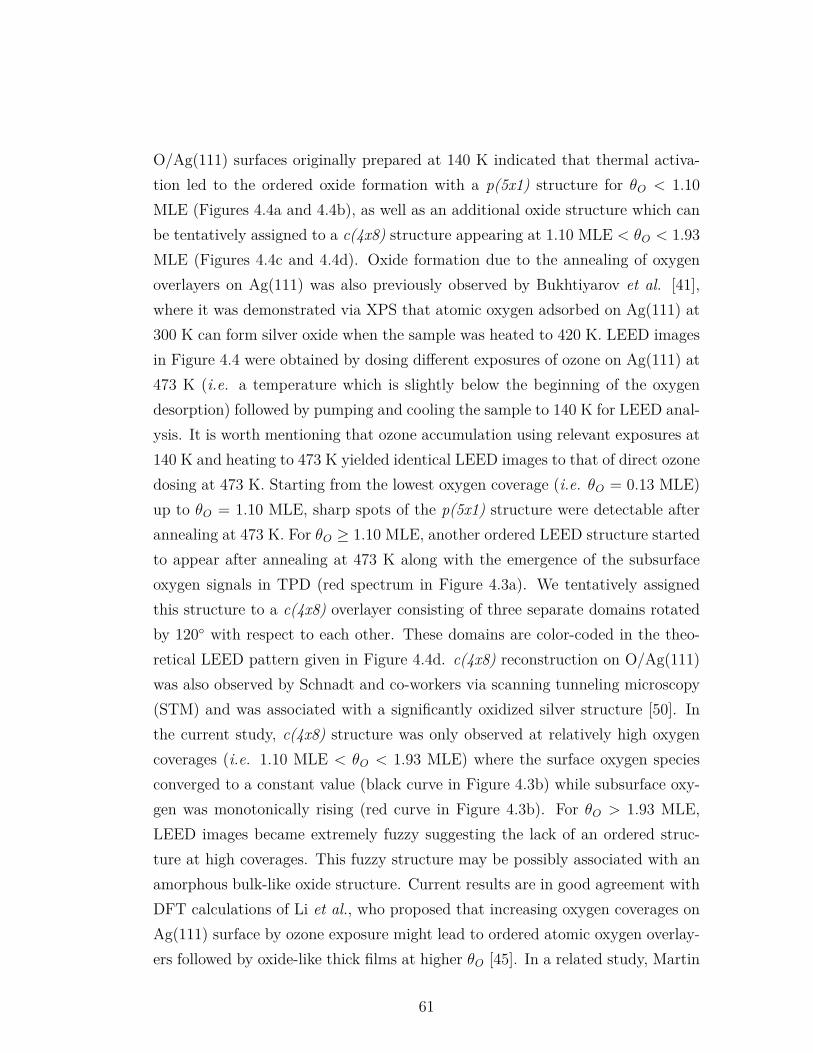
O/Ag(111) surfaces originally prepared at 140 K indicated that thermal activa-tion led to the ordered oxide formation with a p(5x1) structure for θO < 1.10MLE (Figures 4.4a and 4.4b), as well as an additional oxide structure which canbe tentatively assigned to a c(4x8) structure appearing at 1.10 MLE < θO < 1.93MLE (Figures 4.4c and 4.4d). Oxide formation due to the annealing of oxygenoverlayers on Ag(111) was also previously observed by Bukhtiyarov et al. [41],where it was demonstrated via XPS that atomic oxygen adsorbed on Ag(111) at300 K can form silver oxide when the sample was heated to 420 K. LEED imagesin Figure 4.4 were obtained by dosing different exposures of ozone on Ag(111) at473 K (i.e. a temperature which is slightly below the beginning of the oxygendesorption) followed by pumping and cooling the sample to 140 K for LEED anal-ysis. It is worth mentioning that ozone accumulation using relevant exposures at140 K and heating to 473 K yielded identical LEED images to that of direct ozonedosing at 473 K. Starting from the lowest oxygen coverage (i.e. θO = 0.13 MLE)up to θO = 1.10 MLE, sharp spots of the p(5x1) structure were detectable afterannealing at 473 K. For θO ≥ 1.10 MLE, another ordered LEED structure startedto appear after annealing at 473 K along with the emergence of the subsurfaceoxygen signals in TPD (red spectrum in Figure 4.3a). We tentatively assignedthis structure to a c(4x8) overlayer consisting of three separate domains rotatedby 120◦ with respect to each other. These domains are color-coded in the theo-retical LEED pattern given in Figure 4.4d. c(4x8) reconstruction on O/Ag(111)was also observed by Schnadt and co-workers via scanning tunneling microscopy(STM) and was associated with a significantly oxidized silver structure [50]. Inthe current study, c(4x8) structure was only observed at relatively high oxygencoverages (i.e. 1.10 MLE < θO < 1.93 MLE) where the surface oxygen speciesconverged to a constant value (black curve in Figure 4.3b) while subsurface oxy-gen was monotonically rising (red curve in Figure 4.3b). For θO > 1.93 MLE,LEED images became extremely fuzzy suggesting the lack of an ordered struc-ture at high coverages. This fuzzy structure may be possibly associated with anamorphous bulk-like oxide structure. Current results are in good agreement withDFT calculations of Li et al., who proposed that increasing oxygen coverages onAg(111) surface by ozone exposure might lead to ordered atomic oxygen overlay-ers followed by oxide-like thick films at higher θO [45]. In a related study, Martin
61
et al. deposited atomic oxygen on Ag(111) by thermal cracking of O2 (g) at 500K with PO2 = 10−7 mbar [57]. They reported bulk-like silver oxide formation athigh θO and argued that c(4x8) overlayer is the precursor state for bulk-like silveroxide formation.
Figure 4.4: LEED images of O/Ag(111) overlayers obtained by introducing differ-ent ozone exposures at 140 K on clean Ag(111) surface followed by pumping andannealing to 473 K in UHV. (a) LEED image of the p(5x1)-O/Ag(111) overlayer(θO = 0.83 MLE) and (b) its simulated (theoretical) LEED pattern. (c) LEEDimage of the c(4x8)-O/Ag(111) overlayer (θO = 1.10 MLE) and (d) its simulated(theoretical) LEED pattern.
Oxygen accumulation on the Ag(111) surface at 140 K was also analyzed byXPS. O 1s spectra of the O/Ag(111) surface as a function of increasing oxygencoverage is given in Figure 4.5. Due to the detection limit of our photoelectron
62
detector, we were able to observe a reliable O 1s signal at θO ≥ 0.53 MLE. Signalsin the region between 530-531 eV were assigned to atomic oxygen either on thesurface (Oa) or in the subsurface (Osub), whereas surface oxide (Oox) signals werefound between 528.1-528.5 eV [38, 39, 40, 41, 42, 50, 56, 60, 63, 127, 128]. Asmentioned above, ordered surface oxide (Oox) species were not detectable at 140K according to LEED experiments. Schlogl and coworkers previously reportedthat O 1s signal of bulk silver oxide appeared at 529.0 eV [51]. In another study,Heine et al. assigned an O 1s signal at 528.9 eV to silver oxide species at the stepedges of the Ag(111) surface [60] and suggested that subsurface oxygen increasesthe step density of the Ag(111) surface. In Figure 4.5, a noticeable increase inthe O 1s signal at ca. 529 eV is visible at θO ≥ 1.10 MLE (i.e. in correlation withthe appearance of the subsurface oxygen features in TPD data given in Figure4.3a). This O 1s feature at ca. 529 eV may be associated with disordered oxideand/or amorphous bulk-like oxide (Obulk) species. Indications of the formation ofbulk-like silver oxide species were also present in the Ag 3d XPS spectra (Figure4.6) revealing a broadening in the full width at half maximum (FWHM) of the Ag3d peak with increasing oxygen coverages θO > 1.90 MLE. Broadening of the Ag3d XPS signal due to the formation of silver oxide was also previously reportedby Bukhtiyarov et al. [41].
Inset in the right hand side of Figure 4.5 shows the variation of the O 1s/Ag 3dintegrated signal ratios in XPS as a function of oxygen coverage calculated fromthe ozone exposure values using the TPD data in Figure 4.3. It is apparent thatthe O 1s/Ag 3d integrated signal ratio reaches a convergence for θO ≥ 3.70 MLE(Figure 4.5) while total m/z = 32 TPD desorption signal intensity still continuesto increase within this coverage window (Figure 4.3b). These observations mayindicate continuous transport of oxygen species towards the subsurface region(i.e. possibly below 10 nm of the surface) of the O/Ag(111) system at highoxygen coverages which cannot be readily detectable by the surface-sensitive XPStechnique. It should be noted that x-ray induced oxygen desorption during XPSanalysis could also contribute to the high-coverage convergence of the O 1s/Ag3d signal ratio.
63
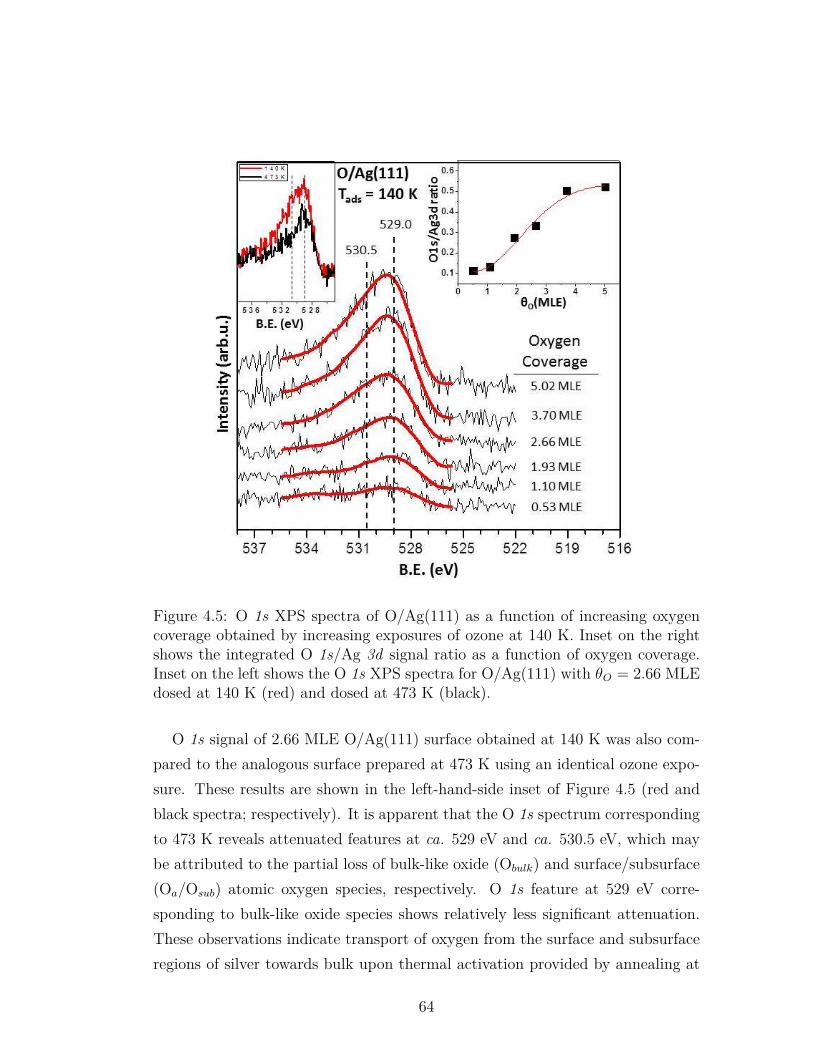
Figure 4.5: O 1s XPS spectra of O/Ag(111) as a function of increasing oxygencoverage obtained by increasing exposures of ozone at 140 K. Inset on the rightshows the integrated O 1s/Ag 3d signal ratio as a function of oxygen coverage.Inset on the left shows the O 1s XPS spectra for O/Ag(111) with θO = 2.66 MLEdosed at 140 K (red) and dosed at 473 K (black).
O 1s signal of 2.66 MLE O/Ag(111) surface obtained at 140 K was also com-pared to the analogous surface prepared at 473 K using an identical ozone expo-sure. These results are shown in the left-hand-side inset of Figure 4.5 (red andblack spectra; respectively). It is apparent that the O 1s spectrum correspondingto 473 K reveals attenuated features at ca. 529 eV and ca. 530.5 eV, which maybe attributed to the partial loss of bulk-like oxide (Obulk) and surface/subsurface(Oa/Osub) atomic oxygen species, respectively. O 1s feature at 529 eV corre-sponding to bulk-like oxide species shows relatively less significant attenuation.These observations indicate transport of oxygen from the surface and subsurfaceregions of silver towards bulk upon thermal activation provided by annealing at
64
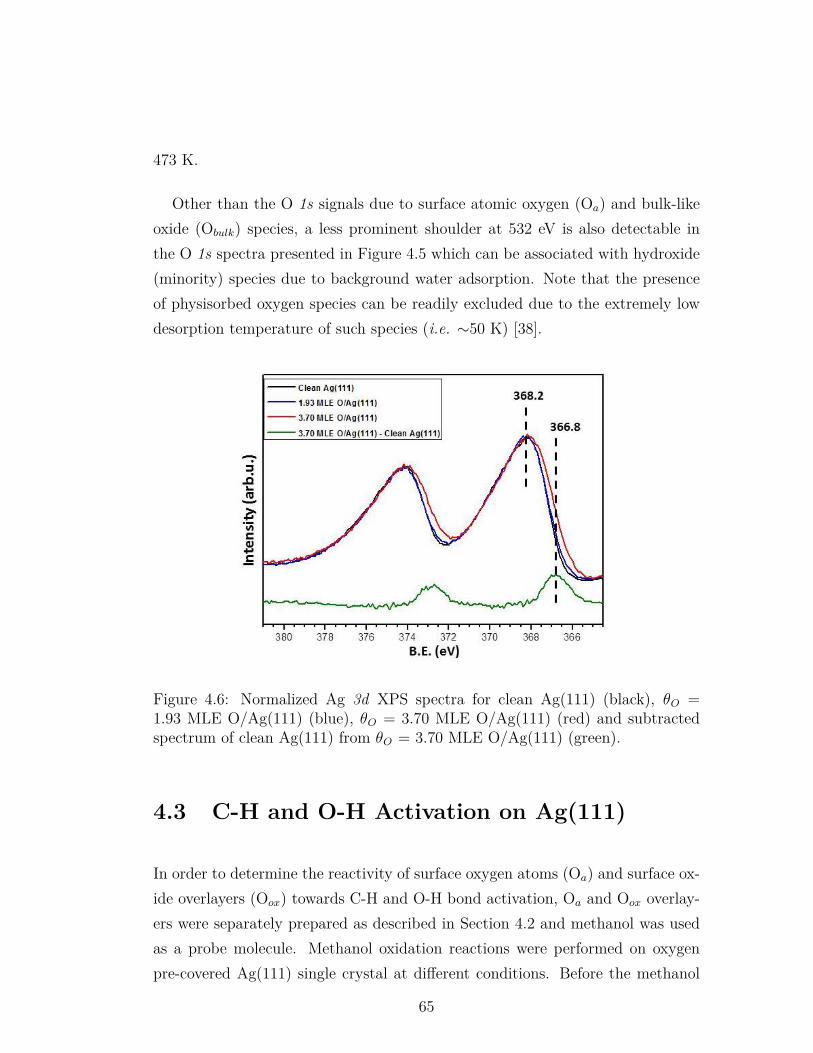
473 K.
Other than the O 1s signals due to surface atomic oxygen (Oa) and bulk-likeoxide (Obulk) species, a less prominent shoulder at 532 eV is also detectable inthe O 1s spectra presented in Figure 4.5 which can be associated with hydroxide(minority) species due to background water adsorption. Note that the presenceof physisorbed oxygen species can be readily excluded due to the extremely lowdesorption temperature of such species (i.e. ∼50 K) [38].
Figure 4.6: Normalized Ag 3d XPS spectra for clean Ag(111) (black), θO =1.93 MLE O/Ag(111) (blue), θO = 3.70 MLE O/Ag(111) (red) and subtractedspectrum of clean Ag(111) from θO = 3.70 MLE O/Ag(111) (green).
4.3 C-H and O-H Activation on Ag(111)
In order to determine the reactivity of surface oxygen atoms (Oa) and surface ox-ide overlayers (Oox) towards C-H and O-H bond activation, Oa and Oox overlay-ers were separately prepared as described in Section 4.2 and methanol was usedas a probe molecule. Methanol oxidation reactions were performed on oxygenpre-covered Ag(111) single crystal at different conditions. Before the methanol
65
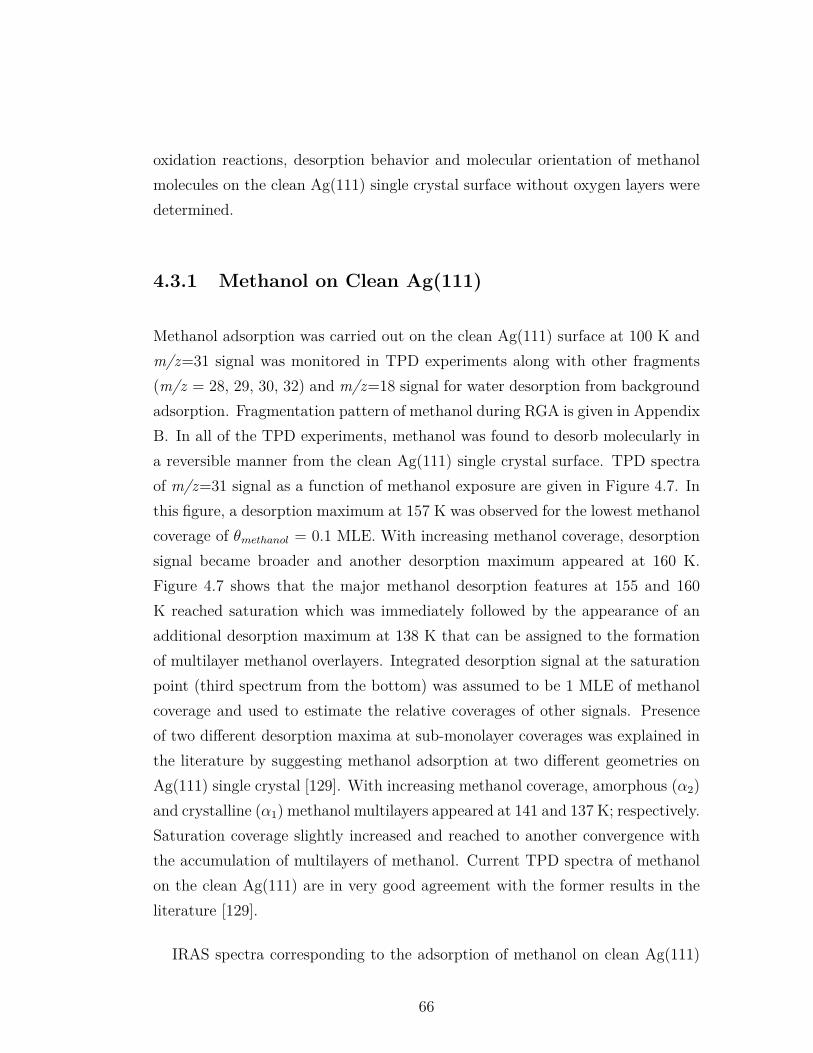
oxidation reactions, desorption behavior and molecular orientation of methanolmolecules on the clean Ag(111) single crystal surface without oxygen layers weredetermined.
4.3.1 Methanol on Clean Ag(111)
Methanol adsorption was carried out on the clean Ag(111) surface at 100 K andm/z=31 signal was monitored in TPD experiments along with other fragments(m/z = 28, 29, 30, 32) and m/z=18 signal for water desorption from backgroundadsorption. Fragmentation pattern of methanol during RGA is given in AppendixB. In all of the TPD experiments, methanol was found to desorb molecularly ina reversible manner from the clean Ag(111) single crystal surface. TPD spectraof m/z=31 signal as a function of methanol exposure are given in Figure 4.7. Inthis figure, a desorption maximum at 157 K was observed for the lowest methanolcoverage of θmethanol = 0.1 MLE. With increasing methanol coverage, desorptionsignal became broader and another desorption maximum appeared at 160 K.Figure 4.7 shows that the major methanol desorption features at 155 and 160K reached saturation which was immediately followed by the appearance of anadditional desorption maximum at 138 K that can be assigned to the formationof multilayer methanol overlayers. Integrated desorption signal at the saturationpoint (third spectrum from the bottom) was assumed to be 1 MLE of methanolcoverage and used to estimate the relative coverages of other signals. Presenceof two different desorption maxima at sub-monolayer coverages was explained inthe literature by suggesting methanol adsorption at two different geometries onAg(111) single crystal [129]. With increasing methanol coverage, amorphous (α2)and crystalline (α1) methanol multilayers appeared at 141 and 137 K; respectively.Saturation coverage slightly increased and reached to another convergence withthe accumulation of multilayers of methanol. Current TPD spectra of methanolon the clean Ag(111) are in very good agreement with the former results in theliterature [129].
IRAS spectra corresponding to the adsorption of methanol on clean Ag(111)
66
Figure 4.7: TPD profiles (m/z = 31) obtained after methanol adsorption on cleanAg(111) surface at 100 K as a function of increasing methanol coverage.
for various coverages of methanol at 100 K are given in Figure 4.8. For the lowestcoverage of methanol (θmethanol = 0.1 MLE), symmetric (νs) and antisymmetric(νas) CH3 stretching signals appeared at 2820 cm−1 and 2953 cm−1, respectively[130]. For 1.0 MLE methanol coverage, νas signal shifted to 2943 cm−1 andantisymmetric deformation overtone (2δas) at 2917 cm−1 became more prominent.C-O stretching signal observed for both 0.2 and 1.0 MLE coverages of methanolat 1022 cm−1 and 1035 cm−1, respectively. These C-H and C-O stretching signalsand the lack of O-H signals for submonolayer methanol coverages (θmethanol ≤0.1 MLE) indicate that C-O bond axis in methanol molecule stays perpendicularto the silver surface; while O-H bond axis locates parallel to the surface. Formultilayer methanol coverages(θmethanol = 1.6 and 4.7 MLE), νas (CH) signalsbroaden and two νs signals appeared at 2830 cm−1 and 2806 cm−1 suggestingvariations in adsorption geometry of methanol in the multilayer coverage. Inaddition, broad ν (OH) band at 3297 cm−1 and ν (CO) signals at 1038 cm−1
and 1049 cm−1 for θmethanol = 1.6 and 4.7 MLE coverages confirm the variousadsorption geometries in the multilayer adsorption regime.
67
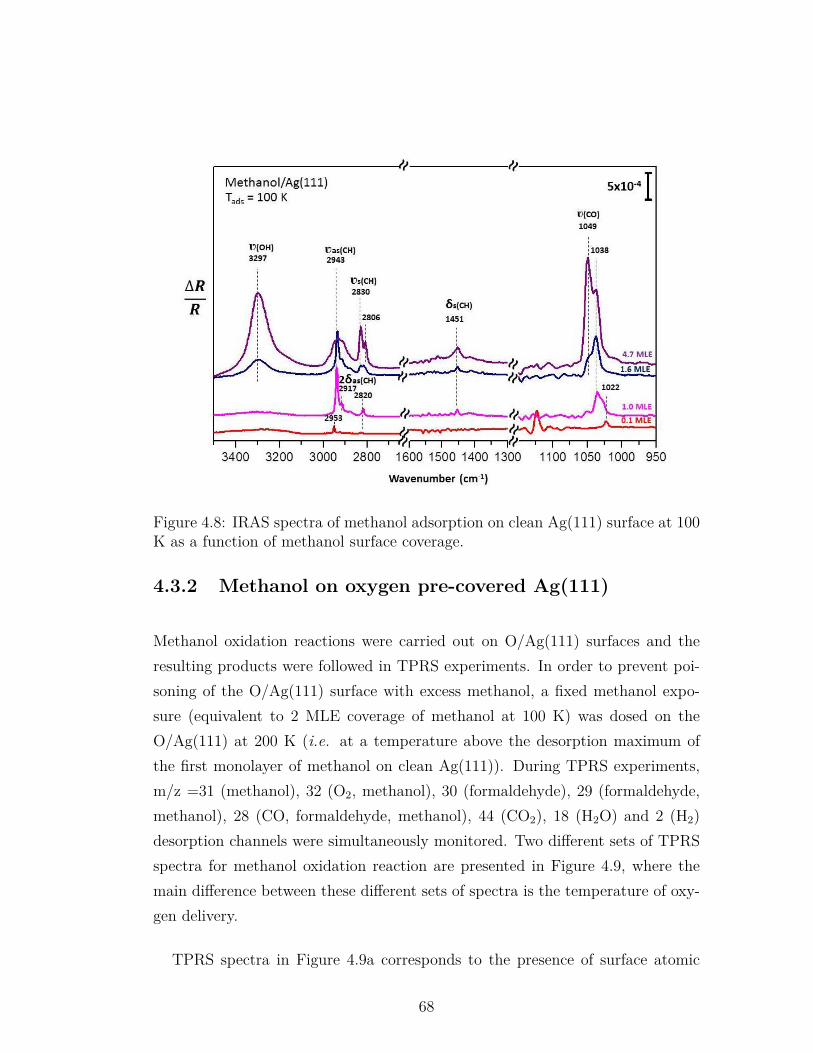
Figure 4.8: IRAS spectra of methanol adsorption on clean Ag(111) surface at 100K as a function of methanol surface coverage.
4.3.2 Methanol on oxygen pre-covered Ag(111)
Methanol oxidation reactions were carried out on O/Ag(111) surfaces and theresulting products were followed in TPRS experiments. In order to prevent poi-soning of the O/Ag(111) surface with excess methanol, a fixed methanol expo-sure (equivalent to 2 MLE coverage of methanol at 100 K) was dosed on theO/Ag(111) at 200 K (i.e. at a temperature above the desorption maximum ofthe first monolayer of methanol on clean Ag(111)). During TPRS experiments,m/z =31 (methanol), 32 (O2, methanol), 30 (formaldehyde), 29 (formaldehyde,methanol), 28 (CO, formaldehyde, methanol), 44 (CO2), 18 (H2O) and 2 (H2)desorption channels were simultaneously monitored. Two different sets of TPRSspectra for methanol oxidation reaction are presented in Figure 4.9, where themain difference between these different sets of spectra is the temperature of oxy-gen delivery.
TPRS spectra in Figure 4.9a corresponds to the presence of surface atomic
68
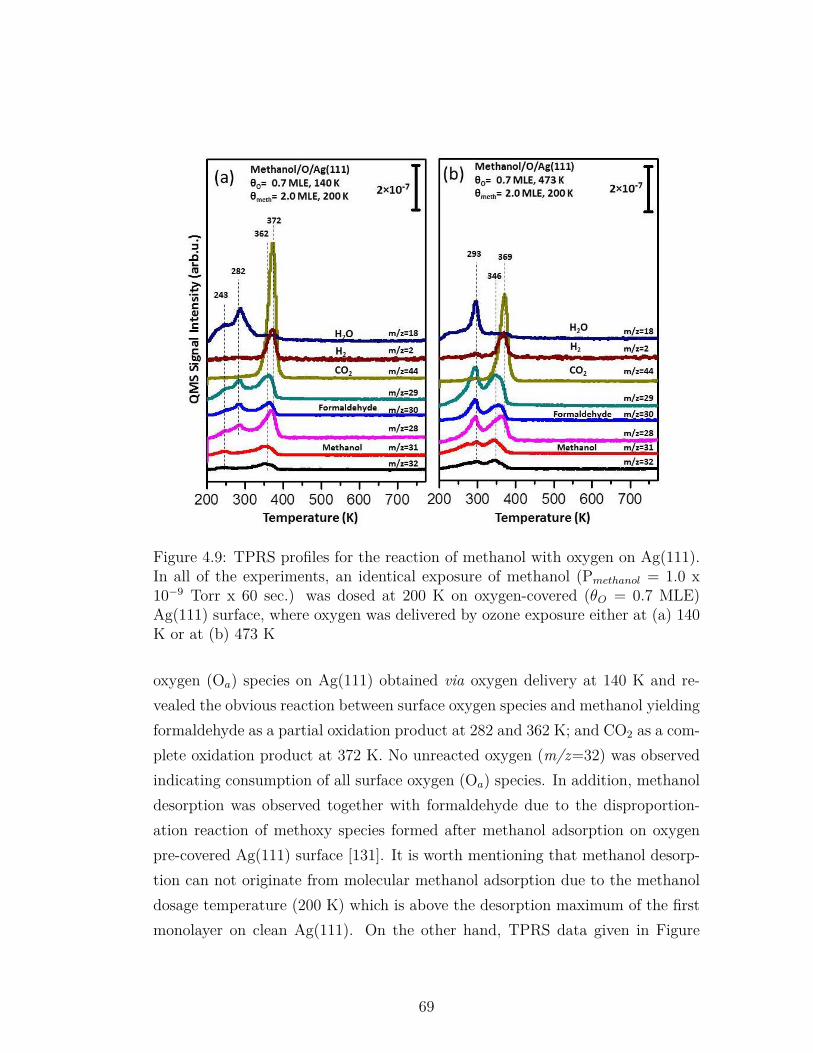
Figure 4.9: TPRS profiles for the reaction of methanol with oxygen on Ag(111).In all of the experiments, an identical exposure of methanol (Pmethanol = 1.0 x10⁻⁹ Torr x 60 sec.) was dosed at 200 K on oxygen-covered (θO = 0.7 MLE)Ag(111) surface, where oxygen was delivered by ozone exposure either at (a) 140K or at (b) 473 K
oxygen (Oa) species on Ag(111) obtained via oxygen delivery at 140 K and re-vealed the obvious reaction between surface oxygen species and methanol yieldingformaldehyde as a partial oxidation product at 282 and 362 K; and CO2 as a com-plete oxidation product at 372 K. No unreacted oxygen (m/z=32) was observedindicating consumption of all surface oxygen (Oa) species. In addition, methanoldesorption was observed together with formaldehyde due to the disproportion-ation reaction of methoxy species formed after methanol adsorption on oxygenpre-covered Ag(111) surface [131]. It is worth mentioning that methanol desorp-tion can not originate from molecular methanol adsorption due to the methanoldosage temperature (200 K) which is above the desorption maximum of the firstmonolayer on clean Ag(111). On the other hand, TPRS data given in Figure
69
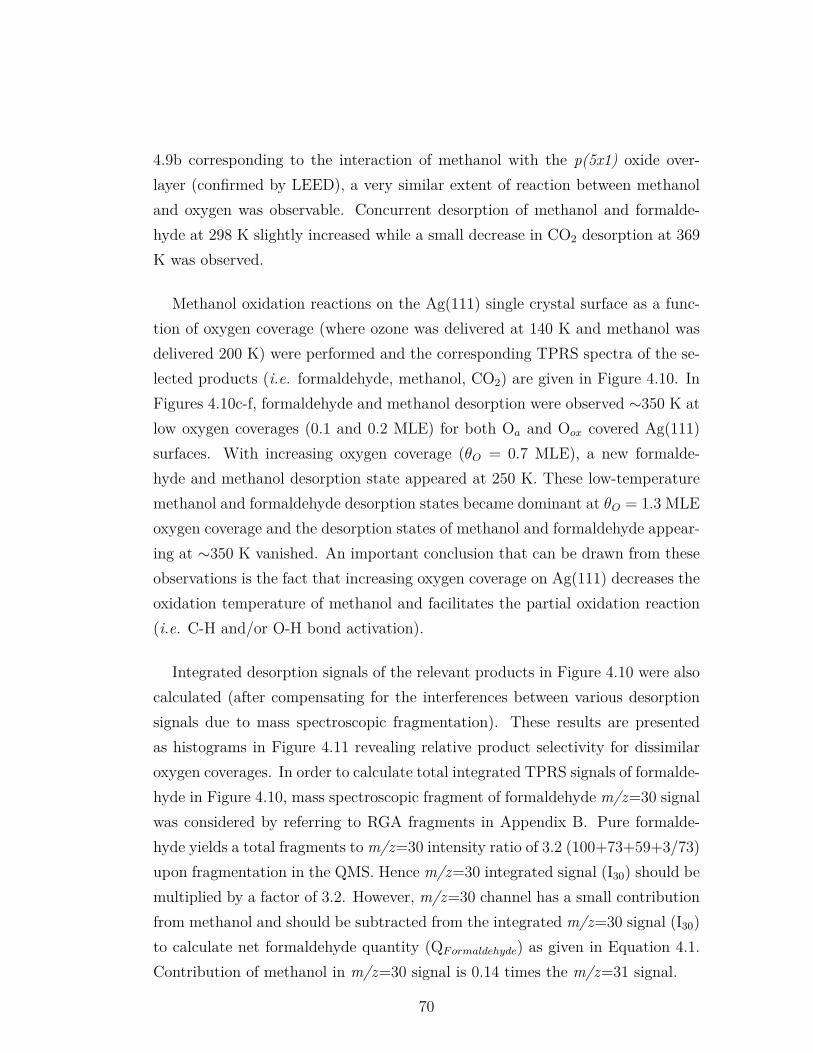
4.9b corresponding to the interaction of methanol with the p(5x1) oxide over-layer (confirmed by LEED), a very similar extent of reaction between methanoland oxygen was observable. Concurrent desorption of methanol and formalde-hyde at 298 K slightly increased while a small decrease in CO2 desorption at 369K was observed.
Methanol oxidation reactions on the Ag(111) single crystal surface as a func-tion of oxygen coverage (where ozone was delivered at 140 K and methanol wasdelivered 200 K) were performed and the corresponding TPRS spectra of the se-lected products (i.e. formaldehyde, methanol, CO2) are given in Figure 4.10. InFigures 4.10c-f, formaldehyde and methanol desorption were observed ∼350 K atlow oxygen coverages (0.1 and 0.2 MLE) for both Oa and Oox covered Ag(111)surfaces. With increasing oxygen coverage (θO = 0.7 MLE), a new formalde-hyde and methanol desorption state appeared at 250 K. These low-temperaturemethanol and formaldehyde desorption states became dominant at θO = 1.3 MLEoxygen coverage and the desorption states of methanol and formaldehyde appear-ing at ∼350 K vanished. An important conclusion that can be drawn from theseobservations is the fact that increasing oxygen coverage on Ag(111) decreases theoxidation temperature of methanol and facilitates the partial oxidation reaction(i.e. C-H and/or O-H bond activation).
Integrated desorption signals of the relevant products in Figure 4.10 were alsocalculated (after compensating for the interferences between various desorptionsignals due to mass spectroscopic fragmentation). These results are presentedas histograms in Figure 4.11 revealing relative product selectivity for dissimilaroxygen coverages. In order to calculate total integrated TPRS signals of formalde-hyde in Figure 4.10, mass spectroscopic fragment of formaldehyde m/z=30 signalwas considered by referring to RGA fragments in Appendix B. Pure formalde-hyde yields a total fragments to m/z=30 intensity ratio of 3.2 (100+73+59+3/73)upon fragmentation in the QMS. Hence m/z=30 integrated signal (I30) should bemultiplied by a factor of 3.2. However, m/z=30 channel has a small contributionfrom methanol and should be subtracted from the integrated m/z=30 signal (I30)to calculate net formaldehyde quantity (QF ormaldehyde) as given in Equation 4.1.Contribution of methanol in m/z=30 signal is 0.14 times the m/z=31 signal.
70
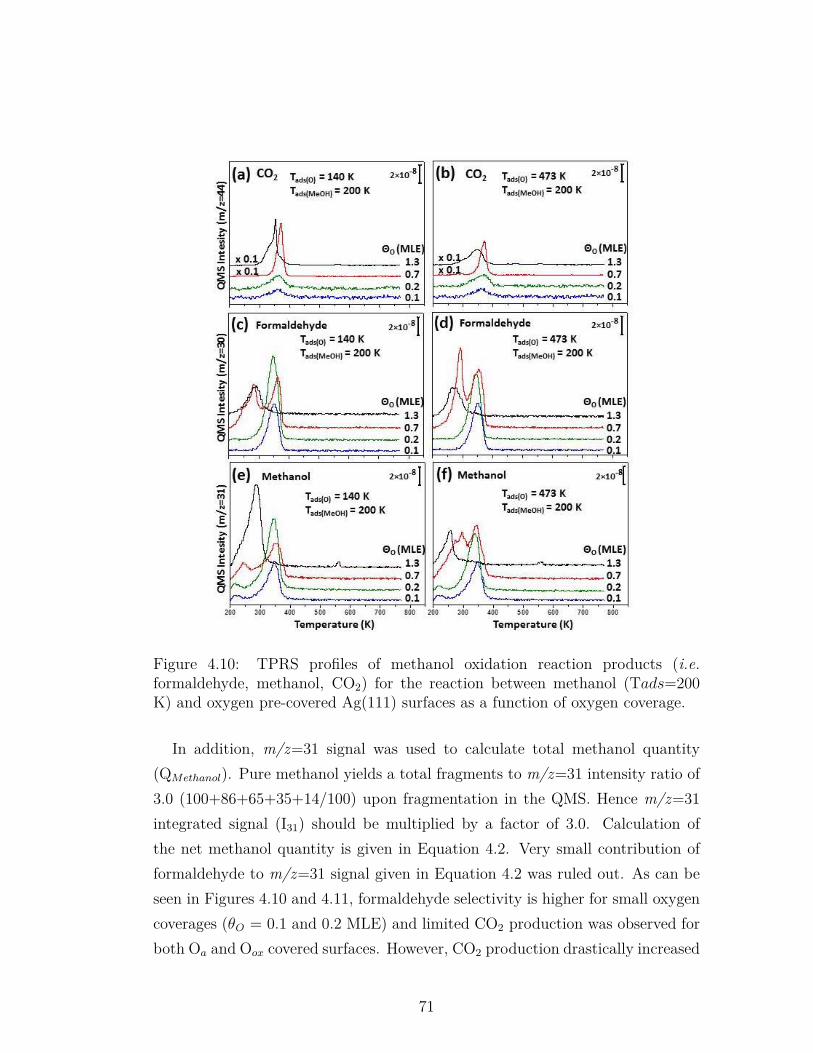
Figure 4.10: TPRS profiles of methanol oxidation reaction products (i.e.formaldehyde, methanol, CO2) for the reaction between methanol (Tads=200K) and oxygen pre-covered Ag(111) surfaces as a function of oxygen coverage.
In addition, m/z=31 signal was used to calculate total methanol quantity(QMethanol). Pure methanol yields a total fragments to m/z=31 intensity ratio of3.0 (100+86+65+35+14/100) upon fragmentation in the QMS. Hence m/z=31integrated signal (I31) should be multiplied by a factor of 3.0. Calculation ofthe net methanol quantity is given in Equation 4.2. Very small contribution offormaldehyde to m/z=31 signal given in Equation 4.2 was ruled out. As can beseen in Figures 4.10 and 4.11, formaldehyde selectivity is higher for small oxygencoverages (θO = 0.1 and 0.2 MLE) and limited CO2 production was observed forboth Oa and Oox covered surfaces. However, CO2 production drastically increased
71
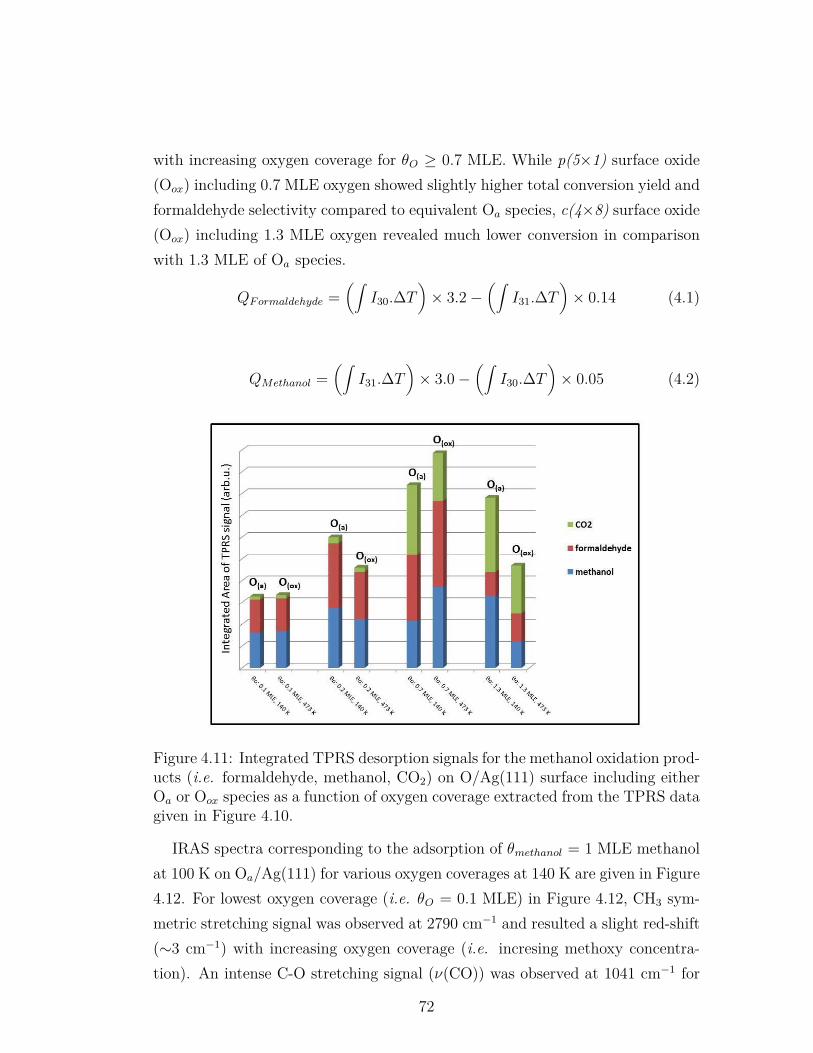
with increasing oxygen coverage for θO ≥ 0.7 MLE. While p(5×1) surface oxide(Oox) including 0.7 MLE oxygen showed slightly higher total conversion yield andformaldehyde selectivity compared to equivalent Oa species, c(4×8) surface oxide(Oox) including 1.3 MLE oxygen revealed much lower conversion in comparisonwith 1.3 MLE of Oa species.
QF ormaldehyde =(∫
I30.∆T)× 3.2−
(∫I31.∆T
)× 0.14 (4.1)
QMethanol =(∫
I31.∆T)× 3.0−
(∫I30.∆T
)× 0.05 (4.2)
Figure 4.11: Integrated TPRS desorption signals for the methanol oxidation prod-ucts (i.e. formaldehyde, methanol, CO2) on O/Ag(111) surface including eitherOa or Oox species as a function of oxygen coverage extracted from the TPRS datagiven in Figure 4.10.
IRAS spectra corresponding to the adsorption of θmethanol = 1 MLE methanolat 100 K on Oa/Ag(111) for various oxygen coverages at 140 K are given in Figure4.12. For lowest oxygen coverage (i.e. θO = 0.1 MLE) in Figure 4.12, CH3 sym-metric stretching signal was observed at 2790 cm−1 and resulted a slight red-shift(∼3 cm−1) with increasing oxygen coverage (i.e. incresing methoxy concentra-tion). An intense C-O stretching signal (ν(CO)) was observed at 1041 cm−1 for
72
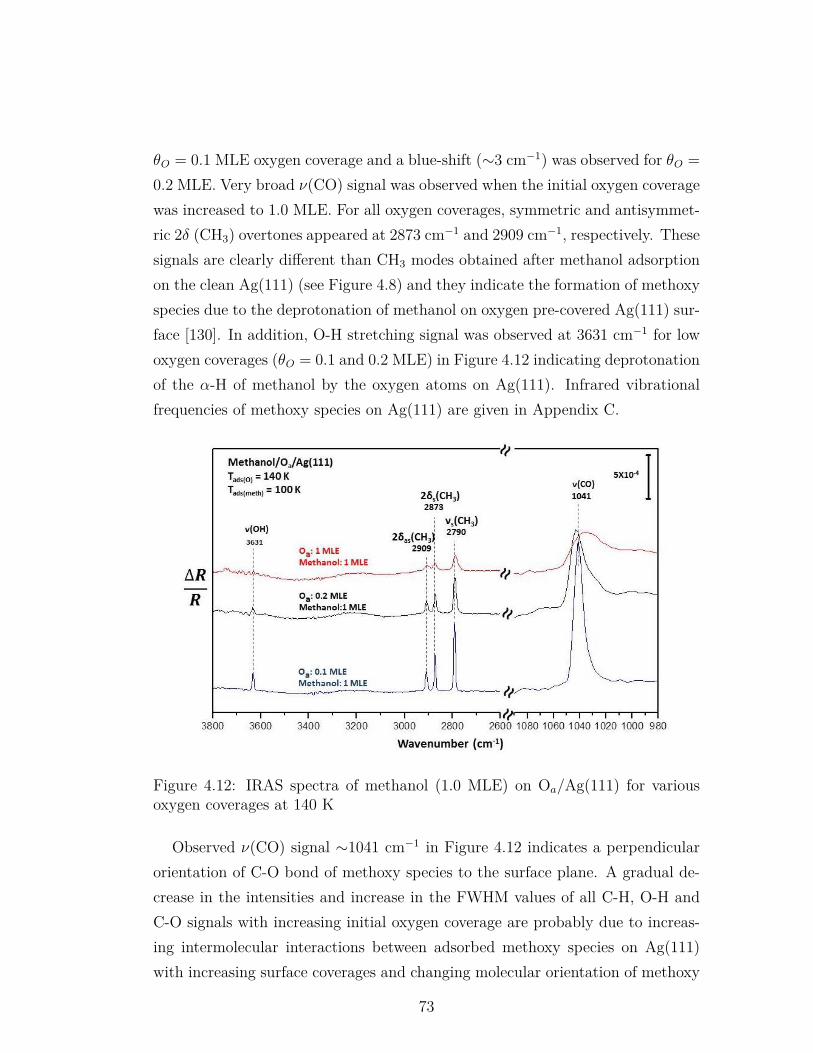
θO = 0.1 MLE oxygen coverage and a blue-shift (∼3 cm−1) was observed for θO =0.2 MLE. Very broad ν(CO) signal was observed when the initial oxygen coveragewas increased to 1.0 MLE. For all oxygen coverages, symmetric and antisymmet-ric 2δ (CH3) overtones appeared at 2873 cm−1 and 2909 cm−1, respectively. Thesesignals are clearly different than CH3 modes obtained after methanol adsorptionon the clean Ag(111) (see Figure 4.8) and they indicate the formation of methoxyspecies due to the deprotonation of methanol on oxygen pre-covered Ag(111) sur-face [130]. In addition, O-H stretching signal was observed at 3631 cm−1 for lowoxygen coverages (θO = 0.1 and 0.2 MLE) in Figure 4.12 indicating deprotonationof the α-H of methanol by the oxygen atoms on Ag(111). Infrared vibrationalfrequencies of methoxy species on Ag(111) are given in Appendix C.
Figure 4.12: IRAS spectra of methanol (1.0 MLE) on Oa/Ag(111) for variousoxygen coverages at 140 K
Observed ν(CO) signal ∼1041 cm−1 in Figure 4.12 indicates a perpendicularorientation of C-O bond of methoxy species to the surface plane. A gradual de-crease in the intensities and increase in the FWHM values of all C-H, O-H andC-O signals with increasing initial oxygen coverage are probably due to increas-ing intermolecular interactions between adsorbed methoxy species on Ag(111)with increasing surface coverages and changing molecular orientation of methoxy
73
species towards tilted bond locations. Besides, red-shift in νs(CH3) and blue-shift in ν(CO) modes with increasing methoxy coverage can be attributed to thecompetition between methoxy species for back-donated electron density [130]. Asa result, increasing methoxy coverage strengthens the C-O bond while weakensthe C-H bond. It is worth mentioning that the increasing quantity of methoxyspecies with increasing oxygen coverage was shown by TPRS in Figure 4.10 andFigure 4.11. Thus, the possibility of limited methanol adsorption with increasingoxygen amount (i.e. a competition of methanol and atomic oxygen for the avail-able adsorption sites of Ag(111)) can be ruled out. Furthermore, orientationalchanges of the methoxy species with increasing oxygen coverage should also beclosely related to surface reconstructions and morphology changes upon oxidationof the silver surface.
As a result, methanol molecules adsorbed on the clean Ag(111) surface viathe oxygen atom with a perpendicular C-O bond orientation to the surface planeand desorbed in a reversible manner. When methanol was adsorbed on oxygenpre-covered Ag(111) surface, methoxy species was formed by O-H bond cleavageand α-H abstraction as shown in Equations 4.3 - 4.4 below. Formaldehyde for-mation (Equation 4.5) and desorption was observed after methoxy formation byTPRS experiments together with methanol desorption (Equation 4.6). C-H bondcleavage must be an intermediate step for formaldehyde formation. In addition,CO2 desorption was also observed in the presence of excess oxygen atoms. CO2
formation mechanism from methanol oxidation on Cu [131] and Au [111] surfaceswas studied in the literature and formate was reported as an intermediate species(see Equations 4.7 - 4.9). Both Oa and Oox species were found to be active in C-Hand O-H bond cleavage. The product distribution of methanol oxidation reactionon Ag(111) single crystal surface is governed predominantly by the amount ofoxygen species available on the catalyst with a possibly weaker contribution fromthe differences in the nature of these oxygen species.
CH3OH(g) +O(a)→ CH3O(a) +OH(a) (4.3)
CH3OH(g) +OH(a)→ CH3O(a) +H2O(a) (4.4)
74
CH3O(a)→ H2CO(g) +H(a) (4.5)
CH3O(a) +H(a)→ CH3OH(g) (4.6)
H2CO(a) +O(a)→ CH2COO(a) (4.7)
CH2COO(a)→ HCOO(a) +H(a) (4.8)
HCOO(a)→ CO2(g) +H(a) (4.9)
2H(a)→ H2(g) (4.10)
4.3.3 The Effect of Methanol Dosage Temperature to theMethanol Oxidation Reaction Pathways
Formation of the methoxy species when methanol is accumulated on oxygen pre-covered Ag(111) single crystal at 100 K was discussed in the previous subsectionand the corresponding IRAS spectrum of methoxy species formed after 1.0 MLEmethanol accumulation on θO = 0.7 MLE of oxygen pre-covered Ag(111) surfaceis given in Figure 4.13a. When the Ag(111) single crystal containing methoxyspecies was annealed, methoxy species was found to be stable up to 300 K (Figure4.13, spectrum b). As can be seen from the spectra a and b of Figure 4.13, C-Hbond strengthens (blue-shift) while C-O bond weakens (i.e. red-shift) at 300 K incomparison to 100 K. However, when the same amount of methanol was accumu-lated on θO = 0.7 MLE of oxygen pre-covered Ag(111) surface at 300 K, methoxysignals were completely disappeared and new signals that are characteristic forformate were observed (4.13c). Formate signals at 1320, 2807 and 2883 cm−1 inFigure 4.13c belong to νs(OCO), ν(CH) and 2δ(CH)/νas(OCO)+δ(CH) modes,respectively [132]. In the literature, four different adsorption configurations of for-mate species were identified by the oxidation of formic acid on Ag(111). Signalsin spectrum c of Figure 4.13 belong to α-formate which adsorbs symmetricallyon the surface by bridging from its oxygen atoms to two adjacent Ag atoms andC-H bond stays perpendicular to the surface plane [132].
TPRS experiments for the same conditions given in 4.13a and c were alsoperformed and corresponding TPRS spectra are given in Figure 4.14. As can
75
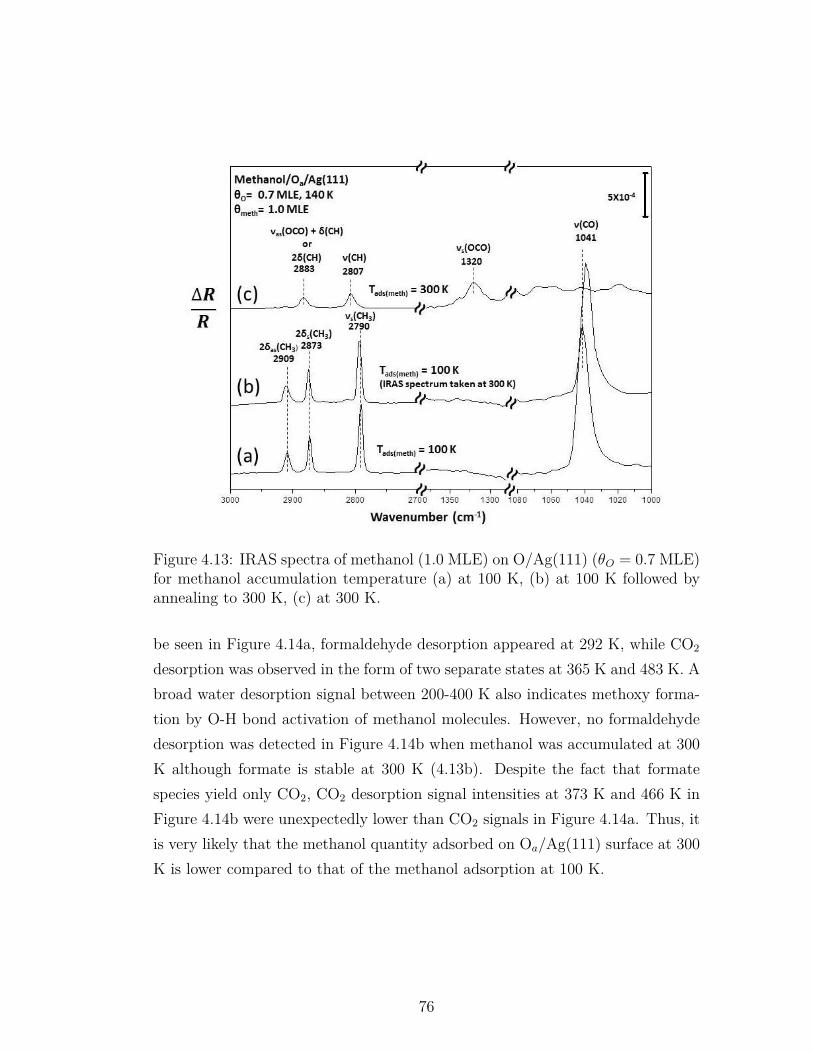
Figure 4.13: IRAS spectra of methanol (1.0 MLE) on O/Ag(111) (θO = 0.7 MLE)for methanol accumulation temperature (a) at 100 K, (b) at 100 K followed byannealing to 300 K, (c) at 300 K.
be seen in Figure 4.14a, formaldehyde desorption appeared at 292 K, while CO2
desorption was observed in the form of two separate states at 365 K and 483 K. Abroad water desorption signal between 200-400 K also indicates methoxy forma-tion by O-H bond activation of methanol molecules. However, no formaldehydedesorption was detected in Figure 4.14b when methanol was accumulated at 300K although formate is stable at 300 K (4.13b). Despite the fact that formatespecies yield only CO2, CO2 desorption signal intensities at 373 K and 466 K inFigure 4.14b were unexpectedly lower than CO2 signals in Figure 4.14a. Thus, itis very likely that the methanol quantity adsorbed on Oa/Ag(111) surface at 300K is lower compared to that of the methanol adsorption at 100 K.
76
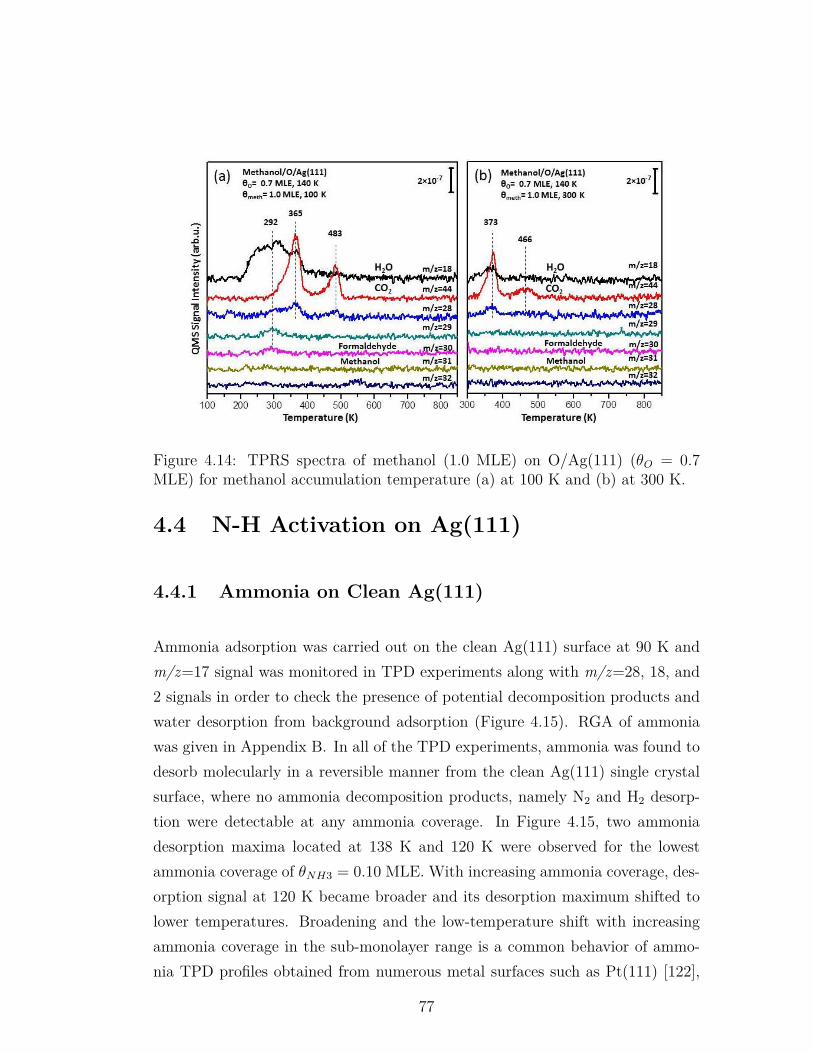
Figure 4.14: TPRS spectra of methanol (1.0 MLE) on O/Ag(111) (θO = 0.7MLE) for methanol accumulation temperature (a) at 100 K and (b) at 300 K.
4.4 N-H Activation on Ag(111)
4.4.1 Ammonia on Clean Ag(111)
Ammonia adsorption was carried out on the clean Ag(111) surface at 90 K andm/z=17 signal was monitored in TPD experiments along with m/z=28, 18, and2 signals in order to check the presence of potential decomposition products andwater desorption from background adsorption (Figure 4.15). RGA of ammoniawas given in Appendix B. In all of the TPD experiments, ammonia was found todesorb molecularly in a reversible manner from the clean Ag(111) single crystalsurface, where no ammonia decomposition products, namely N2 and H2 desorp-tion were detectable at any ammonia coverage. In Figure 4.15, two ammoniadesorption maxima located at 138 K and 120 K were observed for the lowestammonia coverage of θNH3 = 0.10 MLE. With increasing ammonia coverage, des-orption signal at 120 K became broader and its desorption maximum shifted tolower temperatures. Broadening and the low-temperature shift with increasingammonia coverage in the sub-monolayer range is a common behavior of ammo-nia TPD profiles obtained from numerous metal surfaces such as Pt(111) [122],
77
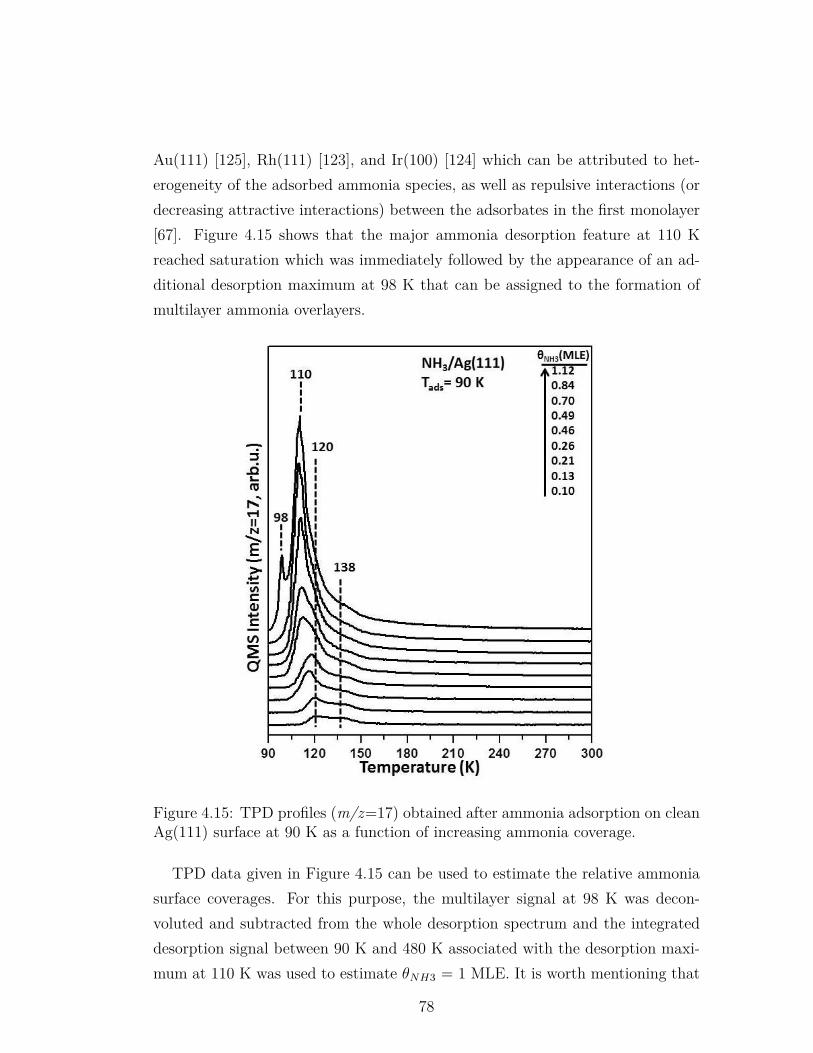
Au(111) [125], Rh(111) [123], and Ir(100) [124] which can be attributed to het-erogeneity of the adsorbed ammonia species, as well as repulsive interactions (ordecreasing attractive interactions) between the adsorbates in the first monolayer[67]. Figure 4.15 shows that the major ammonia desorption feature at 110 Kreached saturation which was immediately followed by the appearance of an ad-ditional desorption maximum at 98 K that can be assigned to the formation ofmultilayer ammonia overlayers.
Figure 4.15: TPD profiles (m/z=17) obtained after ammonia adsorption on cleanAg(111) surface at 90 K as a function of increasing ammonia coverage.
TPD data given in Figure 4.15 can be used to estimate the relative ammoniasurface coverages. For this purpose, the multilayer signal at 98 K was decon-voluted and subtracted from the whole desorption spectrum and the integrateddesorption signal between 90 K and 480 K associated with the desorption maxi-mum at 110 K was used to estimate θNH3 = 1 MLE. It is worth mentioning that
78
TPD experiments were also performed for ammonia coverages greater than 1.12MLE, revealing a typical zero-order desorption kinetics. In the literature, analo-gous monolayer and multilayer ammonia desorption signals were also observed onother metal surfaces [123], [124] as well as on Ag(110) [133]. The less-prominentammonia desorption signal at 138 K in Figure 4.15 can be attributed to strongerammonia adsorption on surface defects and/or adsorption of ammonia with dis-similar geometries/orientations on different surface adsorption sites. In overall,TPD results for NH3 adsorption on clean Ag(111) given in Figure 4.15 clearlypoint out to the fact that in the absence of oxygen species, Ag(111) is incapableof activating NH3. On the other hand, as will be shown below, ammonia activa-tion and its selective catalytic oxidation is achievable by fine-tuning the natureand surface coverage of oxygen species on Ag(111).
IRAS spectra corresponding to the adsorption of ammonia on clean Ag(111)for various coverages of ammonia at 90 K are given in Figure 4.16. For the lowestcoverage of ammonia (θNH3 = 0.21 MLE), symmetric (δs) and antisymmetric (δas)NH3 deformation signals appeared at 1072 cm−1 and 1618 cm−1, respectively;while symmetric (νs) and antisymmetric (νas) NH3 stretching modes can be seenat 3275 cm−1 and 3390 cm−1, respectively [133]. For sub-monolayer coverages, it iscommonly observed that ammonia molecules are typically adsorbed on transitionmetal surfaces through unpaired electrons of nitrogen and the molecular axis staysperpendicular to the surface [134]. In such cases, δas and νas modes cannot beobserved as reported in the literature for ammonia adsorption on Ni(111) [135],Ru(0001) [136], Pt(111) [137], and Cu(110) [138]. In contrast, IRAS data inFigure 4.16 suggest that on clean Ag(111) surface, molecular axis of ammoniais tilted with respect to the Ag(111) surface for sub-monolayer coverages. Asimilar behavior was also observed for ammonia adsorption on clean Ag(110)via Electron Energy Loss Spectroscopy (EELS) [133]. For the IRAS spectrumcorresponding to θNH3 = 0.84 MLE, δs signal was found to vanish and NH3
stretching modes were observed to broaden and shift to lower frequencies, namelyto 3347 cm−1 and 3266 cm−1. These changes in the IRAS spectra are probably dueto increasing intermolecular interactions between adsorbed ammonia moleculeson Ag(111) with increasing surface coverages as well as due to the formation
79
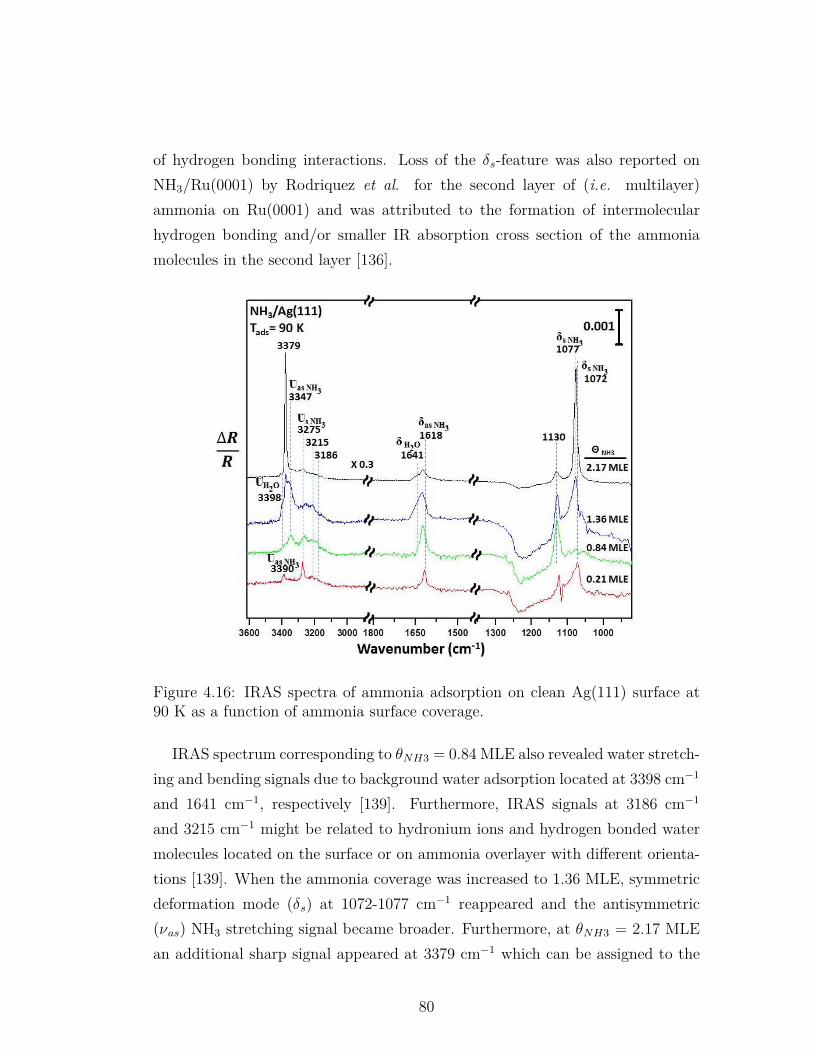
of hydrogen bonding interactions. Loss of the δs-feature was also reported onNH3/Ru(0001) by Rodriquez et al. for the second layer of (i.e. multilayer)ammonia on Ru(0001) and was attributed to the formation of intermolecularhydrogen bonding and/or smaller IR absorption cross section of the ammoniamolecules in the second layer [136].
Figure 4.16: IRAS spectra of ammonia adsorption on clean Ag(111) surface at90 K as a function of ammonia surface coverage.
IRAS spectrum corresponding to θNH3 = 0.84 MLE also revealed water stretch-ing and bending signals due to background water adsorption located at 3398 cm−1
and 1641 cm−1, respectively [139]. Furthermore, IRAS signals at 3186 cm−1
and 3215 cm−1 might be related to hydronium ions and hydrogen bonded watermolecules located on the surface or on ammonia overlayer with different orienta-tions [139]. When the ammonia coverage was increased to 1.36 MLE, symmetricdeformation mode (δs) at 1072-1077 cm−1 reappeared and the antisymmetric(νas) NH3 stretching signal became broader. Furthermore, at θNH3 = 2.17 MLEan additional sharp signal appeared at 3379 cm−1 which can be assigned to the
80
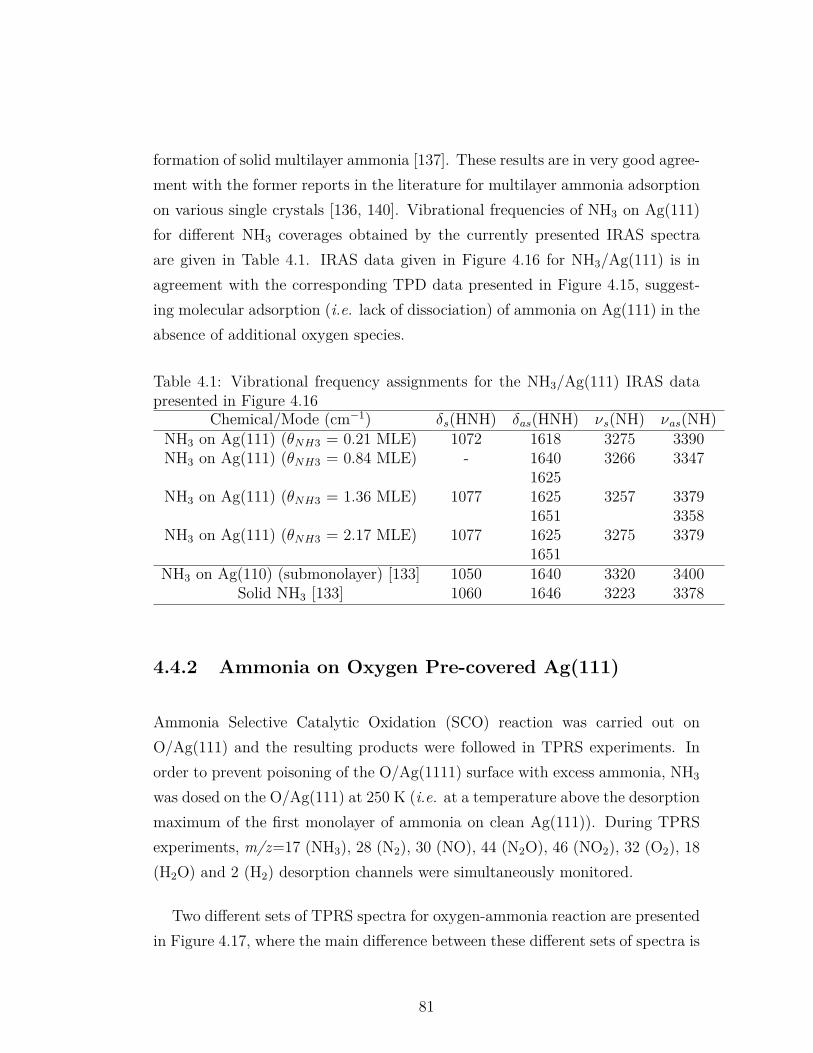
formation of solid multilayer ammonia [137]. These results are in very good agree-ment with the former reports in the literature for multilayer ammonia adsorptionon various single crystals [136, 140]. Vibrational frequencies of NH3 on Ag(111)for different NH3 coverages obtained by the currently presented IRAS spectraare given in Table 4.1. IRAS data given in Figure 4.16 for NH3/Ag(111) is inagreement with the corresponding TPD data presented in Figure 4.15, suggest-ing molecular adsorption (i.e. lack of dissociation) of ammonia on Ag(111) in theabsence of additional oxygen species.
Table 4.1: Vibrational frequency assignments for the NH3/Ag(111) IRAS datapresented in Figure 4.16
Chemical/Mode (cm−1) δs(HNH) δas(HNH) νs(NH) νas(NH)NH3 on Ag(111) (θNH3 = 0.21 MLE) 1072 1618 3275 3390NH3 on Ag(111) (θNH3 = 0.84 MLE) - 1640 3266 3347
1625NH3 on Ag(111) (θNH3 = 1.36 MLE) 1077 1625 3257 3379
1651 3358NH3 on Ag(111) (θNH3 = 2.17 MLE) 1077 1625 3275 3379
1651NH3 on Ag(110) (submonolayer) [133] 1050 1640 3320 3400
Solid NH3 [133] 1060 1646 3223 3378
4.4.2 Ammonia on Oxygen Pre-covered Ag(111)
Ammonia Selective Catalytic Oxidation (SCO) reaction was carried out onO/Ag(111) and the resulting products were followed in TPRS experiments. Inorder to prevent poisoning of the O/Ag(1111) surface with excess ammonia, NH3
was dosed on the O/Ag(111) at 250 K (i.e. at a temperature above the desorptionmaximum of the first monolayer of ammonia on clean Ag(111)). During TPRSexperiments, m/z=17 (NH3), 28 (N2), 30 (NO), 44 (N2O), 46 (NO2), 32 (O2), 18(H2O) and 2 (H2) desorption channels were simultaneously monitored.
Two different sets of TPRS spectra for oxygen-ammonia reaction are presentedin Figure 4.17, where the main difference between these different sets of spectra is
81
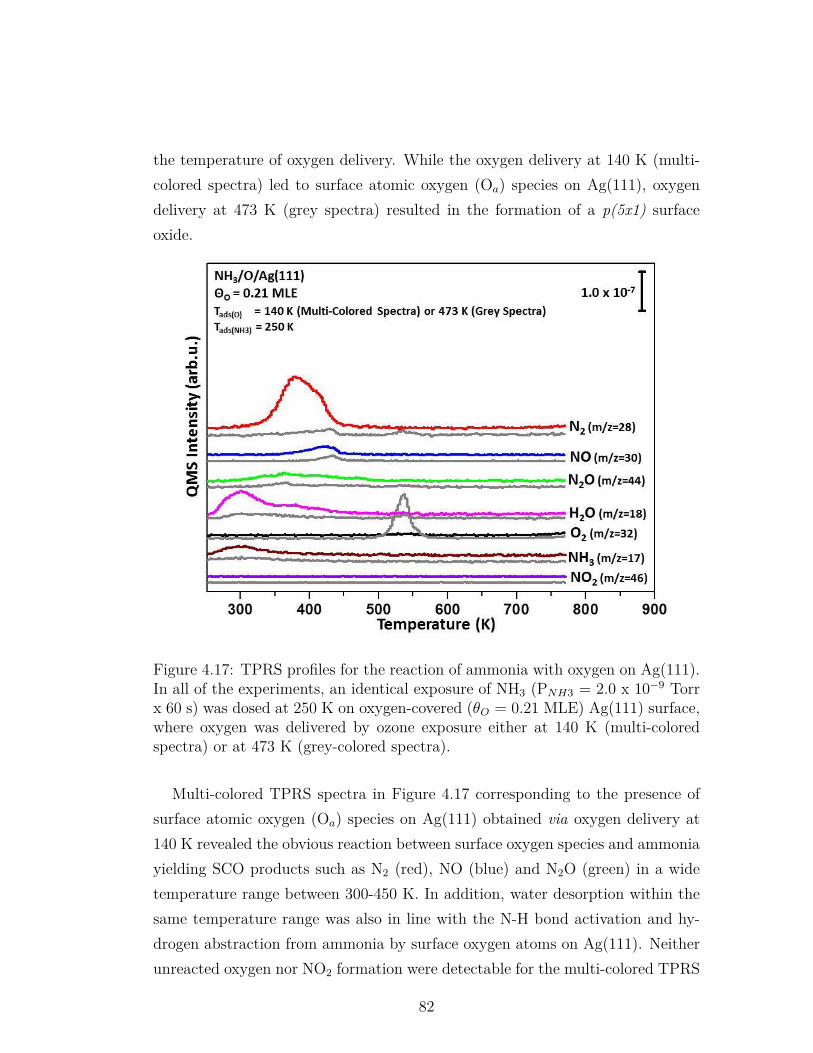
the temperature of oxygen delivery. While the oxygen delivery at 140 K (multi-colored spectra) led to surface atomic oxygen (Oa) species on Ag(111), oxygendelivery at 473 K (grey spectra) resulted in the formation of a p(5x1) surfaceoxide.
Figure 4.17: TPRS profiles for the reaction of ammonia with oxygen on Ag(111).In all of the experiments, an identical exposure of NH3 (PNH3 = 2.0 x 10⁻⁹ Torrx 60 s) was dosed at 250 K on oxygen-covered (θO = 0.21 MLE) Ag(111) surface,where oxygen was delivered by ozone exposure either at 140 K (multi-coloredspectra) or at 473 K (grey-colored spectra).
Multi-colored TPRS spectra in Figure 4.17 corresponding to the presence ofsurface atomic oxygen (Oa) species on Ag(111) obtained via oxygen delivery at140 K revealed the obvious reaction between surface oxygen species and ammoniayielding SCO products such as N2 (red), NO (blue) and N2O (green) in a widetemperature range between 300-450 K. In addition, water desorption within thesame temperature range was also in line with the N-H bond activation and hy-drogen abstraction from ammonia by surface oxygen atoms on Ag(111). Neitherunreacted oxygen nor NO2 formation were detectable for the multi-colored TPRS
82
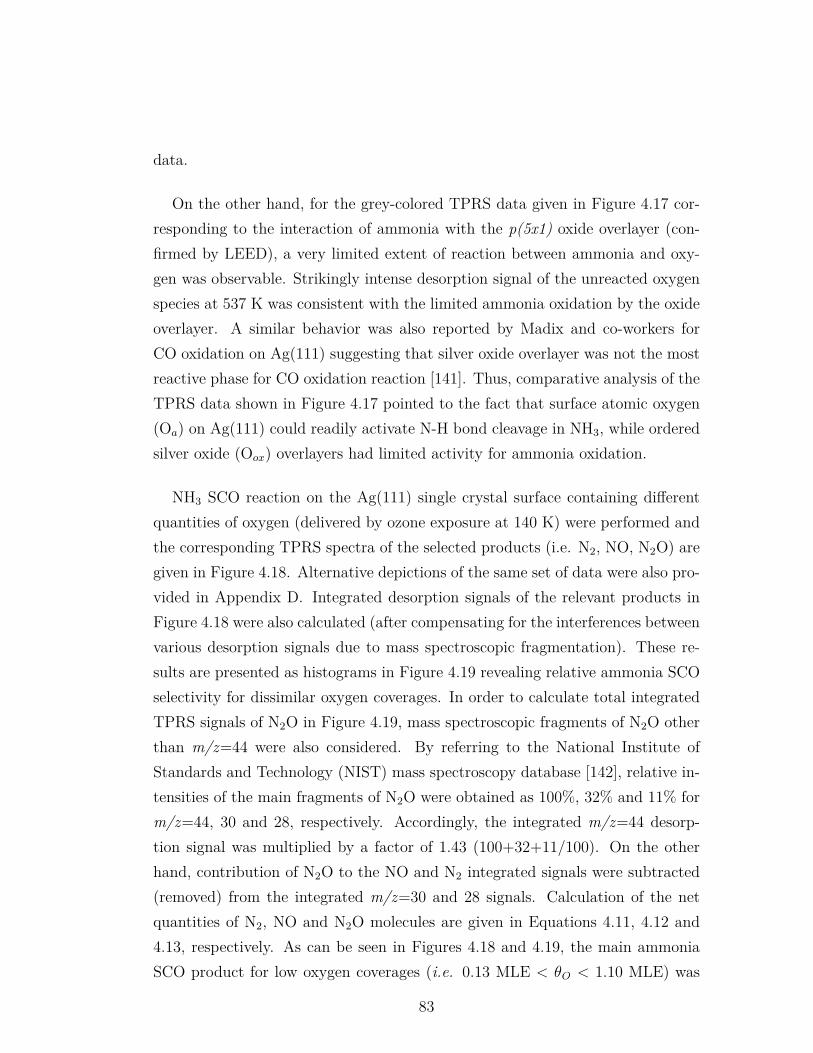
data.
On the other hand, for the grey-colored TPRS data given in Figure 4.17 cor-responding to the interaction of ammonia with the p(5x1) oxide overlayer (con-firmed by LEED), a very limited extent of reaction between ammonia and oxy-gen was observable. Strikingly intense desorption signal of the unreacted oxygenspecies at 537 K was consistent with the limited ammonia oxidation by the oxideoverlayer. A similar behavior was also reported by Madix and co-workers forCO oxidation on Ag(111) suggesting that silver oxide overlayer was not the mostreactive phase for CO oxidation reaction [141]. Thus, comparative analysis of theTPRS data shown in Figure 4.17 pointed to the fact that surface atomic oxygen(Oa) on Ag(111) could readily activate N-H bond cleavage in NH3, while orderedsilver oxide (Oox) overlayers had limited activity for ammonia oxidation.
NH3 SCO reaction on the Ag(111) single crystal surface containing differentquantities of oxygen (delivered by ozone exposure at 140 K) were performed andthe corresponding TPRS spectra of the selected products (i.e. N2, NO, N2O) aregiven in Figure 4.18. Alternative depictions of the same set of data were also pro-vided in Appendix D. Integrated desorption signals of the relevant products inFigure 4.18 were also calculated (after compensating for the interferences betweenvarious desorption signals due to mass spectroscopic fragmentation). These re-sults are presented as histograms in Figure 4.19 revealing relative ammonia SCOselectivity for dissimilar oxygen coverages. In order to calculate total integratedTPRS signals of N2O in Figure 4.19, mass spectroscopic fragments of N2O otherthan m/z=44 were also considered. By referring to the National Institute ofStandards and Technology (NIST) mass spectroscopy database [142], relative in-tensities of the main fragments of N2O were obtained as 100%, 32% and 11% form/z=44, 30 and 28, respectively. Accordingly, the integrated m/z=44 desorp-tion signal was multiplied by a factor of 1.43 (100+32+11/100). On the otherhand, contribution of N2O to the NO and N2 integrated signals were subtracted(removed) from the integrated m/z=30 and 28 signals. Calculation of the netquantities of N2, NO and N2O molecules are given in Equations 4.11, 4.12 and4.13, respectively. As can be seen in Figures 4.18 and 4.19, the main ammoniaSCO product for low oxygen coverages (i.e. 0.13 MLE < θO < 1.10 MLE) was
83
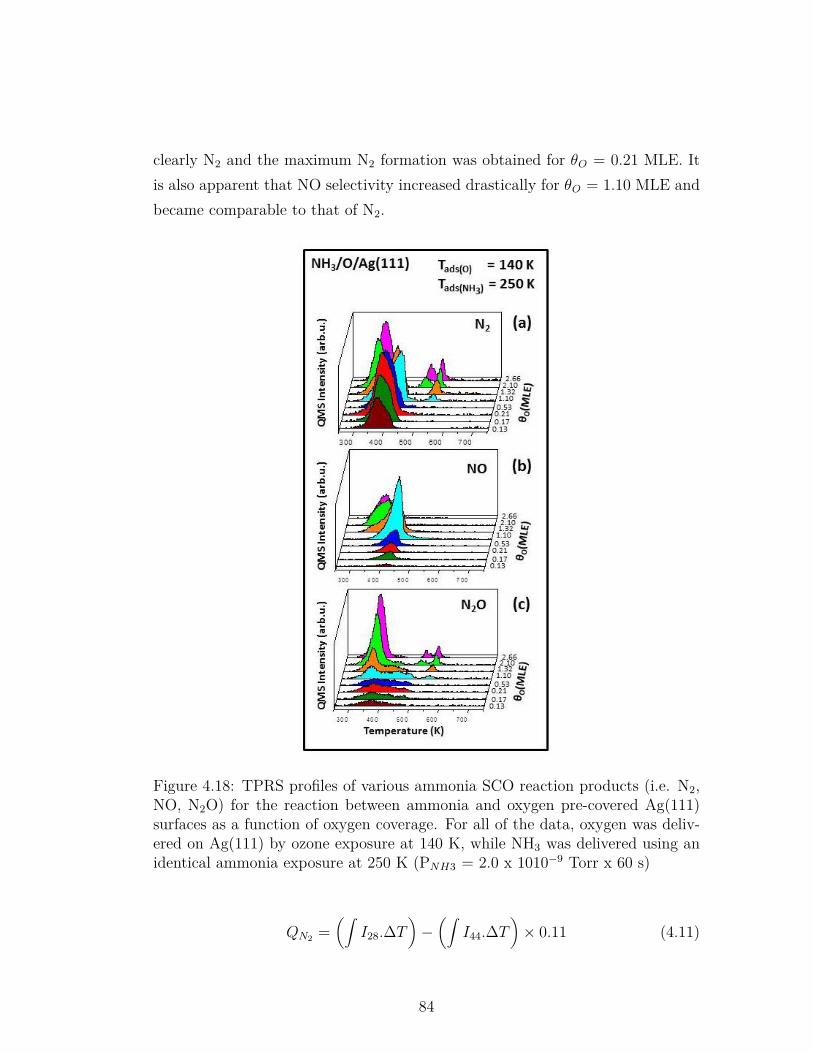
clearly N2 and the maximum N2 formation was obtained for θO = 0.21 MLE. Itis also apparent that NO selectivity increased drastically for θO = 1.10 MLE andbecame comparable to that of N2.
Figure 4.18: TPRS profiles of various ammonia SCO reaction products (i.e. N2,NO, N2O) for the reaction between ammonia and oxygen pre-covered Ag(111)surfaces as a function of oxygen coverage. For all of the data, oxygen was deliv-ered on Ag(111) by ozone exposure at 140 K, while NH3 was delivered using anidentical ammonia exposure at 250 K (PNH3 = 2.0 x 10¹⁰−9 Torr x 60 s)
QN2 =(∫
I28.∆T)−(∫
I44.∆T)× 0.11 (4.11)
84

QNO =(∫
I30.∆T)−(∫
I44.∆T)× 0.32 (4.12)
QN2O =(∫
I44.∆T)× 1.43 (4.13)
Figure 4.19: Integrated TPD desorption signals for the main ammonia SCO prod-ucts (i.e. N2, NO, N2O) on O/Ag(111) surface as a function of oxygen coverageextracted from the TPRS data given in Figure 4.18.
It is worth mentioning that N2 desorption maxima shifted to higher temper-atures for θO ≥ 1.10 MLE (Figure 4.18a) and additional N2 desorption statesalso became visible. This observation was concomitant to the appearance of ex-cess oxygen desorption associated with surface and subsurface/bulk oxide states.Thus, it can be argued that formation of oxide species abundant in oxygen led toan attractive interaction between oxygen species and atomic nitrogen, resultingin the stabilization of the atomic nitrogen species generated by N-H bond acti-vation of NH3 and a shift in the N2 desorption maxima to higher temperatures.Furthermore, generation of additional high temperature N2 desorption states atelevated oxygen coverages can also be attributed to the increasing heterogeneity
85
of the adsorption sites of the substrate surface due to the formation of bulk-likesilver oxide.
Furthermore, unreacted NH3 was also monitored (see Appendix E) for the setof experiments presented in Figure 4.18. These results revealed limited amountsof ammonia desorption (i.e. lack of presence of excess ammonia) suggesting a highconversion of ammonia for the particular set of experimental conditions chosenfor Figure 4.18.
It is worth mentioning that IRAS measurements were also performed at 250K for SCO of ammonia on atomic oxygen (Oa) covered Ag(111) surface usingexperimental conditions (coverages) similar to the ones chosen for the TPRSexperiments given in Figure 4.18. However no IRAS signals were detected possiblydue to the unfavorable adsorption geometry or small IR absorption cross sectionsof the reactants and products lying, possibly close to parallel to the surface.
86
Chapter 5
Conclusions
In the current thesis study, nature of oxygen on Au(111) and Ag(111) single crys-tals was investigated by utilizing a multitude of surface-sensitive spectroscopicand diffraction techniques. Ozone decomposition method was used as an oxygendelivery agent under UHV conditions. TPD/TPRS, XPS and LEED data suggestthat a variety of oxygen species can be generated on the Ag(111) surface uponozone adsorption depending on the oxygen quantity and accumulation tempera-ture. Activity of different oxygen species towards O-H, C-H, C-C and N-H bondcleavage was determined on both Au(111) and Ag(111) single crystal surfaces.
5.1 Bond Activation by Au(111)
Three different oxygen species were generated on the Au(111) single crystal uponozone adsorption such as surface atomic oxygen (Oa), subsurface oxygen (Osub)and surface oxide (Oox). Oxygen accumulation on Au(111) surface at 140 K forθO<1.0 MLE of oxygen coverage resulted in surface atomic oxygen (Oa) forma-tion, while 2D surface oxide (Oox) started to grow for θO>1.0 MLE of oxygencoverage at the same temperature. It was also revealed that oxygen atoms dis-solve (Osub) in the bulk of the Au(111) single crystal when oxygen is accumulated
87
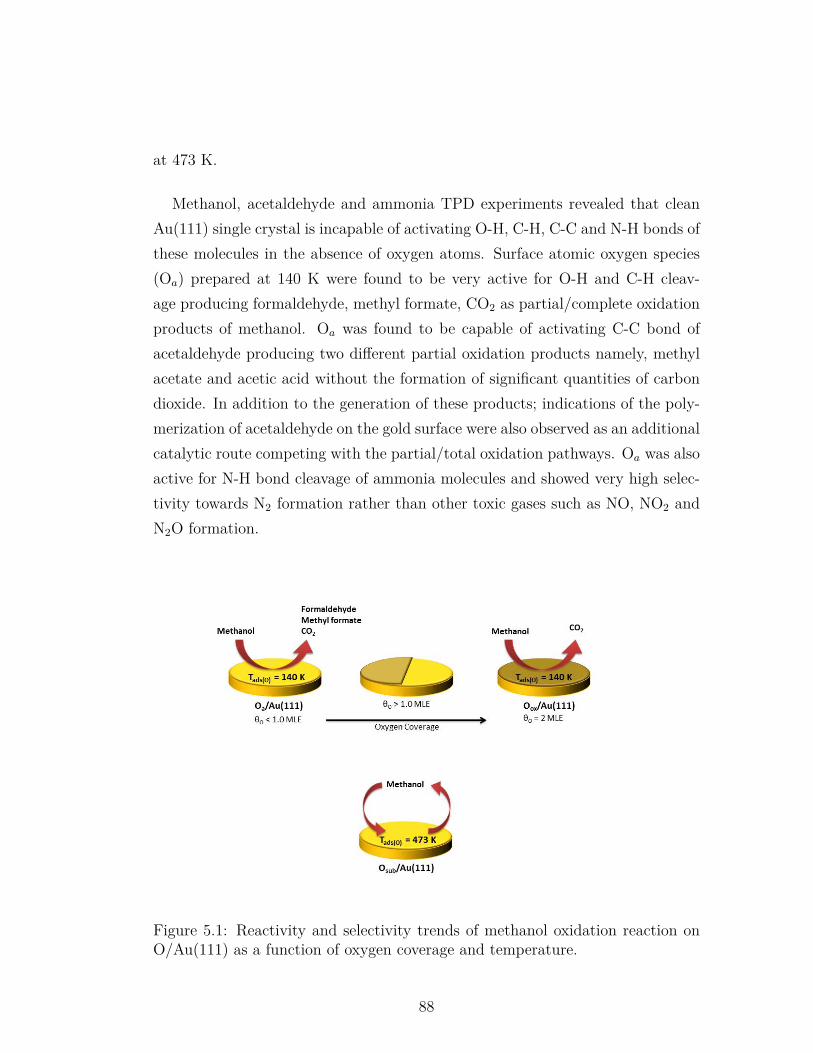
at 473 K.
Methanol, acetaldehyde and ammonia TPD experiments revealed that cleanAu(111) single crystal is incapable of activating O-H, C-H, C-C and N-H bonds ofthese molecules in the absence of oxygen atoms. Surface atomic oxygen species(Oa) prepared at 140 K were found to be very active for O-H and C-H cleav-age producing formaldehyde, methyl formate, CO2 as partial/complete oxidationproducts of methanol. Oa was found to be capable of activating C-C bond ofacetaldehyde producing two different partial oxidation products namely, methylacetate and acetic acid without the formation of significant quantities of carbondioxide. In addition to the generation of these products; indications of the poly-merization of acetaldehyde on the gold surface were also observed as an additionalcatalytic route competing with the partial/total oxidation pathways. Oa was alsoactive for N-H bond cleavage of ammonia molecules and showed very high selec-tivity towards N2 formation rather than other toxic gases such as NO, NO2 andN2O formation.
Figure 5.1: Reactivity and selectivity trends of methanol oxidation reaction onO/Au(111) as a function of oxygen coverage and temperature.
88

Surface oxide (Oox) overlayer prepared on Au(111) for θO>1.0 MLE at 140 Kwas also found to be very active towards methanol. However it showed very highselectivity towards CO2 in the methanol oxidation reactions. In addition, dis-solved oxygen atoms (Osub) prepared at 473 K for all coverages revealed almostno activity in methanol oxidation reactions. Overall reactivity and selectivitytrends of methanol oxidation on O/Au(111) as function of adsorption tempera-tures, oxygen surface coverages and nature of the oxygen species deduced fromthe currently presented experimental findings are summarized in Scheme 5.1.
5.2 Bond Activation by Ag(111)
Three different oxygen species were generated on the Ag(111) surface upon ozoneadsorption such as surface atomic oxygen (Oa), surface oxide (Oox) and bulk-likeoxide (Obulk) species. Indications of oxygen transport to the subsurface region ofsilver at elevated ozone exposures were also detected. Oxygen overlayers preparedvia ozone exposure at 140 K in UHV led to disordered overlayers (either in theform of atomic oxygen or bulk-like silver oxide) for all oxygen coverages, whileannealing of these overlayers for intermediate oxygen coverages at 473 K resultedin the formation of ordered surface oxides with p(5x1) and c(4x8) structures.
Clean Ag(111) surface was found to be incapable of activating O-H and C-Hbonds of methanol as well as N-H bonds of ammonia under UHV conditions in theabsence of ozone exposure. IRAS experiments revealed that methanol moleculeslocate on the clean Ag(111) surface via the oxygen atom with a perpendicular C-Obond orientation to the surface plane. IRAS results also suggested that ammoniamolecules are adsorbed on Ag(111) surface through unpaired electrons of nitrogenand the molecular axis of ammonia is tilted with respect to the Ag(111) surfacefor sub-monolayer coverages.
Disordered atomic oxygen (Oa) and surface oxide (Oox) overlayers prepared onAg(111) for θO ≤ 0.2 MLE were found to be very active for O-H and C-H bondcleavage producing formaldehyde as the dominant product. Increasing oxygen
89

quantity for both oxygen species (0.7 MLE ≤ θO ≤ 1.3 MLE) resulted mostlyCO2 formation indicating that the product distribution of methanol oxidationreaction on Ag(111) surface depends on the oxygen quantity. Another factoreffecting the product distribution of methanol oxidation reaction was found tobe methanol accumulation temperature. While methanol dosage at 100 K onatomic oxygen covered Ag(111) surface revealed methoxy formation followed byformaldehyde and methanol desorption, methanol accumulation at 300 K gener-ated only formate species which yield CO2.
Figure 5.2: Reactivity and selectivity trends of ammonia SCO on O/Ag(111) asa function of oxygen coverage and temperature.
Disordered atomic oxygen overlayers (Oa) prepared on Ag(111) at 140 K forθO < 1.10 MLE were found to be highly selective in SCO of ammonia, producingN2 as the dominant product. On the other hand, ordered p(5×1) and c(4×8)surface oxide (Oox) overlayers on Ag(111) prepared via ozone adsorption at 473K were found to be almost entirely inactive in SCO where NH3 and O2 desorbed
90
in an intact manner in TPRS experiments. It was observed that extreme oxygenexposures on Ag(111) (θO > 1.93 MLE ) at 140 K led to bulk-like silver oxide(Obulk) species with poor N2 selectivity in ammonia SCO and increasing extentof formation of toxic pollutants such as NO and N2O. Overall reactivity andselectivity trends of ammonia SCO on O/Ag(111) as function of adsorption tem-peratures, oxygen surface coverages and nature of the oxygen species deducedfrom the currently presented experimental findings are summarized in Scheme5.2.
Currently presented experimental findings on Ag(111) single crystal modelcatalyst surface reveal valuable insights as well as new structure-functionalityrelationships at the molecular level regarding the reactivity of oxygen speciesin ammonia SCO. These findings may also possibly be relevant to other crucialheterogeneous catalytic oxidation/partial oxidation/oxidative coupling processesof CO, alkenes and alcohols.
91
Bibliography
[1] J. White and C. T. Campbell, “Surface chemistry in heterogeneous cataly-sis: An emerging discipline,” J. Chem. Educ, vol. 57, no. 7, p. 471, 1980.
[2] J. M. Thomas and W. J. Thomas, Principles and practice of heterogeneouscatalysis. John Wiley & Sons, 1997.
[3] X. Liu, R. J. Madix, and C. M. Friend, “Unraveling molecular transforma-tions on surfaces: a critical comparison of oxidation reactions on coinagemetals,” Chemical Society Reviews, vol. 37, no. 10, pp. 2243–2261, 2008.
[4] M. Qian, M. Liauw, and G. Emig, “Formaldehyde synthesis from methanolover silver catalysts,” Applied Catalysis A: General, vol. 238, no. 2, pp. 211–222, 2003.
[5] R. A. Sheldon, I. Arends, and A. Dijksman, “New developments in catalyticalcohol oxidations for fine chemicals synthesis,” Catalysis Today, vol. 57,no. 1, pp. 157–166, 2000.
[6] T. W. G. Solomons, C. B. Fryhle, and S. A. Snyder, Organic Chemistry.John Wiley & Sons, 2014.
[7] D. I. Enache, J. K. Edwards, P. Landon, B. Solsona-Espriu, A. F. Car-ley, A. A. Herzing, M. Watanabe, C. J. Kiely, D. W. Knight, and G. J.Hutchings, “Solvent-free oxidation of primary alcohols to aldehydes usingAu-Pd/TiO2 catalysts,” Science, vol. 311, no. 5759, pp. 362–365, 2006.
92

[8] S. Biella and M. Rossi, “Gas phase oxidation of alcohols to aldehydes orketones catalysed by supported gold,” Chemical Communications, no. 3,pp. 378–379, 2003.
[9] A. Wittstock, V. Zielasek, J. Biener, C. Friend, and M. Baumer,“Nanoporous gold catalysts for selective gas-phase oxidative coupling ofmethanol at low temperature,” Science, vol. 327, no. 5963, pp. 319–322,2010.
[10] L. Chmielarz and M. Jab lonska, “Advances in selective catalytic oxida-tion of ammonia to dinitrogen: a review,” RSC Advances, vol. 5, no. 54,pp. 43408–43431, 2015.
[11] J. E. Huheey, E. Keiter, and R. Keiter, Inorganic Chemistry-Principles ofStructure and Reactivity. Harper Collins College Publishers, New York,1993.
[12] D. R. Lide, “CRC handbook of chemistry and physics,” 12J204, 1947.
[13] G. Somorjai, “Active sites in heterogeneous catalysis,” Advances in cataly-sis, vol. 26, pp. 1–68, 1977.
[14] J. Gong, “Structure and surface chemistry of gold-based model catalysts,”Chemical reviews, vol. 112, no. 5, pp. 2987–3054, 2011.
[15] M. Pan, J. Gong, G. Dong, and C. B. Mullins, “Model studies with gold:a versatile oxidation and hydrogenation catalyst,” Accounts of chemicalresearch, vol. 47, no. 3, pp. 750–760, 2013.
[16] M. Dean and M. Bowker, “Adsorption studies on catalysts under UHV/HVconditions: I. oxygen adsorption on alumina supported silver,” Applied sur-face science, vol. 35, no. 1, pp. 27–40, 1988.
[17] G. C. Bond, P. A. Sermon, G. Webb, D. A. Buchanan, and P. B. Wells,“Hydrogenation over supported gold catalysts,” Journal of the ChemicalSociety, Chemical Communications, no. 13, pp. 444b–445, 1973.
93
[18] G. J. Hutchings, “Vapor phase hydrochlorination of acetylene: Correla-tion of catalytic activity of supported metal chloride catalysts,” Journal ofCatalysis, vol. 96, no. 1, pp. 292–295, 1985.
[19] M. Haruta, T. Kobayashi, H. Sano, and N. Yamada, “Novel gold catalystsfor the oxidation of carbon monoxide at a temperature far below 0 oC,”Chemistry Letters, vol. 16, no. 2, pp. 405–408, 1987.
[20] G. C. Bond and D. T. Thompson, “Catalysis by gold,” Catalysis Reviews,vol. 41, no. 3-4, pp. 319–388, 1999.
[21] A. S. K. Hashmi and G. J. Hutchings, “Gold catalysis,” Angewandte ChemieInternational Edition, vol. 45, no. 47, pp. 7896–7936, 2006.
[22] B. Xu, R. J. Madix, and C. M. Friend, “Predicting gold-mediated catalyticoxidative-coupling reactions from single crystal studies,” Accounts of chem-ical research, vol. 47, no. 3, pp. 761–772, 2014.
[23] B. Min, A. Alemozafar, D. Pinnaduwage, X. Deng, and C. Friend, “Efficientco oxidation at low temperature on au (111),” The Journal of PhysicalChemistry B, vol. 110, no. 40, pp. 19833–19838, 2006.
[24] T. A. Baker, B. Xu, X. Liu, E. Kaxiras, and C. M. Friend, “Nature of oxida-tion of the Au (111) surface: Experimental and theoretical investigation,”The Journal of Physical Chemistry C, vol. 113, no. 38, pp. 16561–16564,2009.
[25] R. A. Ojifinni, J. Gong, D. W. Flaherty, T. S. Kim, and C. B. Mullins,“Annealing effect on reactivity of oxygen-covered Au (111),” The Journalof Physical Chemistry C, vol. 113, no. 22, pp. 9820–9825, 2009.
[26] A. Krozer and M. Rodahl, “X-ray photoemission spectroscopy study ofUV/ozone oxidation of Au under ultrahigh vacuum conditions,” Journal ofVacuum Science & Technology A: Vacuum, Surfaces, and Films, vol. 15,no. 3, pp. 1704–1709, 1997.
[27] H. Tsai, E. Hu, K. Perng, M. Chen, J.-C. Wu, and Y.-S. Chang, “Instabilityof gold oxide Au2O3,” Surface science, vol. 537, no. 1, pp. L447–L450, 2003.
94

[28] A. Y. Klyushin, T. C. Rocha, M. Havecker, A. Knop-Gericke, andR. Schlogl, “A near ambient pressure XPS study of Au oxidation,” PhysicalChemistry Chemical Physics, vol. 16, no. 17, pp. 7881–7886, 2014.
[29] B. K. Min and C. M. Friend, “Heterogeneous gold-based catalysis for greenchemistry: low-temperature CO oxidation and propene oxidation,” Chem-ical Reviews, vol. 107, no. 6, pp. 2709–2724, 2007.
[30] B. Min, X. Deng, D. Pinnaduwage, R. Schalek, and C. Friend, “Oxygen-induced restructuring with release of gold atoms from Au (111),” PhysicalReview B, vol. 72, no. 12, p. 121410, 2005.
[31] T. A. Baker, C. M. Friend, and E. Kaxiras, “Effects of chlorine and oxygencoverage on the structure of the Au (111) surface,” The Journal of chemicalphysics, vol. 130, no. 8, p. 084701, 2009.
[32] T. A. Baker, C. M. Friend, and E. Kaxiras, “Atomic oxygen adsorptionon Au (111) surfaces with defects,” The Journal of Physical Chemistry C,vol. 113, no. 8, pp. 3232–3238, 2009.
[33] T. A. Baker, X. Liu, and C. M. Friend, “The mystery of gold’s chemi-cal activity: local bonding, morphology and reactivity of atomic oxygen,”Physical Chemistry Chemical Physics, vol. 13, no. 1, pp. 34–46, 2011.
[34] G. Rovida, F. Pratesi, M. Maglietta, and E. Ferroni, “Effects of oxygen onsilver surface structure,” Journal of Vacuum Science and Technology, vol. 9,no. 2, pp. 796–799, 1972.
[35] G. Rovida, F. Pratesi, M. Maglietta, and E. Ferroni, “Chemisorption ofoxygen on the silver (111) surface,” Surface Science, vol. 43, no. 1, pp. 230–256, 1974.
[36] H. Engelhardt and D. Menzel, “Adsorption of oxygen on silver single crystalsurfaces,” Surface Science, vol. 57, no. 2, pp. 591–618, 1976.
[37] R. Grant and R. Lambert, “Basic studies of the oxygen surface chemistryof silver: chemisorbed atomic and molecular species on pure Ag (111),”Surface science, vol. 146, no. 1, pp. 256–268, 1984.
95
[38] C. T. Campbell, “Atomic and molecular oxygen adsorption on Ag (111),”Surface Science, vol. 157, no. 1, pp. 43–60, 1985.
[39] V. Bukhtiyarov, A. Boronin, and V. Savchenko, “Two oxygen states and therole of carbon in partial oxidation of ethylene over silver,” Surface Science,vol. 232, no. 1-2, pp. L205–L209, 1990.
[40] X. Bao, M. Muhler, T. Schedel-Niedrig, and R. Schlogl, “Interaction of oxy-gen with silver at high temperature and atmospheric pressure: a spectro-scopic and structural analysis of a strongly bound surface species,” PhysicalReview B, vol. 54, no. 3, p. 2249, 1996.
[41] V. Bukhtiyarov, V. Kaichev, and I. Prosvirin, “Oxygen adsorption on Ag(111): X-ray photoelectron spectroscopy (XPS), angular dependent x-rayphotoelectron spectroscopy (ADXPS) and temperature-programmed des-orption (TPD) studies,” The Journal of chemical physics, vol. 111, no. 5,pp. 2169–2175, 1999.
[42] V. I. Bukhtiyarov, M. Havecker, V. V. Kaichev, A. Knop-Gericke, R. W.Mayer, and R. Schlogl, “Atomic oxygen species on silver: Photoelectronspectroscopy and x-ray absorption studies,” Physical Review B, vol. 67,no. 23, p. 235422, 2003.
[43] W. Huang and J. White, “Revisiting NO2 on Ag (111): A detailed TPDand RAIRS study,” Surface science, vol. 529, no. 3, pp. 455–470, 2003.
[44] A. Reicho, A. Stierle, I. Costina, and H. Dosch, “Stranski–krastanov like ox-ide growth on Ag (111) at atmospheric oxygen pressures,” Surface science,vol. 601, no. 4, pp. L19–L23, 2007.
[45] W.-X. Li, C. Stampfl, and M. Scheffler, “Subsurface oxygen and surfaceoxide formation at Ag (111): A density-functional theory investigation,”Physical review B, vol. 67, no. 4, p. 045408, 2003.
[46] A. Michaelides, M.-L. Bocquet, P. Sautet, A. Alavi, and D. King, “Struc-tures and thermodynamic phase transitions for oxygen and silver oxidephases on Ag {111},” Chemical physics letters, vol. 367, no. 3, pp. 344–350,2003.
96

[47] Y. Xu, J. Greeley, and M. Mavrikakis, “Effect of subsurface oxygen onthe reactivity of the Ag (111) surface,” Journal of the American ChemicalSociety, vol. 127, no. 37, pp. 12823–12827, 2005.
[48] M. Schmid, A. Reicho, A. Stierle, I. Costina, J. Klikovits, P. Kostelnik,O. Dubay, G. Kresse, J. Gustafson, E. Lundgren, et al., “Structure of Ag(111) - p(4×4)-O: No silver oxide,” Physical review letters, vol. 96, no. 14,p. 146102, 2006.
[49] J. Schnadt, A. Michaelides, J. Knudsen, R. T. Vang, K. Reuter, E. Lægs-gaard, M. Scheffler, and F. Besenbacher, “Revisiting the structure of thep(4×4) surface oxide on Ag (111),” Physical review letters, vol. 96, no. 14,p. 146101, 2006.
[50] J. Schnadt, J. Knudsen, X. L. Hu, A. Michaelides, R. T. Vang, K. Reuter,Z. Li, E. Lægsgaard, M. Scheffler, and F. Besenbacher, “Experimental andtheoretical study of oxygen adsorption structures on Ag (111),” PhysicalReview B, vol. 80, no. 7, p. 075424, 2009.
[51] X. Bao, M. Muhler, B. Pettinger, R. Schlogl, and G. Ertl, “On the nature ofthe active state of silver during catalytic oxidation of methanol,” Catalysisletters, vol. 22, no. 3, pp. 215–225, 1993.
[52] V. Bukhtiyarov, I. Prosvirin, and R. Kvon, “Study of reactivity of oxygenstates adsorbed at a silver surface towards C2H4 by XPS, TPD and TPR,”Surface science, vol. 320, no. 1-2, pp. L47–L50, 1994.
[53] C. Carlisle, D. King, M.-L. Bocquet, J. Cerda, and P. Sautet, “Imagingthe surface and the interface atoms of an oxide film on Ag {111} by scan-ning tunneling microscopy: Experiment and theory,” Physical review let-ters, vol. 84, no. 17, p. 3899, 2000.
[54] X. Bao, J. Barth, G. Lehmpfuhl, R. Schuster, Y. Uchida, R. Schlogl,and G. Ertl, “Oxygen-induced restructuring of Ag (111),” Surface science,vol. 284, no. 1-2, pp. 14–22, 1993.
97
[55] A. Michaelides, K. Reuter, and M. Scheffler, “When seeing is not believ-ing: Oxygen on Ag (111), a simple adsorption system?,” Journal of Vac-uum Science & Technology A: Vacuum, Surfaces, and Films, vol. 23, no. 6,pp. 1487–1497, 2005.
[56] S. Gunther, S. Bocklein, J. Wintterlin, M. A. Nino, T. O. Mentes, andA. Locatelli, “Locating catalytically active oxygen on Ag (111) - A spec-tromicroscopy study,” ChemCatChem, vol. 5, no. 11, pp. 3342–3350, 2013.
[57] N. Martin, S. Klacar, H. Gronbeck, J. Knudsen, J. Schnadt, S. Blomberg,J. Gustafson, and E. Lundgren, “High-coverage oxygen-induced surfacestructures on Ag (111),” The Journal of Physical Chemistry C, vol. 118,no. 28, pp. 15324–15331, 2014.
[58] J. Derouin, R. G. Farber, S. L. Heslop, and D. R. Killelea, “Formationof surface oxides and Ag2O thin films with atomic oxygen on Ag (111),”Surface Science, vol. 641, pp. L1–L4, 2015.
[59] T. E. Jones, T. C. Rocha, A. Knop-Gericke, C. Stampfl, R. Schlogl, andS. Piccinin, “Thermodynamic and spectroscopic properties of oxygen onsilver under an oxygen atmosphere,” Physical Chemistry Chemical Physics,vol. 17, no. 14, pp. 9288–9312, 2015.
[60] C. Heine, B. Eren, B. A. Lechner, and M. Salmeron, “A study of the O/Ag(111) system with scanning tunneling microscopy and X-ray photoelectronspectroscopy at ambient pressures,” Surface Science, vol. 652, pp. 51–57,2016.
[61] J. Derouin, R. G. Farber, M. E. Turano, E. V. Iski, and D. R. Killelea,“Thermally selective formation of subsurface oxygen in Ag (111) and con-sequent surface structure,” ACS Catalysis, vol. 6, no. 7, pp. 4640–4646,2016.
[62] B. V. Andryushechkin, V. M. Shevlyuga, T. V. Pavlova, G. M. Zhidomirov,and K. Eltsov, “Structural transformations on an oxidized Ag (111) sur-face,” JETP Letters, vol. 105, no. 5, pp. 292–296, 2017.
98
[63] T. C. Rocha, A. Oestereich, D. V. Demidov, M. Havecker, S. Zafeiratos,G. Weinberg, V. I. Bukhtiyarov, A. Knop-Gericke, and R. Schlogl, “Thesilver-oxygen system in catalysis: new insights by near ambient pressurex-ray photoelectron spectroscopy,” Physical Chemistry Chemical Physics,vol. 14, no. 13, pp. 4554–4564, 2012.
[64] S. L. Schroeder and M. Gottfried, “Temperature-programmed desorption(TPD) thermal desorption spectroscopy (TDS),” Userpage. Chemie. Fu-Berlin. De, pp. 1–22, 2002.
[65] J. W. Niemantsverdriet, Spectroscopy in catalysis. John Wiley & Sons,2007.
[66] D. A. King, “Thermal desorption from metal surfaces: A review,” SurfaceScience, vol. 47, no. 1, pp. 384–402, 1975.
[67] I. Chorkendorff and J. W. Niemantsverdriet, Concepts of modern catalysisand kinetics. John Wiley & Sons, 2003.
[68] S. J. Garrett, “CHEM924 lecture notes, special topics in analyticalchemistry- introduction to surface analysis,” pp. 13.8–13.10, 2001.
[69] P. Redhead, “Thermal desorption of gases,” Vacuum, vol. 12, no. 4, pp. 203–211, 1962.
[70] E. Habenschaden and J. Kuppers, “Evaluation of flash desorption spectra,”Surface Science, vol. 138, no. 1, pp. L147–L150, 1984.
[71] C. C. Chusuei and D. W. Goodman, “X-ray photoelectron spectroscopy,”Encyclopedia of physical science and technology, vol. 17, pp. 921–938, 2002.
[72] Riber, “X-ray source model CX 700 and its power supply unit model ACX700,” Instruction Manual, vol. No: 608 362 02 P.
[73] Riber, “MAC 2 - analysis module and EA 150 - analyser,” InstructionsManual, vol. No: 608 361 82 T.
[74] F. M. Hoffmann, “Infrared reflection-absorption spectroscopy of adsorbedmolecules,” Surface Science Reports, vol. 3, no. 2-3, pp. 107109–192, 1983.
99
[75] H. Bubert and H. Jenett, “Surface and thin film analysis: principles, in-strumentation, applications,” 2002.
[76] J. Pireaux, M. Chtaib, J. Delrue, P. Thiry, M. Liehr, and R. Caudano,“Electron spectroscopic characterization of oxygen adsorption on gold sur-faces: I. substrate impurity effects on molecular oxygen adsorption in ultrahigh vacuum,” Surface science, vol. 141, no. 1, pp. 211–220, 1984.
[77] X. Deng, B. K. Min, A. Guloy, and C. M. Friend, “Enhancement of O2
dissociation on Au (111) by adsorbed oxygen: implications for oxidationcatalysis,” Journal of the American Chemical Society, vol. 127, no. 25,pp. 9267–9270, 2005.
[78] R. Ford and J. Pritchard, “Chemisorption of oxygen on gold,” ChemicalCommunications (London), no. 7, pp. 362–363, 1968.
[79] J. Gottfried, K. Schmidt, S. Schroeder, and K. Christmann, “Spontaneousand electron-induced adsorption of oxygen on Au (110)-(1×2),” Surfacescience, vol. 511, no. 1, pp. 65–82, 2002.
[80] T. S. Kim, J. D. Stiehl, C. T. Reeves, R. J. Meyer, and C. B. Mullins,“Cryogenic CO oxidation on TiO2-supported gold nanoclusters precoveredwith atomic oxygen,” Journal of the American Chemical Society, vol. 125,no. 8, pp. 2018–2019, 2003.
[81] J. Pireaux, M. Liehr, P. Thiry, J. Delrue, and R. Caudano, “Electron spec-troscopic characterization of oxygen adsorption on gold surfaces: II. pro-duction of gold oxide in oxygen DC reactive sputtering,” Surface science,vol. 141, no. 1, pp. 221–232, 1984.
[82] J. Wang, M. R. Voss, H. Busse, and B. E. Koel, “Chemisorbed oxygen onAu (111) produced by a novel route: reaction in condensed films of NO2+
H2O,” The Journal of Physical Chemistry B, vol. 102, no. 24, pp. 4693–4696, 1998.
100
[83] D. H. Parker and B. E. Koel, “Chemisorption of high coverages of atomicoxygen on the Pt (111), Pd (111), and Au (111) surfaces,” Journal of Vac-uum Science & Technology A: Vacuum, Surfaces, and Films, vol. 8, no. 3,pp. 2585–2590, 1990.
[84] J. Wang and B. E. Koel, “IRAS studies of NO2, N2O3, and N2O4 adsorbedon Au (111) surfaces and reactions with coadsorbed H2O,” The Journal ofPhysical Chemistry A, vol. 102, no. 44, pp. 8573–8579, 1998.
[85] J. Wang and B. E. Koel, “Reactions of N2O4 with ice at low temperatureson the Au (111) surface,” Surface science, vol. 436, no. 1, pp. 15–28, 1999.
[86] J. Barth, H. Brune, G. Ertl, and R. Behm, “Scanning tunneling microscopyobservations on the reconstructed Au (111) surface: Atomic structure, long-range superstructure, rotational domains, and surface defects,” PhysicalReview B, vol. 42, no. 15, p. 9307, 1990.
[87] M. Van Hove, R. Koestner, P. Stair, J. Biberian, L. L. Kesmodel, I. Bartos,and G. Somorjai, “The surface reconstructions of the (100) crystal facesof iridium, platinum and gold: I. experimental observations and possiblestructural models,” Surface Science, vol. 103, no. 1, pp. 189–217, 1981.
[88] U. Harten, A. Lahee, J. P. Toennies, and C. Woll, “Observation of a soli-ton reconstruction of Au (111) by high-resolution helium-atom diffraction,”Physical review letters, vol. 54, no. 24, p. 2619, 1985.
[89] Y. Hasegawa and P. Avouris, “Manipulation of the reconstruction ofthe Au (111) surface with the stm,” SCIENCE-NEW YORK THENWASHINGTON-, vol. 258, pp. 1763–1763, 1992.
[90] Y. Wang, N. S. Hush, and J. R. Reimers, “Simulation of the Au(111)-(22×3) surface reconstruction,” Physical Review B, vol. 75, no. 23,p. 233416, 2007.
[91] R. Meyer, C. Lemire, S. K. Shaikhutdinov, and H.-J. Freund, “Surfacechemistry of catalysis by gold,” Gold Bulletin, vol. 37, no. 1-2, pp. 72–124,2004.
101
[92] J. Chastain, R. C. King, and J. Moulder, Handbook of X-ray photoelectronspectroscopy: a reference book of standard spectra for identification andinterpretation of XPS data. Physical Electronics Division, Perkin-ElmerCorporation Eden Prairie, Minnesota, 1992.
[93] N. Saliba, D. Parker, and B. Koel, “Adsorption of oxygen on Au (111) byexposure to ozone,” Surface science, vol. 410, no. 2, pp. 270–282, 1998.
[94] J. Gong and C. B. Mullins, “Surface science investigations of oxidativechemistry on gold,” Accounts of chemical research, vol. 42, no. 8, pp. 1063–1073, 2009.
[95] A. G. Sault, R. J. Madix, and C. T. Campbell, “Adsorption of oxygen andhydrogen on Au (110)-(1×2),” Surface science, vol. 169, no. 2-3, pp. 347–356, 1986.
[96] K. A. Davis and D. W. Goodman, “Propene adsorption on clean andoxygen-covered Au (111) and Au (100) surfaces,” The Journal of Physi-cal Chemistry B, vol. 104, no. 35, pp. 8557–8562, 2000.
[97] J. Gong, R. A. Ojifinni, T. S. Kim, J. D. Stiehl, S. M. McClure, J. M. White,and C. B. Mullins, “Low temperature CO oxidation on Au (111) and therole of adsorbed water,” Topics in Catalysis, vol. 44, no. 1, pp. 57–63, 2007.
[98] J. L. Gland and E. B. Kollin, “Carbon monoxide oxidation on the Pt (111)surface: Temperature programmed reaction of coadsorbed atomic oxygenand carbon monoxide,” The Journal of Chemical Physics, vol. 78, no. 2,pp. 963–974, 1983.
[99] P. S. Bagus, C. Brundle, F. Illas, F. Parmigiani, and G. Polzonetti, “Evi-dence for oxygen-island formation on Al (111): Cluster-model theory and x-ray photoelectron spectroscopy,” Physical Review B, vol. 44, no. 16, p. 9025,1991.
[100] I. Nakai, H. Kondoh, K. Amemiya, M. Nagasaka, T. Shimada, R. Yokota,A. Nambu, and T. Ohta, “Mechanism of the CO oxidation reaction on O-precovered Pt (111) surfaces studied with near-edge x-ray absorption fine
102
structure spectroscopy,” The Journal of chemical physics, vol. 122, no. 13,p. 134709, 2005.
[101] J. Gottfried, K. Schmidt, S. Schroeder, and K. Christmann, “Oxygenchemisorption on Au (110)-(1×2) I. thermal desorption measurements,”Surface science, vol. 525, no. 1, pp. 184–196, 2003.
[102] S. D. Miller and J. R. Kitchin, “Relating the coverage dependence of oxygenadsorption on Au and Pt fcc (111) surfaces through adsorbate-induced sur-face electronic structure effects,” Surface Science, vol. 603, no. 5, pp. 794–801, 2009.
[103] B. Koslowski, H.-G. Boyen, C. Wilderotter, G. Kastle, P. Ziemann,R. Wahrenberg, and P. Oelhafen, “Oxidation of preferentially (111)-orientedAu films in an oxygen plasma investigated by scanning tunneling microscopyand photoelectron spectroscopy,” Surface science, vol. 475, no. 1, pp. 1–10,2001.
[104] H. Shi and C. Stampfl, “First-principles investigations of the structure andstability of oxygen adsorption and surface oxide formation at Au (111),”Physical Review B, vol. 76, no. 7, p. 075327, 2007.
[105] C. R. Aita and N. C. Tran, “Core level and valence band x-ray photoelectronspectroscopy of gold oxide,” Journal of Vacuum Science & Technology A:Vacuum, Surfaces, and Films, vol. 9, no. 3, pp. 1498–1500, 1991.
[106] J. Kim, Z. Dohnalek, and B. D. Kay, “Cryogenic CO2 formation on oxidizedgold clusters synthesized via reactive layer assisted deposition,” Journal ofthe American Chemical Society, vol. 127, no. 42, pp. 14592–14593, 2005.
[107] J. Gong, D. W. Flaherty, R. A. Ojifinni, J. M. White, and C. B. Mullins,“Surface chemistry of methanol on clean and atomic oxygen pre-covered Au(111),” The Journal of Physical Chemistry C, vol. 112, no. 14, pp. 5501–5509, 2008.
[108] W.-S. Sim, P. Gardner, and D. King, “The interaction of methanol withclean and oxygen-precovered Ag {111}: A RAIRS study,” Surface Reviewand Letters, vol. 1, no. 04, pp. 673–676, 1994.
103

[109] B. Sexton, A. Hughes, and N. Avery, “A spectroscopic study of the ad-sorption and reactions of methanol, formaldehyde and methyl formate onclean and oxygenated Cu (110) surfaces,” Surface science, vol. 155, no. 1,pp. 366–386, 1985.
[110] S. Senozan, H. Ustunel, M. Karatok, E. I. Vovk, A. A. Shah, E. Ozensoy,and D. Toffoli, “Comparative analysis of reactant and product adsorptionenergies in the selective oxidative coupling of alcohols to esters on Au (111),”Topics in Catalysis, vol. 59, no. 15-16, pp. 1383–1393, 2016.
[111] D. Outka and R. Madix, “Bronsted basicity of atomic oxygen on the Au(110) surface: reactions with methanol, acetylene, water, and ethylene,”Journal of the American Chemical Society, vol. 109, no. 6, pp. 1708–1714,1987.
[112] “NIST ChemistryW ebbook, http://webbook.nist.gov/cgi/cbook.cgi?id=c107313&units=si&mask=200#mass-spec,” (accessed Sept 10, 2017), Massspectrum of methyl formate.
[113] B. Xu, X. Liu, J. Haubrich, R. J. Madix, and C. M. Friend, “Selectivitycontrol in gold-mediated esterification of methanol,” Angewandte ChemieInternational Edition, vol. 48, no. 23, pp. 4206–4209, 2009.
[114] I. S. Nielsen, E. Taarning, K. Egeblad, R. Madsen, and C. H. Christensen,“Direct aerobic oxidation of primary alcohols to methyl esters catalyzed bya heterogeneous gold catalyst,” Catalysis Letters, vol. 116, no. 1-2, pp. 35–40, 2007.
[115] M. Pan, D. W. Flaherty, and C. B. Mullins, “Low-temperature hydrogena-tion of acetaldehyde to ethanol on H-precovered Au (111),” The Journal ofPhysical Chemistry Letters, vol. 2, no. 12, pp. 1363–1367, 2011.
[116] M. A. Henderson, Y. Zhou, and J. White, “Polymerization and decom-position of acetaldehyde on Ru (001),” Journal of the American ChemicalSociety, vol. 111, no. 4, pp. 1185–1193, 1989.
104
[117] H. Zhao, J. Kim, and B. E. Koel, “Adsorption and reaction of acetaldehydeon Pt (111) and Sn/Pt (111) surface alloys,” Surface science, vol. 538, no. 3,pp. 147–159, 2003.
[118] W. Sim, P. Gardner, and D. King, “Surface-bound helical polyacetaldehydechains and bidentate acetate intermediates on Ag {111},” Journal of theAmerican Chemical Society, vol. 118, no. 41, pp. 9953–9959, 1996.
[119] J. Davis and M. Barteau, “Polymerization and decarbonylation reactionsof aldehydes on the Pd (111) surface,” Journal of the American ChemicalSociety, vol. 111, no. 5, pp. 1782–1792, 1989.
[120] M. Karatok, E. I. Vovk, A. A. Shah, A. Turksoy, and E. Ozensoy, “Ac-etaldehyde partial oxidation on the Au (111) model catalyst surface: C–Cbond activation and formation of methyl acetate as an oxidative couplingproduct,” Surface Science, vol. 641, pp. 289–293, 2015.
[121] Y. Li and M. Bowker, “Acetic acid on Rh (110): The stabilization and au-tocatalytic decomposition of acetate,” Journal of Catalysis, vol. 142, no. 2,pp. 630–640, 1993.
[122] G. B. Fisher, “The electronic structure of two forms of molecular ammoniaadsorbed on Pt (111),” Chemical Physics Letters, vol. 79, no. 3, pp. 452–458, 1981.
[123] R. Van Hardeveld, R. Van Santen, and J. Niemantsverdriet, “The adsorp-tion of NH3 on Rh (111),” Surface science, vol. 369, no. 1-3, pp. 23–35,1996.
[124] A. Santra, B. Min, C. Yi, K. Luo, T. Choudhary, and D. Goodman, “De-composition of NH3 on Ir (100): A temperature programmed desorptionstudy,” The Journal of Physical Chemistry B, vol. 106, no. 2, pp. 340–344,2002.
[125] B. D. Kay, K. R. Lykke, J. R. Creighton, and S. J. Ward, “The influence ofadsorbate–absorbate hydrogen bonding in molecular chemisorption: NH3,HF, and H2O on Au (111),” The Journal of chemical physics, vol. 91, no. 8,pp. 5120–5121, 1989.
105

[126] C. Backx, C. De Groot, and P. Biloen, “Adsorption of oxygen on Ag (110)studied by high resolution ELS and TPD,” Surface Science, vol. 104, no. 1,pp. 300–317, 1981.
[127] S. R. Bare, K. Griffiths, W. Lennard, and H. Tang, “Generation of atomicoxygen on Ag (111) and Ag (110) using NO2: a TPD, LEED, HREELS,XPS and NRA study,” Surface science, vol. 342, no. 1-3, pp. 185–198, 1995.
[128] R. Reichelt, S. Gunther, M. Roßler, J. Wintterlin, B. Kubias, B. Jakobi,and R. Schlogl, “High-pressure STM of the interaction of oxygen with Ag(111),” Physical Chemistry Chemical Physics, vol. 9, no. 27, pp. 3590–3599,2007.
[129] H. G. Jenniskens, P. W. Dorlandt, M. F. Kadodwala, and A. W. Kleyn,“The adsorption of methanol on Ag (111) studied with TDS and XPS,”Surface science, vol. 357, pp. 624–628, 1996.
[130] W. Sim, P. Gardner, and D. King, “Structure and reactivity of the surfacemethoxy species on Ag {111},” The Journal of Physical Chemistry, vol. 99,no. 43, pp. 16002–16010, 1995.
[131] J. Russell, S. M. Gates, and J. Yates, “Reaction of methanol with Cu (111)and Cu (111) + O (ads),” Surface science, vol. 163, no. 2-3, pp. 516–540,1985.
[132] W. Sim, P. Gardner, and D. King, “Multiple bonding configurations of ad-sorbed formate on Ag {111},” The Journal of Physical Chemistry, vol. 100,no. 30, pp. 12509–12516, 1996.
[133] J. L. Gland, B. A. Sexton, and G. E. Mitchell, “Ammonia adsorption onthe Ag (110) surface,” Surface Science, vol. 115, no. 3, pp. 623–632, 1982.
[134] E. Salli, S. Martiskainen, and L. Halonen, “Computational study of thevibrational structure of the ammonia molecule adsorbed on the fcc (111)transition metal surfaces,” The Journal of Physical Chemistry C, vol. 116,no. 28, pp. 14960–14969, 2012.
106
[135] Z. Xu, L. Hanley, and J. T. Yates Jr, “Layer interactions between dissim-ilar adsorbates. NH3 layers on chemisorbed CO on Ni (111): A reflectioninfrared study,” The Journal of chemical physics, vol. 96, no. 2, pp. 1621–1627, 1992.
[136] J. Rodriguez, W. K. Kuhn, C. M. Truong, and D. W. Goodman, “A FT-IRAS study of ammonia adsorbed on Ru (0001),” Surface science, vol. 271,no. 3, pp. 333–339, 1992.
[137] I. Villegas and M. J. Weaver, “Infrared spectroscopy of model electrochemi-cal interfaces in ultrahigh vacuum: interfacial cation solvation by ammoniaon Pt (111),” Surface science, vol. 367, no. 2, pp. 162–176, 1996.
[138] C.-M. Pradier, A. Adamski, C. Methivier, and I. Louis-Rose, “Interactionof NH3 and oxygen with Cu (110), investigated by FT-IRAS,” Journal ofMolecular Catalysis A: Chemical, vol. 186, no. 1, pp. 193–201, 2002.
[139] T. Fukushima, M.-B. Song, and M. Ito, “Local work-function changes ofPt (111) studied by STM and IRAS: coadsorption of Cl - with H3O+, NO,and CO molecules,” Surface science, vol. 464, no. 2, pp. 193–199, 2000.
[140] J. Gohndrone, C. Olsen, A. Backman, T. Gow, E. Yagasaki, and R. Masel,“Ammonia adsorption and decomposition on several faces of platinum,”Journal of Vacuum Science & Technology A: Vacuum, Surfaces, and Films,vol. 7, no. 3, pp. 1986–1990, 1989.
[141] A. Klust and R. J. Madix, “Mesoscopic restructuring and mass transport ofmetal atoms during reduction of the Ag(111)-p(4×4)- O surface with CO,”The Journal of chemical physics, vol. 126, no. 8, p. 084707, 2007.
[142] “NIST ChemistryW ebbook, http://webbook.nist.gov/cgi/cbook.cgi?id=c10024972&units=si&mask=200#mass-spec,” (accessed Sept 10, 2017),Mass spectrum of nitrous oxide.
[143] “NIST ChemistryW ebbook, http://webbook.nist.gov/cgi/cbook.cgi?id=c64197&units=si&mask=200#mass-spec,” (accessed Sept 10, 2017), Massspectrum of acetic acid.
107
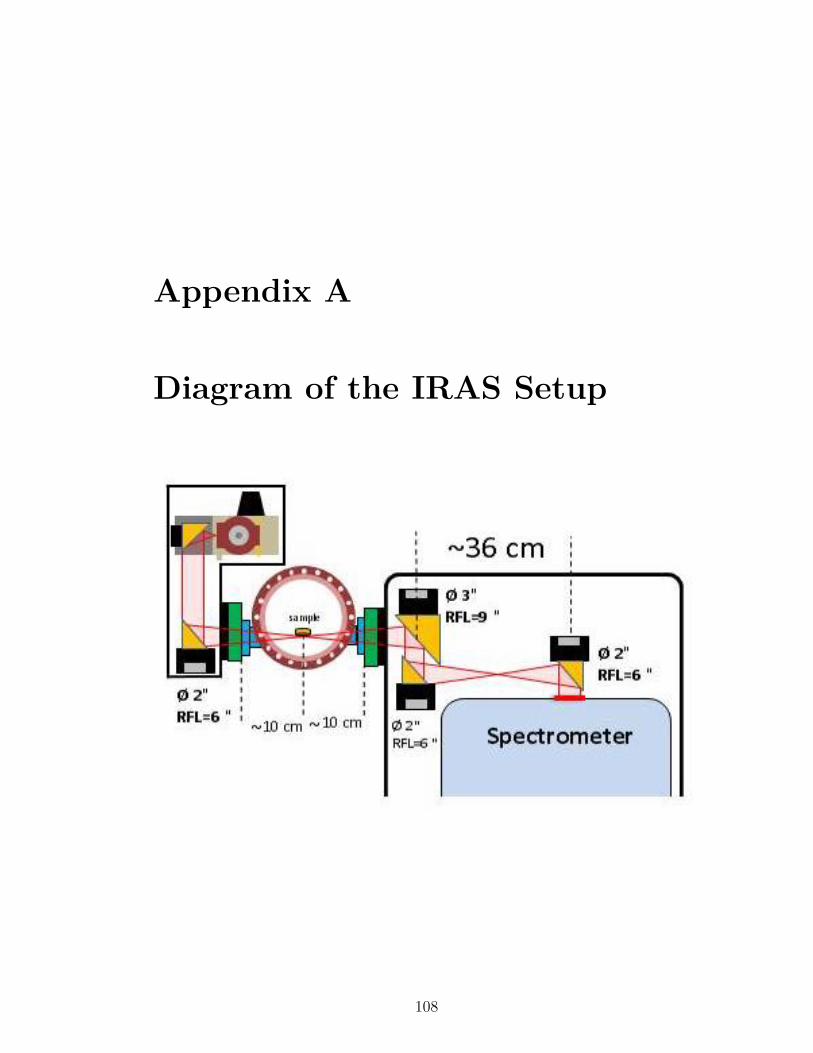
Appendix A
Diagram of the IRAS Setup
108
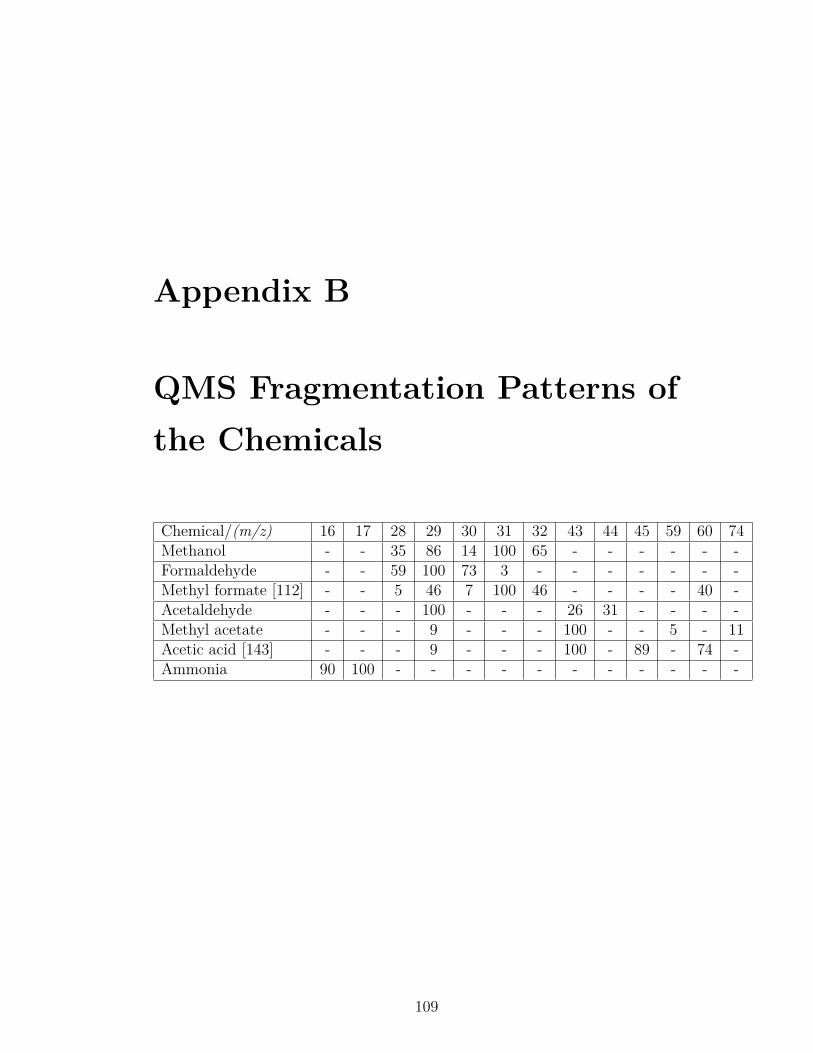
Appendix B
QMS Fragmentation Patterns ofthe Chemicals
Chemical/(m/z) 16 17 28 29 30 31 32 43 44 45 59 60 74Methanol - - 35 86 14 100 65 - - - - - -Formaldehyde - - 59 100 73 3 - - - - - - -Methyl formate [112] - - 5 46 7 100 46 - - - - 40 -Acetaldehyde - - - 100 - - - 26 31 - - - -Methyl acetate - - - 9 - - - 100 - - 5 - 11Acetic acid [143] - - - 9 - - - 100 - 89 - 74 -Ammonia 90 100 - - - - - - - - - - -
109
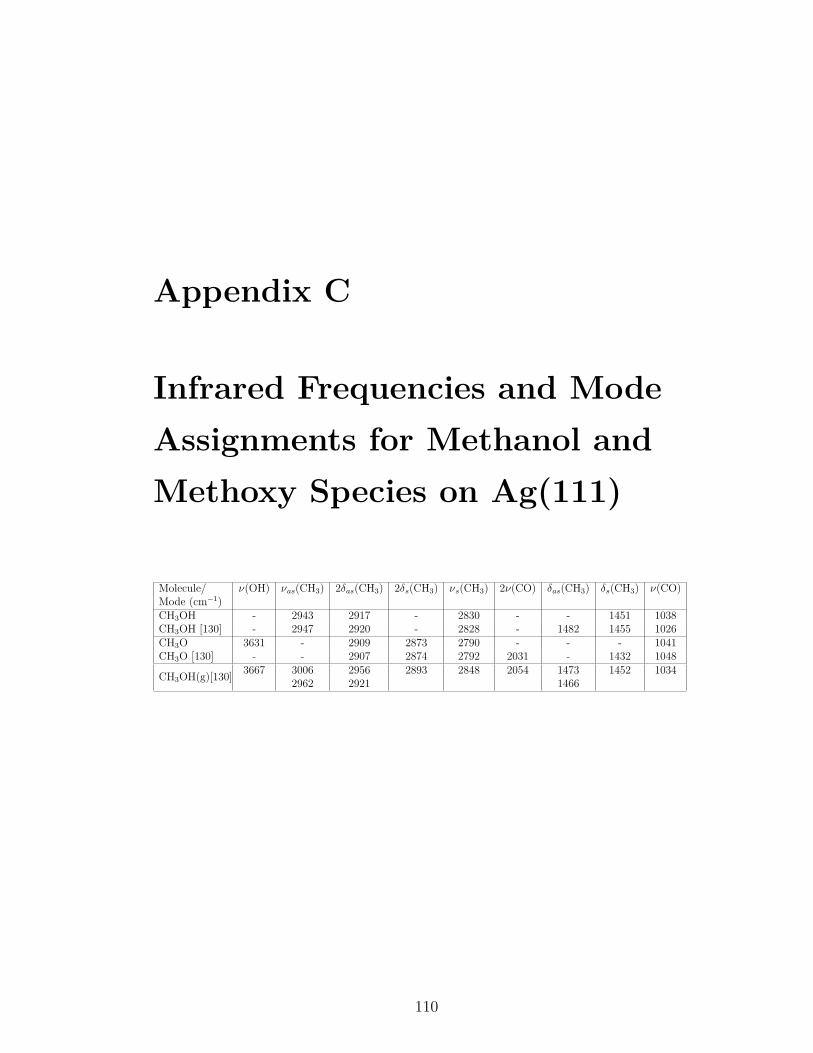
Appendix C
Infrared Frequencies and ModeAssignments for Methanol andMethoxy Species on Ag(111)
Molecule/Mode (cm−1)
ν(OH) νas(CH3) 2δas(CH3) 2δs(CH3) νs(CH3) 2ν(CO) δas(CH3) δs(CH3) ν(CO)
CH3OH - 2943 2917 - 2830 - - 1451 1038CH3OH [130] - 2947 2920 - 2828 - 1482 1455 1026CH3O 3631 - 2909 2873 2790 - - - 1041CH3O [130] - - 2907 2874 2792 2031 - 1432 1048
CH3OH(g)[130] 3667 3006 2956 2893 2848 2054 1473 1452 10342962 2921 1466
110
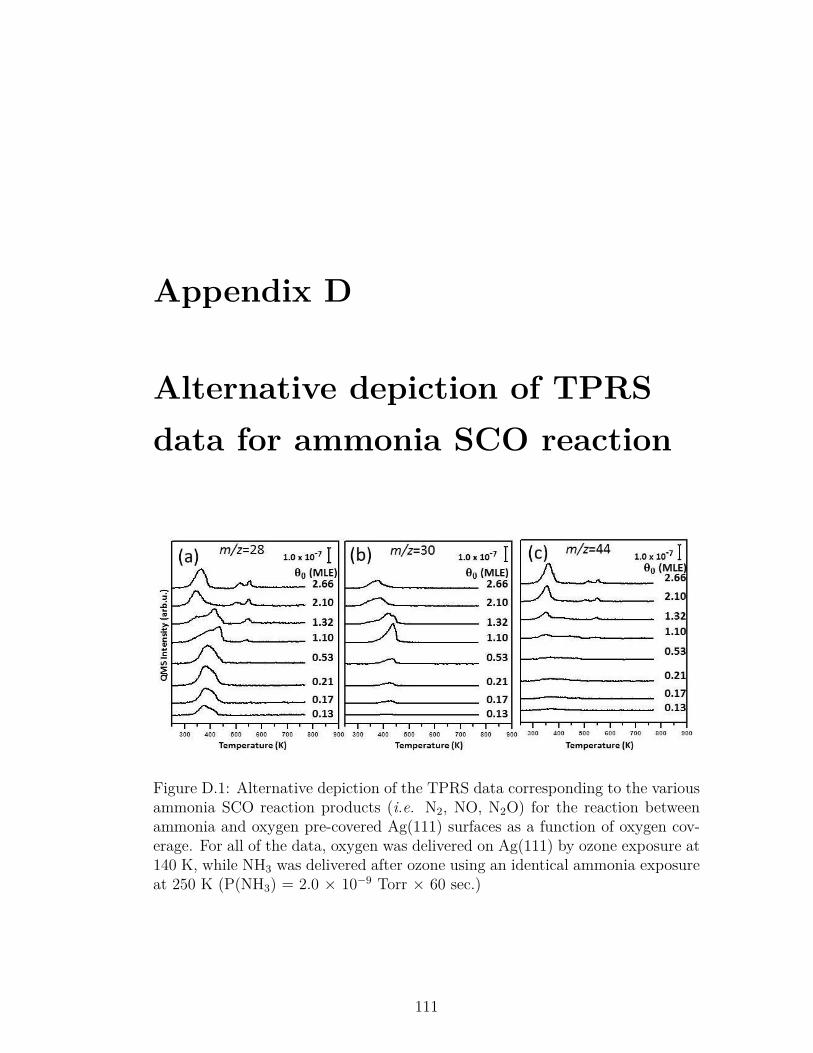
Appendix D
Alternative depiction of TPRSdata for ammonia SCO reaction
Figure D.1: Alternative depiction of the TPRS data corresponding to the variousammonia SCO reaction products (i.e. N2, NO, N2O) for the reaction betweenammonia and oxygen pre-covered Ag(111) surfaces as a function of oxygen cov-erage. For all of the data, oxygen was delivered on Ag(111) by ozone exposure at140 K, while NH3 was delivered after ozone using an identical ammonia exposureat 250 K (P(NH3) = 2.0 × 10⁻⁹ Torr × 60 sec.)
111

Appendix E
TPRS profiles for NH3 and H2Oduring ammonia SCO reaction
Figure E.1: TPRS profiles for NH3 (m/z = 17) and H2O (m/z = 18) desorptionchannels obtained during the reaction between ammonia and oxygen pre-coveredAg(111) surfaces as a function of oxygen coverage as shown in Figure 4.18 of themain text.
112
Appendix F
List of Publications
• Karatok, M., Vovk, E. I., Shah, A. A., Turksoy, A., Ozensoy, E. (2015).Acetaldehyde Partial Oxidation on the Au (111) Model Catalyst Surface:C-C Bond Activation and Formation of Methyl Acetate as an OxidativeCoupling Product. Surface Science, 641, 289-293.
• Senozan, S., Ustunel, H., Karatok, M., Vovk, E. I., Shah, A. A., Ozensoy,E., Toffoli, D. (2016). Comparative Analysis of Reactant and ProductAdsorption Energies in the Selective Oxidative Coupling of Alcohols toEsters on Au (111). Topics in Catalysis, 59(15-16), 1383-1393.
• Erdogan, D. A., Sevim, M., Kısa, E., Emiroglu, D. B., Karatok, M., Vovk,E. I., Bjerring, M., Akbey, U., Metin, O., Ozensoy, E. (2016). Photocat-alytic Activity of Mesoporous Graphitic Carbon Nitride (mpg-C3N4) to-wards Organic Chromophores under UV and VIS Light Illumination. Top-ics in Catalysis, 59(15-16), 1305-1318.
• Karatok, M., Vovk, E. I., Koc, A. V., Ozensoy, E. (2017). SelectiveCatalytic Ammonia Oxidation to Nitrogen by Atomic Oxygen Species onAg (111). The Journal of Physical Chemistry C, (in press, DOI:10.1021/acs.jpcc.7b08291).
• Karatok, M., Vovk, E. I., Shah, A. A., Ozensoy, E. Revisiting the Natureof Oxygen on Au(111). (in preparation).
113
• Karatok, M., Vovk, E. I., Ozensoy, E. Reactivity of Oxygen Species inMethanol Partial Oxidation Reaction Pathways on Ag(111). (in prepara-tion).
• Ercan, K.E., Say, Z., Kurt, M., Karatok, M., Pantaleo, G., Liotta, L.F., Ozensoy, E. New Generation Pt-Free LaCoxMn1−xO3 Type AdvancedHybrid Perovskites with Fine-Tunable Properties for NOx Removal Systems(in preparation).
• Persembe, E., Karatok, M., Zahmakiran, M., Ozensoy, E. CO-TolerantTrimetallic PgAgCr Nanoparticles Promoted with MnOx for Additive-FreeUltra-Pure Hydrogen Production from Formic Acid. (in preparation).
114