Embed Size (px)
Citation preview

Nature of ScienceNature of Science
Science 1101Science 1101

Nature of ScienceNature of Science
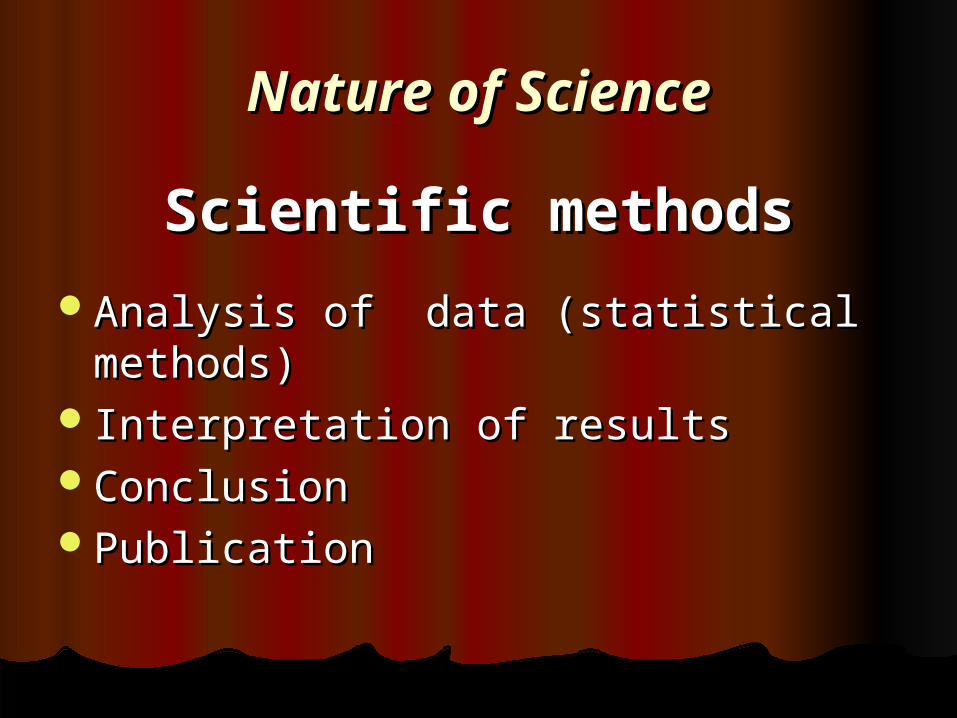
Scientific methodsScientific methods
Formulation of a hypothesisFormulation of a hypothesisSurvey literature/ArchivesSurvey literature/ArchivesDesign experiments considering all Design experiments considering all
Variables (Independant, dependant Variables (Independant, dependant and controlled)and controlled)
Collection of dataCollection of data
Nature of ScienceNature of Science
Scientific methodsScientific methods
Analysis of data (statistical methods)Analysis of data (statistical methods) Interpretation of resultsInterpretation of resultsConclusionConclusionPublicationPublication
Nature of Nature of ScienceScience
Descriptive Descriptive StatisticsStatistics
Measures of Measures of Central TendencyCentral Tendency
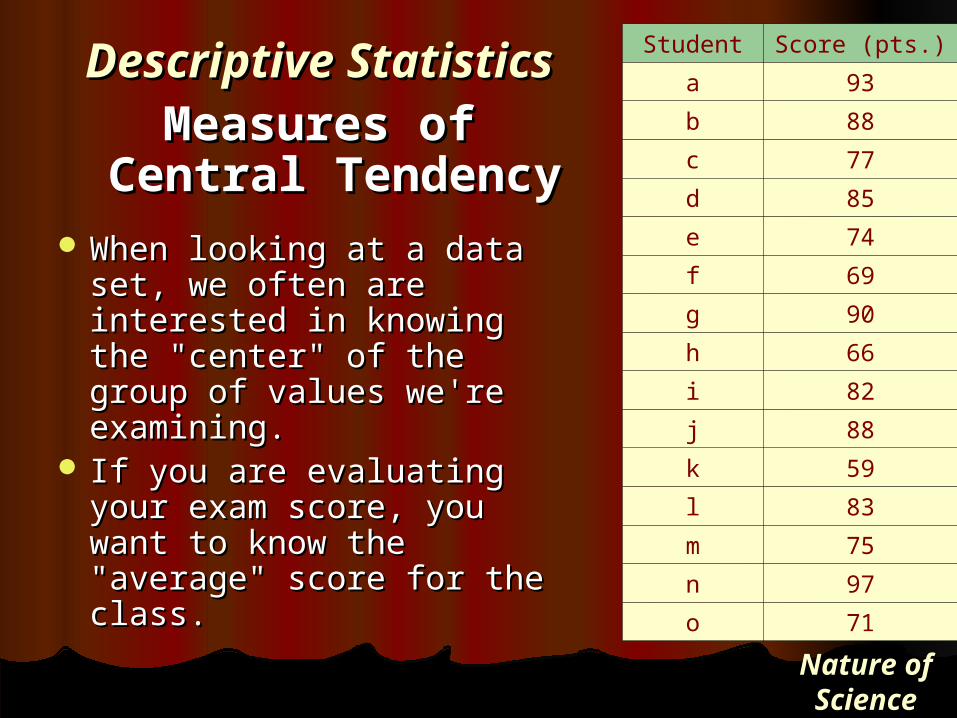
When looking at a data set, When looking at a data set, we often are interested in we often are interested in knowing the "center" of the knowing the "center" of the group of values we're group of values we're examining.examining.
If you are evaluating your If you are evaluating your exam score, you want to exam score, you want to know the "average" score know the "average" score for the class. for the class.
Student Score (pts.)
a 93
b 88
c 77
d 85
e 74
f 69
g 90
h 66
i 82
j 88
k 59
l 83
m 75
n 97
o 71

Nature of Nature of ScienceScience
Descriptive StatisticsDescriptive StatisticsMeasures of Central Measures of Central
TendencyTendency
There are three such There are three such measures of central measures of central tendency: tendency: the mode, the the mode, the median, and the meanmedian, and the mean..
To examine measures of To examine measures of central tendency, it is central tendency, it is helpful to arrange the helpful to arrange the values in descending order. values in descending order.
97, 93, 90, 88, 88, 85, 83, 82, 97, 93, 90, 88, 88, 85, 83, 82, 77, 75, 74, 71, 69, 66, 5977, 75, 74, 71, 69, 66, 59
Student Score (pts.)
a 93
b 88
c 77
d 85
e 74
f 69
g 90
h 66
i 82
j 88
k 59
l 83
m 75
n 97
o 71
Nature of Nature of ScienceScience
Descriptive StatisticsDescriptive StatisticsMeasures of Central TendencyMeasures of Central Tendency
ModeMode The mode of a data set does not need The mode of a data set does not need
to be near the center of the data set, it to be near the center of the data set, it simply has to be the most common.simply has to be the most common.
Modes are useful in that they tell you Modes are useful in that they tell you the most common value in the data set, the most common value in the data set, and can shed some light on the data and can shed some light on the data set's tendencies. set's tendencies.
Nature of Nature of ScienceScience
Descriptive StatisticsDescriptive StatisticsMeasures of Central TendencyMeasures of Central Tendency
MedianMedian The median is the value that occurs in the The median is the value that occurs in the
middle of the data set. middle of the data set. If the data set contains an odd number of If the data set contains an odd number of
values, the median will be the middle value.values, the median will be the middle value. For example, in a ordered data set of 19 For example, in a ordered data set of 19
values, value #10 would be the median as values, value #10 would be the median as there would be nine values below it and nine there would be nine values below it and nine values above it. values above it.
In a data set of 20 values, the median would In a data set of 20 values, the median would be the value halfway between the tenth and be the value halfway between the tenth and eleventh values. eleventh values.
Nature of Nature of ScienceScience
Descriptive StatisticsDescriptive StatisticsMeasures of Central TendencyMeasures of Central Tendency
MeanMean
To calculate the mean you sum all of To calculate the mean you sum all of the values and divide by the number the values and divide by the number of values of values

Nature of Nature of ScienceScience
Descriptive StatisticsDescriptive StatisticsMeasures of Central TendencyMeasures of Central Tendency
RangeRangeThe range describes the highest and The range describes the highest and
lowest values in a data set.lowest values in a data set.The range is commonly used in The range is commonly used in
weather reports, where the daily high weather reports, where the daily high and low temperatures are reported and low temperatures are reported
Nature of Nature of ScienceScience
Descriptive StatisticsDescriptive StatisticsMeasures of Central TendencyMeasures of Central Tendency
Variance and Standard Deviation Variance and Standard Deviation
The variance describes how far each value is The variance describes how far each value is from the mean.from the mean.
While the variance gives you an indication of While the variance gives you an indication of the deviation of each value from the mean, the deviation of each value from the mean, the variance is in "squared" unitsthe variance is in "squared" units
Variance= Substract each value from meanVariance= Substract each value from mean Some values are (+), some (-) and some = 0. Some values are (+), some (-) and some = 0.
Nature of ScienceNature of Science
Descriptive StatisticsDescriptive StatisticsMeasures of Central TendencyMeasures of Central Tendency
Variance and Standard DeviationVariance and Standard Deviation
An absolute value of how much one is deviated An absolute value of how much one is deviated from the mean is to calculate the standard from the mean is to calculate the standard deviation (SD) deviation (SD)
The square root of the variance, which will provide The square root of the variance, which will provide us with a measure of data dispersion is the same us with a measure of data dispersion is the same units as the mean.units as the mean.
This value is known as the standard deviation (SD).This value is known as the standard deviation (SD). The standard deviation is kind of the "mean of the The standard deviation is kind of the "mean of the
mean," and often can help you find the story mean," and often can help you find the story behind the data. To understand this concept, it can behind the data. To understand this concept, it can help to learn about what statisticians call normal help to learn about what statisticians call normal distribution of data.distribution of data.
Nature of ScienceNature of Science
Descriptive StatisticsDescriptive StatisticsMeasures of Central TendencyMeasures of Central Tendency
Variance and Standard DeviationVariance and Standard Deviation
If you looked at normally distributed data on If you looked at normally distributed data on a graph, it would look something like this:a graph, it would look something like this:
The x-axis (the horizontal one) is the value in The x-axis (the horizontal one) is the value in question... calories consumed, for example. question... calories consumed, for example. And the y-axis (the vertical one) is the And the y-axis (the vertical one) is the number of data points for each value on the number of data points for each value on the x-axis... in other words, the number of people x-axis... in other words, the number of people who eat x calorieswho eat x calories
Nature of ScienceNature of Science
Descriptive StatisticsDescriptive StatisticsMeasures of Central TendencyMeasures of Central Tendency
Variance and Standard DeviationVariance and Standard Deviation
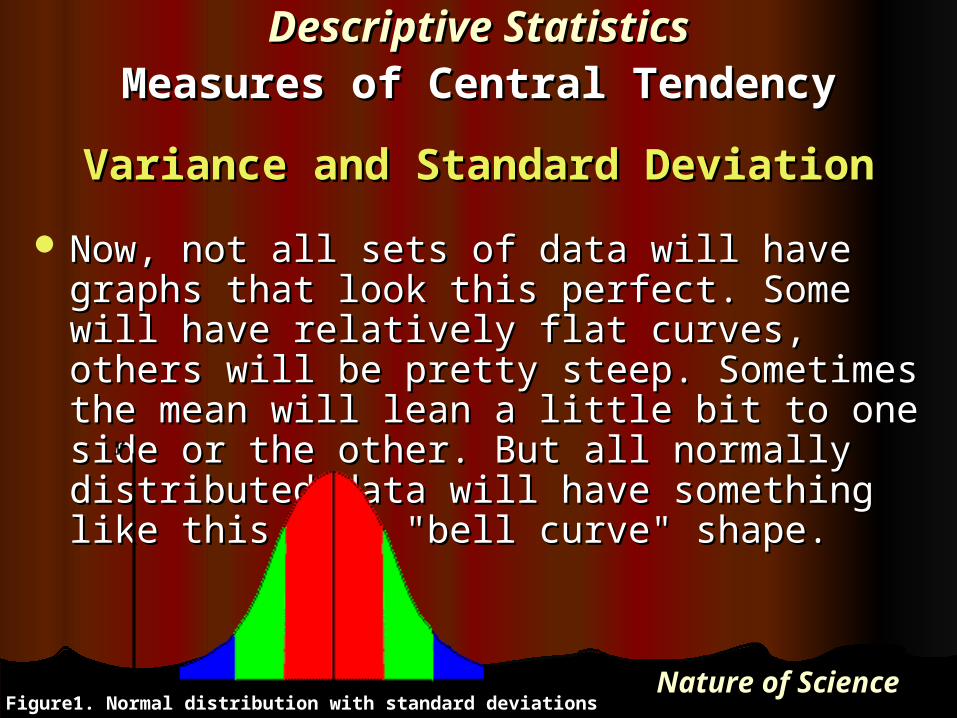
Now, not all sets of data will have graphs Now, not all sets of data will have graphs that look this perfect. Some will have that look this perfect. Some will have relatively flat curves, others will be pretty relatively flat curves, others will be pretty steep. Sometimes the mean will lean a little steep. Sometimes the mean will lean a little bit to one side or the other. But all normally bit to one side or the other. But all normally distributed data will have something like this distributed data will have something like this same "bell curve" shape. same "bell curve" shape.
Nature of ScienceNature of Science
Descriptive StatisticsDescriptive StatisticsMeasures of Central TendencyMeasures of Central Tendency
Variance and Standard DeviationVariance and Standard Deviation
Now, not all sets of data will have graphs Now, not all sets of data will have graphs that look this perfect. Some will have that look this perfect. Some will have relatively flat curves, others will be pretty relatively flat curves, others will be pretty steep. Sometimes the mean will lean a little steep. Sometimes the mean will lean a little bit to one side or the other. But all normally bit to one side or the other. But all normally distributed data will have something like this distributed data will have something like this same "bell curve" shape. same "bell curve" shape.
Figure1. Normal distribution with standard deviations

Nature of ScienceNature of Science
Standard DeviationStandard Deviation
Computing the value of a standard deviation Computing the value of a standard deviation is complicated. But let us see graphically is complicated. But let us see graphically what a standard deviation representswhat a standard deviation represents......
One standard deviation away from the mean in One standard deviation away from the mean in either direction on the horizontal axis (the red area either direction on the horizontal axis (the red area on the above graph) accounts for somewhere on the above graph) accounts for somewhere around 68 percent of the people in this group. around 68 percent of the people in this group.
Two standard deviations away from the mean (the Two standard deviations away from the mean (the red and green areas) account for roughly 95 red and green areas) account for roughly 95 percent of the people. percent of the people.
And three standard deviations (the red, green and And three standard deviations (the red, green and blue areas) account for about 99 percent of the blue areas) account for about 99 percent of the people people

Nature of ScienceNature of Science
HomeworkHomework
Example 1: Brain teaserExample 1: Brain teaser Here is one formula for computing the standard Here is one formula for computing the standard
deviation. deviation. Terms you'll need to knowTerms you'll need to know x = one value in your set of datax = one value in your set of data avg (x) = the mean (average) of all values x in your avg (x) = the mean (average) of all values x in your
set of dataset of data n = the number of values x in your set of datan = the number of values x in your set of data For each value x, subtract the overall avg (x) from x, For each value x, subtract the overall avg (x) from x,
then multiply that result by itself (otherwise known as then multiply that result by itself (otherwise known as determining the square of that value). Sum up all determining the square of that value). Sum up all those squared values. Then divide that result by (n-1). those squared values. Then divide that result by (n-1). Got it? Then, there's one more step... find the square Got it? Then, there's one more step... find the square root of that last number. That's the standard deviation root of that last number. That's the standard deviation of your set of data.of your set of data.
Nature of ScienceNature of Science
Standard DeviationStandard Deviation
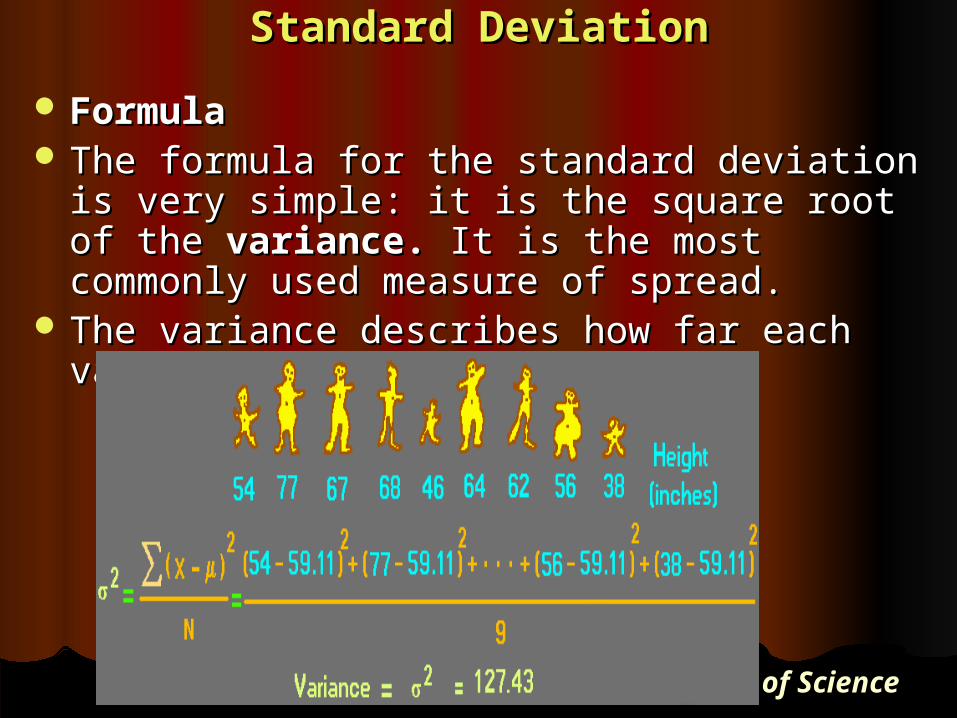
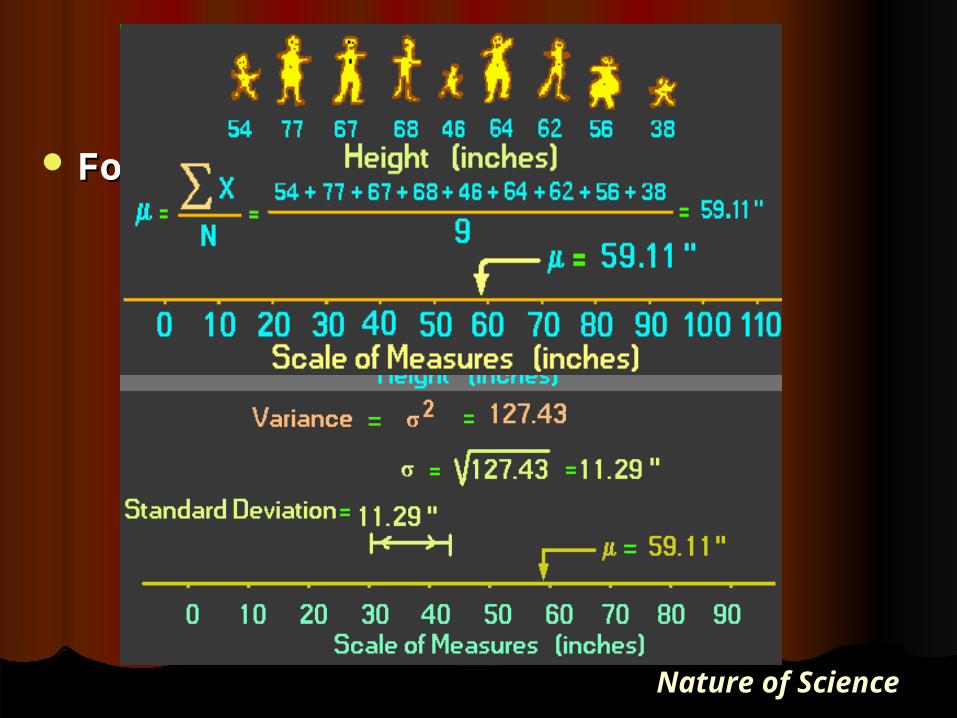
FormulaFormula The formula for the standard deviation is The formula for the standard deviation is
very simple: it is the square root of the very simple: it is the square root of the variance.variance. It is the most commonly used It is the most commonly used measure of spread.measure of spread.
The variance describes how far each value is The variance describes how far each value is from the mean.from the mean.

Nature of ScienceNature of Science
Standard DeviationStandard Deviation
FormulaFormula
Nature of ScienceNature of Science
Standard DeviationStandard Deviation
FormulaFormula
Nature of ScienceNature of Science
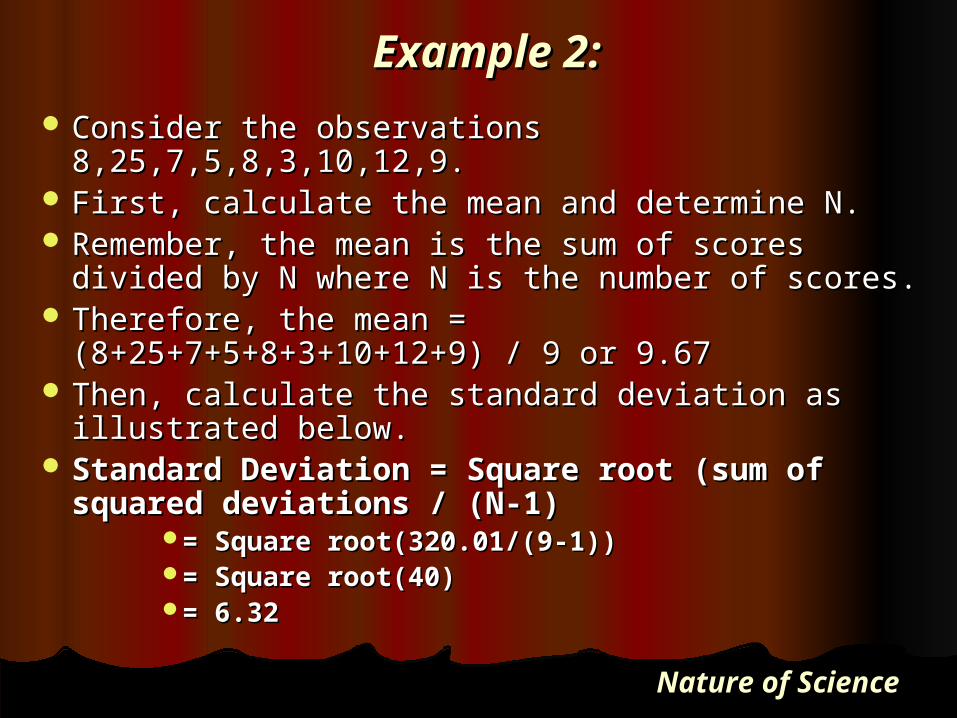
Example 2:Example 2: Consider the observations 8,25,7,5,8,3,10,12,9.Consider the observations 8,25,7,5,8,3,10,12,9. First, calculate the mean and determine N.First, calculate the mean and determine N. Remember, the mean is the sum of scores divided Remember, the mean is the sum of scores divided
by N where N is the number of scores.by N where N is the number of scores. Therefore, the mean = Therefore, the mean =
(8+25+7+5+8+3+10+12+9) / 9 or 9.67(8+25+7+5+8+3+10+12+9) / 9 or 9.67 Then, calculate the standard deviation as Then, calculate the standard deviation as
illustrated below.illustrated below. Standard Deviation = Square root (sum of Standard Deviation = Square root (sum of
squared deviations / (N-1)squared deviations / (N-1)= Square root(320.01/(9-1))= Square root(320.01/(9-1))= Square root(40)= Square root(40)= 6.32= 6.32
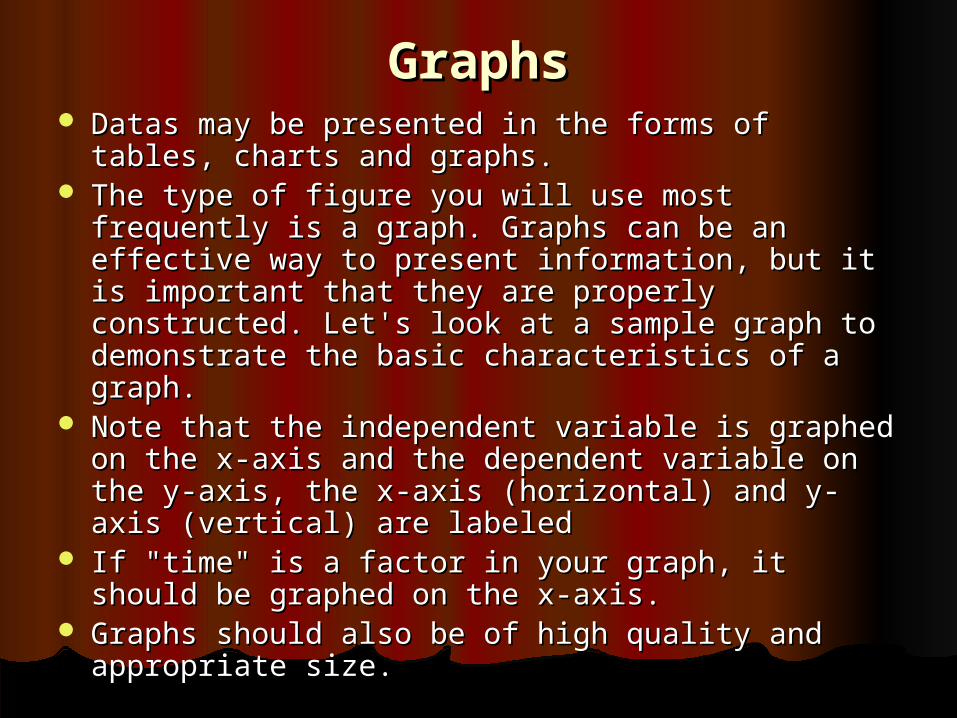
Datas may be presented in the forms of tables, Datas may be presented in the forms of tables, charts and graphs.charts and graphs.
The type of figure you will use most frequently is The type of figure you will use most frequently is a graph. Graphs can be an effective way to a graph. Graphs can be an effective way to present information, but it is important that they present information, but it is important that they are properly constructed. Let's look at a sample are properly constructed. Let's look at a sample graph to demonstrate the basic characteristics of graph to demonstrate the basic characteristics of a graph.a graph.
Note that the independent variable is graphed on Note that the independent variable is graphed on the x-axis and the dependent variable on the y-the x-axis and the dependent variable on the y-axis, the x-axis (horizontal) and y-axis (vertical) axis, the x-axis (horizontal) and y-axis (vertical) are labeled are labeled
If "time" is a factor in your graph, it should be If "time" is a factor in your graph, it should be graphed on the x-axis.graphed on the x-axis.
Graphs should also be of high quality and Graphs should also be of high quality and appropriate size. appropriate size.
GraphsGraphs

GraphsGraphs
Sample bar graph Sample line graph

Bar graphs are useful for graphing non-continuous Bar graphs are useful for graphing non-continuous data, such as data from different experimental data, such as data from different experimental groups. groups.
Note that in each case, the dependent variable is on Note that in each case, the dependent variable is on the y-axis and the independent variable on the x-the y-axis and the independent variable on the x-axis, and axis, and
all of the formatting issues listed above are all of the formatting issues listed above are addressed.addressed.
When Bar Graphs are UsefulWhen Bar Graphs are Useful
Sample bar graph Sample bar graph

If your data are continuous (each point is directly If your data are continuous (each point is directly related to the next and can be connected by an related to the next and can be connected by an infinite number of intermediate points), then a line infinite number of intermediate points), then a line graph is the way to go. graph is the way to go.
Line graphs are commonly used in scientific studies Line graphs are commonly used in scientific studies to present data when time (a continuous variable) is to present data when time (a continuous variable) is one of the variables involved.one of the variables involved.
Note the dependent variable is on the y-axis, "time" Note the dependent variable is on the y-axis, "time" is on the x-axis.is on the x-axis.
When Line Graphs are UsefulWhen Line Graphs are Useful
Sample line graph Sample line graph

While bar and line graphs are used While bar and line graphs are used commonly, there is another type of graph commonly, there is another type of graph worth mentioning - the scatter plot.worth mentioning - the scatter plot.
In some cases you may need to graph two In some cases you may need to graph two variables against one another to determine variables against one another to determine their relationship.their relationship.
You graph one variable on the X-axis and the You graph one variable on the X-axis and the other on the Y-axis, and then graph your other on the Y-axis, and then graph your points accordingly. points accordingly.
Scatter PlotsScatter Plots
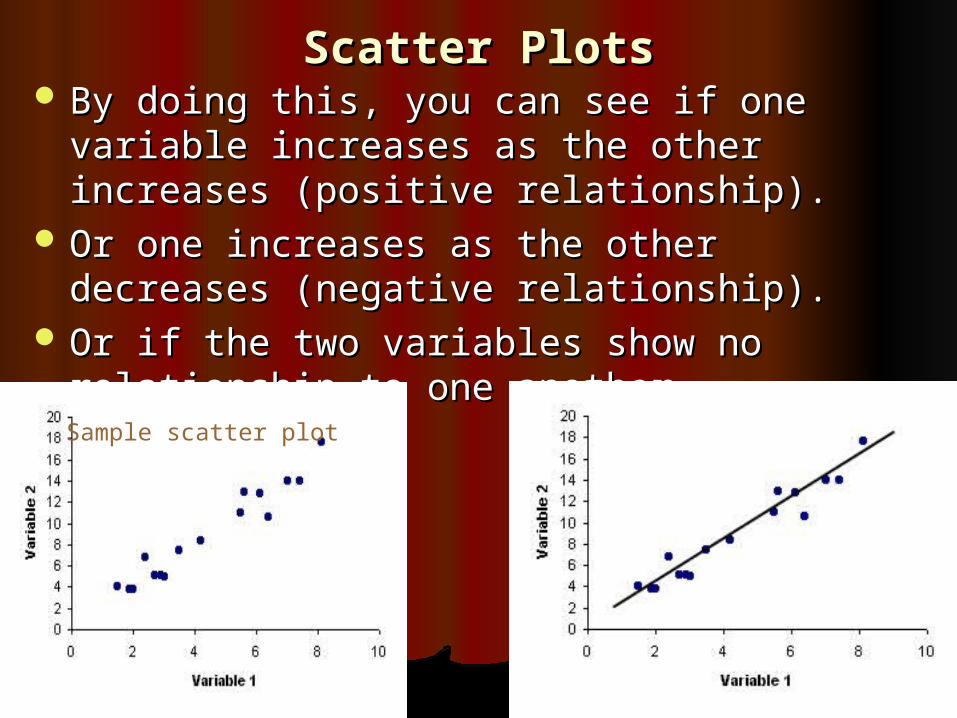
By doing this, you can see if one variable By doing this, you can see if one variable increases as the other increases (positive increases as the other increases (positive relationship).relationship).
Or one increases as the other decreases Or one increases as the other decreases (negative relationship). (negative relationship).
Or if the two variables show no relationship Or if the two variables show no relationship to one another. to one another.
Scatter PlotsScatter Plots
Sample scatter plot