Embed Size (px)
Citation preview
DI
SC
US
SI
ON
P
AP
ER
S
ER
IE
S
Forschungsinstitut zur Zukunft der ArbeitInstitute for the Study of Labor
Nature or Nurture in Higher Education?Inter-generational Implications of theVietnam-Era Lottery
IZA DP No. 9046
May 2015
Louis N. ChristofidesMichael HoyJoniada MillaThanasis Stengos
Nature or Nurture in Higher Education? Inter-generational Implications of the
Vietnam-Era Lottery
Louis N. Christofides University of Guelph, University of Cyprus, IZA and CESifo
Michael Hoy University of Guelph
Joniada Milla
CORE, Catholic University of Louvain
Thanasis Stengos University of Guelph
Discussion Paper No. 9046 May 2015
IZA
P.O. Box 7240 53072 Bonn
Germany
Phone: +49-228-3894-0 Fax: +49-228-3894-180
E-mail: [email protected]
Any opinions expressed here are those of the author(s) and not those of IZA. Research published in this series may include views on policy, but the institute itself takes no institutional policy positions. The IZA research network is committed to the IZA Guiding Principles of Research Integrity. The Institute for the Study of Labor (IZA) in Bonn is a local and virtual international research center and a place of communication between science, politics and business. IZA is an independent nonprofit organization supported by Deutsche Post Foundation. The center is associated with the University of Bonn and offers a stimulating research environment through its international network, workshops and conferences, data service, project support, research visits and doctoral program. IZA engages in (i) original and internationally competitive research in all fields of labor economics, (ii) development of policy concepts, and (iii) dissemination of research results and concepts to the interested public. IZA Discussion Papers often represent preliminary work and are circulated to encourage discussion. Citation of such a paper should account for its provisional character. A revised version may be available directly from the author.

IZA Discussion Paper No. 9046 May 2015
ABSTRACT
Nature or Nurture in Higher Education?
Inter-generational Implications of the Vietnam-Era Lottery It is evident that a strong positive correlation persists between the educational attainment of parents and that of their children in many, if not most, populations. This relationship may form an important part of the phenomenon of low social mobility as well as inefficiently low investment in human capital by youth who have parents with relatively low educational attainment. Is it a genetic inter-generational transmission of innate ability from parents to their children (i.e. nature) or is it the environment that the better educated parents provide for their children (i.e. nurture) that explains this positive relationship? Understanding the relative contributions of nature versus nurture is critical to the development of any social policy designed to increase social and economic mobility between generations. Separating the so-called nature and nurture effects of this relationship is a difficult task. We use the Vietnam Era Draft Lottery as a natural experiment to address the nature-nurture question. Attending university in order to avoid the draft created a cohort which included individuals who would not normally have attended post-secondary educational institutions. Comparing the educational attainment of children of this cohort to that of cohorts who attended university in “normal times” creates a natural experiment to test the relative importance of the nature or nurture explanations. Our findings provide evidence in support of the nurture argument.
NON-TECHNICAL SUMMARY Earlier studies show that the Vietnam draft lottery provided extra incentives for men to attend university and that their attendance increased. Men who (for nature reasons) might not have gone to university during “normal times” appear to have gone to university to avoid the draft. We examine the propensity of their children to go to university relative to those of a control group. Did those children behave as nature would suggest, or did the nurture provided by their university-educated fathers lead them to be as at least as likely to go to university? Consistent with nurture, we find the latter. JEL Classification: I0 Keywords: inter-generational mobility, higher education attendance Corresponding author: Joniada Milla CORE, Université catholique de Louvain 34 voie du Roman Pays – L1.03.01 B – 1348 Louvain-la-Neuve Belgium E-mail: [email protected]
1 Introduction
There is longstanding concern that low inter-generational mobility creates economic and so-
cial problems that are linked to high levels of economic inequality and economic inefficiency,
although the direction of causality is not so clear. As reported by Corak (2013), the OECD
(2011, p.40) has expressed the view that rising economic inequality “can stifle upward mobil-
ity, making it harder for talented and hard-working people to get the rewards they deserve.”
Besides a concern with justice and economic welfare, low social mobility can blunt incentives
and so lead to lower overall productivity. Several studies have investigated the role that the
inter-generational transmission of education attainment plays in this phenomenon. It is with
this part of the literature that we are primarily concerned in this paper.
Hertz et al. (2007) estimate 50-year trends in the inter-generational persistence of ed-
ucational attainment for 42 countries and find an overall average correlation between the
schooling of the parents and that of their offspring of approximately 0.4. They also find
substantial regional variations which suggest that policy interventions may be able to modify
this relationship. Since the level of education is an important determinant of earnings and
overall well-being, understanding the reason for this positive correlation is important. As
Black et al. (2009) point out, the reason may be “a pure selection story: the type of parent
who has more education and earns a higher salary has the type of child who will do so as well,
regardless. Another story is one of causation: obtaining more education makes one a different
type of parent, and thus leads to the children having higher educational outcomes.” If the
latter is correct, then policies which increase education in one generation will have spillover
effects for the next generation. To distinguish between selection and causation, however, is
challenging and the best opportunities for doing so have been natural experiments in which
a shock occurs that changes the incentive to obtain education. In the case of Black et al.
(2009), the shock explored is a change in compulsory schooling laws in Norway during the
1960s which increased the minimum required years of schooling from seven to nine. We use
the Vietnam Era Draft Lottery as a natural experiment to address causation in the context
of the nature-nurture question and to identify whether there is a causal effect of parental ed-
ucation on children’s education. Card and Lemieux (2001) showed that the college enrolment
rates for men increased and fell abruptly between 1965 and 1975. Therefore, the strategy of
2
attending university in order to avoid the draft creates a cohort of men who would not nor-
mally have attended post-secondary education (PSE) institutions. We will refer to this cohort
as the “PSE draft avoiders cohort.” Comparing the educational attainment of the children
of this cohort to that of cohorts who attended university in “normal times” creates a natural
experiment to test the relative importance of the nature and nurture explanations. If the
transmission of post-secondary education from parents to children for the “normal cohorts”
exceeds that for the “PSE draft avoiders cohort”, then we conclude that individuals who
would not normally have obtained PSE do not pass on that achievement to as great an ex-
tent as “normal” PSE attendees. Such a result would be consistent with at least some extent
of nature being the reason for the inter-generational transmission of PSE. This follows since
such a finding would imply that those who would not normally have attended PSE would,
under the nature explanation, have lower innate ability and so pass on lower innate ability
to their children which would in turn reduce the chances of them attending PSE. However,
a finding that there is the same degree of inter-generational transmission of PSE for the two
cohorts points in the direction of a nurture explanation. This follows since such a finding
would imply that those who would not normally have attended PSE but do so for ulterior
motives pass on to their children the ability and aspiration for PSE to the same extent of
“normal PSE attendees.” Such a result, which is what we find, is consistent with the nurture
explanation; that is, the act of attaining some PSE in itself appears to create a different sort
of parent and a different sort of environment for the children and this leads these children to
also be more likely to obtain some PSE. In other words, it appears that the education level
of one generation has a causal effect on the education level of the subsequent generation.
Both the nature and nurture explanations for the inter-generational transmission of educa-
tion are admittedly highly nuanced. In particular, the nurture explanation may reflect many
factors responsible for the observation that a child with highly educated parents is more likely
to obtain a relatively high level of education. That is, regardless of the reason for obtaining
a high level of education, doing so may lead parents to make decisions or take on behavioural
traits that lead to higher educational achievement by their children. One channel may simply
be increased parental expectations for children’s educational attainment. Parents who have
chosen to attend university may serve as positive role models for their children’s educational
3
aspirations (see Christofides et al., forthcoming) regardless of any purposive behaviour by
the parents. It is also well-established that parents with higher education are more likely
to live in “good neighbourhoods” and spend more money on items that promote cognitive
development (e.g., books, computers, tutors, etc.).1 We do not disentangle which of these
channels are more or less important. However, our analysis does provide a test for whether
inter-generational transmission of education is based on nurture or nature. Our results are
consistent with nurture being the more plausible explanation for the inter-generational trans-
mission of higher education.
We also identify the cohort of men which includes those who either voluntarily or through
conscription participated in the Vietnam War and which was thus later faced with an extra
incentive to attend university due to grants provided through the GI Bill. This latter group
may also represent a cohort that includes men who would not under normal circumstances
have attended college or university. However, these two groups of men were influenced by
the occurrence of the war in very different ways and so probably possess quite different
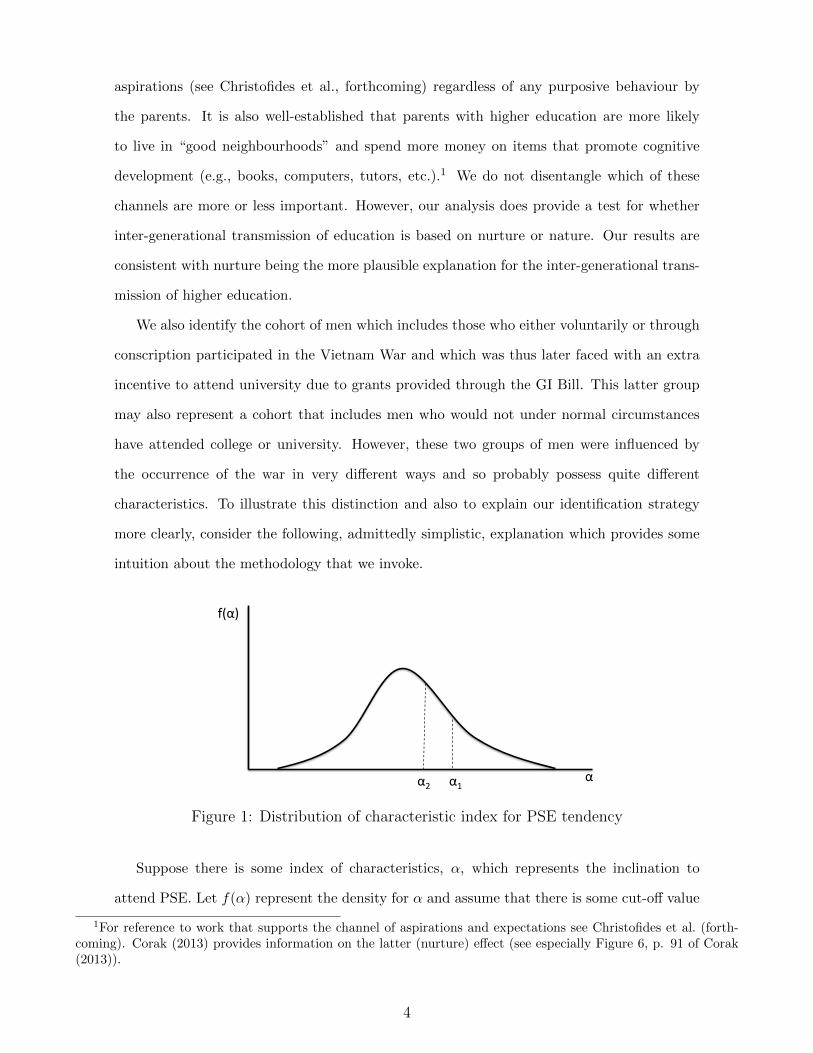
characteristics. To illustrate this distinction and also to explain our identification strategy
more clearly, consider the following, admittedly simplistic, explanation which provides some
intuition about the methodology that we invoke.
α1 α2
f(α)
α
Figure 1: Distribution of characteristic index for PSE tendency
Suppose there is some index of characteristics, α, which represents the inclination to
attend PSE. Let f(α) represent the density for α and assume that there is some cut-off value
1For reference to work that supports the channel of aspirations and expectations see Christofides et al. (forth-coming). Corak (2013) provides information on the latter (nurture) effect (see especially Figure 6, p. 91 of Corak(2013)).
4
of α which demarcates those who will attend university and those who will not. For example,
if the normal cut-off value is α1 in Figure 1, then all those with α ≥ α1 will attend university
while those with α < α1 will not. Just what this characteristic represents depends on what
beliefs or what model one has in mind to explain PSE attendance, as we explain further
below. However, whatever characteristics index α measures and so whatever is presumed
to determine PSE attendance decisions, men who we call draft avoiders are those who have
α < α1 but place an additional value on attending university in order to avoid the risk of
being drafted. Although the strength of preference of draft avoiders to avoid the draft may be
correlated with α, it seems likely that some such individuals who attend university to avoid
the draft will come from the group with α < α1. In fact, this seems clearly the case given the
results of Card and Lemieux (2001) that show more men than usual did attend PSE during
the years of risk of conscription.
Now, suppose the reason that there is a positive correlation between the education level
of children and parents is entirely due to nature; that is, parents with a sufficiently high level
of the characteristic (index) α to have obtained some post-secondary education will have
children who also tend to have a higher level of α than their cohorts and so these children are
also more likely to attend PSE. For the nature explanation, α is usually considered to be some
heritable trait (or set of traits) representing innate ability. This is one explanation for the
observation that children with parents who have post-secondary education are more likely to
also attend PSE. The cohort of men that includes draft avoiders will include men with a lower
level of α than the cut-off value α1. Therefore, their children will on average have a relatively
lower level of α than would the children of parents with PSE coming from “normal cohorts.”
Under a nature explanation of inter-generational transmission of education, the impact of
parental education on children’s education should be less for the cohort that includes the
draft avoiders. We find little to no evidence of this being the case. In other words, it appears
that it is simply the fact that an individual has attended PSE that creates a higher likelihood
that the person’s child will attend PSE and this is not driven by inheritance of some genetic
ability (i.e., in the words of Black et al. (2009), we find that attending PSE “makes one
a different type of parent”). Our empirical results suggest that a nurture explanation for
the inter-generational transmission of education is more plausible. What drives the nurture
5
explanation may reflect a wide variety of environmental reasons and our analysis does not
allow for disentangling these. Obtaining some PSE may affect many personal characteristics
and behaviours of parents that influence their children’s decisions about PSE attendance,
such as parental expectations for their children’s educational attainment, parental role model
effects, parental inputs related to childhood enrichment, parents’ decision on school choice for
their children, etc. A variety of these parental characteristics may all contribute to the positive
effect of parental education on the level of the children’s PSE decision. Our results suggest
that whatever are the specific channels, individuals who attend PSE pass on to their children
some of the necessary requirements for scholastic achievement and aspirations to gain entry
to PSE. Whatever the relative importance of the various channels associated with a nurture
explanation, the draft avoiders who would not have attended PSE in normal circumstances
appear to transmit their own educational achievements to the same degree as for “normal”
cohorts. This is not consistent with the nature explanation provided above.
Our presumption about draft avoiders is that, although those with a higher value of the
characteristic (index value) α are more likely to choose PSE attendance as a strategy to avoid
the draft, there will be a variety of values of α (all being less than α1) in that group. Of
course, some men with α > α1 may also wish to avoid the draft but would have obtained
some PSE in any case and so do not need to be separately treated.
As a result of the Vietnam War, and other wars, there is a second group of “treated”
individuals. These are men that would normally have obtained some PSE but chose instead
to join the armed forces to serve in the war for one reason or another (e.g., due to feelings
of patriotism or to gain a particular type of life experience or possibly a trade). After their
service, many such individuals had the opportunity to attend a PSE institution at a reduced
cost due to the GI Bill. Moreover, the subsidy would presumably reduce the critical value
of the cut-off PSE tendency characteristic α that demarcates those who would decide the
net value of PSE is worthwhile. Suppose the critical value for such individuals becomes
α2 < α1 as shown in Figure 1. This being the case, one would expect a group of subsidized
individuals possessing α between the values α1 and α2 would attend PSE and also create
a cohort of individuals who, under the nature explanation, would be less likely to pass on
their educational attainment to their children. However, as noted above, this cohort may
6
also contain individuals with α > α1 and so the prediction on inter-generational attainment
is not unambiguous. Moreover, these individuals may be quite different from individuals who
would normally obtain some PSE in regards to various other unobserved characteristics as
well as their life experiences being very different at time of entry to PSE.
While there have been numerous papers investigating the outcomes of the individuals
affected by the Vietnam War lottery, to the best of our knowledge our paper is the first
attempt at investigating the outcomes of their children. This paper also stands alone among
the inter-generational mobility studies for the novel way in which it exploits an exogenous
source of variation in the fathers’ incentives to attain tertiary education. We emphasize
that our research does not address the general argument of nature versus nurture but only
the extent to which it is relevant to the inter-generational transmission of education at the
post-secondary level. Many papers have found evidence favouring the nurture debate in that
environmental features where the child was reared matter in their life prospects, whereas
other papers find that nature and nurture complement each other in this respect (Bjorklund
et al., 2007, 2006). Bjorklund et al. (2007) study the inter-generational transmission of the
socio-economic status that they measure by years of education and income. They investigate
a very unique Swedish data set that links children to their biological and adoptive parents
and contains information on both. They find that both nature and nurture play roles in the
inter-generational transmission of education, albeit with the nature effect significantly larger
in magnitude. Using a sample of natural offsprings and adopted children, Plug and Vijverberg
(2003) find evidence that 50% of the inter-generational transmission of IQ scores is related
to nature rather than nurture. With the exception of a possible link between mothers and
sons, Black et al. (2009) find no causal effects of increased compulsory schooling of parents
on the education of their children. However, they look at enforced additional schooling at
the bottom tail of the distribution (i.e., increasing the mandatory education level from seven
to nine years in Norway during the 1960s). Comparing their results to ours suggests that
the stage of life at which an exogenous increase in education (for future parents) occurs may
have differing causal (nurture) effects on the education level of their children.
In the following section we present the empirical framework. In section 3 we describe the
data and the empirical results follow in section 4. The final section concludes.
7
2 Empirical Framework
We analyze the inter-generational effect of higher education on the children’s likelihood of
attending PSE in the following framework.
P (Yi = 1) = γ1I(Father Edui) + γ2I(Father PAi)
+ γ3I(Father Edui)∗I(Father PAi) +Xiβ + εi (1)
where I(.) is an indicator function and I(Father Edui) is a set of PSE level dummy indi-
cators. I(Father PAi) is an indicator of whether the father is born during the Draft Lottery
risk years of the Vietnam Era and is considered a Potential Avoider (PA) of the Vietnam-era
draft. Since the data does not provide information on whether the father was granted an
educational deferment, we proxy the PA status in three different ways. Starting with a gen-
eral definition, we first use an indicator variable identifying those fathers whose birth year is
between 1945–1950. Even though the deferment allowance was fading out for the later birth
years after 1950, individuals born in the three years 1951-1953 still faced a risk of conscription,
albeit one that was falling. Therefore, we also use three extended definitions of PA status
that define the draft avoiders cohorts to be those fathers who were born between 1945–1951,
1945–1952 and 1945–1953. These are explored separately. In order to better approximate
the PA status, we define a second definition of the PA status as an indicator variable that
identifies fathers who were born in the draft lottery risk years, but who did not serve in the
Vietnam War. Finally, the third proxy that we use for the PA status exploits the regulations
of the educational deferment policy that issued educational deferments for the post-secondary
programs except first professional degrees, and post-graduate degrees such as Master’s and
doctoral degrees. To construct this third proxy for PA status, we interact the second proxy
with a dummy variable that indicates whether the father has an education level which did
not qualify for deferment. This last definition approximates best the PA status of the father.
εi is an idiosyncratic error term, Xi = [1, Zi] and Zi is a vector of covariates.
In order to make sure that the PA indicators are not capturing a parental age effect, we
add the fathers’ and mothers’ age and its square as a covariate in the regressions. This is
8

intended to capture the fact that the incentives that parents transmit to their children could
depend on age. Attendance in tertiary education has been increasing for the younger cohorts.
We circumvent this potentially confounding effect of the upward trend by adding children’s
birth year dummy variables. We also account for assortative matching as another unintended
implication of the Vietnam War lottery draft. Since the fathers in our sample attended PSE
in order to avoid the draft, they may well have met their future wives at school. To capture
this channel we include mothers’ education as a covariate and its interaction with fathers’
education for the survey years (post 1992) that allow a detailed classification of the PSE
levels.
Overall, Zi contains the following characteristics for each individual i: female dummy,
race dummies (White, Black, Hispanic), single marital status, dummy variables indicating
the number of own children and the number of siblings in the household, adoptive parents
indicator, own age and its square, metropolitan city centre and metropolitan out of city centre
residence dummies, house ownership dummy, income per capita and its square, father and
mother education dummies and their interactions, father and mother age and their square,
children’s birth year dummies and survey year dummy variables.
3 Data
We have available for use the U.S. Current Population Survey (King et al., 2010) for the years
1981–2014 that is conducted in March of each year. We use the March surveys because they
contain both the educational variables and information on veteran status. One limitation
of the CPS in the context of this paper, is that it is a household survey. This means that
once the young adults leave the household it is impossible to link them to their parents. In
Figure A.1 we can see that the number of respondents that can be linked to their father is
high, in particular, for the ages between 15–18, but decreases quickly for the older children.
For instance we can only link about half of the 24-year olds in the sample to their fathers.
Since we are analyzing an inter-generational effect of the fathers’ education on their children,
data availability on both generations is a binding restriction. Given this limitation, our main
sample is composed of respondents in the civilian population who are between the age of
9

19–21 years old and who can be linked to their parents (their fathers in particular). From
Figure A.1 we can see that the majority of youth at this age range are linked to their fathers.
In our context, the treated respondents (children in this case) are those whose fathers
belong to the draft avoiders cohort. Card and Lemieux (2001) provide evidence that “draft-
avoidance behaviour had little or no effect on the average schooling outcomes of men born
after 1950.” Hence, our main treatment group are the children of those men who were born
between 1945–1950 under risk of conscription in the Vietnam War. Grimard and Parent
(2007) also use the same birth years to construct their treatment group. Differently from the
above two papers, Angrist and Chen (2011) use the birth years 1948–1953 to define the treated
cohorts, instead of 1945–1950. However, the aim of their paper is to estimate the GI Bill
benefits on the later life outcomes of Vietnam War veterans rather than those who avoided
service. Given the two different approaches, we use four different treatment definitions to
include all fathers affected who faced some level of risk: Fathers born 1945–1950, 1945–1951,
1945–1952 and 1945–1953. A chronology of the draft lottery events is summarized in Table
A.1. We omit the respondents whose fathers were born before 1935. In this way we prevent
the confounding effects that may originate from older father cohorts who were at risk of
conscription in the previous war periods (Grimard and Parent, 2007), and especially the
Korean war during which education deferments were also granted.
In this paper the outcome of interest is the probability of attending or enrolling in any
PSE program for the individuals who can be linked to at least their male parent in the survey
and are between 19–21 years old. CPS followed a different (and inconsistent) classification
for the education variables in the surveys prior to 1992. For this reason, we provide a set
of results that we compute using all surveys relevant to our paper (1981–2014) and another
set of results where we use only surveys after 1992. In the first set of results, we are not
able to distinguish between the different levels of post-secondary education of the parents.
The education categories available for all survey years and for all respondents (both children
and their parents) are the same. The educational categories are the following: less than high
school diploma (Less than HS), high school diploma (HS), and post-secondary education
(PSE). The later category includes any level of PSE for any number of years completed
regardless of whether the respondent graduated or not from the program. In the second set
10
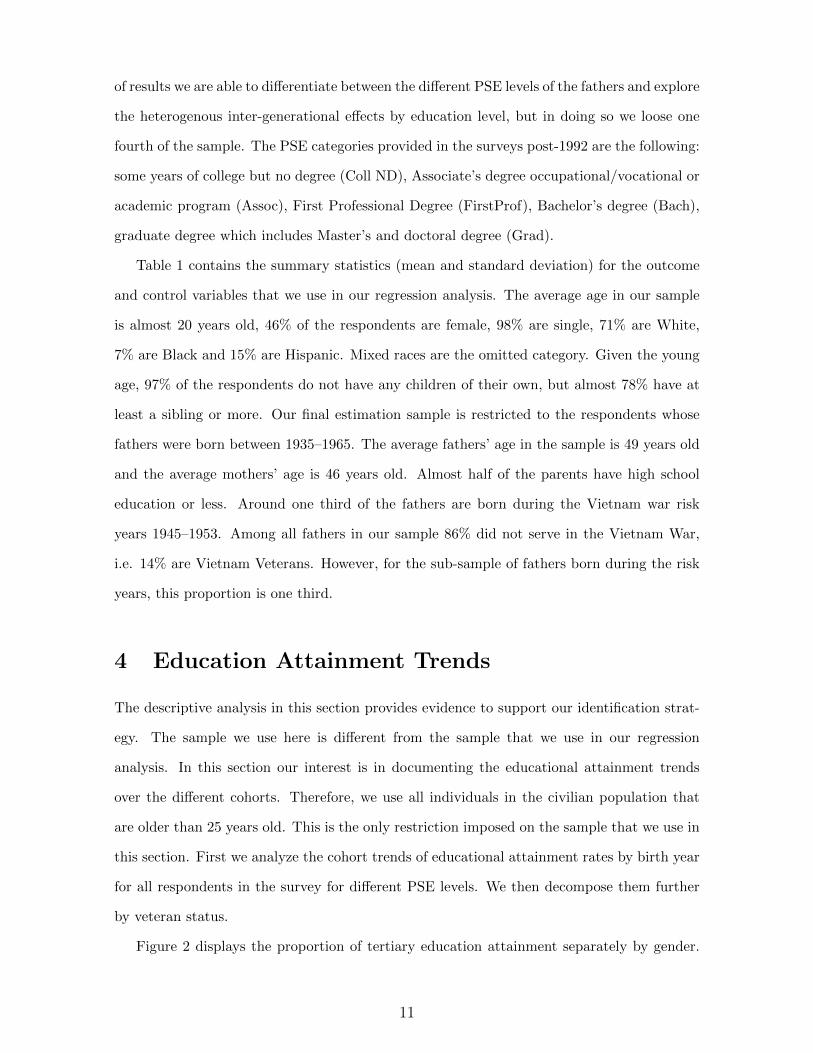
of results we are able to differentiate between the different PSE levels of the fathers and explore
the heterogenous inter-generational effects by education level, but in doing so we loose one
fourth of the sample. The PSE categories provided in the surveys post-1992 are the following:
some years of college but no degree (Coll ND), Associate’s degree occupational/vocational or
academic program (Assoc), First Professional Degree (FirstProf), Bachelor’s degree (Bach),
graduate degree which includes Master’s and doctoral degree (Grad).
Table 1 contains the summary statistics (mean and standard deviation) for the outcome
and control variables that we use in our regression analysis. The average age in our sample
is almost 20 years old, 46% of the respondents are female, 98% are single, 71% are White,
7% are Black and 15% are Hispanic. Mixed races are the omitted category. Given the young
age, 97% of the respondents do not have any children of their own, but almost 78% have at
least a sibling or more. Our final estimation sample is restricted to the respondents whose
fathers were born between 1935–1965. The average fathers’ age in the sample is 49 years old
and the average mothers’ age is 46 years old. Almost half of the parents have high school
education or less. Around one third of the fathers are born during the Vietnam war risk
years 1945–1953. Among all fathers in our sample 86% did not serve in the Vietnam War,
i.e. 14% are Vietnam Veterans. However, for the sub-sample of fathers born during the risk
years, this proportion is one third.
4 Education Attainment Trends
The descriptive analysis in this section provides evidence to support our identification strat-
egy. The sample we use here is different from the sample that we use in our regression
analysis. In this section our interest is in documenting the educational attainment trends
over the different cohorts. Therefore, we use all individuals in the civilian population that
are older than 25 years old. This is the only restriction imposed on the sample that we use in
this section. First we analyze the cohort trends of educational attainment rates by birth year
for all respondents in the survey for different PSE levels. We then decompose them further
by veteran status.
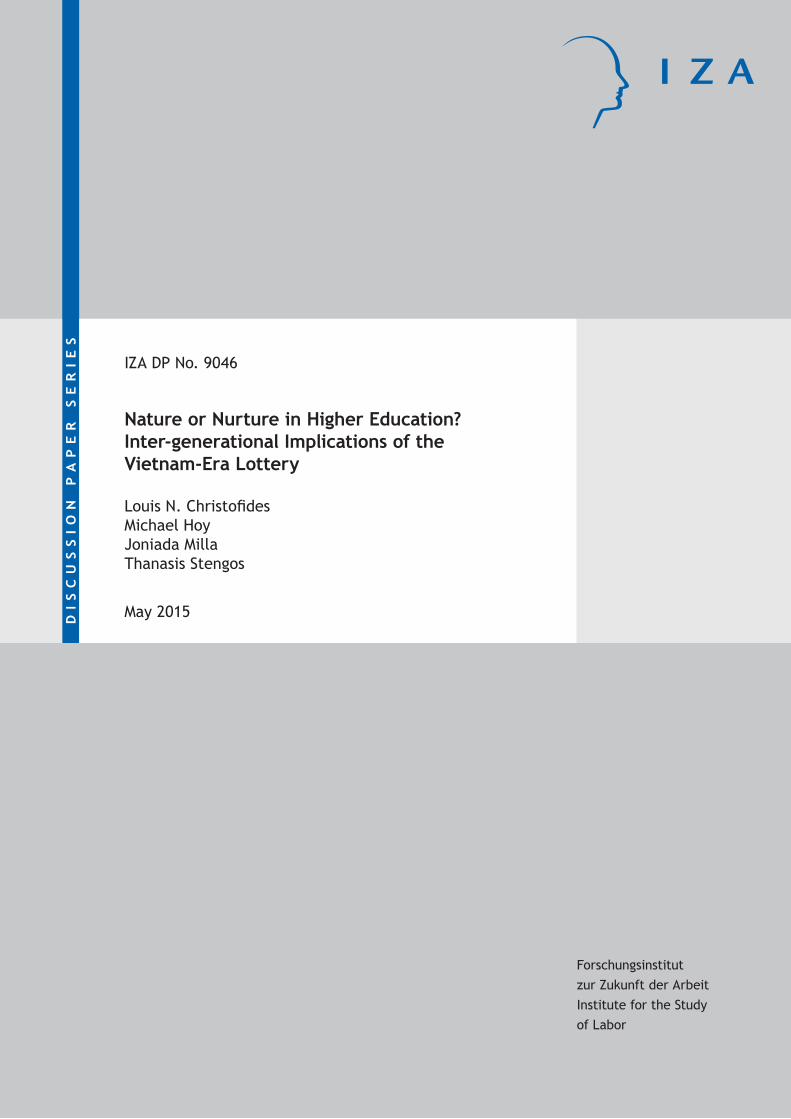
Figure 2 displays the proportion of tertiary education attainment separately by gender.
11
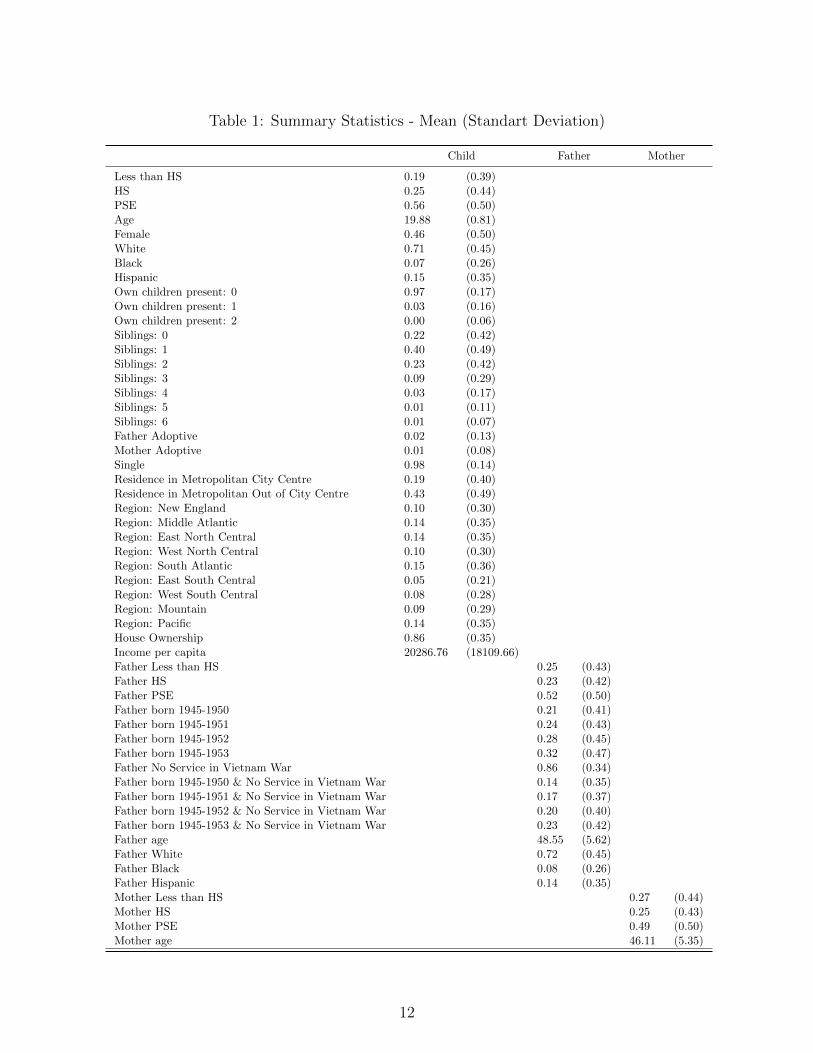
Table 1: Summary Statistics - Mean (Standart Deviation)
Child Father Mother
Less than HS 0.19 (0.39)HS 0.25 (0.44)PSE 0.56 (0.50)Age 19.88 (0.81)Female 0.46 (0.50)White 0.71 (0.45)Black 0.07 (0.26)Hispanic 0.15 (0.35)Own children present: 0 0.97 (0.17)Own children present: 1 0.03 (0.16)Own children present: 2 0.00 (0.06)Siblings: 0 0.22 (0.42)Siblings: 1 0.40 (0.49)Siblings: 2 0.23 (0.42)Siblings: 3 0.09 (0.29)Siblings: 4 0.03 (0.17)Siblings: 5 0.01 (0.11)Siblings: 6 0.01 (0.07)Father Adoptive 0.02 (0.13)Mother Adoptive 0.01 (0.08)Single 0.98 (0.14)Residence in Metropolitan City Centre 0.19 (0.40)Residence in Metropolitan Out of City Centre 0.43 (0.49)Region: New England 0.10 (0.30)Region: Middle Atlantic 0.14 (0.35)Region: East North Central 0.14 (0.35)Region: West North Central 0.10 (0.30)Region: South Atlantic 0.15 (0.36)Region: East South Central 0.05 (0.21)Region: West South Central 0.08 (0.28)Region: Mountain 0.09 (0.29)Region: Pacific 0.14 (0.35)House Ownership 0.86 (0.35)Income per capita 20286.76 (18109.66)Father Less than HS 0.25 (0.43)Father HS 0.23 (0.42)Father PSE 0.52 (0.50)Father born 1945-1950 0.21 (0.41)Father born 1945-1951 0.24 (0.43)Father born 1945-1952 0.28 (0.45)Father born 1945-1953 0.32 (0.47)Father No Service in Vietnam War 0.86 (0.34)Father born 1945-1950 & No Service in Vietnam War 0.14 (0.35)Father born 1945-1951 & No Service in Vietnam War 0.17 (0.37)Father born 1945-1952 & No Service in Vietnam War 0.20 (0.40)Father born 1945-1953 & No Service in Vietnam War 0.23 (0.42)Father age 48.55 (5.62)Father White 0.72 (0.45)Father Black 0.08 (0.26)Father Hispanic 0.14 (0.35)Mother Less than HS 0.27 (0.44)Mother HS 0.25 (0.43)Mother PSE 0.49 (0.50)Mother age 46.11 (5.35)
12
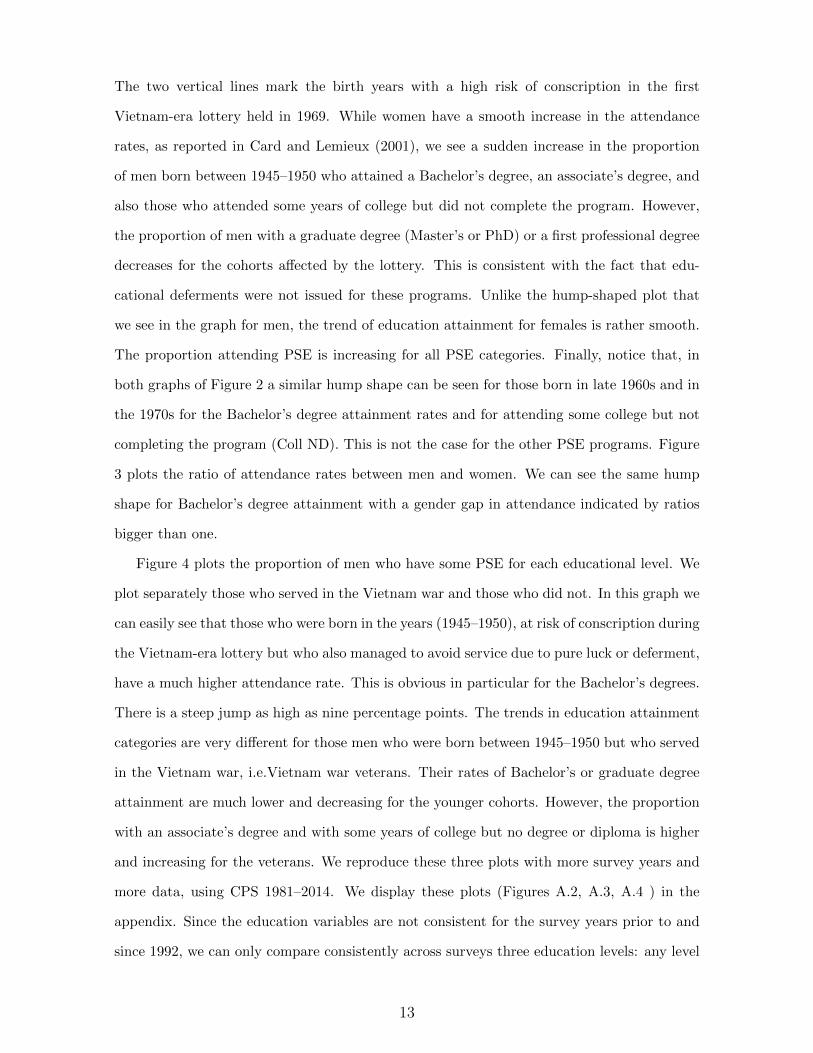
The two vertical lines mark the birth years with a high risk of conscription in the first
Vietnam-era lottery held in 1969. While women have a smooth increase in the attendance
rates, as reported in Card and Lemieux (2001), we see a sudden increase in the proportion
of men born between 1945–1950 who attained a Bachelor’s degree, an associate’s degree, and
also those who attended some years of college but did not complete the program. However,
the proportion of men with a graduate degree (Master’s or PhD) or a first professional degree
decreases for the cohorts affected by the lottery. This is consistent with the fact that edu-
cational deferments were not issued for these programs. Unlike the hump-shaped plot that
we see in the graph for men, the trend of education attainment for females is rather smooth.
The proportion attending PSE is increasing for all PSE categories. Finally, notice that, in
both graphs of Figure 2 a similar hump shape can be seen for those born in late 1960s and in
the 1970s for the Bachelor’s degree attainment rates and for attending some college but not
completing the program (Coll ND). This is not the case for the other PSE programs. Figure
3 plots the ratio of attendance rates between men and women. We can see the same hump
shape for Bachelor’s degree attainment with a gender gap in attendance indicated by ratios
bigger than one.
Figure 4 plots the proportion of men who have some PSE for each educational level. We
plot separately those who served in the Vietnam war and those who did not. In this graph we
can easily see that those who were born in the years (1945–1950), at risk of conscription during
the Vietnam-era lottery but who also managed to avoid service due to pure luck or deferment,
have a much higher attendance rate. This is obvious in particular for the Bachelor’s degrees.
There is a steep jump as high as nine percentage points. The trends in education attainment
categories are very different for those men who were born between 1945–1950 but who served
in the Vietnam war, i.e.Vietnam war veterans. Their rates of Bachelor’s or graduate degree
attainment are much lower and decreasing for the younger cohorts. However, the proportion
with an associate’s degree and with some years of college but no degree or diploma is higher
and increasing for the veterans. We reproduce these three plots with more survey years and
more data, using CPS 1981–2014. We display these plots (Figures A.2, A.3, A.4 ) in the
appendix. Since the education variables are not consistent for the survey years prior to and
since 1992, we can only compare consistently across surveys three education levels: any level
13

Figure 2: Proportion attending tertiary education by birth year
0
.05
.1
.15
.2
.25
1935
1940
1945
1950
1955
1960
1965
1970
1975
1980
1985
1935
1940
1945
1950
1955
1960
1965
1970
1975
1980
1985
Male Female
Coll ND Assoc Bach FirstProf & Grad
Prop
ortio
n
Birth year
Note: Data source are respondents in CPS 1992-2014 who are 25 years old and older.Omitted categories are the educational attainment levels of high school or lower.
Figure 3: Men to women ratio of the proportion attending tertiary education by birth year
.6
.8
1
1.2
1.4
1.6
1.8
2
2.2
Men
to W
omen
Rat
io
1935
1940
1945
1950
1955
1960
1965
1970
1975
1980
1985
Birth year
Coll ND Assoc Bach FirstProf & Grad
Note: Data source are respondents in CPS 1992-2014 who are 25 years old and older.Omitted categories are the educational attainment levels of high school or lower.
14
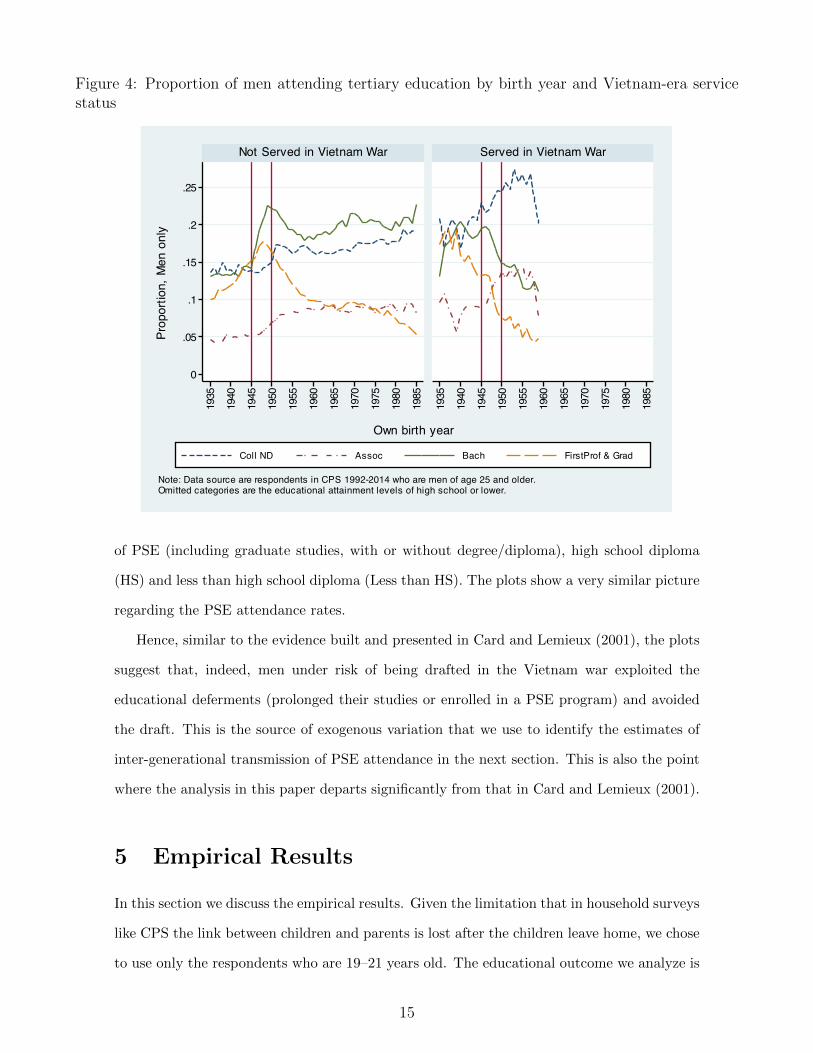
Figure 4: Proportion of men attending tertiary education by birth year and Vietnam-era servicestatus
0
.05
.1
.15
.2
.25
1935
1940
1945
1950
1955
1960
1965
1970
1975
1980
1985
1935
1940
1945
1950
1955
1960
1965
1970
1975
1980
1985
Not Served in Vietnam War Served in Vietnam War
Coll ND Assoc Bach FirstProf & Grad
Prop
ortio
n, M
en o
nly
Own birth year
Note: Data source are respondents in CPS 1992-2014 who are men of age 25 and older.Omitted categories are the educational attainment levels of high school or lower.
of PSE (including graduate studies, with or without degree/diploma), high school diploma
(HS) and less than high school diploma (Less than HS). The plots show a very similar picture
regarding the PSE attendance rates.
Hence, similar to the evidence built and presented in Card and Lemieux (2001), the plots
suggest that, indeed, men under risk of being drafted in the Vietnam war exploited the
educational deferments (prolonged their studies or enrolled in a PSE program) and avoided
the draft. This is the source of exogenous variation that we use to identify the estimates of
inter-generational transmission of PSE attendance in the next section. This is also the point
where the analysis in this paper departs significantly from that in Card and Lemieux (2001).
5 Empirical Results
In this section we discuss the empirical results. Given the limitation that in household surveys
like CPS the link between children and parents is lost after the children leave home, we chose
to use only the respondents who are 19–21 years old. The educational outcome we analyze is
15
the probability of attending a post-secondary program at this age. Our dependent variable
takes a value of one if the child is enrolled in a PSE program, and zero if they report a lower
level of education.
First, we restrict the sample by father’s level of education and compare the “normal”
cohorts to the draft avoiders’ cohorts conditional on the fathers having the same level of
education for all cohorts. Hence, we use only the sub-sample of respondents whose father
has at least some level of post-secondary education. In this way we are comparing the inter-
generational transmission of educational attainment of fathers who were born during the draft
lottery risk years and who faced a strong incentive to enrol in PSE due to this exogenous
shock, to that of those who faced the “usual” incentives to attend PSE. We can refer to this
latter group of fathers as those who would “normally” choose to attend PSE.
The treatment in this case is having a father who belongs to one of the cohorts that faced
the risk of conscription due to the Vietnam Draft Lottery. Even though we think that the
individuals most affected by the educational deferments are those born between 1945–1950 as
is also shown in Card and Lemieux (2001), we also show results for the birth years 1945–1951,
1945–1952 and 1945–1953. The reason for the separate treatments is that for the three later
birth years, 1951, 1952 and 1953, the educational deferment started to phase out and thus
the incentive to enrol in a PSE program were less strong.
The estimation results of equation (1) are displayed in Table 2. In this first set of estimates
we restrict γ3 = 0, not allowing for heterogenous effects. We are interested in the estimate of
γ2, which captures the differential impact (beyond parental education) of attending college
in order to be able to qualify for the educational deferment, and so avoid being drafted.
The treatment indicator in Table 2 pools together the fathers who served (veterans) and
those who did not serve during the Vietnam war, among which also potential avoiders. The
comparison group includes the respondents whose father belonged to cohorts that did not
face risk of conscription due to the Vietnam War Draft Lottery (i.e. who were born before or
after the lottery risk birth years), and who have attained at least some level of PSE. From the
estimates of Table 2 it is obvious that there is a high correlation between mothers’ education
attainment and their children’s probability of attending PSE. Our main interest, is in the
estimates of the first four rows. All coefficients are statistically insignificant.
16
This result indicates that the inter-generational transmission of education from fathers to
their children is not statistically different for potential draft avoiders, who faced an additional
incentive to attend PSE, than for fathers who chose in normal circumstances to attend PSE.
Under the nature hypothesis, the extra incentive of avoiding the draft would be expected to
draw individuals from the lower part of distribution of “innate ability” to attend PSE and so
one would expect a lower rate of transmission of education from the fathers of the cohort at
risk of being drafted. Since this is not observed, the alternative hypothesis that it is nurture,
as reflected by increased levels of education, offers a better explanation for the tendency of
the inter-generational transmission of education.
In Table 3, the definition of the treatment variable separates the veteran fathers from
those who did not serve in the Vietnam War, all conditional on having at least some level
of PSE. This definition approximates better the father’s “potential avoider” status. The
comparison group in this specification, differently from what we have in Table 2, includes the
respondents whose fathers served in the Vietnam war and hence are veterans. In all cases,
not only are the children with fathers from the cohort of potential draft avoiders as likely to
attend PSE as are the children with fathers who obtain PSE under normal circumstances, but
they are even more likely to attend PSE. The additional tendency, at about 2%, is modest
but statistically significant.
Referring to equation (1), so far we abstract from allowing heterogeneity by father’s
educational level in the inter-generational transmission coefficient, i.e. we set γ3 = 0. In
Table 4, we show the estimates that allow the coefficient on the treatment variable to differ
by father’s level of higher education. In order to do that, we have to restrict our sample to
the surveys conducted between 1992–2014, for which the program-based education variable
is available. This explains the drop in the number of observations. We create a dummy
variable to indicate the education levels (and types of education) that did not qualify for
deferments. This variable takes a value of zero if the father has an educational level for which
deferment could be granted. These are some college but no degree, associate vocational
degree or diploma and Bachelor’s degree. This variable takes a value of one if the father
has a first professional degree, a Master’s or a PhD degree, for which educational deferment
were not issued. In Table 4 we interact this indicator variable with the treatment variable.
17
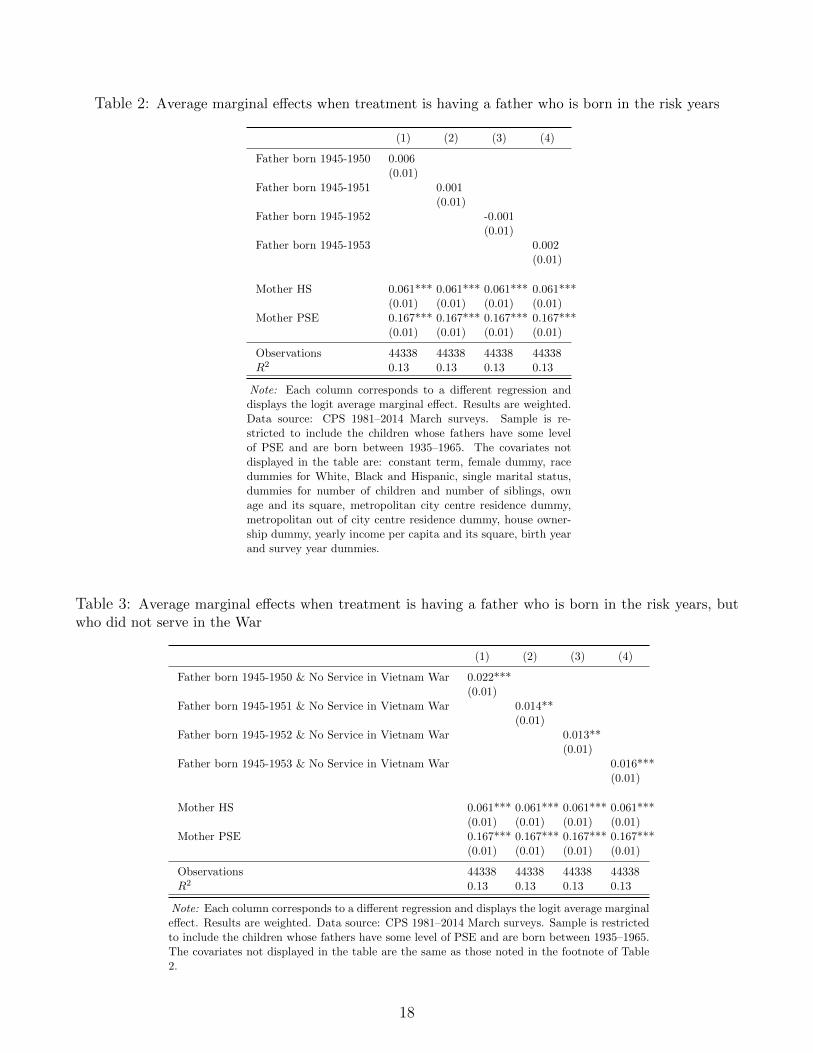
Table 2: Average marginal effects when treatment is having a father who is born in the risk years
(1) (2) (3) (4)
Father born 1945-1950 0.006(0.01)
Father born 1945-1951 0.001(0.01)
Father born 1945-1952 -0.001(0.01)
Father born 1945-1953 0.002(0.01)
Mother HS 0.061*** 0.061*** 0.061*** 0.061***(0.01) (0.01) (0.01) (0.01)
Mother PSE 0.167*** 0.167*** 0.167*** 0.167***(0.01) (0.01) (0.01) (0.01)
Observations 44338 44338 44338 44338R2 0.13 0.13 0.13 0.13
Note: Each column corresponds to a different regression anddisplays the logit average marginal effect. Results are weighted.Data source: CPS 1981–2014 March surveys. Sample is re-stricted to include the children whose fathers have some levelof PSE and are born between 1935–1965. The covariates notdisplayed in the table are: constant term, female dummy, racedummies for White, Black and Hispanic, single marital status,dummies for number of children and number of siblings, ownage and its square, metropolitan city centre residence dummy,metropolitan out of city centre residence dummy, house owner-ship dummy, yearly income per capita and its square, birth yearand survey year dummies.
Table 3: Average marginal effects when treatment is having a father who is born in the risk years, butwho did not serve in the War
(1) (2) (3) (4)
Father born 1945-1950 & No Service in Vietnam War 0.022***(0.01)
Father born 1945-1951 & No Service in Vietnam War 0.014**(0.01)
Father born 1945-1952 & No Service in Vietnam War 0.013**(0.01)
Father born 1945-1953 & No Service in Vietnam War 0.016***(0.01)
Mother HS 0.061*** 0.061*** 0.061*** 0.061***(0.01) (0.01) (0.01) (0.01)
Mother PSE 0.167*** 0.167*** 0.167*** 0.167***(0.01) (0.01) (0.01) (0.01)
Observations 44338 44338 44338 44338R2 0.13 0.13 0.13 0.13
Note: Each column corresponds to a different regression and displays the logit average marginaleffect. Results are weighted. Data source: CPS 1981–2014 March surveys. Sample is restrictedto include the children whose fathers have some level of PSE and are born between 1935–1965.The covariates not displayed in the table are the same as those noted in the footnote of Table2.
18
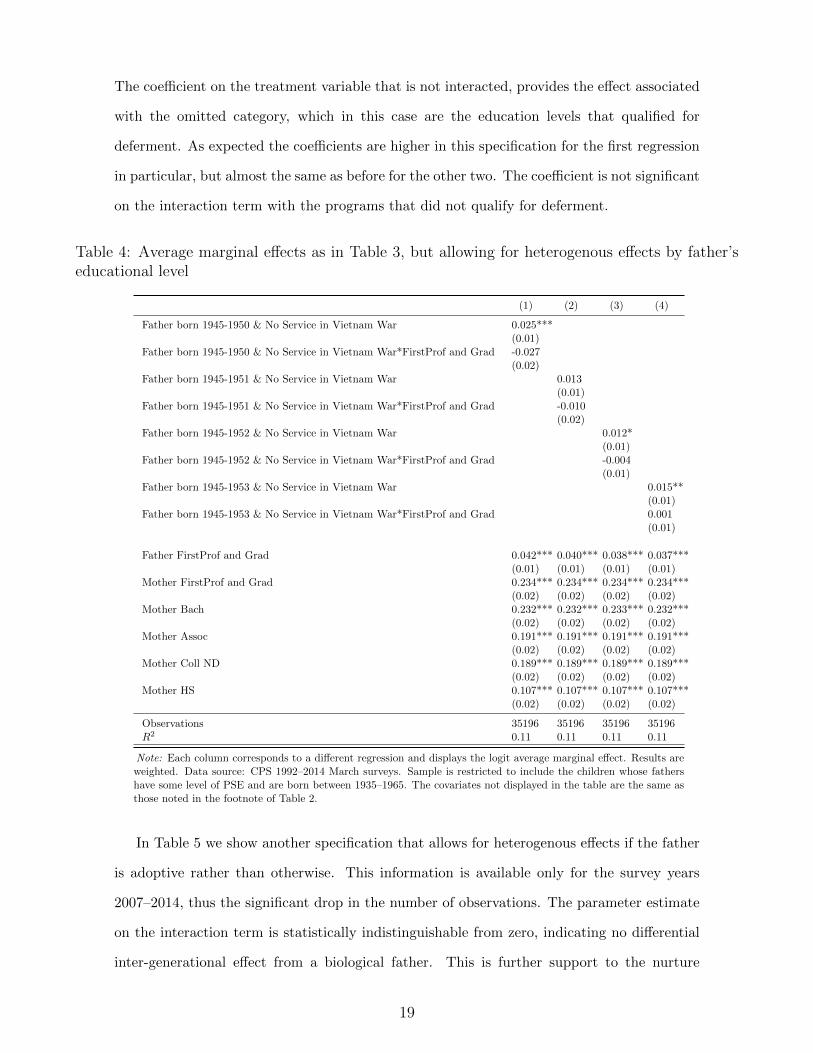
The coefficient on the treatment variable that is not interacted, provides the effect associated
with the omitted category, which in this case are the education levels that qualified for
deferment. As expected the coefficients are higher in this specification for the first regression
in particular, but almost the same as before for the other two. The coefficient is not significant
on the interaction term with the programs that did not qualify for deferment.
Table 4: Average marginal effects as in Table 3, but allowing for heterogenous effects by father’seducational level
(1) (2) (3) (4)
Father born 1945-1950 & No Service in Vietnam War 0.025***(0.01)
Father born 1945-1950 & No Service in Vietnam War*FirstProf and Grad -0.027(0.02)
Father born 1945-1951 & No Service in Vietnam War 0.013(0.01)
Father born 1945-1951 & No Service in Vietnam War*FirstProf and Grad -0.010(0.02)
Father born 1945-1952 & No Service in Vietnam War 0.012*(0.01)
Father born 1945-1952 & No Service in Vietnam War*FirstProf and Grad -0.004(0.01)
Father born 1945-1953 & No Service in Vietnam War 0.015**(0.01)
Father born 1945-1953 & No Service in Vietnam War*FirstProf and Grad 0.001(0.01)
Father FirstProf and Grad 0.042*** 0.040*** 0.038*** 0.037***(0.01) (0.01) (0.01) (0.01)
Mother FirstProf and Grad 0.234*** 0.234*** 0.234*** 0.234***(0.02) (0.02) (0.02) (0.02)
Mother Bach 0.232*** 0.232*** 0.233*** 0.232***(0.02) (0.02) (0.02) (0.02)
Mother Assoc 0.191*** 0.191*** 0.191*** 0.191***(0.02) (0.02) (0.02) (0.02)
Mother Coll ND 0.189*** 0.189*** 0.189*** 0.189***(0.02) (0.02) (0.02) (0.02)
Mother HS 0.107*** 0.107*** 0.107*** 0.107***(0.02) (0.02) (0.02) (0.02)
Observations 35196 35196 35196 35196R2 0.11 0.11 0.11 0.11
Note: Each column corresponds to a different regression and displays the logit average marginal effect. Results areweighted. Data source: CPS 1992–2014 March surveys. Sample is restricted to include the children whose fathershave some level of PSE and are born between 1935–1965. The covariates not displayed in the table are the same asthose noted in the footnote of Table 2.
In Table 5 we show another specification that allows for heterogenous effects if the father
is adoptive rather than otherwise. This information is available only for the survey years
2007–2014, thus the significant drop in the number of observations. The parameter estimate
on the interaction term is statistically indistinguishable from zero, indicating no differential
inter-generational effect from a biological father. This is further support to the nurture
19

hypothesis.
Table 5: Average marginal effects as in Table 3, but allowing for heterogenous effects by father’sbiological/adoptive status
(1) (2) (3) (4)
Father born 1945-1950 & No Service in Vietnam War 0.061***(0.02)
Father born 1945-1950 & No Service in Vietnam War*Adoptive -0.009(0.07)
Father born 1945-1951 & No Service in Vietnam War 0.041**(0.02)
Father born 1945-1951 & No Service in Vietnam War*Adoptive -0.019(0.07)
Father born 1945-1952 & No Service in Vietnam War 0.025(0.02)
Father born 1945-1952 & No Service in Vietnam War*Adoptive 0.018(0.06)
Father born 1945-1953 & No Service in Vietnam War -0.002(0.02)
Father born 1945-1953 & No Service in Vietnam War*Adoptive 0.045(0.05)
Father Adoptive -0.033** -0.032** -0.035** -0.038**(0.02) (0.02) (0.02) (0.02)
Mother Adoptive -0.088***-0.087***-0.087***-0.087***(0.02) (0.02) (0.02) (0.02)
Observations 12551 12551 12551 12551Pseudo R2 0.10 0.10 0.10 0.10
Note: Each column corresponds to a different regression and displays the logit average marginal effect.Results are weighted. Data source: CPS 2007–2014 March surveys. Sample is restricted to include thechildren whose fathers have some level of PSE and are born between 1935–1965. The covariates notdisplayed in the table are the same as those noted in the footnote of Table 2.
In Tables A.2 , A.3 and A.4 we present another set of estimates, in which the fathers
that served in the Vietnam War were omitted from the estimation sample. This serves as
a robustness check of whether the results we presented so far were instead driven by the
presence of the veterans in the data. The coefficients are insignificant and smaller for most
cases, except for the first regression in each table. In this regression the treatment definition
is based on the fathers’ birth years 1945–1950, for which the incentive of enrolling into PSE
to avoid the draft was highest.
Overall, the results point not only to the treatment of fathers’ birth years being 1945-
50 leading to no drop in the transmission of PSE attendance relative to other fathers in
the sample who had the normal incentives to attend PSE, but an increase in the rate of
transmission, albeit a modest one of about 2%.
20
6 Conclusion
In this paper we analyze whether there is a causal effect of parental education on their
children’s educational attainment. In the spirit of Black et al. (2009) but in a different
context, we use a natural experiment to identify an inter-generational causal relationship.
We are able to address the question of whether this effect is genetic (nature argument) or
environmental (nurture argument). The work of Card and Lemieux (2001) suggests that
draft-avoidance behaviour (rather than the post-service GI Bill benefits) lead to the observed
sudden increase in educational attendance and attainment observed during the mid 1960s to
mid 1970s. Men who were at risk of being drafted had a strong incentive to enrol in a PSE
program in order to obtain a deferment and avoid serving in the Vietnam War. Since the
lottery induced an enrolment incentive for those men who would not have enrolled in a PSE
program in the absence of the lottery, the Vietnam Era Draft Lottery serves as a natural
experiment.
In this paper we track whether the PSE education transmission rate from these men to
their children and compare to that for men who faced normal incentives to attend PSE. The
treatment is having a father who was born during the years 1945-1950. We find evidence,
contrary to expectations of the nature hypothesis, that the transmission rate of fathers’ PSE
educational attainment is not less than for those fathers born outside this period (i.e., not
in the treatment group). In fact, we find a modest increase in the transmission rate for the
treatment group. Therefore, the evidence is more consistent with the nurture hypothesis.
Hence, we conclude that the source of the correlation between the parental education and
the educational attainment of their children is in fact due to the educational attainment per
se. From a policy perspective, the inter-generational multiplier effects that this may generate
are of interest in poverty alleviation and inequality reduction initiatives.
21

References
Joshua D. Angrist and Stacey H. Chen. Schooling and the Vietnam-Era GI bill: Evidence
from the draft lottery. American Economic Journal: Applied Economics, 3:96–118, 2011.
Anders Bjorklund, Mikael Lindahl, and Erik Plug. The origins of intergenerational associa-
tions: Lessons from Swedish adoption data. Quarterly Journal of Economics, 121:999–1028,
2006.
Anders Bjorklund, Markus Jantti, and Gary Solon. Nature and nurture in the intergena-
rational transmission of socioeconomic status: Evidence from Swedish children and their
biological and rearing parents. The B.E. Journal of Economic Analysis & Policy, 7(2
(Advances)), 2007.
Sandra E. Black, Paul J. Devereux, and Kjell G. Salvanes. Like father, like son? A note on
the intergenerational transmission of IQ scores. Economics Letters, 105:138–140, 2009.
David Card and Thomas Lemieux. Going to college to avoid the draft: The unintended
legacy of the Vietnam War. The American Economic Review, 91(2):97–102, 2001. Papers
and Proceedings of the Hundred Thirteenth Annual Meeting of the American Economic
Association.
Louis Christofides, Michael Hoy, Joniada Milla, and Thanasis Stengos. Grades, aspriations
and post-secondary education outcomes. Canadian Journal of Higher Education, forth-
coming.
Miles Corak. Income inequality, equality of opportunity, and intergenerational mobility.
Journal of Economic Perspectives, 27(3):79–102, 2013.
Franque Grimard and Daniel Parent. Education and smocking: Were vietnam war draft
avoiders also more likely to avoid smoking? Economics Letters, 26:896–926, 2007.
Tom Hertz, Tamara Jayasundera, Patrizio Piraino, Sibel Seleuk, Nicole Smithand, and Alina
Verashhagina. The inheritance of educational inequality: International comparisons and
fifty-year trends. The B.E. Journal of Economic Analysis & Policy, 7(2):46, 2007.
22
Miriam King, Steven Ruggles, J. Trent Alexander, Sarah Flood, Katie Genadek, Matthew B.
Schroeder, Brandon Trampe, and Rebecca Vick. Integrated public use microdata series,
current population survey: Version 3.0. [machine-readable database]. 2010.
OECD. Divided we stand: Why inequality keeps rising. Organization for Economic Cooper-
ation and Development, 2011.
Erik Plug and Wim Vijverberg. Schooling, family background, and adoption: Is it nature or
is it nurture? Journal of Political Economy, 111(3):611–641, 2003.
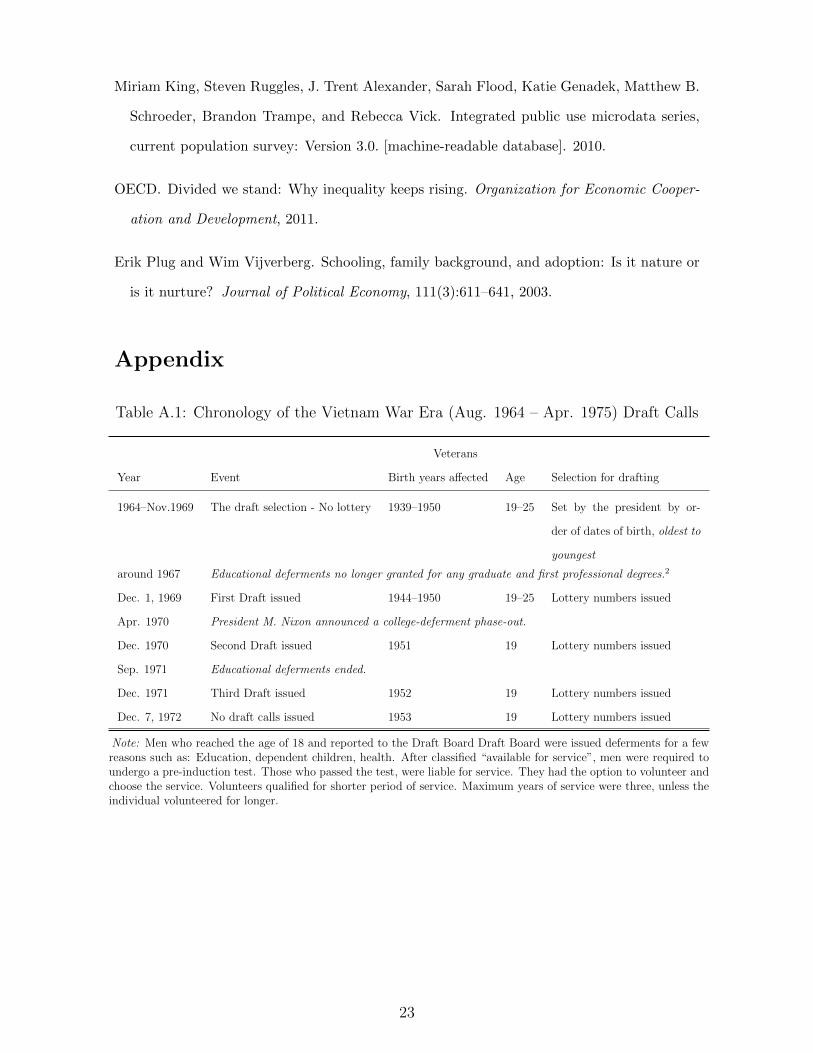
Appendix
Table A.1: Chronology of the Vietnam War Era (Aug. 1964 – Apr. 1975) Draft Calls
Veterans
Year Event Birth years affected Age Selection for drafting
1964–Nov.1969 The draft selection - No lottery 1939–1950 19–25 Set by the president by or-
der of dates of birth, oldest to
youngest
around 1967 Educational deferments no longer granted for any graduate and first professional degrees.2
Dec. 1, 1969 First Draft issued 1944–1950 19–25 Lottery numbers issued
Apr. 1970 President M. Nixon announced a college-deferment phase-out.
Dec. 1970 Second Draft issued 1951 19 Lottery numbers issued
Sep. 1971 Educational deferments ended.
Dec. 1971 Third Draft issued 1952 19 Lottery numbers issued
Dec. 7, 1972 No draft calls issued 1953 19 Lottery numbers issued
Note: Men who reached the age of 18 and reported to the Draft Board Draft Board were issued deferments for a fewreasons such as: Education, dependent children, health. After classified “available for service”, men were required toundergo a pre-induction test. Those who passed the test, were liable for service. They had the option to volunteer andchoose the service. Volunteers qualified for shorter period of service. Maximum years of service were three, unless theindividual volunteered for longer.
23
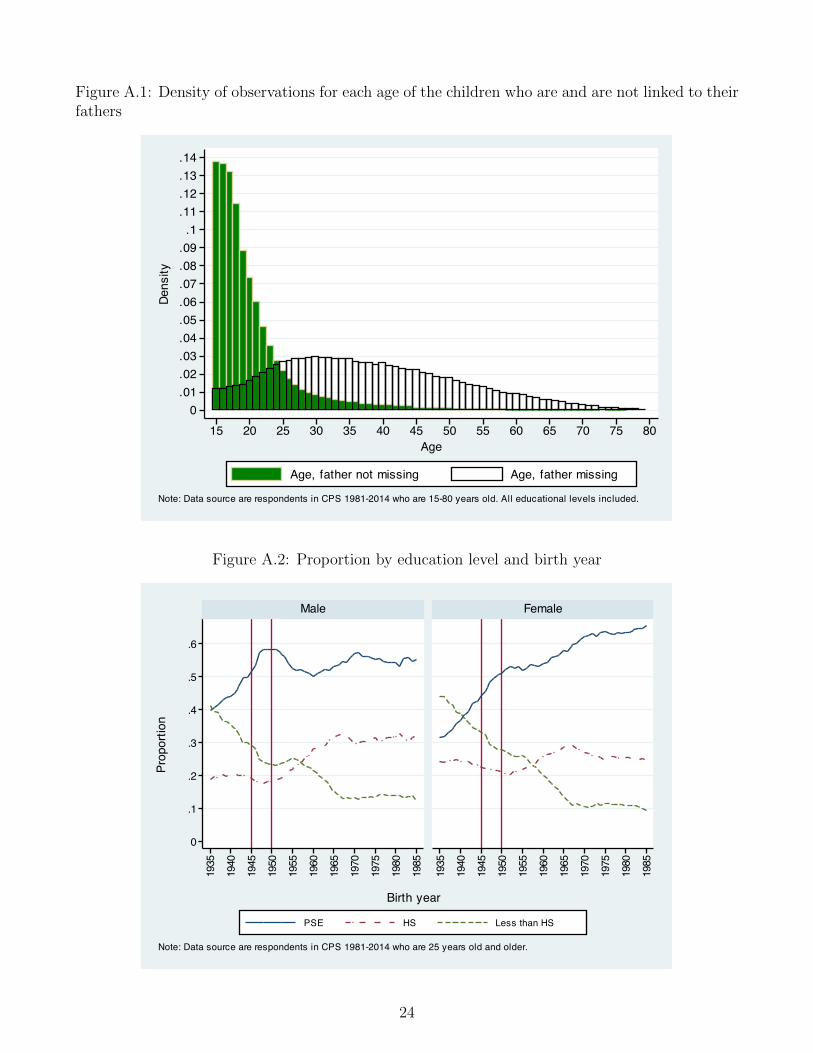
Figure A.1: Density of observations for each age of the children who are and are not linked to theirfathers
0.01.02.03.04.05.06.07.08.09.1
.11
.12
.13
.14De
nsity
15 20 25 30 35 40 45 50 55 60 65 70 75 80Age
Age, father not missing Age, father missing
Note: Data source are respondents in CPS 1981-2014 who are 15-80 years old. All educational levels included.
Figure A.2: Proportion by education level and birth year
0
.1
.2
.3
.4
.5
.6
1935
1940
1945
1950
1955
1960
1965
1970
1975
1980
1985
1935
1940
1945
1950
1955
1960
1965
1970
1975
1980
1985
Male Female
PSE HS Less than HS
Prop
ortio
n
Birth year
Note: Data source are respondents in CPS 1981-2014 who are 25 years old and older.
24
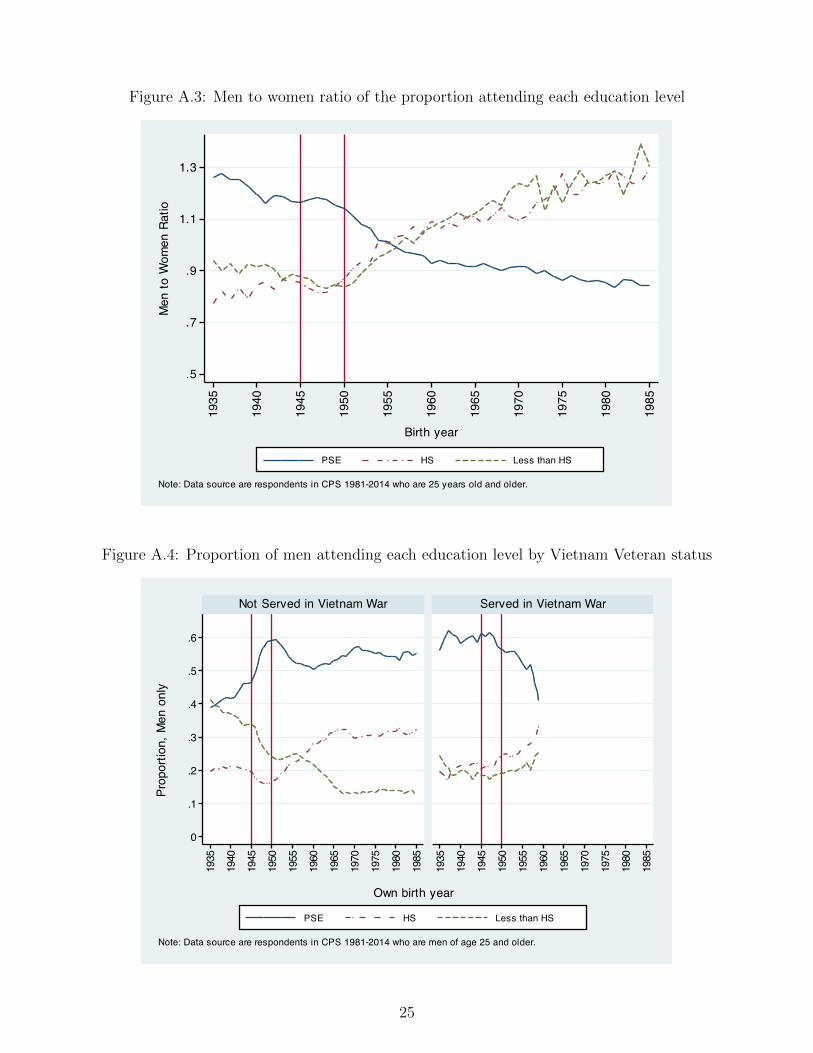
Figure A.3: Men to women ratio of the proportion attending each education level
.5
.7
.9
1.1
1.3M
en to
Wom
en R
atio
1935
1940
1945
1950
1955
1960
1965
1970
1975
1980
1985
Birth year
PSE HS Less than HS
Note: Data source are respondents in CPS 1981-2014 who are 25 years old and older.
Figure A.4: Proportion of men attending each education level by Vietnam Veteran status
0
.1
.2
.3
.4
.5
.6
1935
1940
1945
1950
1955
1960
1965
1970
1975
1980
1985
1935
1940
1945
1950
1955
1960
1965
1970
1975
1980
1985
Not Served in Vietnam War Served in Vietnam War
PSE HS Less than HS
Prop
ortio
n, M
en o
nly
Own birth year
Note: Data source are respondents in CPS 1981-2014 who are men of age 25 and older.
25
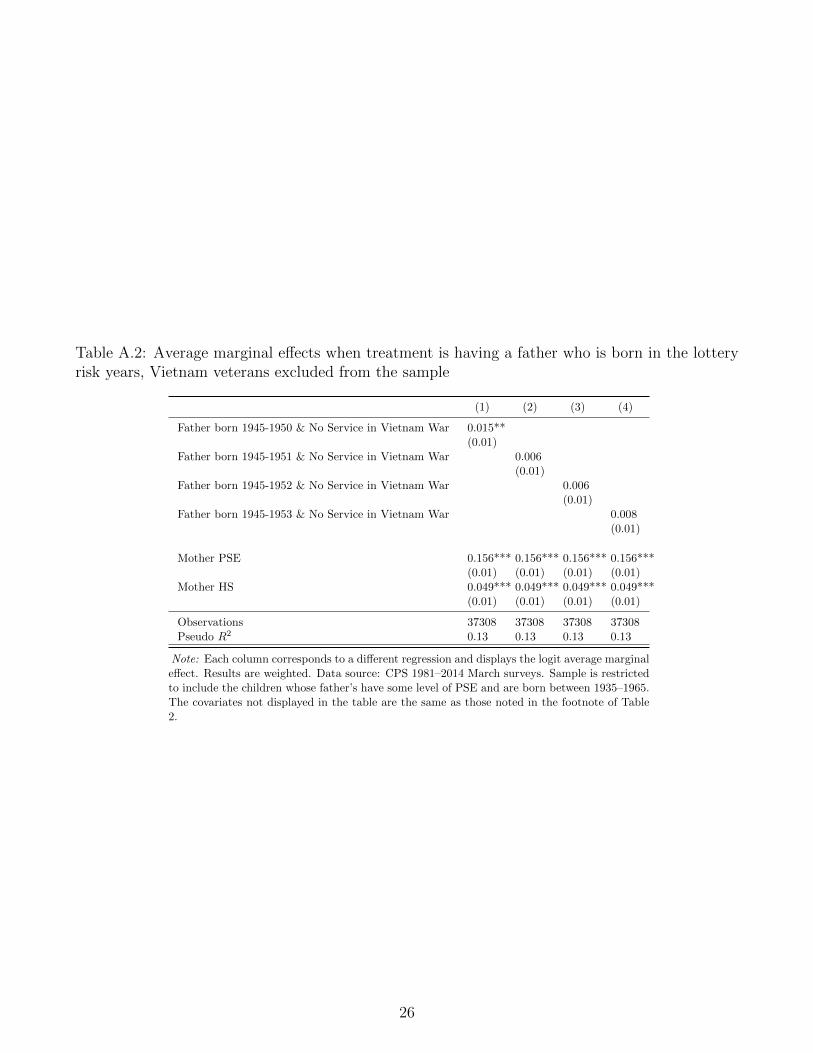
Table A.2: Average marginal effects when treatment is having a father who is born in the lotteryrisk years, Vietnam veterans excluded from the sample
(1) (2) (3) (4)
Father born 1945-1950 & No Service in Vietnam War 0.015**(0.01)
Father born 1945-1951 & No Service in Vietnam War 0.006(0.01)
Father born 1945-1952 & No Service in Vietnam War 0.006(0.01)
Father born 1945-1953 & No Service in Vietnam War 0.008(0.01)
Mother PSE 0.156*** 0.156*** 0.156*** 0.156***(0.01) (0.01) (0.01) (0.01)
Mother HS 0.049*** 0.049*** 0.049*** 0.049***(0.01) (0.01) (0.01) (0.01)
Observations 37308 37308 37308 37308Pseudo R2 0.13 0.13 0.13 0.13
Note: Each column corresponds to a different regression and displays the logit average marginaleffect. Results are weighted. Data source: CPS 1981–2014 March surveys. Sample is restrictedto include the children whose father’s have some level of PSE and are born between 1935–1965.The covariates not displayed in the table are the same as those noted in the footnote of Table2.
26
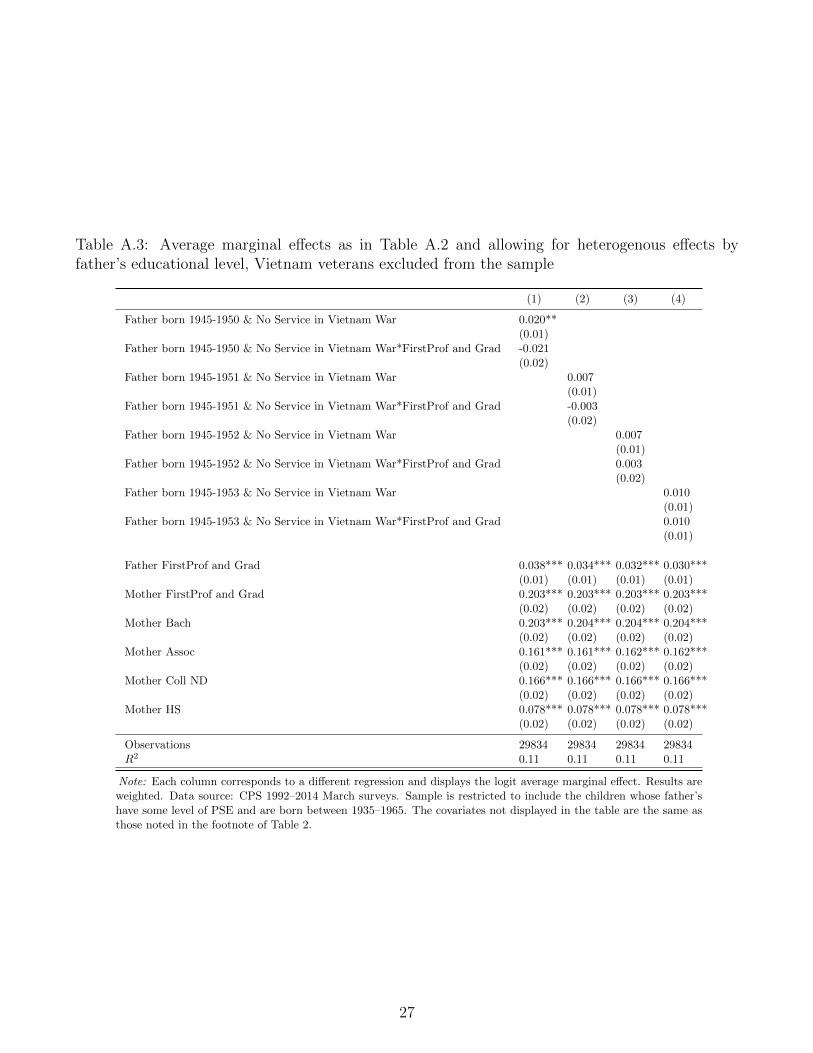
Table A.3: Average marginal effects as in Table A.2 and allowing for heterogenous effects byfather’s educational level, Vietnam veterans excluded from the sample
(1) (2) (3) (4)
Father born 1945-1950 & No Service in Vietnam War 0.020**(0.01)
Father born 1945-1950 & No Service in Vietnam War*FirstProf and Grad -0.021(0.02)
Father born 1945-1951 & No Service in Vietnam War 0.007(0.01)
Father born 1945-1951 & No Service in Vietnam War*FirstProf and Grad -0.003(0.02)
Father born 1945-1952 & No Service in Vietnam War 0.007(0.01)
Father born 1945-1952 & No Service in Vietnam War*FirstProf and Grad 0.003(0.02)
Father born 1945-1953 & No Service in Vietnam War 0.010(0.01)
Father born 1945-1953 & No Service in Vietnam War*FirstProf and Grad 0.010(0.01)
Father FirstProf and Grad 0.038*** 0.034*** 0.032*** 0.030***(0.01) (0.01) (0.01) (0.01)
Mother FirstProf and Grad 0.203*** 0.203*** 0.203*** 0.203***(0.02) (0.02) (0.02) (0.02)
Mother Bach 0.203*** 0.204*** 0.204*** 0.204***(0.02) (0.02) (0.02) (0.02)
Mother Assoc 0.161*** 0.161*** 0.162*** 0.162***(0.02) (0.02) (0.02) (0.02)
Mother Coll ND 0.166*** 0.166*** 0.166*** 0.166***(0.02) (0.02) (0.02) (0.02)
Mother HS 0.078*** 0.078*** 0.078*** 0.078***(0.02) (0.02) (0.02) (0.02)
Observations 29834 29834 29834 29834R2 0.11 0.11 0.11 0.11
Note: Each column corresponds to a different regression and displays the logit average marginal effect. Results areweighted. Data source: CPS 1992–2014 March surveys. Sample is restricted to include the children whose father’shave some level of PSE and are born between 1935–1965. The covariates not displayed in the table are the same asthose noted in the footnote of Table 2.
27
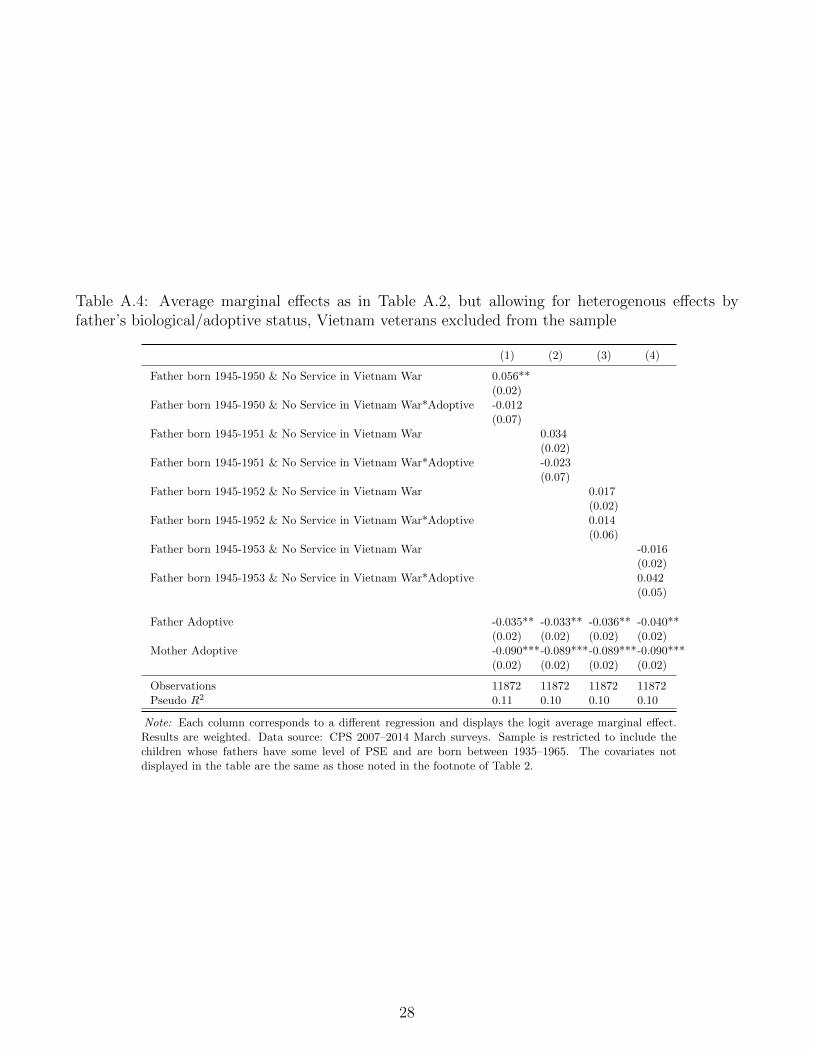
Table A.4: Average marginal effects as in Table A.2, but allowing for heterogenous effects byfather’s biological/adoptive status, Vietnam veterans excluded from the sample
(1) (2) (3) (4)
Father born 1945-1950 & No Service in Vietnam War 0.056**(0.02)
Father born 1945-1950 & No Service in Vietnam War*Adoptive -0.012(0.07)
Father born 1945-1951 & No Service in Vietnam War 0.034(0.02)
Father born 1945-1951 & No Service in Vietnam War*Adoptive -0.023(0.07)
Father born 1945-1952 & No Service in Vietnam War 0.017(0.02)
Father born 1945-1952 & No Service in Vietnam War*Adoptive 0.014(0.06)
Father born 1945-1953 & No Service in Vietnam War -0.016(0.02)
Father born 1945-1953 & No Service in Vietnam War*Adoptive 0.042(0.05)
Father Adoptive -0.035** -0.033** -0.036** -0.040**(0.02) (0.02) (0.02) (0.02)
Mother Adoptive -0.090***-0.089***-0.089***-0.090***(0.02) (0.02) (0.02) (0.02)
Observations 11872 11872 11872 11872Pseudo R2 0.11 0.10 0.10 0.10
Note: Each column corresponds to a different regression and displays the logit average marginal effect.Results are weighted. Data source: CPS 2007–2014 March surveys. Sample is restricted to include thechildren whose fathers have some level of PSE and are born between 1935–1965. The covariates notdisplayed in the table are the same as those noted in the footnote of Table 2.
28