Embed Size (px)
Citation preview

Forest water use and water use efficiency at elevatedCO2: a model-data intercomparison at two contrastingtemperate forest FACE sitesMART IN G . DE KAUWE* , B EL INDA E . MEDLYN* , S ONKE ZAEHLE † ,
ANTHONY P . WALKER ‡ , M ICHAEL C . D I ETZE § , THOMAS H ICKLER ¶ , k, ATUL K . JA IN * * ,
Y IQ I LUO † † , W I LL IAM J . PARTON ‡ ‡ , I . COL IN PRENT ICE * , B EN JAMIN SM ITH § § ,P ETER E . THORNTON ‡ , SHUSEN WANG ¶ ¶ , Y ING -P ING WANG kk, DAV ID WARL IND § § ,ENSHENG WENG † † , KR I S T INE Y . CROUS * * * , DAV ID S . ELL SWORTH* * * ,
PAUL J . HANSON ‡ , HYUN - SEOK K IM † † † , J E F FREY M . WARREN ‡ , RAM OREN ‡ ‡ ‡ , § § §and RICHARD J. NORBY‡
*Department of Biological Sciences, Macquarie University, North Ryde, New South Wales 2109, Australia, †Biogeochemical
Integration Department, Max Planck Institute for Biogeochemistry, Hans-Knoll-Str. 10, Jena 07745 Germany, ‡Oak Ridge
National Laboratory, Environmental Sciences Division and Climate Change Science Institute, Oak Ridge, Tennessee, USA,
§Department of Earth and Environment, Boston University, Boston, MA 02215, USA, ¶Biodiversity and Climate Research Centre
(BiK-F) & Senckenberg Gesellschaft fur Naturforschung, Senckenberganlage 25, Frankfurt/Main 60325, Germany, kDepartment of
Physical Geography at Goethe-University, Altenhoferalle 1, Frankfurt/Main 60438, Germany, **Department of Atmospheric
Sciences, University of Illinois, 105 South Gregory Street, Urbana, Illionis 61801, USA, ††Department of Microbiology and Plant
Biology, University of Oklahoma, Norman, Oklahoma 73019, USA, ‡‡Natural Resource Ecology Laboratory, Colorado State
University, CSU, Fort Collins, Colorado 80523-1499, USA, §§Department of Physical Geography and Ecosystem Science, Lund
University, Ole Romers v€ag 3, Lund, 223 63, Sweden, ¶¶Canada Centre for Remote Sensing, Natural Resources Canada, 580 Booth
St, Ottawa, ON K1A 0E4, Canada, kkCSIRO Marine and Atmospheric Research and Centre for Australian Weather and Climate
Research, Private Bag #1, Aspendale, Victoria 3195, Australia, ***Hawkesbury Institute for the Environment, University of
Western Sydney, Locked Bag 1797, Penrith, NSW 2751, Australia, †††Department of Forest Sciences, College of Agriculture &
Life Sciences, Seoul National University, San 56-1, Gwanak-gu, Seoul 151-742, Republic of Korea, ‡‡‡Division of Environmental
Science & Policy, Nicholas School of the Environment, Duke University, West Campus, Durham, NC 27708, USA,
§§§Department of Forest Ecology & Management, Swedish University of Agricultural Sciences (SLU), Umea, SE-901 83, Sweden
Abstract
Predicted responses of transpiration to elevated atmospheric CO2 concentration (eCO2) are highly variable amongst
process-based models. To better understand and constrain this variability amongst models, we conducted an inter-
comparison of 11 ecosystem models applied to data from two forest free-air CO2 enrichment (FACE) experiments at
Duke University and Oak Ridge National Laboratory. We analysed model structures to identify the key underlying
assumptions causing differences in model predictions of transpiration and canopy water use efficiency. We then
compared the models against data to identify model assumptions that are incorrect or are large sources of uncer-
tainty. We found that model-to-model and model-to-observations differences resulted from four key sets of assump-
tions, namely (i) the nature of the stomatal response to elevated CO2 (coupling between photosynthesis and stomata
was supported by the data); (ii) the roles of the leaf and atmospheric boundary layer (models which assumed multi-
ple conductance terms in series predicted more decoupled fluxes than observed at the broadleaf site); (iii) the treat-
ment of canopy interception (large intermodel variability, 2–15%); and (iv) the impact of soil moisture stress (process
uncertainty in how models limit carbon and water fluxes during moisture stress). Overall, model predictions of the
CO2 effect on WUE were reasonable (intermodel l = approximately 28% � 10%) compared to the observations
(l = approximately 30% � 13%) at the well-coupled coniferous site (Duke), but poor (intermodel l = approximately
24% � 6%; observations l = approximately 38% � 7%) at the broadleaf site (Oak Ridge). The study yields a frame-
work for analysing and interpreting model predictions of transpiration responses to eCO2, and highlights key
improvements to these types of models.
Keywords: climate change, CO2 fertilization, elevated CO2, FACE, models, plant physiology, stomatal conductance, water
Received 28 November 2012 and accepted 30 January 2013
Correspondence: Martin De Kauwe, tel. + 61 2 9850 9256,
fax + 61 2 9850 8245, e-mail: [email protected]
© 2013 Blackwell Publishing Ltd 1759
Global Change Biology (2013) 19, 1759–1779, doi: 10.1111/gcb.12164

Introduction
Forest biomes play a key role in land-atmosphere
exchanges of mass and energy, covering approximately
30% of the land surface and recycling up to 56% of pre-
cipitation (Eltahir & Bras, 1996; Bonan, 2008). The
potential effects of increasing atmospheric carbon diox-
ide concentration ([CO2]) on forest biomes remain a key
uncertainty in global change research (Denman et al.,
2007). At the leaf scale, elevated [CO2] (eCO2) increases
carbon uptake via increasing photosynthetic rates
(Kimball et al., 1993; Curtis & Wang, 1998; Mooney
et al., 1999) and reduces water loss via lower stomatal
conductance (gs) (Morison, 1985; Saxe et al., 1998; Med-
lyn et al., 2001; Ainsworth & Rogers, 2007). Although
these direct impacts on physiological processes are well
understood and have been well-quantified at the leaf
scale, it remains unclear how these impacts will trans-
late into changes at the ecosystem scale.
The reduction in gs under eCO2, when implemented
in models, commonly results in a strong physiological
forcing that affects transpiration, runoff and surface
temperatures (Idso & Brazel, 1984; Henderson-Sellers
et al., 1995; Pollard & Thompson, 1995; Sellers et al.,
1996; Gedney et al., 2006; Betts et al., 2007; Cao et al.,
2010). In model simulations by Gedney et al. (2006),
reduced gs under eCO2 resulted in global reductions in
transpiration and increases in runoff, results that they
argued were supported by increases in observed
continental runoff records over the 20th century. Betts
et al. (2007) modified the Land Surface Model (LSM)
used by Gedney et al. (2006), to account for atmospheric
boundary layer feedbacks, and found similar results,
predicting an increase in global runoff of approxi-
mately 6% for a doubling in [CO2]. In a similar vein,
Cao et al. (2010) showed with a coupled simulation that
a doubling of [CO2] resulted in an increase in global
runoff (approximately 8%) due to physiological forcing
controls.
However, a number of authors have argued that the
effect of eCO2 on transpiration (E) in such studies is
overstated, due to atmospheric boundary layer feed-
backs (Field et al., 1995; Korner et al., 2007), increasing
leaf area index (LAI) (Woodward, 1990; Sch€afer et al.,
2002; Gerten et al., 2008), CO2-driven structural changes
in vegetation and human-induced disturbance. Field
et al. (1995) suggested that the sensitivity of E to
changes in gs is dependent on atmospheric feedback
driven by the humidity of the boundary layer, wind
speed and the canopy temperature. In agreement with
this argument, Wullschleger et al. (2002) found that
canopy-atmosphere decoupling at the Oak Ridge Free-
Air CO2 Enrichment (FACE) site was high during the
summer, which suggests that CO2 driven changes in gs
may have a relatively small effect on canopy transpira-
tion fluxes. Wullschleger et al. (2002) estimated that for
a 24% change in gs, there would only be a 12% reduc-
tion in transpiration (peak of summer). A number of
potential feedbacks via LAI are also possible. It has
been argued that increased carbohydrate availability at
eCO2 will result in increased LAI, which would act to
increase transpiration, offsetting ‘water savings’
(Woodward, 1990; but see Warren et al., 2011a). Experi-
mental results from FACE experiments suggest that
eCO2 can increase LAI in forest stands with relatively
low LAI but not in stands with high LAI (Gielen et al.,
2001; Sch€afer et al., 2002; McCarthy et al., 2007; Uddling
et al., 2008; Norby & Zak, 2011). As a result of such an
eCO2-induced increase of LAI at Duke FACE, annual
transpiration was unaffected over 3 years of measure-
ments (Sch€afer et al., 2002). A series of modelling stud-
ies that allowed for increases in LAI with rising [CO2]
highlighted an increase in transpiration, which, at the
global scale, was found to decrease global runoff
amounts, in direct contrast to Gedney et al. (2006; see
above) (Piao et al., 2007; Gerten et al., 2008; Bounoua
et al., 2010).
The differing results amongst studies highlight the
current uncertainty about plant water use in response
to rising [CO2] and the incomplete nature of ecosystem
water budgets in experiments. As changes in [CO2] are
projected to extend beyond our observation record
(Petit et al., 1999), we are reliant on relatively short-
term elevated [CO2] manipulation experiments to eval-
uate our models. The task, therefore, is to synthesize
what we have learned from [CO2] manipulation experi-
ments to improve our projections of plant water fluxes
in response to eCO2. Although there is a long history of
[CO2] manipulation experiments (glasshouse and open
top chambers) for forest species, it is often difficult to
scale observed results to the stand or ecosystem. Con-
founding factors such as limited rooting depth, short
duration of experiments and age of plants, can compli-
cate interpretation of results. For these reasons, FACE
experiments are arguably the state of the art in this field
and provide us with a unique series of long-term,
stand-scale data sets against which to test models
(Ainsworth & Rogers, 2007).
The goal of this study is to compare simulations of
water fluxes by 11 state of the art ecosystem models,
evaluating simulations against forest carbon and water
fluxes in response to eCO2 at two forest FACE sites in
the United States of America. Our aim is to contrast
and analyse the responses of the models to identify the
key model assumptions that lead to different predicted
effects of CO2 on transpiration. We also aimed to evalu-
ate the simulations against data from the two forest
FACE experiments, to identify which model assump-
© 2013 Blackwell Publishing Ltd, Global Change Biology, 19, 1759–1779
1760 M. G. DE KAUWE et al.

tions are plausible, implausible or in need of further
refinement. In addition, the results of this intercompari-
son will help inform future experimental work, identi-
fying existing gaps in our understanding, particularly
as to which measurements we need to obtain to
constrain uncertainty in model simulations.
The approach taken was to focus on water use effi-
ciency (WUE), or carbon uptake per unit water tran-
spired. Almost all of the models considered here
(as well as many other ecosystem models) simulate
transpiration based on the observed leaf level coupling
between photosynthesis and stomatal conductance
(Wong et al., 1979; Ball et al., 1987). This coupling
implies that assimilation is an important driver of tran-
spiration, and consequently that the CO2 effect on tran-
spiration can be predicted from the CO2 effect on
assimilation. Models based on this coupling may thus
differ in their predictions of transpiration either
because they differ in their prediction of productivity
or because they differ in their prediction of WUE.
Model simulations of the CO2 effect on productivity
will be considered in a companion paper (S. Zaehle,
B.E. Medlyn, A.P. Walker, et al., in prep.). This article
considers how and why models differ in their predic-
tions of the CO2 effect on WUE, using a simple version
of the coupled photosynthesis-stomatal conductance
model as a baseline for comparing the behaviour of the
different models. Having identified the key assump-
tions underlying model differences, we then evaluated
the models against actual measurements. Together with
the impacts on productivity, this information allows us
to identify the uncertainties that lead to models differ-
ing in their predictions of CO2 effects on transpiration.
Materials and methods
Experimental data
The Duke FACE site is located in a loblolly pine (Pinus taeda)
plantation (35.97 °N, 79.08 °W) established in 1983 in open
woodland partially covered with grass harvested as fodder.
The site experiences a mean annual temperature of 15.8 °C.Mean annual rainfall is 1145 mm, which is evenly distributed
throughout the year, but the site regularly experiences
drought during the growing season (McCarthy et al., 2007;
Ellsworth et al., 2012). The majority of fine roots are restricted
by a hard pan to the upper 0.35 m of the soil, making the
forest highly sensitive to even short periods of drought (Oren
et al., 1998). The soil is relatively nutrient poor, showing a sub-
stantial response to nitrogen (N) fertilization (Oren et al., 2001;
Crous et al., 2008; Maier et al., 2008). Furthermore, natural var-
iation in N availability controls net primary productivity
(NPP), LAI, carbon allocation above vs. belowground, and the
proportion of LAI of the dominant pine vs. the broadleaved
species naturally established amongst the pines, as well as the
responses of these variables to elevated CO2 (Finzi et al., 2002;
Palmroth et al., 2006; McCarthy et al., 2007). At the start of the
experiment, trees were 15 years old and approximately 14 m
tall, with a mean summer LAI of 3–4 m2 m�2 (for the domi-
nant pine species). In this study, we examined the experimen-
tal period that covered the years between 1996 and 2008. The
CO2 treatment began in August 1996, with the three elevated
rings (25–30 m in diameter) receiving continuous enhanced
CO2 concentrations tracking ambient conditions +200 lmol
mol�1 (mean approximately 542 lmol mol�1).
The Oak Ridge FACE site was similarly a former grassland
area until a sweetgum (Liquidambar styraciflua) plantation was
established in 1988. The site is located in Tennessee at the Oak
Ridge National Laboratory (35.9 °N, 84.33 °W). The soil at the
site, which is classified as an Aquic Hapludult, developed in
alluvium washed from upland soils derived from a variety of
rocks including dolomite, sandstone and shale. It has a silty
clay loam texture and is moderately well drained. The soil is
slightly acid (water pH approximately 5.5–6.0) with high base
saturation largely dominated by exchangeable Ca (Norby
et al., 2001). The site experiences a mean annual temperature
of 13.9 °C with average annual rainfall of 1371 mm, falling
evenly throughout the year (Warren et al., 2011b).
The Oak Ridge FACE experiment lasted from 1998 to 2009
(data through to 2008 were used in this exercise). Five plots
25 m in diameter were laid out in 1996, and FACE apparatus
was assembled in four of them. The stand can be character-
ized as a closed canopy deciduous sweetgum (L. styraciflua)
forest. At the start of the experiment, the trees (approxi-
mately 90 per plot) were 12 m tall with average diameter at
breast height of 0.11 m and stand basal area of 0.28 m2 m�2.
The trees were in a linear growth phase, LAI was
5.5 m2 m�2, and the canopy was no longer expanding
(Norby et al., 2003). Exposure to elevated [CO2] commenced
in two plots in April 1998, and continued during daylight
hours of each growing season (April– November). The aver-
age daytime [CO2] from 1998 to 2008 growing seasons was
547 lmol mol�1 in the two CO2-enriched plots and
395 lmol mol�1 in ambient plots.
Data measured at the leaf-scale and stand-scale were used
to test modelled responses. Measurements of leaf gas
exchange, including assimilation and stomatal conductance,
were made on in situ foliage throughout the Duke FACE
experiment (Ellsworth et al., 2012). At ORNL, leaf gas
exchange was measured in situ during several campaigns in
1998 – 2000 (Gunderson et al., 2002; Sholtis et al., 2004) and on
cut branches in 2008–2009 (J.M. Warren, B.E. Medlyn, R.J.
Norby, C.A. Gunderson and D.T. Tissue, in prep). At the
stand-scale, annual net primary production (NPP) was esti-
mated at both sites from annual increments of foliage, wood
and fine-root production (see McCarthy et al., 2010; for Duke
and Norby et al., 2002 for Oak Ridge). Stand-scale transpira-
tion was derived from sap flow measurements for the years
1999, 2004, 2007 and 2008 at Oak Ridge (see Wullschleger
et al., 2002; Warren et al., 2011a,b) and for 1998–2007 at the
Duke site (see Drake et al., 2010). Annual stand water use effi-
ciency was estimated from these measurements as annual
NPP / annual transpiration. Note that this measure is not
© 2013 Blackwell Publishing Ltd, Global Change Biology, 19, 1759–1779
MODEL WATER USE AT ELEVATED CO2 1761

identical to the modelled WUE considered in this article,
which is calculated as the ratio of gross primary production
(GPP) to transpiration. The difference between the two
measures is the ratio of NPP : GPP. Comparisons of modelled
values against data therefore need to take into account the
possibility that the ratio NPP : GPP changes under elevated
Ca. In the majority of models, the effect of CO2 treatment on
the NPP : GPP ratio is generally in the range of 0–5%.
This issue is explored in more detail in a companion paper
(M.G. De Kauwe, B.E. Medlyn, S. Zaehle, et al., in prep) and so
to simplify, we do not examine modelled NPP/E, but rather
GPP/E. For completeness, Figs 7 and 8 are reproduced in the
supplementary material, S1 and S2 calculating WUE as NPP/
E. A summary of the observed site responses is provided in
the supporting information.
The models
The 11 process-based models considered in this study, encom-
passing stand, (GDAY, CENTURY, TECO), age/size-gap
(ED2), land surface (CABLE, CASA, CLM4, EALCO, ISAM, O-
CN) and dynamic vegetation models (LPJ-GUESS, SDGVM),
vary widely in terms of their structure, emphasis and com-
plexity. A detailed overview of the models is provided in A.P.
Walker, P.Hanson, et al., (in prep). Here, we give some basic
information about each of the models and summarize the key
assumptions in each model that affect the simulated water
fluxes (see Table 1).
Model simulations
Model participants submitted simulations that covered the
time periods representative of the FACE experiments. Model-
lers were provided with forcing meteorological and CO2 con-
centration data, general site history information and stand
characteristics with the intention that simulations be represen-
tative without being ‘tuned’ to the observations. These data
sets are available at: http://public.ornl.gov/face/index.shtml.
Model outputs were provided at the two time steps hourly
and daily, if appropriate. These outputs contained estimates
of the various carbon, N and water fluxes and pools.
Model analysis
The approach taken to analyse the model simulations was to
make predictions based on a simple model, then to investi-
gate reasons for the departure of each model from this sim-
ple model. By taking this process-oriented approach, our
results can also be applied to other models not participating
in this study. The simple model is based on the coupling
between stomatal conductance and assimilation, which is
widely observed experimentally (Wong et al., 1979). Ball
et al. (1987) found that this correlation was modified by
humidity and atmospheric CO2 concentration, and synthe-
sized their observations into a simple empirical model.
Several alternative forms of this stomatal conductance model
exist (Table 1). We use the form derived by Medlyn et al.
(2011a) from the optimal stomatal theory of Cowan &
Farquhar (1977). They obtained the following expression for
stomatal conductance:
gs ¼ g0 þ 1:6ð1þ g1ffiffiffiffiD
p ÞAca
ð1Þ
where A is the gross assimilation rate (lmol m�2 s�1), g0(mol m�2 s�1), g0 and g1 (dimensionless) are fitted terms
representing theminimum stomatal conductance and the sensi-
tivity of the conductance to the assimilation rate, respectively,
Ca is the atmospheric CO2 concentration, and D is the vapour
pressure deficit (kPa) at the leaf surface. The minimum conduc-
tance, g0, is small and in the simplemodel is assumed to be zero.
In well-coupled atmospheric conditions (i.e. transpiration rate
is largely determined by stomatal conductance), transpiration
(E) (mol H2Om�2 s�1) can be approximated as follows:
E ¼ gsD
Pð2Þ
where P is the atmospheric pressure (kPa).
We can then combine Eqns (1) and (2) and re-arrange to
show that if g1 and D are assumed to be unchanged by CO2
treatment then the instantaneous leaf WUE is directly propor-
tional to the CO2 concentration:
WUE ¼ A
E1Ca ð3Þ
Thus, for a given increase in [CO2], this simple model
would predict a directly proportional increase in WUE. This
model is clearly overly simple, but provides a baseline expec-
tation that we can use to understand responses of more realis-
tic models and to explore the root cause of model-to-model
and model-to-observation differences.
We can analyse model behaviour by comparing the pre-
dicted change in WUE with eCO2 against the proportionality
arising in the simple model. We examined each model’s pre-
dictions to see how far that model deviated from proportional-
ity, and then analysed the models to identify the assumptions
causing this deviation. In the results, we first discuss the dif-
ferences in assumptions amongst the models, and the impacts
of these assumptions on model predictions; we then compare
the models against data from the FACE experiments.
Results
Analysis of model behaviour
Proportionality of modelled WUE response to CO2
treatment
Model results were examined by plotting the CO2 effect
(elevated/ambient) on WUE (GPP per unit transpira-
tion) for each day against the proportional increase in
CO2 for that day. These plots are shown for the year
2002 for the Duke and ORNL sites in Figs 1 and 2
respectively (for all years see S3–20). Most models show
a relationship between the CO2 effect on WUE and the
CO2 enhancement. However, in most cases, there is a
departure from direct proportionality; the slope of the
relationship between the CO2 effect on WUE and the
© 2013 Blackwell Publishing Ltd, Global Change Biology, 19, 1759–1779
1762 M. G. DE KAUWE et al.

Table 1 Summary of model assumptions important for predicting transpiration and water use efficiency
CABLE CLM4 DAYCENT EALCO
Model name CSIRO atmosphere
biosphere land
exchange
The community land
model version 4
Daily version
of CENTURY
Ecological assimilation of
land and climate observations
Reference Kowalczyk et al. (2006);
Wang et al. (2010, 2011)
Oleson et al. (2010) Parton et al. (1983) Wang, (2008); Wang et al.
(2007)
Timestep 30-min 30-min Daily 30-min
Assimilation Farquhar et al. (1980) Collatz et al. (1992) (no
co-limitation)
f(nitrogen,
temperature,
soil water, PAR)
Farquhar et al. (1980)
Stomatal conductance gs ¼ g0 þ g1A1þD=D0
fco2 gs ¼ g0 þ g1A RH Pfco2 gs = f (LAI, PET,
SMC)
gs ¼ g0 þ g1ADbfco2
CO2 function fco2 ¼ 1ðCs�CÞ fco2 ¼ 1
CSNA fco2 ¼ 1
ð1þ0:5ðeCO2�aCO2ÞÞaCO2
Transpiration Iterative
Penman-Monteith
calculation at the leaf
scale accounting for
both gb and ga and
limitation of soil water
supply
Calculation at the canopy
scale determined by
atmospheric demand
and accounting for both
gb and ga
f (PET, soil water
stress and LAI)
when LAI >4.0,transpiration will
equal PET
Iterative solution to the energy
balance at sunlit vs. shaded
canopy scale using ga only.
g0 (mol (H2O) m�2 s�1) 0.006 0.002 NA 0.0008
ga f (wind speed, canopy
stability)
f (wind speed, height) NA f (wind speed, height, canopy
stability)
gb f (wind speed, leaf width) f (wind speed, leaf width) NA NA
Interception effect on
WUE; average fraction
of intercepted rainfall
at Duke / ORNL
Interception does not
reduce transpiration;
2.4–2.2%
Atmospheric demand
can be satisfied by
evaporation of
intercepted water;
5.1–3.5%
Interception
does not reduce
transpiration;
5.6–5.7%
Intercepted water used to meet
atmospheric demand, which
reduces transpiration fluxes
but does not affect GPP
calculations; 2.1–2.8%
Soil moisture stress Modifier attenuates
g1 parameter
Modifier attenuates
Vcmax
Directly affects
transpiration
Modifier attenuates
Jmax and Vcmax
ED2 GDAY ISAM LPJ-GUESS
Model name Ecosystem
demography
version 2
Generic decomposition
and Yield
Integrated science
assessment model
General ecosystem
simulator (GUESS)
version of the combined
lund-potsdam-jena
(LPJ)-GUESS modelling
framework
Reference Medvigy et al. (2009) Comins & McMurtrie,
(1993)
Jain & Yang (2005) Smith et al. (2001 with
unpublished
implementation of
nitrogen cycle.
Timestep 15-min Daily 30-min Daily
Assimilation Farquhar et al. (1980) Farquhar et al. (1980);
Sands, 1995; Sands, 1996
Farquhar et al. (1980) Collatz et al. (1992)
Stomatal conductance
in well-watered
conditions
gs ¼ g0 þ g1A1þD=D0
fco2 gs ¼ g0 þ 1:6 1þ g1ffiffiffiD
p� �
Afco2 gs ¼ g0 þ g1ARhfco2 gs ¼ g0 þ 1:6 A1�0:8 fco2
Stomatal conductance
CO2 function
fco2 ¼ 1ðCs�CÞ fco2 ¼ 1
Cafco2 ¼ 1
Csfco2 ¼ 1
Cs
Transpiration
© 2013 Blackwell Publishing Ltd, Global Change Biology, 19, 1759–1779
MODEL WATER USE AT ELEVATED CO2 1763

Table 1 (continued)
ED2 GDAY ISAM LPJ-GUESS
Dynamic flux
calculation from
gs, gb, and leaf and
canopy air vapour
pressures
Penman-Monteith
calculated at the canopy
scale using ga
Iterative solution to
the energy balance at
sunlit vs. shaded
canopy scale, using
both ga and gb
Lesser of water supply,
determined by
plant-root-weighted soil
moisture, and
atmospheric demand,
calculated as a
semi-empirical
hyperbolic function of
canopy conductance
(Gerten et al. (2004)
g0 (mol (H2O) m�2 s�1) 0.0 0.0 0.016 0.012–0.02
ga f (wind speed,
vegetation profile)
f (wind speed,
vegetation profile)
f (wind speed, height) NA
gb f (leaf temperature,
leaf width, wind speed)
NA f (leaf temperature, leaf
width, wind speed)
NA
Interception effect on
WUE; average fraction
of intercepted rainfall
at Duke / ORNL
Does not affect WUE
calculations; 11.8–2.8%
Does not affect WUE
calculations; 19.1–5.3%
Intercepted water used
to meet atmospheric
demand, which
reduces
transpiration fluxes
but does not affect
GPP
calculations; 4.9–4.2%
Intercepted water used
to meet atmospheric
demand, which
reduces
transpiration fluxes
but does not affect
GPP calculations;
11.4–4.8%
Soil moisture stress Modifier attenuates
assimilation and
transpiration fluxes
Modifier attenuates
g1 parameter
Modifier attenuates
g1 parameter
During periods of stress,
conductance is reduced
until transpiration
matches the supply rate.
Photosynthesis rates are
reduced accordingly
O-CN SDGVM TECO
Model name Orchidee CN Sheffield dynamic
vegetation model
Terrestrial ecosystem model
Reference Zaehle et al. (2010) Woodward et al. (1995) Weng & Lui (2008)
Timestep 30-min Daily 30-min
Assimilation Kull & Kruijt (1998) Farquhar et al. (1980)
as formulated by
Harley et al. (1992)
Farquhar et al. (1980)
Stomatal conductance gs ¼ abDfco2 fhAfðDÞ gs ¼ g0 þ g1ðTÞAð1þ 0:66DÞ fco2 gs ¼ g0 þ g1ANSC
1þD=D0fco2
CO2 function fco2 ¼ Ciþ0:004KiCi
fco2 ¼ 1ðCs�1:54TÞ fco2 ¼ 1
ðC�CÞ
Transpiration Iterative
Penman-Monteith
calculation at the
leaf canopy scale
accounting, ga
Penman-Monteith
calculated at the
canopy scale using ga
Iterative Penman-Monteith
calculated at the leaf scale using gb
g0 (mol (H2O) m�2 s�1) 0.001–0.002 0.005 0.01
ga f (wind speed,
friction velocity)
f (wind speed,
height, LAI)
NA
gb NA NA f (leaf temperature, leaf width, wind speed)
© 2013 Blackwell Publishing Ltd, Global Change Biology, 19, 1759–1779
1764 M. G. DE KAUWE et al.

Table 1 (continued)
O-CN SDGVM TECO
Interception effect on
WUE; average fraction
of intercepted rainfall
at Duke/ORNL
Does not affect WUE
calculations; 2.6–2.5%
Does not affect WUE
calculations; 14.1–11.8%
Not calculated
Soil Moisture stress Modifier attenuates
g1 parameter
Modifier attenuates
Vcmax and the g1parameter
Modifier attenuates g1 parameter
A is the assimilation rate; gs is stomatal conductance; g0 is the residual stomatal conductance as the assimilation rate reaches zero; g1represents the slope of the sensitivity of stomatal conductance to assimilation, CO2 concentration and environmental controls (e.g.
VPD); residual conductance to water vapour Rh is relative humidity at the leaf surface; D is the vapour pressure deficit; D0 is an
empirical constant; Cs is the CO2 concentration at the leaf surface; Γis the CO2 concentration point; P is the atmospheric pressure; gais the canopy scale boundary layer conductance; gb is the leaf level boundary layer conductance; NSC is the nonstructural carbon;
PAR is the photosynthetically active radiation; LAI is the leaf area index; PET is the potential evapotranspiration; SMC is the soil
moisture content; aCO2 is the ambient CO2 concentration; eCO2 is the elevated CO2 concentration; b is an empirical constant; Vcmax
is the maximum rate of carboxylation; Jmax is the maximum rate of electron transport; fh is a function describing the effect of canopy
height on stomatal conductance; f(D) is a function describing the effect of atmospheric humidity upon stomatal conductance; a and
Ki are empirical constants; bD is a soil moisture availability factor.
Fig. 1 Comparison of the ratio of WUE at eCO2 to WUE at aCO2, plotted against the enhancement in CO2 for 2002 at the Duke FACE
site. The dashed black line is the 1 : 1 line, whilst the solid grey line is the fit to the points, forced through the origin. Model names are
given on each panel, as are the slopes of the fitted lines.
© 2013 Blackwell Publishing Ltd, Global Change Biology, 19, 1759–1779
MODEL WATER USE AT ELEVATED CO2 1765

CO2 enhancement is <1. Also, at Duke (Fig. 1), there are
noticeable drops in the WUE response to [CO2] at high
levels of enhancement in several models (CABLE, ED2
and O-CN). These drops occur under simulated soil
moisture stress and tend to occur during the middle of
the year when the CO2 enhancement is at its highest.
We investigated the reasons for the departures from
proportionality for each model, using the simple model
as a basis for our investigation. The major reasons for
the departures from proportionality as suggested by
the simple model can be classified as follows: (i) the
model does not couple A and gs, or uses only partial
coupling; (ii) A/gs is not directly proportional to the
change in [CO2]; (iii) E is not proportional to gs; and (iv)
soil moisture stress modifies the coupling between A
and gs. Finally, we want to reiterate that these depar-
tures from the simple model do not necessarily repre-
sent model failures, but rather are a means of
classifying and understanding model behaviour.
Lack of coupling, or partial coupling, between A and gs
The DAYCENT model does not couple the assimilation
and transpiration calculations. Instead, transpiration is
calculated as a function of the potential evapotranspira-
tion, soil water stress and LAI. The effect of eCO2 on
transpiration is explicitly specified, based on average
measured responses of gs to eCO2 at the two FACE
sites. The hypothesized response of WUE to eCO2 is
thus not applicable to simulations by this model. Figs 1
and 2 therefore show no relationship between the CO2
effect on WUE and the CO2 enhancement in this model.
Fig. 2 Comparison of the ratio of WUE at eCO2 to WUE at aCO2, plotted against the enhancement in CO2 for 2002 at the ORNL FACE
site. The dashed black line is the 1 : 1 line, whilst the solid grey line is the fit to the points, forced through the origin. Model names are
given on each panel, as are the slopes of the fitted lines.
© 2013 Blackwell Publishing Ltd, Global Change Biology, 19, 1759–1779
1766 M. G. DE KAUWE et al.

The CLM4 model shows a subset of points with
WUE response below proportionality for the Duke site
(Fig. 1), and noticeable scatter with a WUE response
below proportionality for the Oak Ridge site (Fig. 2). The
CLM4 model does use a coupled stomatal model to cal-
culate transpiration, but A and gs become progressively
decoupled as the limitation to new growth from the avail-
ability of mineral N increases. Under N-limitation, A is
reduced below its potential value, but in the calcula-
tion of gs the potential A rate is used, rather than the
N-limited A rate. This decoupling of the two pro-
cesses results in a low CO2 effect on WUE, because
the CO2 effect on A is reduced under N-limitation
but the transpiration losses are unchanged. The model
predicts higher N-limitation at both sites during the
summer and under eCO2.
Proportionality of A/gs to atmospheric CO2
In the original Ball et al. (1987) model (Eqn 1), A/gs is
proportional to atmospheric CO2 concentration. Some
models replaced the Ca term in Eqn (1) with a different
CO2 dependence.
In the O-CN model, the Ca term in Eqn (1) is replaced
with a nonlinear response function ðfco2Þ to model the
effect of rising CO2 using a relationship based on Ci
rather than Ca (Friend & Kiang, 2005):
fco2 ¼Ci þ 0:004
KiCið4Þ
where Ki is a fitted parameter which equals five. The
parameters for this CO2 dependence were obtained by
fitting this model to data from a mini-ecosystem ele-
vated CO2 experiment on European Beech (Friend &
Kiang, 2005). With this CO2 dependence, gs is reduced
as [CO2] increases; however, unlike the classical Ball-
Berry model, the Ci : Ca is not constant with Ca, and
the relationship between A and gs is therefore no longer
proportional to Ca. As a result, there is a less than pro-
portional CO2 effect on WUE, the magnitude of which
is sensitive to the fitted parameter (Ki).
Simulations by the EALCO model impose a less than
proportional change in the ratio of A to gs as the [CO2]
increases, by modifying the slope parameter as a func-
tion of [CO2], ðfco2Þ:
fco2 ¼1
Cað1:0þ 0:5ðCa � aCO2Þ=aCO2Þ ð5Þ
where aCO2 is the CO2 is the baseline ambient [CO2].
This equation translates to an increase in A/gs that is
half the increase in CO2 concentration above the base-
line ambient value. Consequently, the WUE increases
at half the rate of increase in CO2 concentration.
Proportionality of transpiration with stomatalconductance
In the simple model, transpiration is assumed to be
proportional to stomatal conductance (Eqn 2). This
assumption only holds when stomata strongly control
transpiration rates, that is, when the canopy is well-
coupled to the atmosphere. In reality, the boundary
layer between the forest and atmosphere reduces the
effect of stomatal conductance on transpiration rate.
Jarvis & McNaughton (1986) showed that:
dE
E¼ ð1� XÞ dgs
gsð6Þ
where Ω is the decoupling factor and ranges from 0
for a canopy fully coupled to the atmosphere to one
for a completely decoupled canopy. The decoupling
factor increases as the ratio of boundary layer conduc-
tance to stomatal conductance decreases; the canopy
becomes decoupled when boundary layer conduc-
tance is low or when stomatal conductance is high. In
a canopy that is decoupled from its local atmosphere,
the CO2 effect on WUE is reduced, because
transpiration is not reduced in proportion to stomatal
conductance. In the case of a completely decoupled
canopy, transpiration will be unaffected by the CO2
effect on gs, and the CO2 effect on WUE will reduce
to the CO2 effect on A.
The boundary layer conductance is determined dif-
ferently amongst the models: some models calculate a
canopy boundary layer conductance, others a leaf
boundary layer conductance, and others use both con-
ductances in their calculations. For example GDAY,
O-CN and SDGVM, determine atmospheric coupling
through the ratio of gs to canopy boundary layer con-
ductance, ga, which accounts for the influence of turbu-
lence. Canopy conductance (and hence coupling)
increases with canopy roughness and wind speed.
Fig. 3a shows how changes in ga, shown here by vary-
ing canopy roughness, change the CO2 effect on WUE.
The CO2 effect on WUE is proportional to CO2 for
rough canopies with high ga. SDGVM effectively
assumes ga only varies with LAI, fixing the wind speed
to 5 m s�1. This results in the model predicting a WUE
response to eCO2 along the saturating portion of the line
shown in Fig. 3a, that is, proportionality between gs and
E. However, as the model predicts higher LAI at Oak
Ridge, the model also predicts a reduction in boundary
layer conductance and thus a reduced WUE response to
CO2. In contrast to SDGVM, GDAY accounts for the
influences of day-to-day wind speed variations, which
tend to reduce ga. GDAY thus predicts a reduced CO2
effect on WUE during stable atmospheric conditions.
© 2013 Blackwell Publishing Ltd, Global Change Biology, 19, 1759–1779
MODEL WATER USE AT ELEVATED CO2 1767

Instead of canopy conductance, ISAM and TECO
simulate leaf boundary layer conductance, gb, which
is determined by wind speed, the difference between
the canopy and air temperature, and leaf size. Fig. 3b
shows the influence of modelled leaf size on the
response of WUE to CO2 enhancement for a model
using gb. As leaf size increases, the conductance of
the boundary layer decreases, transpiration is
reduced and the proportionality of the WUE
response to CO2 is reduced. Leaf size is quite differ-
ent between the two sites: at Duke the canopy is
composed of thin needles, whereas leaf widths are
approximately 0.12 m at Oak Ridge. Therefore, we
would expect models using this approach to simulate
different effects of CO2 on WUE at the two sites,
with a lower effect at ORNL. However, in some
models, such as ISAM and TECO, the leaf width was
fixed rather than being a parameter, so this differ-
ence does not appear.
The more complex LSMs, including CABLE, CLM4,
EALCO and ED2 combine all three conductances
(stomatal, leaf and canopy boundary layer). The overall
decoupling factor thus depends on both leaf and
canopy boundary layer conductances. We observed
that models using all three conductances tended to
have a higher decoupling factor than the simpler mod-
els using just two conductances, and thus predicted a
lower CO2 effect on WUE. For example, the CO2 effect
on WUE in CABLE is low (50–57% of CO2 enhance-
ment, Figs 1 and 2) compared to that in GDAY (77–88%of CO2 enhancement) although both models simulate a
similar effect on A/gs (Fig. 4, see below).
In LPJ-GUESS (and with it the entire LPJ family of
models), the atmospheric demand for transpiration is
simulated with an empirically calibrated hyperbolic
function of canopy conductance (Huntingford & Mon-
teith, 1998) rather than the Penman-Monteith equation
used by the other models. This empirical function is
parameterized with a scaling conductance (gh–m),
which is the conductance at which transpiration
reaches half its maximum value. When canopy conduc-
tance gs exceeds gh-m, as occurs for both sites simulated
Fig. 4 Modelled effects of CO2 on the mean annual ratio of GPP
to canopy conductance (A/gs), the ratio of GPP to transpiration
(WUE), and GPP (A) for GDAY, CABLE, LPJ-GUESS and O-CN
for the year 2003.
(a) (b)
Fig. 3 Sensitivity of the WUE response to CO2 enhancement for varying (a) canopy boundary layer conductance and (b) leaf boundary
layer conductance. Sensitivities were estimate using the MAESTRA model (Medlyn et al., 2007) as a function of (a) roughness length
and (b) leaf width, carried out using the MAESTRA model. In panel (b), the grey shading indicates 1 standard deviation in the annual
WUE response to CO2.
© 2013 Blackwell Publishing Ltd, Global Change Biology, 19, 1759–1779
1768 M. G. DE KAUWE et al.

here, the canopy becomes decoupled and the transpira-
tion rate is thus relatively insensitive to CO2- driven
changes in gs.
We compare four models with different levels of cou-
pling (GDAY, CABLE, LPJ-GUESS and O-CN) in Fig. 4.
GDAY and O-CN only consider ga and both have tight
coupling. For both these models, the WUE response is
therefore similar to the A/gs response. However for O-
CN, the WUE response is lower than for GDAY; this is
because the response of A/gs to CO2 is less than propor-
tional, due to the different stomatal conductance model
(see above). In both CABLE and LPJ-GUESS, the
response of A/gs to CO2 is proportional, but coupling is
low, reducing the WUE response. In CABLE, ga and gboperate in series (see above), reducing the coupling,
such that the WUE response is about 64% of the
response of A/gs. In LPJ-GUESS, stomatal conductance
exceeds the scaling conductance, resulting in a very low
WUE response that approaches the CO2 effect on A.
The effect of the boundary layer is nonlinear
(Fig. 3b), and consequently the time step of the
model matters when estimating the CO2 effect on
WUE. We used a stand-scale model, MAESTRA
(Medlyn et al., 2007), in conjunction with GDAY to
quantify the likely impact of temporal (30 min vs.
day) resolution on the CO2 effect on WUE, when
other factors were fixed. Our sensitivity analyses
suggested that models which operate on daily time
steps are likely to predict higher WUE responses to
CO2 enhancement [mean (l) = 2.2% � 1.8%;
range = �1.6 to 7.3%]. This bias is more pronounced
during summer than winter because of the larger
diurnal variability in the decoupling factor. This
existence of this bias strongly suggests that subdaily
time step models are desirable to predict impacts of
elevated CO2 on WUE.
Finally, in some models such as CABLE, ED2, and
OC-N, which consider gb, differences in leaf-to-canopy
temperatures drive differences in VPD, that is, breaking
from the assumption in the simple model that VPD
does not change with CO2 treatment. We tested the
effect of these temperature driven differences by again
running the MAESTRA model and found that at
Duke leaf temperatures did not depart from the air
temperature so did not affect the WUE response. At
Oak Ridge, larger sized leaves resulted in some
differences in the VPD due to higher leaf temperatures
and led to a small increase in the WUE response to CO2
(approximately 4%).
Role of interception
A disconnect between transpiration and stomatal
conductance can also occur when the canopy is wet.
Some of the models assume that intercepted water is
lost from the system prior to any water balance and
physiology calculations. However, several models,
including CABLE, CLM4, EALCO, LPJ-GUESS, ISAM
and O-CN, assume that if the canopy, or a fraction of it,
is wet and there is an atmospheric deficit, canopy evap-
oration meets the atmospheric water demand for the
wet fraction. As a consequence, during these periods,
E is not related to gs, but rather depends only on LAI
and on the antecedent rainfall conditions, which deter-
mine the amount of interception. The corresponding
transpiration is reduced, resulting in a high apparent
water use efficiency during the period when the canopy
is wet. Changes in LAI with CO2 treatment influence
the amount of intercepted water and therefore affect
the CO2 response of WUE, resulting in a nonpropor-
tional response. For example, LPJ-GUESS simulates
increases in LAI at eCO2 of between 3% and 30% at
Duke and up to 10% at Oak Ridge. This effect is stron-
ger at Duke, as the model assumes a higher interception
in evergreen canopies (Gerten et al., 2004), approxi-
mately 8% of incoming rainfall. Models differed
strongly in how they simulated interception, indicating
a high level of process uncertainty (Table 1). Rates of
interception varied from 2% to 19% of total rainfall and
models disagreed whether, and how, interception
impacts on leaf gas exchange.
Effect of soil moisture stress on theWUE response to eCO2
Day-to-day variability in the CO2 effect on WUE may
be additionally controlled by soil moisture stress,
depending on how the soil moisture stress is assumed
to affect gas exchange. In some models (CLM4, EALCO
and ED2), soil moisture stress is assumed to directly
affect photosynthetic rates. Stomatal conductance is
consequently indirectly reduced by drought, but the
ratio of A/gs is unaffected. In these models, soil mois-
ture stress does not affect the CO2 response of WUE. In
other models (e.g. CABLE, GDAY, ISAM, O-CN and
TECO), soil moisture stress is assumed to reduce the
slope of the relationship between stomatal conductance
and assimilation. In these models, the CO2 response of
WUE typically decreases during soil moisture stress.
This effect is demonstrated for the GDAY model in
Fig. 5, which shows the impact of CO2 enrichment on
modelled soil moisture availability and the correspond-
ing g1 parameter (sensitivity of stomatal conductance to
assimilation), which is reduced during water stressed
periods. Under eCO2, transpiration is reduced, result-
ing in slower soil moisture depletion than at aCO2. Soil
moisture stress results in an increase in WUE; accord-
ingly, the WUE at aCO2 is increased relative to the less
stressed eCO2 simulation (assuming the effects of D to
© 2013 Blackwell Publishing Ltd, Global Change Biology, 19, 1759–1779
MODEL WATER USE AT ELEVATED CO2 1769
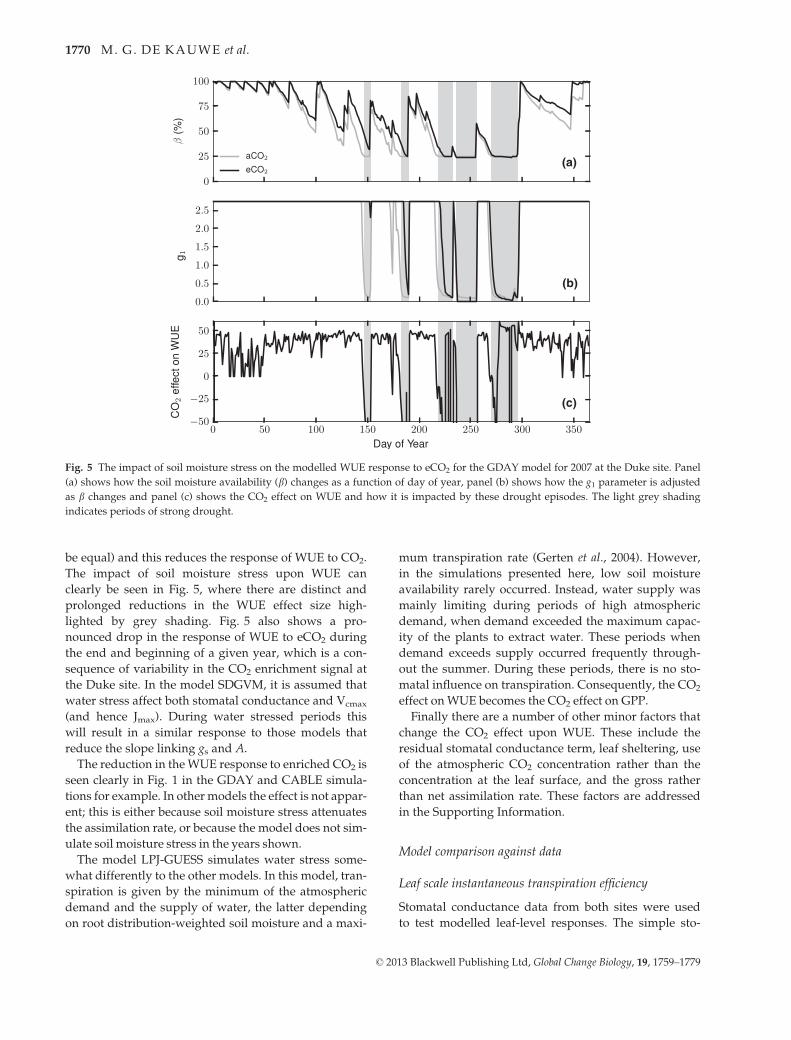
be equal) and this reduces the response of WUE to CO2.
The impact of soil moisture stress upon WUE can
clearly be seen in Fig. 5, where there are distinct and
prolonged reductions in the WUE effect size high-
lighted by grey shading. Fig. 5 also shows a pro-
nounced drop in the response of WUE to eCO2 during
the end and beginning of a given year, which is a con-
sequence of variability in the CO2 enrichment signal at
the Duke site. In the model SDGVM, it is assumed that
water stress affect both stomatal conductance and Vcmax
(and hence Jmax). During water stressed periods this
will result in a similar response to those models that
reduce the slope linking gs and A.
The reduction in theWUE response to enriched CO2 is
seen clearly in Fig. 1 in the GDAY and CABLE simula-
tions for example. In othermodels the effect is not appar-
ent; this is either because soil moisture stress attenuates
the assimilation rate, or because the model does not sim-
ulate soil moisture stress in the years shown.
The model LPJ-GUESS simulates water stress some-
what differently to the other models. In this model, tran-
spiration is given by the minimum of the atmospheric
demand and the supply of water, the latter depending
on root distribution-weighted soil moisture and a maxi-
mum transpiration rate (Gerten et al., 2004). However,
in the simulations presented here, low soil moisture
availability rarely occurred. Instead, water supply was
mainly limiting during periods of high atmospheric
demand, when demand exceeded the maximum capac-
ity of the plants to extract water. These periods when
demand exceeds supply occurred frequently through-
out the summer. During these periods, there is no sto-
matal influence on transpiration. Consequently, the CO2
effect onWUE becomes the CO2 effect on GPP.
Finally there are a number of other minor factors that
change the CO2 effect upon WUE. These include the
residual stomatal conductance term, leaf sheltering, use
of the atmospheric CO2 concentration rather than the
concentration at the leaf surface, and the gross rather
than net assimilation rate. These factors are addressed
in the Supporting Information.
Model comparison against data
Leaf scale instantaneous transpiration efficiency
Stomatal conductance data from both sites were used
to test modelled leaf-level responses. The simple sto-
(a)
(b)
(c)
Fig. 5 The impact of soil moisture stress on the modelled WUE response to eCO2 for the GDAY model for 2007 at the Duke site. Panel
(a) shows how the soil moisture availability (b) changes as a function of day of year, panel (b) shows how the g1 parameter is adjusted
as b changes and panel (c) shows the CO2 effect on WUE and how it is impacted by these drought episodes. The light grey shading
indicates periods of strong drought.
© 2013 Blackwell Publishing Ltd, Global Change Biology, 19, 1759–1779
1770 M. G. DE KAUWE et al.

matal conductance model (Eq. 1) fitted the data well
(Fig. 6), supporting the assumption of coupling
between assimilation and stomatal conductance.
Importantly, at the ORNL site, N content of the foli-
age declined strongly over the course of the experi-
ment (Norby et al., 2010), but neither the slope of the
stomatal model, nor the response of A/gs to CO2, was
altered by this decline (Fig. 6b). These data indicate
that the coupling between stomatal conductance and
assimilation is not affected by N-limitation (Fig. 6b).
The data therefore tend to support coupled models
over uncoupled, or partially coupled, models such as
DAYCENT and CLM4.
The data also tend to support a dependence on Ca as
originally proposed by Ball et al. (1987), that is, a pro-
portionality between A/gs and Ca. We tested the depen-
dence on Ca by fitting the expression (cf Eqn 1.) to each
data set, and obtaining confidence intervals for the Ca
dependence (b).
gs ¼ 1:6 1þ g1ffiffiffiffiD
p� �
AC�ba ð7Þ
Estimates for b were 0.969 (ORNL, 1999), 0.999
(ORNL, 2009) and 1.138 (Duke, 1998–2006). Confidenceintervals from each data set were combined using
meta-analysis, to obtain an overall confidence interval
for b of (0.9, 1.07), strongly supporting an inverse pro-
portional dependence on Ca. Alternatives to this CO2
dependence, such as those used in O-CN (Eqn 4) and
EALCO (Eqn 5), were tested against the data using
dummy variable regression and were found not to be
supported by the data.
Annual stand WUE
At the stand-scale, the observed mean annual WUE
response to CO2 was lower at Duke:
l = 29.7% � 13.8% (1r = interannual variability; years
= 10) than Oak Ridge: l = 37.6% � 7.1% (years = 4),
though between sites, responses are consistent when
accounting for interannual variability (Figs 7 and 8).
However, the enhancement in WUE was notably lower
than (i.e. not directly proportional to) the mean [CO2]
increase, which was l = 45.4% � 13.8% and
l = 40.3% � 11.5%, at Duke and Oak Ridge respec-
tively. The mean increase in WUE was thus approxi-
mately 65% (Duke) or approximately 93% (ORNL) of
the mean increase in [CO2].
The simulated annual mean WUE response to eCO2
is compared with observed values in Figs 7 and 8. At
Duke, the model responses can clearly be seen to fall
into three broad categories: higher than the observed
interquartile range (GDAY, ISAM, SDGVM and TECO);
within the observed interquartile range (CABLE,
CLM4, ED2 and O-CN); and lower than the observed
interquartile range (DAYCENT, EALCO, LPJ-GUESS).
However, there is considerable year-to-year variability
in the observed interquartile WUE response and the
mean of all of the models (l = 27.8% � 9.7%) falls
within the interannual variability bounds of the
observed response. In contrast, at Oak Ridge, the mod-
elled WUE response (l = 24.1% � 6.4%) is broadly
below the observed. At Oak Ridge, ISAM, O-CN,
SDGVM and TECO predict the highest modelled
responses to CO2 treatment, similar to that found for
(a) (b)
Fig. 6 Measured leaf level stomatal conductance as a function of stomatal index A=ðCa
ffiffiffiffiD
p Þ at the (a) Duke (b) Oak Ridge sites. Fitted
linear regression lines are shown. The stomatal model (Eqn 1) was fitted to both data sets. There was no significant difference in slope
between ambient and elevated CO2 treatments at either site. Duke: g1 = 2.56 (Amb) and 2.64 (Elev). Test of different slopes: P = 0.58,
overall model r2 = 0.51. Oak Ridge: g1 = 4.20 (Amb) and 4.11 (Elev). Test of different slopes: P = 0.71, overall model r2 = 0.83.
© 2013 Blackwell Publishing Ltd, Global Change Biology, 19, 1759–1779
MODEL WATER USE AT ELEVATED CO2 1771

Duke. Overall, most modelled simulations, with the
exception of DAYCENT, EALCO and LPJ-GUESS, pre-
dict a lower WUE response to CO2 than at Duke; LPJ-
GUESS and CLM4 predict the smallest responses.
The overall model responses can be understood from
our analysis, whereby various assumptions combine to
alter the CO2 effect on WUE from strict proportionality.
As described above, the assumed leaf-level responses
to CO2 were not consistent with experimental data in
the DAYCENT, CLM4 and EALCO models, explaining
why these models generally predicted lower than
observed mean CO2 responses of WUE. Leaf-level
responses in O-CN were not consistent with data either,
but this model nonetheless captured the mean CO2
response of WUE.
The assumptions regarding soil moisture stress and
interception vary strongly amongst the other models,
indicating significant process uncertainty. However,
these assumptions have a smaller influence at an
annual time scale than the boundary layer, because
drought and rainfall events are typically shorter lived
incidents. The most important difference amongst mod-
els lies in the degree of atmospheric coupling. In gen-
eral, the ‘simplest’ models tended to predict the highest
WUE responses (overprediction at Duke), whilst the
more ‘complex’ models tended to predict WUE response
to CO2 similar to the observations at the well-coupled
site (Duke), but approximately 7% � 5% lower than
observed at the more decoupled site (Oak Ridge). Thus,
the comparison against data indicates three sets of
LPJ-GUESSDAYCEALCOCLM4CABLEED2O-CNTECOISAMSGDVMGDAYOBS
(a) WUE
LPJ-GUESSDAYCEALCOCLM4CABLEED2O-CNTECOISAMSGDVMGDAYOBS
(b) GPP
–30 –10 0 10 30 50
Effect Size(%)LPJ-GUESSDAYCEALCOCLM4CABLEED2O-CNTECOISAMSGDVMGDAYOBS
(c) E
Fig. 7 Box and Whisker plots showing the mean annual response of (a) WUE, (b) GPP and (c) transpiration (E) to CO2 enhancement at
Duke, between 1996 and 2007, for observations and 11 models. Models (boxes) are shown in order of WUE response to CO2. Note: NPP
is used in place of GPP in the observations. The ends of the boxes show the lower (25th) and upper (75th) quartiles. The horizontal
whiskers show the full range of the data. The lines in the boxes are the medians and stars are the means.
© 2013 Blackwell Publishing Ltd, Global Change Biology, 19, 1759–1779
1772 M. G. DE KAUWE et al.

assumptions (interception, soil moisture stress, and
atmospheric coupling) give rise to considerable variabil-
ity amongst models and therefore require further inves-
tigation.
Annual stand transpiration
The modelled WUE responses, when considered with
the modelled GPP responses, help to explain why the
models differ in the predictions of the CO2 effect on E.
Model predictions of the CO2 effect on E were poor for
both sites, but for different reasons. At Duke, modelled
WUE responses are broadly consistent with the
observed, but the modelled E responses to CO2 are not,
and the intermodel variability is considerable,
l = �6.1% � 7.7% (min = �25.9%, max = 9.4%)
(Fig. 7c). Following our simple model, the GPP
response to CO2 must on the whole be poorly simu-
lated (Fig. 7b). At Duke the variable GPP responses
relate to the availability of canopy N, discussed in more
detail by Zaehle et al., 2010; (S. Zaehle, B.E. Medlyn,
A.P. Walker, et al., in prep). At Oak Ridge, on the other
hand, the models generally predicted the GPP response
well, but poorly predicted the WUE response to eCO2.
Consequently, as at Duke, model predictions for the
CO2 response of E were also poor and again varied
between models (intermodel l = �6.4% � 7.8%,
min = �31.2%, max = 10.6%).
CLM4LPJ-GUESSED2CABLEEALCOO-CNSGDVMGDAYTECOISAMDAYCOBS
(a) WUE
CLM4LPJ-GUESSED2CABLEEALCOO-CNSGDVMGDAYTECOISAMDAYCOBS
(b) GPP
–30 –10 0 10 30 50
Effect Size(%)
CLM4LPJ-GUESSED2CABLEEALCOO-CNSGDVMGDAYTECOISAMDAYCOBS
(c) E
Fig. 8 Box and Whisker plots showing the mean annual response of (a) WUE, (b) GPP and (c) transpiration (E) to CO2 enhancement at
Oak Ridge, for the years 1999, 2004, 2007 and 2008, for observations and 11 models. Models (boxes) are shown in order of WUE
response to CO2. Note: NPP is used in place of GPP in the observations. The ends of the boxes show the lower (25th) and upper (75th)
quartiles. The horizontal whiskers show the full range of the data. The lines in the boxes are the medians and stars are the means.
© 2013 Blackwell Publishing Ltd, Global Change Biology, 19, 1759–1779
MODEL WATER USE AT ELEVATED CO2 1773

Discussion
We evaluated 11 models against leaf-scale and stand-
scale water use efficiency data from two long-term for-
est FACE experiments. Simply comparing models
against data would not be insightful, since the out-
comes would apply to these versions of these models
only. Instead, as advocated by Medlyn et al. (2011b), we
first analysed the models to identify the key mecha-
nisms driving model behaviour. This allowed us to
compile a checklist of model assumptions that could be
used to analyse predictions by any model of the effect
of rising CO2 on stand transpiration. Comparison of the
models against the experimental data then allowed us
to discriminate amongst these model assumptions and
to clearly identify areas of uncertainty that need to be
resolved.
Following experimental evidence (Cowan & Farqu-
har, 1977; Wong et al., 1979), most models assume that
transpiration is coupled to carbon assimilation (Ball
et al., 1987; Collatz et al., 1992; Leuning, 1995; Katul
et al., 2010; Medlyn et al., 2011a). We therefore analy-
sed model outcomes in terms of water use efficiency,
or the ratio of assimilation to transpiration. The sim-
plest coupled model predicts that WUE should scale
in direct proportion to changes in Ca in well-watered
conditions (Eqn 3). In this study, models predicted Ca
effects on WUE that differed amongst models, but
were generally less than direct proportionality (Figs 1
and 2). We identified a number of principal causes
that currently lead to differences amongst models, in
particular: (i) assumptions about the stomatal
response to elevated CO2; (ii) the roles of the leaf and
atmospheric boundary layer (Figs 3 and 4); (iii) treat-
ment of canopy interception; and (iv) the impact of
soil moisture stress (Fig. 5). In each of these areas,
there are real discrepancies amongst models in the
way the process is represented, but we believe that
data are available to resolve these discrepancies in
each case.
The stomatal response to elevated CO2
The empirical stomatal model of Ball et al. (1987) and
related theoretical models (Leuning, 1995; Medlyn
et al., 2011a) proposed that for well-watered condi-
tions, at a given relative humidity or D, stomatal
conductance should be proportional to assimilation
divided by Ca. This response is equivalent to stating
that the Ci : Ca ratio is independent of Ca (see also
Katul et al., 2000). This stomatal response to elevated
Ca was recently shown to be consistent with optimal
stomatal theory (Medlyn et al., 2011a, but see also
Katul et al., 2010). Data from the two forest FACE
sites support this elevated Ca response of stomata
(Fig. 6). The response is generally supported wher-
ever empirical data has been fitted to this stomatal
model (Medlyn et al., 2001; Leavitt et al., 2003; Leakey
et al., 2009; Ainsworth & Rogers, 2007; Barton et al.,
2012). The hypothesis that the Ci : Ca ratio is inde-
pendent of Ca also has widespread experimental sup-
port (Drake et al., 1997; Ainsworth & Long, 2005).
Models sometimes employ alternative Ca dependenc-
es parameterized from individual experiments (e.g.
Eqns 4, 5), but the bulk of experimental data and our
analyses of the Duke and Oak Ridge data would
appear to be consistent with the original response
hypothesized by Ball et al. (1987).
Leaf and canopy boundary layer conductance
We have shown that the magnitude of WUE response
to Ca predicted at the stand-scale depends on the
assumed coupling between the foliage and the atmo-
sphere. For strongly coupled, well-watered trees, the
relationship between WUE and Ca should be indepen-
dent of scale. This prediction is supported by experi-
mental data (Barton et al., 2012); in a well-coupled
Eucalyptus saligna canopy, instantaneous transpiration
efficiency increased in proportion to Ca at both leaf and
whole-canopy scale. However, as canopy decoupling
increases, the CO2 response of whole-canopy WUE is
predicted to decline from proportionality.
From our model comparison, it is apparent that mod-
els that adopt simpler boundary layer treatments tend
to have the highest canopy-atmosphere coupling and
therefore predict the highest WUE responses. In con-
trast, models with more complex representations of
canopy-atmosphere coupling often add leaf and canopy
boundary layer conductances in series, resulting in a
low overall boundary layer conductance, high decou-
pling and therefore a low WUE response. To under-
stand a given model’s prediction of CO2 effects on
transpiration, therefore, it is important to understand
the level of decoupling assumed by the model. For this
purpose, modelling studies should be very explicit
about what boundary layer conductances that have
been assumed, and what values have been used for the
key parameters, namely roughness length, leaf width
and wind speed, decoupling factors (sensu Jarvis &
McNaughton, 1986) could also be derived from model
output and reported explicitly. Importantly, there is
clearly scope to reduce the large model-to-model differ-
ences relating to assumed coupling (Fig. 4) by using
eddy covariance data to determine appropriate decou-
pling factors for use in models. We suggest that such
data analyses are a priority for reducing model uncer-
tainty.
© 2013 Blackwell Publishing Ltd, Global Change Biology, 19, 1759–1779
1774 M. G. DE KAUWE et al.

Interception
Another key difference amongst models was in how
interception was treated. Changes in leaf area are often
speculated to impact upon any potential water savings
under eCO2 (Field et al., 1995; Woodward, 1990). We
have deliberately not discussed simulated changes in
LAI in response to CO2 here because the coupled
A-gs relationships assumed by the various models
implicitly consider these changes. Any increase in LAI
due to additional photosynthate at eCO2, will be
accounted for by an increase in GPP (due to increased
light interception) and water loss, due to increased sto-
matal conductance. The WUE response (Eqn 3) to CO2
accounts for these leaf area changes.
However, effects on LAI play an important role in
determining effects when canopies are wet. If LAI
increases under eCO2, as simulated by most models,
canopy interception will increase. Several models use
intercepted water to meet a proportion of atmospheric
demand. In these models, the increase in interception
will result in a smaller CO2 effect on WUE. Models dif-
fered in how they treated interception, and in the esti-
mated proportion of intercepted canopy water
(approximately 2–14%). Interception rates estimated
from measurements as the difference between precipi-
tation and through fall are considerably higher than
these modelled values. Values given by Sch€afer et al.
(2003) for the Duke site are approximately 27% of pre-
cipitation. Data were not available for the ORNL site
but interception rates for other hardwood forests in the
vicinity are of the order of 16% (Oishi et al., 2008). This
model process uncertainty is another key area where
discrepancies amongst models could be significantly
reduced through data synthesis.
Soil moisture stress
There was a great deal of variability between the mod-
els as to when drought stress begins, duration of
droughts and its impact on WUE (Egea et al., 2011).
These differences arise through different approaches to
parameterization. However, more fundamentally, we
also identified considerable process uncertainty: mod-
els disagreed on the mechanisms by which moisture
stress affects photosynthesis and transpiration fluxes.
Some models assumed moisture stress affects photo-
synthetic capacity, others assumed it reduces the slope
of A-gs relationship. Recent research suggests that nei-
ther of these processes alone is sufficient to capture the
full drought effect (Keenan et al., 2010; Egea et al.,
2011). There remains a need to find more mechanistic
models to explain coupled carbon and water responses,
particularly at ecosystem scales (e.g. Katul et al., 2010;
Medlyn et al., 2011a; Buckley et al., 2012), which would
allow us to make predictions under drought conditions
that did not rely on simple empirical modifiers. Given
the data available on plant responses to moisture stress,
this is another important avenue of research that would
allow us to close the gap between the models, and the
model and observations.
Comparison with FACE data
Stand-level WUE, evaluated as NPP/E, often does not
increase in proportion to Ca. For example, over the 20th
century there has been a continuous rise in the [CO2]
(approximately 23%), whereas the change in plant
WUE inferred from stable carbon isotope measure-
ments has been considerably more variable (Saurer
et al., 2004; Waterhouse et al., 2004; Gagen et al., 2011;
Pe~nuelas et al., 2011). This suggests additional site-spe-
cific constraints when extrapolating our experimental
understanding to the landscape scale (Pe~nuelas et al.,
2008; Linares et al., 2009; Andreu-Hayles et al., 2011).
At our two experimental FACE sites, the observed
WUE increase was 66% (Duke) or 93% (ORNL) of the
treatment enhancement of Ca. There is a possibility that
this discrepancy is due to the necessity of calculating
stand-level WUE from the observations of NPP, rather
than gross primary productivity, divided by transpira-
tion. If the NPP : GPP ratio decreases under eCO2, the
Ca effect on observed WUE will be reduced. However,
we have not addressed the NPP : GPP ratio in this arti-
cle (see M.G. De Kauwe, B.E. Medlyn, S. Zaehle, et al.,
in prep.).
Leaving aside the possibility of changes in the
NPP : GPP ratio, our model comparison suggests that
boundary layer and soil moisture feedbacks are the
main factors attenuating the WUE response to CO2.
Decoupling between the foliage and atmosphere due to
the existence of a boundary layer can reduce the effect
of CO2 on WUE. Whilst decoupling might be an expla-
nation for the lower than proportional CO2 response of
WUE at Oak Ridge, this is less likely to be the explana-
tion for Duke, where the thin needle canopy should be
well coupled to the atmosphere. More specific to the
Duke site, effects of needle age and interannual vari-
ability in meteorological forcing (precipitation, storm
damage and droughts), may have affected the magni-
tude of the WUE response to eCO2 (see Ellsworth et al.,
2012). Domec et al. (2009) showed that gs was reduced
under eCO2, but only during well-watered conditions.
At Duke the rooting depth (0.75 m), imposed by a hard
clay pan in the soil, is shallow for a forest (Oren et al.,
1998). Consequently, water stress is common and may
have been a key factor in reducing the CO2 effect on
WUE.
© 2013 Blackwell Publishing Ltd, Global Change Biology, 19, 1759–1779
MODEL WATER USE AT ELEVATED CO2 1775

Experimental data on NPP and transpiration include
many sources of uncertainty. Both terms comprise mul-
tiple primary measurements (e.g. litter mass, stem
circumference, tree height, fine root length in mini-rhi-
zotron tubes and sap flux) with different degrees of
precision, and critical scaling assumptions that may
introduce biases. Heterogeneity across the tree planta-
tion also contributes to substantial plot-to-plot varia-
tion, with coefficients of variation for NPP at ORNL of
20–24%.
It can also be questioned whether the turbulence
regime in the FACE rings is different from natural con-
ditions. Wullschleger et al. (2002) argued that the can-
opy decoupling in FACE rings might be lower than in
natural canopies. However, a detailed study using
arrays of 3D sonic anemometers found no effect on tur-
bulence regime (He et al., 1996 cited with additional
information in Hendrey et al., 1999). Therefore, at Duke,
the 26 m diameter region inside the 30 m total plot is
considered uninfluenced by gas ports in terms of CO2
concentration or turbulence.
Implications for other model studies
A number of models have previously been applied to
predict eCO2 effects on transpiration fluxes. For exam-
ple, Cramer et al. (2001) showed that the physiological
CO2 effect on runoff estimated by five DGVMs for the
period 1990–2100 resulted in a change of anywhere
from �3% to + 47%. Our study has developed a ‘check-
list’ approach (cf. Medlyn et al., 2011b) that can be used
to assess and compare such model studies. The key
questions to ask of any model study are as follows.
First, is stomatal conductance coupled to assimilation
rate? If so, assessments should focus on CO2 effects on
GPP and WUE, since these processes determine CO2
effects on E. Second, is the ratio A/gs proportional to
Ca? Increasing experimental evidence supports this
assumption. Third, how well coupled is the canopy to
the atmosphere? Predicted effects on transpiration will
be highest in model simulations that assume strong
coupling. Fourth, how is drought stress assumed to
affect fluxes? Finally, what percentage of rainfall is
intercepted, and does interception reduce transpiration
fluxes? This checklist provides a relatively straightfor-
wardmeans to assessmodel simulations of transpiration
responses to elevated CO2. In addition, it highlights key
areas where data synthesis could significantly reduce
discrepancies amongst models.
Acknowledgements
This study was conducted as a part of the ‘Benchmarking eco-system response models with experimental data from long-term
CO2 enrichment experiments’ Working Group supported by theNational Center for Ecological Analysis and Synthesis, a Centerfunded by NSF (Grant #EF-0553768), the University of Califor-nia, Santa Barbara and the State of California. The Oak Ridgeand Duke FACE sites and additional synthesis activities weresupported by the US Department of Energy Office of Science,Biological and Environmental Research Program. Duke FACEresearch was supported by the Office of Science (BER) of USDepartment of Energy through Terrestrial Carbon Processes(TCP) program (FACE, DE-FG02-95ER62083). Martin De Kauwewas supported by ARC Discovery Grant DP1094791. Sonke Za-ehle was supported by the Marie Curie Reintegration GrantJULIA (PERG02-GA-2007-224775). Anthony Walker was sup-ported by a PhD studentship funded by the UK National Centrefor Earth Observation (NCEO). Thomas Hickler was fundedthrough the LOEWE initiative for scientific and economic excel-lence of the German federal state of Hesse. David Warlind andBenjamin Smith contribute to the strategic research areas BECC,MERGE and LUCCI.
References
Ainsworth EA, Long SP (2005) What have we learned from 15 years of free-air CO2
enrichment (FACE)? A meta-analytic review of the responses of photosynthesis,
canopy properties and plant production to rising CO2. New Phytologist, 165, 351–
372.
Ainsworth EA, Rogers A (2007) The response of photosynthesis and stomatal conduc-
tance to rising [CO2]: mechanisms and environmental interactions. Plant, Cell and
Environment, 30, 258–270.
Andreu-Hayles L, Planells O, Guti�errez E, Muntan E, Helle G, Anchukaitis KJ,
chleser GH (2011) Long tree-ring chronologies reveal 20th century increases in
water-use efficiency but no enhancement of tree growth at five Iberian pine forests.
Global Change Biology, 17, 2095–2112.
Ball JT, Woodrow IE, Berry JA (1987) A model predicting stomatal conductance and
its contribution to the control of photosynthesis under different environmental
conditions. In: Progress in Photosynthesis Research (ed. Biggins I), pp. 221–224. Marti-
nus Nijhoff Publishers, the Netherlands.
Barton CVM, Duursma RA, Medlyn BE et al. (2012) Effects of elevated atmospheric
[CO2] on instantaneous transpiration efficiency at leaf and canopy scales in Euca-
lyptus saligna. Global Change Biology, 18, 585–595.
Betts RA, Boucher O, Collins M et al. (2007) Projected increase in continental runoff
due to plant responses to increasing carbon dioxide. Nature, 448, 1037–1041.
Bonan GB (2008) Forests and climate change: forcings, feedbacks, and the climate
benefits of forests. Science, 320, 1444–1449.
Bounoua L, Hall FG, Sellers PJ, Kumar A, Collatz GJ, Tucker CJ, Imhoff ML (2010)
Quantifying the negative feedback of vegetation to greenhouse warming: a model-
ing approach. Geophysical Research Letters, 37, L23701.
Buckley TN, Turnbull TL, Adams MA (2012) Simple models for stomatal conductance
derived from a process model: cross-validation against sap flux data. Plant, Cell
and Environment, 35, 1647–1662.
Cao L, Bala G, Caldeira K, Nemani R, Ban-Weiss G (2010) Importance of carbon diox-
ide physiological forcing to future climate change. PNAS, 107, 9513–9518.
Collatz GM, Ribas-Carbo M, Berry JA (1992) Coupled photosynthesis–stomatal con-
ductance model for leaves of C4 plants. Australian Journal of Plant Physiology, 19,
519–538.
Comins HN, McMurtrie RE (1993) Long-term biotic response of nutrient-limited
forest ecosystems to CO2-enrichment: Equilibrium behavior of integrated plant-
soil models. Ecological Applications, 3, 666–681.
Cowan IR, Farquhar GD (1977) Stomatal function in relation to leaf metabolism and
environment. In: Integration of Activity in the Higher Plant. Symposia of Society of
Experimental Biology, 31, Vol 31, (ed. Jennings DH), pp. 471–505. Cambridge Uni-
versity Press, Cambridge.
Cramer W, Bondeau A, Woodward I et al. (2001) Global response of terrestrial ecosys-
tem structure and function to CO2 and climate change: results from six dynamic
global vegetation models. Global Change Biology, 7, 357–373.
Crous KY, Walters MB, Ellsworth DS (2008) Elevated CO2 concentration affects leaf
photosynthesis-nitrogen relationships in Pinus taeda over nine years in FACE. Tree
Physiology, 28, 607–614.
© 2013 Blackwell Publishing Ltd, Global Change Biology, 19, 1759–1779
1776 M. G. DE KAUWE et al.

Curtis PS, Wang X (1998) A meta-analysis of elevated CO2 effects on woody plant
mass, form, and physiology. Oecologia, 113, 299–313.
Denman KL, Brasseur G, Chidthaisong A et al. (2007) Couplings Between Changes in
the Climate System and Biogeochemistry. In: Climate Change 2007: The Physical Science
Basis. Contribution of Working Group I to the Fourth Assessment Report of the Inter-
governmental Panel on Climate Change (eds Solomon SD, Qin M, Manning Z), pp.
499–587. Cambridge University Press, Cambridge, UK and New York, NY, USA.
Domec J-C, Palmroth S, Ward E, Maier CA, Th�er�ezien M, Oren R (2009) Acclimation
of leaf hydraulic conductance and stomatal conductance of Pinus taeda (loblolly
pine) to long-term growth in elevated CO2 (free-air CO2 enrichment) and N-fertil-
ization. Plant Cell and Environment, 32, 1500–1512.
Drake BG, Gonz�alez-Meler MA, Long SP (1997) More efficient plants: a consequence
of rising atmospheric CO? Annual review of plant biology, 48, 609–639.
Drake JE, Davis SC, Raetz LM, DeLucia EH (2010) Mechanisms of age-related
changes in forest production: the influence of physiological and successional
changes. Global Change Biology, 17, 1522–1535.
Egea G, Verhoef A, Vidale PL (2011) Towards an improved and more flexible repre-
sentation of water stress in coupled photosynthesis–stomatal conductance models.
Agricultural and Forest Meteorology, 151, 1370–1384.
Ellsworth DS, Thomas R, Crous KY et al. (2012) Elevated CO2 affects photosynthetic
responses in canopy pine and subcanopy deciduous trees over 10 years: A synthe-
sis from Duke FACE. Global Change Biology, 18, 223–242.
Eltahir EAB, Bras RL (1996) Precipitation recycling. Reviews of Geophysics, 34, 367–378.
Farquhar GD, von Caemmerer S, Berry JA (1980) A biochemical model of photosyn-
thetic CO2 assimilation in leaves of C3 species. Planta, 149, 78–90.
Field CB, Jackson RB, Mooney HA (1995) Stomatal responses to increased CO2: impli-
cations from the plant to the global scale. Plant, Cell and Environment, 18, 1214–
1225.
Finzi AC, DeLucia EH, Hamilton JG, Richter DD, Schlesinger WH (2002) The nitrogen
budget of a pine forest under free air CO2 enrichment. Oecologia, 132, 567–578.
Friend AD, Kiang NY (2005) Land surface model development for the GISS GCM:
effects of improved canopy physiology on simulated climate. Journal of Climate, 18,
2883–2902.
Gagen M, Finsinger W, Wagner-Cremer F et al. (2011) Evidence of changing intrinsic
water-use efficiency under rising atmospheric CO2 concentrations in Boreal Fenno-
scandia from subfossil leaves and tree ring d13C ratios. Global Change Biology, 17,
1064–1072.
Gedney N, Cox PM, Betts RA, Boucher O, Huntingford C, Stott PA (2006) Detection of a
direct carbon dioxide effect in continental river runoff records. Nature, 439, 835–838.
Gerten D, Schaphoff S, Haberlandt U, Lucht W, Sitch S (2004) Terrestrial vegetation
and water balance-hydrological evaluation of a dynamic global vegetation model.
Journal of Hydrology, 286, 249–270.
Gerten D, Rost S, von Bloh W, Lucht W (2008) Causes of change in 20th century
global river discharge. Geophysical Research Letters, 35, L20405.
Gielen B, Calfapietra C, Sabatti M, Ceulemans R (2001) Leaf area dynamics in a closed
poplar plantation under free-air carbon dioxide enrichment. Tree Physiology, 21,
1245–1255.
Gunderson GA, Sholtis JD, Wullschleger SD, Tissue DT, Hanson PJ, Norby RJ (2002)
Environmental and stomatal control of photosynthetic enhancement in the canopy
of a sweetgum (Liquidambar styraciflua L.) plantation during 3 years of CO2 enrich-
ment. Plant Cell and Environment, 25, 379–393.
Harley PC, Loreto F, Marco GD, Sharkey TD (1992) Theoretical considerations when
estimating the mesophyll conductance to CO2 flux by analysis of the response of
photosynthesis to CO2. Plant Physiology, 98, 1429–1436.
He Y, Yang X, Miller D, Hendrey G, Lewin K, Nagy J (1996) Effects of FACE system
operation on the micrometeorology of a loblolly pine stand. Transactions of the
American Society of Agricultural Engineers, 39, 1551–1556.
Henderson-Sellers A, McGuffie K, Gross C (1995) Sensitivity of global climate model
simulation to increased stomatal resistance and CO2 increases. Jounal of Climate, 8,
1738–1756.
Hendrey G, Ellsworth D, Lewin K, Nagy J (1999) A free-air enrichment system for
exposing tall forest vegetation to elevated atmospheric CO2. Global Change Biology,
5, 293–309.
Huntingford C, Monteith JL (1998) The behaviour of a mixed-layer model of the con-
vective boundary layer coupled to a big leaf model of surface energy partitioning.
Boundary-Layer Meterology, 88, 87–101.
Idso SB, Brazel AJ (1984) Rising atmospheric carbon dioxide concentrations may
increase streamflow. Nature, 312, 51–53.
Jain AK, Yang X (2005) Modeling the effects of two different land cover change data
sets on the carbon stocks of plants and soils in concert with CO2 and climate.
Global Biogeochemical Cycles, 19, 1–20.
Jarvis PG, McNaughton KG (1986) Stomatal control of transpiration: scaling up from
leaf to region. Advances in Ecological Research, 15, 1–49.
Katul GG, Ellsworth D, Lai CT (2000) Modeling assimilation and intercellular CO2
from measured conductance: a synthesis of approaches. Plant, Cell, and Environ-
ment, 23, 1313–1328.
Katul G, Manzoni S, Palmroth S, Oren R (2010) A stomatal optimization theory to
describe the effects of atmospheric CO2 on leaf photosynthesis and transpiration.
Annals of Botany, 105, 431–442.
Keenan T, Sabate S, Garcia C (2010) Soil water stress and coupled photosynthesis-
conductance models: bridging the gap between conflicting reports on the relative
roles of stomatal, mesophyll conductance and biochemical limitations to photosyn-
thesis. Agricultural and Forest Meteorology, 150, 443–453.
Kimball BA, Mauney JR, Nakayama FS, Idso SB (1993) Effects of increasing atmo-
spheric CO2 on vegetation. Vegetatio, 104, 65–75.
Korner C, Morgan JA, Norby R (2007) CO2 fertilisation: when, where, how much? In:
Terrestrial Ecosystems in a Changing World (eds Canadell SG, Pataki DE, Pitelka EF),
Springer, Berlin Heidelberg.
Kowalczyk EA, Wang YP, Law RM, Davies HL, McGregor JL, Abramowitz G (2006)
The CSIRO Atmosphere Biosphere Land Exchange (CABLE) model for use in cli-
mate models and as an offline model, CSIRO Marine Atmospheric Research paper
013. Aspendale, Vic., Australia.
Kull O, Kruijt B (1998) Leaf photosynthetic light response: a mechanistic model
for scaling photosynthesis to leaves and canopies. Functional Ecology, 12,
767–777.
Leakey ADB, Ainsworth EA, Bernacchi CJ, Rogers A, Long SP, Ort DR (2009)
Elevated CO2 effects on plant carbon, nitrogen, and water relations: six important
lessons from FACE. Journal of Experimental Botany, 60, 2859–2876.
Leavitt SW, Idso SB, Kimball BA, Burns JM, Sinha A, Stott L (2003) The effect of long-
term atmospheric CO2 enrichment on the intrinsic water-use efficiency of sour
orange trees. Chemosphere, 50, 217–222.
Leuning R (1995) A critical appraisal of a combined stomatal-photosynthesis model
for C3 plants. Plant, Cell and Environment, 18, 339–355.
Linares JC, Delgado-Huertas A, Julio Camarero J, Merino J, Carreira JA (2009)
Competition and drought limit the response of water-use efficiency to rising
atmospheric carbon dioxide in the Mediterranean fir Abies pinsapo. Oecologia, 161,
611–624.
Maier CA, Palmroth S, Ward E (2008) Short-term effects of fertilization on photosyn-
thesis and leaf morphology of field-grown loblolly pine following long-term expo-
sure to elevated CO2 concentration. Tree Physiology, 28, 597–606.
McCarthy HR, Oren R, Finzi AC, Ellsworth DS, Kim H-S, Johnsen KH, Millar B (2007)
Temporal dynamics and spatial variability in the enhancement of canopy leaf area
under elevated atmospheric CO2. Global Change Biology, 13, 1–19.
McCarthy HR, Oren R, Johnsen KH et al. (2010) Re-assessment of plant carbon
dynamics at the Duke free-air CO2 enrichment site: interactions of atmospheric
[CO2] with nitrogen and water availability over stand development. New Phytolo-
gist, 185, 514–528.
Medlyn BE, Barton CVM, Broadmeadow MSJ et al. (2001) Stomatal conductance of
forest species after long-term exposure to elevated CO2 concentration: a synthesis.
New Phytologist, 149, 247–264.
Medlyn BE, Pepper DA, O’Grady AP, Keith H (2007) Linking leaf and tree water use
with an individual-tree model. Tree Physiology, 27, 1687–1699.
Medlyn BE, Duursma RA, Eamus D et al. (2011a) Reconciling the optimal and empiri-
cal approaches to modelling stomatal conductance. Global Change Biology, 17, 2134
–2144.
Medlyn BE, Duursma RA, Zeppel MJB (2011b) Forest production under climate
change: a checklist for evaluating model studies. Climate Change, 2, 332–355.
Medvigy D, Wofsy SC, Munger JW, Hollinger DY, Moorcroft PR (2009) Mechanistic
scaling of ecosystem function and dynamics in space and time: ecosystem demog-
raphy model version 2. Journal of Geophysical Research: Biogeosciences, 114, G01002.
Mooney HA, Canadell J, Chapin FS III et al. (1999) Ecosystem physiology responses
to global change. In: Implications of Global Change for Natural and Managed Ecosys-
tems. A Synthesis of GCTE and Related Research. IGBP Book Series No. 4, (eds
Walker BH, Steffen WL, Canadell J, Ingram JSI), pp. 141–189. Cambridge Univer-
sity Press, Cambridge.
Morison JIL (1985) Sensitivity of stomata and water use efficiency to high CO2. Plant,
Cell and Environment, 8, 467–474.
Norby RJ, Zak DR (2011) Ecological lessons from Free-Air CO2 enrichment (FACE)
experiments. Annual Review of Ecology, Evolution, and Systematics, 42, 181–203.
Norby RJ, Todd DE, Fults J, Johnson DW (2001) Allometric determination of tree
growth in a CO2-enriched sweetgum stand. New Phytologist, 150, 477–487.
© 2013 Blackwell Publishing Ltd, Global Change Biology, 19, 1759–1779
MODEL WATER USE AT ELEVATED CO2 1777

Norby RJ, Hanson PJ, O’Neill EG et al. (2002) Net primary productivity of a CO2-
enriched deciduous forest and the implications for carbon storage. Ecological Appli-
cations, 12, 1261–66.
Norby RJ, Hartz-Rubin J, Verbrugge MJ (2003) Phenological responses in maple to
experimental atmospheric warming and CO2 enrichment. Global Change Biology, 9,
1792–1801.
Norby RJ, Warren JM, Iverson CM, Medlyn BM, McMurtrie RE (2010) CO2 enhance-
ment of forest productivity constrained by limited nitrogen availability. PNAS,
107, 19368–19373.
Oishi AC, Oren R, Stoy PC (2008) Estimating components of forest evapotranspira-
tion: a footprint approach for scaling sap flux measurements. Agricultural and For-
est Meteorology, 148, 1719–1732.
Oleson KW, Lawrence DM, Bonan GB et al. (2010) Technical Description of Version 4.0
of the Community Land Model (CLM) NCAR Tech. Note NCAR/TN-461 + STR.
National Centre for Atmospheric Research, Boulder, Colorado.
Oren R, Ewers BE, Todd P, Phillips N, Katul G (1998) Water balance delineates the
soil layer in which moisture affects canopy conductance. Ecological Applications, 8,
990–1002.
Oren R, Ellsworth DE, Johnsen KH et al. (2001) Soil fertility limits carbon sequestra-
tion by forest ecosystems in a CO2-enriched atmosphere. Nature, 411, 469–472.
Palmroth S, Oren R, McCarthy HR et al. (2006) Aboveground sink strength in forests
controls the allocation of carbon belowground and its [CO2]-induced enhance-
ment. PNAS, 103, 19356–19361.
Parton WJ, Anderson, DW, Cole CV, Stewart JWB (1983) Simulation of soil organic
matter formation and mineralization in semiarid agroecosystems. In: Nutrient
Cycling in Agricultural Ecosystems (eds Lowrance RR, Todd RL, Asmussen LE,
Leonard, RA ), pp. 533–550. The Univ. of Georgia, College of Agriculture Experi-
ment Stations, Athens, Georgia. Special Publ. No. 23.
Pe~nuelas J, Hunt JM, Ogaya R, Jump AS (2008) Twentieth century changes of tree-
ring d13C at the southern range-edge of Fagus sylvatica: increasing water-use effi-
ciency does not avoid the growth decline induced by warming at low altitudes.
Global Change Biology, 14, 1076–1088.
Pe~nuelas J, Canadell JG, Ogaya R (2011) Increased water-use efficiency during the
20th century did not translate into enhanced tree growth. Global Ecology and Bioge-
ography, 20, 597–608.
Petit JR, Jouzel J, Raynaud D et al. (1999) Climate and atmospheric history of the past
420,000 years from the Vostok ice core, Antartica. Nature, 399, 429–436.
Piao S, Friedlingstein P, Ciais P, de Noblet-Ducoudr�e N, Labat D, Zaehle S (2007)
Changes in climate and land use have a larger direct impact than rising CO2 on
global river runoff trends. PNAS, 104, 15242–15247.
Pollard D, Thompson SL (1995) Use of a land-surface-transfer scheme (LSX) in a
global climate model: the response to doubling stomatal resistance. Global and
Planetary Change, 10, 129–161.
Sands PJ (1995) Modelling canopy production. II. From single-leaf photosynthetic
parameters to daily canopy photosynthesis. Australian Journal of Plant Physiology,
22, 603–614.
Sands PJ (1996) Modelling canopy production. III. Canopy light-utilisation efficiency
and its sensitivity to physiological and environmental variables. Australian Journal
of Plant Physiology, 23, 103–114.
Saurer M, Siegwolf RTW, Schweingruber FH (2004) Carbon isotope discrimination
indicates improving water-use efficiency of trees in northern Eurasia over the last
100 years. Global Change Biology, 10, 2109–2120.
Saxe H, Ellsworth DS, Heath J (1998) Tree and forest functioning in an enriched CO2
atmosphere. New Phytologist, 139, 395–436.
Sch€afer KVR, Oren R, Lai CT, Katul GG (2002) Hydrologic balance in an intact tem-
perate forest ecosystem under ambient and elevated atmospheric CO2 concentra-
tion. Global Change Biology, 8, 895–911.
Sch€afer KVR, Oren R, Ellsworth D et al. (2003) Exposure to an enriched CO2 atmo-
sphere alters carbon assimilation and allocation in a pine forest ecosystem. Global
Change Biology, 9, 1378–1400.
Sellers PJ, Bounoua L, Collatz GJ et al. (1996) Comparison of radiative and physiologi-
cal effects of doubled atmospheric CO2 on climate. Science, 271, 1402–1406.
Sholtis JD, Gunderson CA, Norby RJ, Tissue DT (2004) Persistent stimulation of pho-
tosynthesis by elevated CO2 in a sweetgum (Liquidambar styraciflua L.) forest stand.
New Phytologist, 162, 343–354.
Smith B, Prentice IC, Sykes MT (2001) Representation of vegetation dynamics in the
modelling of terrestrial ecosystems: comparing two contrasting approaches within
European climate space. Global Ecology and Biogeography, 6, 621–637.
Uddling J, Teclaw RM, Kubiske ME, Pregitzer KS, Ellsworth DS (2008) Sap flux in
pure aspen and mixed aspen–birch forests exposed to elevated concentrations of
carbon dioxide and ozone. Tree Physiology, 28, 1231–1243.
Wang S (2008) Simulation of evapotranspiration and its response to plant water and
CO2 transfer dynamics. Journal of Hydrometeorology, 9, 426–443.
Wang S, Trishchenko AP, Sun X (2007) Simulation of canopy radiation transfer and
surface albedo in the EALCO model. Climate Dynamics, 29, 615–632.
Wang YP, Law RM, Pak B (2010) A global model of carbon, nitrogen and phosphorus
cycles for the terrestrial biosphere. Biogeosciences, 7, 2261–2282.
Wang YP, Kowalczyk E, Leuning R et al. (2011) Diagnosing errors in a land surface
(CABLE) in the time and frequency domains. Journal of Geophysical Research, 116,
G01034.
Warren JM, Norby RJ, Wullschleger SD (2011a) Elevated CO2 enhances premature
leaf senescence during extreme climatic events in a temperate forest. Tree Physiol-
ogy, 31, 117–130.
Warren JM, Potzelsberger E, Wullschleger SD, Thornton PE, Hasenauer H, Norby RJ
(2011b) Ecohydrologic impact of reduced stomatal conductance in forests exposed
to elevated CO2. Ecohydrology, 4, 196–210.
Waterhouse JS, Switsur VR, Barker AC, Carter AHC, Hemming DL, Loader NJ,
Robertson I (2004) Northern European trees show a progressively diminishing
response to increasing atmospheric carbon dioxide concentrations. Quaternary Sci-
ence Reviews, 23, 803–810.
Weng ES, Lui YQ (2008) Soil hydrological properties regulate grassland ecosystem
responses to multifactor global change: a modeling analysis. Journal of Geophysical
Research, 113, G03003.
Wong SC, Cowan IR, Farquhar GD (1979) Stomatal conductance correlates with pho-
tosynthetic capacity. Nature, 282, 424–426.
Woodward FI (1990) Global change: translating plant ecophysiological responses to
ecosystems. Trends in Ecology and Evolution, 5, 308–311.
Woodward FI, Smith TM, Emanuel WR (1995) A global land primary productivity
and phytogeography model. Global Biogeochemical Cycles, 9, 471–490.
Wullschleger SD, Gunderson CA, Hanson PJ, Wilson KB, Norby RJ (2002)
Sensitivity of stomatal and canopy conductance to elevated CO2 concentra-
tion–interacting variables and perspectives of scale. New Phytologist, 153,
485–496.
Zaehle S, Friend AD, Friedlingstein P, Dentener F, Peylin P, Schulz M (2010) Carbon
and nitrogen cycle dynamics in the O-CN land surface model: 2. Role of the nitro-
gen cycle in the historical terrestrial carbon balance. Global Biogeochemical Cycles,
24, GB1006.
© 2013 Blackwell Publishing Ltd, Global Change Biology, 19, 1759–1779
1778 M. G. DE KAUWE et al.

Supporting Information
Additional Supporting Information may be found in the online version of this article:
Figure S1. Box and Whisker plots showing the mean annual response of (a) WUE, (b) NPP and (c) transpiration (E) to CO2 enhance-ment at Duke, between 1996 and 2007, for observations and 11 models. The ends of the boxes show the lower (25th) and upper (75 th)quartiles. The horizontal whiskers show the full range of the data. The lines in the boxes are themedians and stars are themeans.Figure S2. Box and Whisker plots showing the mean annual response of (a) WUE, (b) NPP and (c) transpiration (E) to CO2 enhance-ment at Oak Ridge, for the years 1999, 2004, 2007 and 2008, for observations and 11 models. The ends of the boxes show the lower(25th) and upper (75 th) quartiles. The horizontal whiskers show the full range of the data. The lines in the boxes are the medians andstars are themeans.Figure S3. Comparison of the ratio of WUE at eCO2 to WUE at aCO2, plotted against the enhancement in CO2 for 1998 at the DukeFACE site. The dashed black line is the 1 : 1 line, whilst the solid grey line is the fit to the points, forced through the origin. Modelnames are given on each panel, as are the slopes of the fitted lines.Figure S4. Comparison of the ratio of WUE at eCO2 to WUE at aCO2, plotted against the enhancement in CO2 for 1999 at the DukeFACE site. The dashed black line is the 1 : 1 line, whilst the solid grey line is the fit to the points, forced through the origin. Modelnames are given on each panel, as are the slopes of the fitted lines.Figure S5. Comparison of the ratio of WUE at eCO2 to WUE at aCO2, plotted against the enhancement in CO2 for 2000 at the DukeFACE site. The dashed black line is the 1 : 1 line, whilst the solid grey line is the fit to the points, forced through the origin. Modelnames are given on each panel, as are the slopes of the fitted lines.Figure S6. Comparison of the ratio of WUE at eCO2 to WUE at aCO2, plotted against the enhancement in CO2 for 2001 at the DukeFACE site. The dashed black line is the 1 : 1 line, whilst the solid grey line is the fit to the points, forced through the origin. Modelnames are given on each panel, as are the slopes of the fitted lines.Figure S7. Comparison of the ratio of WUE at eCO2 to WUE at aCO2, plotted against the enhancement in CO2 for 2003 at the DukeFACE site. The dashed black line is the 1 : 1 line, whilst the solid grey line is the fit to the points, forced through the origin. Modelnames are given on each panel, as are the slopes of the fitted lines.Figure S8. Comparison of the ratio of WUE at eCO2 to WUE at aCO2, plotted against the enhancement in CO2 for 2004 at the DukeFACE site. The dashed black line is the 1 : 1 line, whilst the solid grey line is the fit to the points, forced through the origin. Modelnames are given on each panel, as are the slopes of the fitted lines.Figure S9. Comparison of the ratio of WUE at eCO2 to WUE at aCO2, plotted against the enhancement in CO2 for 2005 at the DukeFACE site. The dashed black line is the 1 : 1 line, whilst the solid grey line is the fit to the points, forced through the origin. Modelnames are given on each panel, as are the slopes of the fitted lines.Figure S10. Comparison of the ratio of WUE at eCO2 to WUE at aCO2, plotted against the enhancement in CO2 for 2006 at the DukeFACE site. The dashed black line is the 1 : 1 line, whilst the solid grey line is the fit to the points, forced through the origin. Modelnames are given on each panel, as are the slopes of the fitted lines.Figure S11. Comparison of the ratio of WUE at eCO2 to WUE at aCO2, plotted against the enhancement in CO2 for 2007 at the DukeFACE site. The dashed black line is the 1 : 1 line, whilst the solid grey line is the fit to the points, forced through the origin. Modelnames are given on each panel, as are the slopes of the fitted lines.Figure S12 Comparison of the ratio of WUE at eCO2 to WUE at aCO2, plotted against the enhancement in CO2 for 1998 at the OakRidge FACE site. The dashed black line is the 1 : 1 line, whilst the solid grey line is the fit to the points, forced through the origin.Model names are given on each panel, as are the slopes of the fitted lines.Figure S13. Comparison of the ratio of WUE at eCO2 to WUE at aCO2, plotted against the enhancement in CO2 for 1999 at the OakRidge FACE site. The dashed black line is the 1 : 1 line, whilst the solid grey line is the fit to the points, forced through the origin.Model names are given on each panel, as are the slopes of the fitted lines.Figure S14. Comparison of the ratio of WUE at eCO2 to WUE at aCO2, plotted against the enhancement in CO2 for 2000 at the OakRidge FACE site. The dashed black line is the 1 : 1 line, whilst the solid grey line is the fit to the points, forced through the origin.Model names are given on each panel, as are the slopes of the fitted lines.Figure S15. Comparison of the ratio of WUE at eCO2 to WUE at aCO2, plotted against the enhancement in CO2 for 2001 at the OakRidge FACE site. The dashed black line is the 1 : 1 line, whilst the solid grey line is the fit to the points, forced through the origin.Model names are given on each panel, as are the slopes of the fitted lines.Figure S16. Comparison of the ratio of WUE at eCO2 to WUE at aCO2, plotted against the enhancement in CO2 for 2003 at the OakRidge FACE site. The dashed black line is the 1 : 1 line, whilst the solid grey line is the fit to the points, forced through the origin.Model names are given on each panel, as are the slopes of the fitted lines.Figure S17. Comparison of the ratio of WUE at eCO2 to WUE at aCO2, plotted against the enhancement in CO2 for 2004 at the OakRidge FACE site. The dashed black line is the 1 : 1 line, whilst the solid grey line is the fit to the points, forced through the origin.Model names are given on each panel, as are the slopes of the fitted lines.Figure S18. Comparison of the ratio of WUE at eCO2 to WUE at aCO2, plotted against the enhancement in CO2 for 2005 at the OakRidge FACE site. The dashed black line is the 1 : 1 line, whilst the solid grey line is the fit to the points, forced through the origin.Model names are given on each panel, as are the slopes of the fitted lines.Figure S19. Comparison of the ratio of WUE at eCO2 to WUE at aCO2, plotted against the enhancement in CO2 for 2006 at the OakRidge FACE site. The dashed black line is the 1 : 1 line, whilst the solid grey line is the fit to the points, forced through the origin.Model names are given on each panel, as are the slopes of the fitted lines.Figure S20. Comparison of the ratio of WUE at eCO2 to WUE at aCO2, plotted against the enhancement in CO2 for 2007 at the OakRidge FACE site. The dashed black line is the 1 : 1 line, whilst the solid grey line is the fit to the points, forced through the origin.Model names are given on each panel, as are the slopes of the fitted lines.
© 2013 Blackwell Publishing Ltd, Global Change Biology, 19, 1759–1779
MODEL WATER USE AT ELEVATED CO2 1779