Embed Size (px)
Citation preview

NAVAJO GALLUP WATER SUPPLY PROJECT
APPRAISAL LEVEL DESIGNS AND COST ESTIMATES ·
APPENDIXC
WATER TREATMENT

WATER TREATMENT APPENDIX C
1. MANUFACTURE'S PROPOSALS AND INFORMATION A. HOLLOW FIBER ULTRAFILTRATION SYSTEM- ZENON. B. ULTRA VIOLET DISINFECTION UNITS - AQUIONICS INC.
2. SUPPORTING DOCUMENTATION FOR CAPITAL COSTS ESTIMATES A. ESTIMATE WORK SHEETS B. SUPPORTING DOCUMENTATION ON ESTIMATED QUANTITIES
3. SUPPORTING DOCUMENTATION ON ANNUAL OPERATION COST ESTIMATES.
4. ESTIMATES ON LOG REDUCTION CREDIT DURING TREATED WATER CONVEYANCE TO SERVICE.
5. EXISTINGWATERQUALITYDATA
6. CITY OF SOMERTON, WATER BLENDING STUDY

Modified by G.Ienn Howard For Enhanced Coagulation
ZeeWeed® _Wate~ T_reatment System
BUDGET PROPOSAL for a ZeeWeed® Membrane Filtration
Drinking Water Treatment System For the Navajo Gallup Water Supply Project
Proposal Number 820-01
Submitted to:
Glen Howard, P .E.
PO Box25007 Building 56
Denver Federal Center Denver, CO 80225-0007
cc:
Brian Dieke- Water Technology Group Dan Higgins - Zenon
Submitted by:
ZENON Environmental Corporation Municipal Division
3235 Dundas Street West Oakville, Ontario
L6M4B2
February 9, 2001
Copyrighte ZENON Environmental, 2001

Navajo Gallup Water Supply Project Water Treatment Plant Budget Proposal Number 820-01, February 9, 2001
Table of Contents
1.0 ZEEWEED® WATER TREATMENT SYSTEM DESIGN ................................................. 3
1.1 DESIGNP~1ERS ............. ................................................. .. .......................................... 3 1.2 DESIGN PHILOSOPHY AND EQUIPMENT SELECTION ..... . .... .. ................................................... 6
System Configuration ...... ........... ... .......... .... ...... ........................ .. ............................................ 6
Overview ofEquipment Provided ............ ..... ................. :························································· 6 ® .
2.0 SUMMARY OF THE ZEEWEED WATER TREATMENT PROCESS .•....••..•..•...•.••....• 8
3.0 ENHANCED COAGULATION PROCESS ......................................................................... 9
4.0 FEATURES & BENEFITS OF THE ZEEWEED® SYSTEM ..••..•...•••...•••••••.••..•.•.•..•••.•... ll
Advantages of an "Outside-In" Immersed Membrane ..... ..... .................................................. 11 Exceptional Membrane Durability ............................................ Error! Bookmark not defined. Simplicity of Operation ................. .......................... .................... ....... ... ... ... .. ....... .... .. ........... 11 Ruggedness of Operation I Operational Flexibility ........ ... ...................................................... 12 Reduced Consumption ofProcess Chemicals .. ....................................................................... 12 Modular Expandability .................... ........................... ............................. .................... .. ... ..... 13 Compact Plant ........................................................................ · ............................................... 13 Treated Water Disinfection & Disinfection By-Products ................................ ............... ......... 13 NOM Removal ...................................................................................................................... 13 Disinfection Contact Time/Virus Rejection ................................................................. ........... 13 Geosmin Removal .......................................................................................... : ...................... 13 Membrane Certifications ............................. .. ........ ................................................................ 14 Membrane Chemical Tolerance ............... : ........................................................................... :. 14
5.0 MAJOR EQ"UIPMENT ....................................................................................................... 15
ZENON Scope of Supply ...................................................................................................... 15 ZENON Scope of Supply ........ ......... ·: ........... ........................ ... Error! Bookmark not defined.
6.0 CO.MMERCIA.L IN'FORMA TION ...........•......................................................................... 18
6.1 PRICING SUMMARY ............................. ~ .............................................................................. 18 6.2 EQUIPNIENT S:HIPMENT AND DELIVERY ........................................... . .................................. 19 6.3 STANDARD TERMs AND CoNDmoNs ................................................................................. 19 .
ZENON Environmental Systems Inc. 2

Navajo Gallup Water Supply Project Water Treatment Plant Budget Proposal Number 820-01, February 9, 2001
1.0 ZeeWeed® Water Treatment System Design
1.1 Design Parameters
· The table below summarizes the main design parameters on which the proposed ZeeWeed~ Water Treatment System for the Navajo Gallup Water Supply Project has been designed. The column titled "treated water" is the anticipated treated water quality.
Two options have been proposed; both to produce a combined treated maximum daily flow capacity of 40.5 MGD. The source water will be from either the future Moncisco Reservoir or from a blend of San Juan River and Cutter Reservoir. The first option is to use ZW500 series membranes in contact with coagulated water for an enhanced coagulation ultrafiltration system. The second option is to use the ZW1 000 membranes to filter settled water. This option does not include the flocculation and settling equipment.
Moncisco Reservoir~ Source Water, Navajo Dam via Navajo Indian Irrigation Project (NIIP)
Design Flow Raw Water Treated Water*
Design Flow Maximum Daily Flow year 2020 26.25 MGD 26.25 MGD Maximum Daily flow year 2040 42.24 MGD 42.24 MGD * 90 percent recovery is included in maximum daily flow demand estimate
Cutter Reservoir- Source Water Navajo bam
Design Flow Raw Water
Design Flow Maximum Daily Flow year 2020 2.35 MGD Maximum Daily flow year 2040 4.0 MGD
Treated Water*
2.35 MGD 4.0 MGD
* 90 percent recovery is included in maximum daily flow demand estimate .
Physical Parameters - NIIP Water
Temperature Turbidity TOC DOC Color Alkalinity Hardness
Raw Water
45.3-49.1 1.47-3.16
2.29-8 N/A N/A N/A N/A
ZENON Environmental Systems Inc.
oF NTU Mg/L Mg/L TCU Mg/L (as CaC03) Mg/L (as CaC03)
Treated Water
s; 0.1 35%
oF NTU reduction Mg/L TCU Mg/L (as CaC03) Mg/L (as CaC03)
3

Navajo Gallup Water Supply Project Water Treatment Plant Budget Proposal Number 820-01, February 9, 2001
TTHM's Iron Manganese PH
ZENON Environmental Systems Inc.
N/A J.lg/L N/A Mg/L N/A Mg/L . 7.7
J,Lg/L Mg/L Mg/L
4

Navajo Gallup Water Supply Project Water Treatment Plant Budget Proposal Number 820-01, February 9, 2001
San Juan River
Design Flow Raw Water
Design Flow
Treated Water*
Maximum Daily Flow year 2020 23.89 MGD 23.89 MGD Maximum Daily flow year 2040 38.25 MGD 38.25 MGD * 90 ·percent recovery is included in maximum daily flow demand estimate
Physical Parameters. San Juan River without runoff Raw Water Treated Water
oF
~· 0.1 NTU Temperature Turbidity TOC DOC
45-74 1.47-3.16
2.29-8
oF
NTU mg/L mg/L TCU
35% reduction (Option 1 only) mg/L
Color p Alkalinity M Alkalinity Hardness T1'IThf's Iron Manganese PH
mg/L (as CaC03) mg/L (as CaCOJ) mg/L (as CaCOJ) J.Lg/L mg/L mg/L
TCU mg/L (as CaC03) mg!L (as CaC03) mg/L (as CaCOJ) J.Lg/L mg!L
. mg!L
Microbiological Parameters for all source water being considered.
Raw Water Treated Water
Giardia Not Stated units/L ~6 log removal Note 1
Cryptosporidium Not Stated unitSJL ~6 log removal Note 1
Viruses Not Stated units/L ~2 log removal Note 2
Total Coliforms ~ 1 cfu/100 mL Faecal Coliforms ~ 1 cfu/100 mL
Note 1: The ZeeWeedcz, Membrane is guaranteed to achieve ~ 6 log removal of Giardia and Cryptosporidium to the limits of detection, however it must be realized that 6 log removal can only be achieved if> 106 cysts/oocysts are present in the raw water.
ZENON Environmental Systems Inc. 5

Navajo Gallup Water Supply Project Water Treatment Plant Budget Proposal Number 820-01, February 9, 2001
Note 2: Viruses are usually less than 0.1 microns, however they are typically associated with host bacteria or attached to particulates larger than 0.1 microns and can therefore be removed by the ZeeWeed~ Membrane. ZENON has received a minimum of2.0 log virus rejection certification by the DHS based on the · results of the California DHS Certification Testing
. which showed a minimum virus rejection of 2.5 log for the ZeeWeed~ Immersed Ultrafiltration Membrane.
1.2 Design Philosophy and Equipment Selection
System Configuration - ZW 500 Series Enhanced Coagulation
The design configuration proposed by ZENON for the Moncisco Reservoir and the San Juan River will have seven (7) individual membrane treatment trains. The system for the Cutter Reservoir will have four (4) individual membrane trains. Future plant expansion, if and when required, can be · achieved by adding additional treatment units to the spare compartment provided.
The use of multiple process trains enables the plant to be operated at full capacity for short periods with one (1) membrane treatment stream off-line for cleaning (or maintenance) by increasing the flow (and hence flux) through the remaining operational membrane trains. The system proposed by ZENON is capable of producing the maximum daily demands of treated water with one train of membranes temporarily removed from service.
The system is designed for installation within adjacent rectangular concrete membrane tanks that will use common wall construction to reduce costs and minimize plant footprint. Each membrane treatment stream will be equipped with its own permeate pump. The flow will . be split into the individual tanks from a common inlet feed channel that will run along the feed end of the membrane tanks. Tank characteristics for the Moncisco and San Juan treatment plants are as follows:
Tank Dimensions (Approximate) Side Water Depth (SWD) Number of Tanks Flocculation Tank(s) .
85.5 ft long x 18.0 ft wide x 9 Ft 7
5-7 minutes detention time
10.0 ft high
Process tanks may be of concrete construction or fabricated steel tanks, whichever suits the Customer's preferences and are not included in ZENON's scope of supply. Tank dimensions are . preliminary only and may change slightly once final detail design commences.
Overview of Equipment Provided
The ZeeWeed~ Membrane Water Treatment System is designed with major process equipment supplied loose for installation on concrete pads. The ZeeWeed~ membranes are supplied for installation in concrete tanks (by others) within ZENON supplied membrane support frames.
ZENON Environmental Systems Inc. 6

Navajo Gallup Water Supply Project Water Treatment Plant Budget Proposal Number 820-01, February 9, 2001
The permeate from each membrane train will be pumped via a single permeate pump. Permeate pumps are supplied loose for mounting on concrete pads with the interconnecting piping and local isolators for supply by others. ZENON will supply the valves for the permeate system to ensure compatibility with the control system provided.
Backpulsing of the membranes will be by dedicated backpulse pumps/, using water from concrete backpulse water storage tanks that are not included within ZENON's scope of supply. ZENON will supply the size requirements for the backpulse tanks. The backpulse tank will be filled from the common permeate discharge header pipe (piping by others).
The membrane air scour blowers are supplied loose either for installation adjacent to the membrane system tanks or if preferred, within a separate hlower room to minimize the noise within the plant building. The interconnecting piping from the blowers to the air headers in the membrane tanks will be for supply and installation by others (not by ZENON).
The design proposed uses one (1) air blower to provide the air to two (2) trains of membranes. For this system to operate correctly it is important to ensure that the water levels in the two adjacent tanks are the same to ensure and even flow of air to each train of membranes. This is achieved by installing a balance pipe between adjacent tanks to permit equalization of the water level. The balance pipe includes an isolation valve to permit adjacent tanks to be isolated from each other when drained down for maintenance or membrane cleaning operations. Alternatively, a common feed channel with inlets to each train below the operating water level can be utilized to provide a .common water level.
Reject water will flow via an overflow by gravity to the disposal point.
A control valve and flowmeter will regulate reject water.
The plant control panel will be supplied loose so that it can be either wall mounted adjacent to the plant or located in a separate control room depending on the Owner's preference.
ZENON Environmental Systems Inc. 7
Navajo Gallup Water Supply Project Water Treatment Plant Budget Proposal Number 820-0 I, February 9, 200 I
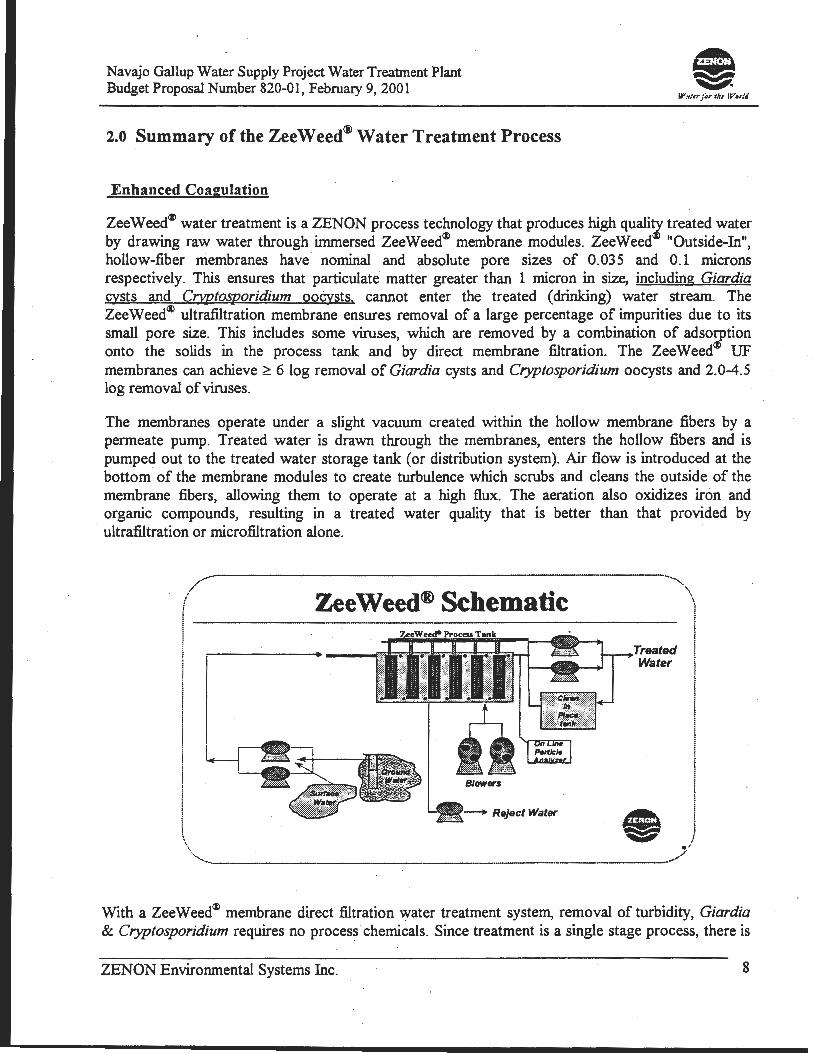
2.0 Summary of the Zee Weed® Water. Treatment Process
Enhanced Coagulation
ZeeWee~~~> water treatment is a ~NON process technology that produces high qualiZ treate~ water by drawmg raw water through unmersed ZeeWeedil> membrane modules. ZeeWeed "Outstde-In", hollow-fiber membranes have nominal and absolute pore sizes of 0.035 and 0.1 microns respectively. This ensures that particulate matter greater than I micron in size, including Giardia cysts and Cryptosporidium oo¢ysts. cannot enter the treated (drinking) water stream. The ZeeWeedil> ultrafiltration membrane ensures removal of a large percentage of impurities due to its small pore size. This includes some viruses, which are removed by a combination of adsorption onto the solids in the process tank and by direct membrane filtration. The ZeeWeedil> UF membranes can achieve~ 6 log removal of Giardia cysts and Cryptosporidium oocysts and 2.0-4.5 log removal of viruses.
The membranes operate under a slight vacuum created within the hollow membrane fibers by a permeate pump. Treated water is drawn through the membranes, enters the hollow fibers and is pumped out to the treated water storage tank (or distribution system). Air flow is introduced at the bottom of the membrane modules to create turbulence which scrubs and cleans the outside of the membrane fibers, allowing them to operate at a high flux. The aeration also oxidizes iron and organic compounds, resulting in a treated water quality that is better than that provided by ultrafiltration or microfiltration alone. ·
With a ZeeWeedil> membrane direct filtration water treatment system, removal of turbidity, Giardia & Cryptosporidium requires no process chemicals. Since treatment is a single stage process, there is
ZENON Environmental Systems Inc. 8

Navajo Gallup Water Supply Project Water Treatment Plant Budget Proposal Number 820-01, February 9, 2001
no need for coagulants 'and the ZeeWeedi&) membranes effectively replace both the clarifier and granular media type filters found in conventional water treatment plants. There is no need to create large flocculated particles for settling in clarifiers or for capture by granular media filters. This results in significantly easier control for plant operators. ·Also, as the membranes are immersed directly in the process tank and are under only a low vacuum, high suspended solids concentrations do not foul the membranes or cause excessive backpulsing frequency and therefore, avoid the loss of productivity that can be experienced with positive pressure membranes in vessels.
ZeeWeedi&) membranes have the additional benefit of being chlorine resistant up to concentrations greater than 500 mg/L. Therefore, influent water can be pre-chlorinated for zebra mussel control.
The ZeeWeedi&) membrane technology process consistently p~oduces high quality water, as the membranes are not subjected to stress, pressurization or rapid pressure fluctuations. Membrane cleaning by backpulsing is achieved ·by reversing the permeate flow and backwashing the fibers' lumen with permeate at low pressure (due to the high permeability ofthe ZeeWeedi&) membrane, the backpressure during backpulsing is low). The small variations in operating pressure occur smoothly over relatively long periods so that at no time is the membrane stressed. This, in tum, results in a membrane filtered permeate with the lowest sustainable particle count on the market.
3.0 Enhanced Coagulation Process
The ZeeWeedi&) water treatment systems are highly effective at removing color, Total Organic Carbon (TOC) and Dissolved Organic Carbon (DOC) from water - more effective than conventional treatments. Color, TOC and DOC removal is achieved using an enhanced coagulation process.
The ultrafiltration enhanced coagulation process consists of the integration of immersed membrane technology with the conventional coagulation/filtration steps traditionally used in municipal filtration plants. However, in this process, a three-stage process comprised of rapid-mixcoagulation-ultrafiltration replaces the conventional coagulation-flocculation-sedimentationfiltration steps. This is accomplished in a single process tank, which contains the membranes in a compartment. Coagulant is injected into the water to allow the formation of floc particles, which need only be larger than the membrane pore size to be removed by the membranes. The success of . the enhanced coagulation process is based on the presence of a high concentration of pin sized iron or aluminum based floes in the process tank.
There are numerous advantages associated with the enhanced coagulation process, some of which are: 1. High floc concentration in the process tank increases the surface area available for
adsorption ofNOM and thus increases the TOC removal efficiency. 2. Increasing the solid concentration increases the floc retention time in the process tank. When
standard ultrafiltration membranes are combined with coagulation, it is very likely that some impurities do not have sufficient time to get adsorbed on to floc surface and thus escape treatment. Increasing floc retention time enhances the removal of these particles.
ZENON Environmental Systems Inc. 9

Navajo Gallup Water Supply Project Water Treatment Plant Budget Proposal Number 820-01, February 9, 2001
3. Higher solid concentration also translates into improved membrane petformance as most of · the impurities that would normally adsorb on the membrane sutface and cause fouling will have more floc surface are4 and time available for adsorption, thereby eliminating their availability as a foulant.
4. Since settling is not an issue for membrane based separation, there is only the need to form micro-floes of 0.1 microns and larger for the membrane to effectively separate the coagulated organic and colloidal particles. This is achieved by providing enough mixing to maintain G values greater than 80-100 sec"1 range in the process tank. The small size of floes further increases the sutface area available for adsorption and thus improves the overall process efficiency.
5. Compared to conventional treatment, enhanced coagulation process requires a smaller building footprint area and thus reduces capital cost.
6. Based on the process efficiencies discussed above, lower coagulant dosages are required to achieve similar results which further decreases chemical and sludge disposal costs.
TOC removal can also be achieved and/pr enhanced by the addition of PAC to the rapid mix stage of the enhanced coagulation process. Aeration in the solids contact zone and membrane tank maintains the PAC in suspension. Similar to the immersed enhanced coagulation process, a high solids ·. concentration is maintained in the process tank to enhance the adsorption of dissolved organic carbon, particularly low molecular weight organics.
ZENON Environmental Systems Inc. 10

Navajo Gallup Water Supply Project Water Treatment Plant Budget Proposal Number 820-01, February 9, 2001
4.0 Features &·Benefits of the ZeeWeed® System
Advantages of an "Outside-In" Immersed Membrane a) Single Step Treatment
The ZeeWeedill memb~ane is an outside-in membrane, where the flow of water is from the outside of the membrane to the inside of the hollow fiber. The result is that the inside of the membrane only comes in contact with clean, filtered water. The solids to be removed remain outside of the membrane, where they do not cause fouling and plugging.
b) Low Energy Requirement
Being immersed allows ZENONs ZeeWeedill Membranes to operate under a slight vacuum instead of under a high positive pressure, as do other membranes on the market. The ZeeWeedill Membrane operates under a differential pressure of 5"Hg to 18"Hg (5-20ft H20) vacuum. The operational energy to maintain this vacuum is very low; to ZENON's knowledge it is the lowest in the membrane market. ·
c) Ability to Operate in a High Solids Environment
The ZeeWeedill membranes are immersed within the process tank, where suspended solids can exist without interfering with membrane operation. The operating flux rates of ZeeWeedill membrane modules are, for all practical purposes, independent of the solids content and turbidity of the raw water supply. This may not be the case for positive pressure membrane systems in vessels using high coagulant dosages.
d) Stable and Low Particle Counts in the Effluent
The low energy backpulse of the ZeeWeedil) membrane does not produce significant expansion of the membrane pores. Expansion of the membrane pores, which results from high energy air backpulsing of the membranes as utilized in some types of membrane systems, can result in high particle counts immediately following backpulsing. This expansion of the membrane pores may potentially permit the passage of particles of larger sizes through the membranes until the membrane fiber is . fully relaxed from the expansion induced by the backpulsing process. Such systems cannot reliably use particle counters to verify the membrane integrity.
·The ZeeWeedill process consistently produces high quality treated water, which remains stable at all phases of plant operation.
Simplicity of Operation , The ZeeW~edill process is an easy and inexpensive system to operate both in terms of maintenance costs and personnel requirements. Since treatment is a single stage process, there is no need for coagulants (except for color and organics ·removal), clarifiers or sand filters as with some other
ZENON Environmental Systems Inc. 11

Navajo Gallup Water Supply Project Water Treatment Plant Budget Proposal Number 820-01, February 9, 2001
membrane systems. Instead the plant operators are only required to ensure they maintain proper membrane permeating conditions by maintaining _the permeate pumps and blowers in operation.
Ruggedness of Operation I Operational Flexibility
The ZeeWeed<ll Treatment Process consiste~tly produces high quality treated water irrespective of seasonal and weather related variations in the source raw water quality, since the membranes can operate equally well in low or high solids concentrations and at varying temperatures:
without clogging without the need for pressurized air backpulsing cycles which consistently stress the membranes and lead to premature failure . without any detrimental effects.on the membrane flux since the ZeeWeed<ll membrane was developed for environments of high solids concentrations without breaking. since the hollow · fiber membrane is a composite developed to be both highly durable structurally as well as chemically resistant to outside elements
Reduced Consumption of Process Chemicals With a ZeeWeed111 Membrane Water Treatment System, removal of turbidity, Giardia & Cryptosporidium requires no process . chemicals. For these types of applications it may be permitted to . pump the reject (overflow) water back to the water source (lake or river) reducing the waste sludge disposal/treatment c.osts associated . with chemical coagulants. This, in turn, may eliminate chemical laden sludges, which must be taken to a waste treatment plant for disposal. The particular local regulations pertaining to reject return should be investigated, as significant savings in capital equipment ·costs and the cost of constructing facilities to store the waste sludge may be realized.
For removal of organic color, TOC or DOC, coagulant addition is required and the waste stream may need to be directed to · a waste treatment facility for disposal. The ratio of waste water generated to treated water produced is, however, comparable to or better than conventional water treatment plants. Recovery, the percentage of feed water that is delivered treated to the distribution system, is typically in the range of95- 99%.
In lieu of direct discharge of the. waste ·stream to a municipal sewer, settling flicilities can be incorporated into the treatment plant design to separate settleable solids from the supernatant which can be returned to the ZeeWeedill process tank without impairing the treated water quality. Cyst concentration is not a concern as the membranes provide an absolute barrier to pathogenic organisms larger than the membrane pore size. Alternatively, the supernatant may be returned to the raw water source, where permitted. The relatively low volume of settled solids (sludge) that remains after decanting the supernatant can be pumped to the wastewater treatment plant.
Periodically, cleaning chemicals may need disposal by either being pumped into the sewer line or hauled away by truck, depending on local site conditions. Cleaning the membranes by slowly backpulsing cleaning chemicals into an empty tank can minimize the volume of wastewater of which to be disposed. Cleaning chemicals are typically neutralized prior to discharge to a sanitary sewer system.
ZENON Environmental Systems Inc. 12

Navajo Gallup Water Supply Project Water Treatment Plant Budget Proposal Number 820-01, February 9, 2001
Modular Expandability
Since the membrane equipment used with the ZeeWeed(J) Membrane System is modular in nature, plant capacity expansion can be undertaken in stages by progressively adding more ZeeWeed(J) Treatment Units {and treated water pumping· capacity) as the need for increased plant operating capacity occurs. This feature provides the option of inventorying membranes at ZENON for future installation and significantly reducing O&M costs.
Compact Plant
The ZeeWeed(J) Water Treatment Unit requires only a compact reactor vessel to accomplish that which would conventionally require a rapid mix tank,. flocculation tank, sedimentation basin and sand filters. This enables large savings in physic~l plant size and hence construction costs.
Treated Water Disinfection & Disinfection By-Products
The treatment system proposed by. ZENON does not include a chlorine dosing system to add residual chlorine to the treated water for disinfection, neither is any type of chamber provided for chlorine contact time. Treated water is to be chlorinated by others prior to being pumped to the distribution system in accordance with the applicable local standards for municipal water plant design.
NOM Removal
Natural Organic Matter larger than the 0.035 micron pore size will be rejected by the ZeeWeed(J) membrane. This will reduce the NOM available to react with free chlorine during disinfection. Additionally, NOM can be removed with the use of a coagulant prior to being fed to the ZeeWeed(J) system.
Disinfection Contact TimeNirus Rejection
ZENON has received a minimum of 2.0 log virus rejection certification by the DHS based on the results of the California DHS Certification Testing which showed a minimum virus rejection of 2.5 log for the ZeeWeed® Immersed Ultrafiltration Membrane.
Based on the assured 2 log virus removal with the membrane technology, there is only a need for 2 log virus inactivation by disinfection.
Based on the greater · than 6 log removal capability of the membrane for · Giardia and Cryptosporidium and the 2 log removal for the viruses, the ZENON membrane approach will require considerably less disinfectant dosages than other approaches. This will not only substantially reduce the annual disinfection chemical costs, it will also reduce the potential for the formation of disinfection by-products, inCluding TTHMs.
Geosmin Removal
Taste and odor complaints associated with Geos.min, a secondary metabolite of blue green algae Actinomycetes are· a common concern for most water utilities using surface water. Recent Research completed by Dr. James Taylor et. al, Uniyersity of Central Florida, 1998 has shown that the
ZENON Environmental Systems Inc. . 13

Navajo Gallup Water Supply Project Water Treatment Plant Budget Proposal Number 820-01, February 9, 2001 -
ZeeWeed~ Ultrafiltration system can remo~e between 25.9 to 44.9 % of Geosmin without pretreatment. While this ability is not unique to the ZeeWeed Ultrafiltration System, higher rejections of Geosmin are anticipated by · ZeeWeediJ) and other ultrafilters compared to microfiltration systems.
Membrane Certifications
The ZeeWeed~ Ultrafiltration Membrane System is certified to NSF-61 as an ultrafiltration membrane. A copy of our notice of Official Listing can be supplied upon request.
Membrane Chemical Tolerance
The ZeeWeed~ membrane is resistant to chlorine and other typical water treatment plant oxidants (such as chlorine dioxide and potassium permanganate). This means that it is possible to prechlorinate· the water for zebra mussel control as required without having to add a de-chlorination step such as Granular Activated Carbon (GAC) or bisulfite injection, which not only requires periodic chemical filling and maintenance, but also adds an unnecessary compound into the drinking water. Where prechlorination is desired, chemical resistance also provides protection against dechlorination equipment failure, which could lead to severe damage of a chlorine sensitive membrane. Finally, chlorine resistance also allows for easy disinfection of the membrane and the plant should this be required.
ZENON's ZeeWeed~ Me~brane is resistant to those chemicals that are commonly encountered in water treatment applications. The membranes will likely not be exposed to the majority of the chemicals listed below. However, should the ne_ed arise in the future to add any of these chemicals to the water, the ZeeWeed~ Membrane is able to operate with concentrations up to the levels indicated:
Chemical Chlorine Sodium Hypochlorite Chlorarnines Sodium Hydroxide Powdered Activated Carbon Alum (Aluminum Sulfate) Ferric Chloride Potassium Permanganate Polyaluminum Chloride
ZENON Environmental Systems Inc.
Maximum Concentration 1,000 mg!L 1,000 mg!L 1,000 mg!L 100 mg!L or pH< 10.5@ 40°C Unlimited
. Unlimited@ pH 4.5 - 8.5 Unlimited@ pH 3.5-9.0 < ioo mg!L Unlimited@ pH 4.5 - 8.5
14

. .
Navajo Gallup Water Supply Project Water Treatment Plant Budget Proposal Number 820-01, February 9, 2001
5.0 Major Equipment
The list below summarizes the major equipment and the quantities of items included for the ZeeWeed~ Water Treatment System design.
ZENON Scope of Supply
ZW 500 Series with Enhanced Coagulation
ZeeWeed~ Membranes and Tankage Including: • Aluminum Membrane Cassette Support Frames to permit membrane installation in
• • • • •
224 Eight (8) Eight (8) Eight (8) 32
concrete tanks . ~
ZeeWeed . Membrane Cassettes Permeate Collection Header Pipes Air Scour Distribution Header Pipes Process Tank Level Transmitters- one (1) per process train Process Tank Level Switches, four per tank
Permeate Pumping System Including: . • Eight (8) Permeate.Pumps, duty
·supplied loose, complete with required manual and automatic valves associated with
• • • • • • •
Eight (8) Four (4) Eight (8) Eight (8) Eight (8) Eight (8) Eight .(8)
the permeate pumping system . Air_ Separation Columns Vacuum Pumps, one duty and one stand-by Trans-Membrane -Pressure Transmitters Permeate Pump Pressure Gauges Permeate Flowmeters Particle Counters Turbidiineters
Membrane Air Scour System Including: • Five (5) Membrane Air Scour. Blowers, four duty and one stand:.by, supplied loose • -Five ( 5) Discharge Isolation y alves · • Five (5) Membrane Air Scour Blower Flow Switches • Five (5) Membrane Air Scour Blower Pressure Gauges
Reject Water Flow Control Equipment • Eight (8) Reject Water Discharge Flow Control Valves • Eight (8) · Reject Water Flowmeters
Backpulse System Including: • Two (2) Backpulse Pumps, one duty and one stand-by • Two (2). Backpulse Water Storage Taflk Level Transmitters, one per tank
ZENON Environmental Systems Inc. 15

Navajo Gallup Water Supply Project Water Treatment Plant Budget Proposal Number 820-01, February 9, 2001
• Eight(8)
• Two(2)
• Two (2)
• One (1)
• One (1)
• One (1) Two (2) One (1)
Backpulse Tank Level Float Switches, four per tank Backpulse Tank Inlet Fill Valves Backpulse Tanks Discharge Isolation Valves Backpulse Tank Crossover Valve Backpulse Flowmeter Backpulse Sodium Hypochlorite Chemical Feed System, including Chemical Metering Pumps, one duty and one stand-by Sodium Hypochlorite Chemical Storage Tank
Membrane Cleaning Systems • One (1) Sodium Hypochlorite CIP Chemical Feed System including:
Two (2) Chemical Feed Pumps, one duty and one stand-by One (1) . Sodium Hypochlorite Chemical Storage Tank
• One (1) · Sodium Bisulfite Chemical Neutralization System including Two (2) Chemical Feed Pumps, one duty and one stand-by One (1) Sodium Bisulfite Chemical Storage Tank
• One ( 1) MC 1 CIP Chemical Feed System including Two (2) Chemical Feed Pumps, one duty and one stand-by One (1) MCJ Chemical Storage Tank
• One (1) Sodium Hydroxide Chemical Neutralization System including Two (2) Chemical Feed Pumps, one duty and one stand-by One (1) Sodium Hydroxide Chemical Storage Tank
Chemical Feed Systems • One (1) Coagulant Chemical Feed System
Two (2) Chemical Feed Pumps, one duty and one stand-by One (1) Chemical Storage Tank ·
• One(1) pH Sensor and Transmitter
Electrical and Control Equipment • One (1) PLC based Control Panel with Panelview 900 Touchscreen HMI for ZENON
supplied equipment
Miscellaneous • Two (2) Air Compressors for . Membrane Integrity Pressure Hold Test, dual operation for
pneumatic valve operation
General • Equipment General Arrangement and Layout Drawings • Operator Training • Operating & Maintenance Manuals · • · Field Service and Process Start-up Assistance • Equipment Delivery FOB Gallup WTP, NM
ZENON Envir~nmental System~ Inc. 16

Navajo Gallup Wat~r Supply Project Water Treatment Plant Budget Proposal Number 820-01, February 9,2001
ZENON Environmental Systems Inc. 17
Navajo Gallup Water Supply Project Water Treatment Plant Budget Proposal Number 820-01, February 9, 2001
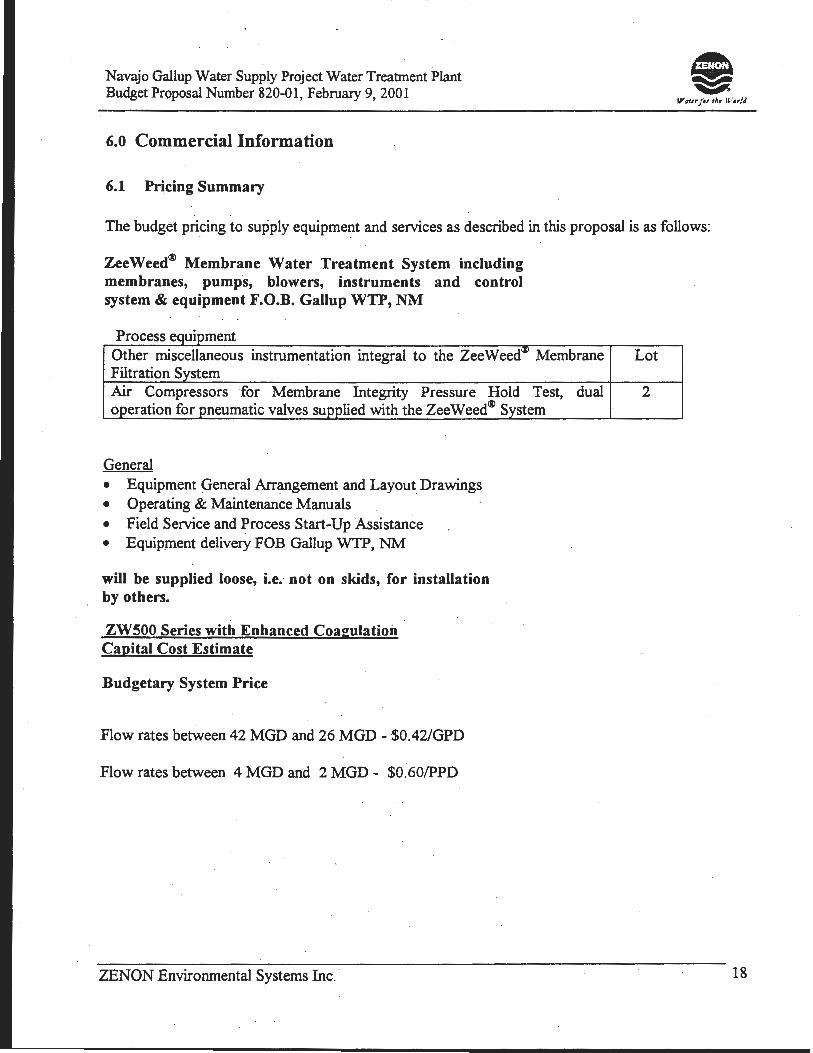
6.0 Commercial Information
6.1 Pricing Summary
The budget pricing to supply equipme1_1t and services as described in this proposal is as follows:
ZeeWeed® Membrane Water Treatment System including membranes, pumps, blowers, instruments and control system & equipment F.O.B. Gallup WTP, NM
p rocess eqmpment Other miscellaneous instrumentation integral to the ZeeWeed<&l Membrane Filtration System Air Compressors for Membrane Integrity Pressure Hold Test, operation for pneumatic valves supplied with the ZeeWeedill System
General • Equipment General Arrangement and Layout Drawings • Operating & Maintenance Manuals • Field Service and Process Start-Up Ass!stance • Equipment delivery FOB Gallup WTP, NM
will be supplied loose, i.e. not on skids, for installation by others.
ZWSOO Series with Enhanced Coagulation Capital Cost Estimate
Budgetary System Price
Flow rates between 42 MGD and 26 MGD - $0.42/GPD
Flow rates between 4 MGD and 2 MGD- $0.60/PPD
ZENON Environmental Systems Inc. ·
dual
Lot
2
18

Navajo Gallup Water Supply Project Water Treatment Plant Budget Proposal Number 820-01, February 9, ~001
6.2 E9uipment Shipment and Delivery
Typical Drawing Submission and Equipment Shipment Schedule
Operator training will occur when preferred by the Customer, but no later than 2 weeks prior to the scheduled plant start-up.
6.3 Standard Terms and Conditions
ZENON's Standard Terms and Conditions apply.
The enclosed materials are considered proprietary property of ZENON Environmental Systems Inc. No .assignments either implied or expressed, of intellectual property rights, data, know how, trade secrets or licenses of use thereof are given. All information is provided exclusively to the addressee for the purposes of evaluation and is not to be reproduced or divulged to other parties, nor used for manufacture or other means or authorize any of the above, without the express written consent of ZENON Environmental Systems Inc. The acceptance of this document will be construed as an acceptance of the foregoing conditions.
ZENON Environmental Systems Inc. 19

ro: Glenn Howard @ 303-445-6329 02/02/2001 11:18
From: Art Clemens (95q)337-8108 Via efax.com P9 2115 02-06-01 10:29 AM 6063410350 AQUIONICS PAGE 02
AQUIONICS INC. 21KENTONLANDSROAD PHONE: 8.59-341-0710
Quotation For:
Attention:
From:
Project:
Parameters:
ERLANGER, KY 41018 FAX: 859-341-0350
Art Clemens
ArtC1emens
Tina L. Masters, P .E.
Date: Quo~ No.
Navajo Indian Irrigation Project, CO
February 1, 2001 DWOl-02-0lB
Wat~r P.v~h1ation: Assume_ 85_% transmission in 11 1om light pnth nt 253. 7nm
Flow Ra.te:
Minimum lTV nn~C'!:
Inactivation ot.
2.0 mgd per unit
40 mJ/ cm2 (end of lamp life)
Cryptosporidium parvum: 2 to 4 log,0 reduction based on animal infectivity Giardia: 0.5 lolt reduction
Equipment Selection: two (2) Inline 12.50 Units
Design: Install 1 ca. Model Inline 12.50 mediwu IJICljliUJ1: W c.li~infection unit in parallel pl.p~s. Each unit will disinfect up to 2.0 mgd of wastewater to the requirements stated above. Two units will be used for peak flows. Each unit conllillts nf a ~mi,;~l.C'!n steel chamber conbining one bank of 6 x 2020W meclium presSUJ'e W lamps mounted horizontn.l nnd pCipcndiculllf to flow. The unit comes complete with au aulumat.ic L{UilrtZ !!lceve cleaning system, manual lamp power level control, UY monitor, and access hatch. Standard controls and the ~ower supply will be housed in two wall mounted epoxy coated steel cahinet~ (NF.MA. 12) per \Ulit.
.Clcc:tdcnl: 480V, 3·ph.asc, 30kW maximum connected load (rwo units operating at h1gh power level)
Connections: 8" ASA flange,;
O&M costs; See atLacltt:c..l
Dudget Pric~. S 104,900
Price Includes: Freight to jnh~ir~, 1 0% "P"~~ ::.:o.d factory start-up assistance included.
Tcrm5: Nt:L 30, FOB fat:tory, freight allowed to job9ite Delivery approx. _12-16 wedcs after approval of submittals.

ro: Glenn Howard @ 303-445-6329 FrOI: Art Clemens (954)337-8108 Via efax.com Pg 3/15 02-06-01 10:30 AM 02/02/2001 11: 18 · 6063410350 AQUIONICS PAGE 03
Navajo Indian lrr., CO unit qty unit cost subtotal Total
Capital cost:
lnline 1250 each 2 $52,450.00 $104,900
O&M cost:
electricity kwh 11.4 $0.06 $5,992 lamps each 6 $575.00 $3,450 wiper rings each . 6 $25.00 $150 quartz sleeves each 2.00 $150.00 $300 sleeve seals each 2.00 $10.00 $20 labor hr 108 $20.00 $2,160
Annual O&M Total $12,072
O&M cost (50 years) % 50 0.05 $12,072 $220,432
Total cost (50 years) $~25,~~2
Assumptions:
1. Electricity costs are based on operation of one unit to treat ~ flow of 2.0 mgd at T1 0=85% and UV dose = 40 mj/cm2. Operate 6 lamps at 1.9 kw per lamp on average tor one year. 2. Based on 1. Above rfiiplace 6 lamps per year on average. 3. RepiCice quartz sleeves every 3 years or two {2) per year. 4. Replace wiper rings every 10,000 cycles or once per year. 5. Replace quartz sleeve seals with each quartz sleeve change. 6. Labor cost assumes four (4) hour per week for UV system maintenance. 7. 50 year cost of money@ 5% (18.26 multiplication factor).

ro: Glenn Howard @ 303-445-6329 02/02/2001 11:18
From: Art Clemens (954)337-8108 Via efax.com P9 4/15 02-06-01 10:30 AM 6063410350 AQUIONICS PAGE 04
AQUIONICS INC. 21KENTONLANDSROAD PHONE: 859-341-0710
ERLANGER, KY 41018 FAX: 859-341-0350
Quotation For:
Attention:
From:
Project:
PIIJ"3.l1leters:
Date: Quote No.
Art Clemens
Art Clemens ~.
Tina L. Masters, P.E. "")'
Navajo Indian Irrigation Project, CO
February 1, 2001 DW01-02-01A
Asrume _85_% transmission in a1cm light path at 253.7run
Flow Rate: 7.0 mgd per unit
Minimum UV Dose: 40 mJ/ cm2 (end oflamp life)
Inacr:tvatiort of: Cryptosporidium parvum: 2 to 4 log10 reduction based on animal infectivity Giardia: O.S log reduction
F.qnip.mmt Selection: Inline 5000 Units
Design:
Electrical:
Conncctio115:
O&Mcosts: '
Budget Pnce:
Options;
Terms:
Install .l ea. Model Inline 5000 medium pressure UV disinfection unit on the downstream side of each 7.0 mgd ~egmenr nfrh~ XP.nnn. lmjt. EAch \\nit will disinfec:t up to 7.0 msd as de5cribed to the required discharge level. Each unit consists of a stainless steel chamber containing one bank of 8 x 353SW medimn pressure UV lamps mounted horizontal and perpendicular to flow. The unit comes complete with an automatic quartz sleeve cleaning system, manual lamp power level control, UV monitor, and access hatch. Standard controls will be housed in one freestanding epoxy coated steel c:~binet per unit. Co.bincts nrc rated NTIMA 12, suitable for iJ1door insll!.llttliuu.
480V, 3-phase, 36Jc:W maximum connected load.
14" ASA flanges
See attached
S 88,200.00 per unit
Freight to jobsitc, 10% spares and factory start-up lill!!.i!ll<ul~~ indull~tl.
Net 30, FOB factory, frei~~:ht allowed tojobsite Delivery approx. _12-16_weeks after approval of submittals.

ro: Glenn Howard @ 303-445-6329 From: Art Clemens (954)337-8108 Via eFax.com Pg 5/15 02-06-01 10:30 AM 02/02/2001 11: 18 6063410350 AQUIONICS PAGE 05
Navajo Indian lrr., CO unit qty unit cost subtotal Total
Capital cost:
lnline 5000 each 1 $74,900.00 $74,900
O&M cost:
electricity kwh 28 $0.06 $14,717
lamps each - 8 $575.00 $4,600
wiper rings each 8 $25.00 $200
quartz sleeves each 2.67 $250.00 $667
sleeve seals each 2.67 $10.00 $27
labor hr 108 $20.00 $2,160
Annual O&M Total $22,370
O~M c:ost (50 years) % 50 0.05 $22,370 . $408,479
Total cost (50 years) $483,379
Assumptions:
1. Electricity costs are based on operation of 1 unit to treat a flow of 7.0 mgd at T1 0=85% and UV dose= 40 mj/cm2. Operate 8 lamps at 3.5kw per lamp on average for one year. 2. Based on 1.· Above replace 8 lamps per year on average. 3. Replace quartz sleeves every 3 years or 2.67 per year. 4. Replace wiper rings every 10,000 cycles or once per year. 5. Replace quartz sleeve seals with each quartz sleeve change. 6. Labor cost assumes four (4) hour per week for uv system maintenance. 7. 50 year coat of money @5% (18.26 multiplication factor).

ro: Glenn Howard @ 303-445-6329 02/02/2001 11:18
From: Art Clemens (954)337-8108 606341El35El
... . ) A(JUIONICS
AQUIONICS Via eFax.com P9 6/15 02-06-01 10:30 AM
PAGE El6
Spttelallsr Manufacturers of Water, Air and Surface Dl$infection Sy8tem•
SPECIFICATIOMf:; .. ...
TREATMENT CHAMBER
Model l.>rawing Number per system Material Dimensions:
Weight
Degree ofProtection
-length -diameter -dry -wet
Pressure rating . tost -operational
Opero.tion.nl water temperature Storage temperature Wlamp type Lamp lite Lamp voltage (IrulJI:,) Lamp current (max.) Number lamps per cham her Inlet/Outlet connections Cleaning mechanism ACCl063 Hlltoh .uv sen~or Tmtperature detector
POWER MODULE
Model Drawin2 Number per eystcm Material DimmBions · height
- Wi4th -depth
:Weight
Aqulonlca, Inc. P.O. Box 18395, Erlanger, KY 41018 Tel: (606) 34Hl110 Fax: (806) 341-()350
INLINE1250
: Inl.We 1250 :lNLNOSHA
= 1 : 316L stainless steel : SOOmm (19.68 in.) with ·access hatch : 273mm (1 U. 7 in.) : 70lcg (1$4lbs.) : 95kg (209lbs.) : IP54 (Nema 12) : 10 bar (150 psi) : 7 bar (100 psi) ; 0-45" c (32-113" F) :0-70° C (32-15&" F)
·: B2020 :8000 hrs : 23S Va~:. ! 11 A : 6 :8 in. ASA : anto-wipe :yes :yes :yes
: 2020HSC4 : C.l~TN12;C;Q : 1 : 316 Stainless Steel : 700mm (28 in.) : 820mm (32.5 in.) ; 340mm (13.5 in.) : 140kg (308 l'bs.)
-A-HALMA CROUP COMPAN'r
ro: Glenn Howard @ 303-445~6329
02/02/2001 11:18
From: Art Clemens (954)337-8108 · Via efax.com P9 7/15 02-06-'01 10:30 AM
··,
6063410350 AQUIONICS PAGE 07
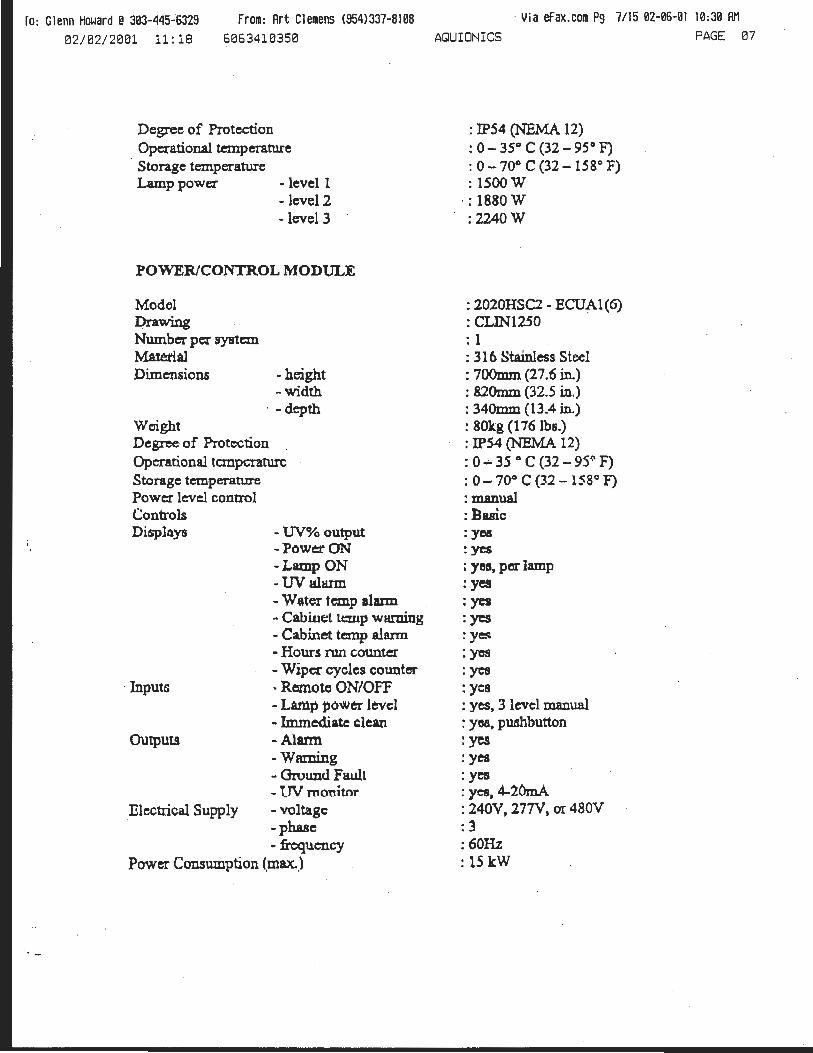
Degree of Protection Operational temperature
· Storage temperature Lamp power - level I
-level2 -level3
POWER/CONTROL MODULE
Model Dra . . wmg Number per system Material Dimensions
Weight
-height -width
. -depth
Degree of Protection Operational temperature Storage temperature Power level control Controls Displays
· Inputs
Outputs
- UV%output -Pow~ ON -Lamp ON - tN alarm -Water temp almD - Cabwel tt:mp warning - Cabinet temp alann ·Hours run counter - Wiper cycles counter • Remote ON/OFF - Lamp power level - Immediate clean - Alann -Warning - Ground Fa.ult - UV monitor
:mectrical Supply - voltage -phase - frequency
Power Consumption (max.)
: IP54 (NEMA 12) : 0- 35° C {32- 95° F) : 0-70° C (32 -158° F) : lSOOW .
. = 1880 w : 2240W
: 2020HSC2- ECUAl(G) : CLIN1250 : 1 : 316 Stainless Steel : 700mm (27.6 in.) : 820mm (32.5 in.) : 340mm (13.4 in.) : 80kg (176 lbs.) : IP54 (NEMA 12) : 0 ..- 35 ° C (32 - 95~ F) : 0- 70° C {32 - 158° F) :manual :Basic :yes :yes ; yes. per lamp :yes :yea :yes : ye,c; :yes :yes :yes : yes, 3 level manual : yea. pUBhbutton :yes :yes :yes : yes. 4-iOmA : 240V, 277V, or 480V : 3 :60Hz : 15kW

12. SERV'JCE
AREA
STUD, GROUNDING
.Hmi ' 1. DO ~T SCAL£ DRAWING
31.0"
2. Cl.H.RAHCE R£OUIRED FOR SERVICE AJ40 UAIIfTEt.lANCE or SYST£1.1 J. DlldEHStoHS SlJaJECT 10 CH.l.HG£
12. SERVICE
AREA 9.
, ....:
I All '"'•rYnctlcn oeniofn.d wflhln tN• ctrawfng t. the prcp.ny Dt J.q~Mttle~ trw... / ~ ~W 1 -.. .......... ._ 1 ·-.. ~ 1 Am ~11cHan mu"" t- tM ....,._. "'"'"'-- .. -'-'-· _, •-· .. __ , __ .__
....., 0
~ CD
~ g '- ::::t: ~ ~ tv cu '- .., tv C..
~ I'BI ...... w
f5 I
...... .bo
...... .J>o • • Cf1 ~§
(Q
(Jl
~.., (Jl ..,
w 0 J"- a ........ ~ ::c w.., U1 ....
~ ~
l> I<) c 1-1 0 z 1-1 [) Ul
I ~ ~ I
~ CS) co
c cu
~ ~ 0
~ .., 1.0
co ~ U1 CS) N
I CS) CTI
I CS)
-u -D ~ G) w fTl-
~ CD
~

,;
Power Module Control Module
• I J II e
~ l tBao-:-1 21.1 [YO) 27.1 (700]
• II II e f3 tbj
·DD ~ D D~J-~
L».7~)_J 1-----:su (azo)-----i
HCJT[5: I, OCWEifSJOHS AAt: IN INO£$ (WUJVmnl 2. lO. rR:OHT c:t.U.JWQ: JtlQlUfD rDI stRw:L .1. 12• Sot Cl.UJU,!K[ RECO:.AJ[}JO[D f~ ~ Fl.DW. 4. JtOIOYI.8U PUT£:5 ON II01TOW fOI1 CABLI Oilll't,
All lnfonnoflan c:onto\nod wHhln ...... dnni1ng ,. the pnlp.riy af Aqulonkl, m. An'( r1producflon mwt haw 1M prfar wrlt1en permlnfan af Aqulonk:a, Inc.
Tnla: PO'WIR AHO !Nl.M 1250
Standard ...... ow.-••am..&W ·-rw.-._,.,.,_
• •u.a
. -IMP· . .,.._.
Conirols
5II..A1M .... ••• ••• ·~~·-•• .._ l . .,.._. . . .._.
~
-- WQ- WI WI-
DDO ·
I -•-J
~
L C.lBIHrT U.YQUT
li\frill~ -m ~cptg'ffll' Rw. A
1250
_, 0
C')
nl lSI :::J
:::J tV ........ :I:
0 lSI ~ tV
........ .., tV c. lSI 1'111 lSI w .....
~ I ..... :t ..... U1 .. I ..... ~ m N
co
(Jl
lSI ..., (Jl .., w 0 ~ a ..... lSI :::0 w .., Ul <T
lSI ('")
a nl
i1l
m :e ~ -.1
I Q)
CS) Q)
l> £.) c H 0 z H 0 Ul
c co
~ co X
0 0 5I
""0 <.a
co ::::::. U1
~ I
CS) O'l
I CS)
\J CS) D G) ~ m ~
lSI LD

To : Glenn Howard @ 303-445-6329 From: Art Clemens (954)337-8108 Via eFax.com P9 10/15 02-06-01 10:31 AM 02/02/2001 11:18 6063410350 AQUIONICS PAGE 10
I I
~= 0 .. -;! ,.'!
! 8' ~
~ w
~ ~ ::11 :a i: .. a "'0
E
~j: ....:
i :i ~ ...
-... ~
~ I
~
I . .. ~ .. .. .. .. .. .. ....
ti ~
~l¢J¢¢<>l¢ I I ... ... .. ... • ~ ~ ~ ~ ~ ~ II
~ :1 = . s! . ~~ !j !j ~~ ... .... ... ~~
f I I
...... - :r ~ ~ I ~~~
.. .. .. .........
"' .... 1 ] ~ ~ ; I ; I .. .. JJ "'I'"" .. -~
lr- . t= = 2 • I t • • - ~ = '
D ll 11 a J I . ::; - - - - ~ = :: : : = a A ;&A ·~
·~;15~~~llltil"'IIC:S_.
lj.. "' "'
... ...
r:: ..- r.;- .r r-
- r- -"" - ~~ -.- ~ ::: !:1 !:1 I Q ~ : a :r :x ..,
1111 ~ !I! = = ~ ! ~ = !1 •
h i I
. --·· .. ,.
.....,
~ --~~-1;
~i iRi~ !;il
-
A ... ..
1 ~ !\' .. =
; ~~ ~ f a [;:
.!! l=
.. c -
l l ~ ~ ~ .. .. ... ...
0 :z
• ~

To: Glenn Howard @ 303-445-6329 02/02/2001 11:18
From: Art Clemens (954)337-8108 6063410350
AQUIONICS
AQUIONICS
Via eFax.com Pg 11/15 02-06-01 10:31 AM PAGE 11
Spm;ialist Manufacturers of Water, Air and SurlaetJ Disinfection Syst.ms
SPECIFICATIONS ...
TREATMENT CHAMBER
Model Drawing Number per system Material Dimensions: Weight
Degree ofProtection
-length -dry -wet
Pressure rating -test . - operational
Operational water temperature Storage temperature lN lamp type Lamp life Lamp voltage (max.) Lamp current (max.) Number lamps per chamber Inlet/Outlet connections Cleacing mechanism Access Hatch uv sensor T empcrature detector
POWER/CONTROL MODULE
Model Drawing Number per system Materia1 Dimensions
Weight
-height -width -depth
Degree of Protection Operational temperature
Aqulonlcs, Inc. P.O. Box 18395, Erlanger, KY 41018 Tel: (606) 341-0710 Fax: (606) 341-0350
INLINE 5000
: Inline 5000 :INLN14HA : 1 : 316L stainless steel : 755mm (29.72 in.) with access hatch : 120kg (264 lbs.) : 190kg (418 lbs.) : JPS4 (Nema 12) : 10 bar (150 psi) : 7 bar (1 00 psi) :0-45° C (32-113° F) : 0-70° C (32- 158° F) : B3535 : 8000 hrs :525 Vac. : 8.2A : 8 : 14 in. ASA :auto-wipe :yes :yes :yes
: 3535HSC8 : CLIN5000 : 1 : Epoxy coated steel : 2100mm (82.7 in.) : 800mm (31.5 in.) . : 800mm (31.5 in.) : 450kg (990 lbs.) : IP54 (NEMA 12) : 0- 35° C (32- 95° F)
-A-HALMA GROUP COMPANY

/
STUD, GftOUMOING . ~ ~
~ Q
~ e
HOlE; 1. DO NOT SCAU DRAWING 2. Cl..£ARANCE REQUIRED FOR SERVICE AND ~AINliHANCE Of SYSTE\1 .3. OlUENSIONS SUBJECT TO CHAHGE
All lrdArnwi&ft aarrlGh'ed wtftlln ttlt. drcrwiM b thtt £~raperty of Aqutonk:a Inc..
SERVICE AREA -----,r-
29.7"
30"
22.4"
~ro;.'&M ........ 4t lj
I : i -' lSI g N :::> ':I: lSI 0 N ~ ' .., N a. ~ C1D ...... w ~ I
...... .l>o
...... .l>o .. 'r
...... 0'1 rn~
<D
(J"I lSI (J"I ""T1 w .., """
0 • ...... lSI :D w .., U1 .... lSI n
a Cll
Ol co U1 e ~ -.J
I
~ CSI co
1> £) c I-f 0 z I-f 0 (f)
<: Cl
~ Cl X (") 0 a "'tJ I.Q
w ' U1
CSI N
I CSI 0'1
I
~
lJ CSI 1> G) (..)
fTI N
:D ::J: ......
w

--------- ---·- ----------------
To: Glenn Howard @ 303-445-6329 From: Art Clemens (954)337-8108 Via eFax.com Pg 12115 02-06-01 10:32 AM e21e2120e1 . 11:18 6e6341B35B AQUIONICS PAGE 12
Storage temperature Lamp power
Power level control Controls Displays
Inputs ·
Outputs
-levell -leve12 -lcvel3
- UV% outJ)ut -Power ON -Lamp ON -lN alann - Water temp alann - Cabinet temp warning - Cabinet temp alarin - Hours run counter - Wiper cycles counter -Remote ON/OFF - Lamp power level - Immediate clean -Alarm -Warning - Ground Fault - UV monitor
Electrical Supply - voltage -phase - frequency
Power Consumption (max.)
: 0-70° C (32- 158° F) : 2650W : 3100W : 3750W :manual :Basic :yes :yes : yes, per l8II1p :yes :yes :yes :yes :yes :yes :yes : yes, 3 level manual : yes, pushbutton :yes :yes :yes : yes, 4-20mA :480V : 3 :60Hz :36kW

fo : Glenn Howard @ 303-445-6329 From: Art Clemens (954)337-8108 Via eFax.com P9 Jq/J~ ~£-~b-~1 J~:~L Hn
El2/ El2/2001 11: 1,EI_ 6063410350 AQUIONICS PAGE 14
Cll I • .. · 0 ! I ' ..... "- !!!) EO - !···· c Jaalt a as• 0 • • • 0 . . . . ! (.)
ID "0 ssl ~ 0 dll "0 I
!~l! t: I !til 10 0 SIIS -· Vl • 0 ••• • • • •
~ :1 GO 0. 0 01 en
~c ~
.......... ..........
.ii ... ... c ~ .......... . (
~ oD
.s~ !:' 11.. iD
i ...
w~ !5 ;g -t ri ~ SO! t:J
::1 :;
~ c ••
~~~ )t } ~. 0
~ a
91 ~~ I !I; ~~ ~~~ ~~
-i· § ~-~ :t~ Ji
..:~,.( e;
i 1. .. {
"5 .: 'i
1 l
- .II ...... 8
~~~ j
E. • ... ! :3 '11
• £
I f •
~ .... 1 "' w: .!!!. l ~
_j J ...... I
l ~
' .......... ..

fo: Glenn Howard@ 303-445-6329 From: Art Clemens (954)337-8108 Via eFax.com P9 15/15 .02-06-01 10:32 AM 02/02/2001 11: 18 606341035El AQUIONICS PAGE 15
r•·
- . - w - • w w • w • • - • • •
- .. .. ... ... .. ... - ,_. . --------
~g- ~~ ~ ~ "1 • .. ""' ""' ~ = ~ ~ ~
• I U.! '"i: D< -s; ~-i o •
..!!' £ .5 . .IC .
~
l 1

SUPPORTING DOCUMENTATION FOR CAPITAL COSTS ESTIMATES

cooe·o..tzJo ESTIMATE WORKSHEET SHI!I!T 1 OF 1
FEATURE: 12-0ct-1001 PROJECT: NIIP Alternatives Navajo Gallup WSP
Moncisco Dam, Coury Lateral & Cutter Dam 2020 Demand (26.25 MGD) DIVISION:
Quantities for tanks, building and process pons for
2040 demand. All other quantities for 2020 demand FILE:
Includes Jicarilla Apache Nation Demand H:\08170\ESliSPREADSHICOPELANDINA V AJ()-.1\NIP·EST A. WK4
PLANT PAY UNIT
ACCT. ITEM DESCRlPTION CODE QUANTITY UNIT PRICE AMOUNT
1 Prefabricated Building with 20 foot high exterior wal D8230 27,200 SF $75.00 $2,040,000.00
includes 2, 700 square foot mezzanine.
2 Hollow Fiber UF Water Treatment System 27,640,000 GPD $0.46 $12,714,400.00
3 Concrete Reinforced tanks for UF System 1047 CY $400.00 $418,800.00
4 Concrete for Flocculation tank 310 CY $400.00 $124,000;00
5 Concrete for splitter box 50 CY $400.00 $20,000.00
6 Concrete for rapid mix tank 50 CY $400.00 $20,000.00
7 Ultraviolet Disinfection Units 5 EA $100,000.00 $500,000.00
8 Excavation of Clearwell 10800 CY $10.00 $108,000.00 .
9 Reinforced Concrete for Clearwell 1162 CY $400.00 $464,800.00
10 Backfill after Clearwell Construction 6327 CY . $15.00 $94,905.00
II Excavation for wastewater polishing ponds 8850 CY $8.00 $70,800.00
12 Mixers for Clearwell 6 EA $15,000.00 $90,000.00
13 Sediment Drying beds
Sand for Wastewater Polishing Ponds 125 CY $20.00 $2,500.00
14 Regional Operations and Maintenance Bldg 2,500 .00 SF $110.00 $275,000.00
Prefab, slab ongrade with 14 feet eves
15 45 mil Polypropylene Liner for Wastewater Ponds 35,500.00 SF $0.50 $17,750
Installation 35,500.00 SF $0.20 $7,100
Unlisted 30% (mixer for rapid mix tank, chlorinators, $5,100,000.00 / ammoniators, mise piping, blending studies, etc. )
Subtotal $22,068,05 5.00 /
Unlisted 10% (for DBP Treatment Systems at service points) $2,210,000.00
Construct and operate Pilot sytem for 12 consecutive months $200,000.00
TOTAL $24,478,055.00 /
QUANTITIES PRICES BY CHECKED BY CHECKED cJJP -z..~O\
Glenn Howard K. Copeland ,o-'
DATE PREPARED APPROVED DATE PRICE LEVEL
October 9, 2001 BY 12-0ct-2001

---------
. ESTIMATE WORKSHEET SHEET 1 OF 1
FEATURE: 11-0ct-2001 PROJECT: NIIP Alternatives Moncisco Dam, Coury Lateral & Cutter Dam Additional treatment units to DIVISION:
to upgrade the plant by 15.99 MGD for a total Production Rate of 43.63 MGD FILE:
Includes Jicarilla Apache Nation Demand H:\D8170\EST\SPREADSH\COPELAND\NA VAJ0-1\N1P-ESTA.WK4
PLANT PAY UNIT
ACCT ITEM DESCRlPTION CODE QUANTITY UNIT PRlCE AMOUNT
1 ZeeWeed Water Treatment System 15,990,000 MGD $0.46 $7,355,400 I
2 Ultraviolet Disinfection Units 2 EA $100,000 $200,000 /
Unlisted 5% $378,000.00 -
TOTAL $7,933,400.00
QUANTITIES PRICES BY BY CHECKED /fco/IifvJ Glenn Howard K. Copeland
DATE PREPARED APPROVED DATE PRICE LEVEL ·
October 9, 2001 BY 11-0ct-2001

coce·a .. nlo ESTIMA IE WORKSHEET SHE!T 1 OF 1
FEATURE: ll-Oct-ZOO I PROJECT: Navajo Gallup WSP
SJR PNM Alternative 2020 Demand (23.89 MGD) DIVISION: Quantities for tanks, buildings, and process ponds for
2040 demand. All other quantities for 2020 demand FILE:
H:IDH 170\ESl\SPREADSHICO PELANDINA Y AJQ-1\PMN-ESTF. WK4
PLANT PAY UNIT
ACCT. ITEM DESCRIPTION CODE QUANTITY UNIT PRICE AMOUNT
I Prefabricated Building with 20 foot high exterior wa ~8230 27 ,200 SF $75 .00 $2,040,000.00
includes 2.700 SF of Mezzanine
2 ZeeWeed Water Treatment System 23 ,890,000 .00 GPD $0.42 $10,033,800
3 Concrete Reinforced tanks for ZeeWeed Systems 1047 CY $400.00 $418,800
4 Concrete Flocculation tank 198 CY $400.00 $79,200
5 Concrete for Splitter Tank 50 CY $400.00 $20,000 6 Concrete for rapid mix tank 50 CY $400.00 $20,000
7 Ultraviolet Disinfection Units 5 EA $88,200.00 $441 ,000
8 Excavation of Clearwell 7700 CY SIO.OO $77,000
9 Backfill around clearwell after construction 2900 CY $15 .00 $43,500
10 Construction of Clearwell 1053 CY $400.00 $421,200
II Excavation for wastewater treatment ponds 8570 CY $8.00 $68,560
12 Excavation for settling ponds 53,000 CY $6.00 $318,000
13 Clear Well !Vtixers 6 Ea $15,000.00 $90,000
14 Sediment Drying Beds
Gravel 20,400 CY $20.00 $408,000
Sand for Settling Pond Sediment 10,200 CY $15.00 $153,000
Concrete for sides 84 CY $400.00 $33,600
4-inch PVC perforated pipe 25,000 LF $6.00 $150,000
15 Regional Operations and Maintenance Bldg 2,500.00 SF $110.00 $275,000.00
Prefab, slab on grade with 14 feet eves
16 45 mil Polypropylene Liner for Wastewater Ponds 34,500.00 SF $0.50 s 17,250
Installation 34,500.00 SF $0.20 $6,900
17 6-inch thick reinforced concrete liner lor settling po ds 4100 CY $150.00 $615,000
Unlisted 30% (mixer for rapid mix tank, chlorinator , $4,720,000.00 ./
ammoniillors, mise piping, blending studies, etc.)
i---Subtotal $20,449,810.00
Unlisted 10% (for DBP Treatment Systems at servic 'points) $2,040,000.00
Construct and oiJ_erate Pilot sytem for 12 consecutiv months $200,000.00
. TOTAL $22,689,810.00
QUANTITIES PRICES BY CHECKED BY CHECKEd f/O_t-z...-0\ Glenn How:ard BY K. Copeland
DATE PREPARED APPROVED DATE PRICE LEVEL
October 9. 200 I ll-Oct-ZOO I

COOE·O 8230 ESTIMATE WORKSHEET SHEET 1 OF 1
FEATURE: 11-0ct-2001 PROJECT:
SJR PNM Alternative Additional treatmept units to DIVISION:
upgrade the plant by 14.36 MGD with a total capacity of 38.25 MGD FILE:
H:\08170\EST\SPREADSH\COPELAND\NA V AJ0-1 \PMN-ESTF. W K~
PLANT PAY UNIT
ACCT. ITEM DESCRlPT!ON CODE QUANTITY UNIT PRlCE AMOUNT
1 ZeeWeed Water Treatment System 14,360,000 $0.46 $6,605,600
2 Ultraviolet Disinfection Units 2 $100,000 $200,000
Unlisted 5% $340,000
TOTAL $7,145,600.00
QUANTITIES PRICES BY Checked BY CHECKED o!f/ !o(fl /o 1 Glenn Howard BY K. Copeland
DATE PREPARED APPROVED DATE PRICE LEVEL
October 9, 2001 11-0ct-200 I

cooe·o a2Jo .. ESTIMATE WORKSHEET SHEET 1 OF 1
FEATURE: 12-0ct-2001 PROJECT: Navajo Gallup WSP
San Juan Alternative Cutter Diversion Quantities for tanks, building and process ponds for DIVISION:
2040 demand. All other quantities for 2020 demand
Includes Jicarilla Apache Nation Demand FILE: H:\08170\ESi\SPREADSH\COPELAND\NA V AJ()-.1\ClJT-ESTA.WK4
PLANT PAY UNIT
ACCT. ITEM DESCRIPTION CODE QUANTITY UNIT .PRICE AMOUNT
I Prefabricated Building 08230 4,600 SF $90.00 $414,000
2 ZeeWeed Water Treatment System 3,740,000 GPO $0.70 $2,618,000
3 Concrete Reinforced tanks for ZeeWeed Systems 110 CY $500 $55,000
4 Concrete Flocculation tank 61 CY $500 $30,500
5 Reinforced Concrete for Splitter Tank 20 CY $500 $10,000
6 Reinforced Concrete for Rapid mix tank 20 CY $500 $10,000
7 Ultraviolet Disinfection Units Model 1250 3 Ea $120,000 $360,000
8 Excavation of Clearwell 1,820 CY $10 $18,200
9 Backfill around clearwell after construction 1,270 CY $15 $19,050
10 Reinforced concrete for clearwell 213 CY $500 $106,500
II Excavation of Wastewater Polishing Ponds 2, 100 CY $9 $18,900
12 Mixers for ClearWell 6 Ea $15,000 $90,000
13 Sediment Drying Beds
Sand for Wastewater Polis_hing Ponds 25 CY $20 $500 - ·
14 Regional Operations and Maintenance Bldg 2,500.00 SF $110.00 $275,000.00
Prefab, slab on grade with 14 feet eves
15 45 mil Polypropylene Liner for Wastewater Ponds 11,500.00 SF $0.50 $5 ,750
Installation 11,500.00 SF $0.20 $2,300 -
Unlisted 30% (mixer for rapid mix tank, chlorinators, $1 ,210,000.00 / ammoniators, mise piping, blending studies, etc. )
Subtotal $5,243 ,700.00 I
Unlisted 10% (for DBP Treatment Systems at service points) $520,000.00
Construct and operate Pilot sytem for 12 consecutive months $200,000.00
TOTAL $5,963,700.00 /
QUANTITIES PRICES BY CHECKED BY CHECKED cA f to-\L-~o' Glenn Howard K. Copeland
DATE PREPARED APPROVED DATE PRICE LEVEL
October 9, 2001 BY 12-0ct-2001

COOE·D-8230 ESTIMATE WORKSHEET SHEET 1 OF 1
FEATURE: 11-0ct-2001 PROJECT:
San Juan Alternative Cutter Diversion Additional treatment units to upgrade the treatment DIVISION:
plant by 1.65 MGD to a total capacity of 5.39 MGD
Includes Jicarilla Apache Nation Demand FILE:
H:\D8170\EST\SPREADSH\COPELAND\NA VAJ0-1\CUT -ESTA.WK4
PLANT PAY UNIT
ACCT. ITEM DESCRIPTION CODE QUANTITY UNIT PRICE AMOUNT
I ZeeWeed Water Treatment System I ,650,000.00 GPD $0.70 $1,155,000.00
Unlisted 5% $58,000.00 /
TOTAL $1,213,000.00 /
QUANTITIES PRICES BY BY CHECKED
~f ro( I I )o I Glenn Howard K. Copeland
DATE PREPARED APPROVED DATE PRICE LEVEL
October 9, 2001 BY 11-0ct-2001

cooe·o.a2Jo ESTIMATE WORKSHEET SHEET 1 OF 1
FEATURE: 12-0ct-200 I PROJECT: Navajo Gallup WSP
SJR Infiltration Alternative 2020 Demand (23.89 MGD) DIVISION:
Quantities for tanks, building and process ponds for 2040 demand. All other quantities for 2020 demand FILE:
H:ID81701ESTISPREADSHICOPE LANDIN A VAJ0-1 \SJR-ESTF. W K4
PLANT PAY UNIT
ACCT. ITEM DESCRIPTION CODE QUANTITY UNIT PRICE AMOUNT
I Prefabricated Building with 20 foot high exterior wal :08230 27,200 SF $75.00 $2,040,000.00 includes 2. 700 SF of Mezzanine
2 ZeeWeed Water Treatment System 23,890,000.00 GPD $0.46 $10,989,400.00
3 Concrete Reinforced tanks for ZeeWeed Systems 1047 CY $400.00 $418,800.00
4 Concrete Flocculation tank 198 CY $400.00 $79,200.00
5 Concrete for Splitter Tank 50 CY $400.00 $20,000.00
6 Concrete for rapid mix tank 50 CY $400.00 $20,000.00
7 Ultraviolet Disinfection Units 5 EA $100,000.00 $500,000.00
8 Excavation ofC!earwell 7700 CY $10.00 $77,000.00
9 Backfill around clearwell after construction 2900 CY $15.00 $43,500.00
10 Construction of Clearwell 1053 CY $400.00 $421,200.00
II Excavation for wastewater treatment ponds 8570 CY $8.00 $68,560.00
12 Clear Well Mixers 6 Ea . $15,000.00 $90,000.00
13 Sediment Drying Beds
Sand for Wastewater Polishing Ponds Sediment 125 CY $15.00 $1,875.00
14 Regional Operations and Maintenance Bldg 2,500.00 SF $110.00 $275,000.00
Prefab, slab on grade with 14 feet eves
15 45 mil Polypropylene Liner for Wastewater Ponds 34,500.00 SF $0.50 $17,250
Installation 34,500.00 SF $0.20 $6,900
Unlisted 30% (mixer for rapid mix tank, chlorinators, $4,520,000.00 ./ ammoniators, mise piping, blending studies, etc. )
Subtotal $19,588,685.00
Unlisted 10% (for DBP Treatment Systems at service po ints) · $1,960,000.00
Construct and operate Pilot sytem for 12 consecutive months $200,000 .00
TOTAL $21 '7 48,685.00
QUANTITIES PRICES BY CHECKED BY CHECKED
~f 1'2- ~o \ Glenn Howard BY K. Copeland
JiJ-
DATE PREPARED APPROVED DATE PRICE LEVEL
October 9, 200 I 12-0ct-200 I

coce·c a2Jo ESTIMATE WORKSHEET SHEET 1 OF 1
FEATURE: 11-0ct-2001 PROJECT:
SJR Infiltration Alternative Additional treatment units to DIVISION:
upgrade the plant by 14.36 MGD with a total capacity of 38.25 MGD FILE:
H:\D81 70\EST\SPREAOSH\COPELANDINA V AJQ-.1 \SJR-ESTF. WK4
PLANT PAY UNIT
ACCT. ITEM DESCRIPTION CODE QUANTITY UNIT PRICE AMOUNT
1 ZeeWeed Water Treatment System 14,360,000 $0.46 $6,605,600.00
2 Ultraviolet Disinfection Units 2 $100,000 $200,000.00
Unlisted 5% $340,000.00
TOTAL $7,145,600.00
QUANTITIES PRICES BY CHECKED BY
CHECKED rJ.. flo Ill\ D\ Glenn Howard BY K. Copeland
DATE PREPARED APPROVED DATE PRICE LEVEL
October 9, 2001 11-0ct-200 I

SUPPORTING DOCUMENTATION ON ESTIMATED CAPITAL COST QUANTITIES

rtear 2040 2020
Year
2040 2020
2040 2020
Navajo- Gallup Water Supply Project
Treatment Process Calculations UF units and Clearwell
Treatment Process Calculations with J. Apache Demands 11-0ct-<>1
Assumptions 1. Production rate per cassette is approximately 200,000 GPO with 4 cassettes per module for NIIP and San Jaun Plants 2. Production rate per cassette is approximately 200,000 GPO for the Cutter treatment plant. 3. 6 hours of detention in settling pond will be adequate for Jan Juan River
after the PMN diversion structure. 4. Clear well detention time is 30 minutes with a depth of 10 ' deep
Options
NIIP Alternatives- Moncisco, Coury Lateral & Cutter I Water Quality Constant Turbidity, TOC higher than source water Treatment Scheme - Enhanced coagulation Ultrafiltration - NH2CI
Demand MGO Size SP number of cassestts Groups of 4 Clear Well size -acres 43.63 NR 218.15 54.54 0.28 27.64 NR 138.20 34.55 0.18
San Juan Alternative •
Source 1 San Juan River Water Quality- Periods of High Turbidity. High TOC, Potential for Crypto Treatment- Enhanced Coagulation- Ultrfiltration- NH2CI
OemandMGO Size SP (MG) number of cassettes Groups of 4 Clear Well size-acres 38.25 9.56 191.25 47.81 0.24 23.89 5.97 119.45 29.86 0.15
Source 2 Cutter Reservoir in San Juan Alternative Water Quality - Constant turbidity - low turbidity
Demand MGO Size SP (MG) number of cassettes Clear Well size-acres 5.39 NR 26.95 0.03 3.74 NR 18.70 0.02
CWS.A CW length SF width of l 60'
12152 203
CW S.A. CW length SF width if l 60' 10653.41 178
CWSA CW length SF width of l 60' 1501.225 25
• San Juan alternative includes treatment plants at PNM and the San Juan treatment plant with a infiltration intake. ** Demand by Jicarilla Apache from Moncisco and Cutter is 1.39 MGD for 2020 and 2040 CW Clearwell
(file: designfowsr3.xls)
Volume Gallons
908,958
Volume Gallons
796,875
Volume Gallons
112,292

Navajo-Gallup WSP Calculations- Concrete Quantities Reinforced concrete 912312001 lncl J. Apache demands
Assumptions
Concrete Volumes
1. Tanks for hollow fiber membranes will be constructed for final build-out 2. Equalization tanks will be constructed for final build-out 3. Hollow Fiber tanks height 10 feet with includes 1 feet of freeboard
All other tanks have height of 12 feet with 2 feet of freeboard 4. Thickness of all concrete 1 foot 5. All quantities for PNM are the same for the San Juan WTP with infiltration intakes
Tanks for hollow fiber treatment trains NIIP Alternatives PNM Cutter •
Lenath (ft) 91 91 25 Width (ft) 20 20 10 Heioht (ft) 10 10 10 CY per tank 150 150 35 #tanks 7 7 3 Total CY 1,047 1,047 106
Floccualton Tanks NIIP Alternatives PNM Cutter •
Length(ft) 45 33 14 Width(ft) 45 33 13 Heiaht(ft) 12 12 12 CY per tank 155 99 31 #tanks 2 2 2 Total CY 310 198 61
Buildino slab -minus the tanks NIIP Alternatives I piping area tank area 2nd floor Length 185 122 122 Width 30 24 24 CY 206 108 108 CYtotal 422
PNM I piping area tank area 2nd floor Length 185 122 122 Width 30 24 24 CY 206 108 108 CYtotal 422
Clearwell N II P Alternatives PNM Cutter •
Length(ft) 202 182 100 Width(ft) 62 62 15 Height(ft) 12 12 12 CY per tank 1162 1053 213 #tanks 1 1 1 Total Concrete 1,162 1,053 213
Rapid Mix Tank and Splitter Box NIIP Alternatives PNM Cutter •
Length(ft) 20 20 8 Width(ft) 20 20 8 Height(ft) 12 12 12 CY per tank 50 50 17 #tanks 1 1 1 Total CY 50 50 17
* Cutter Diversion in San Juan River Alternatives
(!ile:concrete calcsr3.xls)

Flocculation Tank Calculations
Design of Flocculation tanks- GH- 10/11/01 w J Apache Demand
Design Criteria 1 Flocculation basin split into with 5 minutes detention time each 2. Water depth 1 0 ft 3.Rapid mix detention time 40 seconds
Floc tank NIIP * Demand volume (gal) area (sf) L w
2040 43.63 302,986 4067 90 2020 27.64 191,944 2576 72
Floc tank PNM- Demand volume (gal) area (sf) L w
2040 38.25 265,625 3565 84 2020 23.89 165,903 2227 67
Floc tank Cutter*- Demand volume (gal) area (sf) L w
2040 5.39 26,201 352 27 2020 3.74 18,181 244 22
* For all NIIP alternatives, Moncisco, Coury Lateral and Cutter - For both San Juan alternatives, PNM and Infiltration Intake ._ Cutter Diversion in San Juan alternatives (Hocc basinr3.xls)
Rapid Mix Vol (gal}
45 20,981 36 16,700
Rapid Mix Vol (gal)
42 19,645 33 15,526
Rapid Mix Vol (gal)
13 6,170 11 5,140
area (sf) LxW 282 17 224 15
area (sf) LxW 264 16 208 14
area (sf) LxW 83 9 69 8

NIIP Chemical Disinfection Caclulatons
Design Calculations -1 0/11/01 GLHJ Chlorimination System- With J. Apache Demands Navajo Gallup Water Supply Project NIPP attematives - Moncisco, Coury Lateral and Cutter
Assumptions Chlorine injection rate of 1 ppm (demand of .5 ppm residual of .5 ppm) Ammonia Demand .33 ppm (chlorine to ammonia ration 3:1) pH of treated water 7.0 to 7.5 No ammonia in water after filtration All disenfection CT requirements provided by UV units
Requirements Determine chlorine and ammonia usage rates size chorine and ammonia storage and injection system.
Cales
NH3 d CL2 an usage ra es
Year Demand (MGD) NH3 dosage Rate NH3 DailyUse NH3 Monthly Use .. Cl2 dosage rate !(ppm) lppd Tons !(ppm)
2020 27.64 0.33 76.07 1.14 1 2040 43.63 0.33 120.08 1.80 1
Room size
Assumptions Store 2 months supply of chlorine and ammonia canisters Use 2 parallel parallel trains, 8 feet in width, 3' centers, empty set of trunions provided.
Ammoma - Design
Year Used/mo Stand by Total Space Require Total# of trunions 2020 1.5 1.5 3 144 6 2040 2 2 4 192 8
Ch . D . lonne- es1gn
Year Usedlmo Stand by Total Space Require Total# of trunions 2020 4 4 8 384 16 2040 6 6 12 576 24
(file:NIIP disent calcsr3.xls)
References Handbook of Chlorination
Cl2 daily Use Cl2 Monthly use PPD Tons
230.52 3.46 363.87 5.46

San Juan Alternatives
Chemical Disinfection Calculations
Design Calculations -9/24101 GLHJ Chloramination System with J Apache Demands Navajo Gallup Water Supply Project San Juan Alternatives, PNM and Infiltration Intakes
Assumptions Chlorine injection rate of 1 ppm (demand of .5 ppm residual of .5 ppm) Ammonia Demand .33 ppm (chlorine to ammonia ration 3:1) pH of treated water 7.0 to 7.5 No ammonia in water after filtration All disinfection CT requirements provided by UV units
Requirements Determine chlorine and ammonia usage rates size chorine and ammonia storage and injection system.
Cales
NH3 d CL2 an usage ra es
!Year Demand (MGD) NH3 dosage Rate NH3 Daily Use NH3 Monthly Use Cl2 dosage rate (ppm) ppd Tons !(ppm)
2020 23.89 0.33 65.75 0.99 1 2040 38.25 0.33 105.27 1.58 1
Room size
Assumptions Store 2 months supply of chlorine and ammonia canisters Use 2 parallel parallel trains, 8 feet in width, 3' centers, empty set of trunions provided.
A mmoma - Design Year Used/mo Stand by Total Space Require Total# oftrunions
2020 1.5 1.5 3 144 6 2040 2 2 4 192 8
Chlorine- D esign
!Year Used/mo Stand by Total Space Require Total# of trunions 2020 4 4 8 384 16 2040 6 6 12 576 24
(file:SJ disenf calcs r3.xls)
References Handbook of Chlorination
Cl2 daily Use Cl2 Monthly use PPD Tons
199.24 2.99 319.01 4.79

Cuttter Diversion Chemical Disinfection Calculations
Design Calculations -9/24101 GLHJ Chlorimination System - Witth J. Apache Demands Navajo Gallup Water Supply Project Cutter diversion in San Juan Alternative
Assumptions Chlorine injection rate of 1 ppm (demand of .5 ppm residual of .5 ppm) Ammonia Demand .33 ppm (chlorine to ammonia ration 3:1) pH of treated water 7.0 to 7.5 No ammonia in water after filtration All disenfection CT requirements provided by UV units
Requirements Determine chlorine and ammonia usage rates size chorine and ammonia storage and injection system.
Cales
NH3 d Cl2 an usage ra es
[Year Demand (MGD) N H3 dosage Rate NH3 Daily Use NH3 Monthly Use Cl2 dosage rate '(ppm) ppd tons/month !(ppm)
2020 3.74 0.33 10.29 0.15 1 2040 5.39 0.33 14.83 0.22 1
Room size
Assumptions Store 2 months supply of chlorine and ammonia canisters Use 2 parallel parallel trains, 8 feet in width, 3' centers, empty set of trunions provided.
A D . mmoma- es1gn
Year Used/mo Stand by Total Space Require Total# of trunions 2020 0.47 1 1.47 70.46 2.94 2040 0.67 1 1.67 80.37 3.35
Chlorine - Design
Year Used/mo Stand by Total Space Require Total# of trunions 2020 0.47 1 1.47 70.46 2.94 2040 0.67 1 1.67 80.37 3.35
(file: cut disenf calcst3.xls)
References Handbook of Chlorination
Cl2dailyUse Cl2 Monthly use PPD Tons
31 .19 0.47 44.95 0.67

Navajo Gallup WSS WTP Pond Liner Requirements
11-0ct-01
Assumptions Quantities for liner will be determined
Liner Quantities Water Treatment Plants
Process Ponds
Costs will include the cost of the liner and installation cost Cost for liner subgrade will be included in unlisted items Liner will be exposed - Actual design may include some form of liner protection from damage
due to ice formation Single Pond
Alternative Type of Pond Bot Length Bot Width Depth Slope S.F. Liner NIIP Moncisco Wastewater 160 60 10 1to 1 17,625 NIIP Cory Lateral Wastewater 160 60 10 1to 1 17,625 NIIP Cutter Wastewater 160 60 10 1to 1 17,625 PNM Wastewater 155 60 10 1to 1 17,139 PNM Settling 360 180 12 1to 1 see note SJ Infiltration Wastewater 155 60 10 1to 1 17,139 SJ Alt Cutter Wastewater 80 25 10 1to 1 5,687
Note: Liner for PNM settling ponds will be six inch reinforced concrete with a surface area of approximately 92,000 square feet per pond.
Both Ponds S.F. liner
35,250 35,250 35,250 34,278
see note 34,278 11,374

Year 2040 2020
2040 2020
2040 2020
Navajo- Gallup Water Supply Project Wastewater Flows Includes J. Apache Demands
5-0ct-01
Assumptions
1. Total of 6 hours detention time, 2 pOnds pOlishing pOnds or wastewater treatment ponds in series each with 3 hours of detention time
2. Length to width ratio 2:1 3. Side slopes 1 :1 4. Wastewater Estimate = BW production which is estimate which is 10 percent of incoming flow
Options
NIIP Alternatives - Moncisco Dam, Coury Lateral and Cutter Water Quality- Water Constant Turbidity, TOC higher than source water I Treatment Scheme" Enhanced coa~ ulation- MF - UF- NH3- chlorine
Per pOnd per pond
Demand MGD BWWaterMGD Flow rate gpm Total volume gals VolumePP area 43.63 4.36 3,030 1,090,750 545,375 7,291 27.64 2.76 1 919 691,000 345,500 4,619
San Juan Alternatives
Source 1 San Jauan River PNM and Infiltration Water Quality- Periods of High Turbidity. High TOC, Potential for Crypto Treatment- Enhanced Coagulation- MF- UF - NH3- Chlorine
Demand MGD BWWaterMGD Flow rate gpm Pond size for DT E Volume pp• area 38.25 3.83 2656.25 956,250 478,125 6392 23.89 2.39 1659.03 597,250 298,625 3992
Source 2 Cutter Reservoir Water Quality - Constant turbidity - Low turbidity_
Demand MGD BWWaterMGD Flow rate gpm Pond size for DT E Volume pp• area 5.39 0.54 374.31 134,750 67,375 901 3.74 0.37 259.72 93,500 46,750 625
• PP- Polishing or wastewater treatment ponds (gallons)
per pOnd per pOnd SA (acres)
width length each 80 181 0.33 68 156 0.24
SA (acres width length each
77 173 0.30 65 149 0.22
SA(acres width length each
41 102 0.097 38 95 0.082

Wastewater Polishing Ponds and Polishing Pond Drying Beds
Volume Calculations Polishing Pond Excavation and Sediment Drying Bed Size and Sand Requirements 10/11/2001 Includes j. Apache
Assumptions and Notes A. Polishing Ponds to treat backwash water and other wastes before being recycled
to the treatment system. B. Sediment taken from the PNM polishing pond will be conveyed to the drying beds
for the sediment removed from the settling ponds.
1 Wastewater Settling Ponds Excavation Quantities Site Top Width Top Lengt Depth Slope Bottom W Bottom L NIIP * 180 80 10 1 to 1 160 60 San Juan** 175 80 10 155 60 Cutter*** 100 42 10 80 22
2 Sediment Excavation Quantities .. Site Top Width Top Lengt Depth Slope Bottom W Bottom L NIIP* 164 64 2 1 to 1 160 60 SJ Alt ** 159 64 2 155 60 Cutter*** 84 24 2 80 20
Vol CYea 4415 4285 1071
Volume CY 744 721 134
total Vol 8829 8570 2143
1488 1442 267
Design criteria - Dewater, Drain and excavate solids when the depth of solids is approximately 2 feet deep,
3. Drying bed Quantities Drying Bed L w Sand Volume (CY) NIIP * 167 40 124 SJ Infiltration 162 40 120 Cutter ••• 60 20 22 Design assumes 4 inches of sediment will be spread across drying bed 6 inches of sand used for drying will be replaced after unloading bed
Notes: * NIIP Alternatives including Moncisco, Coury Lateral and Cutter ** San Juan Alternatives including PNM and San Jaun with Infiltration Intake ••• Cutter Diversion in San Juan Alternatives No separate drying beds for PNM Alternative as drying beds for Settling
ponds will also be used for sediment from polishing ponds
(file: PP and PP drying bedsr3.xls)

PNM Settling Pond Size, Excavation, Sediment
Navajo- Gallup Water Supply Project Settling Pond Calculations
15-Aug-01
Assumptions
1. Total of 6 hours detention time, 2 ponds In series each with 3 hour detention time 2. Length to width ratio 2:1 3. Side slopes 1:1 with a finished depth of 10 feet with 2 feet freeboard 4. Ponds sized for 2040 demand
Excavation Quantities per pond I Bottom width I Bottom Length Top Width Top Length Depth
Year !(feet) !(feet) feet) feet) l(feet) 20401 1791 358 203 382
-- - - ----------------
I I I Volume of solids in each pond When sediment depth is 2 feet.
12
Bottom W I Bottom L ISedimentW Sediment L deoth of sediment Volume
I I CY 1791 3581 183 362 2 4,815
Drying Bed Requirement
Bed size based on a length to width ratio of 2:1 Bed will consist of 12 Inches of gravel with underdrain piping system followed by 6 inches of sand. It will be assumed that 2 Inches of sand will be removed with the dry sediment. Approximately 6-lnches of excavated sediment will be spread on top of the bed for drying. Primary and secondary pond will be switched after cleaning.
Two drying beds will be provided each with a drying area of approximately 260,000 square feet (5.97acres). The sediment generated during the cleaning of one pond will produce a layer from 5 to 6 Inches thick. A combination of draining and evaporation will produce a dried sediment layer between 2.5 and 3.0 Inches that will be removed and disposed of along with any sand that is excavated with the dried sediment.
One drying bed will be used, with one on standby.
file: pnm SP calcs revised.xls
One pond Both VolumeC CY
31_,38~ ______§_2, 777
(

SUPPORTING DOCUMENTATION ON ANNUAL OPERATION COST ESTIMATES.

Navajo Gallup Water Supply Project - October 11 , 2001
ANNUAL POWER COSTS NTUA
Operation and Maintenance Calculations -Revised to Include J Apache
Power Consumption Calculations usintg NTUA Power
Assumptions
1 Power Consumption prOIIided by Zenon for the ultrafiltration system and Aquionics for ultraviolet disinfection units. These costs will be prorated for each demand and each treatment plant
2 't<MI usage for inftuent pumps and recycle pumps will be calculated based on now and head
3 Miscellaneous power will be included in a safety factor of 1% of the total of 1 and 2 above
4 Electrical Supply requirement 480V 3 phase
5 Power costs are based on operating at an average daily flow (design ftow /1 .3) for 24 hours a day.
-UMgepwMGO
Rated Flow (MGO)
1.Uh~syol.,.,.
20.2
- 2020
2040
2020
2040
2020
2040
2020
2040
2020
2040
2 Uhvlolet Oisintedion Lllits
(Wirilc..,...,..28KW""-'l
3. lnlako o;v.,;on ......,.
4 . Pln1ps from PNM Setttna Pond
4 Roc:ydo ......,. from WIN ponds
Eltimotod cost of power NTUA
Demond Chorgo (""'"-~)
INn-J Estimated ConSU1'4ltion Por Atomollve
Plonl
NIIP Monc:isco .nd Cl.Ctw
NIIP C041'f Latn
SJR PNM
CLtter Qiwrsion
SRJintihtion•
• Does - power conSU1'4ltion by lhe R""""'f inloko system.
N:JF -A--ge doily flow
7
1
1
1
Head
KWH KW
Desl!11
30
30
30
Flow(MGO)
27.64
43.63
27.64
43.63
23.69
38.25
3.74
5.39
23.89
38.25
'rf.Yol.«/fJay
7475
672
147
147
147
$0.0185
$111o1 .80
Avenge
Flow(MGO)
21 .26
33.56
21 .26
33.56
18.38
29.42
2.88
4.15
18.38
29.42
Bocla4> gonentors ore rwq.ited 111 .. en WTP plontlo "'-"PPY power llllhe overage doily now. Electl'ic* UMQe and costs are based on avenge wat« demands
to.Mioy/MGO KW
370 638
96.0 28
147 6.1
147 6.1
147 6.1
KW-IY/dov AmuoiKW-IY
13.038 4,758.831
20.580 7 ,511 .860
16.167 5.900.903
25.520 9,314.631
16,678 6.087.434
26.703 9,746.519
1.764 643,923
2.542 928,007
11 .269 4 .113.187
18,043 6 ,585.575
KWIMGO S<uce
31 .6 Zenon
4.0 ~aries
8.1 Cole
6.1 Cole:
6.1 Cole
Energy Oomand Oomand Tolol
Mise Costs KW Costs
47 ,588 $88,919 887 5163.908 5252.827
75.119 5140.359 1.400 $258,730 $399.089
59.009 $110.256 887 $163.908 $274.166
93,146 5174.044 1.400 $258,730 S432.n4
60.874 $113,744 992 $183,319 $297,062
97.465 5182,114 1,588 $293.509 $475.623
6.439 512.032 120 $22,179 $34.210
9.280 517.340 224 $41 .360 556,700
41 .132 575.855 767 $141.670 $218.525
65.856 5123.051 1.227 $226,826 5349.878

N ....... Golklp Wolw ~Project· Ocl-11, 2001
a.--one~ Moirt-~. -ROIIIMdtolncUioJApacho
-~~uointgCRSPP"""'
1 Poww C~ pnMdod by Zenon fO<the '*'"ftlration system ond
,oqiorics fO< lllnNi- clsinledion lrils. TheM c:...u l!il be proroted
fO< nell donwld ond """"-plot(. 2 ~ IAOge fO<- IQ11IS ond recycle 1Q111S 'Oil be -ed based
onftowondhMd
ANNUAL POWER COSTS CRSP
3 ---be lncblod in 1 safety factO< of 1% of the totll of 1 ond 2 -4 Eloctricol ~ rwqiOrwnont 480113 phase
5 -cools.,. bllld on _.ana o1111 avwage daily ftow (doslgn flow /1 .3) fO< 24 holn a cloy.
p.,...,. IAOOO per MGO
. ., 2020
2040
2020
2040
2020
2040
2020
2040
2020
2040
Roled Flow (MGO)
1. UlnftlniHon systems
2 UlnlloO- Oioinfection .nts
(W lril consumes 24 ~Aiou')
3. lruke Oivenion IQ11IS
4. F'l.n1)s from PNM Seltlnc;l Pond
4 Rocydo ~·from WW ponds
.,_od coot of-from CRSP
o.n.nd Charge (II'RIOI)
~ Eotimlllod Consunptlon Pot' Alernotivo
Ptont NIIP Monc:isco and Cr..tter
NIIP Coury latonol
SJR PNM
Cliler Oivenion
SRJ lnfilntlon•
• Does incble- consunptlon by the Rameylntll<o system.
Notn
AOF • Avwage daily flow
20.2
7
1
1
1
Head
KWH
~
Onion
30
30
30
Flow(MGO)
27.64
43.63
27.64
43.63
23.89
38.25
3.74
5.39
23.89
38.25
Bac1o4J _.t.,.. 110 re(JMod ol each WTP p4ont to 5l.tpply power o1 the avot11ge daily flow.
Eloctricolusage .nd coots on based on avenogo demands (30% of Pell< flows).
KY>Utrlm.y
7475
672
147
147
147
$0.0081
$41.28
A-.oge
Flow(MGO}
21 .26
:i3.56
21 .26
33.56
18.38
29.42
2.88
4.15
18.38
29.42
~y/MGO
370
96
147
147
147
~~/m.y
13.038
20,580
16.167
25,520
16,678
26,703
1,764
2,542
11.269
18,043
~ ~MGO S0<6CO
6la 31 .6 Zenon
28 4.0 AQUonics
6.1 Calc
8.1 Calc
8.1 Calc
en...vv Demond Oot'nond Totll
Arrool KYoUtr MI..: Costs ~ CoSt
4,758,831 47,588 $38,932 887 $36.613 $75.545 7,511 ,860 75,119 $61 ,455 1,400 $57,794 $119,249
5,900,903 59,009 $48,275 887 $36,613 $84,8811
9.314,631 93,146 $76,203 1,400 $57,794 $133,997
6,087,434 60,874 $49.801 992 $40,949 $90,750
9,746,519 97,465 $79,736 1.58a $65,563 $145,299
643,923 6,439 $5,268 120 $4,954 $10,222
928,007 9,280 $7,592 224 $9,239 $16,831
4,113,187 41 ,132 $33,650 767 $31.646 565.296
6.565,575 65.856 $53.877 1,227 $50,668 $104,544

Navajo-Gallup Water Supply Project Appraisal Study - Operator Costs
25-Sep-01
Assumptions
ANNUAL OPERA TOR COSTS
1. Technical operators have a total cost of $40 dollars a hour. Two operators are required 8 hours a day. between 0900 to 1700 hrs with one operator required the rest of the time.
2. Maintenance personnel have a total cost of $50.00 an hour and with one in the plant an average of 8 hrs a day. 3. Plant manager has a total cost of $60.00 per hour at the plant an average of 8 hours a· day.
plant manager will also be used to fill in for an operator when one of the operators are sick or on vacation or on vacation.
4. Operator requirements for all plants and demands will be the same.
Annual Operations Cost Estimate
Title Shift hourly cost Hrs day Days I week Annual Cost Operator 0700-1500 $40 8 7 $116,480 Operator 0700-1500 $40 8 7 $116,480 Operator 1500-2300 $40 8 7 $116,480 Operator 2300-0700 $40 8 7 $116,480 Maintenance 0900-1700 $50 8 5 $104,000 Manager 0900-1700 $60 8 5 $124,800 Total $694,720
Notes
Total costs are "loaded" costs and includes hourly wage, insurance, retirement etc.

Chemical Costs include demand by J Apache 10/11/01
Assumptions
ANNUAL CHEMICAL COSTS
Cleaning Chemicals hollow fiber membranes will be prorated from Zenon Cost Data
Aluminum sulfate costs will be based on a dosage of 30 ppm for all plants except the San Juan River for the SJ infiltration intake alternative which will be at 10 PPM. The estimated cost of Alum is $.25.
Chloramine demand is estimated at 1 mg/L with a dosage ratio of 3 parts chlorine to one part of ammonia. Cost of chorine is $.25 per pound delivered in ton containers while cost of ammonia gas is estimated to be $1 .00 per pound.
Chemical usage is based on operation at average flow (design demand divided by 1.3) for 24 hours a day.
Cleanin!l chemicals - Information from Zenon
Chemical CosUyr base flow $/MGD MC-1 $47,237 20.2 $6.41 Sodium Hypochlorite $11 ,678 $1.58 Sodium Hydroxide $4,834 $0.66 Sodium Bisulfate $2,651 $0.36 Total $9.01
Aluminum sulfate
Plant Dosage mg/L #used/ M ~I pound $/MGD All except II 30 250 $0.25 $62.50 Infiltration lntake(ll) 10 83 $0.25 $20.75
Chlorine Gas All Plants
Annual Chemical costs Design Average Year Plant Flow Rate Flow rate $/dayCC $1 day Alum $/day Cl2 $/day NH3 $/day total
2020 · NIIP Alternatives 27.64 21 .26 $191 .48 $1 ,329 $44 $58 $1 ,623.12 2040 NIIP Alternatives 43.63 33.56 $302.25 $2,098 $70 $92 $2,562.12
2020 PNM 23.89 18.38 $165.50 $1 ,149 $38 $51 $1 ,402.91 2040 PNM 38.25 29.42 $264.98 $1 ,839 $61 $81 $2,246.18
2020 Cutter Diversion 3.74 2.88 $25.91 $180 $6 $8 $219.63 2040 Cutter Diversion 5.39 4.15 $37.34 $259 $9 $11 $316.52
2020 San Juanw II 23.89 18.38 $165.50 $381 $38 $51 $635.67 2040 38.25 29.42 $264.98 $611 $61 $81 $1,017.77
CC - Hollow fiber Cleaning Chemicals
Notes 1. NIIP alternatives include Moncisco Dam, Coury Lateral and Cutter 2. San Juan II - San Jaun alternative with infiltration intake.
(file: power-chem-eq calcsi5.Jds sheet 2)
i$/year $592,440 $935,172
$512,062 $819,856
$80,164 $115,530
$232,021 $371,486

ANNUAL EQUIPMENT REPLACEMENT COSTS
Equipment Replacement incl J. Apache demand 11-0ct-01
Assumptions
1. Replacement of Hollow Fiber membrane cassettes. Cost/MGD (Data from manufacturer infonnation)
2. Annual r~placement of tubes etc in Ultraviolet Disinfection Units. Cost/MGD (Data from manufacturer infonnation)
4 Sum of annual cost for replacement of equipment per MGD
Annual cost for equipment replacement Year Plant Design Average cost
Flow rate (MGD) Flow rate (MGD) 2020 NIIP Alternatives 27.64 21 .26 $380,187 2040 NIIP Alternatives 43.63 33.56 $600,128
2020 PNM 23.89 18.38 $328,606 2040 PNM 38.25 29.42 $526,127
2020 Cutter Diversion 3.74 2.88 $51,443 2040 Cutter Diversion 5.39 4.15 $74,139
2020 San Juan w II 23.89 18.38 $328,606 2040 San Juan w II 38.25 29.42 $526,127
Notes 1. Costs area based on operating at average daily flow (design/1 .3) 24 hours a day. 2. NIIP Alternatives include Moncisco, Coury Lateral and Cutter 3. San Juan w II = San Juan Alternative with infiltration intake. 4. Costs are based on annual replacement although it is expected that the
$17,881
hollow fiber membrane cassettes will need to be replaced every 1 0 years, the tubes in the UV disinfection units every year and the mechanical equipment (pumps, blowers etc) every 15 years.
(file: power-chem-eq calcsrS.xls sheet 3)

ANNUAL SEDIMENT DISPOSAL COST WASTEWATER POLISHING PONDS
Excavation and disposal of sediment contained in the Wastewater polishing ponds. Navajo Gallup WSP
10/11/01 Assumptions
1. Distance between each plant and disposal site 1 0 miles round trip. 3. Ponds cleaned every 15 years no matter what demand. 4. Annual cost based on a interest rate of 8 percent 5. Dewater, Drain and excavate solids when the depth of solids is approximately 2 feet deep.
1. Wastewater Settling Ponds Excavation Quantities
Site Top Width Top Lengtl Depth Slope Bottom W Bottom L NIIP Alternatives 180 80 10 1 to 1 160 60 San Juan Alternatives 175 80 10 155 60 Cutter Diversion 100 40 10 80 20
2. Volume of solids to be removed, dewatered and hauled for disposal.
Site Top Width Top Lengtl Depth Slope Bottom W Bottom L NIIP Alternatives 164 64 2 1 to 1 160 60 San Juan Alternatives 159 64 2 155 60 Cutter Diversion 84 24 2 80 20
Excavation Dragline total Cost
Site CY $/CY NIIP Alternatives 1488 $4,00 $5,952 PNM 1442 $4.00 $5,769 Cutter 267 $4.00 $1 ,069 San Juan with II 1442 $4.00 $5,769 Source for cost RS Means Site work, 3/4 CY removmg hght clay
Loading and Transport Site CY Cost/YO Total Cost NIIP Alternatives 1637 $14.84 $24 292 PNM 1586 $14.84 $23,542 Cutter 294 $14.84 $4,363 San Juan with II 1586 $14.84 $23,542 CY includes a 1 0% increase for sand removed during loading Source cost for Loading RS Means, using a front end loader at 70 C Y per hour Source for cost RS Means Site Work, 12 CY dump truck with PRof 0.6 loads per hour.
Total Costs Every 15 years F/P A/F factor Annual cost Site factor NIIP Alternatives $30,244 3.1722 0.03682 $3,533 PNM $29,311 3.1722 0.03682 $3,424 Cutter Diversion $5,432 3.1722 0.03682 $634 San Juan with II $29,311 3.1722 0.03682 $3,424
Notes 1. NIIP alternatives include Moncisco, Coury Lateral and Cutter 2. San Juan with II = San Juan River alternative with infiltration intakes.
(file: wwpp cleaning costsr3.xls)
Per pond Both VoiCY
4415 8829 4285 8570 1004 2007
Sediment CYeach CYtotal
744 1488 721 1442 134 267

Navajo Gallup WaiJ!Jr Supply Project
Sediment Production and Disposal Costs
San Juan River PNM Alternative
15-Aug-<l1
Sediment Production Rates
Criteria and Assumptions
San Juan River PNM Alt Sediment Handling Costs
- Solids loading will be based on peak solids loading 14 days a year at a Suspended solids concentration
of20,000 mg/L
- Sediment production rates and costs will be based on year 2040 flow ralllJ
- density ot tully dried material 70 pounds per cubic feet
- sediment in pond at cleanout is 2 percent solids
- sludge after drying beds have solids content of 50 percent solids
1. Pounds if totally dry
2 Volume taken up in pond
NoiJ!Js:
Volume of sediment in pond when excavation is required 4,815 CY
90% ot solids retained in lead pond with a solids accumulation rate ot (557 x .9) or 501 CY per day
Days of high sediment loading before lead pond needs to be cleaned (48151418) = 11 .5 days of
TSS loading of 15,000 mg/L
Costs for Sediment Handling
Criteria and Assumptions
- Excavation, drying and dispOsal of sludge will need to b8 done twice a year
- Excavated sediment is placed on the bed will have a depth of approximately 6 inches.
-Dried sludge will have a depth of 3.0 inches over 5.96 acres or a volume ot 2404 cubic yards.
- ~ is estimated that 2 inches of sand will be removed with the dried sediment or a volume of 1603 CY.
Activity CY S perCY
1 Excavate sediment and load beds 4815
2 Load and haul dried sludge 4.007
3. Sand Replacement 1.603
Total
Notes
Volume of loaded sludge includes 2404 CY of dried sediment and 1603 CY of Sand with a total ot 4007 CY.
Excavation costs are from means using 1 112 power shovel, 6-12 CY dump trucks
Load and haul costs form means using 1-112 CY loader, 4-16 CY dump trailers with a 4 mile round trip.
(file sp pnm costs.xls)
$4.64
$8.03
$20.00
418
Cost per Cleaning Cycle Annual Cost
$22,342 $44,683
$32,176 $64,352
$32.060 $64,120
$86,578 $173,156

A 12. 1·614 Load & Haul Common Earth
The Loading and Hauling of Common Earth System balances the productivity of loading equipment to hauling equipment It is assumed that the hauling equipment will encounter light traffic . and will move up no considerable grades on the haul route.
The Expanded System Usting shows Loading and Hauling systems that use either a track or wheel front-end loader. Track loaders indicated range from 1-1/2 Cubic Yards capacity to 4-1/2 Cubic Yards capacity. Wheel loaders range from 1-1/2 Cubic Yards to 5 Cubic Yards. Trucks for hauling range from 6 Cubic Yards capacity to 20 Cubic Yards capacity. Each system lists the number of trucks involved and the distance (round trip) that each must travel.
COST PER C. Y.
QUANTlTY UNIT EQUIP. LABOR TOTAL SYSTEM 12.1-614-1000 LOAD & HAUL COMMON EARTH, 1-1/2 CY LOADER, SIX 6 CY TRUCKS, 1 MRT
Excavating bulk, F.E. loader track mtd., 1.5 C.Y. Haul earth, 6 C.Y. dump truck, 1 mile round trip, 3.3 loads;llr Spotter at earth fiU dump or in cut
Total
12.1·614 Load & Haul Common Earth
Load&haul common earth,1·1/2 C.Y. tr. loader,six 6C.Y. trucks,1MRT Four 12 C.Y. dump trucks, 2 mile round trip Three 16 C.Y. dump tra~ers, 2 mile round trip Four 16 C.Y. dump trailers, 4 m~e round trip .
2-1/2 C.Y. track loader, six 12 C.Y. dump trucks, 3 mile round trip Four 16 C.Y. dump trailers, 2 mile round trip FIVe 16 C.Y. dump trailers, 4 mile round trip Three 20 C.Y. dump trailers, 1 mile round trip
3-1/2 C.Y. track loader, six 12 C.Y. dump trucks, 1 mile round trip Seven 16 C.Y. dump trailers, 4 mile round trip Four 20 C. Y. dump trailers, 1 mile round trip Six 20 C.Y. dump trailers, 4 mile round trip
4000 4-1/2 C.Y. track loader, eight 12 C.Y. dump trucks, 1 mile round trip 4200 Six 16 C. Y. dump trailers, 1 mile round trip 4400 Six 20 C.Y. dump trailers, 2 mile round trip 4600 Eight 20 C.Y. dump trailers, 4 mile round trip 5000 1-1/2 C.Y. wheel loader, eight 6 C.Y. dump trucks, 2 mile round trip 5200 Four 12 C.Y. dump trucks, 1 mile round trip 5400 Six 12 C.Y. dump trucks, 3 mile round trip 5600 FIVe 16 C.Y. dump trailers, 4 mile round trip 6000 3 C.Y. wheel loader, eight 12 C.Y. dump trucks, 2 mile round trip 6200 FIVe 16 C.Y. dump trailers, 1 mile round trip 6400 Eight 16 C. Y. dump trailers, 3 mile round trip 6600 Six 20 C.Y. dump trailers, 2 mile round trip 7000 5 C. Y. wheel loader, eight 16 C. Y. dump trailers, 1 mile round trip 7200 Twelve 16 C. Y. dump trailers, 3 mile round trip 7 4DO Nine 20 C. Y. dump trailers, 2 mile round trip 7600 Twelve 20 C.Y. dump trailers, 4 mile round trip
1.000 1.000 . 010
C.Y. C.Y. Hr .
.48 3.86
4.34
EQUIP. 4.34 3.95 3.98 5.05 4.17 3.99 5.10 2.90 3.05 5.20 3.06 4.73 3.05 3.44 3.72 4.72 5.45 2.76 3.99 4.88 3.64 2.98 4.21 3.18 3.18 4.42 3.39 4.39
.65 1.13 2.69 6.55 .35 .35
3.69 8.03
COST PER C.Y. LABOR TOTAL
3.69 8.03 2.88 6.83 2.50 6.48 2.98 8.03 ·= 2.93 7.10 2.29 6.28 0 2.80 7.90
== 1.73 4.63 1.94 4.99
IU .... 2.69 7.89 -"' 1.57 4.63 2.46 7.19 Bl 1.81 4.86 1.73 5.17 1.84 5.56 2.29 7.01 4.46 9.91
~ 2.12 4.88 2.93 6.92 2.79 7.67 ~ ~ 2.41 6.05 1.62 4.60 ~{ 2.22 6.43 1.75 4.93 · ~~ 1.61 4.79 ..-::: 2.16 6.58 ~ ~ 1.66 5.05 {fl ~ 2.11 6.50
(V)
~
(eJ 425

SITE WORK A 12. 1·414 Excavate Common Earth
The Excavation of Common Earth System balances the productivity of the excavating equipment to the hauling equipment It is assumed that the hauling equipment will encounter light traffic and will move up no considerable grades on the haul route. No mobilization cost is included. All costs given in these systems include a swell factor of 25% for hauling.
The Expanded System Usting shows Excavation systems using backhoes ranging from 1/2 Cubic Yard capacity to 3-1/2 Cubic Yards. Power shovels indicated range from 1/2 Cubic Yard to 3 Cubic Yards. Dragline bucket rigs range from 1/2 Cubic Yard to 3 Cubic Yards. Truck capacities range from 6 Cubic Yards to 20 Cubic Yards. Each system lists the number of trucks involved and the distance (round trip) that each must travel.
System Components UNIT
420
EXCAVATE COMMON EARTH, 1/2 CY BACKHOE, TWO 6 CY DUMP TRUCKS, 1 MRT Excavating, bulk hyd. backhoe wheel mtd., 1/2 C.Y. Haul earth, 6 C.Y. dump truck, 1 mile round trip, 3.3 loads;hr Spotter at earth fill dump or in cut
Total
1.000 C.Y. 1.000 C.Y. . . 020 Hr.
.99 1.74 2.09 1.45
.56
3.08 3.75
Important: See the Reference Section for critical supporting data • Reference Nos., Crews, & C"dy Cost

ESTIMATES ON LOG REDUCTION CREDIT DURlNG TREATED WATER CONVEYANCE TO SERVICE.
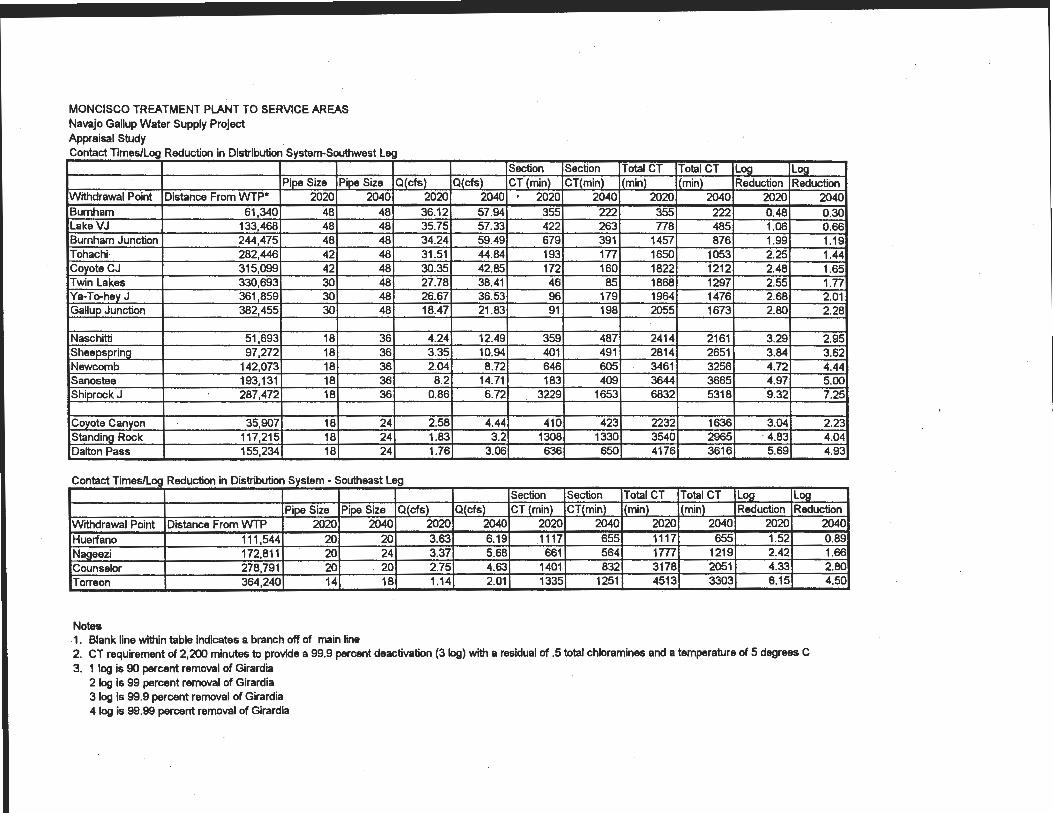
MONCISCO TREATMENT PLANT TO SERVICE AREAS Navajo Gallup Water Supply Project Appraisal Study Contact Times/Log Reduction in Distribution System-Southwest Leg
Pipe Size Pipe Size Q(cfs) Withdrawal Point Distance From WTP* 2020 2040 2020 Burnham 61,340 48 48 36.12 Lake VJ 133,468 48 48 35.75 Burnham Junction 244,475 48 48 34.24 Tohachi· 282,446 42 48 31.51 Coyote CJ 315,099 42 48 30.35 Twin Lakes 330,693 30 48 27.78 Ya-To-hey J 361 ,859 30 48 26.67 Gallup Junction 382,455 30 48 18.47
Naschitti 51,693 18 36 4.24 Sheepspring 97,272 18 36 3.35 Newcomb 142,073 18 36 2.04 Sanostee 193,131 18 36 8.2 Shiprock J 287,472 18 36 0.86
Coyote Canyon 35,907 18 24 2.58 Standing Rock 117,215 18 24 1.83 Dalton Pass 155,234 18
l_ _ __ ----24 1.76
Contact Times/Log Reduction in Distribution System - Southeast Leg
Pipe Size Pipe Size Q(cfs) Withdrawal Point Distance From WTP 2020 2040 2020 Huerfano 111,544 20 20 3.63 Nageezi 172,811 20 24 3.37 Counselor 278,791 20 . 20 2.75 Torreon 364,240 14 18 1.14
Notes .1. Blank line within table indicates a branch off of main line
Q(cfs) 2040
57.94 57.33 59.49 44.84 42.85 38.41 36.53 21 .83
12.49 10.94 8.72
14.71 6.72
4.44 3.2
3.06
Q(cfs) 2040 6.19 5.68 4.63 2.01
Section Section Total CT Total CT Log Log CT (min) CT(min) (min) l(min) Reduction Reduction . 2020 2040 2020 2040 2020 2040
355 222 355 222 0.48 0.30 422 263 778 485 1.06 0.66 679 391 1457 876 1.99 1.19! 193 177 1650 1053 2.25 1.44! 172 160 1822 1212 2.48 1.65! 46 85 1868 1297 2.55 1.77 96 179 1964 1476 2.68 2.01 91 198 2055 1673 2.80 2.28
359 487 2414 2161 3.29 2.95 401 491 2814 2651 3.84 3.62 646 605 3461 3256 4.72 4.44 183 409 3644 3665 4.97 5.00
3229 1653 6832 5318 9.32 7.25
410 423 2232 1636 3.04 2.23 1308 1330 3540 2965 ' 4.83 4.04 636 650 4176 3616 5.69 4.93
Section Section TotaiCT Total CT Log Log CT (min) CT(minT mirl) (min) Reduction Reduction
2020 2040 2020 2040 2020 2040 1117 655 1117 655 1.52 0.89
661 564 1m 1219 2.42 1.66 1401 832 3178 2051 4.33 2.80 1335 1251 4513 3303 6.15 4.50
2. CT requirement of 2,200 minutes to provide a 99.9 percent deactivation (31og) with a residual of .5 total chloramine& and a temperature of 5 degrees C 3. 1 log is 90 percent removal of Girardia
2 log is 99 percent removal of Girardia 3 log is 99.9 percent removal of Girardia 4 log is 99.99 percent removal of Girardia

PNM TREATMENT PLANT TO SERVICE AREAS Navajo Gallup Water Supply Project Appraisal Study Contact Times/Log Reduction in Distribution System
Pipe Size Withdrawal Point Distance From WTP* 2020 Ship Rock Junction 99,075 42 Sanostee 193,415 42 Burnham Junction 244,475 48 Newcomb 254,017 48 Sheepsprings 305,216 45 Naschitte 334,853 45 Tohachi 405,274 42 Coyote Canyon ~'"' 457,713 42 Twin Lakes 473,307 39 Ya-To-hey Junction 520,067 30 Gallup Junction 587,424 28 Rock Springs 29,441 21 Window Rock 88,415 21
Notes
Pipe Size Q(cfs} 2040 2020
48 36.28 48 35.42 48 34.24 48 34.08 45 33.19 45 32.77 42 31 .88 42 30.72 42 27.28 39 26.67 30 18.47 30 8.2 24 6.27
1. * Rock Springs and Window Rock distances is from the Yo-to-Hey junction
Q(cfs} 2040 58.21 51.49 59.49 49.22
47.7 47
45.46 43.47 38.41 36.53 21.83 14.71 11.51
Section Section Total CT ToaiCT Log Log !
CT (min} CT(min} !(min} !(min} Reduction Reduction: 2020 2040 2020 2040 2020 2040
438 356 438 356 0.60 0.49 427 384 865 740 1.18 1.01 312 180 1177 920 1.60 1.25
59 41 1235 960 1.68 . 1.31 284 197 1519 1158 2.07 1.58 166 116 1686 1274 2.30 1.74 354 248 2040 1522 2.78 2.08 274 193 2313 1715 3.15 2.34
79 65 2392 1780 3.26 2.43 143 177 2536 1957 3.46 2.67 260 252 2795 2209 3.81 3.01 144 164 2679 2121 3.65 2.89 565 402 3244 . 2523 4.42 3.44
2. CT requirement of 2,200 minutes to provide a 99.9 percent deactivation (3 log} with a residual of .5 total chloramines and a temperature of 5 degrees C 3. 1 log is 90 percent removal of Girardia
2 log is 99 percent removal of Girardia 3 log is 99.9 percent removal of Girardia 4 log is 99.99 percent removal of Girardia

CUTIER TREATMENT PLANT TO SERVICE AREAS Navajo Gallup Water Supply Project Appraisal Study Contact Times/Log Reduction in Distribution System
Pipe Size Pipe Size Withdrawal Point Distance From WTP 2020 2040 Huerfano 136,524 14 16 Nageez1 197,791 16 21 Counselor 303,772 12 14 Torreon 389,220 8 12
Notes
Q(cfs) Q(cfs) 2020 2040 3.63 6.19 3.37 5.68 2.75 4.63 1.14 2.01
Section Section Total CT Total CT Log Log CT (min) CT(min) (min) [(min) Reduction Reduction
2020 2040 2020 2040 2020 2040 670 513 670 513 0.91 0.70 423 432 1093 945 1.49 1.29 504 . 408 1597 1353 2.18 1.84 436 556 2033 ,_ 1909 2.77 2.60
1. CT requirement of 2,200 minutes to provide a 99.9 percent deactivation (3 Jog) with a residual of .5 total chloramines and a temperature of 5 degrees C 2. 1 Jog is 90 percent removal of Girardia ·
2 Jog Is· 99 percent removal of Girardia 3 Jog is 99.9 percent removal of Girardia 4 Jog is 99.99 percent removal of Girardia

WATER QUALITY DATA

' Design Water Quality Navalo l;;anuo water ~uool t-'rolect
Water Analysis
Navajo Gallup Water Supply Project
PNM Diversion -River Quality - 1999
Design Water Quality San Juan Diversion
Source : Weekly sampling/analysis by
San Juan Generating Station
Parameters 1/5/99 1112199 1/19/99 1/26/99 212199 219/99 16-Feb 23-Feb 312199 319/99 3116/99 3123/99 3130199
Tempdeg C
EC 584.0 589.0 587.0 539.0 553.0 549.0 547.0 512.0 510.0 498.0 504.0 503.0 488.0
IPH 8.1 8.1 8.1 8.1 8.6 8.1 8.2 8.1 8.1 7.9 8.0 8.0 7.9
Turbidity 57.0 54.0 27.0 41 .0 30.0 30.0 40.0 24.0 32.0 31 .0 25.0 33.0 34.0
TSS mg/L 100.0 139.0 101 .0 103.0 78.0 108.0 111 .0 67.0 53.0 91 .0 104.0 113.0 83.0
TDS mg/L
T S04mg/L 160.0 155.0 170.0 185.0 150.0 153.0 160.0 147.0 130.0 148.0 140.0 158.0 160.0
T . Hardness mg/L 204.0 214.0 216.0 200.0 194.0 210.0 193.0 180.0 176.0 174.0 188.0 180.0 196.0
Calcium +2 66.0 66.0 63.0 59.3 78.0 59.3 59.0 56.0 55.0 55.3 60.0 56.0 40.9
Magnesium +2 10.0 12.0 14.0 12.7 7.8 15.1 11 .0 9.7 9.7 8.8 9.3 9.7 22.3
P Alkalinity 0.0 0.0 0.0 0.0 0.0 0.0 0.0 2.0 0.0 0.0
M Alkalinity 114.0 116.0 110.0 112.0 110.0 108.0 120.0 104.0 102.0 108.0 118.0 110.0 100.0
Si02 8.8 9.4 8.8 8.4 8.3 8.3 8.5 6.6 7.9 8.3 8.0 6.8 6.9
PNM Diversion After Settling Pond.
Turbidity NTU
TSS mg/L
TDS mg/L
percent reduction in NTU due to settling
~cent reductionjn_ suspended_solid!idue to settling
Page 1

Water Analysis
Navajo Gallup Water Supply Project
PNM Diversion • River Quality· 1999
Design Water Quality San Juan Diversion
Source : Weekly sampling/analysis by
San Juan Generating Station
Parameters 416199 4113/99
Temp deg C
EC 538.0 513.0
pH 7.7 8.0
Turbidity 58.0 75.0
TSS mg/L 132.0 143.0
TDS mg/L
T S04 mg/L 165.0 152.0
T. Hardness mg/L 186.0 174.0
Calcium +2 42.4 55.7
Magnesium +2 4.0 8.5
P Alkalinity 0.0 0.0
M Alkalinity 124.0 108.0
Si02 7.2 7.3
PNM Diversion After Settling Pond.
Turbidity NTU
TSS mg/L
TDS mg/L
percent reduction in NTU due to settling
percent reduction in suspended solids due to s
Design Water Quality Navaio Galluo Water Suoolv Proiect
4119/99 4125/99 513/00 5110/99 5/18/99
16.1
518.0 479.0 468.0 451.0 333.0
8.1 8.2 8.3 8.2 8.1
49.0 180.0 212.0 109.0 88.0
108.0 718.0 451.0 327.0 320.0
32.0
125.0 128.0 165.0 148.0 122.0
188.0 186.0 184.0 204.0 138.0
58.9 58.0 59.0 61 .7 46.0
9.9 10.2 9.0 12.1 54.0
0.0 0.0 4.0 4.0 0.0
122.0 108.0 128.0 125.0 88.0
7.3 6.8 8.0 7.6 6.9
7 17 16
14 40 41
34
96.1 92.0 85.3
98.1 91.1 87.5
Page 2
5/24199 6/1/99 6{7/99 6/13199 6/20/99 6/28/99
263.0 254.0 265.0 234.0 245.0 214.0
8.0 7.6 8.0 7.9 7.9 8.2
24-4.0 64.0 50.0 56.0 660.0 69.0
733.0 262.0 128.0 206.0 937.0 130.0
24.0 160.0 110.0
70.0 52.3 52.0 57.2 45.0 38.01
96.0 90.0 110.0 90.0 88.0 84.0'
34.4 32.8 33.6 29.2 23.9 28.1
24.0 1.9 6.3 4.1 3.9 3.4
0.0 2.0 0.0 0.0 0.0 0.0
66.0 78.0 72.0 66.0 58.0 50.0
5.7 9.0 9.8 7.5 5.7 5.8
16 14
62 13
270
93.4 97.9
91 .5 98.6

Water Analysis
Navajo Gallup Water Supply Project
PNM Diversion • River Quality • 1999
Design Water Quality San Juan Diversion
Source : Weekly sampling/analysis by
San Juan Generating Station
Parameters 7/4199 7/11/99
Temp deg C
EC 274.0 455.0
pH 7.8 8.0
Turbidity 17.0 6100.0
TSS mg/L 60.0 6116.0 .
TDS mg/L 150.0 300.0
T S04 mg/L 75.0 95.0
T. Hardness mg/L 104.0 118.0
Calcium +2 35.0 40.9
Magnesium +2 4.0 4.4
P Alkalinity 0.0 0.0
M Alkalinity 80.0 82.0
Si02 6.0 6.4
PNM Diversion After Settling Pond.
Turbidity NTU 22
TSS mg/L 24
TDS mg/L 230
percent reduction in NTU due to settling 99.6
percent reduction in suspended solids due to s 99.6
Design Water Quality Navaio Galluo Water Suoolv P
7/19/99 7/26/99 8/2199
500.0 347.0 476.0
7.8 8.4 8.0
6160.0 1140.0 6700.0
10810.0 1674.0 10326.0
340.0
150.0 68.0 108.0
154.0 128.0 123.0
41 .6 45.7 42.4
12.2 3.4 4.1
0.0 0.0 2.0
4.8 90.0 92.0
7.8 7.0 4.9
23 16 27
26 15 25
260
99.6 98.6 99.6
99.8 99.1 99.8
Page 3
. - ---
I
8/8/99 8/16/99 8123/99 8129199 9/5/99 9/14199
302.0 334.0 278.0 297.0 260.0 308.0
8.1 7.9 7.7 8.1 8.3 8.3
780.0 1400.0 188.0 940.0 160.0 60.0
1736.0 3520.0 654.0 1757.0 561.0 245.0
190.0 220.0
51.6 92.0 76.0 68.0 49.0 51.6
115.0 113.0 148.0 108.0 106.0 116.0
38.5 38.9 40.1 34.4 34.4 36.8
4.6 3.9 11.7 5.4 4.9 5.8
0.0 0.0 0.0 2.0 0.0 0.0
94.0 92.0 85.0 86.0 78.0 82.0
6.5 9.4 9.0 13.2 8.9 11.5
32 22 17 19 23
27 25 37 22 55
270 300
95.9 98.4 90.9 98.0 84.7
98.4 99.3 94.3 98.7 90.2

Water Analysis
Navajo Gallup Water Supply Project
PNM Diversion -River Quality- 1999
Design Water Quality San Juan Diversion
Source : Weekly sampling/analysis by
San Juan Generating Station
Parameters 9/21/99 9127/99
Tempdeg C
EC 267.0 339.0
pH 8.2 8.2
Turbidity 35.0 32.0
TSS mg/L 88.0 103.0
TDS mg/L
T S04 mg/L 54.0 92.0
T. Hardness mg/L 120.0 146.0
Calcium +2 40.9 40.0
Magnesium +2 4.4 11.0
P Alkalinity 0.0 3.0
M Alkalinity 86.0 112.0
Si02 10.3 10.1
PNM Diversion After Settling Pond.
Turbidity NTU
TSS mg/L
TDS mg/L
percent reduction in NTU due to settling
percent reduction in suspended solids due to s
Design Water Quality Navaio Galluo Water Suoolv Proiect
10/3/99 10/10/99 10/18/99 10/24199
441.0 446.0 481 .0 586.0
8.2 8.1 8.1 8.2
20.0 15.0 21 .0 15.0
58.0 37.0 54.0 24.0
210.0 280.0
88.0 106.0 200.0 130.0
161 .0 148.0 174.0 198.0
51.3 49.7 50.1 65.7
8.0 5.8 11 .9 8.3
0.0 0.0 0.0 0.0
104.0 100.0 106.0 114.0
8.5 8.0 8.9 7.8
Page 4
11/8/99 11123199 11128/99 1215199 12113199
583.0 578.0 608.0 632.0 584.0 624.0
8.2 8.6 8.1 8.2 8.3 8.1
30.0 9.0 33.0 32.0 21.0 20.0
72.0 21 .0 54.0 72.0 39.0 24.0
350.0 290.0 260.0
140.0 145.0 155.2 140.8 138.0 170.0
192.0 208.0 214.0 230.0 217.0 232.0
65.8 65.6 68.1 72.1 76.1 60.9
6.8 11.2 10.7 12.2 11.4 19.5
0.0 0.2 1.0 1.0 0.0 0.0
112.0 100.0 126.0 132.0 124.0 130.0
9.1 8.9 9.1 9.2 8.8 10.2

Water Analysis
Navajo Gallup Water Supply Project
PNM Diversion - River Quality - 1999
Design Water Quality San Juan Diversion
Source : Weekly sampling/analysis by
San Juan Generating Station
Parameters 12120/99 Average
Temp deg C
EC 599.0
pH 8.1
Turbidity 20.0
TSS mg/L 30.0
TDS mg/L
T S04 mg/L 184.0
T. Hardness mg/L 230.0
Calcium +2 70.0
Magnesium +2 14.0
P Alkalinity 0.0
MAikalinity 128.0
Si02 5.8
PNM Diversion After Settling Pond.
Turbidity NTU
TSS mg/L
TDSmg/L
percent reduction in NTU due to settling
percent reduction in suspended solids due to s --
Design Water Quality Navaio Galluo Water Suoolv Project
Max Min
16.10 16.1 16.1
446.7 632.0 214.0
8.1 8.6 7.6
506.0 6700.0 9.0
879.6 10810.0 21 .0
208.3 350.0 24.0
119.3 200.0 38.0
162.9 232.0 84.0
50.8 78.0 23.9
10.1 54.0 1.9
0.5 4.0 0.0
99.3 132.0 4.8
8.1 13.2 4.9
19.4
30.4
227.3
95.0
96.1
Page 5

Design r Quality Navajo Gallup Water Supply Project
Water Analysis - Navajo Gallup Water Supply Project Samples Taken by the Field and Analyzed by the TSC Labs
Hogback Diversion Design Water Quality San Juan Diversion
Hog Back Samples PNM Historic PNM Historic Parameters 4/14/00 5/9/2000* 5/12/00 5/25/00 6/6/00 6/27/00 23-Aug 23-Aug Averages Ranges Average Range
Note 1 Note 2 Note 3 EC 376 251 308 203 224 445 1155 301.17 203-1155 pH 8.16 7.53 8.16 7.53 7.9 8.66 7.85 . 7.99 7.53-8.66 TempF 53.6 55.2 53 55.7 52.1 74.1 62.4 57.28 62.4-74.1
•
Turbidity 85 113 36.38 149 79.07 5.41 4266 77.98 4266-5.41 TSS mg/L 141 140 42 195 331 15334 169.80 15334-42 TDS mg/L 282 177 184 168 141 884 190.40 884-141 T S04mg/L 83.4 53.5 64.2 42.6 42.2 476.5 57.18 476.5-42.2 TOC mg/L 4 2.89 2.98 3.71 3.3 4.76 3.38 4.76-2.89 Chloride mg/L 8.42 3.9 5.06 2.98 2.91 26.8 4.65 26.6-2.91 T. Hardness mg/L 106 107 1535 106.50 1535-106 Calcium+2
Magnesium +2
P Alkalinity
M Alkalinity
Si02
• Sample taken in the canal downstream of the ho~ back diversion. Turbidity (T1) = turbidity after 1 hour of settling
Note 1 Sample taken after storm event. Turbidity after settling 7 hrs- 57.9, after settling for 24 hrs 9.36 NTU Note 2 Water Quality of 8/23/00 water after 4 hours of settling Note 3 Average does not include 8/23/00 water sample. But does include that water after
4 hours of settling I I
Page 1

I
NIIP Water Quality Samples taken the summer of 2000 by U.S. Bureau of Reclamation Sample taken at "Cutter Diversion" storet numbers DRSSJ078A
Parameter 4/14/00 Time 1000 EC 205 pH 7.7 TempF 45.3 Turbidity 3.11
Turbidity (TO) 3 Turbidity (T1 ) 3 Turbidity (T 4) 3 TSS <4 TDS 181 TS04 38.2 TOC 8 Chlorides 1.2
5/9/00 1200
187 7.71 45.6 3.16
2.8 2.5 2.3
1 140
29.7 2.29
1.9
Averages
196.00 7.71
45.45 3.14
2.90 2.75 2.65 1.00
160.50 33.95
5.15 1.55
SOURCE WATER QUALITY NIIP ALTERNATIVE
CUTTER DIVERSION

Table 1. Water Quality for San Juan River at different Locations Data compiled from USGS database for noted sampling point
. Parameter Units Navajo Reservoir Dam RM 225.4 Start Date End Date Mean Min Max
Total Hardness as CaC03 mg/L
Calcium (Ca+2) mg/L
Magnesium (Mg+2) mg/L
Sodium (Na~ mg/L
Potassium (k ~ mg/L
Total Alkalinity as CaC03 mg/L
Carbonate (C03 -2) mg!L
Bicarbonate (HC03) mg!L
Total sulfate (S04) mg!L
Flouride _(F) mg!L
Chloride (Cl) mg/L
Nitrate as N (NO-~ mg/L
Phosphate (P04-~ mg!L
Aluminum (Al+~ J.lg/L
Barium (Ba +2) mg/L
Copper (Cu +2) llg/L
Iron (Total) J.lg/L
Iron (Dissolved-Fe +2) llg/L
Manganese (Total) J.lg/L
Manganese (Dissolved-Mn +2) J.lg/L
Arsenic (As +3) J.lg/L 4/20/94 6/20/95 2.533 1 6
Selenium (Total) J.lg/L 4/20/94 6/20/95 1 1 1
Selenium (Dissolved-Se-2) llg/L 4/20/94 6/20/95 1.267 1 5
Strontium (Sr+2) J.lg/L
Anunonia as N (NH4 ~ mg/L
Dissolved Oxygen (Ov mg!L 5/16/94 6/20/95 7.081 3.1 11.1
Hydrogen Sulfide/Sulfide as S mg/L
Silica (SiOv mg!L
Specific Conductivity llOhmlcm 4/20/94 6/20/95 233.333 214 282 Total Dissolved Solids (TDS,Cond. meter) mg/L
Total Organic Carbon as C mg/L
Temperature oc 4/20/94 6/20/95 14.201 6.42 24.39 Turbidity NTU 5/16/94 6/20/95 7.214 0.8 35
IPH Unitless 4/20/94 6120/95 7.456 0.214 8.62 Total Suspended Solids (TSS) mg!L 5116/94 6/20/95 11.714 2 58
Page 1 of7

Table 1. Water Quality for San Juan River Data compiled from USGS database for noted sampling point
Parameter Units San Juan River at Farmington Rm 180.1 Start Date End Date Mean Min Max
Total Hardness as CaC03 mg!L 5/10/62 2/22/82 189.322 65 820
Calcium (Ca+2) mg!L 10/16/96 2/19/97 71.5 55.3 78.3
Magnesium (Mg+2) mg/L 10/16/96 2/19/97 11.88 9.3 13.5
Sodium (Na~ mg/L 10/16/96 2/19/97 37.7 26.5 44
Potassium_(k') mg/L 10/16/96 2/19/97 3.12 2.3 5.5
Total Alkalinity as CaC03 mg!L 10/2/65 2/22/82 113.852 49 302
Carbonate (C03 -2) mg/L
Bicarbonate (HC03) mg!L
Total sulfate (S04) mg!L· 5/10/62 2/4/91 154.231 25 827
Flouride (F) mg/L
Chloride (Cl) mg!L 5/10/62 2/4/91 9.783 1.3 160
Nitrate as N (N0-3) mg!L 10/3/69 9/30/70 0.28 0 1
Phosphate (P04-3) rng!L 5/24/79 5/24/79 0.37 0.37 0.37
Aluminum (AI+~ Jlg/L 5/31/68 3/20/97 579.056 0.39 6300
Barium (Ba +2) mg/L 4/27/77 2/19/97 128.618 0.076 400
Copper (Cu +2) Jlg/L 3/10/75 3/20/97 34.328 0.005 550
Iron (Total) Jlg/L 3/10/75 10/29/81 25690.67 760 310000
Iron (Dissolved-Fe +2) Jlg/L 9/10/69 2/4/91 48.693 0 1699.997
Manganese (Total) Jlg/L 3/10/75 2/19/97 805.047 0.056 12000
Manganese(Dissolved-Mn+2) Jlg/L 11/9/70 2/19/97 15.584 0.02 70
Arsenic (As+~ Jlg/L 3/10/75 3/20/97 3.591 0.005 30 Selenium (Total) Jlg/L 4/2/74 3/20/97 0.839 0 2
Selenium (Dissolved-Se -2) Jlg/L 3/10/75 3/20/97 0.966 0 5
Strontium (St2) Jlg/L 4/27/77 2/19/97 125.772 0.71 750
Ammonia as N (NH4) mg!L 11/30/72 2/22/82 0.159 0.01 0.66
Dissolved Oxygen (02) mg!L 12/3/68 3/20/97 9.595 3.7 14.6
Hymo~nSWfiddSWfideasS mg/L
Silica (SiOz) mg!L 10/16/96 2/19/97 19.46 8 50.2
Specific Conductivity J10hrnlcm 11/6/80 3/20/97 319.594 0.293 630 Total Dissolved Solids (TDS,Cond. meter) mg!L 10/16/96 3/20/97 372 230 450 Total Organic Carbon as C mg/L 8/1/72 116/82 10.862 1.5 110
Temperature oc 12/3/68 3/20/97 10.608 0 27
Turbidity NTU 5/19/94 3/20/97 144.37 2.5 1880 pH Unitless 4/20/94 3/20/97 8.098 7.24 8.69 Total Suspended Solids (TSS) mg!L 5/19/94 3/20/97 262.41 5 2660
Page 2 of 7
.

Table 1. Water Quality for San Juan River Data compiled from USGS database for noted sampling point
Parameter Units San Juan River at Fruitland RM 167.4 Start Date End Date Mean Min Max
Total Hardness as CaC03 mg/L 1127/78 7/11/86 167.659 97 270
Calcium (Ca +2) mg/L 5/18/94 2/19/97 69.167 38 83.3
Magnesium (Mg+2) mg/L 5/18/94 2/19/97 13 .167 8 16.6
Sodium (Na) mg!L 5/18/94 2/19/97 37.083 13 47.5
Potassium (k) mg/L 5/18/94 2/19/97 3.3 2.5 4.9
Total Alkalinity as CaC03 mg/L 1/27/78 8/18/87 101.852 56 154
Carbonate (C03 "2) mg/L
Bicarbonate (HC03) mg/L
Total sulfate (S04) mg/L 1127/78 5/6/92 137.5 50 400
Flouride (F) mg/L
Chloride (Cl) mg/L 1127/78 5/6/92 9.502 1 23
Nitrate as N (NO-~ mg/L
Phosphate {P04"3) mg/L 4/25/79 6/19/79 0.535 0.21 0.86
Aluminum (AI+~ Jlg/L 5/18/94 3/20/97 814.968 0.6 8910
Barium (Ba +2) mg/L 7/20/78 2/19/97 184.742 0 800
Copper (Cu +2) Jlg/L 7/20/78 3/20/97 14.51 0.006 94
Iron (Total) Jlg/L 10/30/80 9/5/84 32589.38 530 420000
Iron (Dissolved-F e +2) Jlg/L 1127/78 8/8/90 39.135 3 270
Manganese (Total) Jlg/L 7/20/78 2/19/97 945.583 0.04 20000
Manganese (Dissolved-Mn +2) Jlg/L 4/26/78 2/19/97 10.843 0.013 40
Arsenic (As+~ Jlg/L 7/20/78 3/20/97 3.143 0.005 10 Selenium (Total) Jlg/L 4/26/78 3/20/97 0.837 0 2
Selenium (Dissolved-Se"2) Jlg/L 7/20/78 3/20/97 0.765 0 1
Strontium (St2) J.lgt'L 11/25/80 2/19/97 193.108 0.76 680
Ammonia as N (NH/) mg!L 1/27/78 9/5/84 0.061 0 0.35
Dissolved Oxygen (Oz) mg!L 1/27/78 3/20/97 9.792 3.46 15.18
HymogenSWfiddSWfideasS mg/L
Silica (Si02) mg!L 5/18/94 2/19/97 26.317 10 55.3
Specific Conductivity J.10hrnlcm 10/30/80 3/20/97 351.63 0.289 695 Total Dissolved Solids (TDS,Cond. meter) mg/L 10/16/96 3/20/97 397 280 510 Total Organic Carbon as C mg/L
Temperature oc 1/3/78 3/20/97 11.872 0.21 25 .5 Turbidity NTU 5/18/94 3/20/97 152.535 2.6 1750
IPH Unitless 4/20/94 3/20/97 8.274 7.7 9.19 Total Suspended Solids (TSS) mg/L 5118/94 3/20/97 322.923 5 3100
Page 3 of7

Table 1. Water Quality for San Juan River Data compiled from USGS database for noted sampling point
Parameter Units San Juan River at Shiprock Bridge RM 147.8 Start Date End Date Mean Min Max
Total Hardness as CaC03 mg/L
Calcium (Ca +2) mg/L 5/18/94 2/20/97 72.517 40 87.3
Magnesium (Mg +2) mg/L 5/18/94 2/20/97 14.75 9 18.6
Sodium (Na) mg/L 5/18/94 2/20/97 39.833 14 50.1
Potassium (k) mg/L 5/18/94 2/20/97 3.5 2.5 4.8
Total Alkalinity as CaC03 mg/L
Carbonate (C03-2) mg/L
Bicarbonate (HC031 mg/L
Total sulfate (S04) mg/L
Flouride. (F} mg/L
Chloride (Cl) mg/L
Nitrate as N (NO-~ mg/L
Phosphate (P04-3) mg/L
Aluminum (Al+~ Jlg/L 5/18/94 3/19/97 681.368 0.41 11200
Barium (Ba +2) mg/L 5/18/94 2/20/97 31.784 0.072 190
Copper (Cu +2) Jlg/L 5/18/94 3/19/97 2.39 0.009 40
Iron (Total) Jlg/L
Iron (Dissolved-Fe +2) Jlg/L
Manganese (Total) Jlg/L 5/18/94 2/20/97 71.827 0.027 430
Manganese (Dissolved-Mn +2) Jlg/L 5/18/94 2/20/97 1.687 0.005 10
Arsenic (As+~ ~giL 4/21194 3/19/97 5.156 0.005 44 Selenium (Total) Jlg/L 4/21194 3/19/97 0.79 0.001 1
Selenium (Dissolved-Se-2) Jlg/L 4/21194 3/19/97 0.856 0.001 3
Strontium (St2) Jlg/L 5/18/94 2/20/97 64.12 0.77 380
Ammonia as N (NH/) mg/L
Dissolved Oxygen (Oz) mg/L .5!18194 3/19/97 9.651 3.6 13 .94
Hydrogen Sulfide/Sulfide as S mg/L
Silica (SiOz) mg!L 5/18/94 2/20/97 35.55 6 65 .9
Specific Conductivity J.LOhrnlcm 4/21194 3/19/97 415 .695 0.28 808 Total Dissolved Solids (TDS,Cond. meter) mg/L 10/16/96 3/19/97 421.875 280 550 Total Organic Carbon as C mg!L
Temperature oc 4/21194 3/19/97 11.666 0.08 23 .67 Turbidity NTU 5/18/94 3/19/97 732.485 3.8 11100
I pH Unitless 4/21194 3/19/97 8.26 7.66 8.89 Total Suspended Solids (fSS) mg/L 5/18/94 3/19/97 1322.162 5 17700
Page 4 of 7

Table 1. Water Quality for San Juan River Data compiled from USGS database for noted sampling point
Parameter Units
Total Hardness as CaC03 mg/L
Calcium (Ca +2) mg/L
Magnesium (Mg+2) mg/L
Sodium (Na) mg/L
Potassium (k) mgi.L
Total Alkalinity as CaC03 mg/L
Carbonate (C03 •2) mg/L
Bicarbonate (HC03) mg/L
Total sulfate (S04) mg/L
Flouride (F) mg!L
Chloride (Cl) mg/L
Nitrate as N (N0.3) mg/L
Phosphate (P04·) mg/L
Aluminum (AI+) ~giL
Barium (Ba +2) mg/L +2) Copper (Cu ~giL
Iron(!'_otal)_ J..Lg/L
Iron (Dissolved-F e +2) ~giL
Manganese (Total) ~giL
Manganese (Dissolved-Mn +2) ~giL
J\rsenic (J\s+) ~giL Selenium (Total) ~giL
Selenium (Dissolved-Se-2) !!giL
Strontium (Sr+2) ~giL
Ammonia as N (NH/) mg/L
Dissolved Oxygen (Ov mg!L
Hydrogen Sulfide/Sulfide as S mg/L
Silica (SiOv mg/L
Specific Conductivity ~ohm/em
Total Dissolved Solids (TDS,Cond. meter) mg/L Total Organic Carbon as C mg/L
Temperature oc Turbidity NTU pH Unitless Total Suspended Solids (TSS) mg/L
,::,an Juan .Kiver ar nogoacK utvers10n uam RM 158.9
Start Date End Date Mean Min Max
8/12/93 7/26/94 965 730 1200
8/12/93 7/26/94 815 630 1000
8/12/93 7/26/94 116 62 170
4/19/94 6/20/95 3.833 1.2 11 8/12/93 6/20/95 1 1 1
4/19/94 6/20/95 1 I 1
8/12/93 6/20/95 8.722 3.62 13.57
4/19/94 6/20/95 476.667 248 646
8/12/93 6/20/95 13.345 1.7 . 27.5 5/18/94 6/20/95 272.071 4.3 1900 4/19/94 6/20/95 8.249 7.77 8.97 5/18/94 6/20/95 607.214 2 4000
Page~ of 7

Table 1. Water Quality for San Juan River Data compiled from USGS database for noted sampling point
Parameter Units San Juan River at Shiprock Below Bridge Start Date End Date Mean Min Max
Total Hardness as CaC03 mg/L 9/18/58 7/9/86 248.63 76 990
Calcium (Ca +2) mg/L
Magnesium (Mg+2) mg/L
Sodium (Na) mg/L
Potassium (k) mg/L
Total Alkalinity as CaC03 mg/L 9/18/58 8/19/87 120.498 32 250
Carbonate (C03 "2) mg/L
Bicarbonate (HC03) mg/L
Total sulfate (S04) mg/L 9/18/58 5/6/92 234.873 38 1200
Flouride (F) mg/L
Chloride (Cl) mg/L 9/18/58 5/6/92 17.762 1.6 196
Nitrate as N (NO-~ . mg/L 10/2/69 10/14/70 0.621 0 3.2
Phosphate (P04"3) mg/L 4/18/79 6/13/79 1.34 0.28 2.4
Aluminum (AI+~ J.lg/L 11/17/61 11/17/61 400 400 400
Barium (Ba +2) mg/L 2/22/78 9/1/81 613.33 100 5400
Copper (Cu +2) J.lg/L 9/26/74 9/7/82 58.217 0 580
Iron (Total) J.lg/L 9/26/74 9/7/82 28959.55 460 349999.9
Iron (Dissolved-Fe+2) J.lg/L 9/18/58 5/6/92 31.673 0 1700
Manganese (Total) J.lg/L 11117/61 9/7/82 1178.696 50 12000
Manganese (Dissolved-Mn +2) J.lg/L 9/18/58 5/6/92 63 .809 0 2099.996
Arsenic (As+~ J.lg/L 9/26/74 9/7/82 10.478 1 56 Selenium (Total) J.1g/L 9/18/58 5/6/92 2.379 0 50
Selenium (Dissolved-Se-2) J.lg/L 9/26/74 9/7/82 2.609 1 10
Strontium (St2) J.lg/L 2/5/80 5/6/81 561.667 470 620
Ammonia as N (NH4) mg/L 11/29/72 6/9/92 0.073 0 0.09
Dissolved Oxygen (0~ mg/L 8/5/69 6/9/92 9.968 4.6 14.5
Hydrogen Sulfide/Sulfide as S mg/L
Silica (SiO~ mg/L
Specific Conductivity J.10hrn!cm Total Dissolved Solids (TDS,Cond. meter) mg/L Total Organic Carbon as C mg/L 10/25/72 5/6/81 12.706 2.4 110
Temperature oc 2/26/59 6/9/92 12.578 0 30 Turbidity NTU pH Unitless Total Suspended Solids (TSS) mg/L 12/14/70 9/28/71 1916.299 96.5 7799.996
Page 6 of?

Table 1. Water Quality for San Juan River Data compiled from USGS database for noted sampling point
Parameter Units
Total Hardness as CaC03 rng/L
Calcium (Ca +2) rng/L
Magnesium (Mg+2) rng/L
Sodium (Na ~ rng/L
Potassium (k"} rng/L
Total Alkalinity as CaC03 rng!L ·
Carbonate (C03 "2) rng/L
Bicarbonate (HC03) rng/L
Total sulfate (S04) rng/L .
Flouride (F) rng/L
Chloride (CI) rng/L
- Nitrate as N (NO-~ rng/L
Phosphate (P04-~ rngi'L
Alwninum (Al+~ J.lg/L Barium (Ba +2
) mg/L
Copper (Cu +2) Jlg/L
Iron (Total) Jlg/L
Iron (Dissolved-Fe+2) Jlg/L
Manganese (Total) Jlg/L
Manganese (I>issolved-Mn+2) Jlg/L
Arsenic (As+~ Jlg/L Selenium (Total) Jlg/L
Selenium (Dissolved-Se "2) Jlg/L
Strontium (Sr+2) Jlg/L
Ammonia as N (NH/) rng/L
Dissolved Oxygen (Oz) rng/L
Hydrogen Sulfide/Sulfide as S rng/L
Silica (SiOz) mg/L
Specific Conductivity J.LOhmlcm Total Dissolved Solids (fDS,Cond. meter) mg/L Total Organic Carbon as C mg/L
Temperature oc Turbidity NTU I pH Unitless Total Suspended Solids (TSS) mg/L
San Juan River at PNM Diversion Structure Start Date End Date Mean Min Max
l/5/99 1/2/00 164 84 232
l/5/99 1/2/00 51.1 28.1 78
l/5/99 1/2/00 9.0 1.9 22.3
1/5/99 1/2/00 97.9 0 132
1/5/99 1/2/00 120.0 38 200
1/5/99 1/2/00 9.2 4.85 58
1/5/99 1/2/00 449.7 214 632 1/5/99 1/2/00 202.9 24 350
115/99 1/2/00 496.4 9 6700 1/5/99 1/2/00 8.1 7.62 8.56
115/99 1/2/00 893.4 21 10810
Page 7 of?

CITY OF SOMERTON, WATER BLENDING STUDY

Summary
CITY OF SOMERTON WATER BLENDING STUDY
The proposed blending of Colorado River water with Somerton well water will improve the Somerton drinking water quality. The maximum benefit will be achieved with the maximum amount of river water used in the blend. More work needs to be done to obtain additional analyses and perform corrosion testing of the actual. blended waters.
Background
· The City of Somerton is planning to blend Colorado River water with Somerton well water in the future. This study investigates the major water quality and corrosion issues of the blended water in order to anticipate possible problem areas. Calculations were done based on currently available water quality.data,.
Blending Calculations
For the blending calculations,"The Rothberg, Tamburini & Winsot Model for Corrosion Control and Process Chemistry", version 3.0 was used. This software is available from the American Water Works Association. Table 1 shows the data used to calculate the typical composition of the City of Somerton water treatment plant effluent. Table 2 shows the data from the first half of 2000 used to calculate the typical Colorado River water composition. More data needs to be obtained to get a better estimate of the actual river water composition. A temperature of 25°C was assumed for the river water.
For the first case, blend calculations of the percent of Somerton water to Colorado River water were done for 0, 25, 50, 75, & 100 %. For example, the 1 00% blend contained no Colorado River water, the 50% blend contained 50% Somerton water & 50% Colorado River water, and the 0% blend was all Colorado River water. The blended water was not treated further. The results of the calculation are shown in the first section of the Table 3. The calculation sheets are shown in Appendix A. These results are the "interim values", meaning that the water remains supersaturated in calcium carbonate. The final values are for the blends which are saturated and that have precipitated all calcium carbonate.
The concentration of the major species are plotted in Chart 1 as a function of the Somerton water blend. As can be seen, the water quality improves as the Somerton blend decreases. It should be noted that the total dissolved solids (TDS) is 677 mg/1 with 100% Colorado River water which is above the 500 mg/1

secondary drinking water standard. The chloride secondary standard of 250 mg/1 is met with a 50% blend. The sulfate secondary standard of 250 mg/1 is nearly met with 1 00% Colorado River water.
The pH of the blended water is plotted in Chart 2. As the Somerton blend is decreased, the pH increases. The pH at 100% Colorado River water is 8.39 which is less than the secondary standard maximum of 8.5.
r
The calcium carbonate precipitation potential is plotted in Chart 3. This is the maximum amount of precipitation which will occur in the blended water. As the Somerton blend is decreased, the precipitation potential decreases to a minimum of 19 mg/1. In general, this value should be less than 10 mg/1 to minimize calcium carbonate scale formation.
The Langelier Index and the ratio of alkalinity to the sum of chloride and sulfate concentration are plotted in Chart 4. In general, the Langelier index should be positive to insure some calcium carbonate formation. The value is positive in all cases. The ratio of alkalinity to the sum of chloride & sulfate concentration is a measure of the corrosiveness of the blended water. In general, this "corrosion" ratio should be above 5. For these blends, the maximum value is 0.4 with Colorado River water. This is due to the high concentrations of chloride and sulfate.
For the second case, carbon dioxide was added to the blended water in order to reduce the precipitation potential. The results of the calculation are shown in the se.cond section of the Table 3. The calculation sheets are shown in Appendix 8, The advantage of using carbon dioxide is that it can reduce the pH without ·reducing alkalinity. Carbon dioxide was added until the precipitation potential was reduced to less than the maximum recommended of 1 0 mg/1.
The pH of this "stabilized" water is plotted in Chart 5. This treatment reduced the interim blend pH by about 0. 7 units.
The precipitation potential of the blended stabilized water is plotted in Chart 6. In · all cases,. the potential is less than 10 mg/1.
The Langelier Index and corrosion ratio is plotted for the blended stabilized water in Chart 7. The Langelier index remains positive for all blends whereas the corrosion ratio is unaffected.
The amount of carbon dioxide added for the blend calculations is shown in Chart 8. A maximum of 25 mg/1 is added for the 100% Somerton water blend.
The final blended unstabilized water characteristics are shown in Chart 9. Although the calcium and alkalinity values are reduced somewhat, the TDS is not

reduced significantly. The chloride & sulfate values are not affected by the calcium carbonate precipitation.
The pH of the final unstabilized blend is shown in Chart 1 0. The values are within the secondary standard of 6.5 to 8.5.
The final stabilized blend characteristics are shown in Chart 11. The calcium & alkalinity values are higher than the unstabilized final blend due to the reduction in precipitation potential.
The pH of the final stabilized blend is shown in Chart 12. For all blends, the secondary standard is met.
Discussion of Results
Although the water quality is improved by blending Somerton well water with Colorado River water, not all secondary standards can be met. The chloride secondary standard can be met with a 50% blend. The Somerton well water is very super-saturated in calcium carbonate as indicated by the precipitating potential of 40 mg/1. Blending tends to reduce this value. Carbon dioxide or acid can be used to reduce the precipitation potential to less than 1 0 mg/1. Due to the high concentrations of chloride and sulfate ions in the blended water, the water will tend to be corrosive even though calcium carbonate tends to precipitate.
Conclusions
The blending of Colorado River water with Somerton well water improves the potable water quality. The maximum effectiveness is achieved with the highest proportions of Colorado River water. Although this blended water will have calcium carbonate scaling potential, blending tends to reduce the amount of scale formation. Due to the high amounts of sulfate and chloride in the blended water, the "corrosion" ratio of the water is only slightly improved. However, the RTW model does not predict actual corrosion rates. So despite having a positive · Langelier Index, which would tend to indicate a-non-corrosive water,, the high amounts of sulfate and chloride indicate that this could be a corrosive water.
Recommendations
1. To improve the potable water quality for the City of Somerton, the maximum amount of Colorado River water should be used to blend with Somerton well water.
2. Obtain full analyses of components such as toxic elements identified in the Drinking Water Standards and perform blend calculations to ensure compliance.
3. Perform corrosion testing using blends of actual waters with various anticorrosion additives.

4. Consider membrane treatment processes to obtain water quality consistent with secondary drinking water standards.

1.
Cit~ of Somerton _j_ ----Water Treatment Plant Effluent --
! -Date TDS, I: Tem_Q_.
---j---· pH Alkalinity Calcium Calcium Chloride Sulfate
Sampled (mg/1) {OC) {lab) (mg/1 CaC03) (mg/1) (mg/1 CaC03) (mg/1) (mg/1) 01/24/2000 1350 20.0 7.76 214 175 437 361 393 04/03/2000 ' 1380 7.72 ' 214 182 454 363 41.4
I ! ---···- ·-i - -!
--_ -------~--------~ - --
--r---- -
' I
.
i
~erag~-- ~1365 20 7.74 214 179 446 362 404
·. • ........ ~~ ·

1<- 2 ·
Colorado Riveri -- ·-·-- -- ~ ----· _· -------- ---· !--- -- ·--- ----· Imperial Dam i
--t-· I
Date TDS, Evap. Temp. pH Alkalinity Calcium Calcium Chloride Sulfate Sampled (mg/1) (OC) (lab) (mg/1 CaC03) (mg/1) (mg/1 CaC03) (mg/1) (mg/1)
01/03/2000 750 25.0 8.26 154.1 81.1 203 96.0 249 01/18/2000 732 8.27' 150.5 83.6 209 . 98.0 .271 02/07/2000 668 8.25 146.1 79.5 199 ' 92.0 252 03/06/2000 660 8.30 146.4 81.1 203 96.4 261 04/03/2000 670 8.95 144 77.0 192 92.0 250 04/17/2000 626 8.35 140 73.7 . 184 78.1 234 05/01/2000 626 8.31 142 77.1 193 81.3 :. 249 05/15/2000 684 8.33 145 77.0 192 87.1 242
I
Average 677 25 8.38 146 79 197 90 251
'
·.• 1
'\ .. <~~ ;: ,,.. o;.,. '.: .':~··

·1- - 3
Blended, Untreated Water Interim Blend i Somerton ! I
Water I TDS Alkalinity Calcium Chloride Sulfate pH Precipitation Potential Langelier Index Alk/(CI+S04) C02 Added
(%) I (mg/L) (mg/1 CaC03 ) (mg/1 CaC03) (mg/1) (mg/1) _ (mg/1) (mg/1) I
100 1365 214 446 362 404 7.73 39.53 0.743 0.280 75 I 1193 197 383 ' 294 365 7.81 33.36 0.754 0.299 50 1021 180 321 226 327 7.94 27.84 0.804 0.325
i 25 849 163 259 158 289 . 8.13 23.06 0.895 0.365 0 677 146 197 90 251 8.39 19.13 1.029 0.428
Blended, Treated Water I
Interim Blend I I
100 1390 214 446 362 404 7.09 9.08 0.103 0.280 25 75 1211 197 383 294 365 7.19 9.90 0.134 0.299 18 50 1034 180 321 226 327 7.3 9,66 0.164 0.325 13 25 858 163 259 158 289 7.46 9.49 0.225 0.365 9 0 683 146 197 90 251 7.68 9.35 0.319 0.428 6
Blended, Untreated Water Final Blend
100 1325 174 406 362 404 7.12 75 1160 164 350 294 365 7.18 50 993 152 293 226 327 7.25 -25 826 140 236 158 289 7.34 0 658 127 178 90 251 7.47
Blended, Treated Water Final Blend
100 1356 205 437 362 404 7.02 75 1183 187 374 294 365 7.09 50 1011 170 312 226 327 . 7.17
- -- ---·-- -------·-- - -- ---- -- --- -25 840 154 249 158 289 7.28 0 668 I 137. 187 90 251 . 7.41
\ . 'l •.
··.\;...)r;u'-/ "· :, ... ,./·

1400
1200
1000
-'§, E 800 -c 0
+:;
~ -c Q)
600 u c 0 (.)
400
200
0
100
L. . .I 1
Interim Blended Unstablilized Water Characteristics
75 50
Somerton Well Water(%)
~r'#: ·.-, .:..~ .. _:~:\
.\
\. .d "'~IIQl.~
25
-+-TDS
-Alkalinity Calcium
~Chloride
--w- Sulfate
0
.. ,., ... ~~

:::z: a. ... G) ._
~ "C G)
-.~ -·-.a N RJ ._ tn c
..1 :::::> "C Q)
"C c ~ r:a E 'i: Q) ._ c
I() co cri
I() 1'- I()
r-..: <0
Hd
0
I() N
0 I()
I() 1'-
. 0 0 ,....
~ c -.... CD ai ~ Iii :"':.
-~ ·,~··
-c 0 t: CD E 0
(/')

{.,, ,_ .. . 3
Interim Blended Unstablilized Water Precipitation Potential
45.00 . ._ . 1. . . ... . . . ! .• .. , .. , ,. , ..
40.00 .I. .·· .. , : ··.:. ··.. ... . . :L · .. ~: .. :· ;~:
35.00 I . ·. ;; .: .. :~~-. · :: ~"?" . ...;;.,;;:,: :" .:. ' J .. :. '· ·:,;.::.(:;: · ~ .. .
=g; 30.00 1 . ·: , .... :,. ·· · .·c ·-- '· .] .··:;····: .. ;. ~·: ·:·~_ ;.·:
§. (ij ~ 25.00 t·:· ;·.>.• ' ::· ·· ~·i;;·· .. .. ~~.:: .' ·· --: .. ::: ·,:t:· ; ,-,::· ·· ·
~ a.. r:: ~ 20.00 I . . .. . :.:··: . , ·::::· .. : .~·,<: .· :·: , :: ·:.: :: .:r; .~
·a. ·u Q)
Q: 15.00 I . ;· .I: -. .. ? ' ,., : :~: , , .:~ . : ... :1\.1;>;:
10.00 I ' .•.. _ ,~·:; . ·,< ... ~;~ ... ;, ~. :- 'i':i~~ : .. ::J- 1~;~- <;:'f,J
5.00 1······· ··- ·· , ·· ; · .~·· · · · ·~:
100 75 50 25 .
Somerton Well Water(%)
/ "" t .... I - ~
·.-,._·>t-;._,'i
0
·. ···:¥•

0
U) (.)
; en 'i: Q) ... (.)
e 10 ca N
.s::. 0 '-Q) ... ~
'V "C ~ ) t
Q)
.!!:! - · ·~ - ..... ····-,j
Q)
:c a; s · ~ U)
0 a; c ::> 10 ~ "C c
0 Q) t
"C Q)
c E ~ 0
m (./)
E 'i: Q) ... c
10 .......
0 0
0 0 0 0 0 8 0 ..-
0 0 0 0 0 0 ""! 0 CX) c.o 'V N 0 ..- ..- 0 0 0 0 0

Cn<:iit 5
Interim Blended Stablilized Water pH
8.5 -r ·~ "' ..
8 r ~ . ·;:" ·" ···::":.:: · ·::.:.:-::; .~ . :: .:~;·~
~ 7.s 1.-. :··• ·:·: ,. c.: .;,·.:·J;.~;;: .:,. :<.:c . ,::r>c::: :.::' L\:1~:
7
6.5
100 75 50 25 0
Somerton Well Water(%)
., I i .... ,( .. ;/ ·;.,·····

\. .6
Interim Blended Stablilized Water Precipitation Potential
45.QQ • I ·· ' ' · · .. .-. · -' > ... ,.-···· '"'"
40.oo 1 . . ,, ... ;,~ ·- .. ····.- :;;. _. ·: -.. ~ .r ·,·· ::~~; .. '.,:
35.00 + . . . . ··:· -r .:· · .. .! . . ; ... ·.
~ 3o.oo 1 <:.·"~: . : - ~:--i':~ ::' ;~:rt::·:";:_':ui:~-; ~;~:~~M
.s ro ~ 25.00 I · · -·· · ... ~ . • . ·. :··)·
0 a.. c ..g 20.00 + ... ,, ·' 5 --·a. '(3 Q)
Q: 15.00 I ·.::.. . .. ·.: 'r ' · .. :.::;: .: ;;::··.1 /
1 o.oo r · (~;>' ?.~~::;_ ;; · .;.< :· .. :;:;;;
s. oo 1 ·. ·~:~~:.·:;;':!~ ~·;~~ .. ,: ~:::'if;~:~~::~:.:-~~r~~~~ .. i~~s:.·~::t::~;~f,~~0~.;~;iJ~~t~:i.~i:~i~~;Mt~;,~
0.00 I · · , . ·:·:" .. ... ....... ·:· .. - · --->.--· ········r• .... , ...... .... . -... -.... .
100 75 50
Somerton Well Water (%)
' )
/• · ... ,
:i ·,, . 1 ' .........
25 0
.~; •.-. •.· . ·-

c._, ..... ( 7
Interim Blended Stablilized Water Characteristics
1.200 .·• · .. .. · ··•· ' ··•·J·C•.-. . , ... . .. .. ,,.,, • ''•
1.000 I . T C.< . . : ' :: .. . .. · i':'.<:·:.
0.800 1 .. .. . . <···.. ·• ... . :·,·.:;·c.· · ..... •::~~ ' I , :·~·:.::. -- .,::.:::.:·-.• .-.:. ·;:·
0.600 I' .' .. •-· ~ , : :': \ ~~: ··: · .·; ~~~.·, .;_ ... ·. , .. _ .. , ...... ; [ :;<~::~ .-· ::::·,; ~.;~::: ·.·: .· .. ::,::F .. ·;·. ;,:~;::
0.400 1>. · ·· ::;· " :·:::: :. :·::;:o,: .:·.:;;::.n::·
0.200 1: .: .. . ;::·:;. ,.;)
0.000 ··· ·.•:.. . .. , . . ...... , .... -- .. .... _ .. , ......... .
100 75 50 25
Somerton Well Water(%)
, : "\ I
··,,- .,. . ,~v
0
_._Langelier Index
-+-Alki(CI+S04)

~ E -Cll "0 ·x
L11art 8
Interim Blended Stabilized Water
30 .. .,..·~~~~~~~...,.,.,...,..,.,....,.,.~,...,...,.,..
25
20
~ 15 , . . ''' ".'. '.'.·";';C[.:'·::Y'''~il>":11.:':';;:'·' t;'_l:,_<: i5 c
€ (tJ
0 10 I ;: . . .. •.. ·.:·:::.: :·::'::·: t.:
5
Q , ....• , ··· .. , ...... · .· ... "· ·: ... ···· •.: ••· ''·· ' ···N• .. :c·,.,j :•c:··.·:•,,:•:·.··:-,·:•.c·,,-'_,.,.,"-."''"'.•"
100 75 50
Somerton Well Water (%)
,.
[-+- C02 Adde~
25 o·

Chdlt 9
Final Blended Unstablilized Water Characteristics
1400 .< •.... ·.,._. •. •I ' .- ' ' •• ·•· ,.;, .. •· ...•. J ... .J.. .... '<
1200 I· :~ ~\:c!it~~<;~~~:··i.-;~1;~~f~f:!£::;~:i~t!~':;~~:;
1000
~ ·.·;·:.·: : .~~~!~-~( . ::?:~L·'~~;~_t.P~--->{Y -+-TDS .s BOO c -Alkalinity 0
-.;:::; Calcium g c -*-Chloride 8 600 c -sulfate 0 u
400
200 1. : ·:;:_; .• ~: .~::·::.:·~ .... ·.;,:·::~ ''· •'\ •· J :::;.;:,:·:-~ : . :.··.·::.~.~-::~e ·:~·,-.. ~; :
0 ·' ,.. •.·;.· .... ... .... ., ... . ... . ,
100 75 50 25 0
Somerton Well Water(%}
..... ·-- ....
' \ . ,:·; · ·\.:. ~1·;,)' .. :· ~

:X: Q. .... .! ca ~ "C C1)
.!:::! 0 ::0
J. s tn u c
;::)
"C C1)
"C c ~ m ca c
LL
0 10 cri
0 0 0 0 10 0 cri ,..._ ,..._
Hd
0 10 <0
0
10 N
0 10
10 ,..._
0 0 ..-
-~ 0 -.... Q)
~ Q) -.. ~\ s: c 0 -e Q)
E 0 en

Ct.-.• 11
Final Blended Stablilized Water Characteristics
1400 .. . .... ······'·
1200 1 •· .. : .•.••. ".·" . ., •. _;:·:;.~;:.~:;;;,. ~x:::,.· :i;.~;·;,
1000
-'§, E. 800 -+-TDS c: -Alkalinity .Q ro Calcium ... c ~Chloride ~ 600 c: ., ---sulfate 0
(..)
400
2oo , . ··-;: .. ·.!·., ··.:;;·· .... c.:. ;\~ ,. ~:;; · .. :·,~·· · "·; . : : • :. :·;.: .~ ' · · · :~."::: : ..... :··
100 75 50 25 0
Somerton Well Water(%)
. .F

.. · ..
J: c. ... G) -- ~ ca ;: .....
G) -'C ~ G)
-~ 0 Q) N lO ~ .c
1 ca c .... 0 (J U) t::
G)
'C E G) 0 'C (f)
c ..!!! m ca c u.
lO 1"-
0 0
0 0 0 0 0 ..-
lO 0 lO ~ lO cri cO ,....: 1"- <.0
Hd

APPENDIX A

The RTW Model Ver. 3.0 ID: Water A=WTP Effluent, Water B=Colorado River
Blending Application Package
STEP 1: Enter characteristics for waters to be blended.
Water A WaterS
TDS 1365 mg/L ???? TDS 677 mg/L Temperature 20 deg C Temperature 25 degC
pH 7.74 pH 8.3775 Alkalinity, as CaC03 214 mg/L Alkalinity, as CaC03 146.013 mg/L
Ca as CaC03 445.7511976 mgJL Ca, as CaC03 196.686 mg/L Cl 362 mg/L Cl 90.1125 mgJL
S04 403.5 mg/L S04 251 mg/L
STEP 2: Enter portion of blend that is Water A
I % Water A in blend 0 %
Press PAGE DOWN for blended water characteristics and chemical treatment calculations.
Press PAGE UP to review characteristics of waters A & 8 prior to blending Initial blended water characteristics
STEP 3: Enter amount of each chemical to be added to blended water (expressed as 100% chemical). Press Ctr1+C to select chemicals for this list.
TDS 677 mgJL Alum *18H20 0 ·mg/L Temperature 25 degC Alum 50% solution 0 mg/L
pH 8.39 Carbon dioxide 0 mg/L
Alkalinity, as CaC03 146.0125 mgJL Caustic soda 0 .mg/L Ca as CaC03 196.6861552 mgJL Chlorine gas 0 mg/L
Cl 90.1125 mg/L Hydrochloric acid 0 mg/L S04 251 mg/L Hydrofluosilicic acid 0 mgJL
Acidity 143 mg/L Ume (slaked) 0 mg/L Ca sat, as CaC03 19 mg/L Soda ash 0 rng/L
DIC, as CaC03 289 mg/L Sodium bicarbonate 0 mg/L
STEP 4: Adjust at Step 3 until interim blended water characteristics meet your criteria. Theoretical interim characteristics Desired Theoretical interim characteristics
Interim alkalinity 146 mg/L >40 mg/L lntelim pH 8.39 Interim Ca, as CaC03 197 mall > 4Q.mgll Precipitation potential 19.13 maiL
Alki(CI+S04) 0.4 > 5.0 Langelier index 1.03 . . . . Press PAGE DOWN for addltionalmtenm and final blended water charactenstics if desrred .
Press PAGE UP to review initial blended water characteristics, chemical addition quantities and additional interim blended water characteristics.
Desired
6.8-9.3 4-10 mall
>0
Theoretical final blended water charactelistics Theoretical interim blended water characteristics after CaC03. precipitation
Interim acidity 143 mg/L Final alkalinity 127 mg/L Interim Ca sat, as CaC03 19 mg/L Final Ca 178 m_g/L
Ryznar index 6.33 Final acidity 143 mg/L
Interim DIC, as CaC03 289 mgJL Final pH 7.47 Aggressiveness Index 12.85 Final DIC, as CaC03 270 mg/L
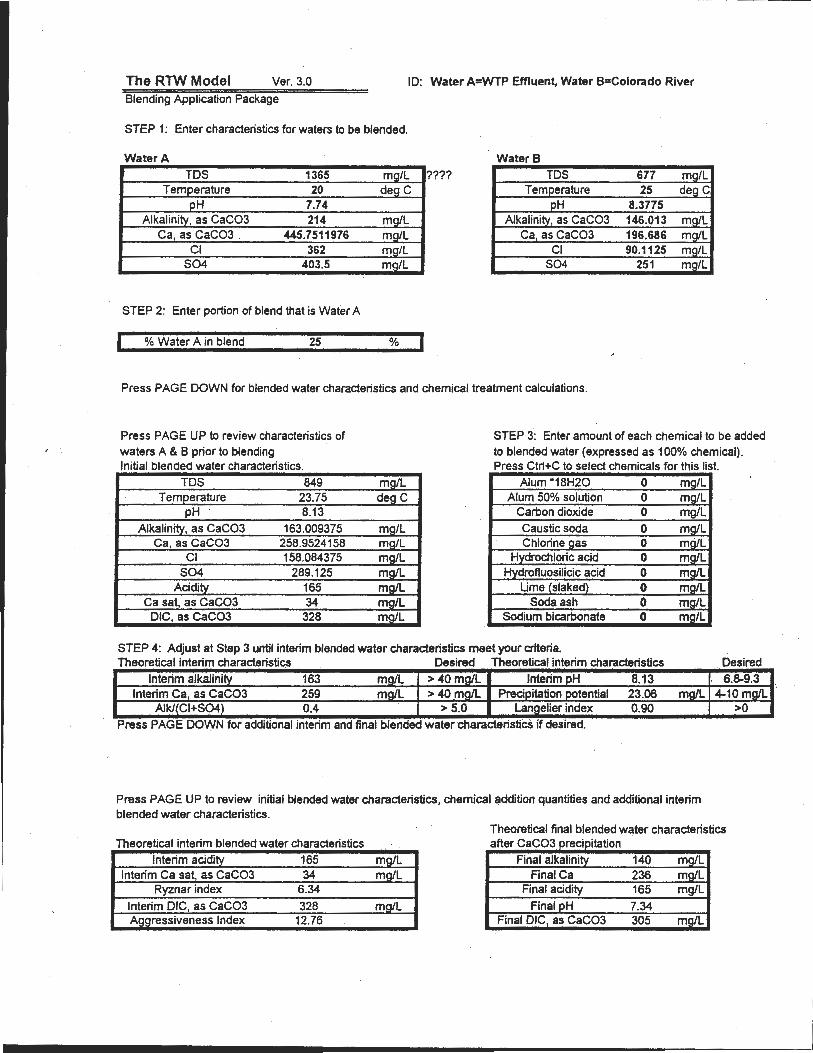
The RTW Model Ver. 3.0 ID: Water A=WTP Effluent, Water B=Colorado River
Blending Application Package
STEP 1: Enter characteristics for waters to be blended.
Water A Water 8 TDS 1365 mg/L ???? TDS 677 mg/L
Temperature 20 deg C Temperature 25 deg C pH 7.74 pH 8.3775
Alkalinity, as CaC03 214 mg/L Alkalinity, as CaC03 146.013 mg/L Ca, as CaC03 445.7511976 mg/L Ca, asCaC03 196.686 mg/L
Cl 362 mall Cl 90.1125 mg/L S04 403.5 mg/L 504 251 mg/L
STEP 2: Enter portion of blend that is Water A
I % Water A in blend 25 % I
Press PAGE DOWN for blended water characteristics and chemical treatment calculations.
Press PAGE UP to review characteristics of
waters A & 8 prior to blending Initial blended water characteristics
TDS 849 Temperature 23.75
pH 8.13
Alkalinity, as CaC03 163.009375 Ca. as CaC03 258.9524158
Cl 158.084375 S04 289.125
Acidity_ 165 Ca sat, as CaC03 34
DIC, as CaC03 328
mg/L deg C
mg/L mg/L mg/L mg/L mg/L mg/L mg/L
STEP 3: Enter amount of each chemical to be added to blended water (expressed as 100% chemical). Press Ctr1+C to select chemicals for this list.
Alum *18H20 0 mg/L Alum 50% solution 0 mg/L
Carbon dioxide 0 mg/L
Caustic soda 0 mg/L Chlorine aas 0 mg/L
Hydrochloric acid 0 mg/L Hydrofluosilicic acid 0 mg/L
Ume (slaked) 0 mg/L Soda ash 0 mg/L
SOdium bicarbonate 0 mg/L
Press PAGE UP to review initial blended water characteristics, chemical addition quantities and additional interim blended water characteristics.
Theoretical final blended water characteristics Theoretical interim blended water characteristics ft c co a er a 3 precipitation
Interim acidity 165 mgJL Final alkalinity 140 mg/L Interim Ca sat, as CaC03 34 mg/L FinaiCa 236 mg/L
Ryznar index 6.34 Final acidity 165 mg/L
Interim DIC, as CaC03 328 mg/L Final pH 7.34 Aggressiveness Index 12.76 Final DIC, as CaC03 305 mg/L

The RTW Model Ver. 3.0 ID: Water A=WTP Effluent, Water B=Colorado River
Blending Application Package
STEP 1 : Enter characteristics for waters to be blended.
Water A WaterS
TOS 1365 mg/L ???? TDS an mg/L Temperature 20 deg C Temperature 25 deg c
pH 7.74 pH s.Jns Alkalinity, as CaC03 214 mg/L Alkalinity, as CaC03 146.013 mg/L
Ca, as CaC03 445.7511976 mgtl Ca, as CaC03 196.686 mg/L Cl 362 mg/L Cl 90.1125 mgtl
S04 403.5 mg/L S04 251 mg/L
STEP 2: Enter portion of blend that is Water A
I % Water A in blend 50 % I
Press PAGE DOWN for blended water characteristics and chemical treatment calculations.
Press PAGE UP to review characteri~tics of waters A & 8 prior to blending Initial blended water characteristics
STEP 3: Enter amount of each chemical to be added to blended water (expressed as 100% chemical). Press Ctri+C to select chemicals for this list.
TDS 1021 mgtl Alum •18H20 0 mg/L Temperature 22.5 deg C Alum 50% solution 0 mg/L
pH 7.94 Carbon dioxide 0 mg/L Alkalinity, as CaC03 180.00625 mg/L Caustic soda 0 mg/L
Ca as CaC03 321 .2186764 mgtl Chlorine gas 0 mgtl Cl 226.05625 mg/L Hydrochloric acid 0 mg/L
S04 327.25 mg/L H_y_drofluosilicic acid 0 mg/L Acidity 186 mg!L Ume (slaked) 0 mg/L
Ca sat, as CaC03 51 mg/L Soda ash 0 mg/L DIC, as CaC03 366 mg/L Sodium bicarbonate 0 mg/L
STEP 4: Adjust at Step 3 unti.l interim blended water characteristics meet your criteria. Theoretical interim characteristics Desired Theoretical interim characteristics
Interim alkalinity 180 mg/L >40 mg!L Interim pH 7.94 Interim Ca, as CaC03 321 mg!L > 40.mg/L Precipitation potential 27.84 mg/L
Alki(CI+S04) 0.3 > 5.0 Langelier index 0.80 . . ..
Press PAGE DOWN for additional1ntenm and final blended water charactenstics 1f desired .
Press PAGE UP to review initial blended water characteristics, chemical addition quantities and additional interim blended water characteristics.
Desired 6.8-9.3
4-10 mg/l._ >0
Theoretical final blended water characteristics Theoretical interim blended water characteristics c 3 after Ca 0 precipitation
Interim acidity 186 mg!L Final alkalinity 152 mg/L Interim Ca sat, as CaC03 51 mg/L Final Ca 293 mg/L
Ryznar index 6.33 Final acidity 186 mg/L
Interim DIC as CaC03 366 mg/L Final pH 7.25 Aggressiveness Index 12.70 Final DIG, as CaC03 338 mg/L

The RTW Model Ver. 3.0 ID: Water A=WTP Effluent, Water B=Colorado River
Blending Application Package
STEP 1: Enter characteristics for waters to be blended.
Water A WaterS
TDS 1365 mgJL ???? TDS 677 mg/L Temperature 20 deg C Temperature 25 degC
pH 7.74 pH 8.3775 Alkalinity, as CaC03 214 mg/L Alkalinity, as CaC03 146.013 mg/L
Ca, as CaC03 445.7511976 mgJL Ca, as CaC03 196.686 mg/L Cl 362 mg/L Cl 90.1125 mg/L
504 403.5 mg/_L 504 251 mg/L
STEP 2: Enter portion of blend that is Water A
I % Water A in blend 75 %
Press PAGE DOWN for blended water characteristics and chemical treatment calculations.
Press PAGE UP to review characteristics of waters A & 8 prior to blending Initial blended water characteristics
STEP 3: Enter amount of each chemical to be added to blended water (expressed as 100% chemical). Press Ctr1+C to select chemicals for this list.
TDS 1193 mg/L Alum *18H20 0 mg/L Temperature 21 .25 degC Alum 50% solution 0 mg/L
pH 7.81 Carbon dioxide 0 mg/L
Alkalinity, as caco3 197.003125 mg/L Caustic soda 0 mg/L Ca as CaC03 383.484937 m_gL_L Chlorine gas 0 mg/L
Cl 294.028125 mQIL Hydrochloric acid 0 mg/L 504 365.375 mg/L Hydrotluosilicic acid 0 mQIL
Acidity 208 mgJL Lime (slaked) 0 mg/L Ca sat as CaC03 68 mg/L Soda ash 0 mg/L
DIC, as CaC03 405 mg/L Sodium bicarbonate 0 mg/L
STEP 4: Adjust at Step 3 until interim blended water characteristics meet your criteria. Theoretical interim characteristics Desired Theoretical interim characteristics
Interim alkalinity 197 mg/L > 40 mg/L Interim pH 7.81 Interim Ca, as CaC03 383 mg/L >4Q.mgll Precipitation POtential 33.36 mgJL
Alki(CI+S04) 0.3 >5.0 Langelier index ·· 0.75 . . ..
Press PAGE DOWN for add1tional•ntenm and final blended water charactenstics if des1red .
Press PAGE UP to review initial blended water characteristics, chemical addition quantities and additional interim . blended water characteristics.
Desired
6.8-9.3 4-10 mgll
>0
Theoretical final blended water characteristics Theoretical interim blended water characteristics ft C C03 a er a preCipitation
Interim acidity 208 mg/L Final alkalinity 164 mg/L Interim Ca sat, as CaC03 68 mg/L Final Ca 350 mg/L
Ryznar index 6.30 Final acidity 208 mg7L
Interim DIC, as CaC03 405 mgJL Final pH 7.18 Aggressiveness Index 12.69 Final DIC, as CaC03 371 mg/L

The RTW Model Ver. 3.0 ID: Water A=WTP Effluent, Water B=Colorado River
Blending Application Package
STEP 1 : Enter characteristics for waters to be blended.
Water A WaterS
TDS 1365 mg/L ???? TDS 677 mg/L Temperature 20 deg C Temperature 25 deg c
pH 7.74- pH 8.3775 Alkalinity, as CaC03 214 mg/L Alkalinity, as CaC03 146.013 mg!L
Ca, as CaC03 445.7511976 mg/L Ca, as CaC03 196.686 mg!L Cl 362 mg/L Cl 90.1125 mg/L
S04 403.5 mg/L S04 251 mg/L
STEP 2: Enter portion of blend that is Water A
I % Water A in blend 100 % I
Press PAGE DOWN for blended water characteristics and chemical treatment calculations.
Press PAGE UP to review characteristics of waters A & 8 prior to blending Initial blended water characteristics
STEP 3: Enter amount of each chemical to be added to blended water (expressed as 100% chemical) . Press Ctrl+C to select chemicals for this list.
TDS 1365 mgJL Alum *18H20 0 mg/L Temperature 20 degC Alum 50% solution 0 mg/L
pH 7.73 Carbon dioxide 0 mg/L
Alkalinity, as CaC03 214 mg/L Caustic soda 0 mg/L Ca, as CaC03 445.7511976 mg/L Chlorine gas 0 mg/L
Cl 362 mg/L Hydrochloric acid 0 mg/L S04 403.5 mg/L Hydrofluosilicic acid 0 m_g/L
Acidity 229 mg/L Lime (slaked) 0 mg/L Ca sat, as CaC03 81 mg/L Soda ash 0 mg/L
DIC, as CaC03 443 mg/L Sodium bicarbonate 0 mg/L
STEP 4: Adjust at Step 3 until interim blended water characteristics meet your criteria. Theoretical interim characteristics Desired Theoretical interim characteristics
Interim alkalinity 214 mg!L > 40 mg/L Interim pH 7.73 Interim Ca, as CaC03 446 mg/L >4Q.mg/L Precipitation potential 39.53 mg/L
Alki(CI+S04) 0.3 > 5.0 Langelier index . 0.74 . . . .
Press PAGE DOWN for addltionalmtenm and final blended water charactenstics 1f destred .
Press PAGE UP to review initial blended water characteristics, chemical addition quantities and additional interim blended water charaCteristics.
Desired
6.8-9.3 4-10 mg/L
>0
Theoretical final blended water characteristics Theoretical interim blended water characteristics ft C C03 . a er a precipitation
Interim acidity 229 mg/L Final alkalinity 174 mg/L Interim Ca sat, as CaC03 81 mg/L Final Ca 406 mg/L
Ryznar index 6.24 Final acidity 229 mg/L
Interim DIC, as CaC03 443 mg/L Final pH 7.12 Aggressiveness Index 12.71 Final DIC, as CaC03 403 mg/L

APPENDIX B

The RTW Model Ver. 3.0 ID: Water A=WTP Effluent, Water B=Colorado River
Blending Application Package
STEP 1: Enter characteristics for waters to be blended.
Water A WaterS
TDS 1365 mg/L ???? TDS 677 mgll Temperature 20 deg c Temperature 25 deg C
pH 7.74 . _pH 8.3775 Alkalinity, as CaC03 214 mg/l Alkalinity, as CaC03 146.013 mg/L
Ca, as CaC03 445.7511976 mg/L Ca. as CaC03 196.686 mg!L Cl 362 mg/L Cl 90.1125 mg/L
S04 403.5 mg/L S04 251 mg/L
STEP 2: Enter portion of blend that is Water A
I % Water A in blend 0 o/o I
Press PAGE DOWN for blended water characteristics and chemical treatment calculations.
Press PAGE UP to review characteristics of waters A & 8 prior to blending Initial blended water characteristics
STEP 3: Enter amount of each chemical to be added to blended water (expressed as .100% chemical) . Press Ctri+C to select chemicals for this list.
TDS 677 mg/L Alum *18H20 0 mg/L Temperature 25 degC Alum 50% solution 0 mg/L
pH 8.39 Carbon dioxide 6 mg/L
Alkalinity, as CaC03 146.0125 mg/l Caustic soda 0 mg!L Ca, as CaC03 196.6861552 mg!L Chlorine gas 0 mg/L
· Cl 90.1125 mg/L Hydrochloric acid 0 mg/L S04 251 mgll Hydrofluosilicic acid 0 mg/L
Acidity 143 mgl_L Lime (slaked) 0 mg!L Ca sat, as CaC03 19 mg.IL Soda ash 0 mg/L
DIC, as CaC03 289 mg/L Sodium bicarbonate 0 mg/L
STEP 4: Adjust at Step 3 until interim blended water characteristics meet your criteria. Theoretical interim characteristics Desired Theoretical interim characteristics
Interim alkalinl_ty 146 mg/L > 40 mgJL Interim pH 7.68 Interim Ca as CaC03 197 mgll >4Qmg/L Precipitation potential 9.35 mg/L
Alk/(CI+S04) 0.4 > 5.0 Langelier index 0.32 . .
Press PAGE DOWN for add1tional1ntenm and final blended water charactenstics if des1red .
Press PAGE UP to review initial blended water characteristics, chemical addition quantities and additional interim blended water characteristics.
Desired
6.8-9.3 4-10 mg/L
>0
Theoretical final blended water characteristics Theoretical interim blended water characteristics after CaC03 precipitation
Interim acidity 157 mg/L Final alkalinity 137 mgll Interim Ca sat, as CaC03 95 mgll Final Ca 187 mg/L
Ryznar index 7.04 Final acidity 157 mg/L
Interim DIC, as CaC03 303 mg/L Final pH 7.41 Aggressiveness Index 12.14 Final DIC, as CaC03 294 mg/L

The RTW Model Ver. 3.0 ID: Water A•WTP Effluent, Water B=Colorado River
Blending Application Package
STEP 1 : Enter characteristics for waters to be blended.
Water A WaterS
TDS 1365 m_g/L ???? TDS 677 mg/L Temperature 20 deg C Temperature 25 degC
pH 7.74 pH 8.3775 Alkalinity, as CaC03 214 mg/L Alkalinity, as CaC03 146.013 m_g/L
Ca, as CaC03 445.7511976 mg/L Ca, as CaC03 196.686 mgll Cl 362 mg/L Cl 90.1125 mg/L
S04 403.5 mg/L S04 251 mg/L
STEP 2: Enter portion of blend that is Water A
I % Water A in blend 25 %
Press PAGE DOWN for blended water characteristics and chemical treatment calculations.
Press PAGE UP to review characteristics of waters A & 8 prior to blending Initial blended water characteristics
STEP 3: Enter amount of each chemical to be added to blended water (expressed as 100% chemical). · Press Ctrl+C to select chemicals for this list.
TDS 849 mgll Alum *18H20 0 mgJL Temperature 23.75 degC Alum 50% solution 0 mg/L
pH 8.13 Carbon dioxide 9 mg/L
Alkalinity, as CaC03 163.009375 mgJL Caustic soda 0 mgll Ca, as CaC03 258.9524158 mg/L Chlorine gas 0 mgll
Cl 158.084375 mgll Hydrochloric acid 0 mg/L S04 289.125 mgll Hvdrotluosilicic acid 0 mg/L
Acidity 165 mgll Lime (slaked) 0 mg/L Ca sat as CaC03 34 mgll Soda ash 0 mgll
DIC, as CaC03 328 mgll Sodium bicarbonate 0 mgll
STEP 4: Adjust at Step 3 until interim blended water characteristics meet your criteria. Theoretical interim characteristics Desired Theoretical interim characteristics
Interim alkalinity 163 mg/L > 40 mg/L Interim pH 7.46 Interim Ca, as CaC03 259 mgll > 4Q.mg/L Precipitation potential 9.49 mgll
Alki(CI+S04) 0.4 > 5.0 Langelier index 0.23 . . . .
Press PAGE DOWN for add1tional1ntenm and final blended water charactenStics if des1red .
Press PAGE UP to review initial blended water characteristics, chemical addition quantities and additional interim blended water characteristics.
Desired
6.8-9.3 4-10 mg/L
>0
Theoretical final blended water characteristics Theoretical interim blended water characteristics aft C C03 er a preCipitation
Interim acidity 185 mg/L Final alkalinity 154 mg/L Interim Ca sat, as CaC03 155 mg/L Final Ca 249 mg/L
Ryznar index 7.01 Final acidity 185 mg/L
Interim DIC, as CaC03 348 mg/L Finai_QH 7.28 Aggressiveness Index 12.09 Final DIC, as CaC03 339 mg/L

The RTW Model Ver. 3.0 JD: Water A=WTP Effluent, Water B"'Colorado River
Blending Application Package
STEP 1 : Enter characteristics for waters to be blended.
Water A WaterS
TDS 1365 mg/L ???? TDS 677 mg/L Temperature 20 degC Temperature 25 deg C
pH 7.74 _pH 8.3775 Alkalin_i!y, as CaC03 214 mg/L Alkalinity, as CaC03 146.013 mg/L
Ca, as CaC03 445.7511976 mg/L Ca, as CaC03 196.68& mg/L Cl 362 mg/L Cl 90.1125 mg/L
S04 403.5 mg/L S04 251 mg/L
STEP 2: Enter portion of blend that is Water A
I % Water A in blend 50 % I
Press PAGE DOWN for blended water characteristics and chemical treatment calculations.
Press PAGE UP to review characteristics of
waters A & 8 prior to blending Initial blended water characteristics
STEP 3: Enter amount of each chemical to be added to blended water (expressed as 100% chemical). Press Ctrl+C to select chemicals for this list.
TDS 1021 mg/L Alum *18H20 0 mg/L Temperature 22.5 degC Alum 50% solution 0 mg/L
pH 7.94 Carbon dioxide 13 mg/L
Alkalinity, as CaC03 180.00625 mg/L Caustic soda 0 mg/L Ca, as CaC03 321 .2186764 mgJL Chlorine gas 0 mg/L
Cl 226.05625 mg/L Hydrochloric acid 0 mg/L S04 327.25 mg/L Hydrofluosilicic acid 0 mg/L
Aciqity 186 mg/L Lime (slaked) 0 mg/L Ca sat, as CaC03 51 mg/L Soda ash 0 mg/L
DIC, as CaC03 366 mg/L Sodium bicarbonate 0 mg/L
STEP 4: Adjust at Step 3 until interim blended water characteristics meet your criteria. Theoretical interim characteristics Desired Theoretical interim characteristics
Interim alkalinity 180 mg/L > 40 mg/L Interim pH 7.30 Interim Ca, as CaC03 321 mgJL > 40.mg/L Precipitation potential 9.66 mg/L
Alki(CI+S04) 0.3 > 5.0 Langelier index 0.16 ' 0 0 0 0
Press PAGE DOWN for addrtional rntenm and final blended water charactenstics rf desrred.
Press PAGE UP to review initial blended water characteristics: chemical addition quantities and additional interim blended water characteristics.
Desired
6.8-9.3 4-10 mg/L
>0
Theoretical final blended water characteristics Theoretical interim blended water characteristics after CaC03 _precij)itation
Interim acidity 216 mg/L Final alkalin_ity 170 mg/L Interim Ca sat, as CaC03 221 mg/L Final Ca 312 mg/L
Ryznar index 6.97 Final acidity 216 mg/L
Interim DIC, as CaC03 396 mg/L Final pH 7.17 Aggressiveness Index 12.06 Final DIC, as CaC03 386 mg/L

··' .
The RlW Model Ver. 3.0 ID: Water A•WTP Effluent, Water B=Colorado River
Blending Application Package
STEP 1: Enter characteristics for waters to be blended . .
Water A WaterB TDS 1365 mg/L ???? TDS 677 mg/L
Temperature 20 degC Temperature 25 deg C pH 7.74 pH 8.3775
Alkalinity, as CaC03 214 mg/L Alkalinity, as CaC03 146.013 mg/L Ca as CaC03 445.7511976 mg/L Ca as CaC03 196.686 mg/L
Cl 362 mg/L Cl 90.1125 mg/L S04 403.5 mg/L S04 251 mg/L
STEP 2: Enter portion o'tblend that is Water A
I % Water A in blend 75 % I
Press PAGE DOWN for blended water characteristics and chemical treatment calculations.
Press PAGE UP to review characteristics of waters A & 8 prior to blending Initial blended water characteristics
STEP 3: Enter amount of each chemical to be added to blended water (expressed as ~00% chemical). Press Ctr1+C to select chemicals for this list.
TDS 1193 mgtl Alum *18H20 0 mg/L Temperature 21.25 degC Alum 50% solution 0 mg/L
pH 7.81 Carbon dioxide 18 mg/L Alkalinity, as CaC03 197.003125 mg/L Caustic soda 0 mg/L
Ca, as CaC03 383.484937 mg/L Chlorine gas 0 m_g/L Cl 294.028125 mg/L Hydrochloric acid 0 mg/L
S04 365.375 mg/L Hydrofluosilicic acid 0 mg/L Acidity 208 mg/L Ume (slaked) 0 mg!L
Ca sat as CaC03 68 mg!L Soda ash 0 mg/L DIC, as CaC03 405 mg/L Sodium bicarbonate 0 mg!L
STEP 4: Adjust at Step 3 until interim blended water characteristics meet your criteria. Theoretical interim characteristics Desired Theoretical interim characteristics
Interim alkalinity 197 mg/L > 40 mg/L Interim pH 7.19 Interim Ca, as CaC03 383 mg/L > 40-mg/L Precipitation potential 9.90 mg/L
Alk/(CI+S04) 0.3 > 5.0 Langelier index 0.13 . .
Press PAGE DOWN for add1tional10tenm and final blended water charactenstics if des~red.
Press PAGE UP to review initial blended water characteristics, chemical addition quantities and additional interim blended water characteristics.
Desired
6.8-9.3 4-10 mg/L
>0
Theoretical final blended water characteristics Theoretical interim blended water characteristics after CaC03 precipitation
Interim acidity 249 mg!L Final alkalinity 187 mg/L Interim Ca sat, as CaC03 282 mg/L Final Ca 374 mg/L
Ryznar index 6.92 Final acidity 249 mg/L
Interim DIC, as CaC03 446 mgtl Final pH 7.09 Aggressiveness Index 12.07 Final DIC, as CaC03 436 mg/L

The RTW Model Ver. 3.0 JD: Water A=WTP Effluent, Water 8-=Colorado River
Blending Application Package
STEP 1 : Enter characteristics for waters to be blended.
Water A WaterS TDS 1365 mg/L ???? TDS 677 mg/L
Temperature 20 deg C Temperature 25 degC pH 7.74 pH s.Jns
Alkalinity, as CaC03 214 mg/L Alkalinity, as CaC03 146.013 mg/L Ca, as CaC03 445.7511976 mg/L Ca, as CaC03 196.686 mg/L
Cl 362 mg/L Cl 90.1125 mg/L S04 403.5 mg/L S04 251 mg/L
STEP 2: Enter portion of blend that is Water A
I % Water A in blend 100 % I
Press PAGE DOWN for blended water characteristics and chemical treatment calculations.
Press PAGE UP to review characteris1ics of waters A & B prior to blending Initial blended water characteristics
STEP 3: Enter amount of each chemical to be added to blended water (expressed as 100% chemical). Press Ctrt+C to select chemicals for this list.
TDS 1365 mg/L Alum *18H20 0 mgLL Temperature 20 degG Alum 50% solution 0 mg/L
pH 7.73 Carbon dioxide 25 mg/L
Alkalinity, as CaC03 214 mg/L Caustic soda 0 mg!L Ca, as CaC03 445.7511976 mg/L Chlorine gas 0 mg/L
Cl 362 mg!L Hydrochloric acid 0 mg!L S04 403.5 mg/L Hydrofluosilicic acid O · mg/L
Acidity 229 mg/L Lime {slaked) 0 mg/L Ca sat, as CaC03 81 mg/L Soda ash 0 mg!L
DIC, as CaC03 443 mg/L Sodium bicarbonate 0 mg/L
STEP 4: Adjust at Step 3 until interim blended water characteristics meet your criteria. Theoretical interim characteris1ics Desired Theoretical interim characteristics
Interim alkalinity 214 mg/L > 40 mg/L Interim pH 7.09 Interim Ca, as CaC03 446 mgtl > 4Q..mg/L Precipitation potential 9.08 mg/L
Alki(CI+S04) 0.3 > 5.0 Langelier index 0.10 0 0
Press PAGE DOWN for add1tional1ntenm and final blended water charactenstics 1f desired.
Press PAGE UP to review initial blended water characteristics, chemical addition quantities and additional interim blended water characteristics.
Desired
6.8-9.3 4-10 mg/L
>0
Theoretical final blended water characteristics Theoretical interim blended water characteristics ft C C03 . 't . a er a precrpr ation
Interim acidi!Y 286 mg/L Final alkalinity 205 mg/L Interim Ca sat, as CaC03 352 mg/L Final Ca 437 mg!L
Ryznar index 6 .~8 Final acidity 286 mg/L
Interim DIC, as CaC03 500 mg/L Final pH 7.02 Aggressiveness Index 12.07 Final DIC, as CaC03 491 mg/L